Constitutive Model Prediction and Flow Behavior Considering Strain Response in the Thermal Processing for the TA15 Titanium Alloy


1
State Key Laboratory of Solidification Processing, School of Materials Science and Engineering, Northwestern Polytechnical University, Xi’an 710072, China
2
School of Metallurgical Engineering, Xi’an University of Architecture and Technology, Xi’an 710055, China
*
Authors to whom correspondence should be addressed.
Materials 2018, 11(10), 1985; https://doi.org/10.3390/ma11101985
Submission received: 3 September 2018
/
Revised: 27 September 2018
/
Accepted: 12 October 2018
/
Published: 15 October 2018
(This article belongs to the Special Issue Mechanical Characterization of Bio-Based Materials and Structures)
Abstract
:To investigate the flow stress, microstructure, and usability of TA15 titanium alloy, isothermal compression was tested at 1073–1223 K and strain rates of 10, 1, 0.1, 0.01, and 0.001 s−1, and strain of 0.9. The impact of strain and temperature on thermal deformation was investigated through the exponent-type Zener–Hollomon equation. Based on the influence of various material constants (including α, n, Q, and lnA) on the TA15 titanium alloy, the strain effect was included in the constitutive equation considering strain compensation, which is presented in this paper. The validity of the proposed constitutive equation was verified through the correlation coefficient (R) and the average absolute relative error (AARE), the values of which were 0.9929% and 6.85%, respectively. Research results demonstrated that the strain-based constitutive equation realizes consistency between the calculated flow stress and the measured stress of TA15 titanium alloy at high temperatures.
1. Introduction
TA15 alloy, a near-α titanium alloy, is extensively used in the aerospace industry due to its various advantages, such as weldability, mechanical capability at high temperatures, superior creep and erosion resistance, and large strength-to-weight ratio [1]. The mechanical properties and physical characteristics of TA15 titanium alloy have led to its wide application. The microstructure evolves in the process, and is influenced by process parameters: strain rate, strain, and temperature [2]. There is an interactive correlation between deformation behavior and microstructure evolution [3]. The required shape, properties, and microstructure can be obtained by optimizing the thermal deformation parameters in thermomechanical processing. Therefore, deformation and flow are being studied at elevated temperatures, which is conducive to investigating the thermal deformation ofTA15 titanium alloy.
Scholars have investigated the deformation and microstructural evolution of TA15 titanium alloy [4,5,6]. Processing the components is difficult given the complex shape, hard-to-deform properties, and requirement of forming quality [7]. Gao et al. studied the microstructure evolution and flow behavior of near-α titanium alloy, whose microstructure is inhomogeneous in thermal deformation, finding that nonuniform microstructure before deformation was composed of β phase, lamellar α, and equiaxed α in the colony form. There was a correlation between the Burgers orientation and β phase in α colony [6]. According to Zhao et al., thermal flow stress is not significantly influenced by the initial β grain size [5]. By investigating the influence of inhomogeneous deformation on the microstructure of the rib-web part of TA15 alloy, Fan et al. found four microstructures in the forming process [8]. The superplasticity of TA15 alloy was enhanced using thermomechanical techniques, which could refine the grains of the alloy [9]. Thermal uniaxial tensile tests were conducted and finite element models were established to explore the thermal formability of TA15 titanium alloy [10]. Zhu et al. explored the influence of cooling speed on the major α phase microstructure evolution of TA15 titanium alloy. According to the research results, the size distribution and volume fraction of the major α phase are influenced by cooling speed [11]. The kinetics rate and dynamic globularization kinetics of TA15 are influenced by deformation parameters. The dynamic globularized fraction is in direct proportion to strain and temperature, but inversely proportional to strain rate [12]. A prediction model was established on the basis of an improved back propagation (BP) neural network, and it was used to explore the quantitative evolution of aspect ratio, grain size, and volume fraction of equiaxed α for TA 15 alloy [13].
As a foundation of engineering parts production, thermal deformation processes require not only microstructural and mechanical properties, but also dimensional accuracy [14]. As excellent mechanical properties require fine microstructural characteristics, it was necessary to explore the thermomechanical process affecting the microstructural characteristics. To this end, we used theconstitutive equation at various temperatures and strain rates. The Arrhenius model, as a phenomenological constitutive model, has generally been used to present the correlations among temperature, flow stress, and strain rate in a constitutive study, particularly at high temperatures [15]. The influence of strain has been proven to be necessary to verify the constitutive equation involving the strain effect, which predicted flow behaviors at elevated temperatures in pure titanium [16] and titanium alloy [15], steel [17,18,19], aluminum alloy [14,20,21], and magnesium alloy [22].
This research attempted to represent thermal deformation of TA15 titanium alloy by formulating a proper constitutive correlation. The thermal compression was tested at different temperatures and strain rates. The flow stress was further analyzed based on the test results. A comprehensive constitutive model involving temperature, strain rate, and flow stress was established. Finally, the reliability of the constitutive model was verified.
2. Experimental Details
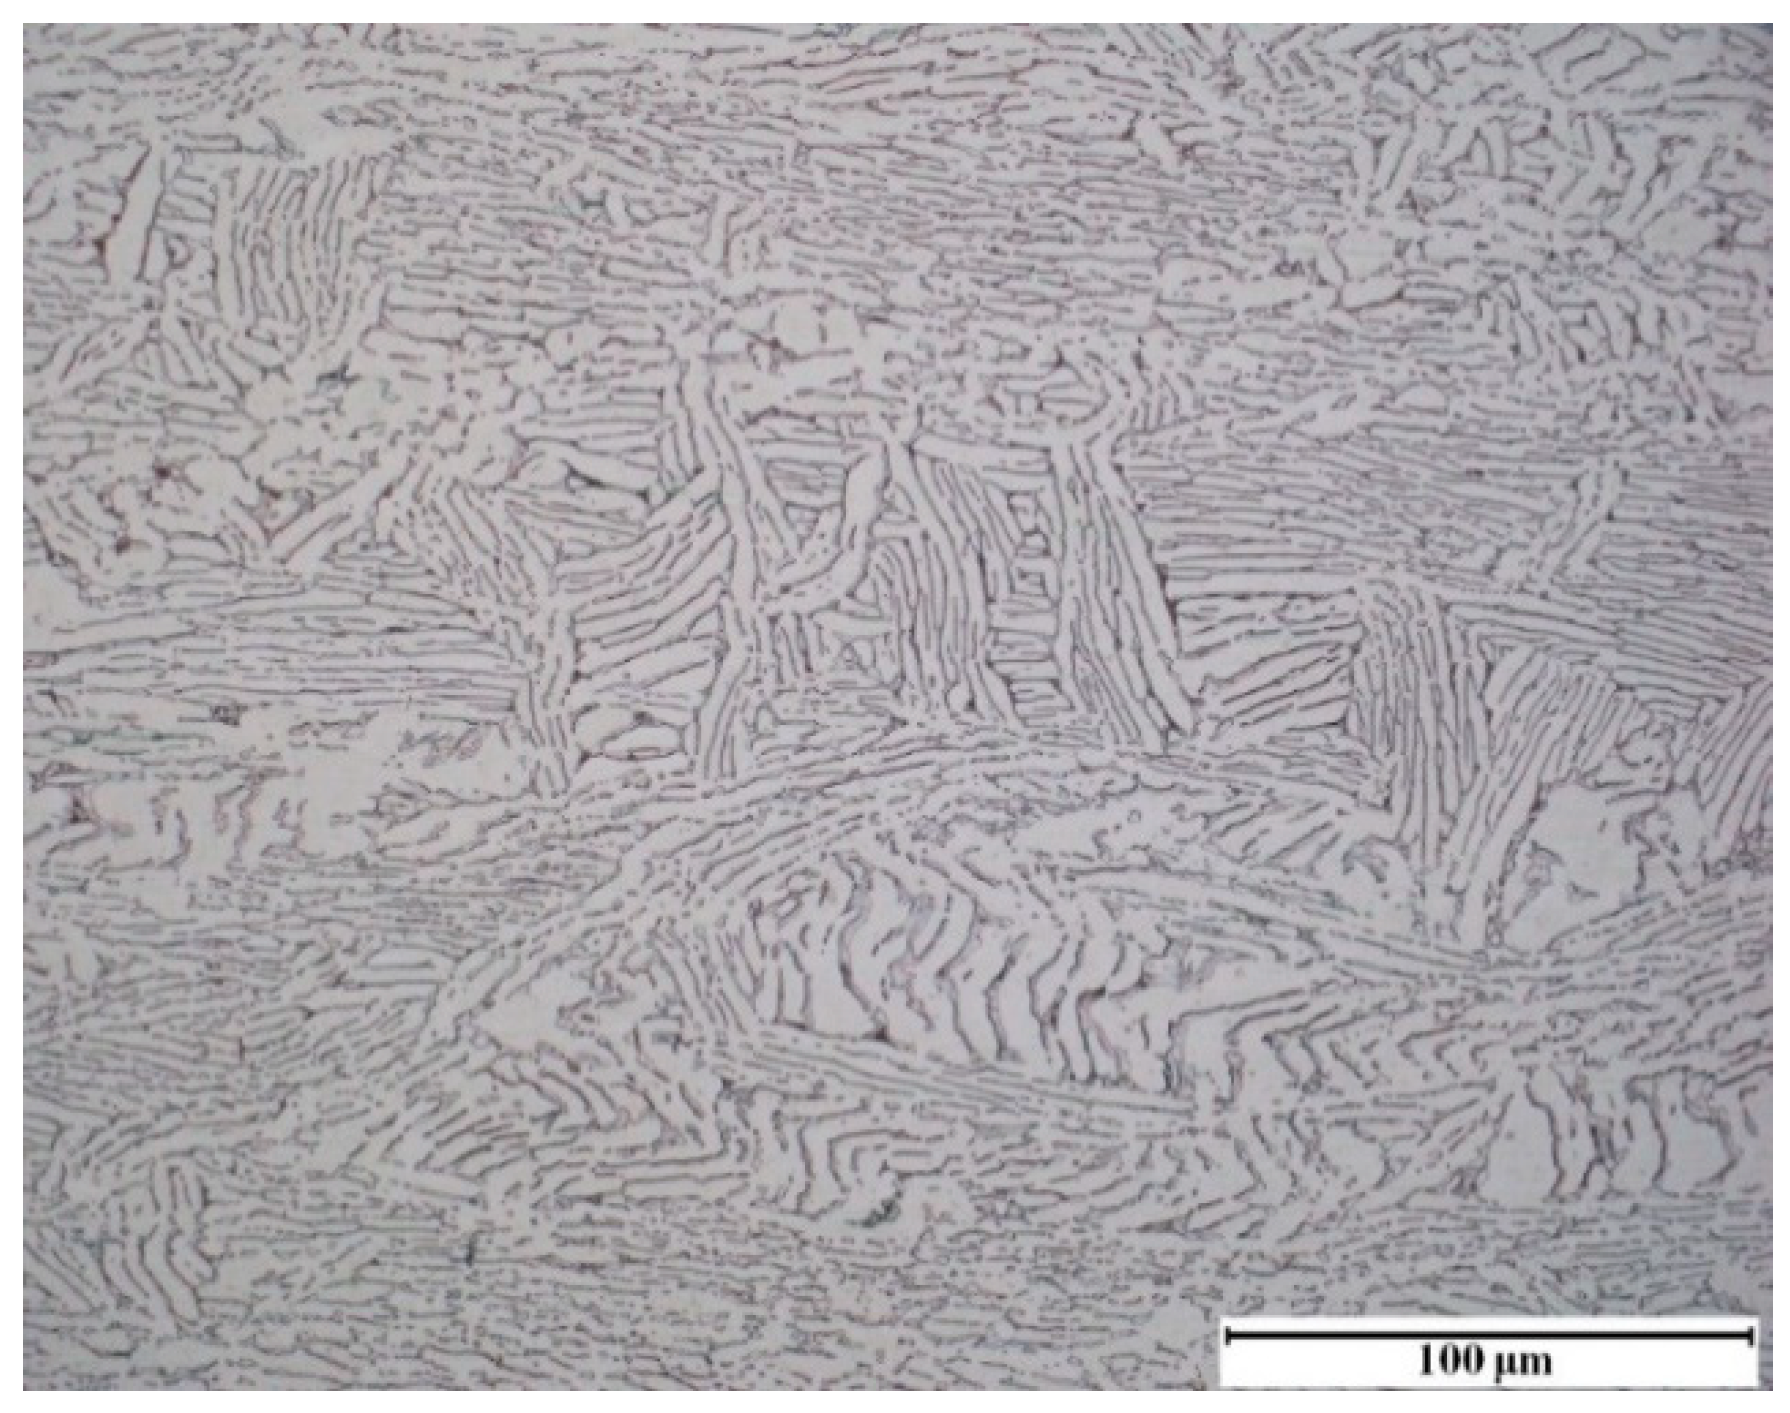
TA15 titanium alloy, a near-α titanium alloy that has the chemical composition of Ti-6.5Al-2Zr-1Mo-1V (in wt%), was used in the research. The original specimen was sectioned from the bar axial, ground to 2000 grit with sand paper, and then polished to 0.5 μm. Finally, the specimen was etched to carry out optical microscopy (GX51F, OLYMPUS, Tokyo, Japan) observation, and Kroll’s agent (2% HF, 4% HNO3, and 94% H2O) was used to etch the specimens for 3–5 s.
The β transus temperature of TA15 was measured as approximately 1258 K, and all specimens used in the experiments were annealed for homogenization by heating at 1073 K for 1 h and cooling in the furnace. The microstructure shown in Figure 1 primarily consisted of a number of coarse strip-shaped α phases; meanwhile, there were only a few thin strip-shaped α phases on the β matrix.
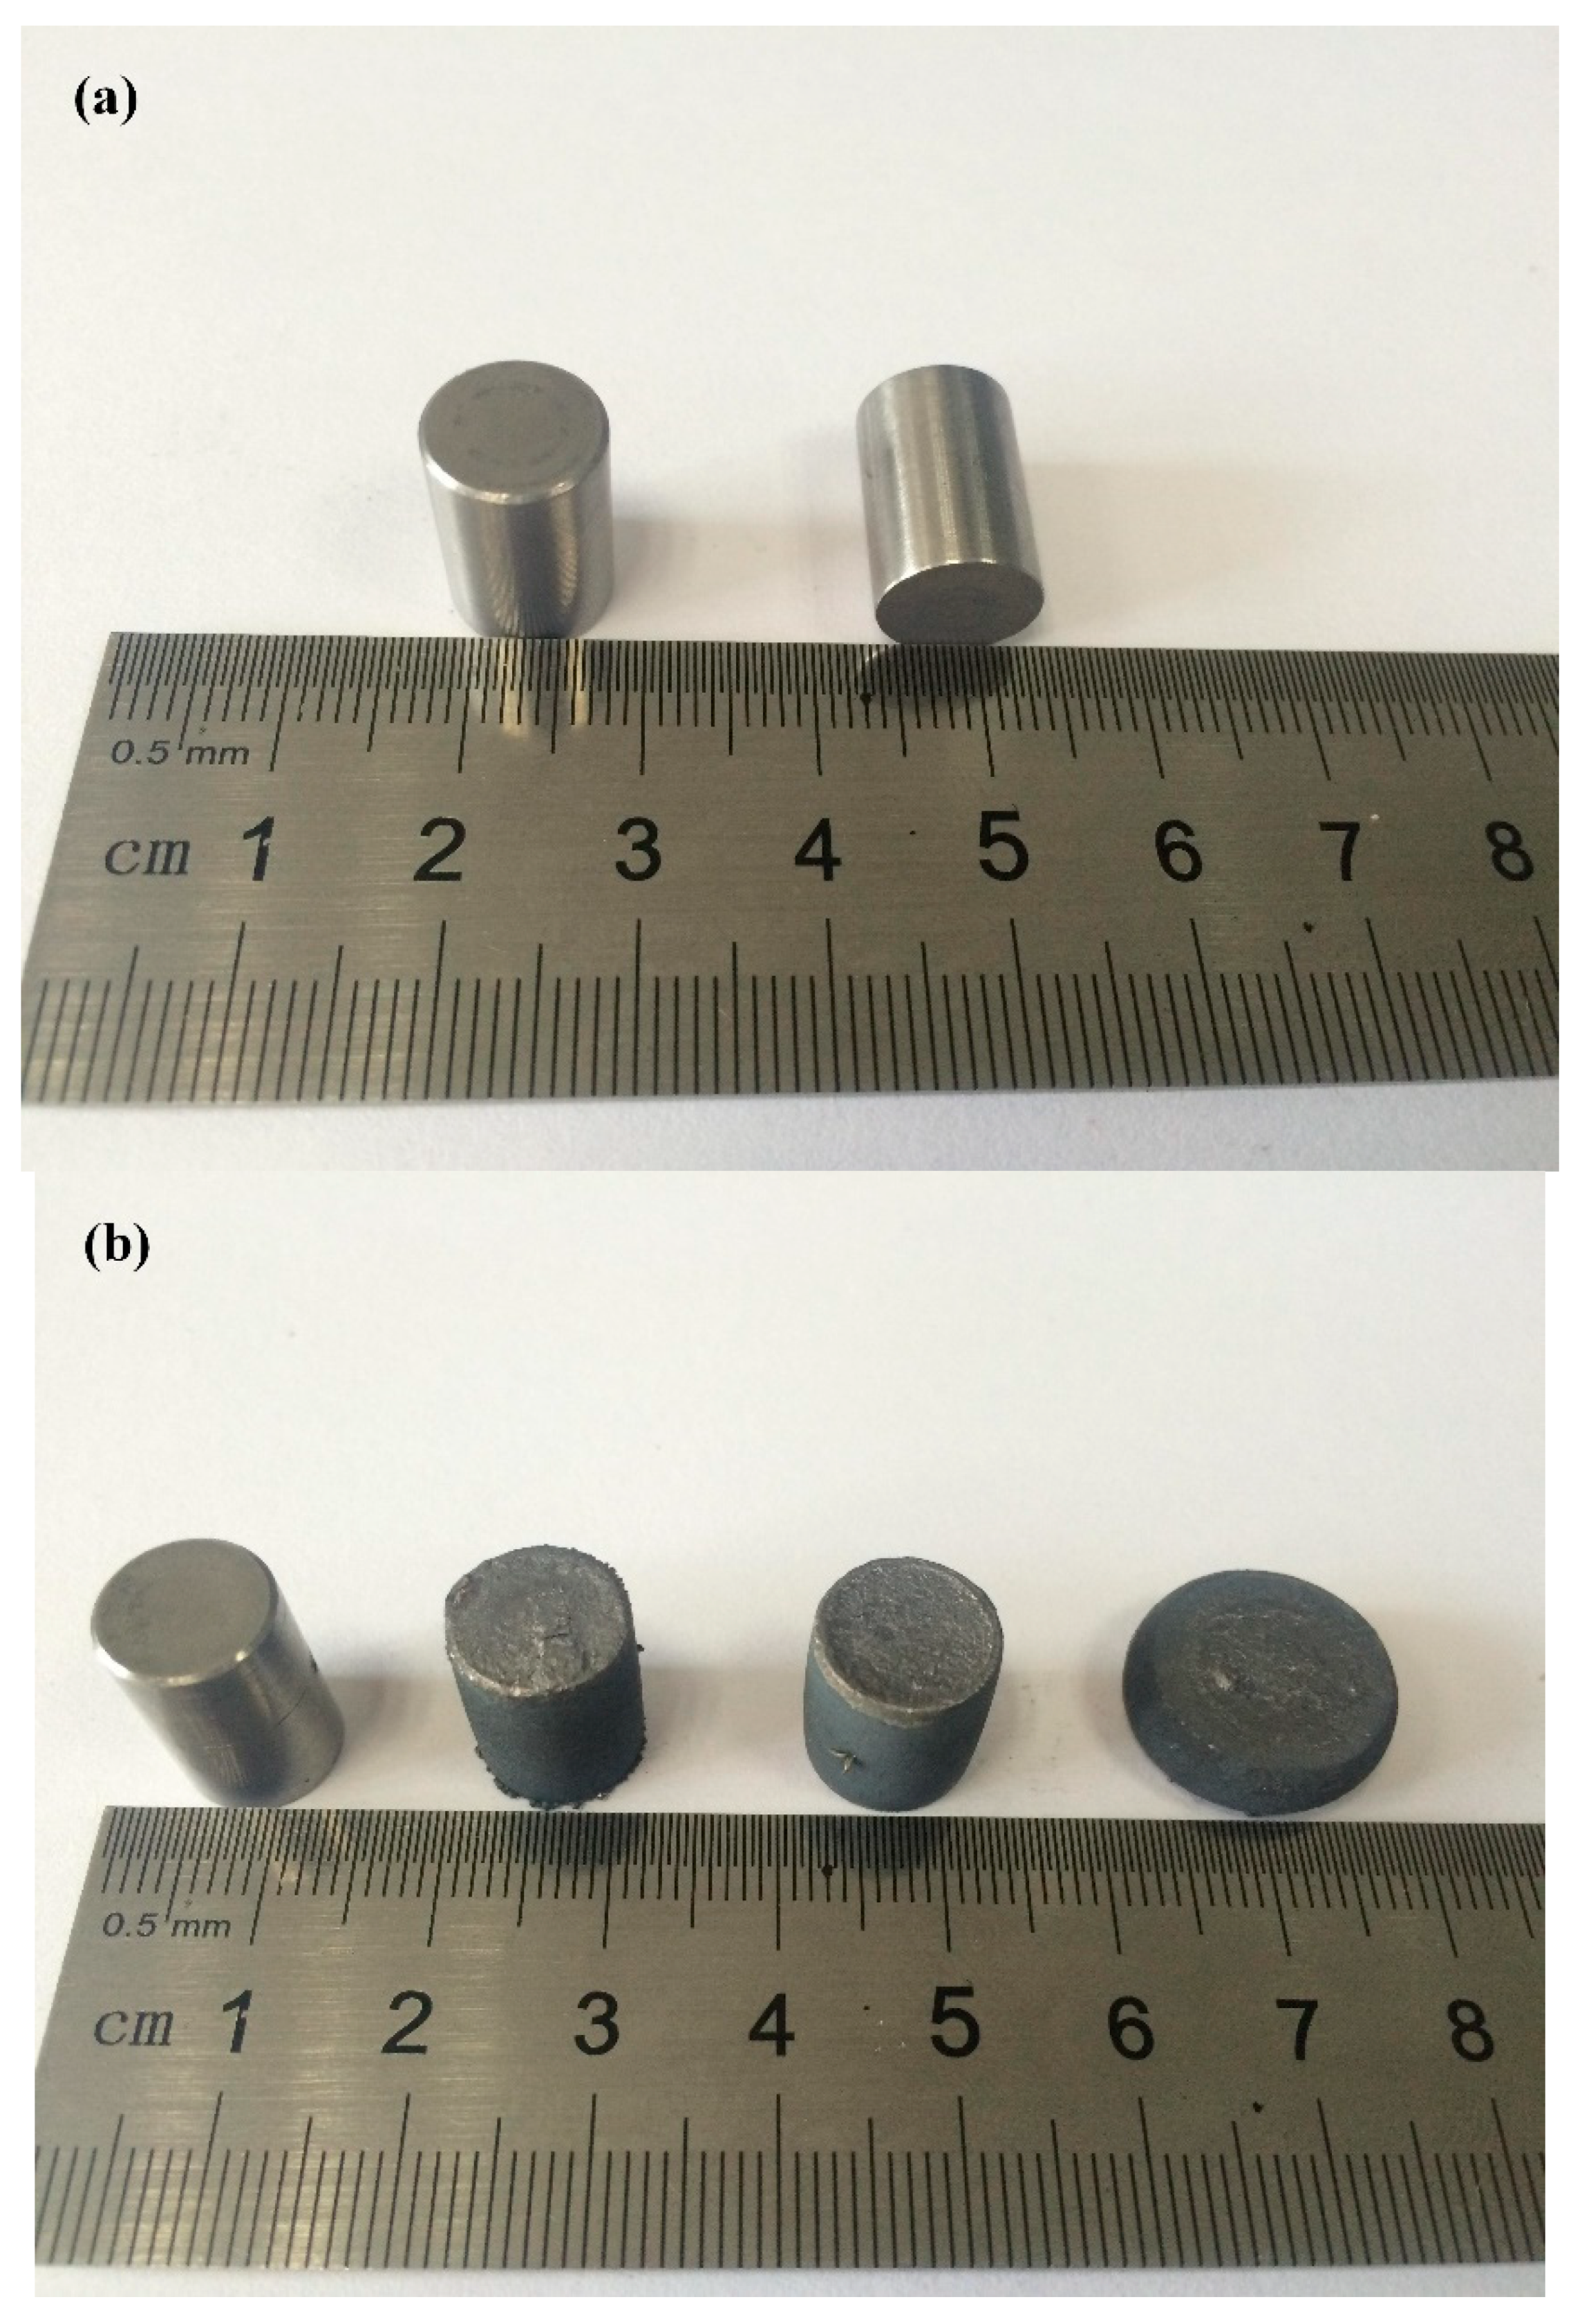
The isothermal compression simulation test is the most commonly used method to investigate the deformation and microstructural evolution of materials at high temperatures. An isothermal compression simulation experiment was carried out on a Gleeble-3500 tester (DSI Corporation, New York, USA). Cylindrical Ф10 mm × 15 mm specimens were used in this study, as shown in Figure 2. The upper and lower end faces were parallel to each other. The mechanical perpendicularity of the vertical face was maintained, and the two end surfaces were smooth to decrease the effects of transverse friction on deformation. The axis of the cylindrical specimen was the axial line of the bar billet. In the experiment, a radial sensor was used in the deformation of the specimen to collect and record the cross-section area and the collected signals to control the parameters of the tester. The specimen was compressed at a constant strain rate. The whole test was electrically heated, and the temperature was obtained with a thermocouple. The temperature deviation was controlled in ±1 °C increments.
The isothermal simulation compression experiment temperature ranged from 1073 K to 1223 K in increments of 50 K. The strain rate varied from 0.001 s−1 to 10 s−1, and the corresponding reduction ranges were 10%, 20%, and 60%. A graphite flake cushion was used between the specimen and the pressure head to decrease transverse friction. We heated the specimen to deformation temperature at a heating rate of 10 °C/s, which was maintained for 3 min to guarantee temperature uniformity. Thermal deformation occurred at the isothermal constant strain rate. The stress-strain curves were automatically recorded as the isothermal compression at elevated temperature was tested. The specimens were quenched immediately in water after the compression test to maintain the organization.
3. Results and Discussion
3.1. Experiment Results and Flow Stress Behavior
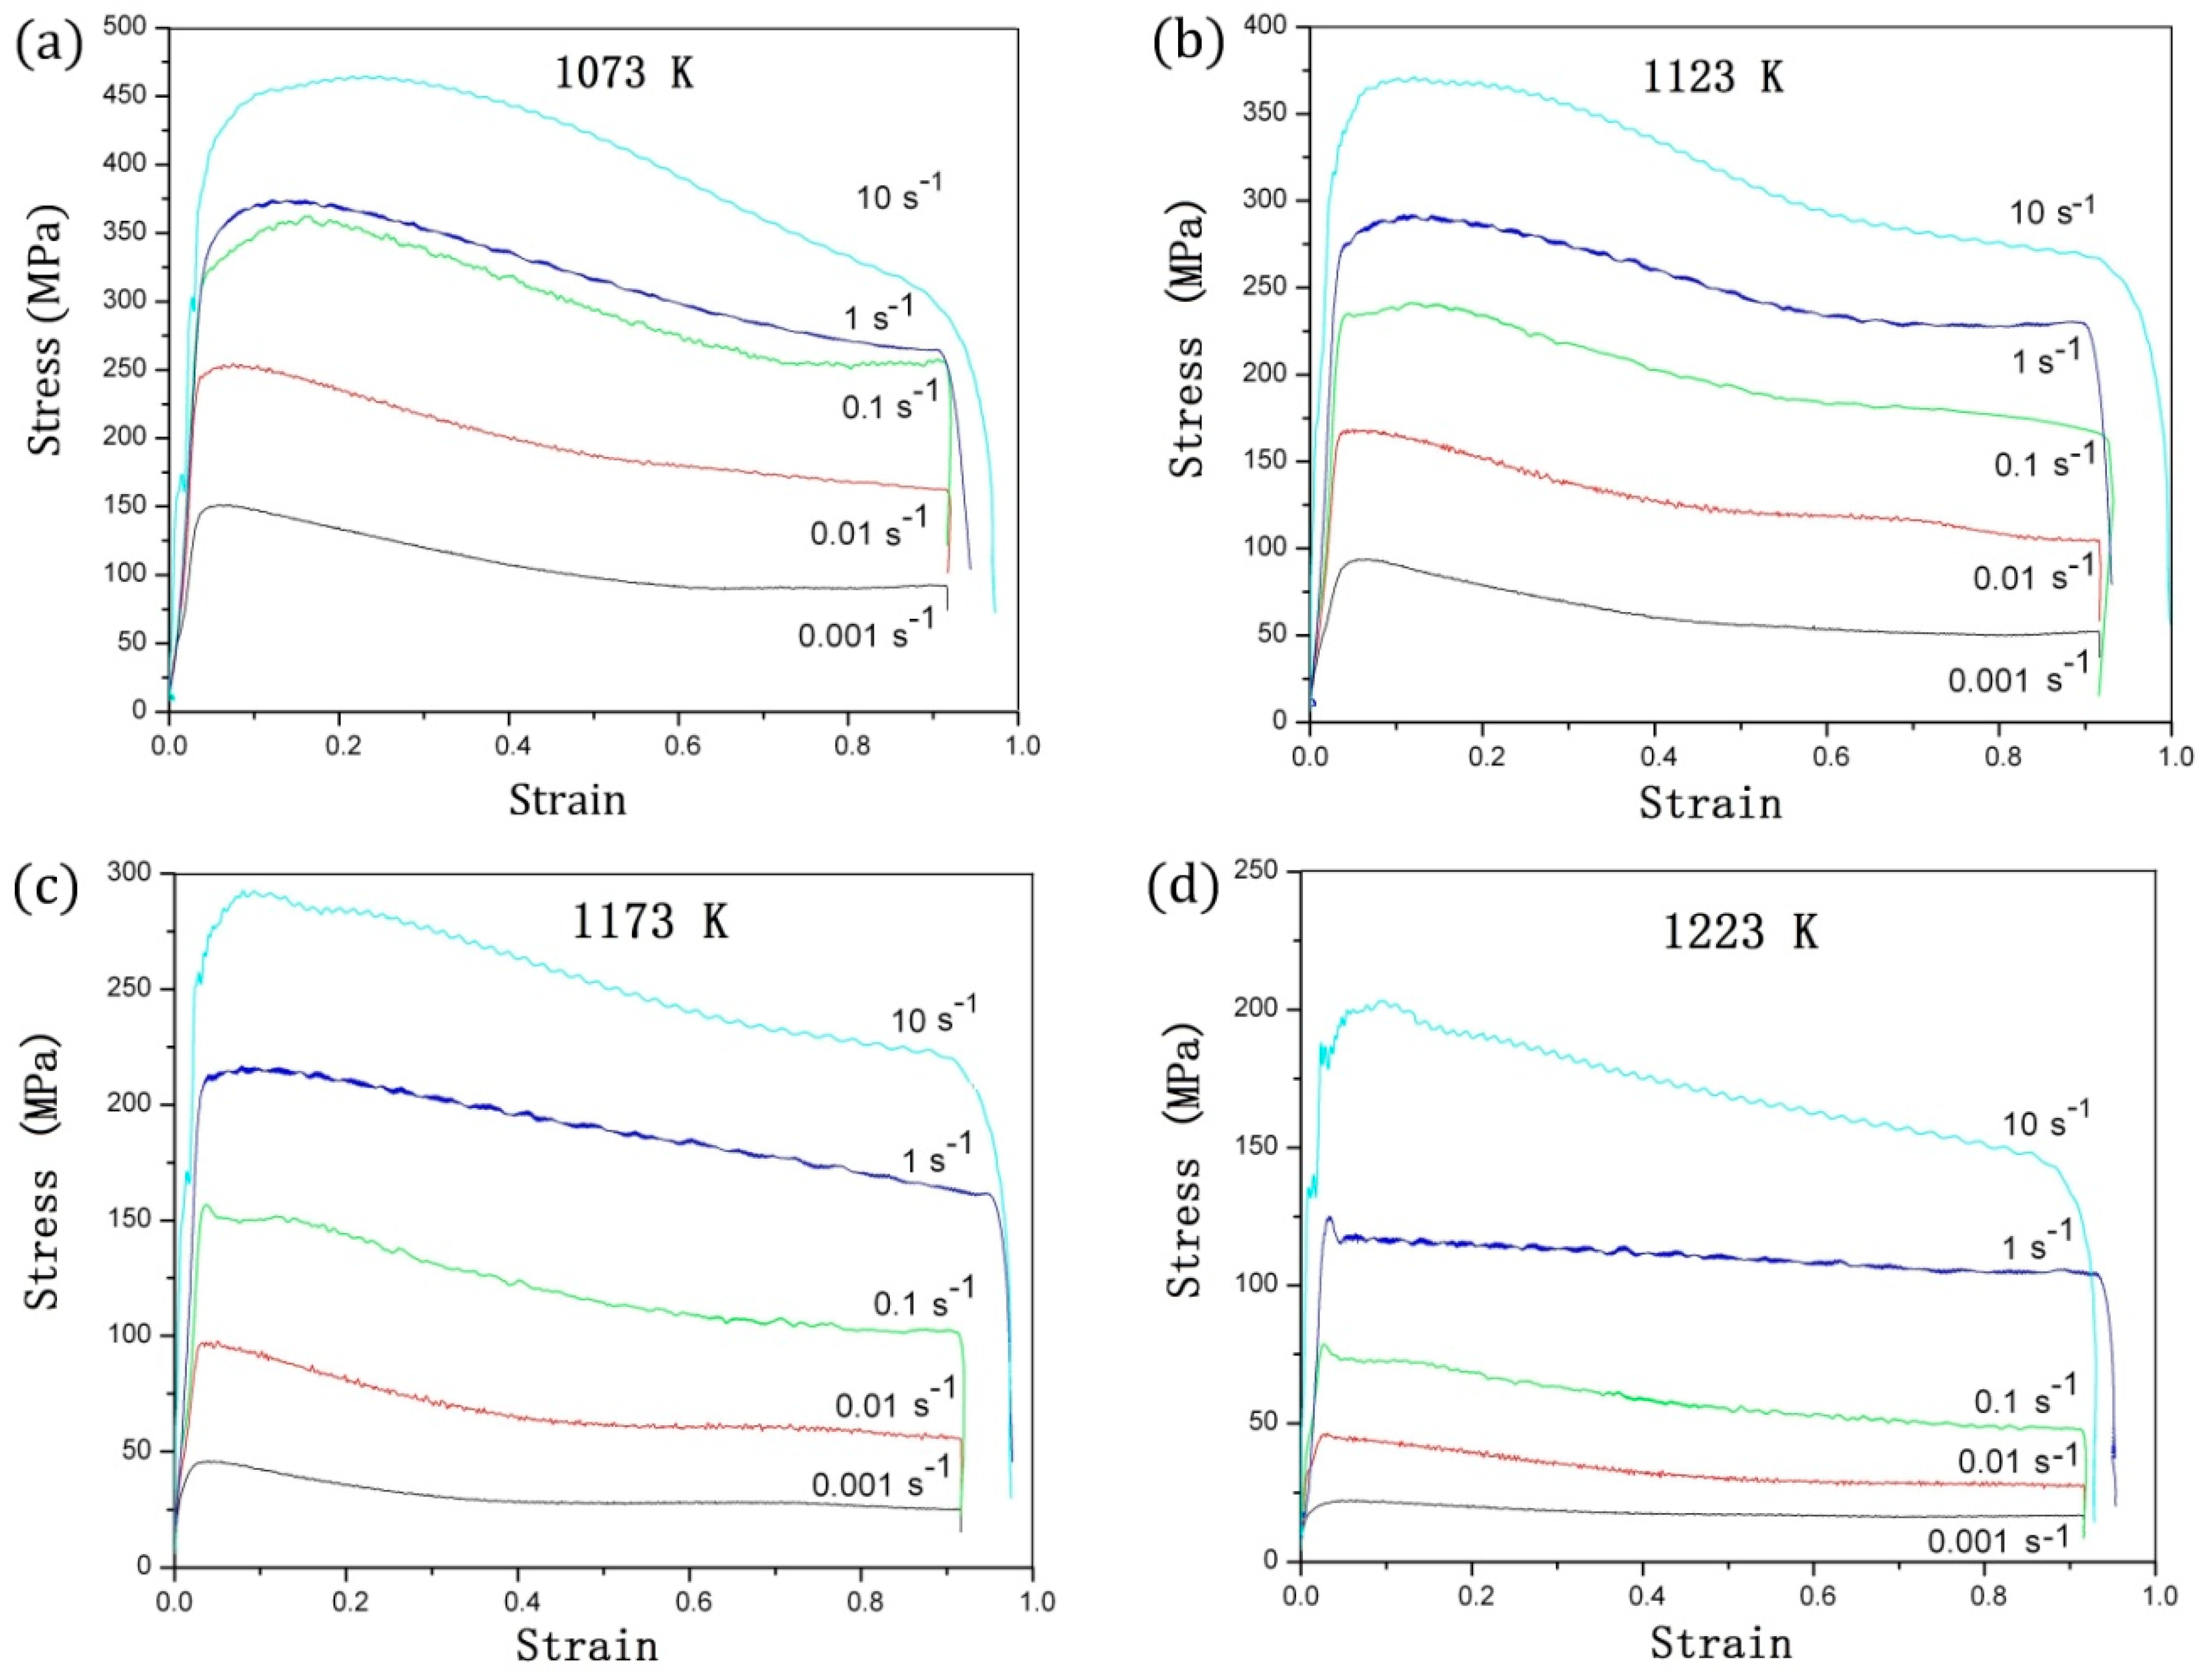
Figure 3 depicts the stress-strain curves of TA15 titanium alloy in various deformation conditions. The flow stress rises substantially as the strain increases due to the work-hardening resulting from the increasingly higher dislocation density. Flow stress showed peaks at nearly all temperatures and strain rates, and a clear flow softening phenomenon occurred. Peak strain was generally less than 0.1, and it did not change obviously with thermal deformation conditions.
As can be seen from Figure 3, the stress-strain curves of TA15 titanium alloy were obtained by testing the isothermal compression at 1073 K to 1223 K in intervals of 50 K. The flow stress first peaked and then decreased as the strain increased. In addition, flow stress was highly sensitive to temperature. It first sharply decreased and then flattened out as the temperature rose. We ignored the deformation heating due to the low strain rates (0.001 s−1 and 0.01 s−1). At 1173 K and 1223 K, the flow stress curves flattened out as the strain rate decreased. Formation at low strain rates can only enhance dynamic recovery (DRV), but can also inhibit dynamic recrystallization (DRX). Above the phase transition temperature, the β grain size was large as the temperature rose. The microstructure indicates that the DRV was dominant with little DRX during formation. At different experimental temperatures, the volume fraction and grain size of the major α phase were inversely proportional to temperature [4].
TA15 titanium alloy presented flow softening, which was closely related to the thermal processing conditions and the initial microstructure, which is common in the metal deformation process. The dynamic recrystallization was inhibited by DRV. The flow stress tended to be stable after saturation. A small amount of DRX occurred at higher strain. The β-transus temperature was 1263 K, and the DRV was the main softening mechanism in the β-phase field because of the body-centered cubic crystal structure with rapid self-diffusion and high stacking fault energy [23].
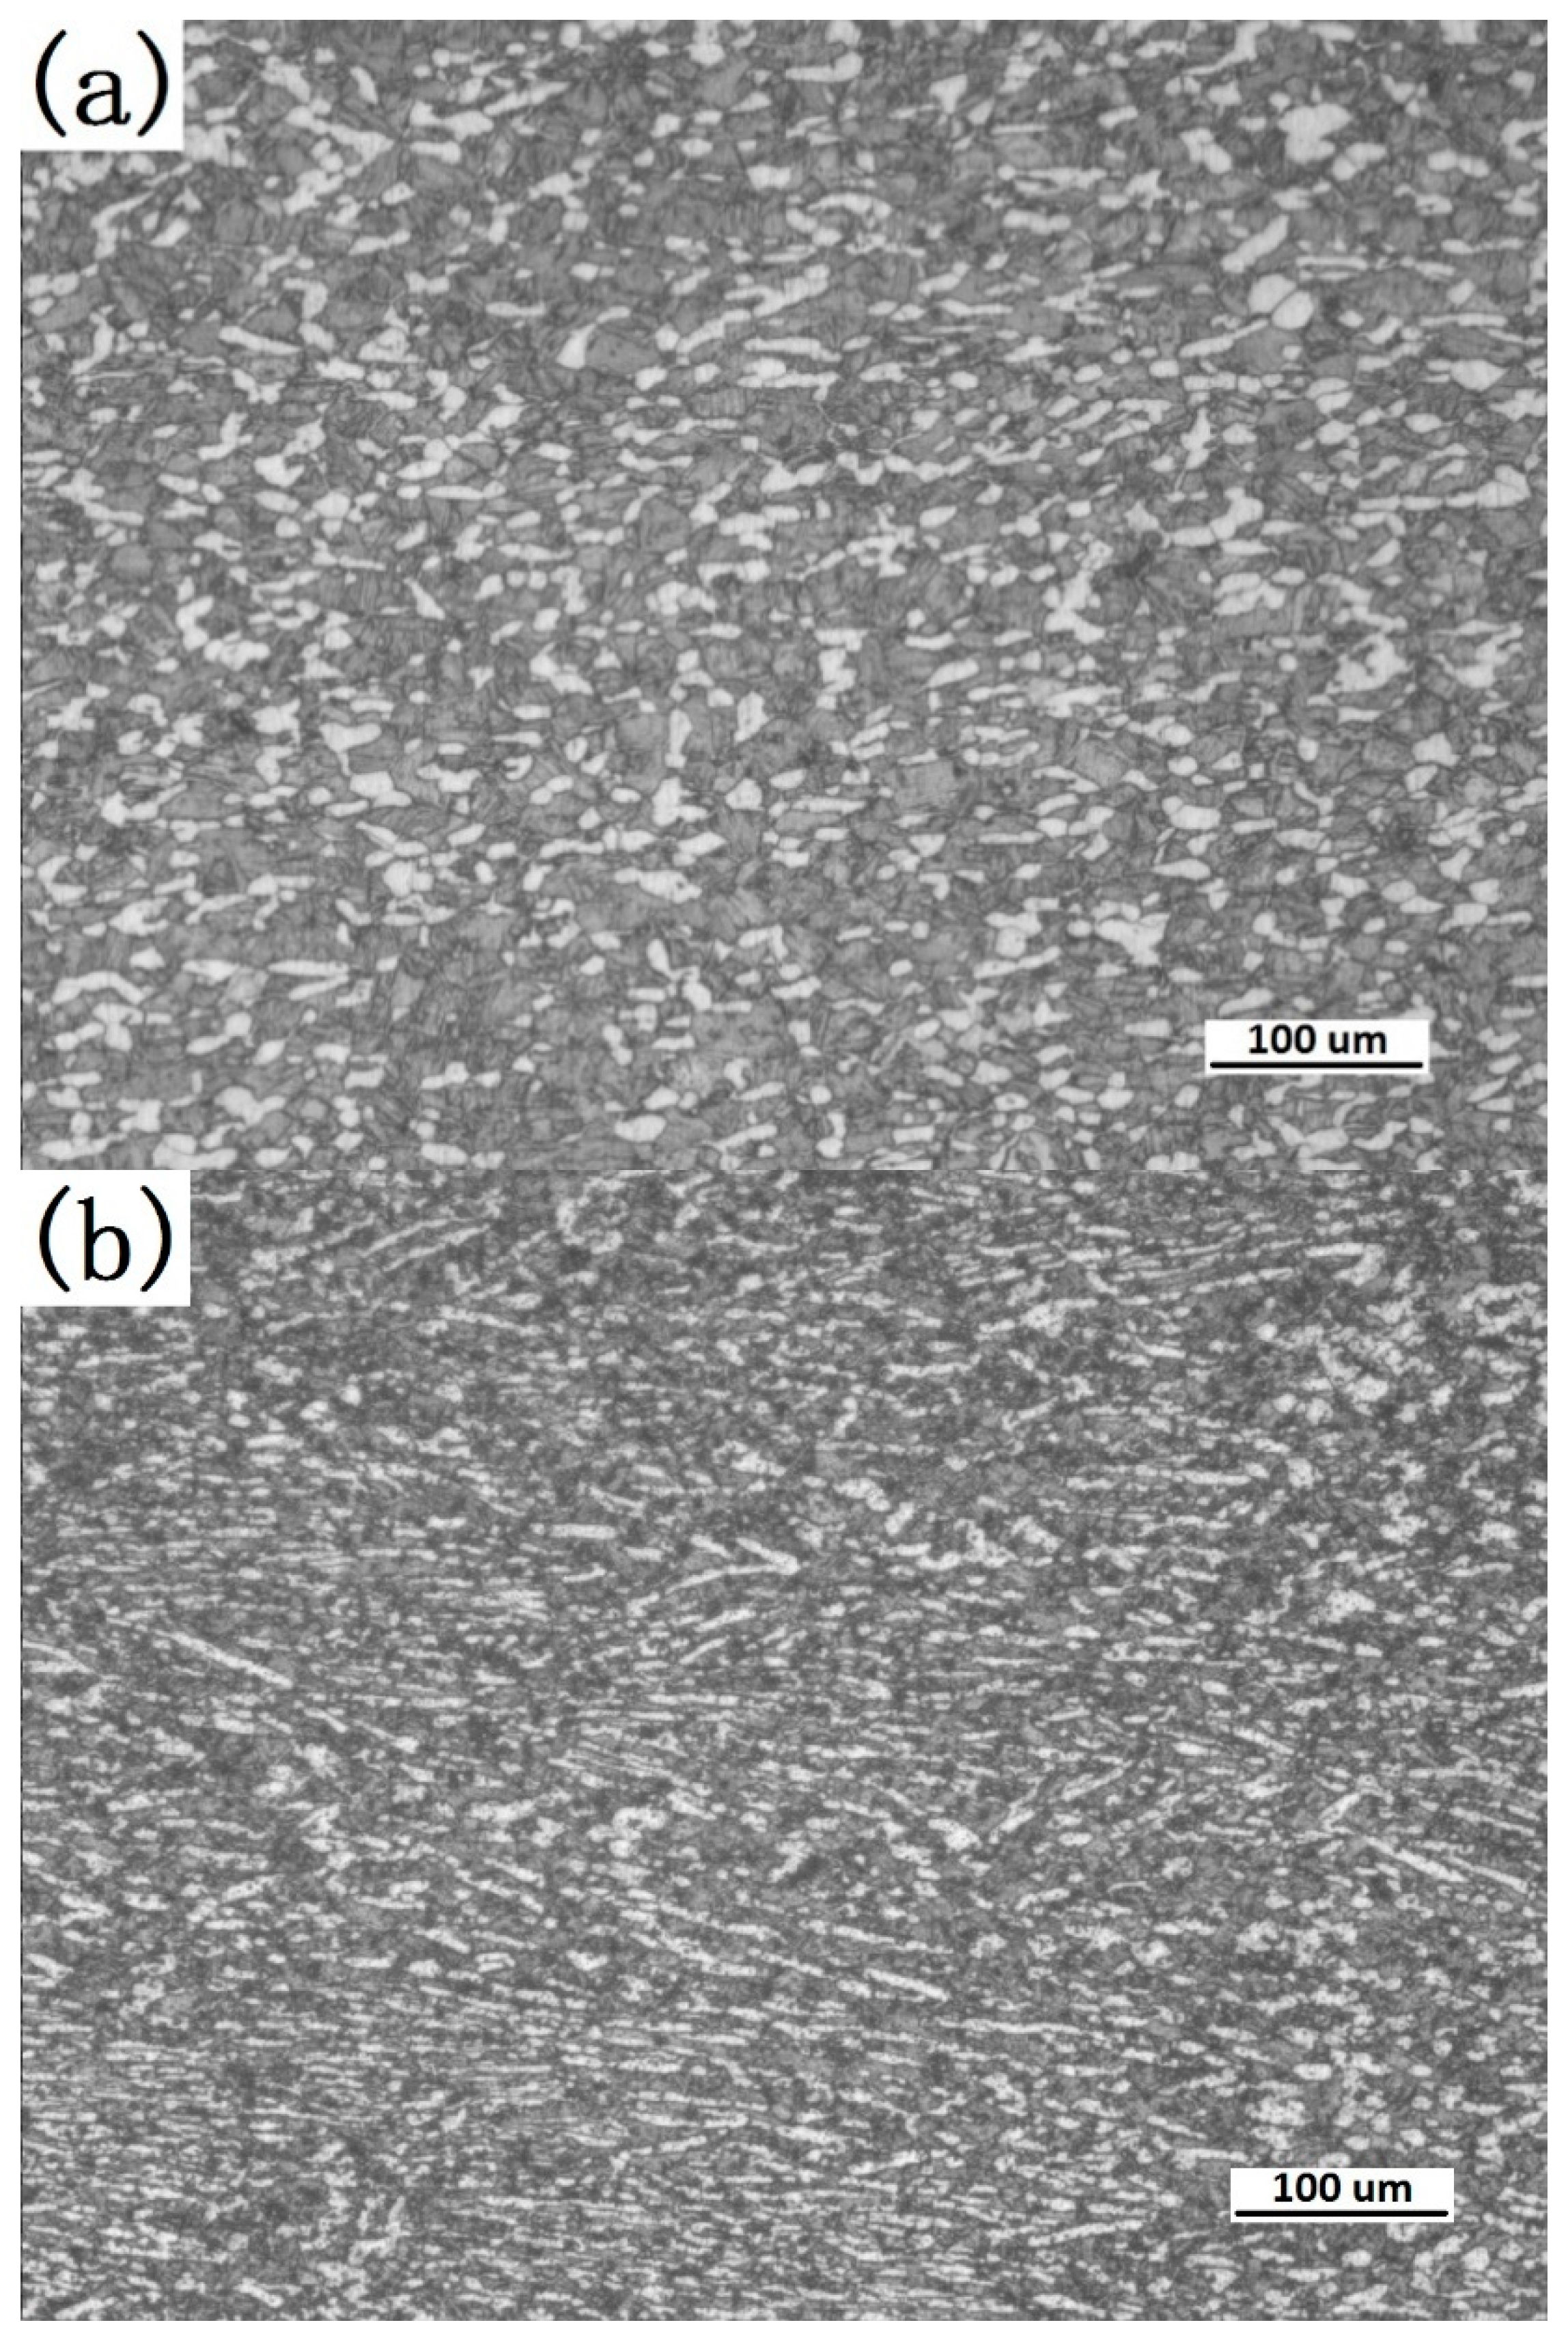
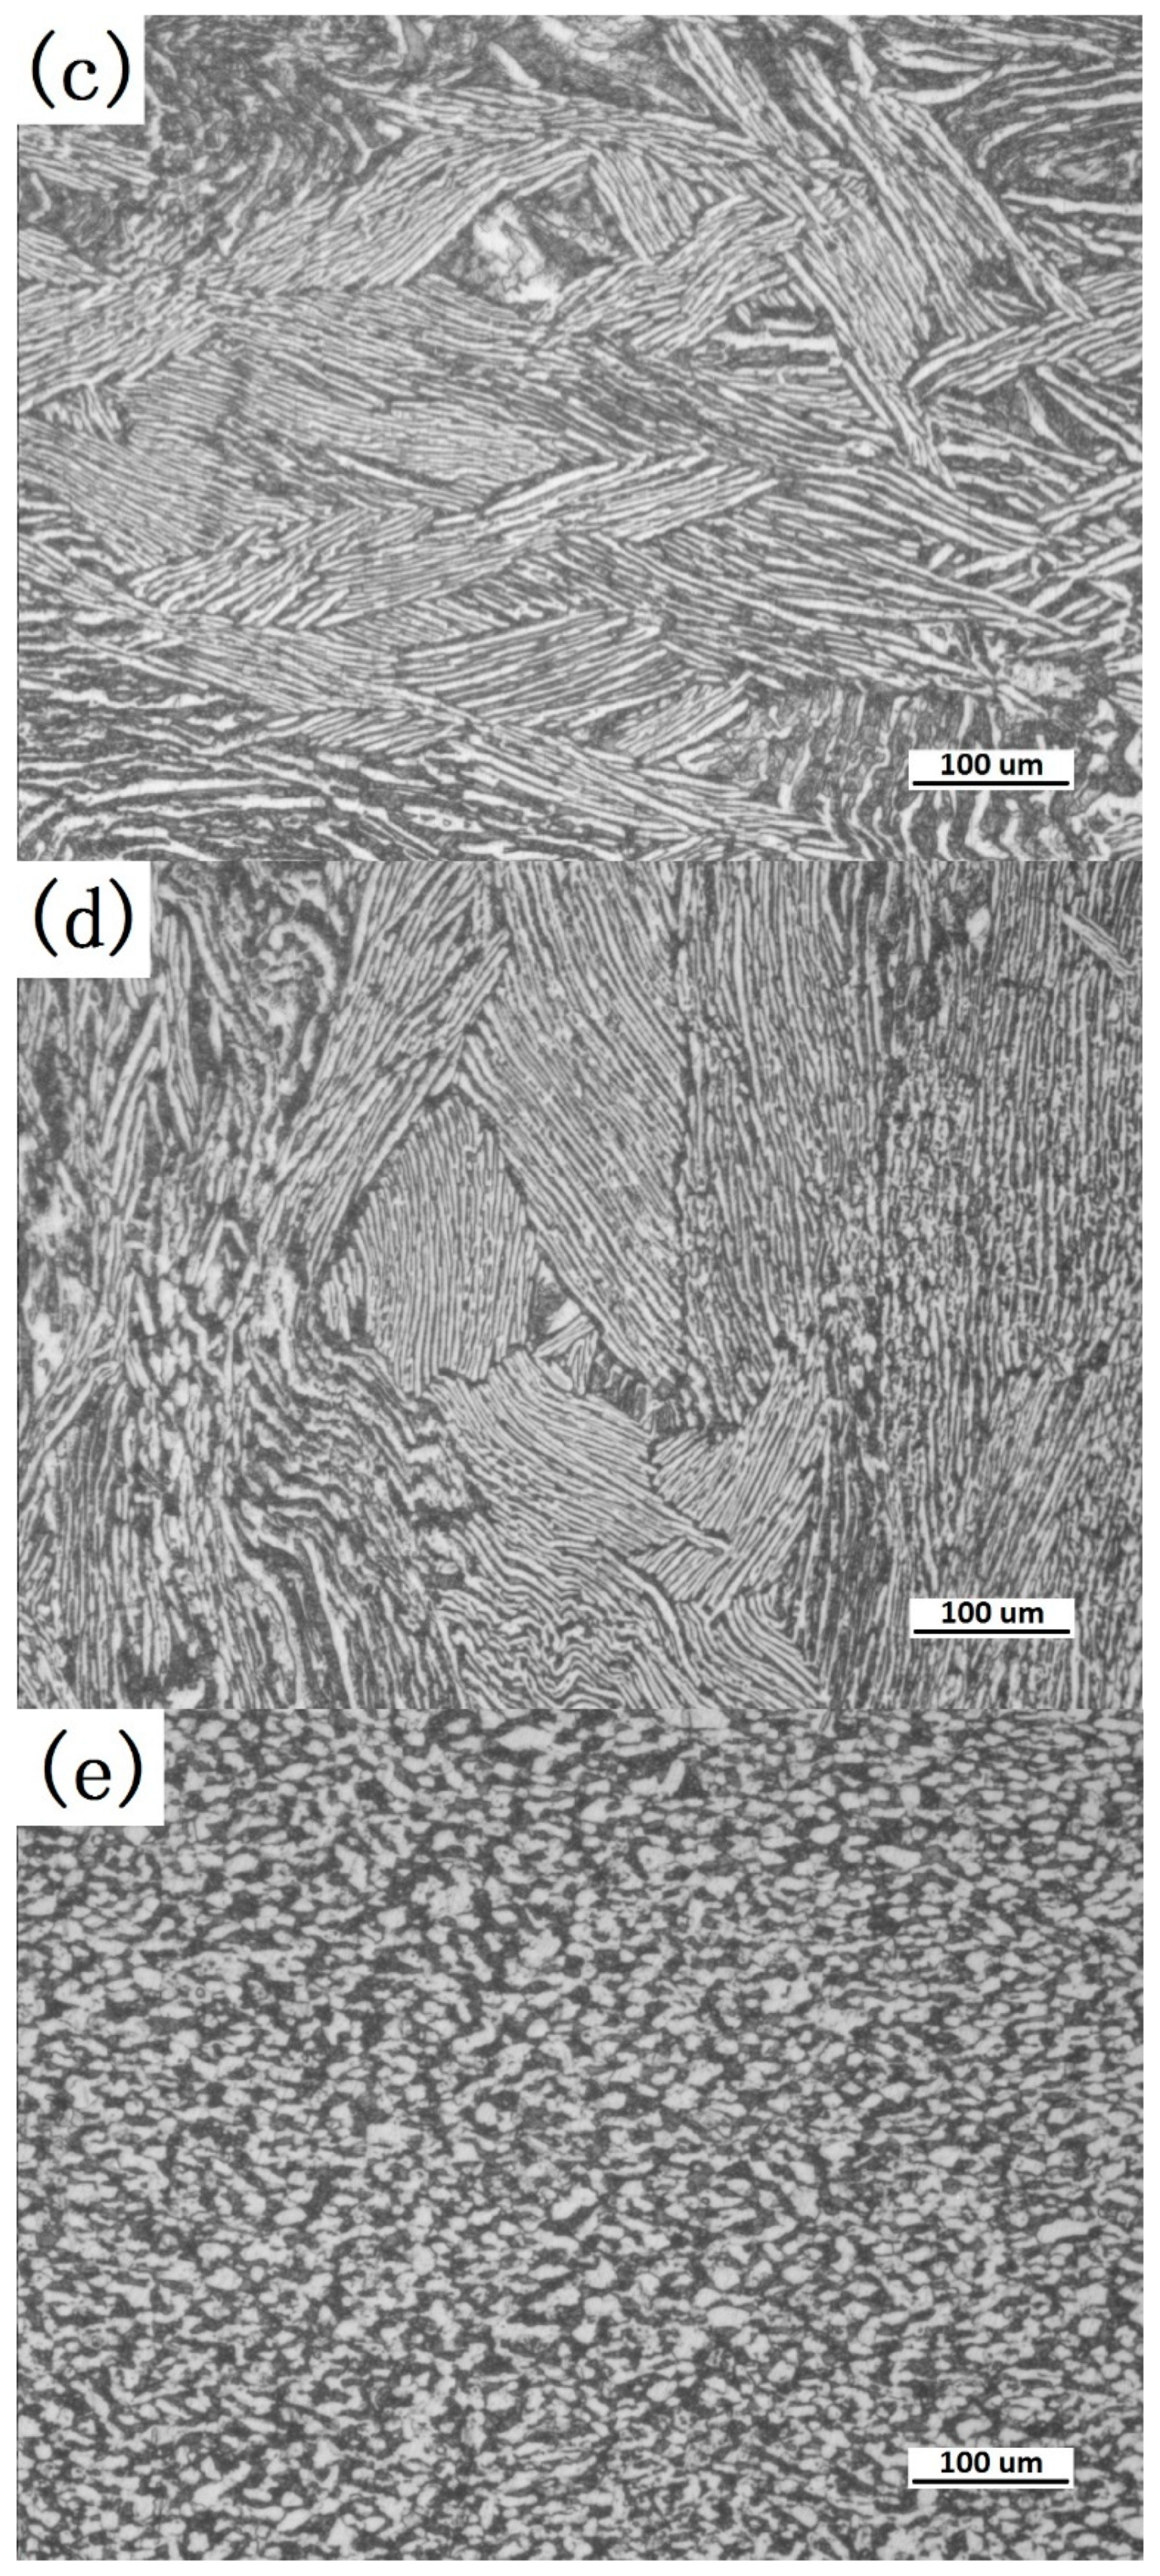
The microstructure variations of the specimens at 1223 K are shown in Figure 4, and the deformation strain rates increased from 0.001 s−1 to 10 s−1. Figure 4a indicates that equiaxial recrystal grains were found, which replaced the initial and primary strip-shaped grain of 0.001 s−1, probably due to the deformation recrystallization of the microstructure under this deformation condition. As the deformation condition changed, the primary strip-shaped α phase volume fraction varied, and the β matrix volume fraction increased gradually with increasing deformation temperature. It can be seen from the change of the microstructure evolution that the recrystallization volume fraction was influenced by the strain rate and decreased as the latter increased. Considering the trend in the variation of the stress-strain curve under the corresponding conditions, the α phase and β phase recrystallizations were the potential reason for flow softening, as shown in Figure 4a–e. The flow softening mechanism is more complicated when deformed in the two-phase zone for titanium alloy. As shown in Figure 4c,d, the initial strip-shaped grain was elongated and smooth along the vertical compression direction, which proved that no obvious DRX occurred in this process. Some squashed β grains at 10 s−1 were observed and a few β matrix grains were compressed and partial β grains were equiaxial, which proved the occurrence of recrystallization in β phase, as shown in Figure 4e. The adiabatic shear band was another important reason for the flow softening, especially at the higher strain rate, such as 10 s−1 in this study; however, no obvious adiabatic shear band was found (Figure 4e).
3.2. Constitutive Modeling
3.2.1. Constitutive Equation Derivation
The flow stress of TA15 titanium alloy was affected by the strain rate and temperature in the evaluated temperature deformation. The stress-strain curve was obtained by testing the isothermal compression at different temperatures and strain rates, so that the constants of the presented constitutive equation could be obtained.
The Arrhenius equation, which is a phenomenological model, was used to predict the constitutive equation [24], illustrate the correlation among temperature, flow stress and strain, and express the special parameter Z [25,26]:
where
where T is absolute temperature in K, R is a gas constant, 8.3145 J/mol·K, Q is the deformation activation energy of thermal deformation in J/mol, έ is strain rate in s−1, and A, n’, β, α, and n are constants of materials, α = β/n’.
3.2.2. Material Constants
Material constants in the constitutive equation were evaluated through the stress-strain curve based on experimental data. However, the strain effect was not considered in Equations (1) and (2). Previous research mainly studied the Arrhenius model, which accurately illustrates the correlation among flow stress, deformation temperature, and strain. The following process was evaluated at a strain of 0.2.
The values of F(σ) were replaced in Equation (2). Correlation between low stress and high stress is as follows:
where B and C are material constants that are independent from the deformation temperature. The natural logarithms of both sides of Equations (4) and (5) were taken, and the equations are as follows:
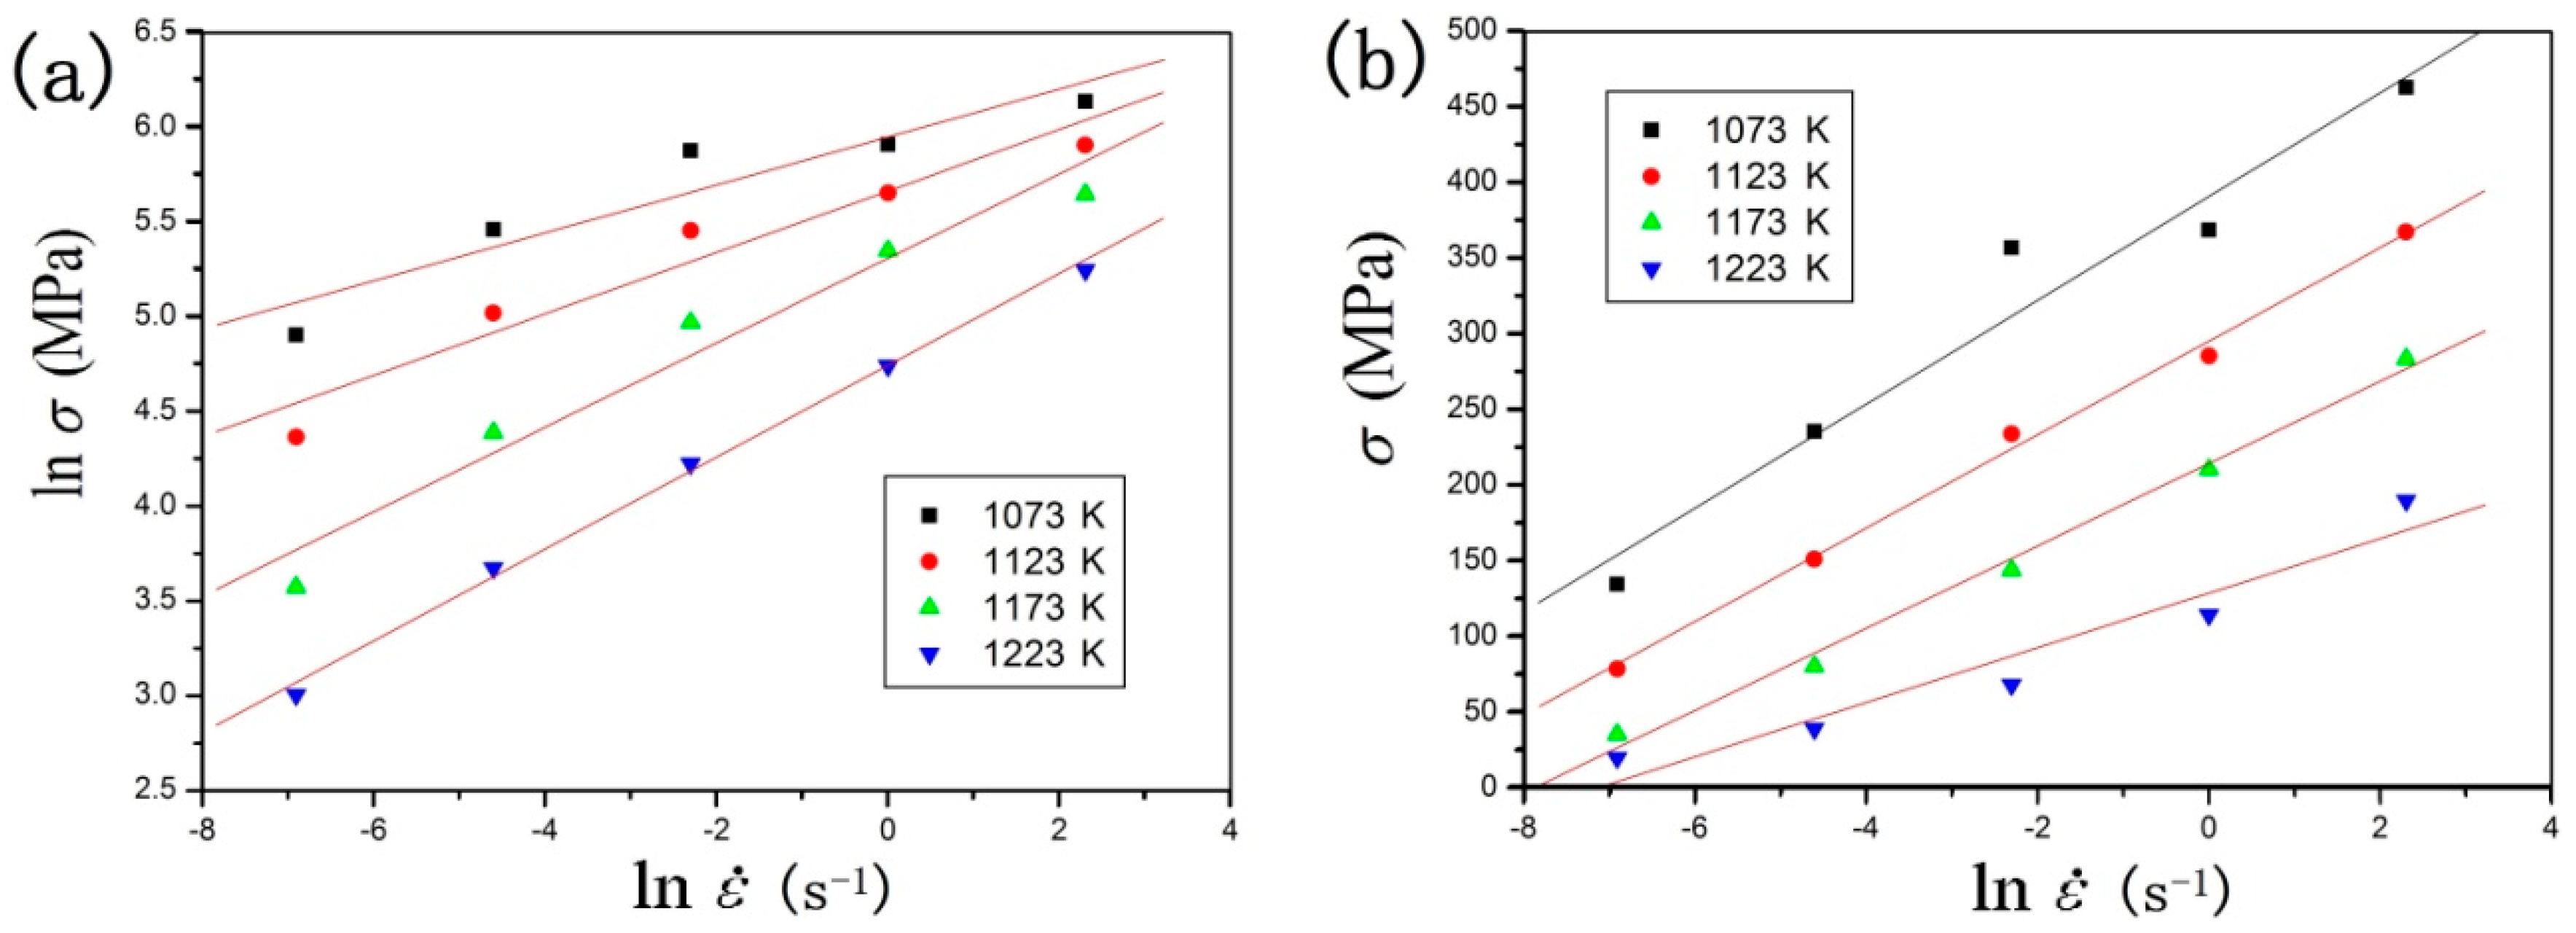
The corresponding value under the strain of 0.2 was substituted into the above equations. The correlation plots of ln(σ)−ln(έ) and σ−ln(έ) were obviously approximated by parallel and straight lines, respectively. β and n’ were obtained from the line slopes in the ln(σ)−ln(έ) plot and σ−ln(έ) plot, as shown in the following equations and Figure 5. The averages of n’ and β were 5.6875 and 0.0384 MPa−1, respectively.
Subsequently, Equation (2) was rewritten for all strain levels as follows:
The natural logarithms of both sides were taken for the above equation. The equation is as follows:
At a certain temperature, after Equation (11) is differentiated:
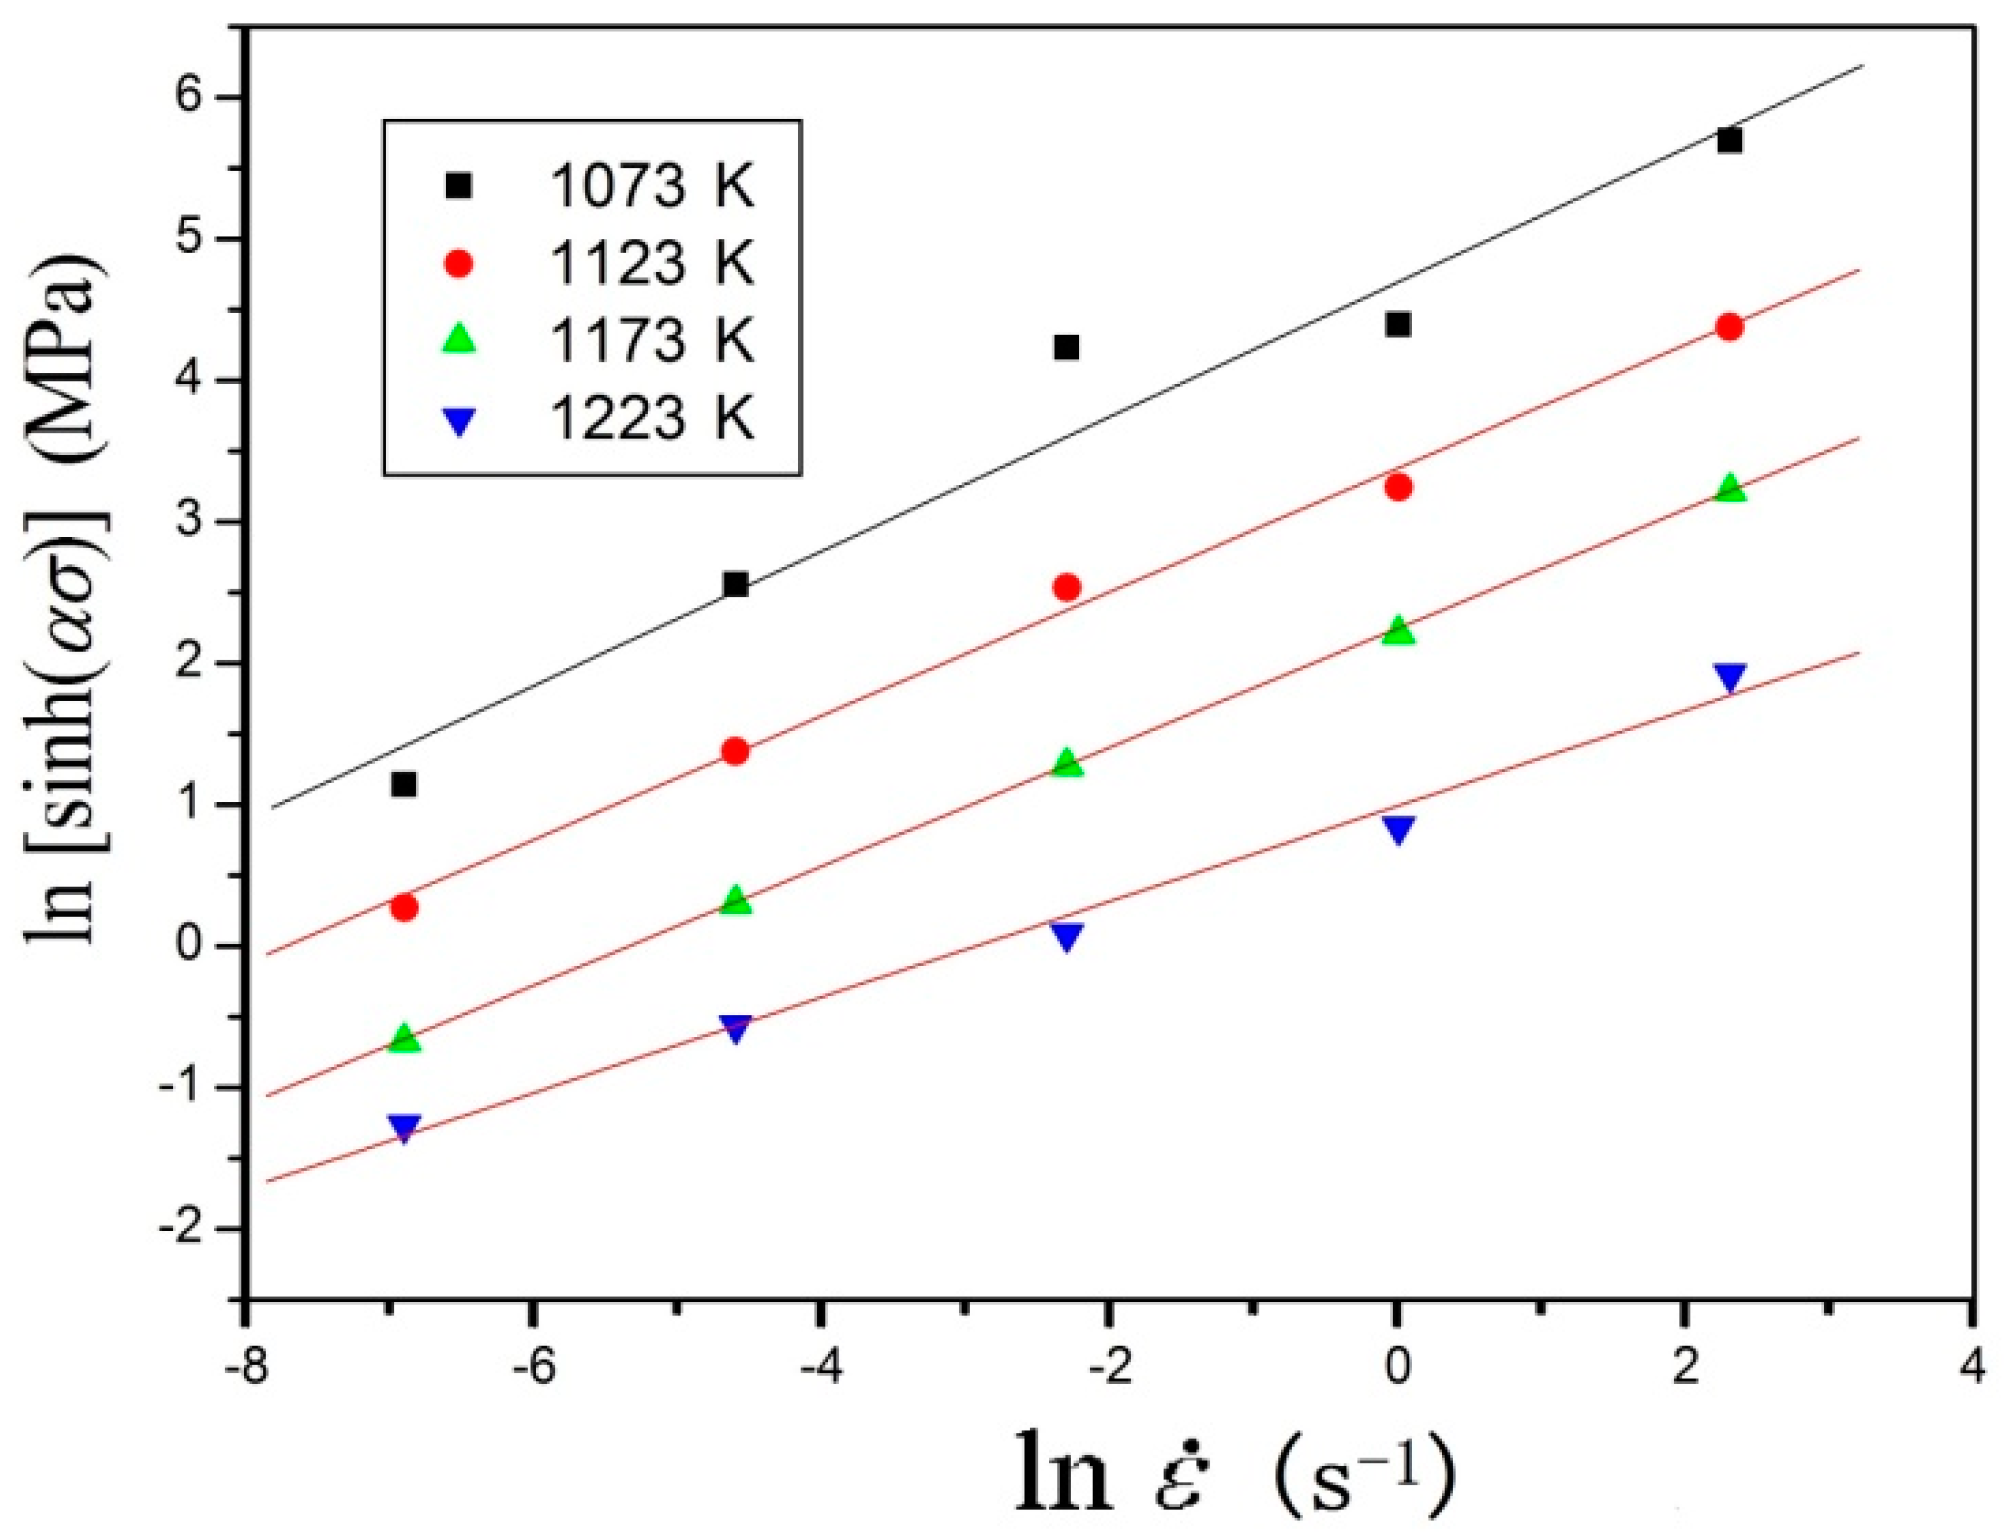
where the n value was taken based on the line slopes of ln[sinh(ασ)]−lnέ in Figure 6, which was 3.5987. And the value of lnA can be derived from the intercept of Figure 6.
At a specific strain rate, Equation (11) is differentiated:
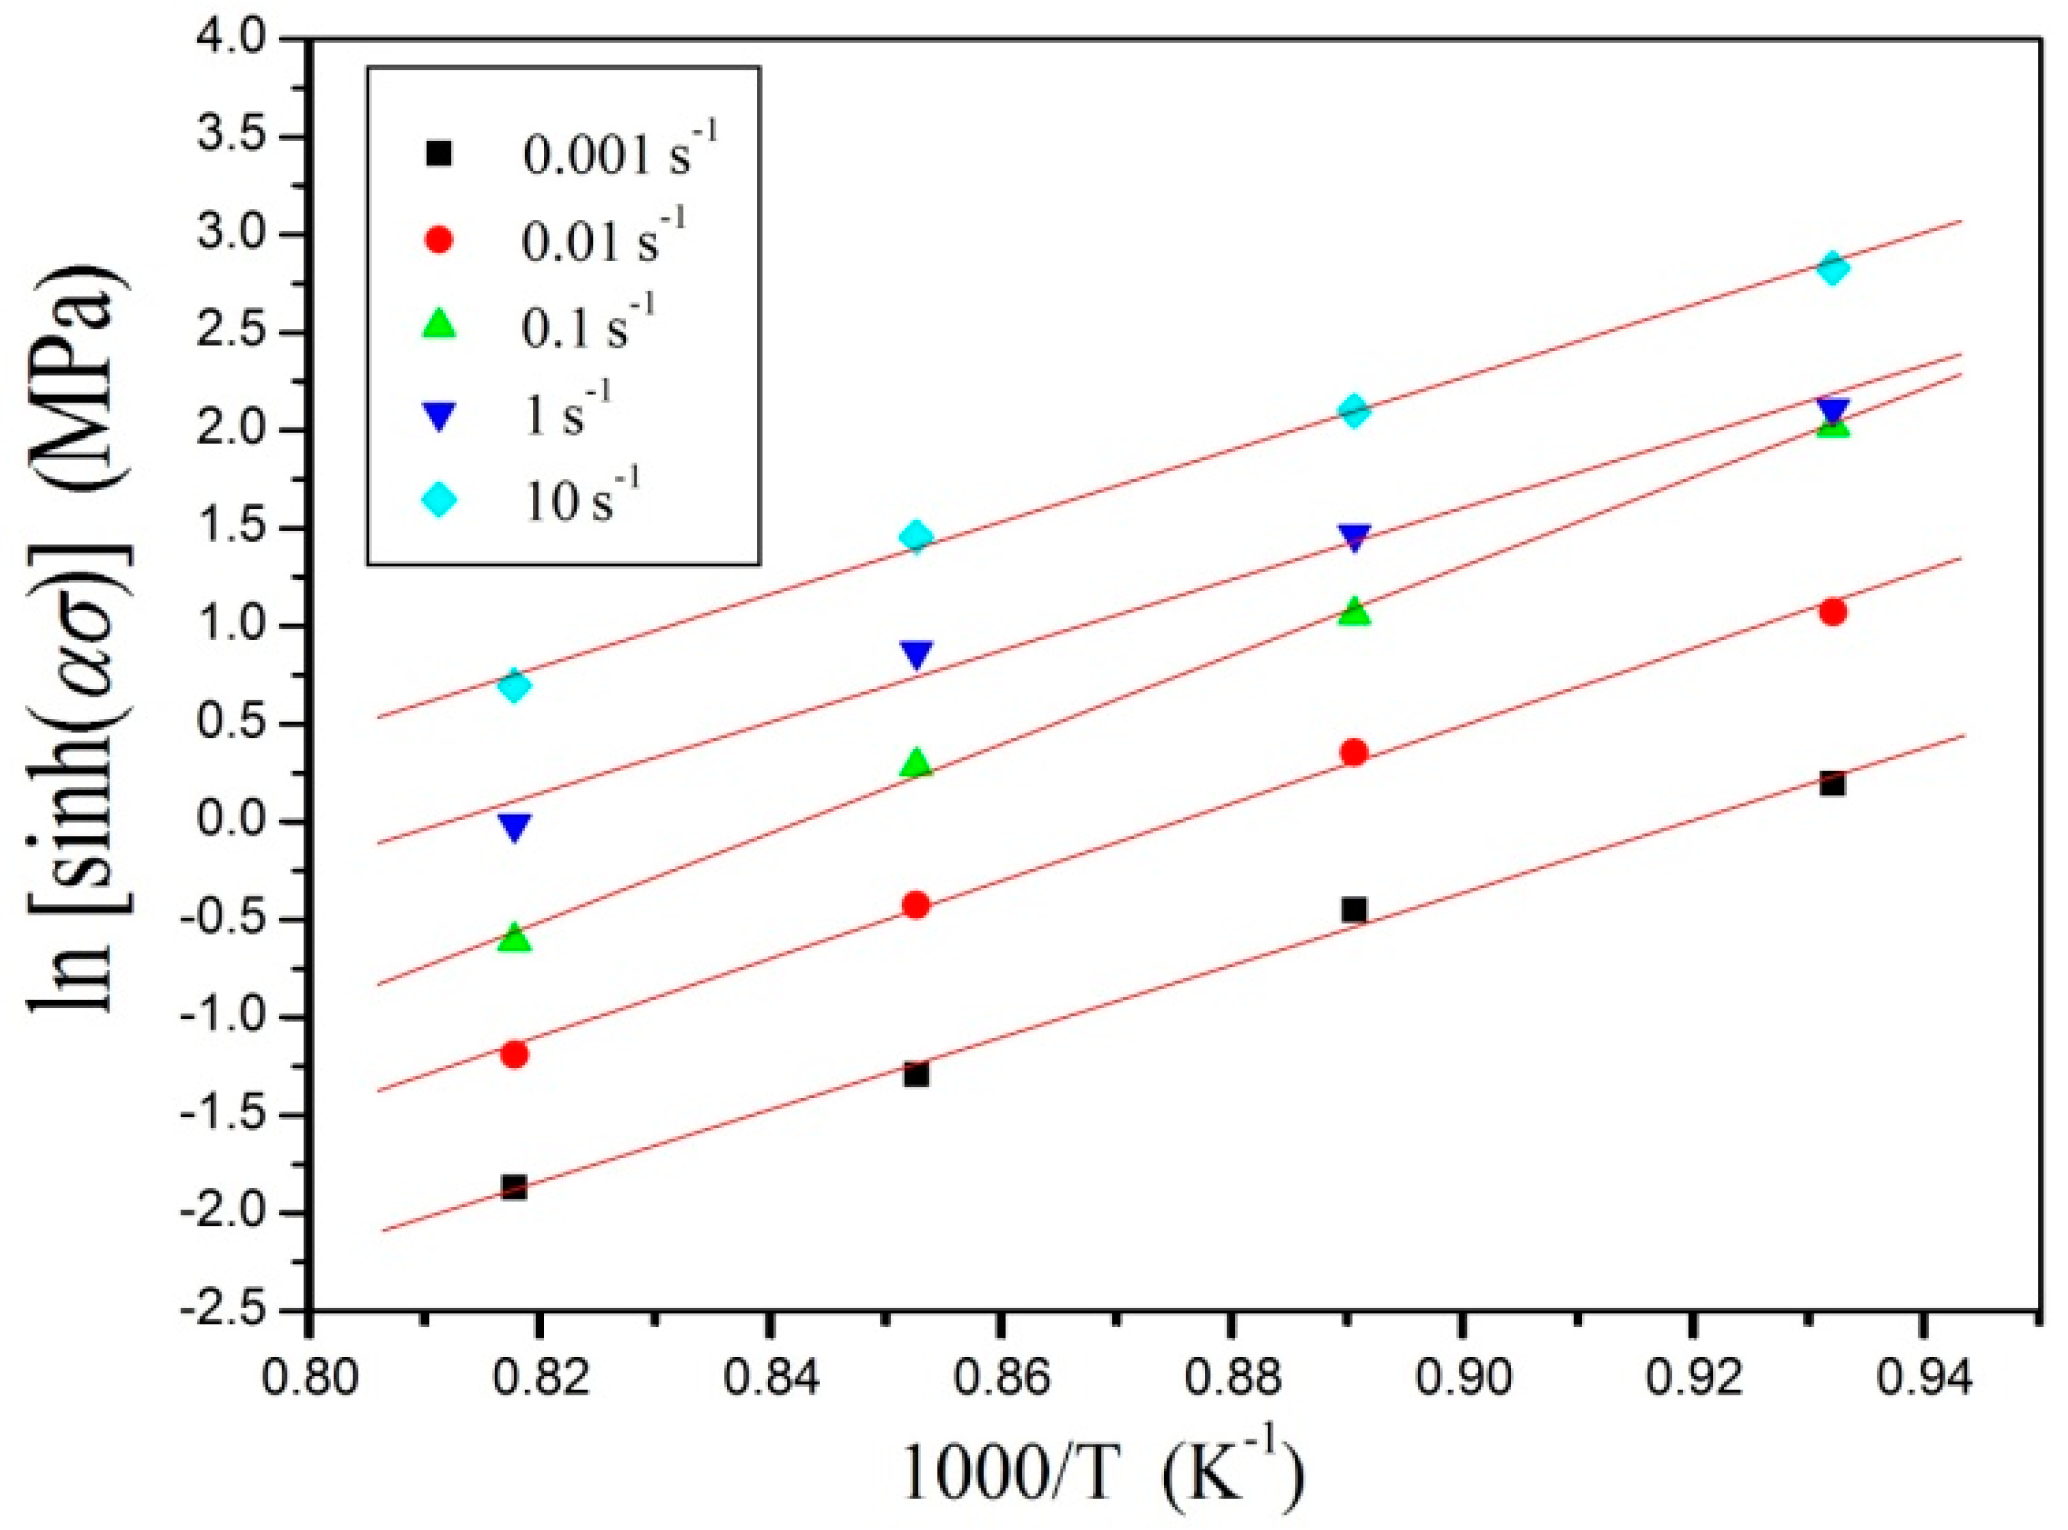
As can be seen in Figure 7, when the strain was 0.2, flow stress and deformation temperatures at a certain strain rate were substituted to Equation (13), and the value of Q was derived in the plotting slope of ln[sinh(ασ)] as a function of 1/T (Q was in kJ/mol for ln[sinh(ασ)]−1000/T). Average Q at different strain rates was 584.63 kJ, and the value of Q was obtained, which was consistent with the current reference (654 kJ/mol by Zhang [27] and 588.7 kJ/mol by Luo [28] for α + β phase region). When deformation activation energy Q in deformation approached diffusion activation energy, the major material softening mechanism was dynamic recovery. When the diffusion activation energy was much lower than the deformation activation energy, the DRX may have been the main mechanism. According to the study of Briottet et al., the deformation activation energy of titanium alloy is high in the two-phase region due to the change in temperature, which changes the phase volume fraction and ultimately affects the flow stress through the modeling analysis [29]. The value of lnA at a certain strain was 57.1869, determined from the intercept of Figure 7. The dislocation climb, recrystallization, and recovery were related to Q, which reflected the characteristics of deformation [30].
Subsequently, similar processes were followed so that the above-mentioned material constants could be obtained at deformation strains ranging from 0.1 to 0.8 at 0.1 intervals.
3.2.3. Strain Effect
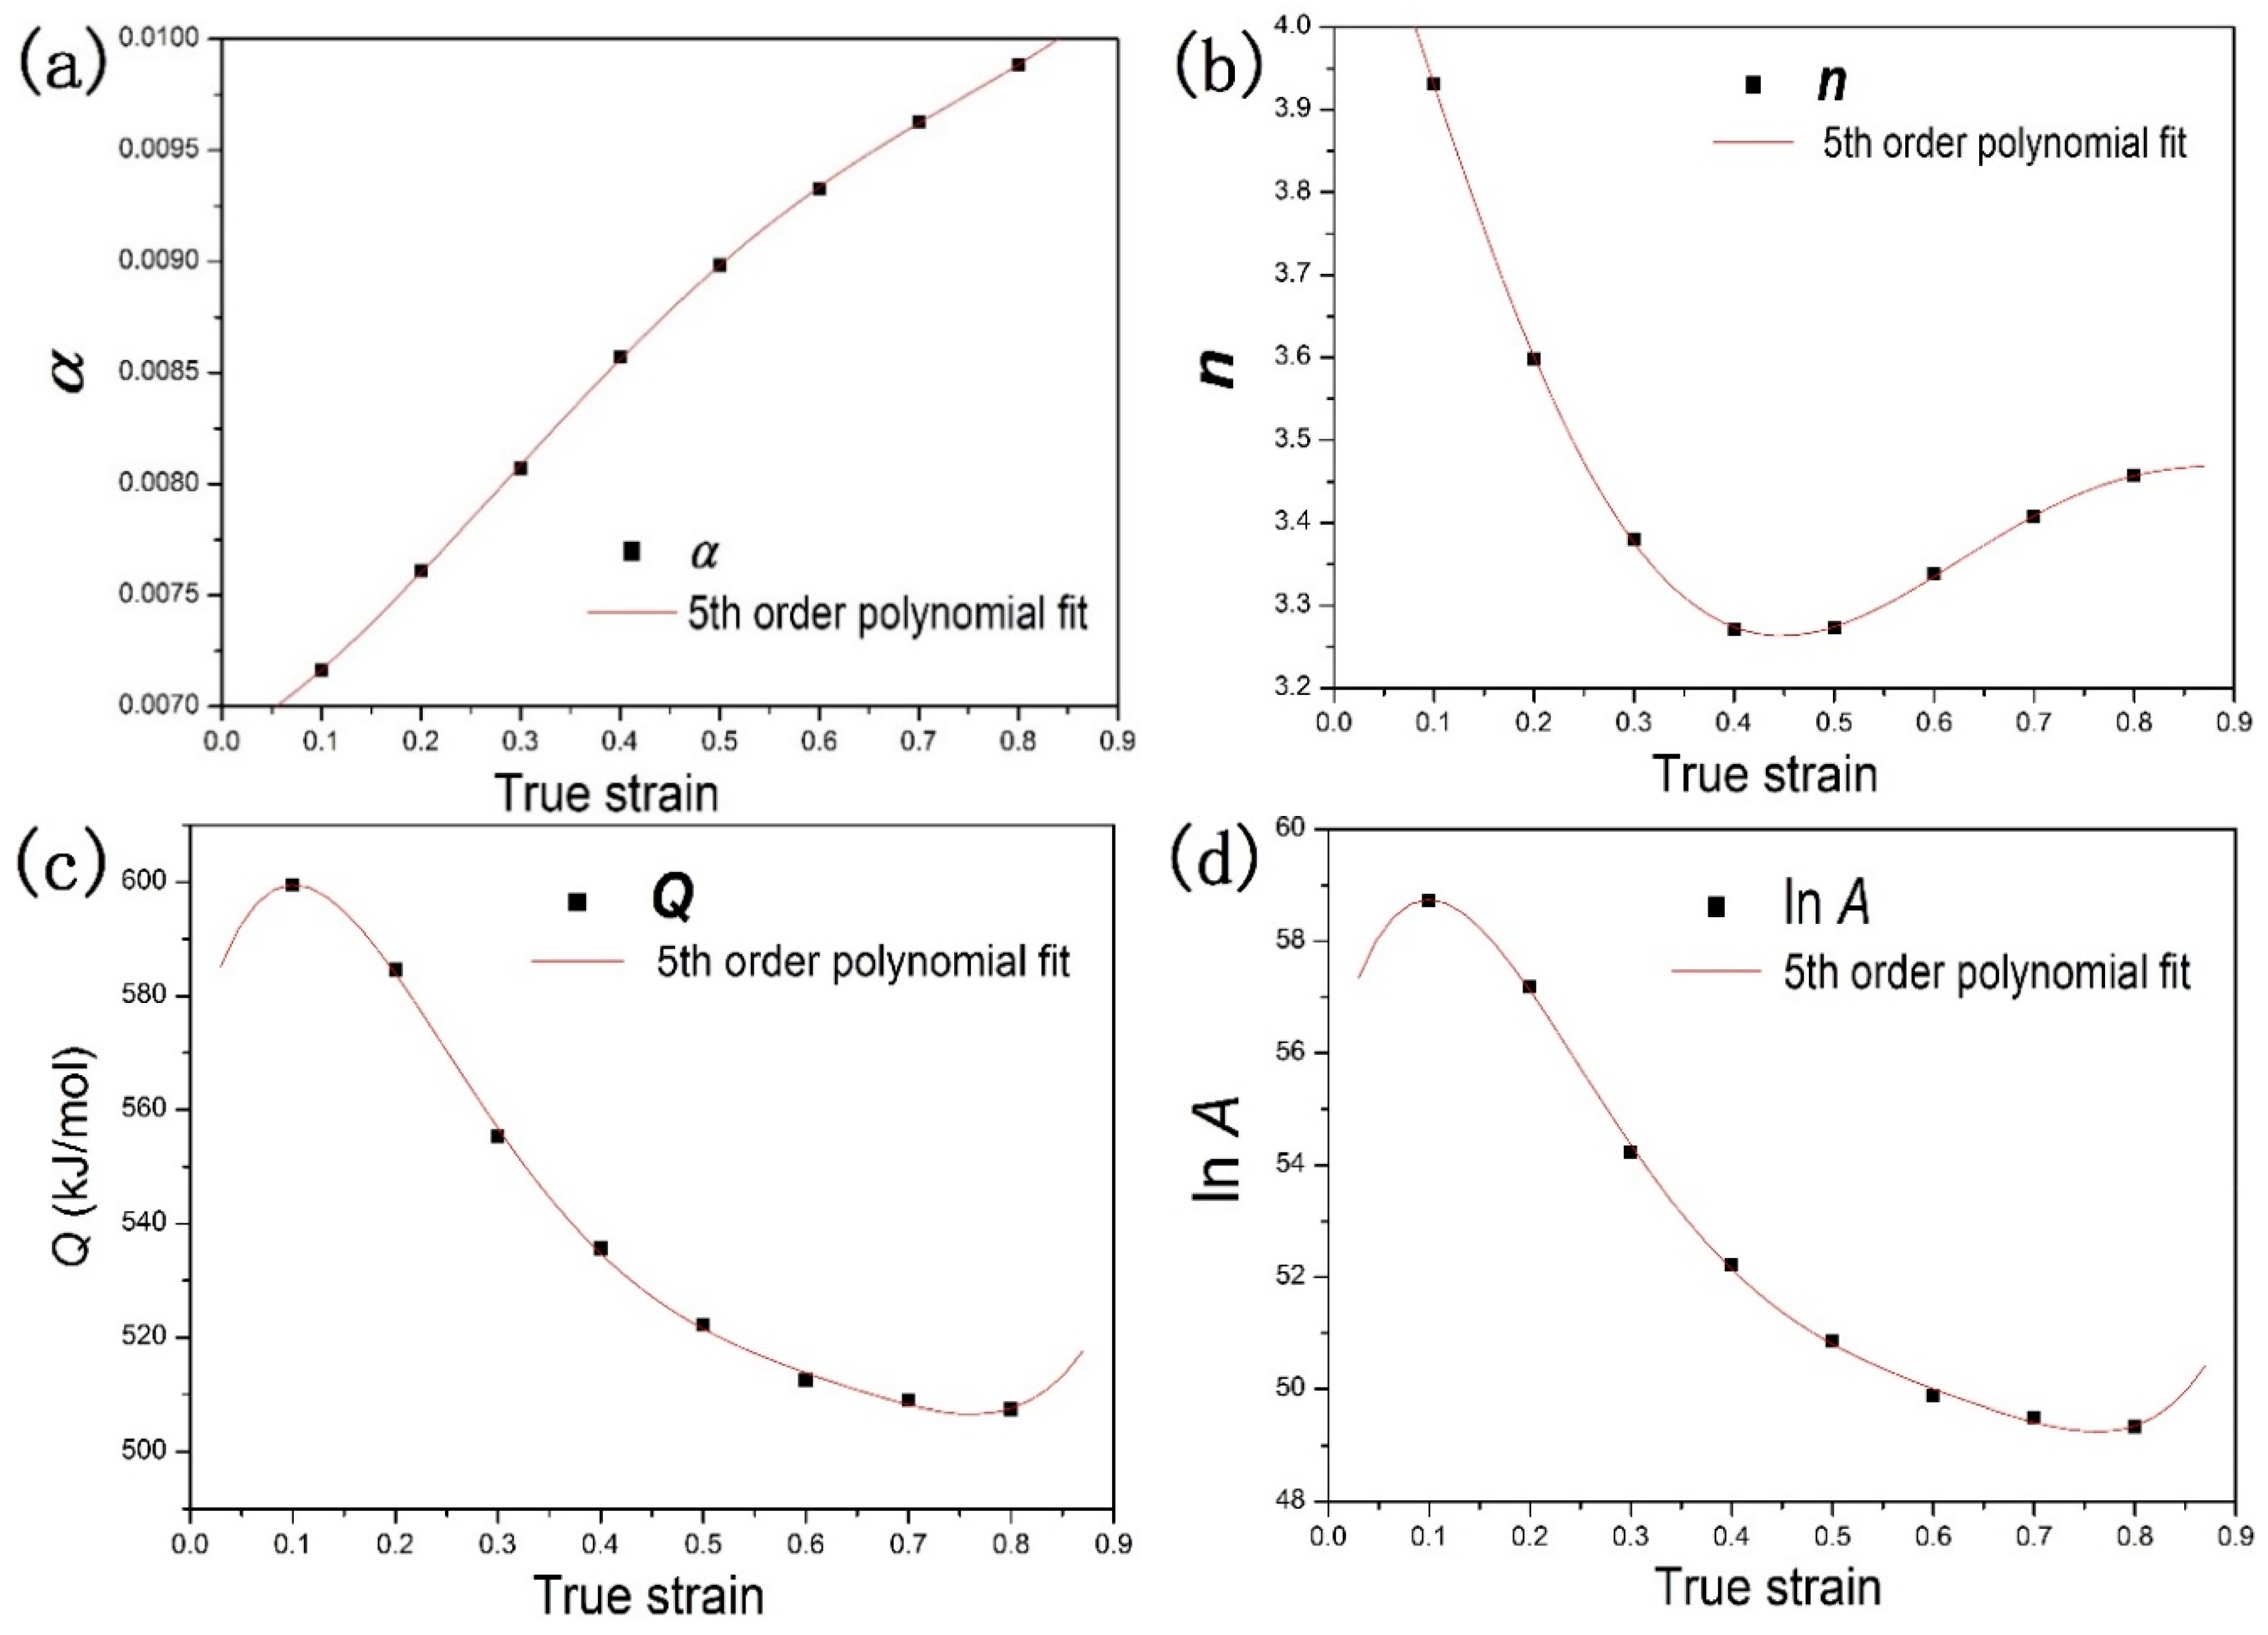
Temperature and strain rate were the parameters of concern for elevated temperature stress-strain curves. Strain cannot significantly influence flow stress. However, strain can affect deformation activation energy Q. This common phenomenon was studied in Ti-6Al-4V titanium alloy [15], Ti-modified austenitic stainless steel [31], aluminum alloys [14,20,21], magnesium alloy [22,32], and steels [17,18,19]. In isothermal compression tests at elevated temperatures, strain generally influenced flow stress, which was particularly significant at high deformation temperature for TA15 alloy, as can be seen from Figure 8. Therefore, the strain effects cannot be neglected. The results show that strain significantly influenced the materials constants α, β, n, lnA, and Q in the range of strain.
The strain compensation was considered so that the flow stress of TA15 alloy could be accurately predicted. The model between strain and material constants was established using the polynomial function. The fitted polynomial ranged from two to eight. The optimal fitting model of fifth-order polynomial was selected. The material constants were evaluated at strains from 0.1 to 0.8. Equation (14) is the fifth-order polynomial fitting equation. Generalization and representation would be lost due to the overfitting of higher-order (more than five) polynomials. Table 1 shows the polynomial fitting of the material constants α, n, Q, and lnA of TA15 alloy.
The constants of materials were calculated by predicting the flow stress through hyperbolic sine function. The constitutive equation of the Zener-Holloman parameter and flow stress was written as follows considering Equations (1) and (10):
4. Validation of Constitutive Modeling
4.1. Results of Constitutive Modeling
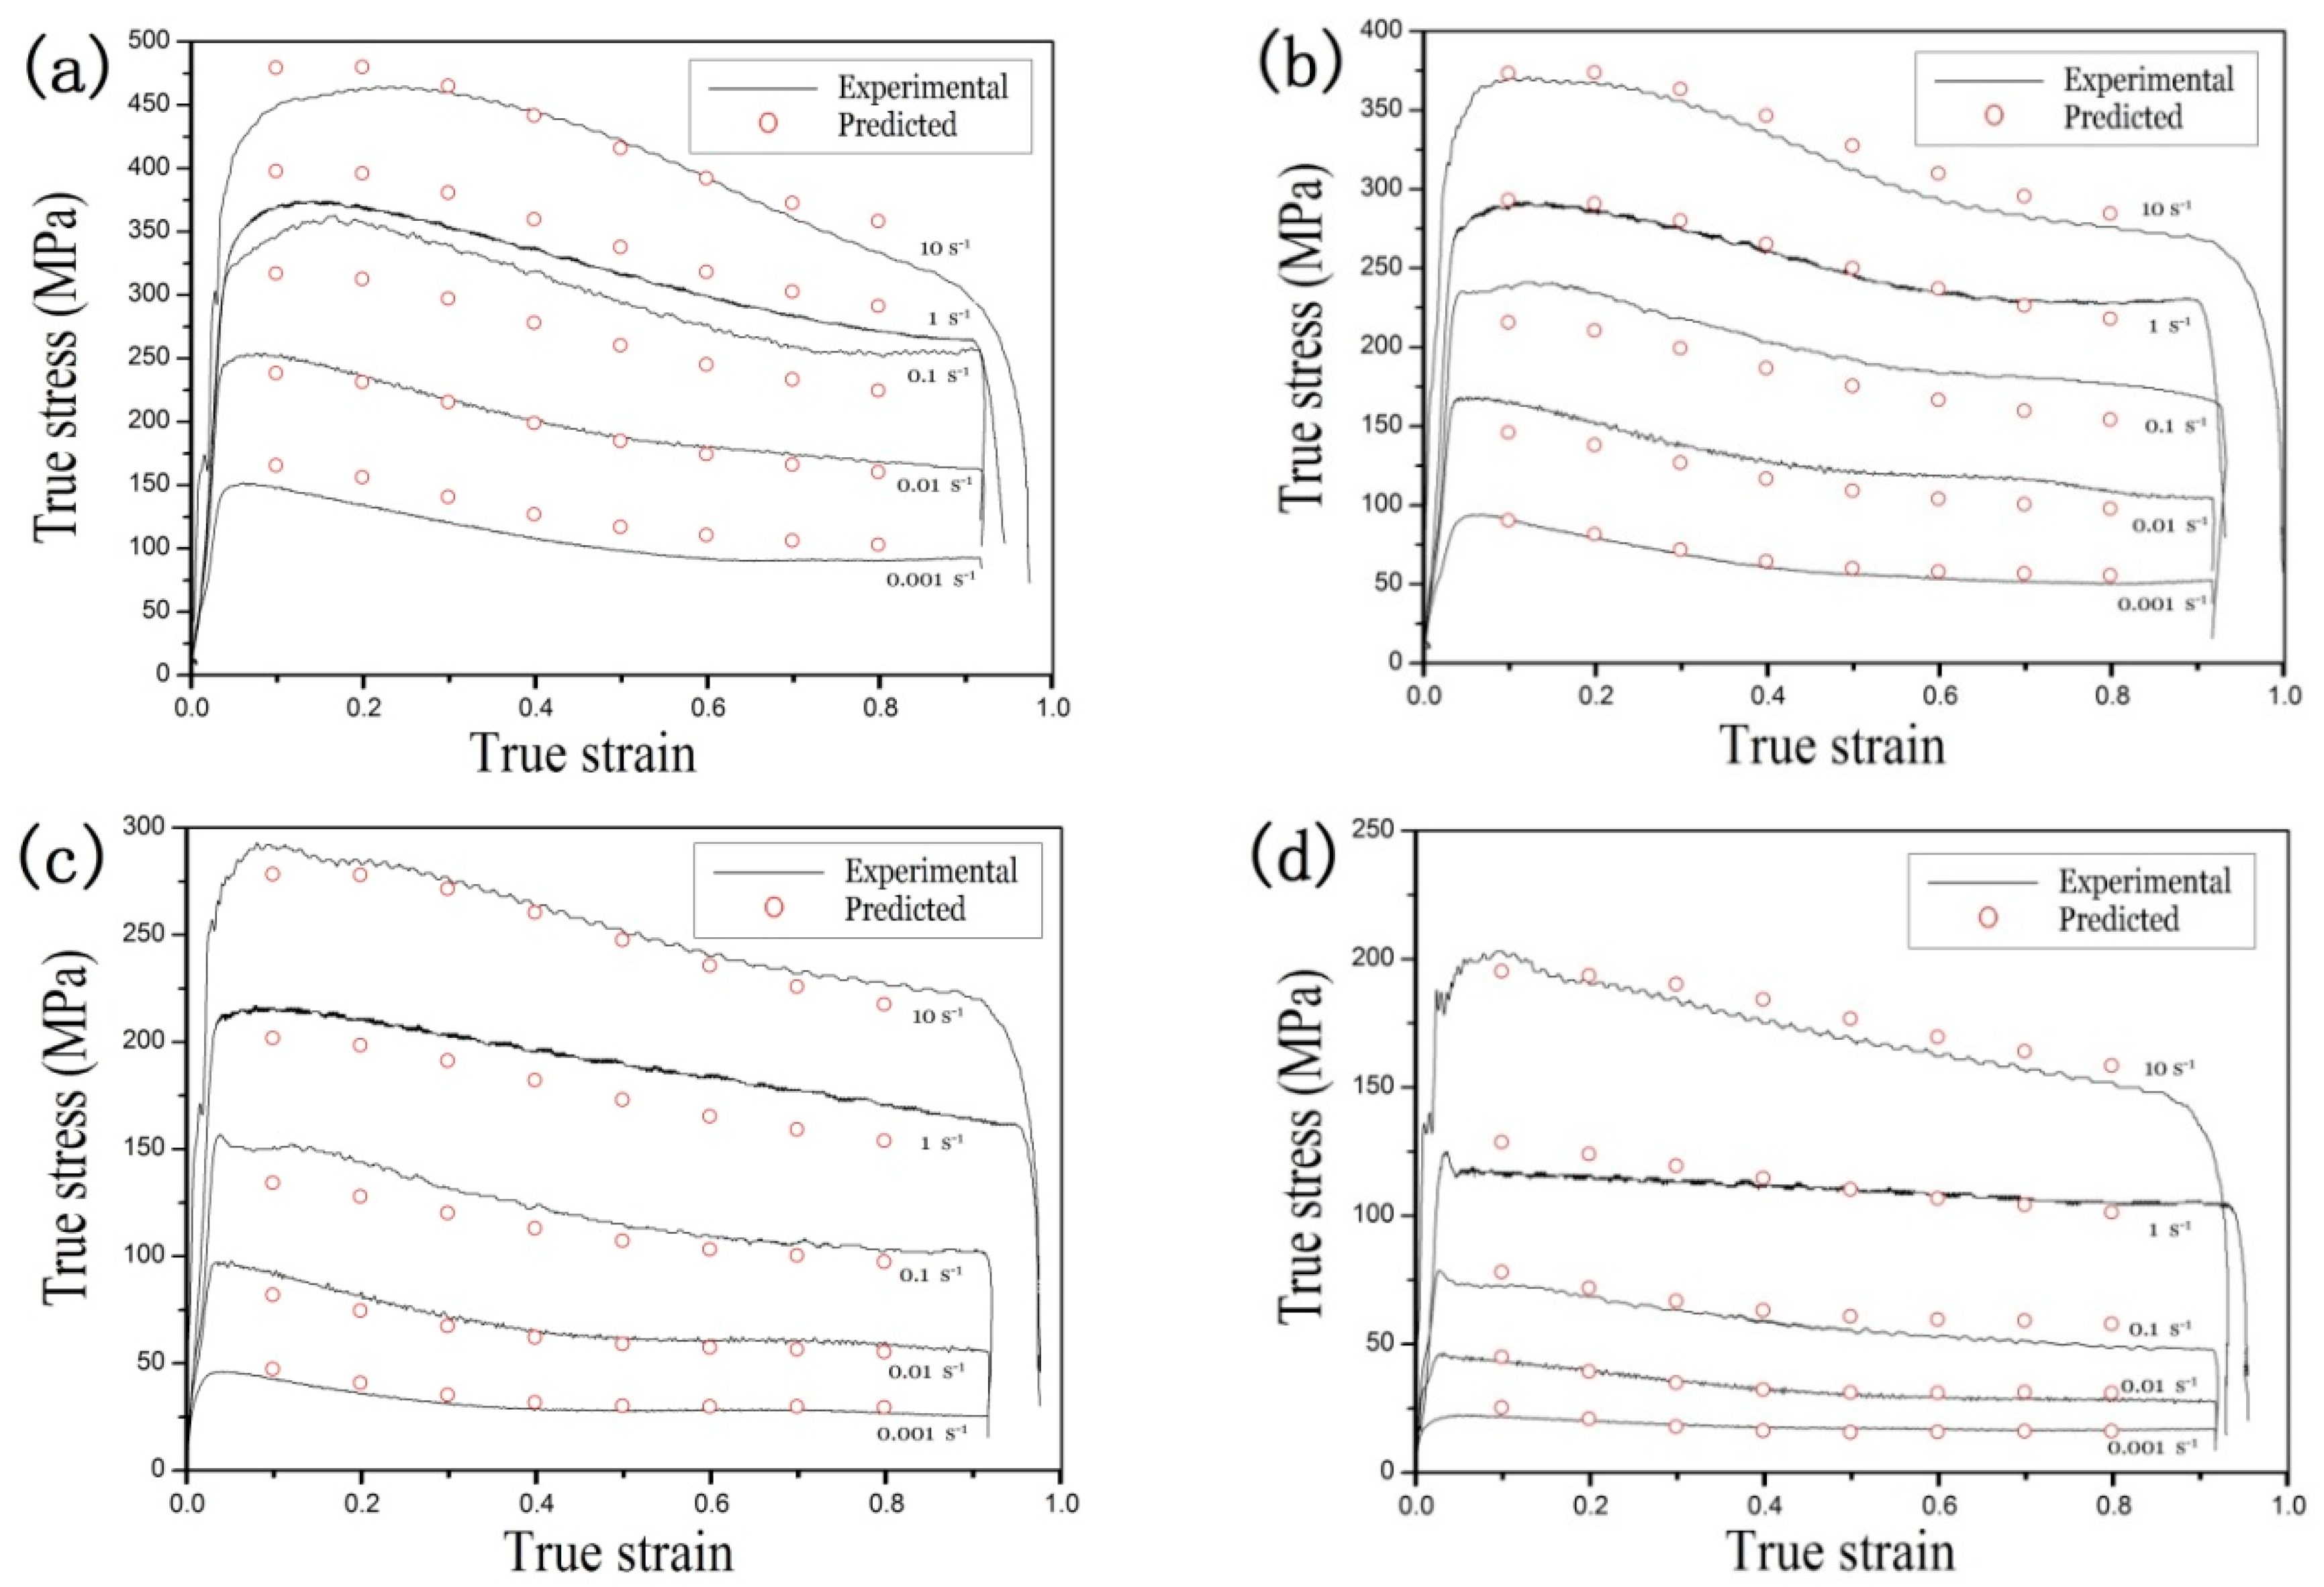
As shown in Figure 9, the experimental data and predicted data were compared to verify the constitutive modeling result considering the strain compensation. The experimental data were consistent with the predicted data in most deformation conditions. In the processing condition (1073 K, when 0.1 s−1; Figure 9a), there was variation between the predicted data and the experimental data due to the high nonlinearity of the flow behavior at high temperatures, which was affected by many factors, limiting the accuracy of the applicable range and the flow stress. The model fitting of the materials constants and some deviations may introduce variation into the modeling.
4.2. Constitutive Modeling Verification
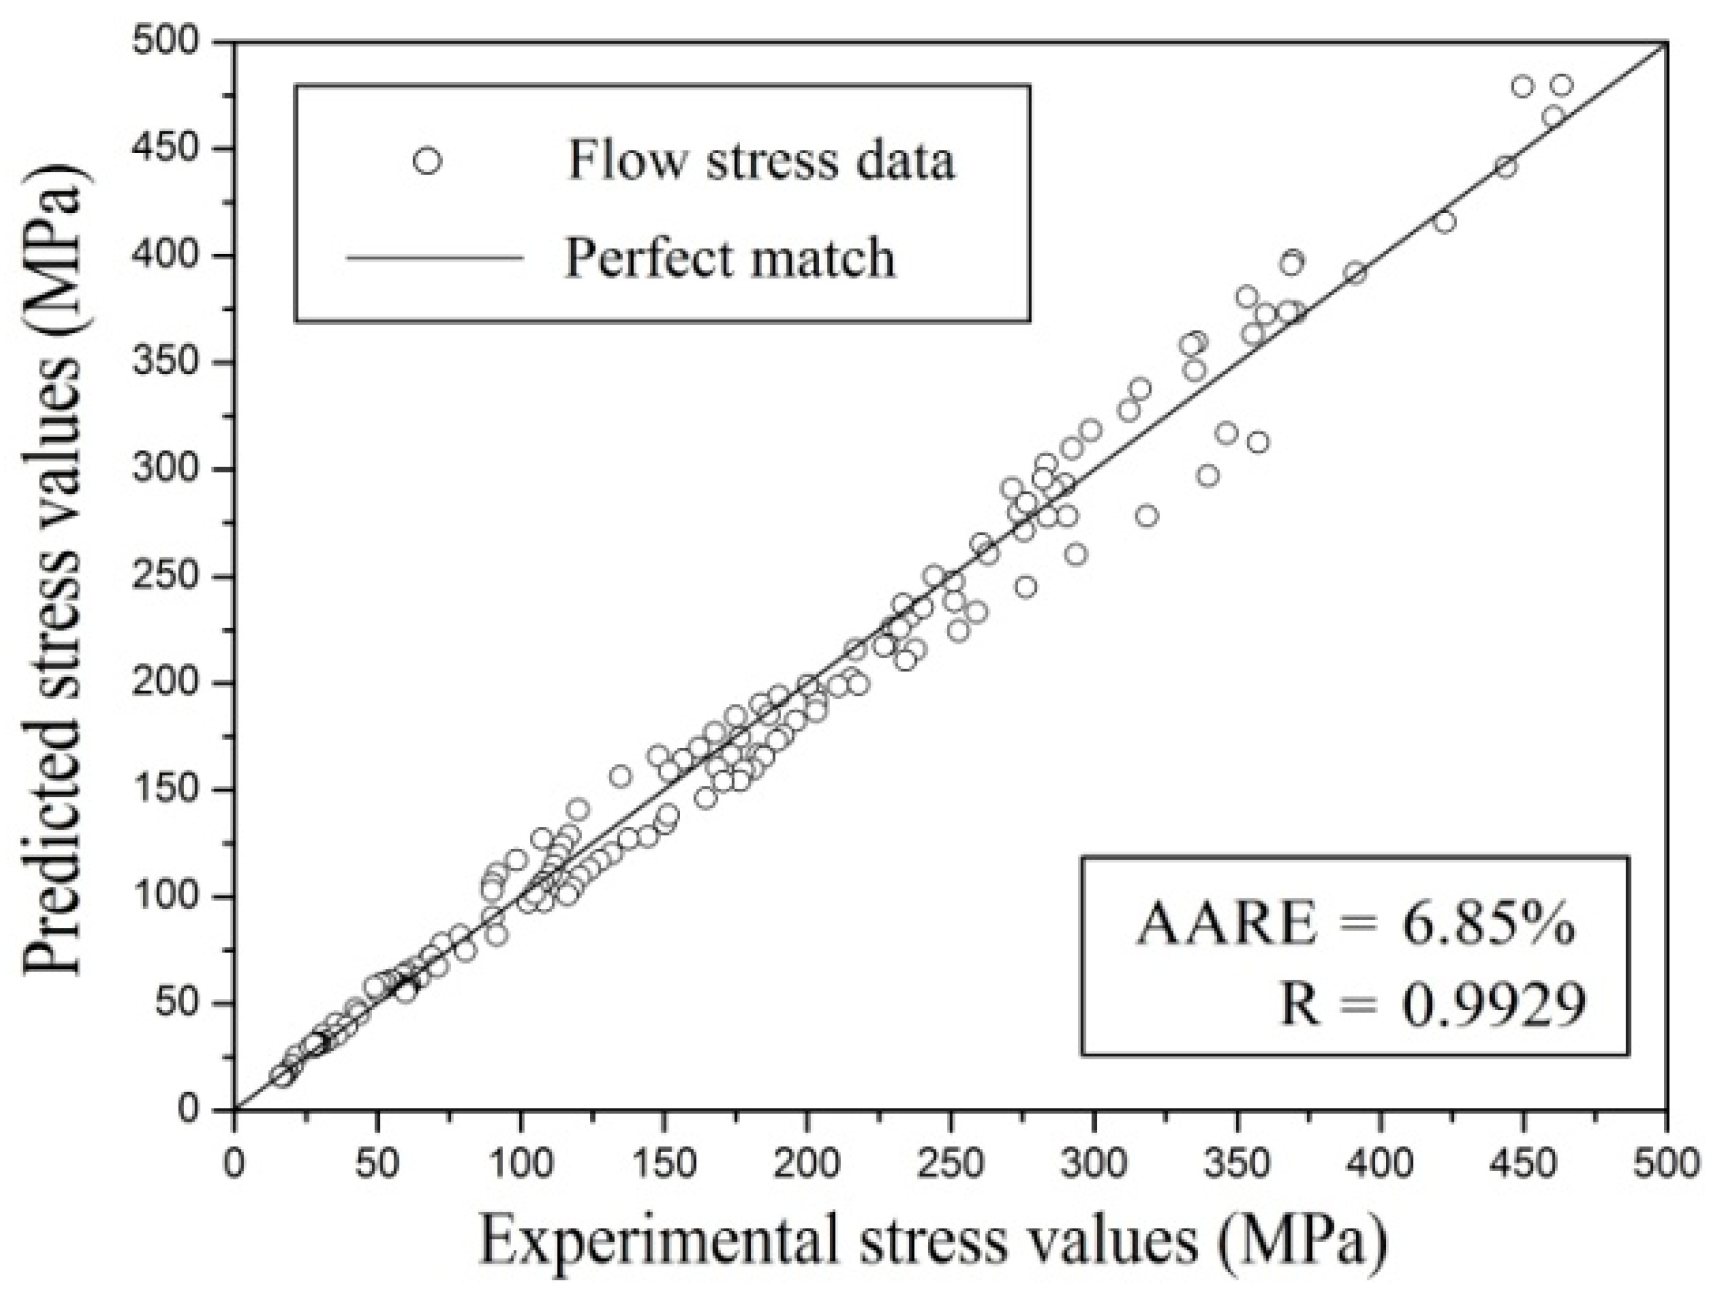
Figure 10 depicts the correlation of experimental data of flow stress and the predicted data in the constitutive equation incorporating the effect of strain over the entire strain range, strain rate, and temperature. Standard statistical parameters, like R and AARE, can quantify the predictability of the constitutive equation:
where N is the data number used in the research, and are average values of P and E, P is flow stress predicted from the constitutive equation involving the strain compensation, and E is the measured flow stress.
As a common statistical parameter, R provides strength information about the relationship between the calculated value and the observed value [21]. Since there is a tendency for the equation to deviate toward lower or higher values, a higher R value does not represent better performance. AARE was also computed by comparing the relative error. As a result, it is an unbiased statistical parameter used to determine predictability. The values of AARE and R are 6.85% and 0.9929, respectively, shown in Figure 10. This indicates that the proposed deformation constitutive equation involving strain compensation can estimate flow stress for TA15 titanium alloy accurately.
4.3. Prediction of Constitutive Model
Flow stress is complex and associated with complicated metallurgical phenomena, across which hot deformation changes considerably. However, the developed model predicted flow stress in a wide range of strains, strain rates, and temperatures. This can be considered as the major potential of the developed model compared to the analytical, phenomenological, and traditional empirical model that is applied in a specific processing domain [33]. Validating the accuracy of the prediction is good not only for the experimental data but also for the extensional conditions. Because of that higher temperature values can introduce the β phase transition in the material, the temperature selected for the specimens prediction accuracy is lower, at 1023 K. The phase change in the microstructure easily produces different stress-strain results, so lower temperatures ensure that the microstructure of the materials is filled with a single α phase. A similar study found that the simulation error of extreme points can be decreased by increasing the temperature and strain rate ranges for the near-α titanium alloy [34].
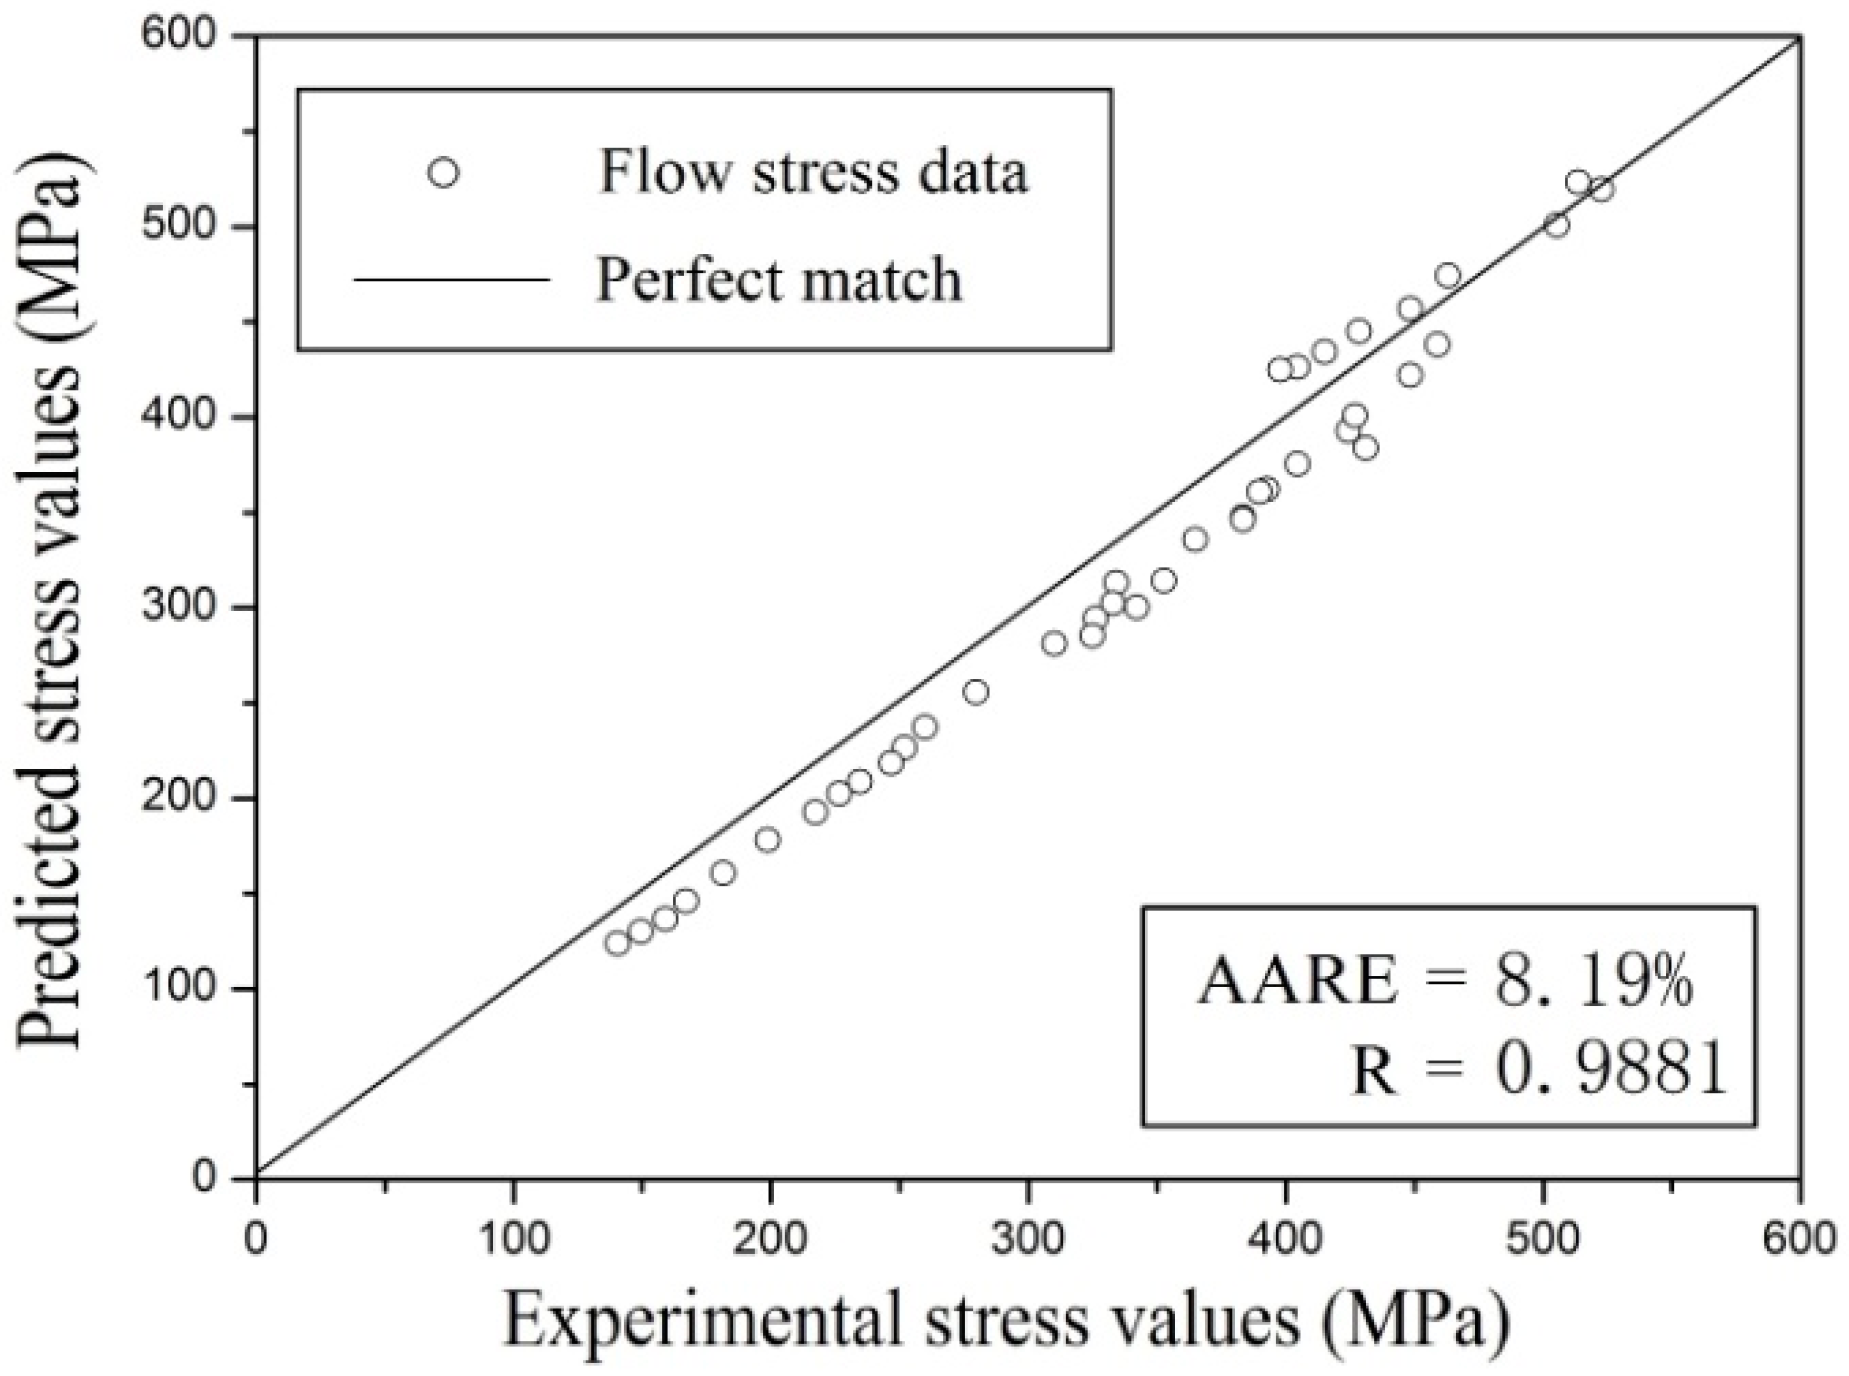
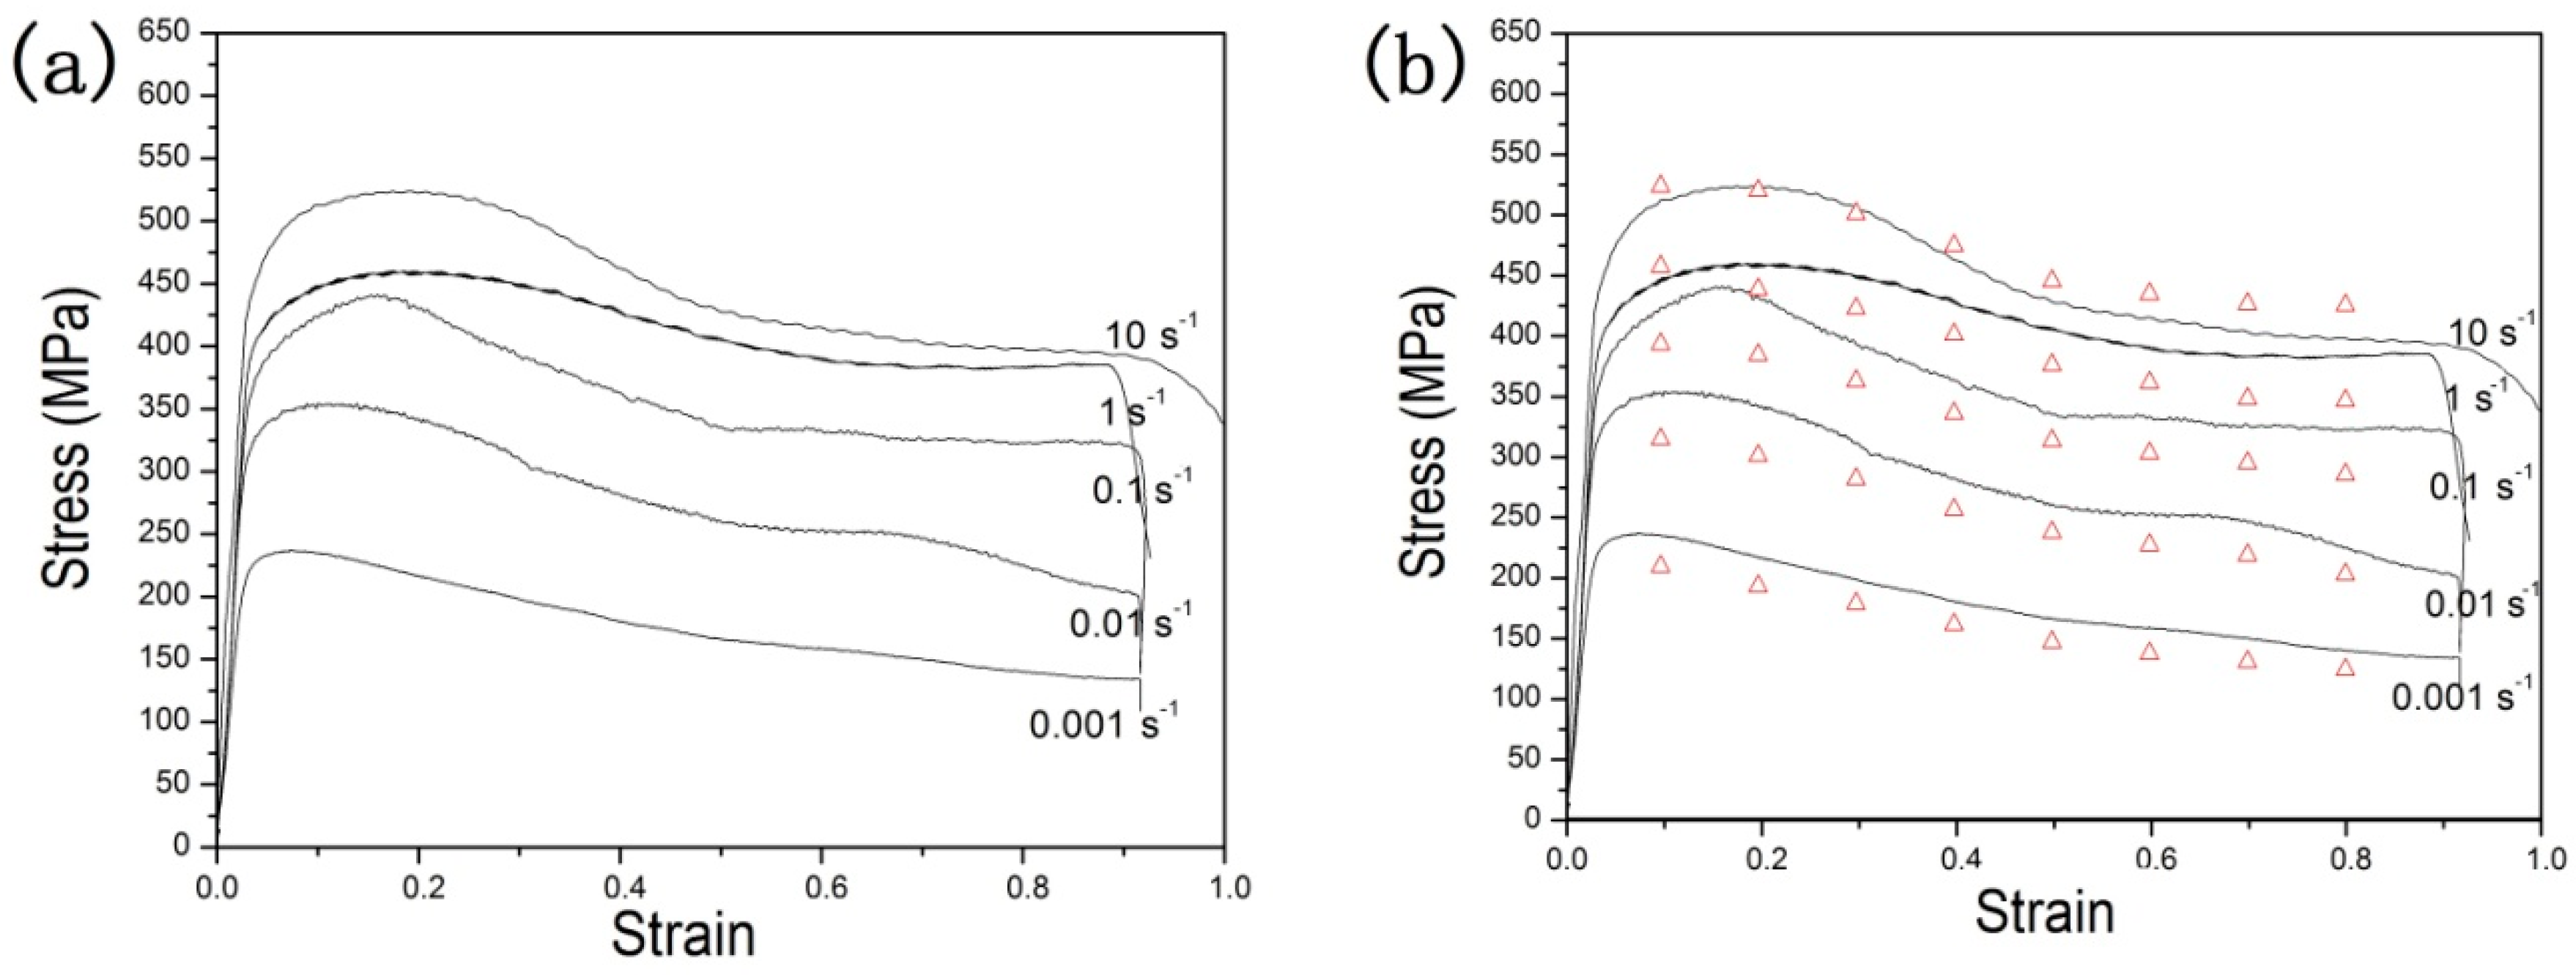
Therefore, to predict the constitutive model of TA15 titanium alloy, the constitutive model is further extended to predict flow stress at a temperature of 1023 K, which is not included in the previous compression tests. Experimental and predicted flow stresses at a temperature of 1023 K were compared, and results are shown in Figure 11. The same change trend in the stress-strain value is found in the experimental result, and prediction is good at a temperature of 1023 K, as shown in Figure 11b. Similarly, the quantization method with AARE and R, as mentioned above, was used to evaluate the prediction accuracy. The values of AARE and R are 8.19% and 0.9881, respectively, shown in Figure 12. This indicates that the proposed constitutive equation considering strain effect has good prediction accuracy for the extended data range for TA15 titanium alloy.
5. Conclusions
In this investigation, flow stress at various strain rates and deformation temperatures was predicted by establishing a strain-dependent constitutive equation model for TA15 titanium alloy. The following conclusions were drawn:
- (1)
- TA15 titanium alloy stress was sensitive to deformation temperature and strain rate; the value increased with increasing strain rate and decreased with increased deformation temperature. The experimental result curves exhibited the typical flow behavior, and a constitutive model was introduced based on the Arrhenius equation;
- (2)
- Material constants α, n, Q, and lnA were significantly influenced by the strain effect for TA15 titanium alloy, and the relationships between strain and material constants could be described using fifth-order polynomials with a good fitting correlation;
- (3)
- Flow stress at various conditions of deformation was accurately predicted through the constitutive equation incorporating strain compensation. R and AARE were used to quantify the predictability of the constitutive equation, with values of 6.85% and 0.9929, respectively. The values were 8.19% and 0.9881, respectively, in the prediction using the extended stress-strain data for 1023 K, which proved the high accuracy of the constitutive equation compensated by the strain effect for TA15 titanium alloy.
Author Contributions
J.L. proposed the conceptualization and wrote the manuscript; J.L. and F.L. designed and performed the models and methods of analysis; J.C. designed and performed the isothermal compression simulation tests and other experiments; J.L. and F.L. discussed and analysed the results of the experiments, and J.L. was in charge of the response of the review comments.
Funding
This research was funded by the National Natural Science Foundation of China with Grant No. 51605387 and No. 51275414, the Province Natural Science Foundation of Shaanxi with Grant No. 2015JM5204, the Fundamental Research Funds for the Central Universities with Grant No. 3102015BJ (II) ZS007.
Acknowledgments
The authors thank Xiyuan Yao for her valuable help with the microstructure experiments and part of the pictures processing for the result.
Conflicts of Interest
The authors declare no conflict of interest.
References
- Vo, P.; Jahazi, M.; Yue, S.; Bocher, P. Flow stress prediction during hot working of near-α titanium alloys. Mater. Sci. Eng. A 2007, 447, 99–110. [Google Scholar] [CrossRef]
- Wu, C.; Yang, H.; Li, H.W. Substructure and texture evolution and flow behavior of TA15 titanium alloy compressed in the α+β two-phase field. J. Mater. Process. Technol. 2013, 213, 2033–2041. [Google Scholar]
- Yang, Y.; Wu, S.Q.; Li, G.P.; Li, Y.L.; Lu, Y.F.; Yang, K.; Ge, P. Evolution of deformation mechanisms of Ti-22.4Nb-0.73Ta-2Zr-1.34O alloy during straining. Acta Mater. 2010, 58, 2778–2787. [Google Scholar] [CrossRef]
- Sun, Z.C.; Yang, H.; Tang, Z. Microstructural evolution model of TA15 titanium alloy based on BP neural network method and application in isothermal deformation. Comput. Mater. Sci. 2010, 50, 308–318. [Google Scholar] [CrossRef]
- Zhao, A.M.; Yang, H.; Fan, X.G.; Gao, P.F.; Zuo, R.; Meng, M. The flow behavior and microstructure evolution during (σ+β) deformation of β wrought TA15 titanium alloy. Mater. Des. 2016, 109, 112–122. [Google Scholar] [CrossRef]
- Gao, P.F.; Zhan, M.; Fan, X.G.; Lei, Z.N.; Cai, Y. Hot deformation bahavior and microstructure evolution of TA15 titanium alloy with nonuniform microstructure. Mater. Sci. Eng. A 2017, 689, 243–251. [Google Scholar] [CrossRef]
- Gao, P.F.; Yang, H.; Fan, X.G.; Yan, S.L. Microstructural features of TA15 titanium alloy under different temperature routes in isothermal local forming. Mater. Sci. Eng. A 2012, 540, 245–252. [Google Scholar] [CrossRef]
- Fan, X.G.; Yang, H.; Sun, Z.C.; Zhang, D.W. Effect of deformation inhomogeneity on the microstructure and mechanical properties of large-scale rib-web component of titanium alloy under local loading forming. Mater. Sci. Eng. A 2010, 527, 5391–5399. [Google Scholar] [CrossRef]
- Sun, Q.J.; Wang, G.C. Microstructure and superplasticity of TA15 alloy. Mater. Sci. Eng. A 2014, 606, 401–408. [Google Scholar] [CrossRef]
- Ma, B.L.; Wu, X.D.; Li, X.J.; Wan, M.; Cai, Z.Y. Investigation on the hot formability of TA15 titanium alloy sheet. Mater. Des. 2016, 94, 9–16. [Google Scholar] [CrossRef]
- Zhu, S.; Yang, H.; Guo, L.G.; Fan, X.G. Effect of cooling rate on microstructure evolution during α/β heat treatment of TA15 titanium alloy. Mater. Charact. 2012, 70, 101–110. [Google Scholar] [CrossRef]
- Wu, C.B.; Yang, H.; Fan, X.G.; Sun, Z.C. Dynamic globularization kinetics during hot working of TA15 titanium alloy with colony microstructure. Trans. Nonferrous Meter. Soc. China 2011, 21, 1963–1969. [Google Scholar] [CrossRef]
- Sun, Z.C.; Wang, X.Q.; Zhang, J.; Yang, H. Prediction and control of equiaxed α in near-β forging of TA15 Ti-alloy based on BP neural network: For purpose of tri-modal microstructure. Mater. Sci. Eng. A 2014, 591, 18–25. [Google Scholar] [CrossRef]
- Rezaei Ashtiani, H.R.; Shahsavari, P. Strain-dependent constitutive equation to predict high temperature flow behavior of AA2030 aluminum alloy. Mech. Mater. 2016, 100, 209–218. [Google Scholar] [CrossRef]
- Cai, J.; Li, F.G.; Liu, T.Y.; Chen, B.; He, M. Constitutive equations for elevated temperature flow stress of Ti-6Al-4V alloy considering the effect of strain. Mater. Des. 2011, 32, 1144–1151. [Google Scholar] [CrossRef]
- Zeng, Z.P.; Jonsson, S.; Zhang, Y.S. Constitutive equations for pure titanium at elevated temperatures. Mater. Sci. Eng. A 2009, 505, 116–119. [Google Scholar] [CrossRef]
- Ren, F.C.; Chen, J. Modeling flow stress of 70Cr3Mo steel used for back-up roll during hot deformation considering strain compensation. J. Iron Steel Res. 2013, 20, 118–124. [Google Scholar] [CrossRef]
- Ji, G.L.; Li, F.G.; Li, Q.H.; Li, Z. A comparative study on Arrhenius-type constitutive model and artificial neural network model to predict high-temperature deformation behaviour in Aermet100 steel. Mater. Sci. Eng. A 2011, 528, 4774–4782. [Google Scholar] [CrossRef]
- Zhang, J.Q.; Di, H.S.; Wang, X.Y.; Zhang, J.C.; Ma, T.J. Constitutive analysis of the hot deformation behavior of Fe-23Mn-2Al-0.2C twinning induced plasticity steel inconsideration of strain. Mater. Des. 2013, 44, 354–364. [Google Scholar] [CrossRef]
- Woll, D.W.; Davidson, M.J.; Khanra, A.K. Constitutive modeling of powder metallurgy processed Al-4%Cu preforms during compression at elevated temperaure. Mater. Des. 2015, 65, 83–93. [Google Scholar] [CrossRef]
- Li, J.; Li, F.G.; Cai, J.; Wang, R.T.; Yuan, Z.W.; Xue, F.M. Flow behavior modeling of the 7050 aluminum alloy at elevated temperatures considering the compensation of strain. Mater. Des. 2012, 42, 369–377. [Google Scholar] [CrossRef]
- Cai, Z.W.; Chen, F.X.; Guo, J.Q. Constitutive model for elevated temperature flow stress of AZ41M magnesium alloy considering the compensation of strain. J. Alloys Compd. 2015, 648, 215–222. [Google Scholar] [CrossRef]
- Yang, L.; Wang, B.Y.; Liu, G.; Zhao, H.J.; Xiao, W.C. Behavior and modeling of flow softening and ductile damage evolution in hot deformation of TA15 alloy sheets. Mater. Des. 2015, 85, 135–148. [Google Scholar] [CrossRef]
- Samantaray, D.; Mandal, S.; Bhaduri, A.K. A comparative study on Johnson Cook, modified Zerilli-Armstrong and Arrhenius-type constitutive models to predict elevated temperature flow behaviour in modified 9Cr-1Mo steel. Comput. Mater. Sci. 2009, 47, 568–576. [Google Scholar] [CrossRef]
- Lin, Y.C.; Xia, Y.C.; Chen, X.M.; Chen, M.S. Constitutive descriptions for hot compressed 2124-T851 aluminum alloy over a wide range of temperature and strain rate. Comput. Mater. Sci. 2010, 50, 227–233. [Google Scholar] [CrossRef]
- Haghdadi, N.; Zarei-Hanzaki, A.; Abedi, H.R. The flow behavior modeling of cast A356 aluminum alloy at elevated temperatures considering the effect of strain. Mater. Sci. Eng. A 2012, 535, 252–257. [Google Scholar] [CrossRef]
- Zhang, R.; Wang, D.J.; Huang, L.J.; Yuan, S.J.; Geng, L. Deformation behaviors and microstructure evolution of TiBw/TA15 composite with novel network architecture. J. Alloys Compd. 2017, 722, 970–980. [Google Scholar] [CrossRef]
- Luo, Y.; Heng, Y.; Wang, Y.; Yan, X. Dynamic recrystallization behavior of TA15 titanium alloy under isothermal compression during hot deformation. Adv. Mater. Sci. Eng. 2014, 2014, 1–9. [Google Scholar] [CrossRef]
- Briottet, L.; Jones, J.J.; Montheillet, F. A mechanical interpretation of the activation energy of high temperature deformation in two phase materials. Acta Mater. 1996, 44, 1665–1672. [Google Scholar] [CrossRef]
- Zhang, M.J.; Li, F.G.; Wang, S.Y.; Liu, C.Y. Effect of powder preparation technology on the hot deformation behavior of HIPed P/M nickel-base superalloy FGH96. Mater. Sci. Eng. A 2011, 528, 4030–4039. [Google Scholar] [CrossRef]
- Mandal, S.; Rakesh, V.; Sivaprasad, P.V.; Venugopal, S.; Kasiviswanathan, K.V. Constitutive equations to predict high temperature flow stress in a Ti-modified austenitic stainless steel. Mater. Sci. Eng. A 2009, 500, 114–121. [Google Scholar] [CrossRef]
- Liao, C.H.; Wu, H.Y.; Lee, S.H.; Zhu, F.J.; Liu, H.C.; Wu, C.T. Strain-dependent constitutive analysis of extruded AZ61 Mg alloy under hot compression. Mater. Sci. Eng. A 2013, 565, 1–8. [Google Scholar] [CrossRef]
- Ji, G.L.; Li, F.G.; Li, Q.H.; Li, H.Q.; Li, Z. Prediction of the hot deformation behavior for Aermet100 steel using an artificial neural network. Comput. Mater. Sci. 2010, 48, 626–632. [Google Scholar] [CrossRef]
- Mosleh, A.; Mikhaylovskaya, A.; Kotov, A.; Pourcelot, T.; Aksenov, S.; Kwame, J.; Portnoy, V. Modelling of the superplastic deformation of the near-α titanium alloy (Ti-2.5Al-1.8Mn) using Arrhenius-type constitutive model and artificial neural network. Metals 2017, 7, 568. [Google Scholar] [CrossRef]
Figure 1.
Initial microstructure of the specimens of TA15 titanium alloy.
Figure 2.
The appearance of the specimen: (a) before deformation and (b) after deformation.

Figure 3.
True stress versus true strain curves of TA15 titanium alloy obtained by isothermal hot compression tests at temperatures of: (a) 1073 K, (b) 1123 K, (c) 1173 K, and (d) 1223 K.
Figure 3.
True stress versus true strain curves of TA15 titanium alloy obtained by isothermal hot compression tests at temperatures of: (a) 1073 K, (b) 1123 K, (c) 1173 K, and (d) 1223 K.
Figure 4.
Microstructure of TA15 titanium alloy specimens compressed to strain 0.9 at 1223 K at different strain rates: (a) 0.001 s−1, (b) 0.01 s−1, (c) 0.1 s−1, (d) 1 s−1, and (e) 10 s−1.
Figure 4.
Microstructure of TA15 titanium alloy specimens compressed to strain 0.9 at 1223 K at different strain rates: (a) 0.001 s−1, (b) 0.01 s−1, (c) 0.1 s−1, (d) 1 s−1, and (e) 10 s−1.
Figure 5.
Evaluating the value of (a) n’ by plotting lnσ versus lnέ and (b) β by plotting σ versus lnέ.
Figure 5.
Evaluating the value of (a) n’ by plotting lnσ versus lnέ and (b) β by plotting σ versus lnέ.
Figure 6.
Evaluating the value of n by plotting ln[sinh(ασ)] versus lnέ.
Figure 7.
Evaluating the value of activation energy by plotting ln[sinh(ασ)] versus 1000/T.
Figure 8.
The variation with strain of the material constants: (a) α, (b) n, (c) Q, and (d) lnA.
Figure 9.
Comparison between the experimental and predicted flow stress at the temperature: (a) 1073 K, (b) 1123 K, (c) 1173 K, and (d) 1223 K.
Figure 9.
Comparison between the experimental and predicted flow stress at the temperature: (a) 1073 K, (b) 1123 K, (c) 1173 K, and (d) 1223 K.
Figure 10.
The correlation between predicted data and experimental data over the entire range of strain, strain rate, and temperature.
Figure 10.
The correlation between predicted data and experimental data over the entire range of strain, strain rate, and temperature.
Figure 11.
The comparison between the prediction and experimental results at temperature of 1023 K: (a) experimental results and (b) prediction results of different strain rates.
Figure 11.
The comparison between the prediction and experimental results at temperature of 1023 K: (a) experimental results and (b) prediction results of different strain rates.
Figure 12.
The correlation between predicted and experimental results at temperature of 1023 K.

Table 1.
Polynomial fitting results of material constants (α, n, Q, and lnA).
| α Coefficient | n Coefficient | Q Coefficient | lnA Coefficient |
|---|---|---|---|
| C0 = 0.00684 | D0 = 4.29525 | E0 = 567.4279 | F0 = 55.57609 |
| C1 = 0.00248 | D1 = −3.41358 | E1 = 742.9928 | F1 = 74.06573 |
| C2 = 0.00883 | D2 = −4.96388 | E2 = −5372.16 | F2 = −541.173 |
| C3 = −0.01072 | D3 = 29.91754 | E3 = 12837.02 | F3 = 1300.602 |
| C4 = −0.00216 | D4 = −35.6602 | E4 = −13555.2 | F4 = −1381.13 |
| C5 = 0.00544 | D5 = 13.30015 | E5 = 5382.073 | F5 = 551.388 |
© 2018 by the authors. Licensee MDPI, Basel, Switzerland. This article is an open access article distributed under the terms and conditions of the Creative Commons Attribution (CC BY) license (http://creativecommons.org/licenses/by/4.0/).
Share and Cite
MDPI and ACS Style
Li, J.; Li, F.; Cai, J. Constitutive Model Prediction and Flow Behavior Considering Strain Response in the Thermal Processing for the TA15 Titanium Alloy. Materials 2018, 11, 1985. https://doi.org/10.3390/ma11101985
AMA Style
Li J, Li F, Cai J. Constitutive Model Prediction and Flow Behavior Considering Strain Response in the Thermal Processing for the TA15 Titanium Alloy. Materials. 2018; 11(10):1985. https://doi.org/10.3390/ma11101985
Chicago/Turabian StyleLi, Jiang, Fuguo Li, and Jun Cai. 2018. "Constitutive Model Prediction and Flow Behavior Considering Strain Response in the Thermal Processing for the TA15 Titanium Alloy" Materials 11, no. 10: 1985. https://doi.org/10.3390/ma11101985
Note that from the first issue of 2016, this journal uses article numbers instead of page numbers. See further details here.