3.1. Magnetoresistance Measurements
Magneto-resistive measurements of the bridge-type structures showed that the films Fe
50Mn
50/Fe/Mo/R-sapphire exhibit an exchange bias along the Fe [010] crystallographic direction, while Fe/Fe
50Mn
50/Mo/R-sapphire films do not. The dependence of the bridge resistance against applied in-plane magnetic field is shown in
Figure 1.
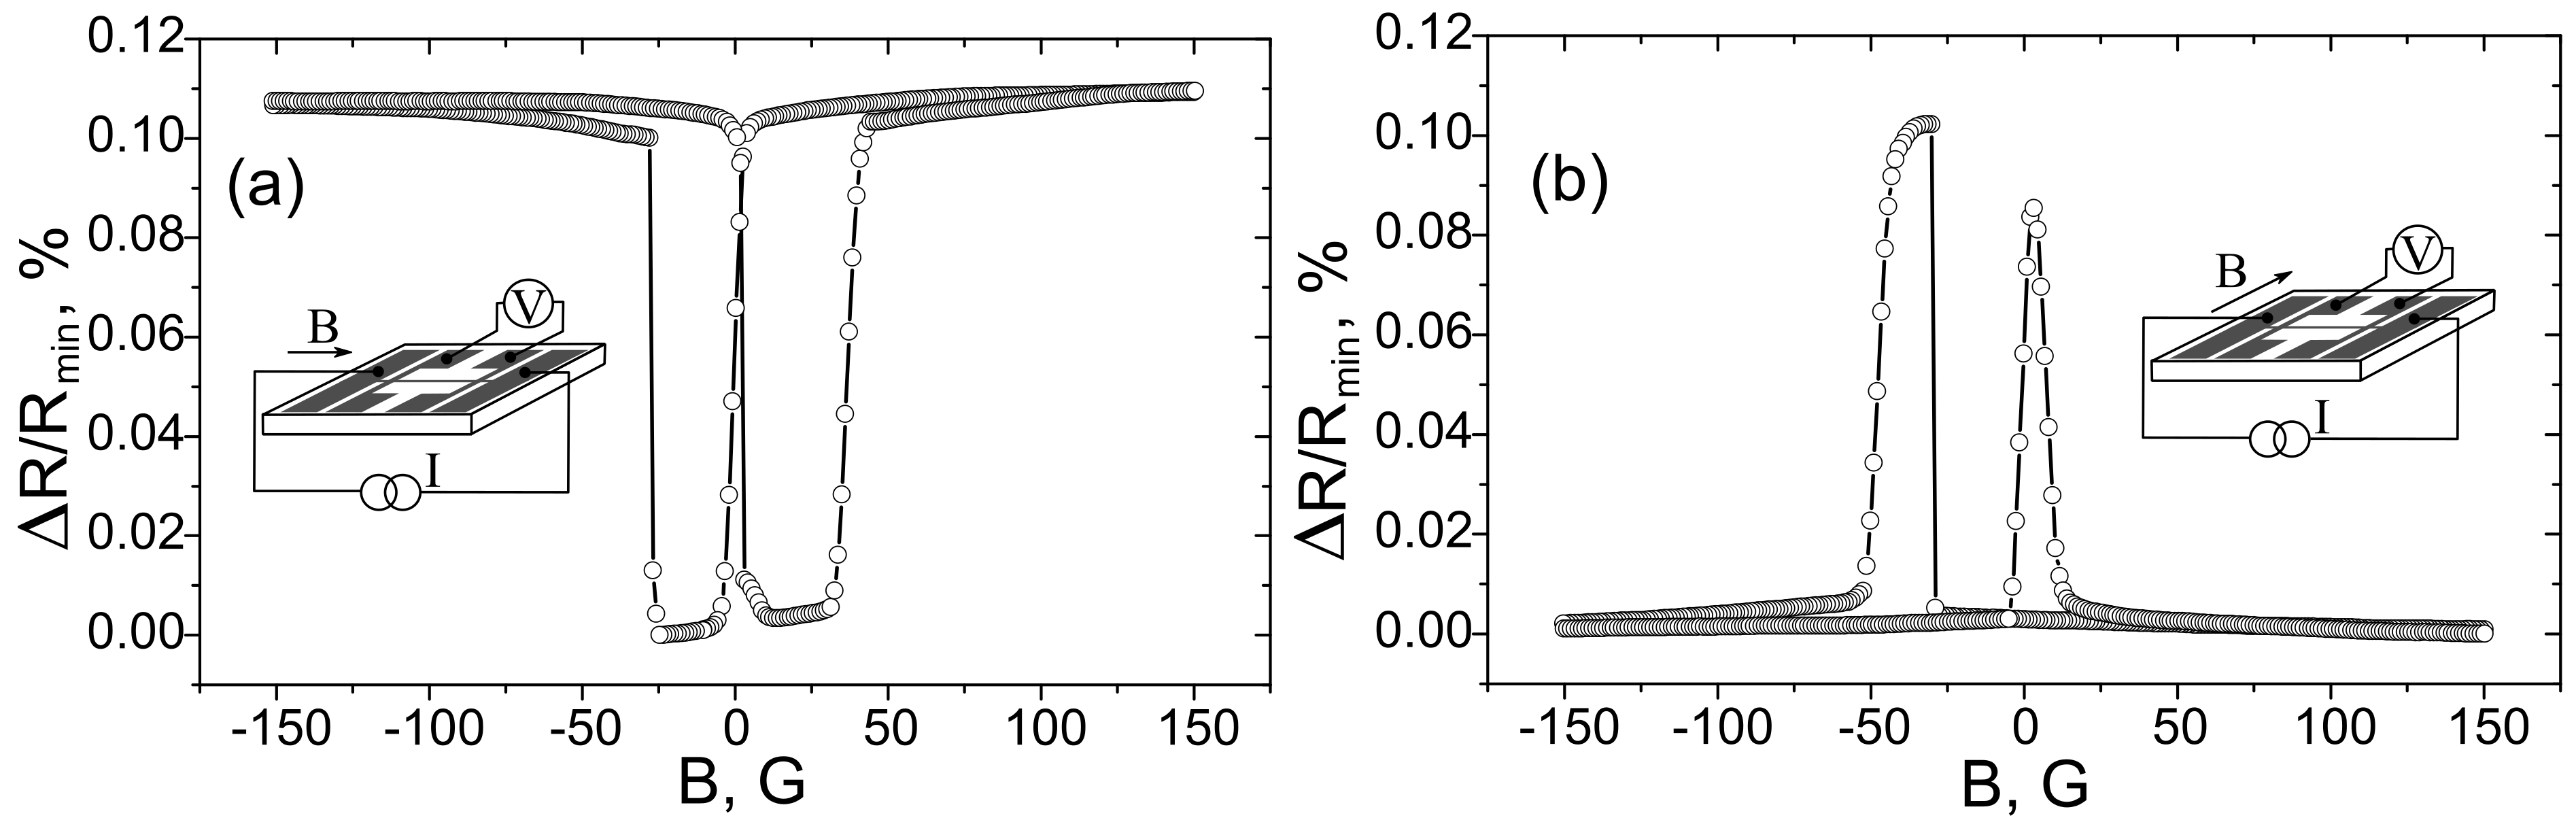
Figure 1a presents the curve of the longitudinal magnetoresistance (magnetic field along the bridge). This may be explained by an anisotropic magnetoresistance effect for the magnetic field applied parallel to the current. The curve is symmetric with respect to B = 0. The curve of transverse magnetoresistance (magnetic field perpendicular to the bridge) is presented in
Figure 1b, demonstrating two peaks typical of an anisotropic magnetoresistance effect for a magnetic field perpendicular to the current. It can clearly be seen that the peak positions are displaced against B = 0 by 25 G to the left, manifesting an exchange bias.
Magnetoresistance curves could slightly vary from sample to sample; however, all experiments showed the appearance of an exchange bias along the direction of the magnetic field applied during sample annealing.
Thus, the magneto-resistive measurements showed that an exchange bias is observed in Fe
50Mn
50/Fe/Mo/R-sapphire bridge structures if the external magnetic field is along the Fe [010] crystallographic axis, coinciding with the direction of the magnetic field applied during sample annealing, but is not observed if the magnetic field is along the Fe [100] axis. Note that, if magnetic field applied during sample annealing was along the Fe [100] axis, the exchange bias was observed for longitudinal magnetoresistance but not for the transverse one. This indicates that the appearance of unidirectional anisotropy is due to the effect of the magnetic field applied during sample annealing. This is in agreement with [
2], which models the uncompensated inner surface of the antiferromagnetic layer adjoining the ferromagnetic layer.
3.2. MFM-Experiments
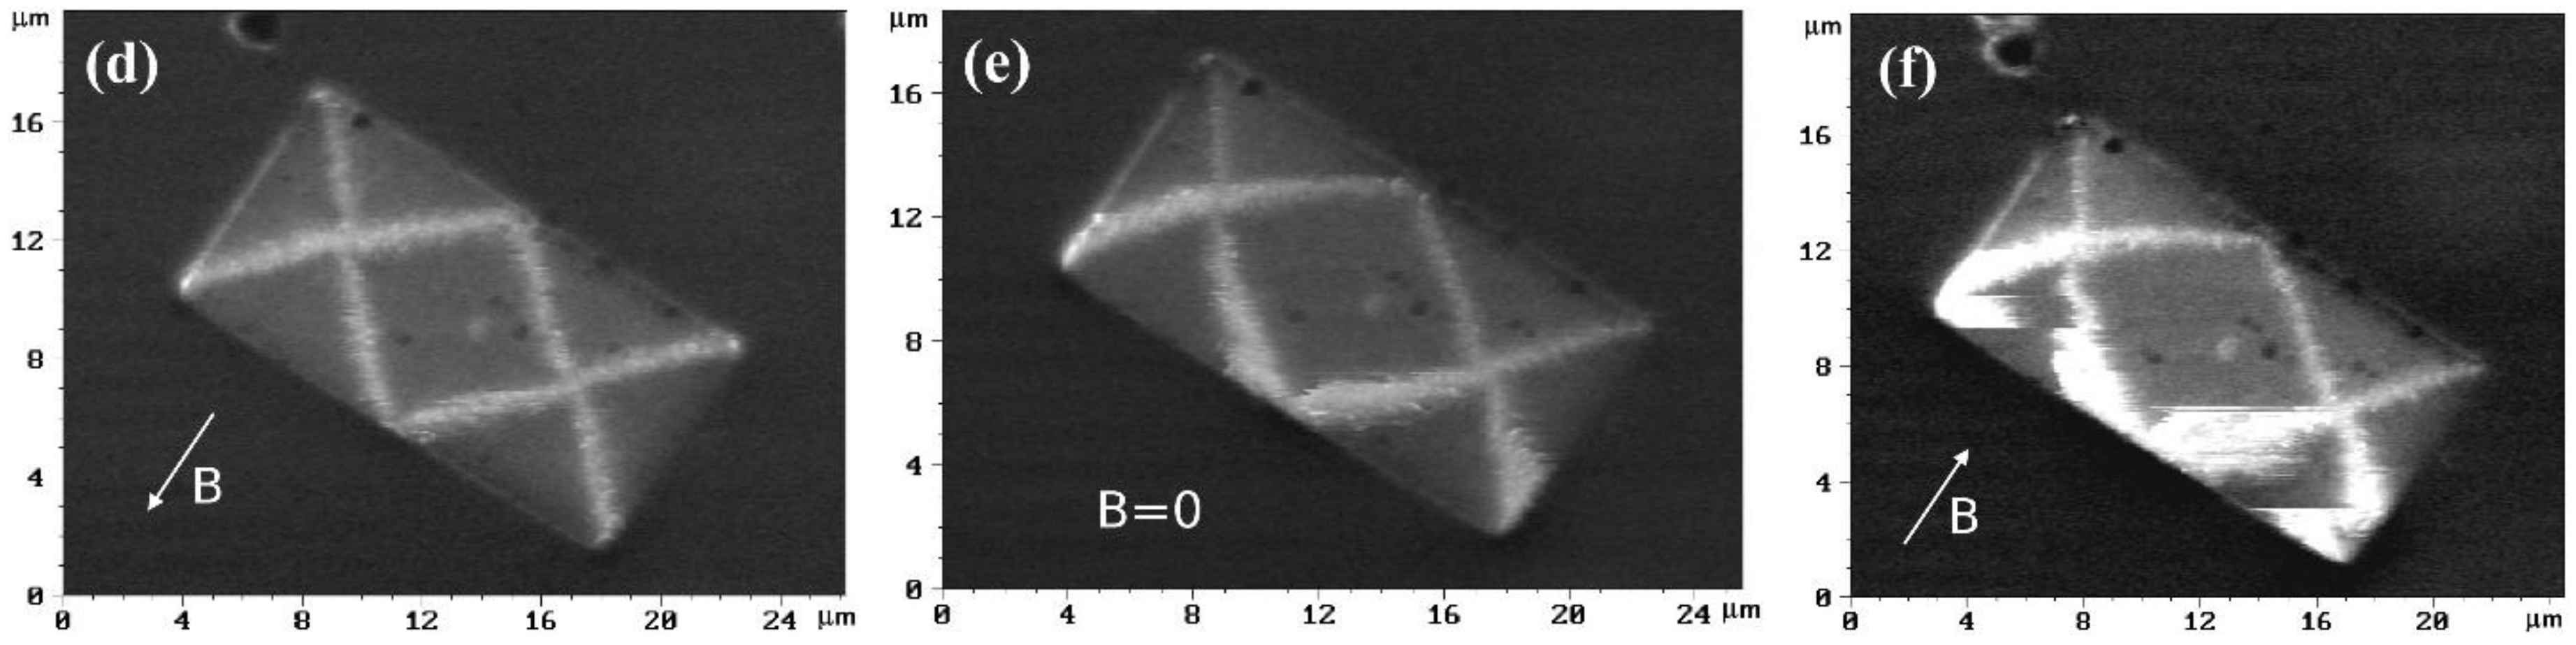
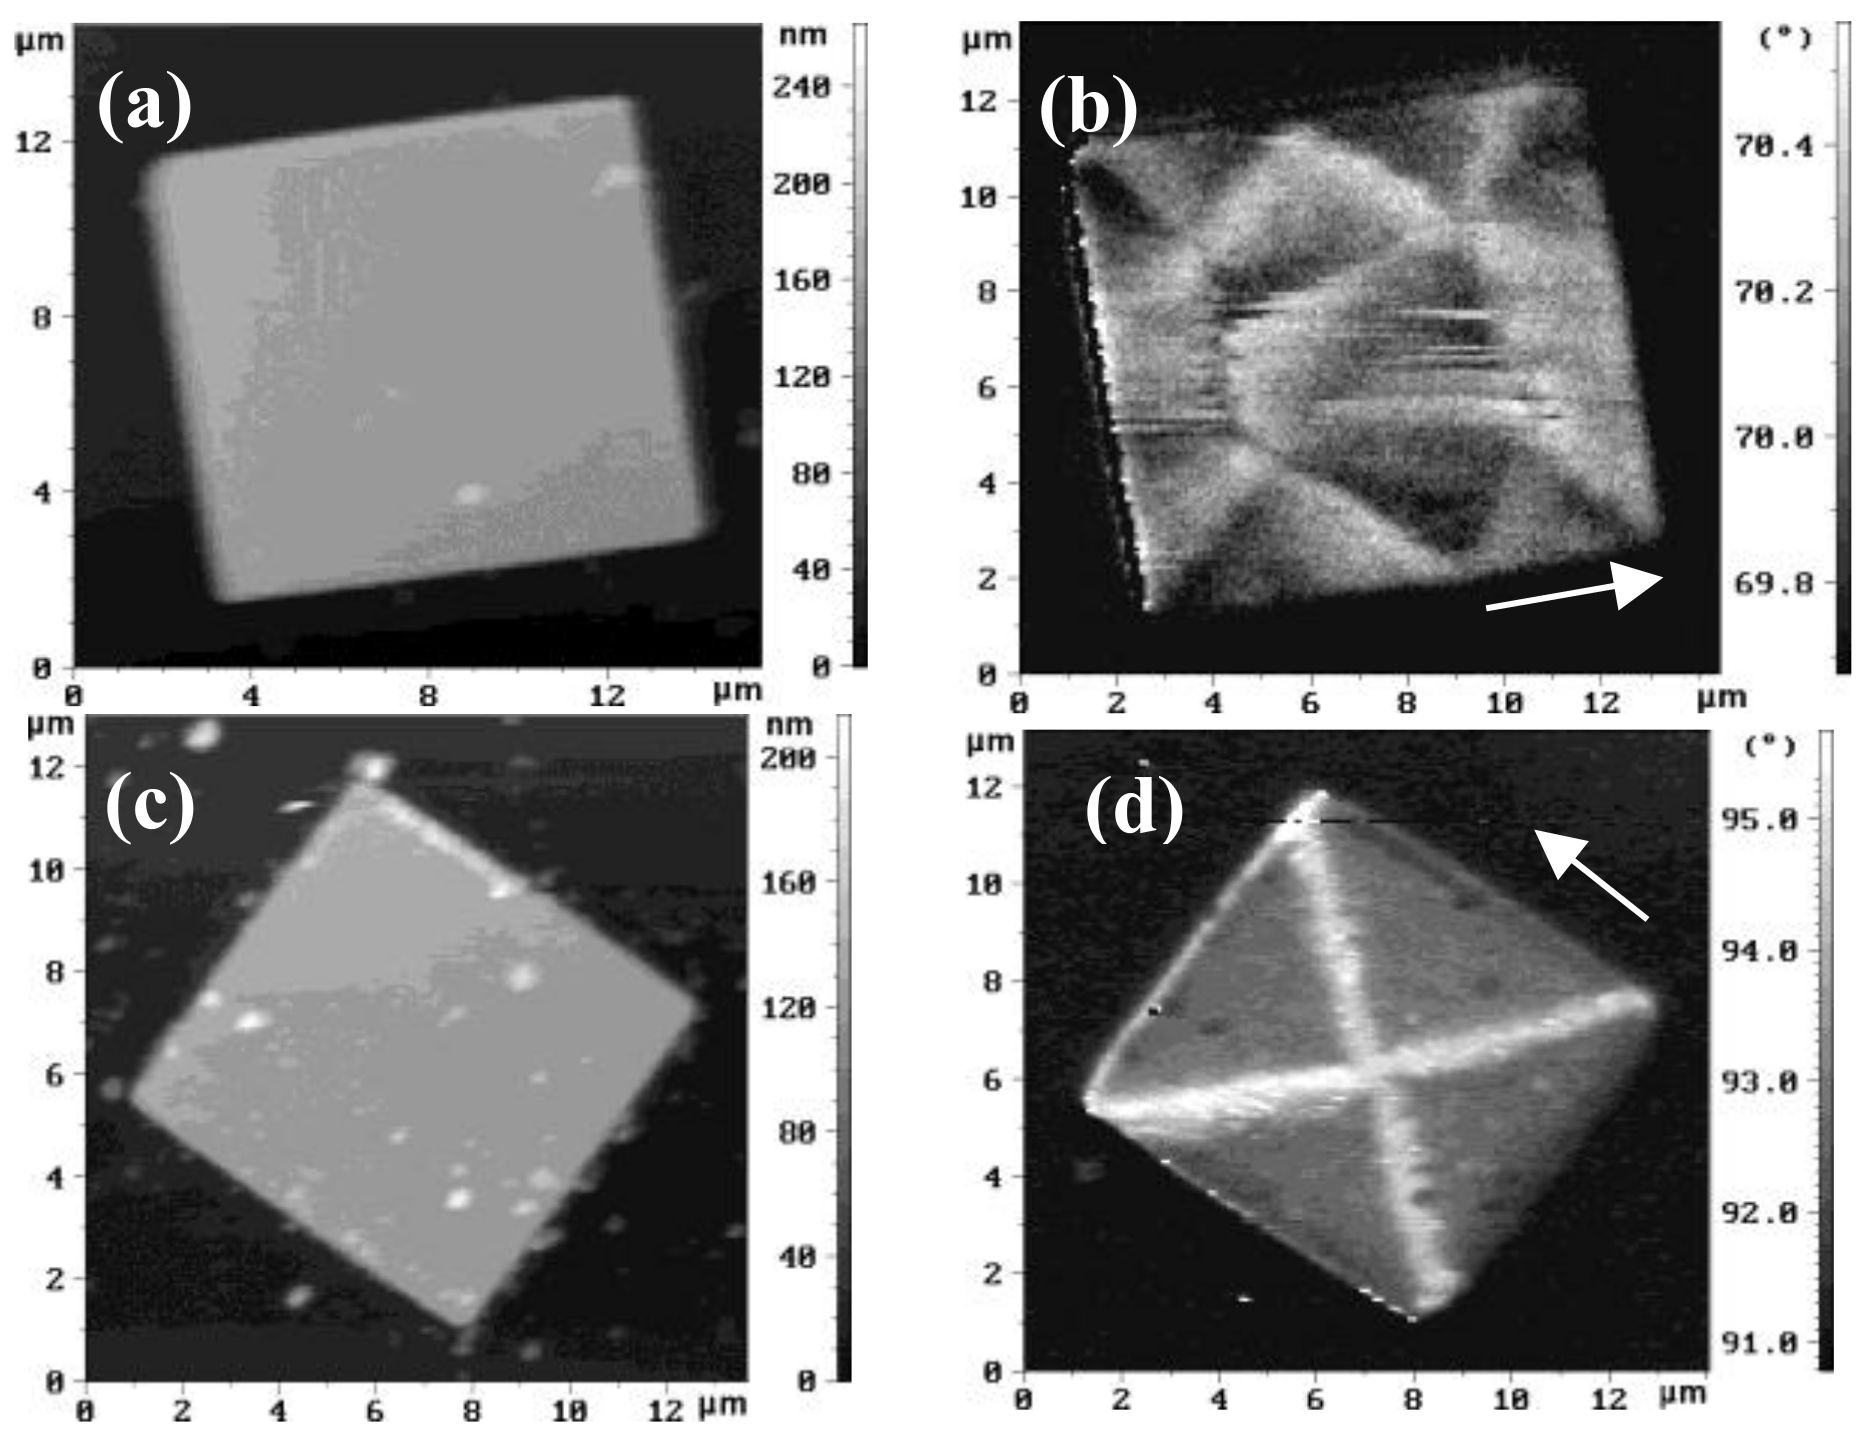
MFM measurements revealed that, in the case where the FeMn layer was grown on the top of the Fe layer, the square microstructures had a regular magnetic state (
Figure 2d). When the FeMn film was at the bottom, the magnetic structure was less regular (
Figure 2b). The latter can be explained by the lower epitaxial quality of the samples due to the large mismatch between the crystal lattices of the Fe and FeMn layers. The iron layers are steadily grown on the epitaxial sublayer of molybdenum by cube-on-cube with a lattice mismatch of less than 10% (9.7%); the Fe
50Mn
50 layer on Fe(001) layer grows at a crystal rotation of 45° and a lattice mismatch of 11.8%. Epitaxial growth of the Fe
50Mn
50 layer on the Mo(001) sublayer breaks, however, because of the larger lattice mismatch of 13.2%.
The observed domain structures in the MFM for both cases were very different from each other. For Fe/Fe
50Mn
50/Mo/R-sapphire structures, the domains were located as if there were one axis of easy magnetization in the film plane perpendicular to the direction used during sample annealing in magnetic field (
Figure 2b). Actually, this can be observed [
3], if a FM/AFM interface is compensated. For Fe
50Mn
50/Fe/Mo/R-sapphire square structures, their magnetic state is quite different (
Figure 2d). It consists of four triangle domains separated by ninety-degree domain walls. This is because there are two in-plane easy axes of magnetization, the same as in epitaxial iron films without a Fe
50Mn
50 layer on their top. This defines the kind of magnetic state that is realized. However, the investigated domain structure is slightly distorted in comparison with those of the epitaxial monolayered Fe(001) square microstructures [
11,
13] because of the presence of the exchange field at the Fe
50Mn
50/Fe interface. For comparison, topographical images of square mictrostructures are shown in
Figure 2a,c. Additionally, some topographical features can be observed in MFM-images (
Figure 2b,d) they obviously possess an entirely different nature from the measured magnetic contrasts of the magnetic states.
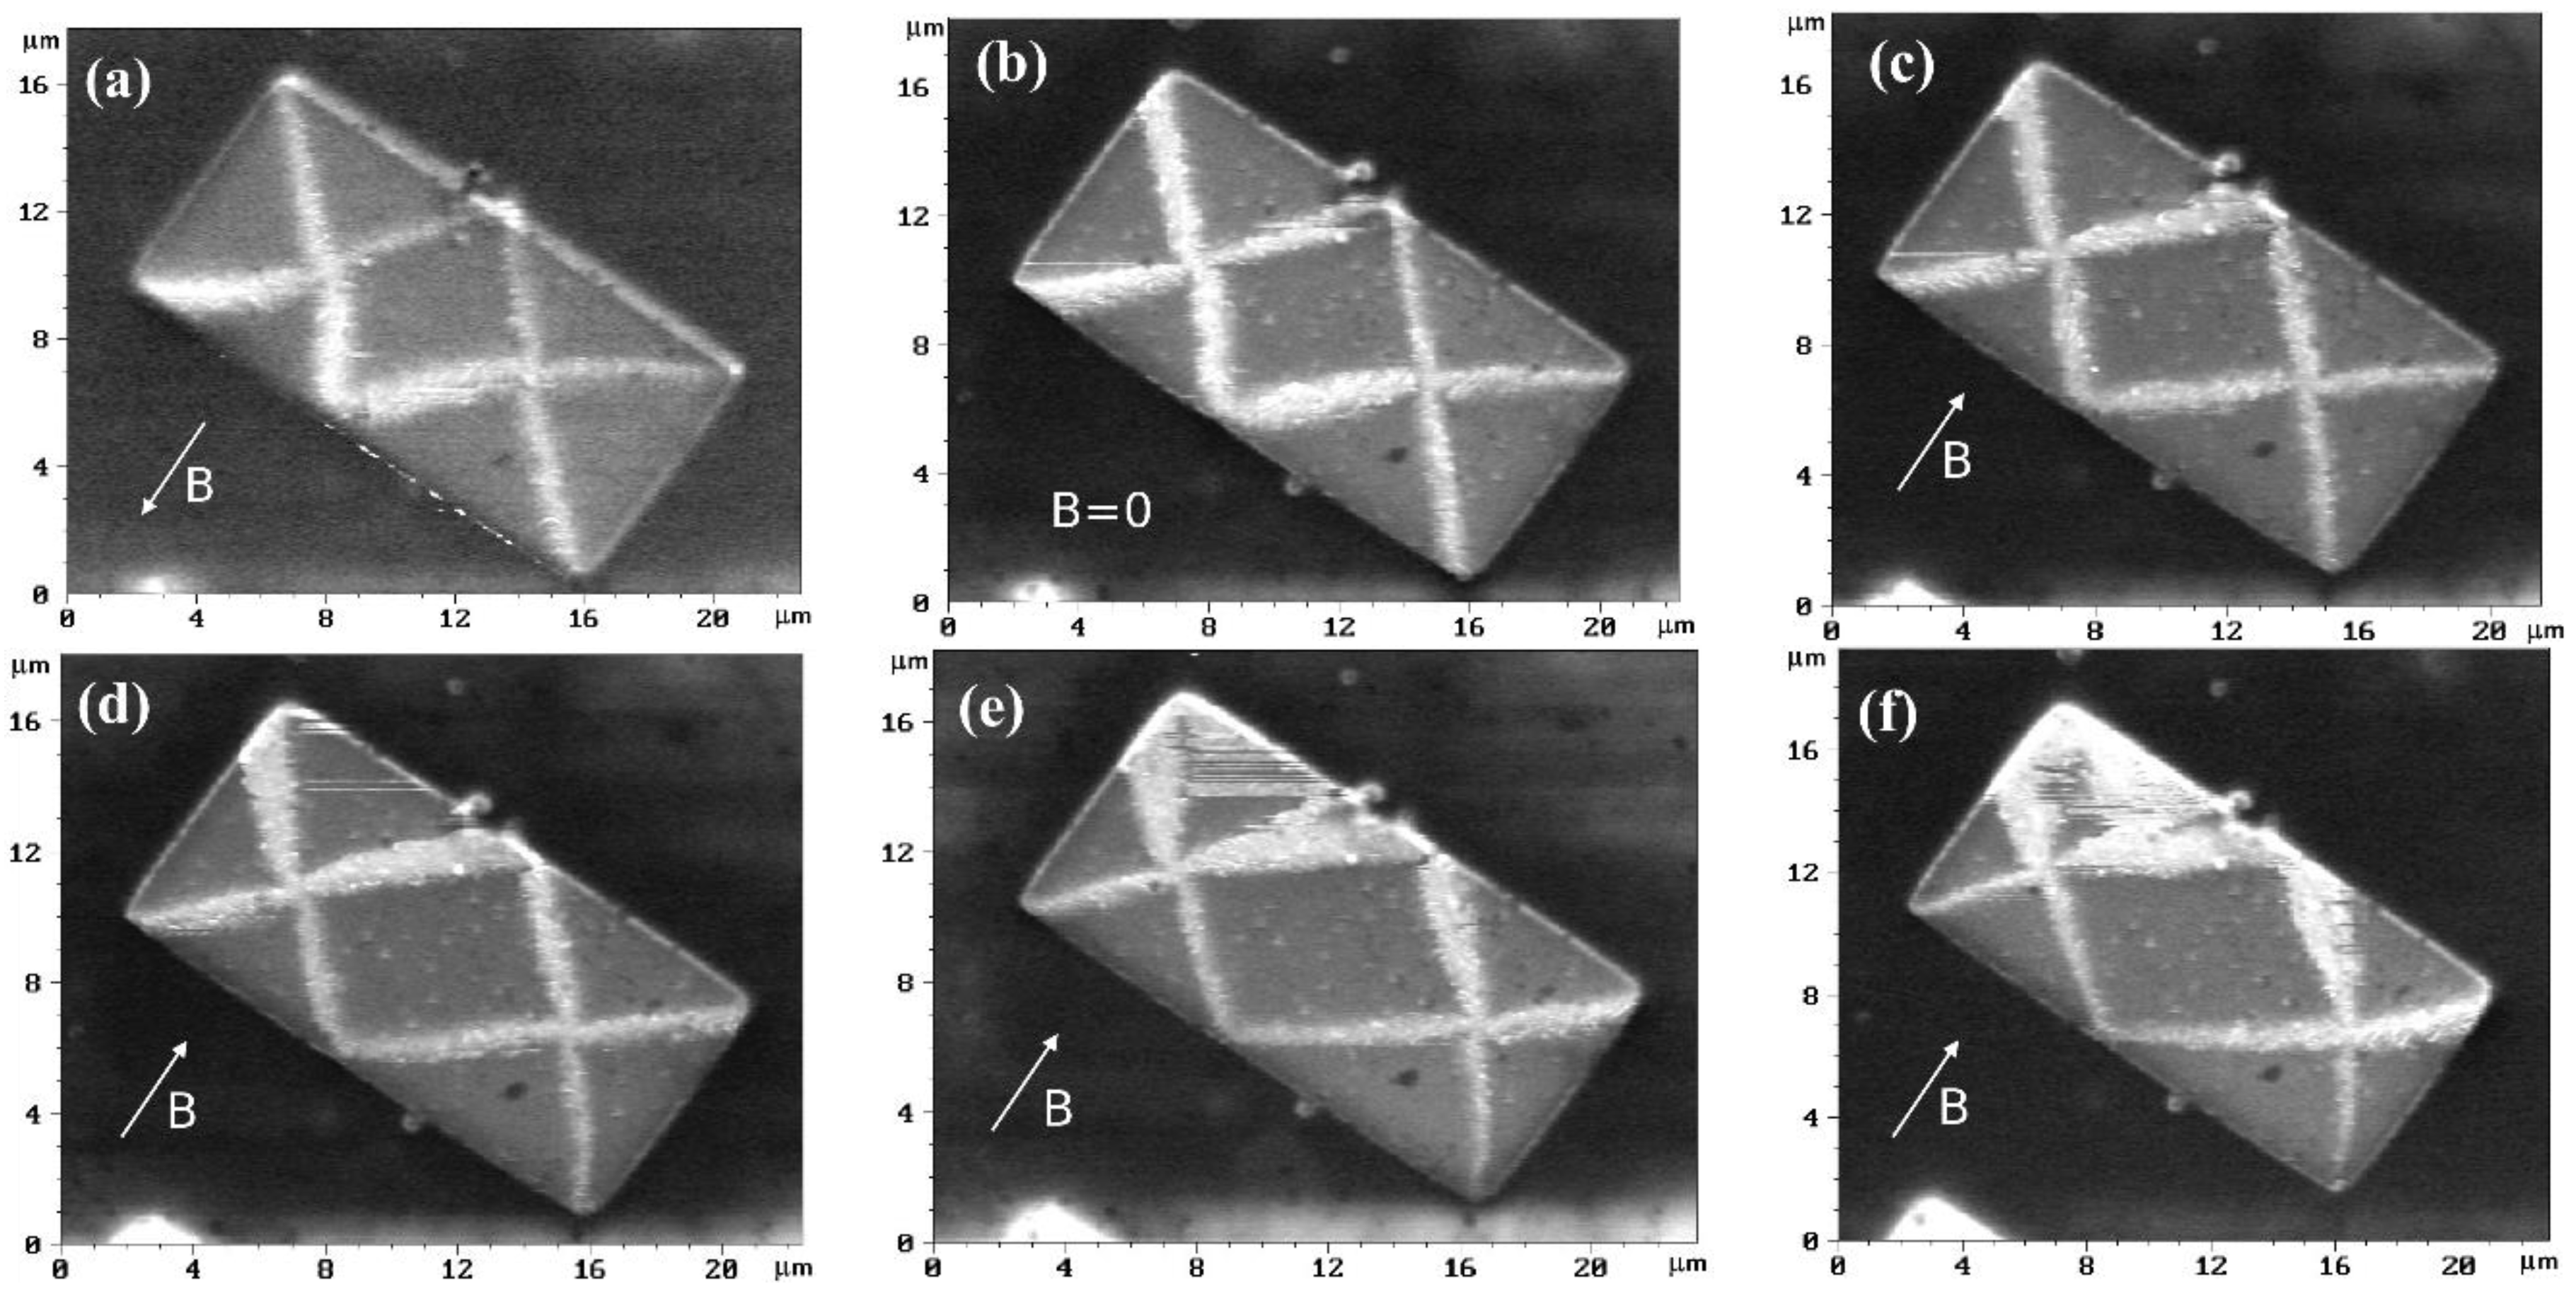
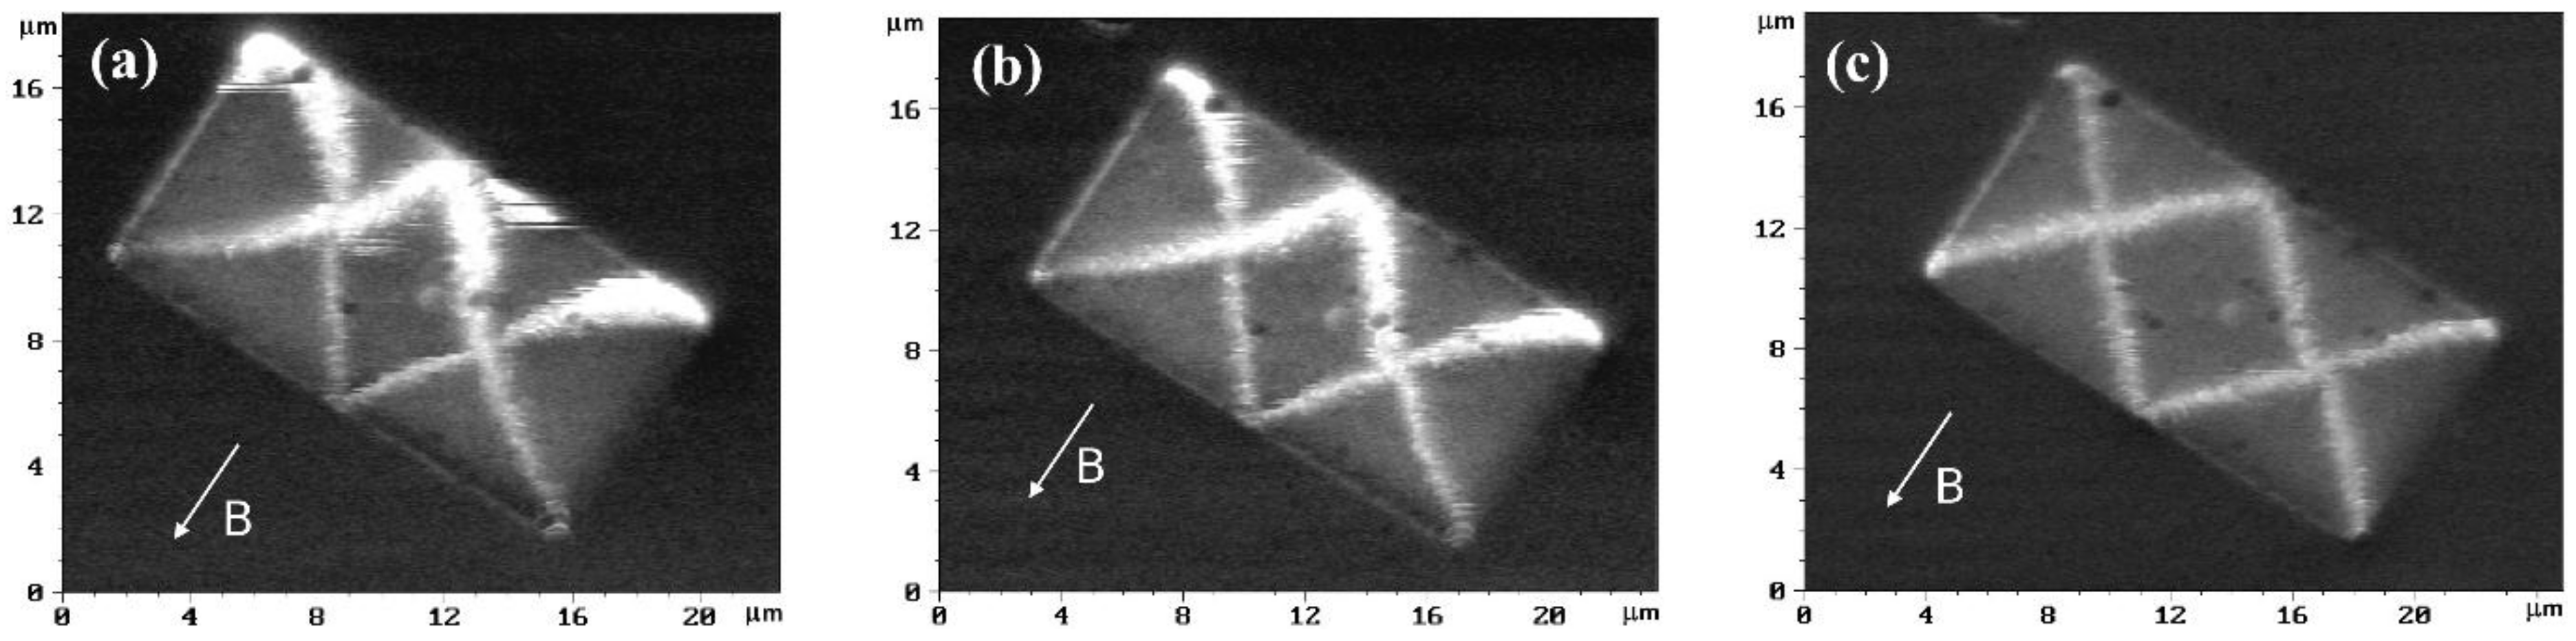
MFM experiments in the presence of an external magnetic field allowed measuring this built-in field without application of electric contacts. It is more convenient to use rectangular Fe
50Mn
50/Fe/Mo/R-sapphire microstructures in these experiments. MFM images of them in an external magnetic field, oriented along the short side of the rectangle are shown in
Figure 3 and
Figure 4. The built-in exchange field in the magnetic field, which originated during the annealing procedure, was directed in turn along the short and long sides of the rectangle.
It is known that the magnetic state of a rectangular microstructure of Fe(001) with an aspect ratio 1:2 is of “diamond” type [
13]. At zero magnetic field, the area of the central domain is equal to 1/4 of the area of the whole rectangle. If there is a built-in exchange field directed along the magnetization of the central domain, the central domain will be widened. This broadening is most clearly seen in
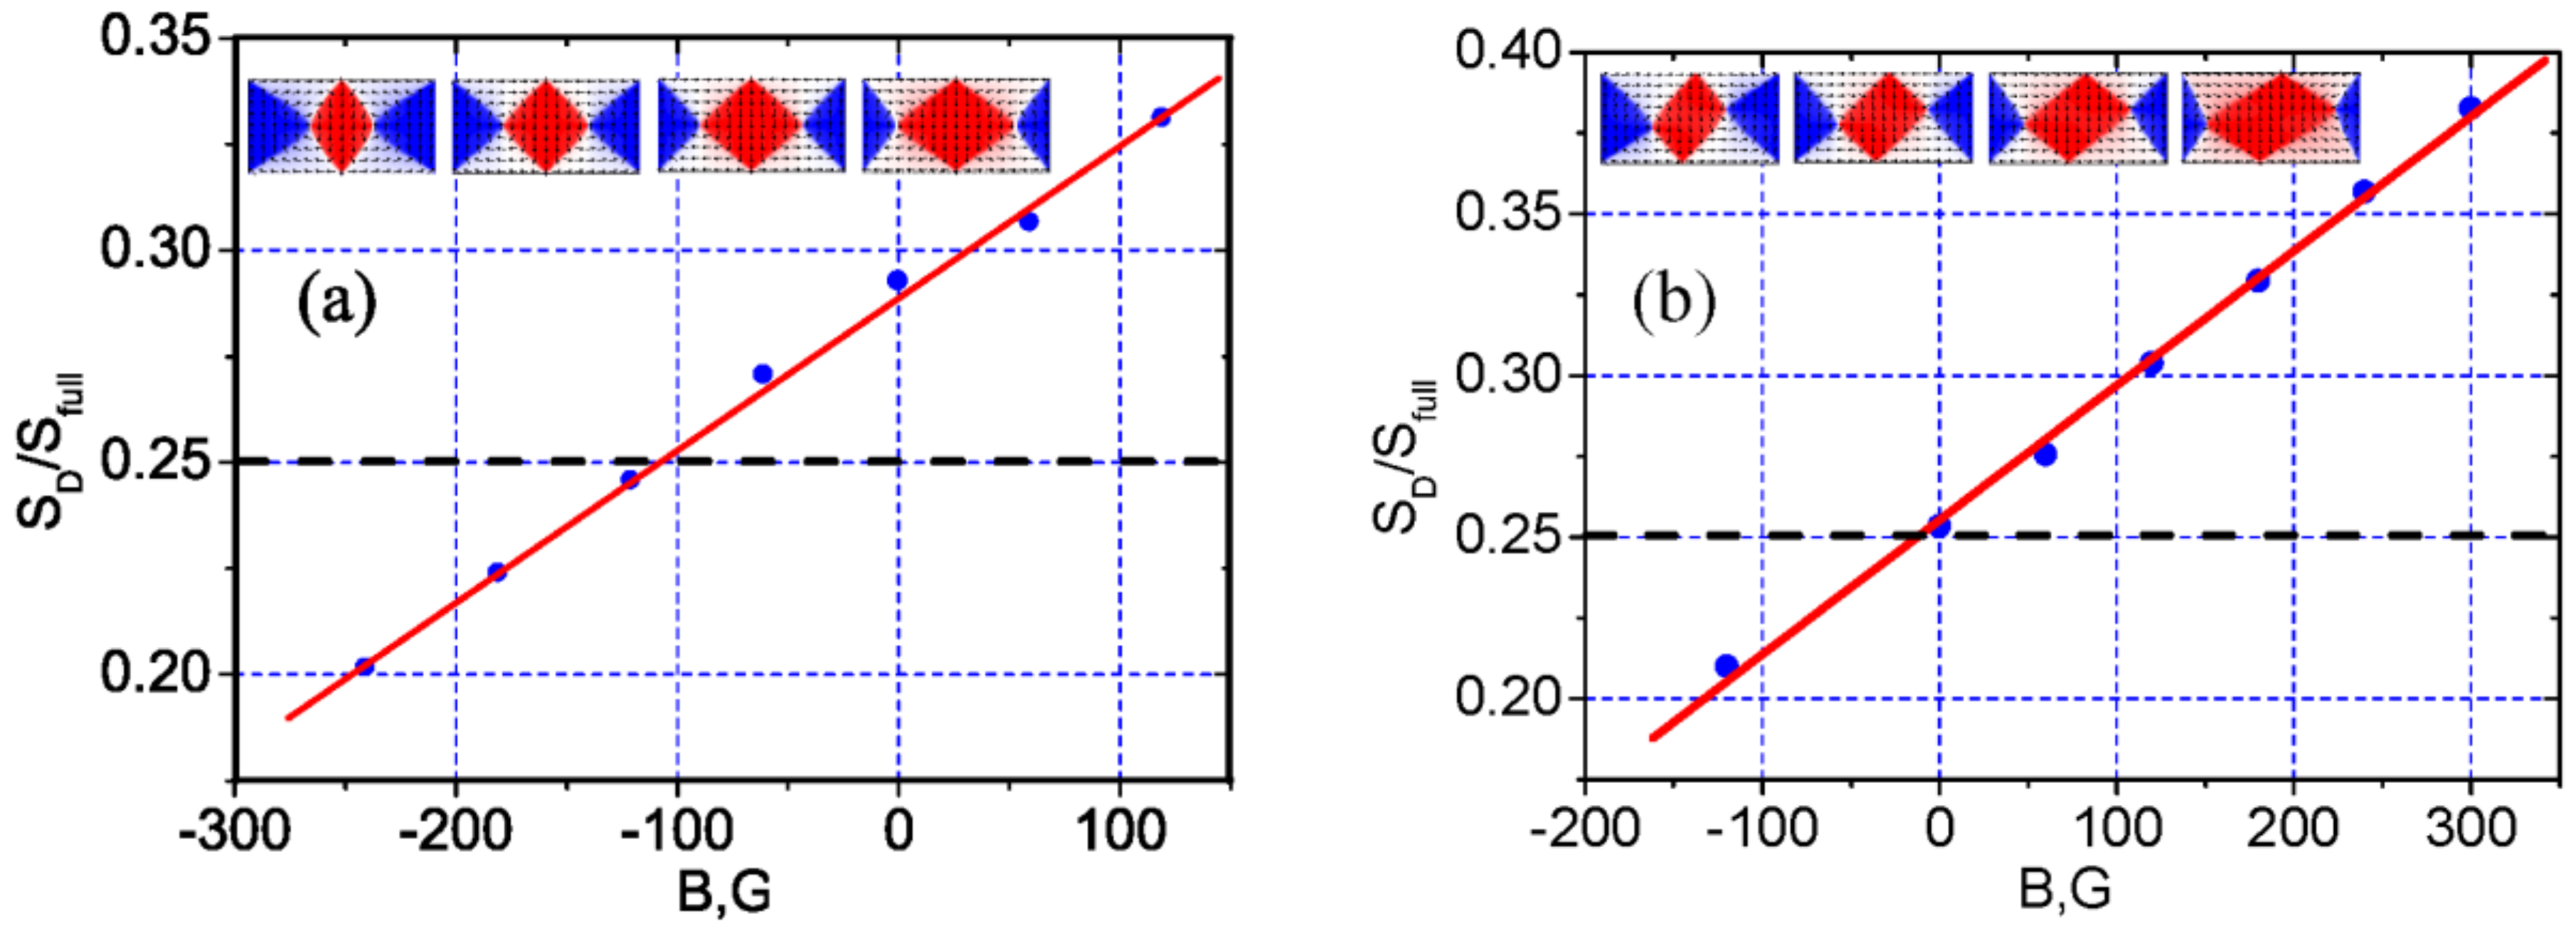
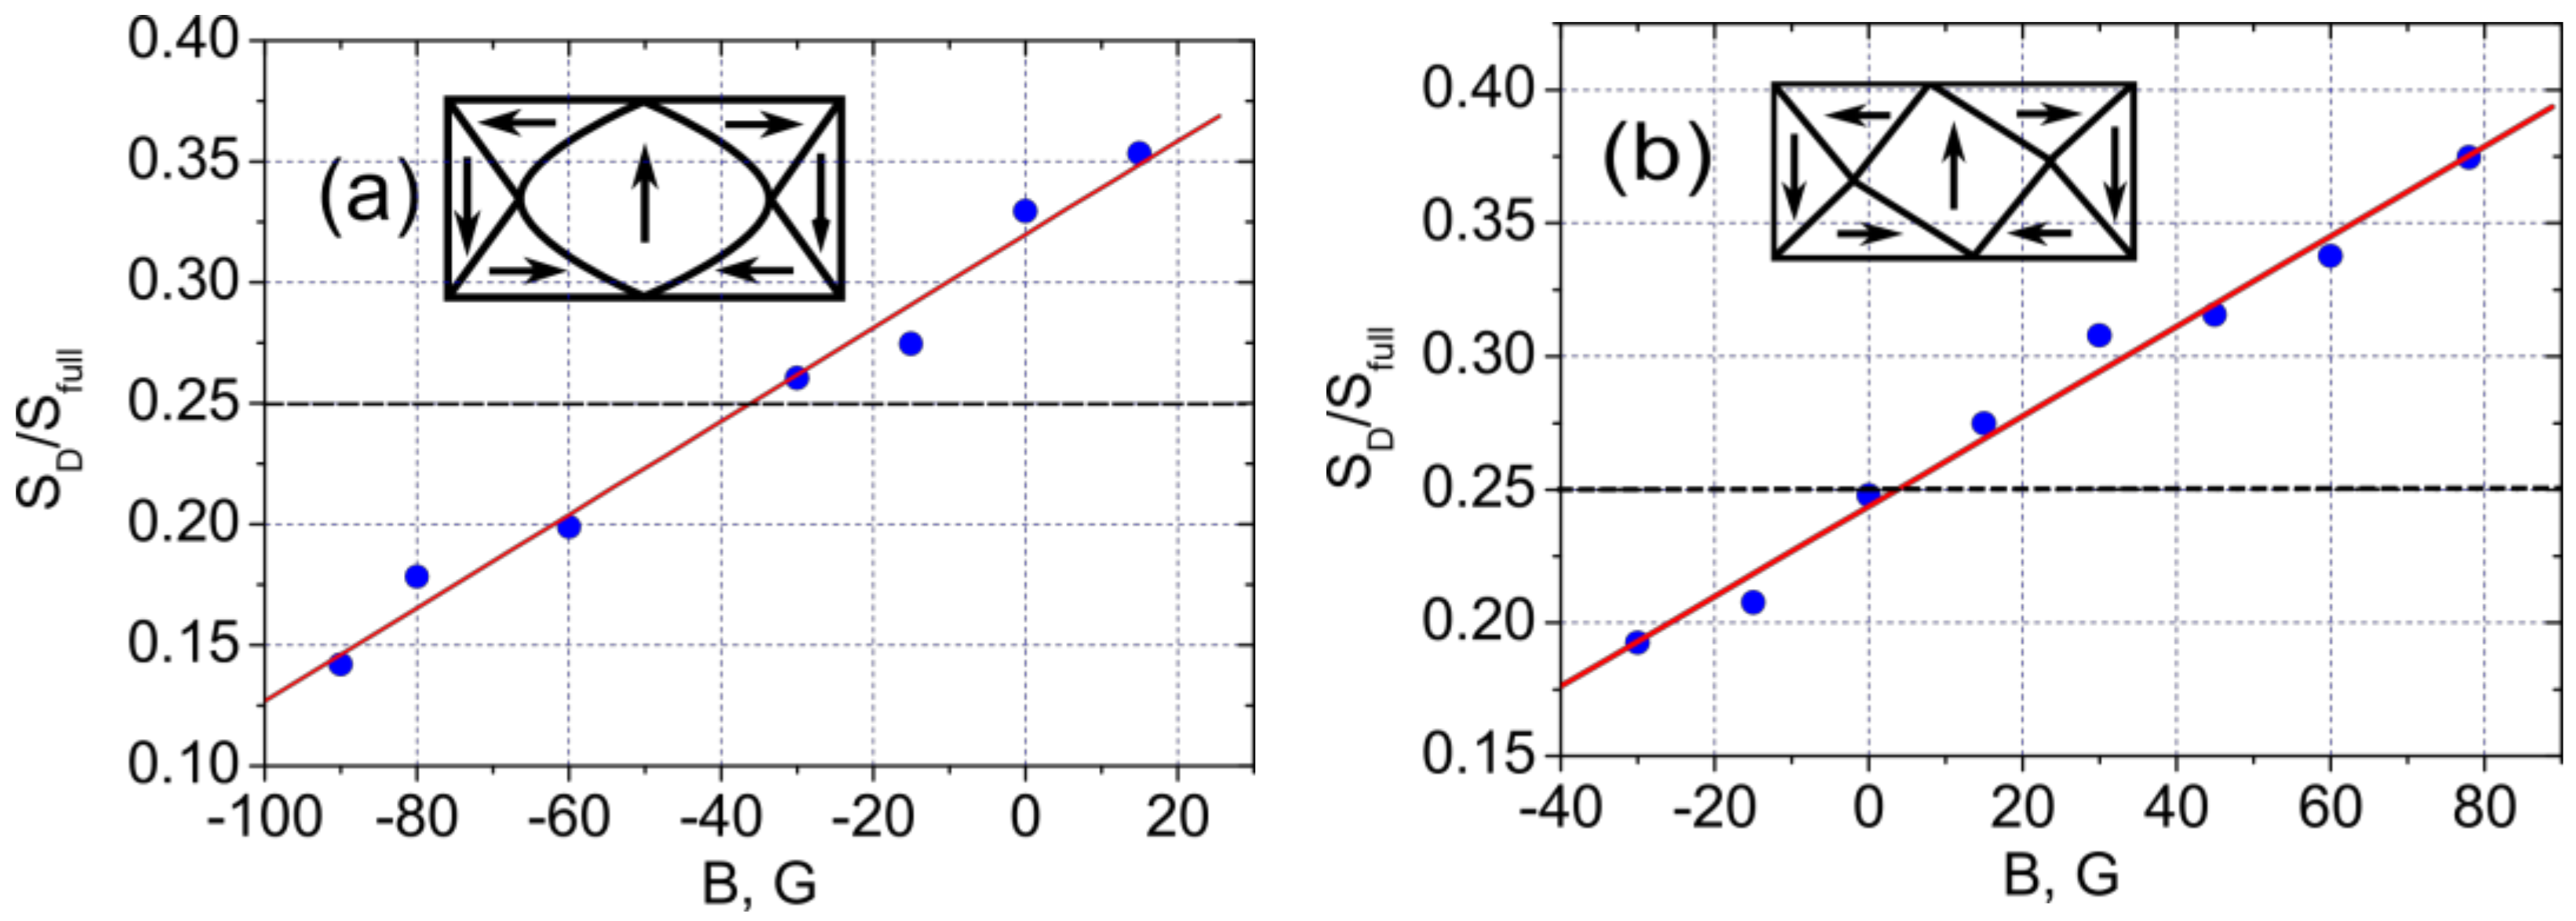
Figure 3c. Graphs of the normalized central domain area of the rectangles corresponding to
Figure 3 and
Figure 4, are presented in
Figure 5a,b, respectively. Approximation of the experimental data of a normalized central domain area (
Figure 5a) gives a value for the exchange bias of about minus 35 G for the structures that, during annealing, were magnetized perpendicular to the long side (
Figure 3). The value of an exchange bias was found at the point where the curve crosses 1/4
.This value is close to the exchange bias found from magnetoresistance measurements. The difference between data can be explained by the non-equal lateral dimensions of the structures used in these experiments and possible influence of electric contacts applied in magnetoresistance measurements. Approximation of experimental MFM data gave a value of zero for exchange bias (
Figure 5b) for structures that during annealing was magnetized parallel to the long side.
3.3. Micromagnetic Calculations
To explain the experimental results of MFM Fe
50Mn
50/Fe/Mo/R-sapphire structure investigation using a model that considers an uncompensated inner surface of the antiferromagnet at the FM/AFM interface, micromagnetic calculations were carried out. OOMMF [
14] software (version 1.2a5) was used. Calculations were performed for a rectangular Fe/FeMn microstructure of 1 × 2 μm
2 lateral dimensions. The thickness of the iron layer was assumed to be 40 nm. The size of the calculation cell was 5 × 5 × 5 nm
3. The antiferromagnetic layer was modeled by two oppositely spin-directed elementary layers, the thickness of each layer was equal to cell size (5 nm) and their spins were considered frozen during calculation. Spins in one layer were oriented in a common direction, thus forming an uncompensated surface at the AFM/FM interface. The saturation magnetic moment was taken to be M
s = 800 emu for FeMn and M
s = 1700 emu for Fe. The exchange stiffness for Fe was A = 21 × 10
−7 erg/cm. The anisotropy of Fe was considered to be cubic with in-plane easy axes of magnetization along [100] and [010] directions. The constant of cubic anisotropy for Fe was 4.8 × 10
5 erg/cm
3. The exchange and anisotropy parameters of FeMn layers were not important in the calculations, because the spins of the layers were frozen. The constant of exchange interaction between the Fe- and FeMn-layers at their interface was assumed to be equal to 1 × 10
−7 erg/cm, which is much lower than the exchange stiffness of Fe. This can be considered an effective (fitting) parameter, because the applied model disregards both modification of the interface magnetic structure and interface roughness. The RMS of the grown films is about 0.5 nm, which exceeds the distance between elementary layers of AFM magnetic sublattices. As a result, the roughness may have a significant effect on the exchange interaction between AFM and FM layers on their interface.
During calculations, a simulated external magnetic field was always directed along the short side of the rectangle, while the spin direction in the uncompensated antiferromagnetic layer at the AFM/FM interface was along the short or long rectangular side. For calculation, the initial conditions of the Fe layer magnetic state in the bilayered Fe/FeMn rectangle was was selected as a “diamond” magnetic state, which is typical of monolayered Fe-rectangles without an external magnetic field. In this approach, if the found simulated magnetic contrast and the sign of exchange bias coincide with the experimental results, it is assumed that the calculated magnetic state represents the magnetic state of the real microstructure.
The results of the calculations are presented in
Figure 6.
Figure 6a shows the normalized (to the rectangle area) area of the central domain of the magnetic state as a function of the simulated external field, where the directions of the external magnetic field and the antiferromagnetic-layer spin coincide at the FM/AFM interface. An exchange bias of about 100 G can be clearly seen.
Figure 6a shows the same, when the simulated external magnetic field is perpendicular to the ferromagnetic layer spin direction. No exchange bias is observed in this case. The inserts represent how the “diamond” magnetic state of the Fe-layer in the bilayered FeMn/Fe rectangle is transformed by the external magnetic field and unidirectional anisotropy. Note that the central domain is symmetrically distorted (
Figure 6a) if the built-in exchange field and external magnetic field are parallel to each other, and asymmetrically (
Figure 6b) if they are perpendicular. This is because the effective field, which is a vector sum of the built-in exchange field and external magnetic field, may be parallel or not to the wall-side of the microstructures. The same is observed experimentally, if the MFM magnetic contrasts in
Figure 3 and
Figure 4 are compared.
On a few occasions, the exchange bias obtained from the calculations exceeded the experimental one. A possible explanation of this discrepancy could be the presence of structural defects in the experimental samples; in particular, roughness at the AFM/FM interface that was not taken into account during the calculations.
Micromagnetic calculations are semi-quantitatively consistent with the MFM experiments, and support the uncompensated surface model for the case, when FeMn layer is on the top of the Fe-layer. For the opposite case, if the Fe layer is on the top of the FeMn layer, it may be assumed that the FeMn layer forms a compensated surface at the FM/AFM interface.
