Article

Experimental and Numerical Research Activity on a Packed Bed TES System

1
Department of Mechanical, Chemical and Materials Engineering, University of Cagliari, Via Marengo, 2, Cagliari 09123, Italy
2
Solar Concentration Technologies and Hydrogen from RES Laboratory, Sardegna Ricerche—Z.I. Macchiareddu, Uta (CA) 09010, Italy
*
Author to whom correspondence should be addressed.
Energies 2016, 9(9), 758; https://doi.org/10.3390/en9090758
Submission received: 11 July 2016 / Revised: 6 September 2016 / Accepted: 8 September 2016 / Published: 20 September 2016

Abstract

:
This paper presents the results of experimental and numerical research activities on a packed bed sensible thermal energy storage (TES) system. The TES consists of a cylindrical steel tank filled with small alumina beads and crossed by air used as the heat transfer fluid. Experimental tests were carried out while varying some operating parameters such as the mass flow rate, the inlet–outlet temperature thresholds and the aspect ratio (length over diameter). Numerical simulations were carried out using a one-dimensional model, specifically developed in the Matlab-Simulink environment and a 2D axisymmetric model based on the ANSYS-Fluent platform. Both models are based on a two-equation transient approach to calculate fluid and solid phase temperatures. Thermodynamic properties were considered to be temperature-dependent and, in the Computational Fluid Dynamics (CFD) model, variable porosity of the bed in the radial direction, thermal losses and the effective conductivity of the alumina beads were also considered. The simulation results of both models were compared to the experimental ones, showing good agreement. The one-dimensional model has the advantage of predicting the axial temperature distribution with a very low computational cost, but it does not allow calculation of the correct energy stored when the temperature distribution is strongly influenced by the wall. To overcome this problem a 2D CFD model was used in this work.

1. Introduction

TES systems based on packed beds of rocks or other solid materials allow storage of thermal energy in the form of sensible heat at high temperature as required in many industrial applications. In concentrating solar power plants (CSP), energy storage has a fundamental role for continuity of power generation and optimum dispatching management. It can be effectively used to decouple electricity production and demand, thus meeting random fluctuations in demand and reducing part-load generation in fossil fuel power plants [1,2]. Moreover, TES can be used in numerous commercial and industrial applications, often integrated with conventional energy sources such as advanced adiabatic compressed air energy storage systems (ACAES) [3], thermal-fluid systems [4], gas-cooled nuclear reactors [5], drying processes [6], catalytic reactors [7] and in residential buildings [8].
There are several methods for storing thermal energy through both physical and chemical processes [9]: sensible, latent and chemical storage. In each case, a sequential process of charge, storage and discharge is present, and it needs to be reversible to recover the energy stored. In sensible heat storage, heat is stored by increasing the storage medium temperature that can be liquid or solid [10]. In the case of latent heat storage, a phase change of the storage medium occurs [11]. Thermo-chemical storage is a technique that involves chemical reactions [12]. Although technologies based on latent heat and chemical energy are considered the most promising, some technological and economic aspects make sensible heat storage superior [13] and it represents the simplest and least expensive form of thermal storage [14]. Thermocline TES based on packed beds with air as the heat-transfer fluid has been shown to have many advantages for industrial applications: applicability in a wide temperature range, the possibility of using economical storage materials (i.e., stones), direct heat transfer between working fluid and storage material, and no degradation or chemical instability [15]. In past decades, random and structured packings were extensively investigated by many researchers and also coupled with a numerical support. A parametric study to investigate the effect of bed dimensions, fluid flow rate, particle material and dimension on the thermal behavior of a packed bed up to 550 °C was performed in [16]. Air was used as an HTF and a one-dimensional two-phase model with constant fluid and solid properties including heat losses from lateral walls was validated. The behavior of a high temperature rock-bed TES system using air as the HTF, taking into account the effect of its variable porosity and effective conductivity, was studied in [17]. The authors also found a good agreement between time-dependent 3D CFD simulation results and experimental data, thus showing the relevance of heat transfer by radiation, even at relatively low temperature (300–350 °C) [18]. A comparison between experimental data with numerical results in a vessel filled with alumina beads crossed by air as HTF was carried out, considering the radial temperature gradient negligible [19]. The commercial CFD Ansys Fluent was used to investigate the effect of radiation heat transfer, mass flow rate and the void fraction in two different types of porous media: packed bed or honeycombs [20,21]. In this model, a cylindrical system geometry was assumed and the effect of heat loss from lateral walls for charging temperatures of 1200 °C was evaluated, assuming both fluid and the solid thermophysical properties to be temperature-independent. Packed bed systems with different HTFs such as molten salt or thermal oil were also investigated, including a pilot-scale oil/rock thermocline TES system which was numerically and experimentally studied [22]. A one-dimensional model based on two energy equations was developed and validated with experimental data for both single and multiple charge/discharge phases. The same authors used the commercial CFD software Ansys Fluent to compare the experimental results with numerical 3D simulation results [23]. A parametric investigation on a molten salt thermocline TES using a transient two-dimensional two-phase model was performed [24]. Other authors studied the effect of several parameters on TES performance for one charge/discharge cycle with molten salt as HTF [25]. Recently, the performance of a packed bed storage system with encapsulated phase change material was investigated using molten salt for CSP applications [26], synthetic oil [27] or gas as HTF [28]. A new TES configuration for CSP applications based on the combination of sensible and latent heat storage obtained by adding a relatively small amount of encapsulated PCM at the top of a packed bed was proposed to stabilize outflow temperature during the discharging phase [29]. The packed bed thermal storage system investigated herein consists of a tank filled with solid alumina beads chosen for their high heat capacity and stability at high temperatures, crossed by air used as HTF. An accurate experimental study was carried out to verify the effect of some parameters on thermal behavior. In this work, the bed aspect ratio and the temperature thresholds at the inlet–outlet sections of the bed were considered. The results of the experimental tests are here compared with the simulation ones performed with a 1-D code built in Matlab-Simulink environment and with a 2-D CFD model developed in Ansys Fluent. In both cases, fluid and solid temperatures were calculated separately through a LTNE two-equation model. In the 2-D CFD model, a variable porosity in the radial direction and the thermal losses were taken into consideration.

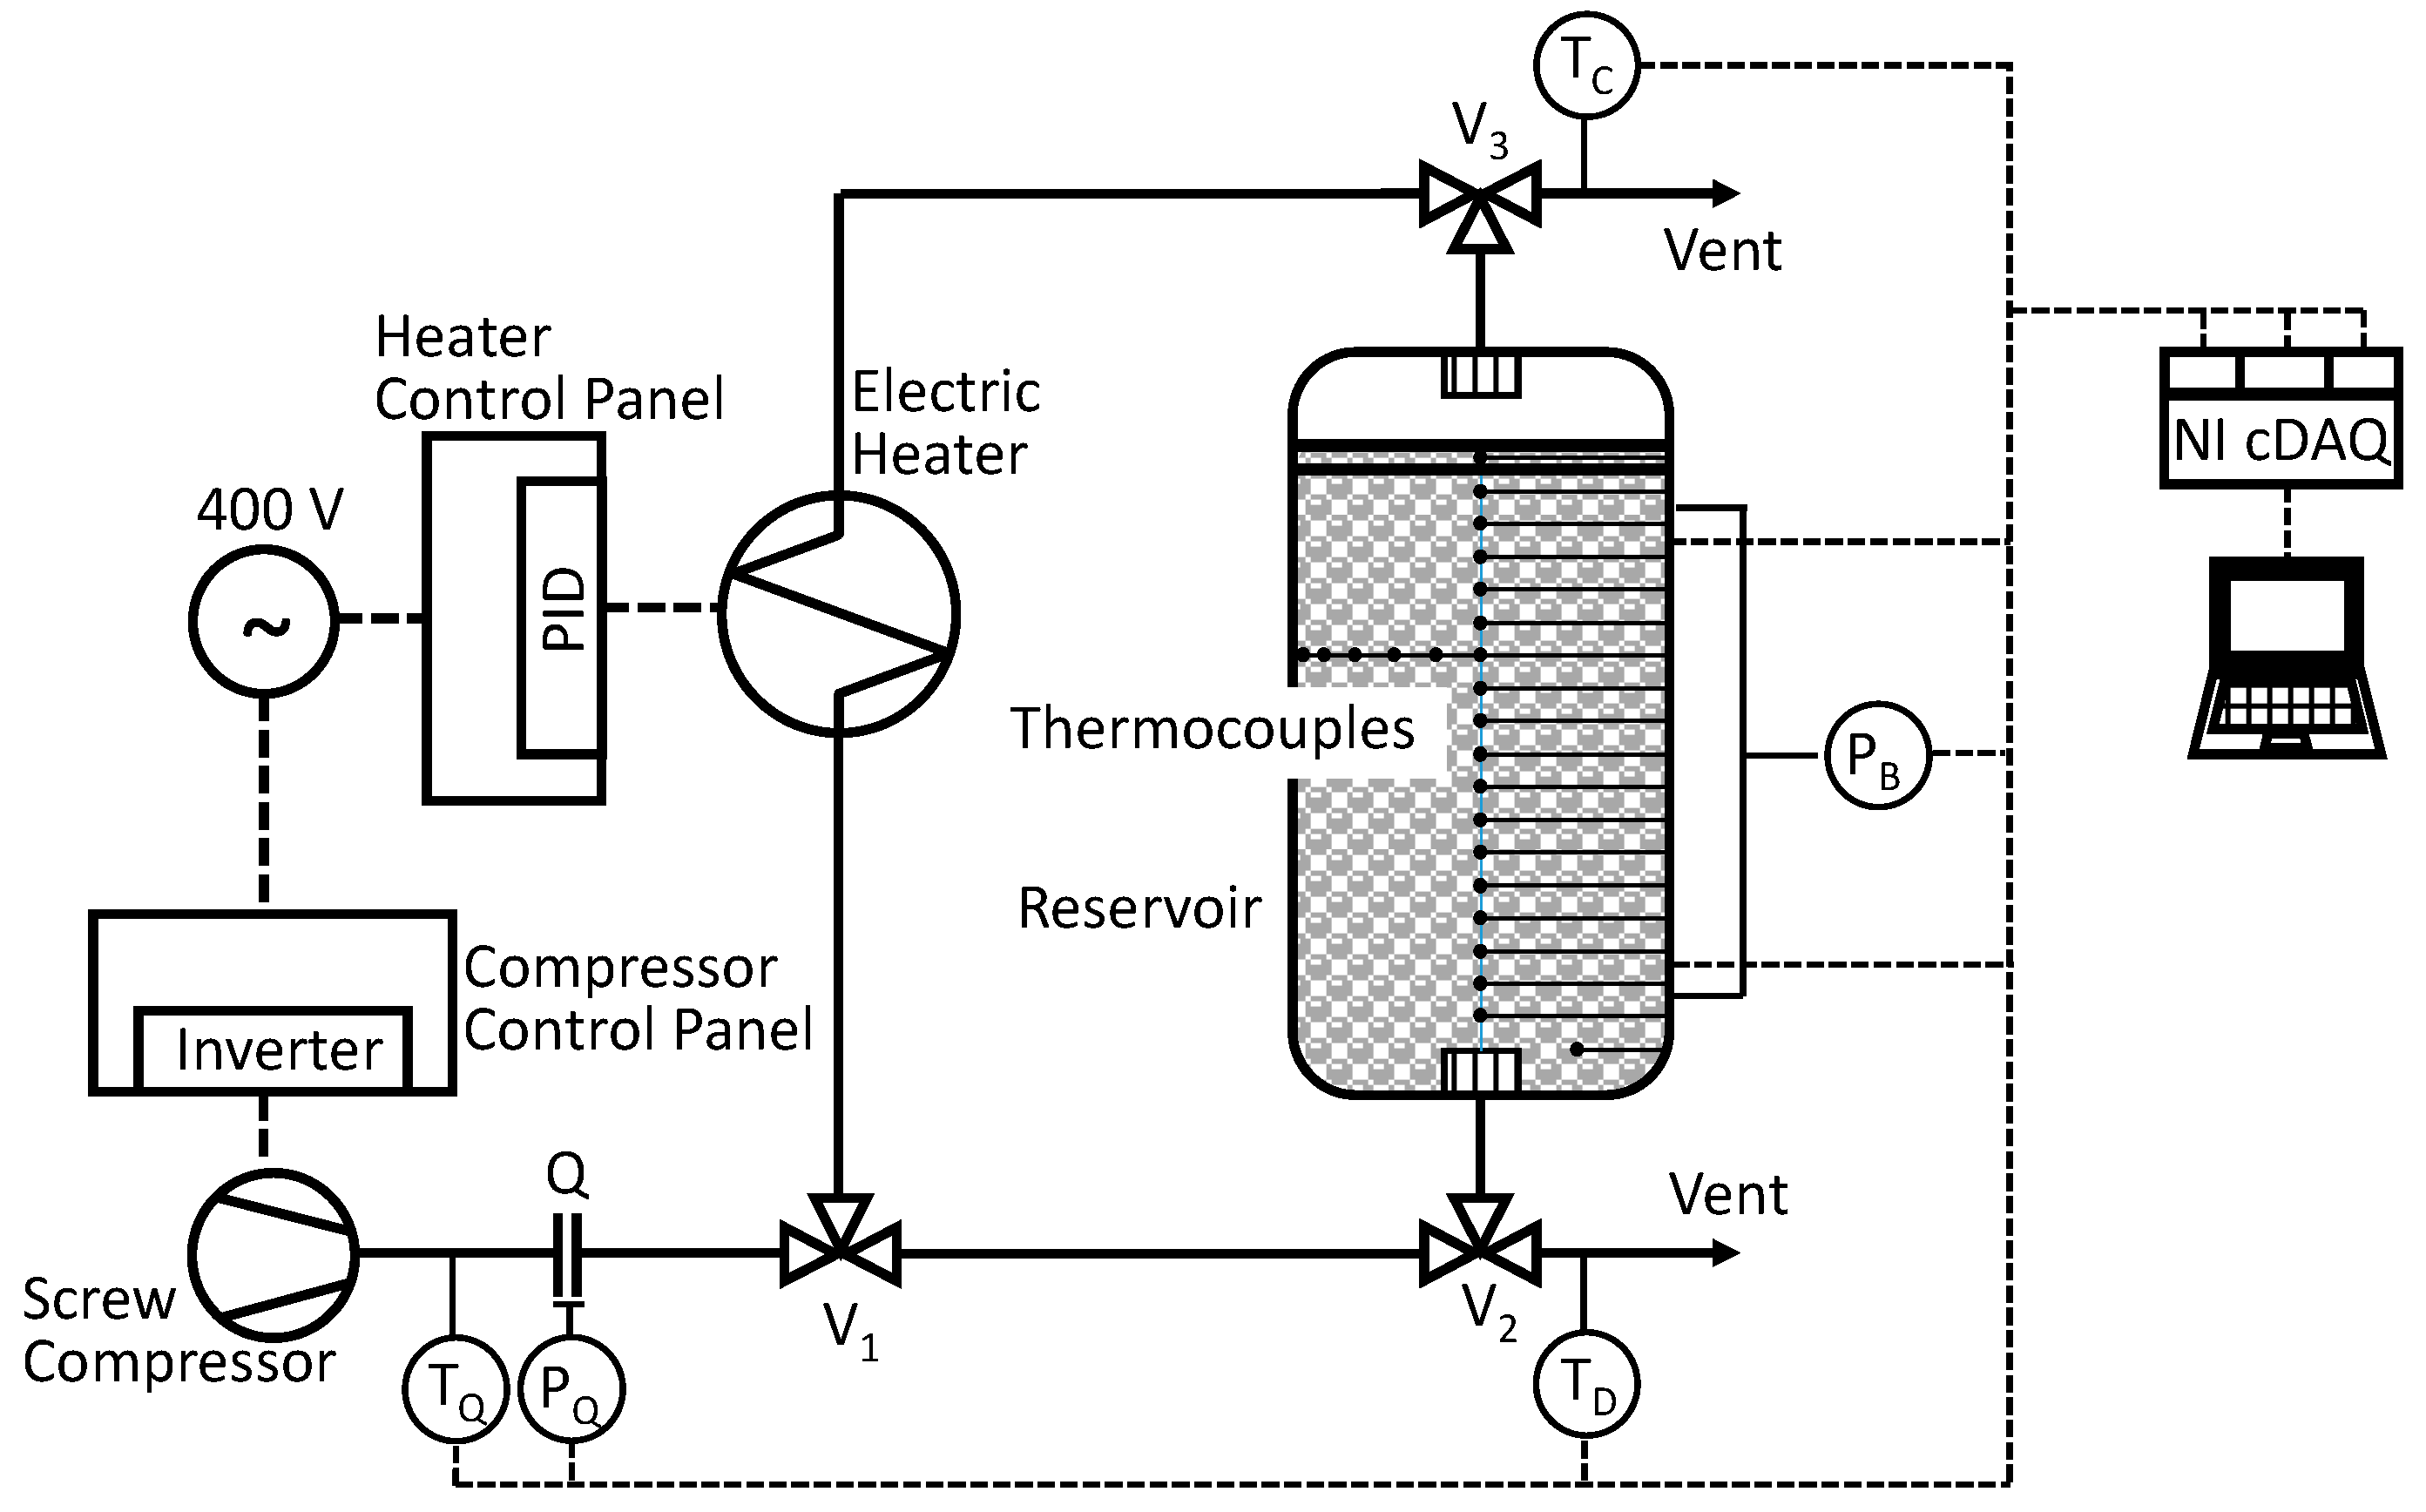
2. Experimental Setup and Instrumentation

The experimental setup built at the DIMCM of the University of Cagliari has been described in detail in previous works [30,31]. The TES system consists of an insulated steel tank with a net volume of about 0.5 m3 (0.58 m in diameter and 1.8 m in height) filled with commercial small alumina spheres with an average diameter of 8 mm (Figure 1).
The experimental setup is an open circuit equipped with a variable speed screw compressor that blows air, used as HTF, and an electric heater that can heat the HTF up to 300 °C. Table 1 shows the most relevant data for the test rig.
The TES can be charged and discharged handling the position of three 3-way valves. The mass flow rate is evaluated by an orifice plate (Q in Figure 1) and several pressure and temperature transducers allow control over the whole process. The temperature profile in the storage tank is detected by nineteen thermocouples placed along the vertical axis (100 mm from each other), and five more thermocouples are placed along the radius at a height of about 600 mm from the top of the bed to investigate the thermal influence of the wall, with a decreasing distance from each other close to the wall. Finally, 10 more thermocouples give the external wall temperature along the axial direction. All signals are acquired by a National Instruments Compact DAQ USB chassis and monitored with a Graphical User Interface developed using LabVIEW software.
The experimental setup is suitable for investigating and evaluating storage system performance under different operating conditions by varying the mass flow rate, bed aspect ratio, particle dimension and temperature range during the charging and the discharging phases.

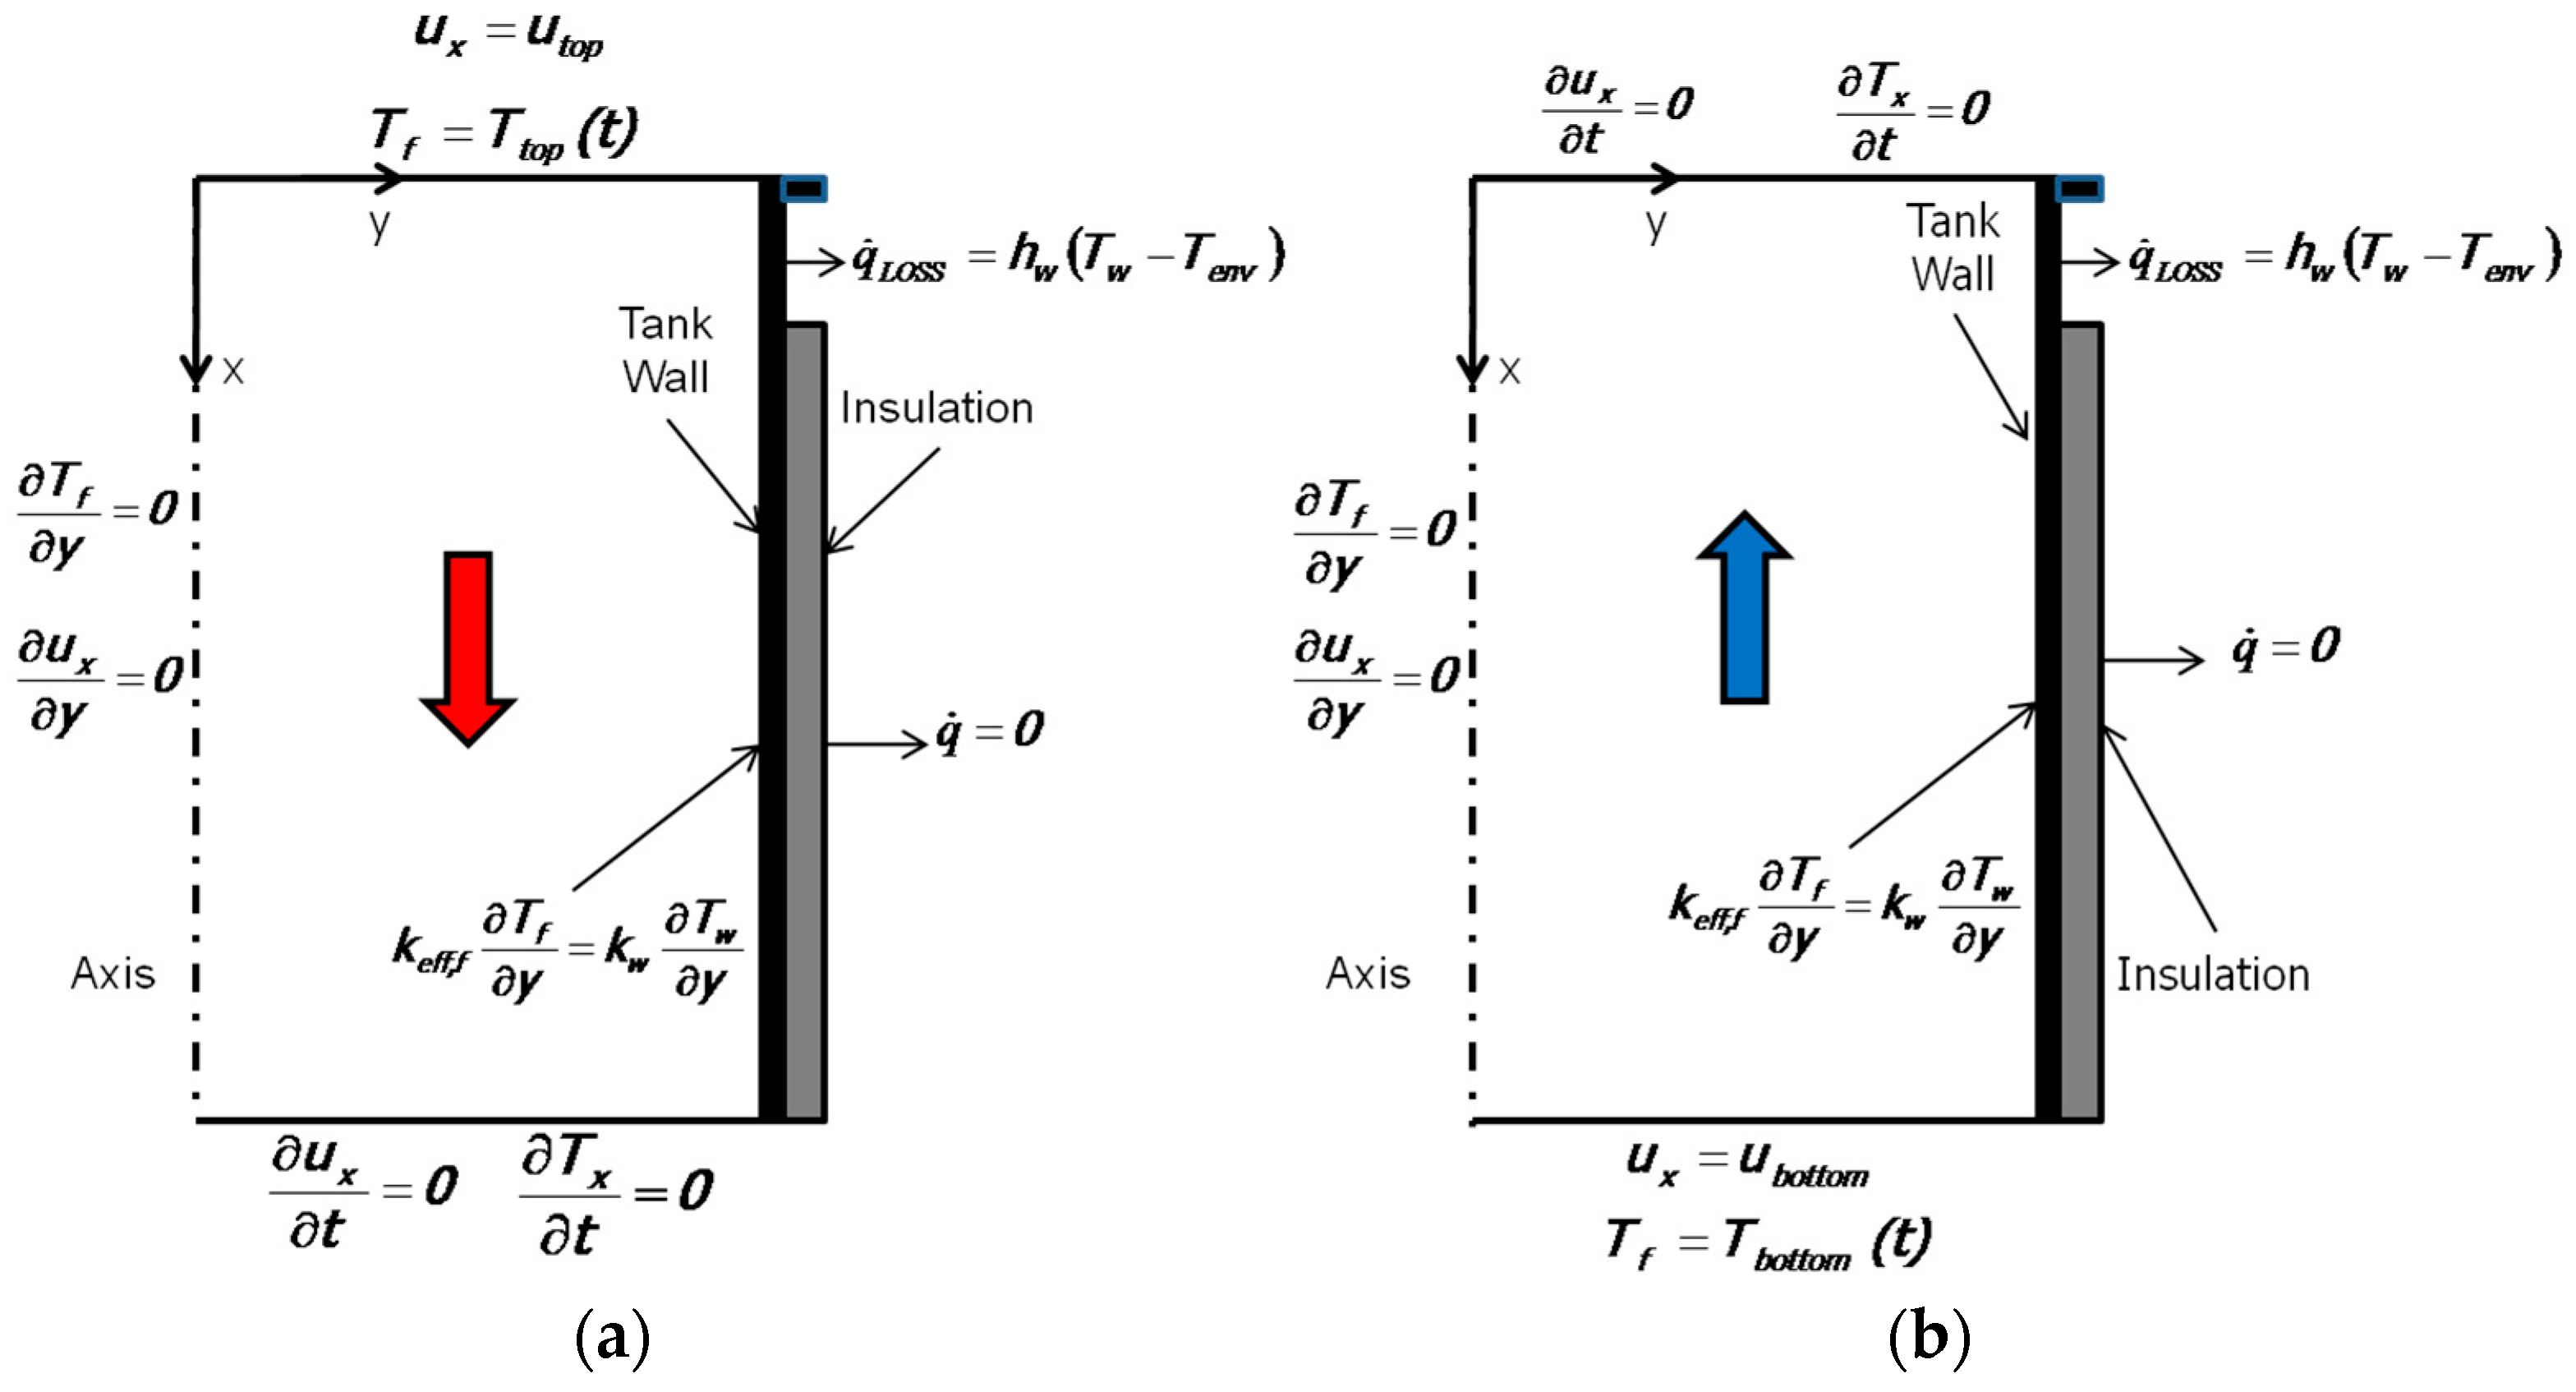
3. Numerical Analysis

In this work, the experimental results are compared with the numerical simulations. The numerical results were obtained with two different approaches: using a one-dimensional model developed in house in Matlab-Simulink environment and CFD software Fluent to simulate a two-dimensional domain. In both cases, a two-equation transient model was used to compute fluid and solid temperatures separately. The Matlab model, described in detail in a previous work [31], allows prediction of the porous bed thermal behavior along the axis of symmetry by considering a uniform radial temperature distribution. The filler bed was assumed to be isotropic and homogeneous and the conduction among solid particles was neglected. The Biot number was small enough to assume a uniform temperature distribution inside the beads. For both phases, thermal properties are temperature-dependent since they change considerably in the operative temperature range [32]. The fluid flow is considered incompressible while natural convection and radiation are assumed negligible owing to sufficiently high flow velocity and moderate temperature values [33].
With these assumptions, to correctly calculate the bed behavior in the Matlab-Simulink platform, a transient, one-dimensional, two-equation model for fluid (1) and solid (2) phases along the axis of the bed was established as follows:
ε ( ρ c v ) f T f t + ( ρ c p ) f u D T f x = k e f f 2 T f x 2 + h s f α s f ( T s T f )
( 1 ε ) ( ρ c ) s T s t = h s f α s f ( T f T s )
A detailed description of the model, with the expression of the specific surface area αsf and heat transfer coefficient hsf in Equations (1) and (2), is reported in a previous work [31]. CFD software Fluent is able to give further information such as bed radial thermal behavior and, in particular, the influence of the wall tank on it. The geometry includes the porous bed coupled with the wall and the flange. It is a 2D axisymmetric domain with the bed, set as a fluid domain, having an inner diameter and height of 0.58 m and 1.8 m respectively. The wall, set as a solid domain, has a thickness of 13 mm. The domain is discretized with about 30,000 cells including the outer wall of the tank adjacent to the bed. The computational grid is of the quadrilateral type with a discretization step of 5 mm, while at the wall the mesh is finer to better represent the sharp variation in porosity close to the wall. The main assumptions made for the Matlab model are also valid for the CFD model with some additions: in the 2D model, the effects of thermal losses and solid conductivity are taken into account. Furthermore, the thermal properties of the wall are assumed to be constant and the porosity varies along the radius with a maximum near the wall. A detailed description of the model was already proposed [34]. Simulations were carried out using the commercial CFD software Ansys Fluent solving the unsteady Reynolds-Averaged Navier–Stokes (RANS) equations and assuming turbulent flow with a RNG turbulence model and “enhanced wall treatment” option (the flow behaviour near the wall is resolved in a finer mesh). A second-order upwind scheme was used for spatial discretization of the convective fluxes as well as the transient one with a second-order implicit formulation. The conservation equations of mass, momentum and energy can be reduced to transient two-dimensional axisymmetric form by taking into account the aforementioned assumptions. The volume-averaged mass equation for the HTF phase is stated in terms of the superficial velocity vector (Equation (3)):
( ε   ρ f ) t + ( ρ f u ) = 0
The Darcy-Forchheimer momentum equation for packed beds of disordered spheres in the simplified form of an Ergun equation is considered, taking into account viscous and inertial momentum dissipation in the porous bed (Equation (4)).
ρ f ( u t + ( u )   u ε ) = ε   p + ε   ρ f g ε ( μ f K u + ρ f F K | u | u )
Permeability K and inertial coefficient F, used to calculate the pressure drop through the porous bed, are functions of bed porosity and particle diameter [35]. The local thermal non-equilibrium model (LTNE) was used to simulate the heat transfer in the porous medium with separate energy equations for fluid (Equation (5)) and solid phase (Equation (6)), since solid and fluid phases have significantly different heat capacities and thermal conductivities:
ε ( ρ   c v ) f T f t + ( ρ   c p ) f u T f = ( k e f f , f T f ) + h   α ( T s T f ) + h w a w ( T w T f )
( 1 ε ) ( ρ   c ) s T s t = ( k e f f , s T s ) h   α ( T s T f )
The two parameters h and α are the convective heat transfer coefficient and the specific surface area respectively. The effective conductivity for solid phase keff,s is calculated by modeling the contact area between two spheres using Hertzian elastic deformation principles, while effective fluid conductivity keff,f depends on the Peclet number and bed porosity. The radial porosity variation is also considered and more details about its formulation and the whole model can be found in [35].
The initial and boundary conditions are defined in accordance with the different phases of charge and discharge. At the beginning of the charging phase, the temperature along the domain was set at the minimum value of the process. The inlet air temperature, entering from the top of the bed, is time-dependent and was assumed equal to the experimental value. Temperature distribution at the end of the charging phase is used as the initial condition for the following discharge phase in which flow is reversed and uniform axial velocity at the bottom of the tank is assumed. The temperature of the porous bed is coupled to that of the wall tank to satisfy temperature distribution continuity and energy conservation across the interface (Equation (7)).
T f | y = D 2 = T w | y = D 2 ,   k e f f , f T f y | y = D 2 = k w T w y | y = D 2
The outer wall of the tank is not completely insulated, so the part covered by the insulation is considered adiabatic (thermal insulation is not included in the domain), while a constant heat transfer coefficient to the outside was imposed on the other uninsulated part (Equation (8)):
k w T w y | y = D 2 + s = 0 ,   k w T w y | y = D 2 + s = h w ( T w T e n v )
All the boundary conditions are explicitly indicated in Figure 2.
To correctly model the porous medium where the transport process and the heat transfer through the packed bed occur, it was necessary to implement a mathematical model in user-defined functions (UDFs). They were used to set the heat transfer coefficient, the pressure losses in the porous bed, the porosity variation in the radial direction of the bed, the effective thermal conductivity of the fluid and solid phase as well as for calculating the diffusivity in the solid state. Furthermore, a user-defined scalar function (UDS) was also used to set the temperature value for the solid material.

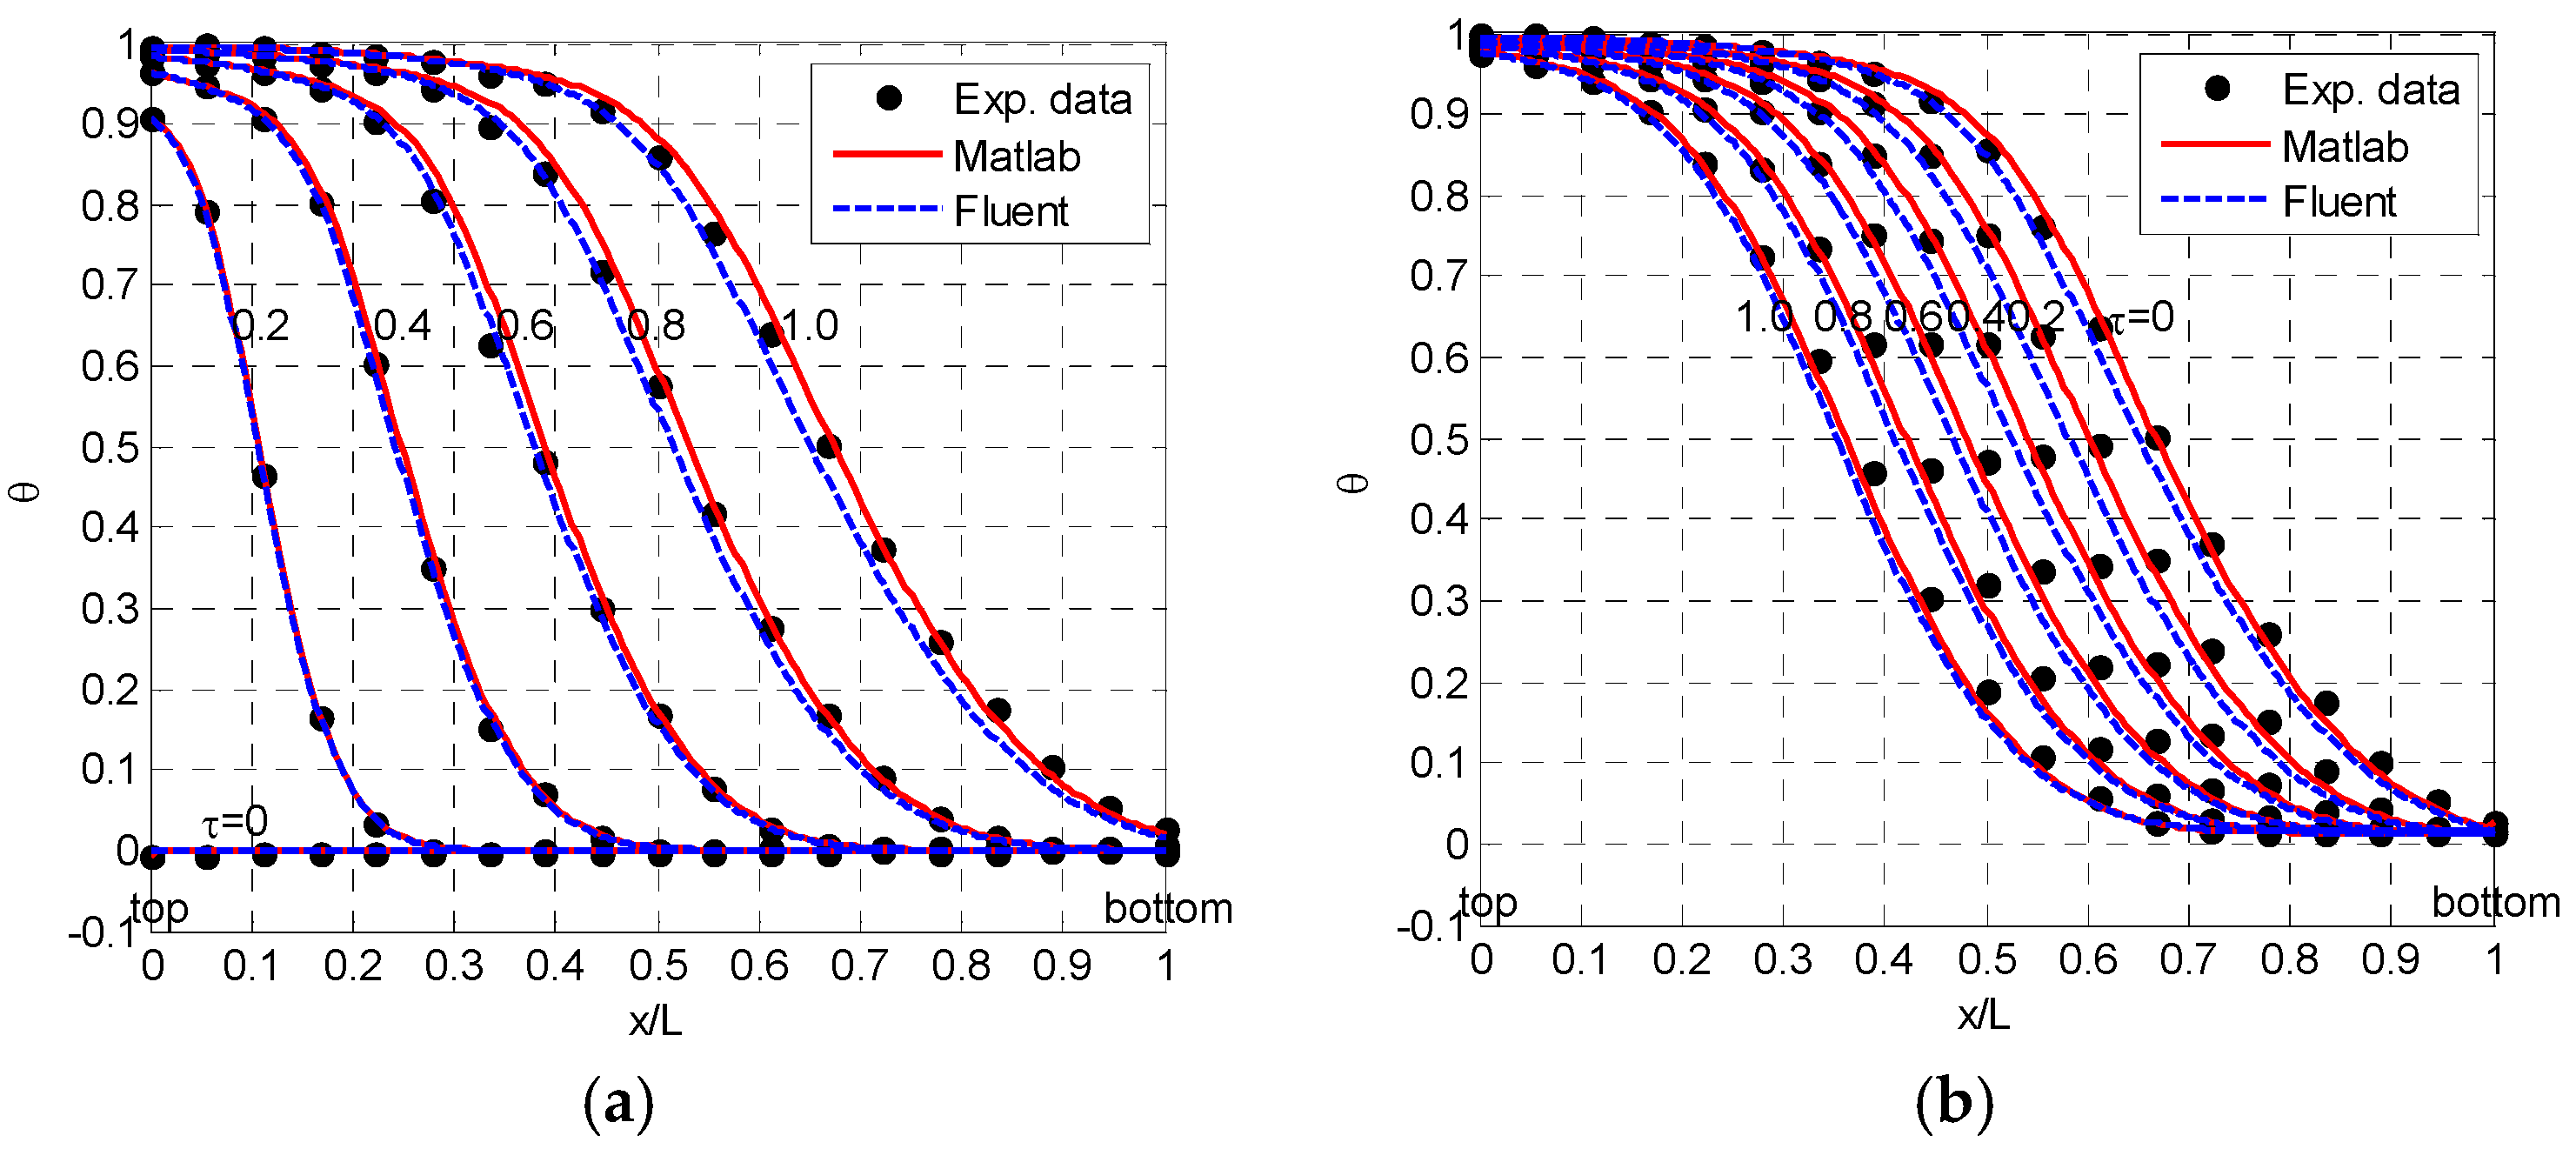
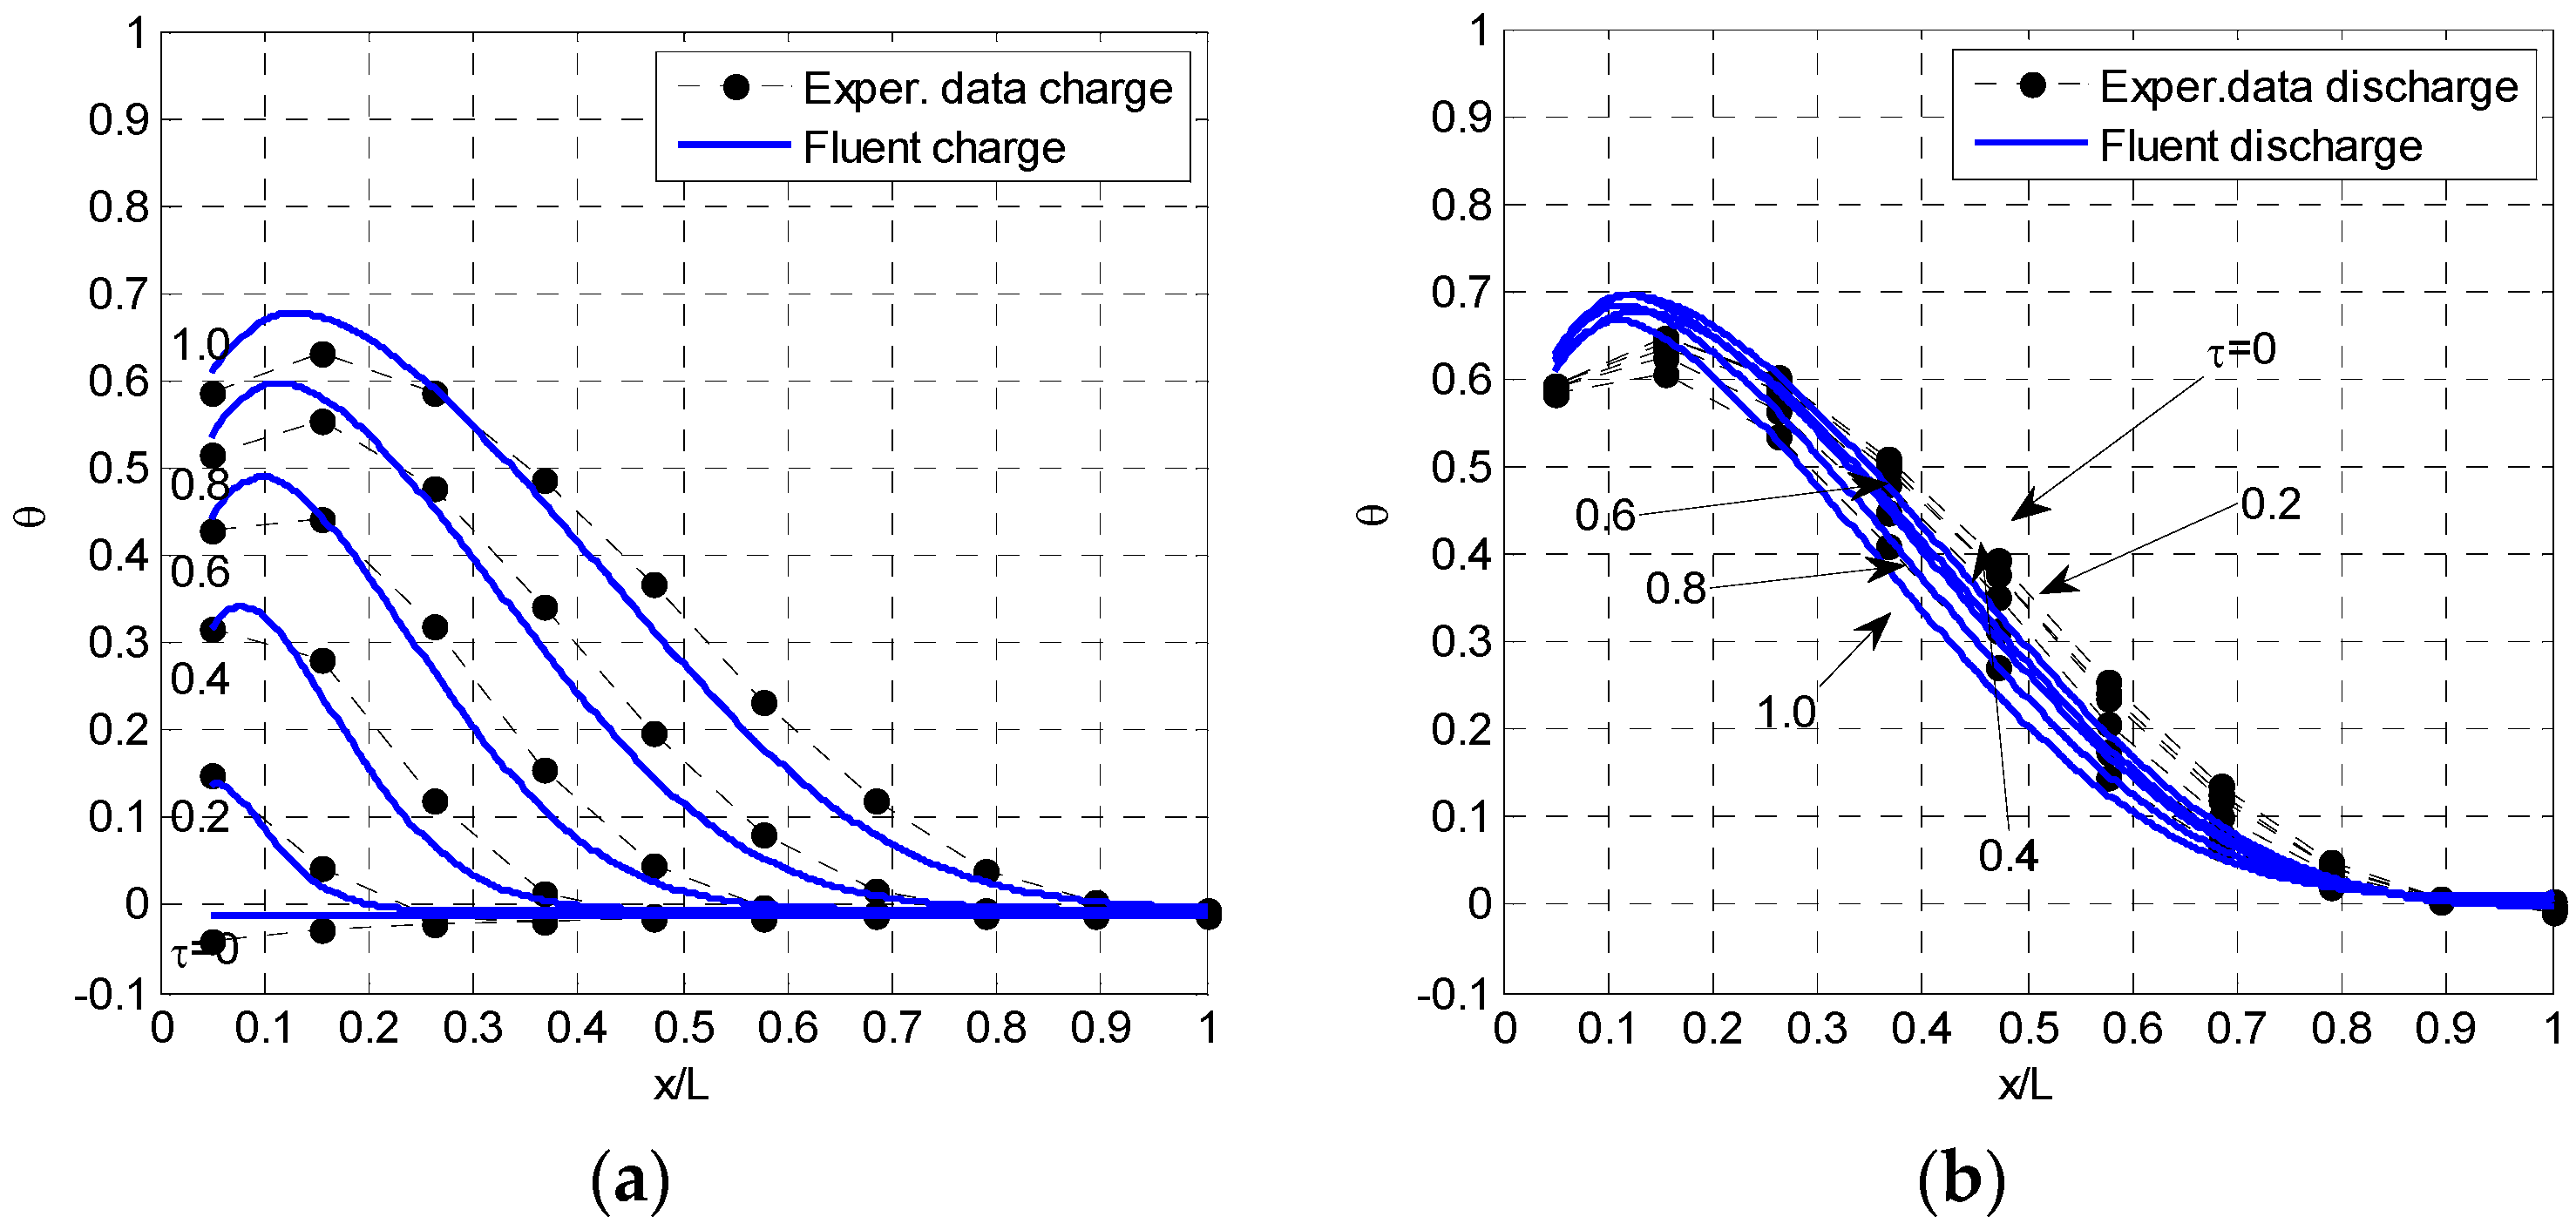
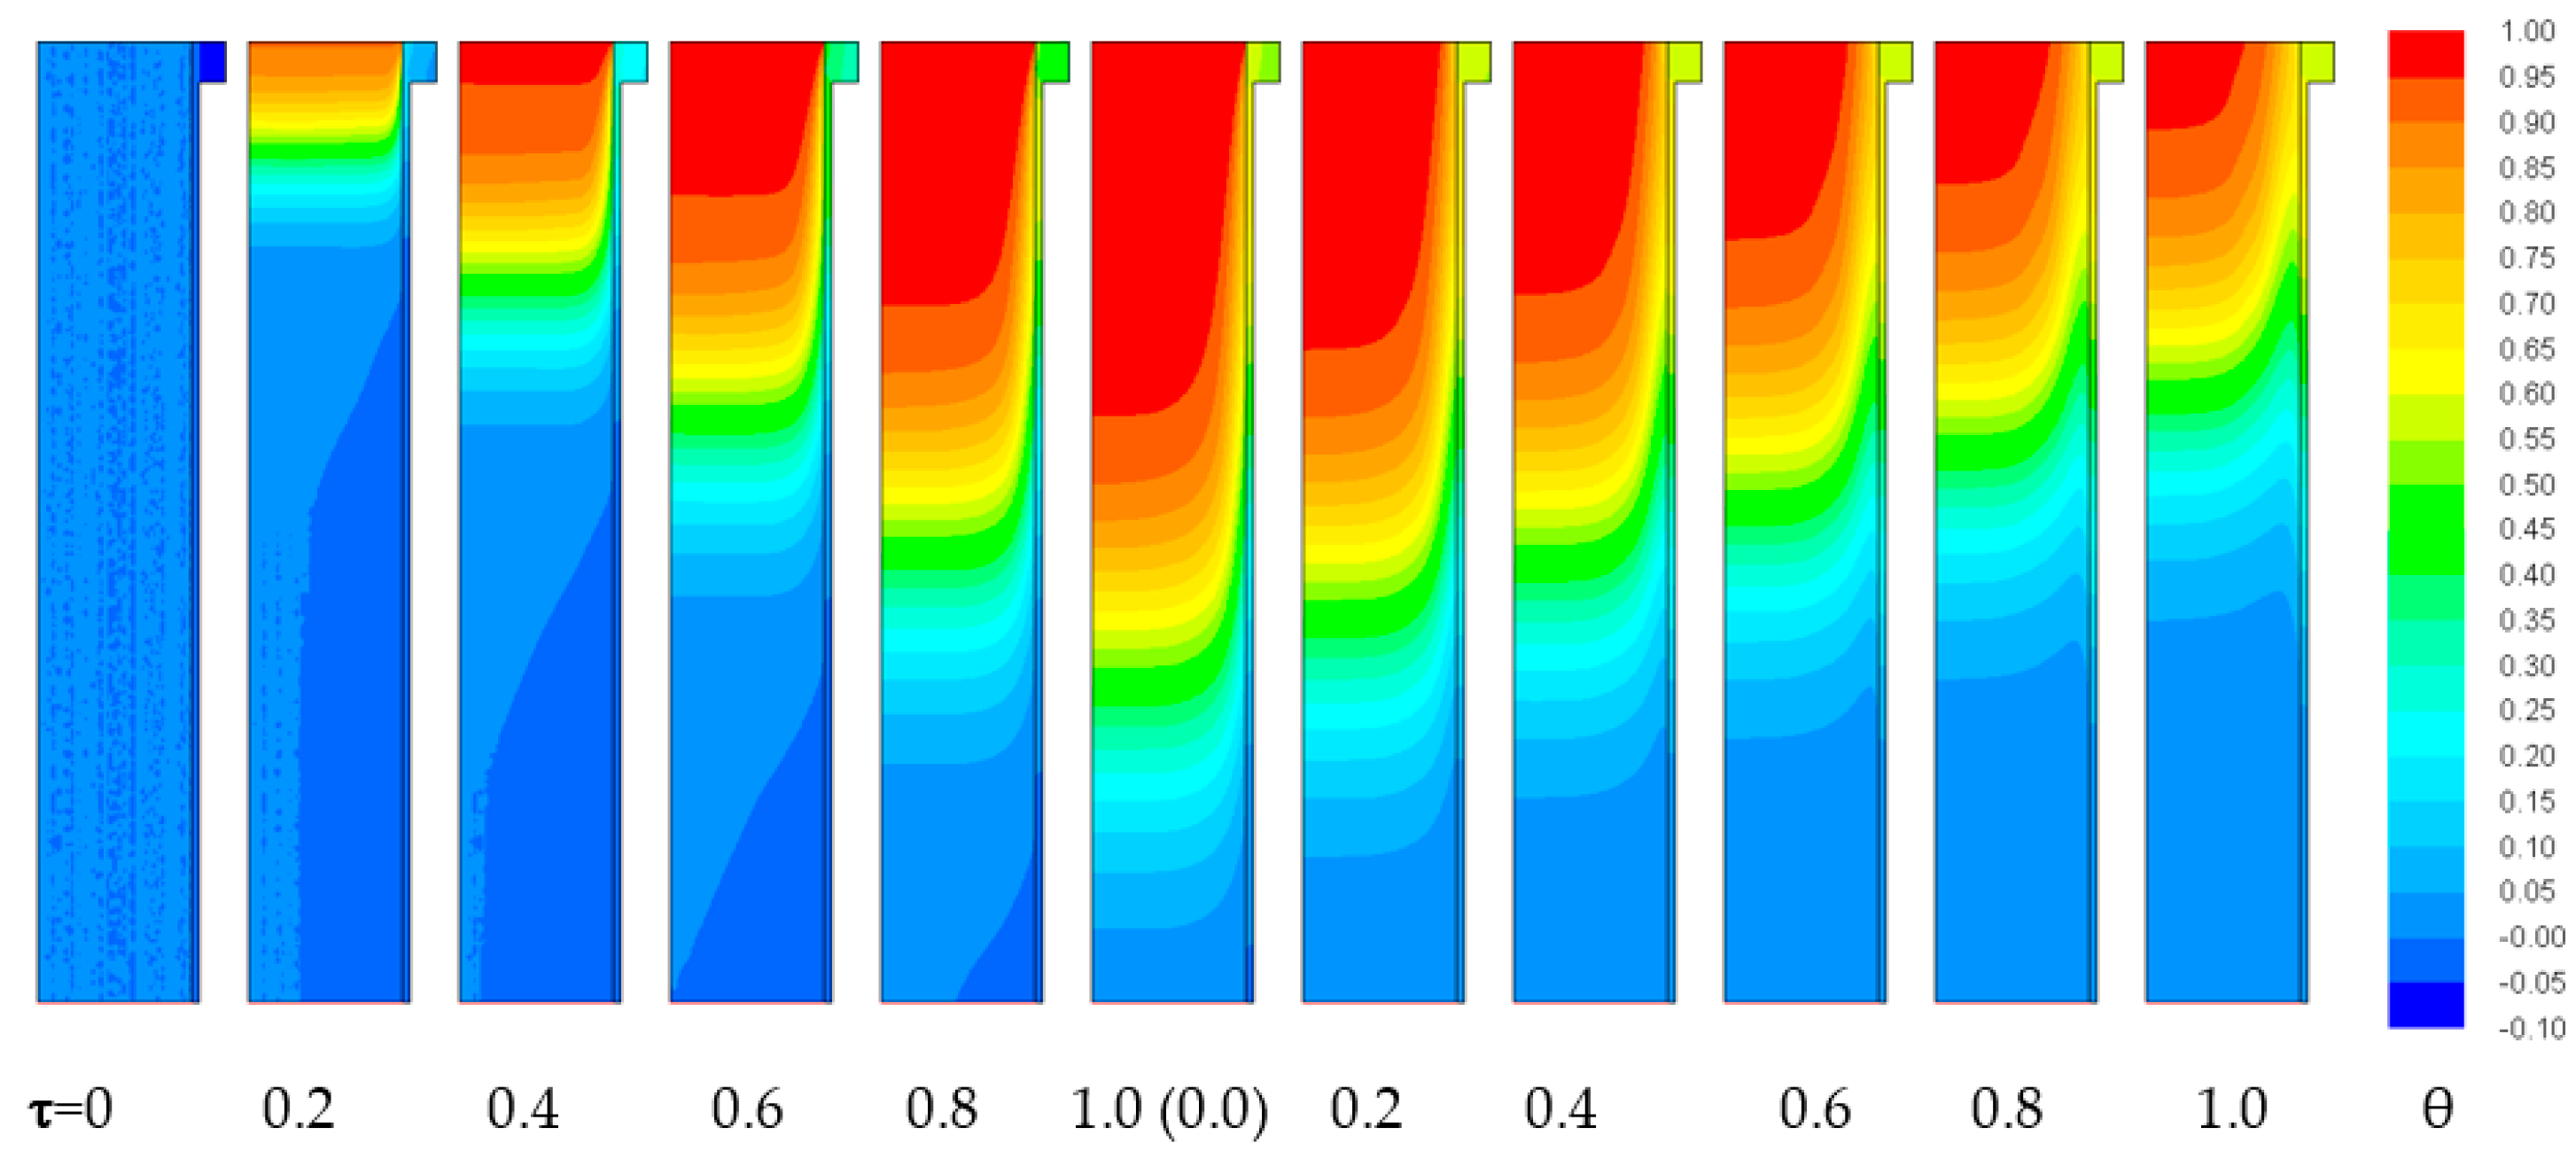
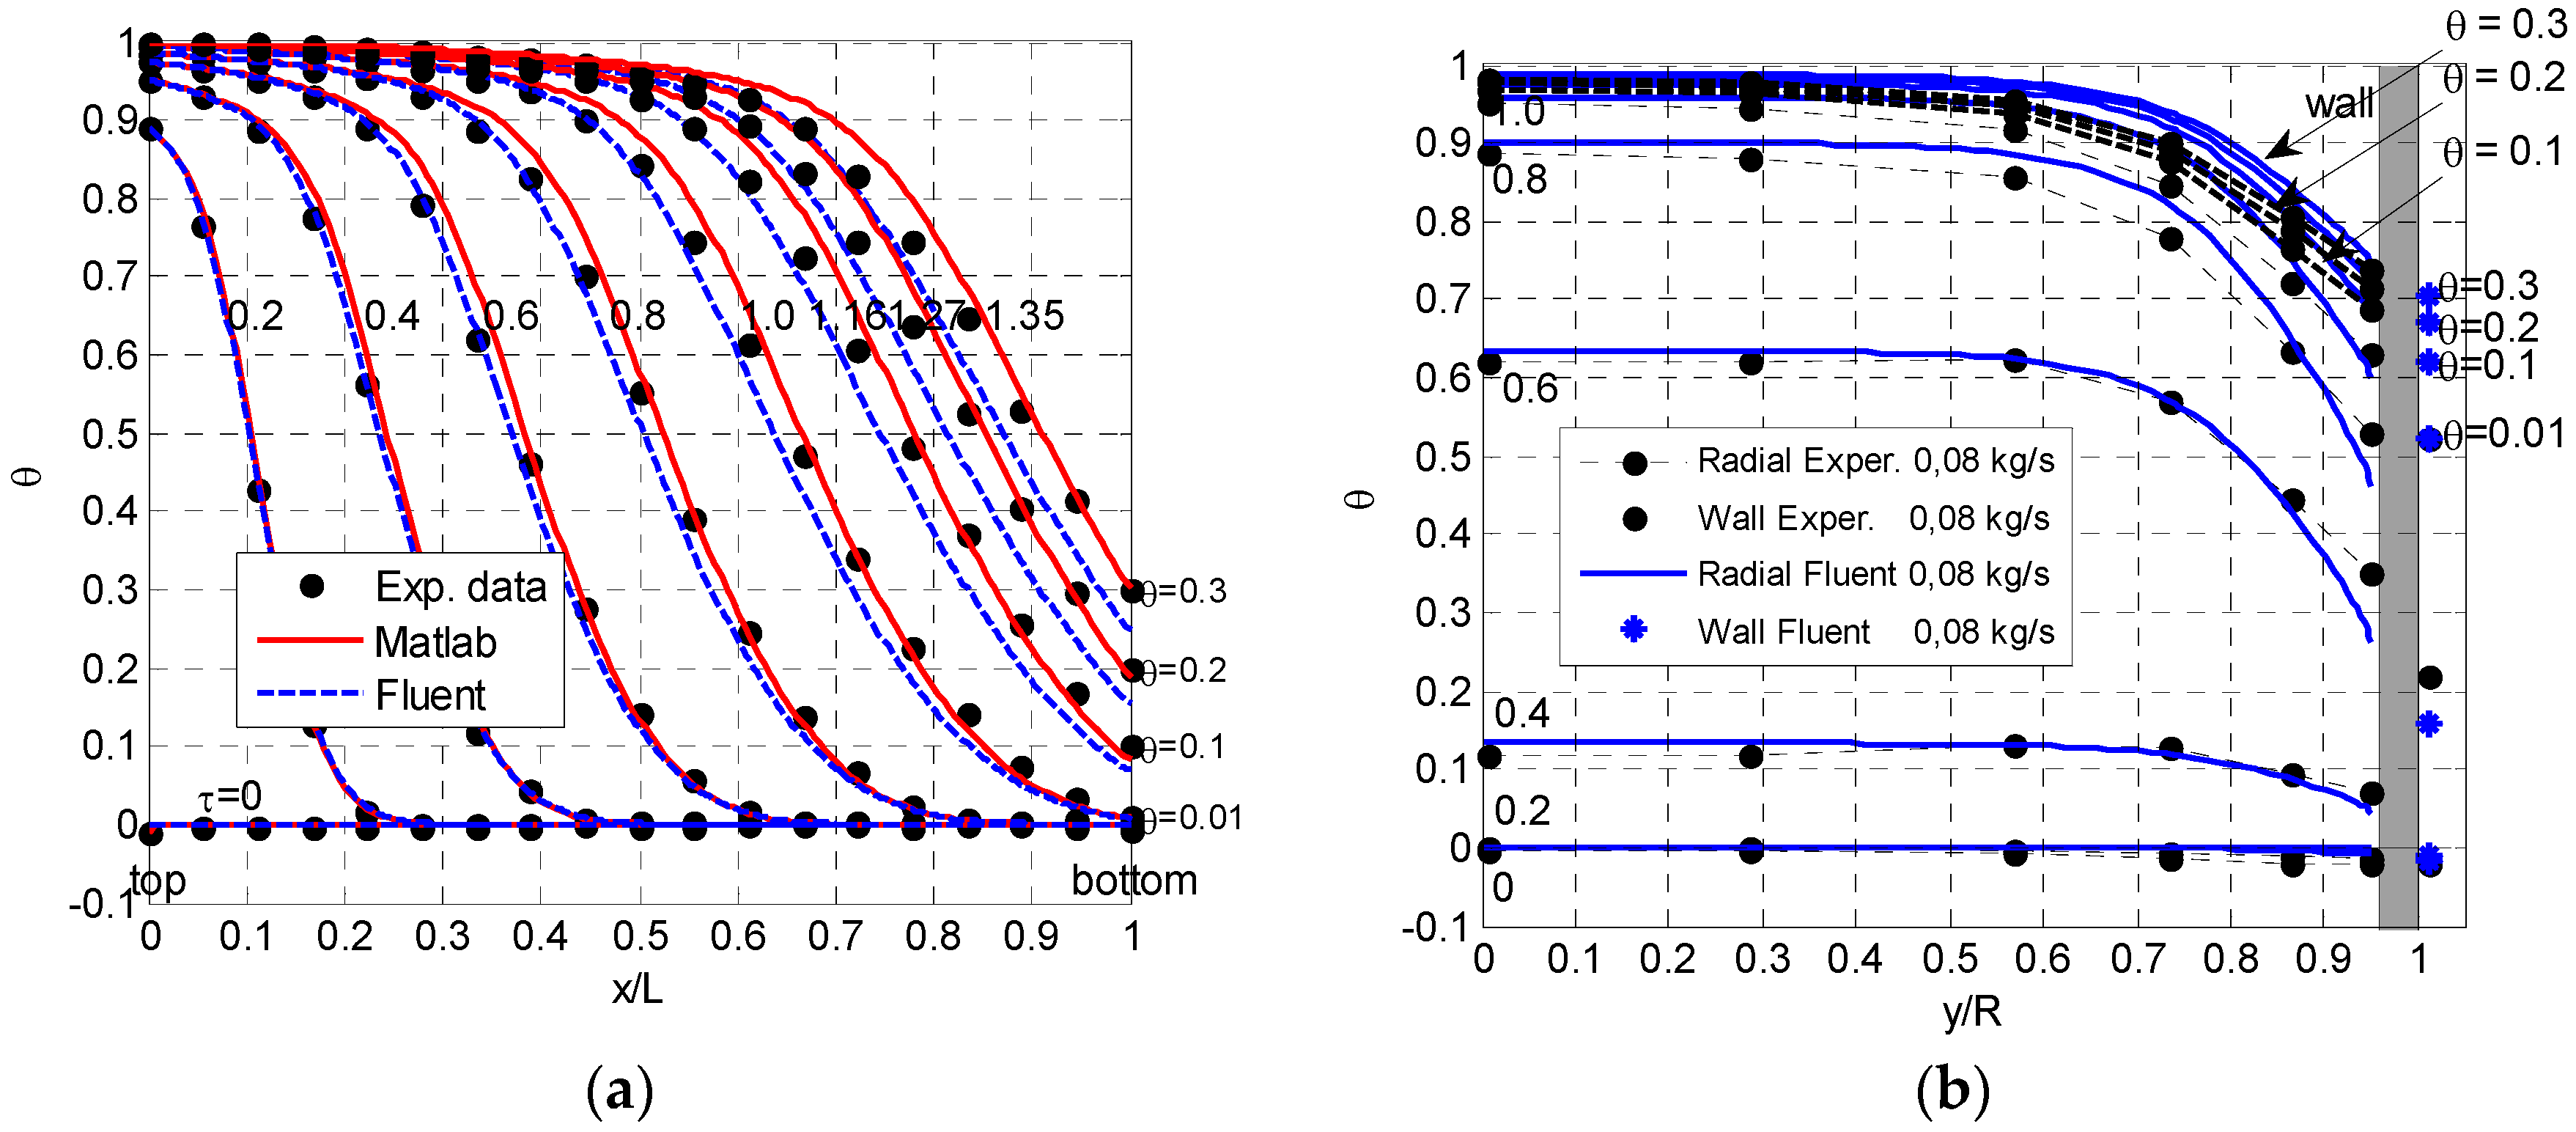
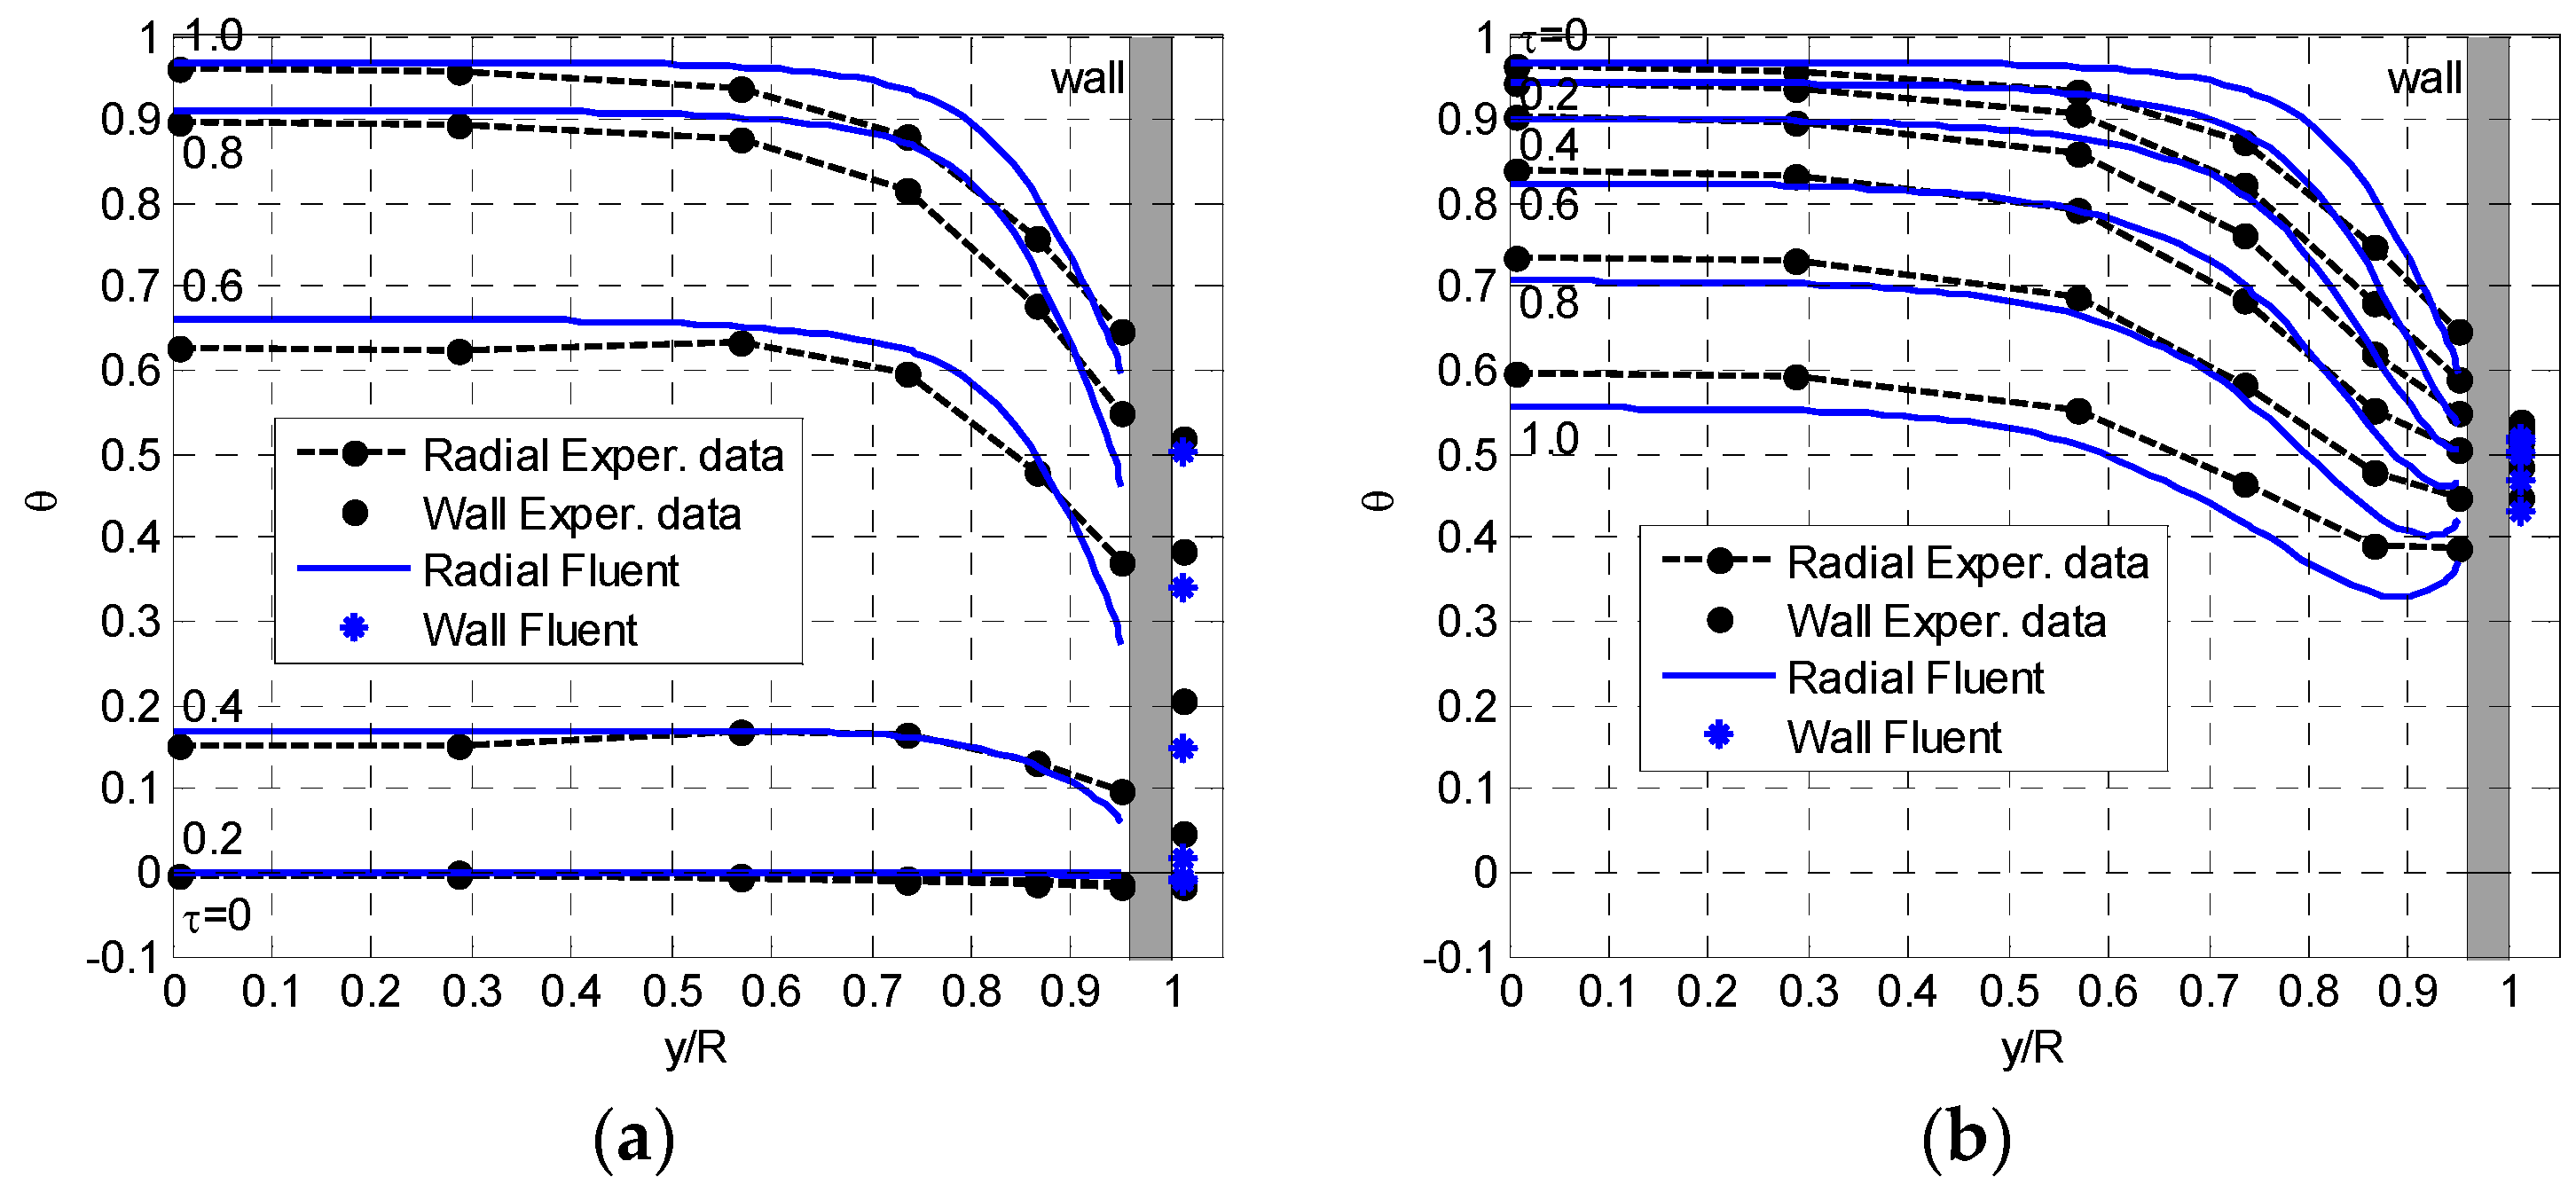
4. Experimental Analysis, Results and Discussion

Experimental tests were carried out with variation of the inlet–outlet threshold temperature and the bed aspect ratio (length over diameter ratio). Each charging phase followed a preliminary temperature stabilization of the bed by sending the air directly from the compressor to the tank. As shown in Figure 1 the air flows through valves V1 and V2 and crosses the tank from the bottom to the top before reaching the atmosphere through the vent. In this way, the porous bed is at a nearly uniform temperature at the beginning of the charging phase. Before starting this phase, the pipe connecting the heater to the tank is heated by setting valve V1 so as to link the compressor to the heater and the air is sent to the vent through valve V3. When the temperature detected by thermocouple TC (Figure 1) reaches the desired value, valve V3 is actuated to start the charging phase.
During the charging phase, the air crosses the porous bed from top to bottom, gradually heating the filling material before exiting from the bottom of the tank at a lower temperature. The region at higher temperature is located in the upper part of the bed, while the region at lower temperature is located in the lower one. A sharp thermal gradient, the so-called “thermocline”, moves downwards and splits the upper and lower parts of the bed. Figure 3a shows the temperature profiles along the axis of the reservoir obtained at different time instants and separated by 1/5 of the overall time of charge for a flow rate of 0.15 kg/s. Normalized time τ used to identify the different instants of time is defined as the ratio between the current instant of time and the overall time required for the phase of charge or discharge. Both the axial position and the temperature are reported in dimensionless form. In particular, the dimensionless temperature distribution along the axis is evaluated as follows (Equation (9)):
θ = T T m i n T m a x T m i n
where Tmax and Tmin are respectively the maximum and the minimum fluid temperature detected in the porous bed during each test. The experimental results are also compared with the numerical ones obtained with the one-dimensional model developed in Matlab-Simulink and the 2D-CFD code Ansys-Fluent.
The inlet temperature profile over time in the simulations coincides with the experimental one. The latter constraint is a necessary condition to obtain a good agreement between numerical and experimental results, as already demonstrated in a previous work [31]. In this experimental test, the charging phase ended when the dimensionless air temperature at the outlet section reached a default value of 0.025. The maximum and the minimum temperatures were 237 °C and 38 °C, corresponding to θ = 1 and θ = 0 respectively. On completion of the charging phase, the air flow is reversed and sent by the compressor to the bottom of the bed at the minimum process temperature, where it is heated by the solid material before exiting from the top of the bed. The discharging phase, carried out at the same mass flow rate as the charging phase, was completed when the dimensionless temperature dropped below the default value of 0.975 at the top of the bed. Figure 3b shows the temperature distributions along the bed at time intervals of 1/5 of the overall discharge time both for experimental investigations and numerical simulations. The starting discharging phase temperature distribution of the bed is equal to the temperature distribution at the end of the charging phase. The area between the final and initial discharging phase temperature distributions is representative of the useful energy recovered during the first charge/discharge cycle. Most of the bed is clearly not exploited and the presence of the temperature constraints avoids recovery of all the charged energy. Figure 4a shows the radial temperature distribution during the charging phase and highlights the influence of the thermal inertia of the wall. The temperature distribution along the radius is initially almost constant and equal to the minimum value. The temperature gradually increases more quickly at the center of the bed than it does near the wall. The influence of the wall extends up to about 35%–40% of the radius at the end of the charging phase.
During the discharge phase, the temperature drops more quickly along the axis than near the wall, owing to its high thermal inertia. In this case, the radial temperature is affected up to 40% of the radius (Figure 4b). In Figure 4 the experimental results are also compared with the numerical ones obtained only with the CFD software Fluent because the one-dimensional model is unable to predict bed temperature in the radial direction.
The temperature distribution along the outer wall of the tank is shown in Figure 5a for the charging phase and in Figure 5b for the discharging phase. Experimental results are again compared to the numerical ones and show a fairly good agreement. During the discharging phase, the wall temperature distribution shows a very slight variation owing to its high thermal inertia (Figure 5b). Figure 6 reports the contour plots of the temperature distribution inside the porous bed, including the wall and the flange, at different normalized times τ. Owing to the axisymmetric configuration of the model, only half of the bed between the axis and the wall of the tank is represented.
The scale temperature begins from a value below zero because the maximum and minimum temperatures refer to values detected along the axis, but lower values were detected in some parts of the domain.
Tank storage capacity can be improved by increasing threshold tolerance. This solution is clearly dependent on the temperature threshold which can be set by the user. Figure 7a,b show respectively the temperature distribution along the bed axis and in the radial direction for the dimensionless outlet temperature values of 0.01, 0.1, 0.2 and 0.3 with a mass flow rate of 0.08 kg/s. As expected, on increasing the outlet flow temperature, the energy that can be stored in the bed also increases, while the temperature distribution along the monitored radius does not change appreciably, even when the charge continues beyond the condition of θ = 0.01, which corresponds to τ = 1. For a correct comparison, Figure 7 also shows the results of numerical simulations that refer to the same time instants as in the experimental results.
Equation 10 gives the energy stored as computed in this paper. As shown in Figure 8a, the energy stored in the bed calculated with the one-dimensional model and with experimental results, is always significantly greater than that calculated with the 2D model in Fluent. This is due to the non-uniform temperature distribution along the radius. In fact, although the result obtained with the 1D model is in good agreement with the experimental one, both are based only on the values of the axial distribution of temperature but neglect the non-uniformity of temperature in the radial direction. Therefore, even if the 1D models can be confidently used with this type of TES systems, they cannot correctly predict the energy stored in presence of a strong wall influence and of a significant radial temperature gradient.
E s t o r e d = 2 π 0 L 0 D / 2 ρ S c S ( 1 ε )   ( T S ( x , y ) T 0 )   y   d y   d x
Furthermore, as reported in Figure 8b, when the temperature constraint at the outlet of the bed is removed, there is a gain in stored energy of about 30% for the one-dimensional model and up to nearly 50% for the 2D CFD model when θ = 0.3. In fact, the one-dimensional model cannot give information on radial temperature distribution and experimental results are not sufficient to obtain reliable results concerning the energy stored (an only one radius in the particle bed was instrumented). The 2-D simulation takes into account the presence of the wall and the corresponding temperature gradient along the radius, thus there is less energy stored. The temperature maps obtained from the 2-D simulations are shown in Figure 9 for different instants of time. At normalized time τ = 1.0, the dimensionless temperature θ at the exit of the bed is 0.01, while at τ = 1.16, 1.27 and 1.35 it is respectively 0.1, 0.2 and 0.3. As the temperature at the bottom of the bed increases, a greater portion of the bed rises to a higher temperature, which is indicative of a larger amount of energy stored.
Figure 10a shows the dimensionless wall temperature at the instants of time corresponding to θ of 0.1, 0.2 and 0.3 at the outlet of the bed. The influence of the wall remains unchanged with the progress of charging beyond the value of θ = 0.01 detected at the outlet section. In the upper part of the wall, which is not insulated, the temperature stabilizes at a certain point owing to thermal losses towards the outside, while the temperature continues to rise in the rest of the insulated wall.
Results from CFD simulation show good agreement and differences can be justified by the different initial condition at the wall with respect to experimental ones. Another important parameter that affects the performance in this kind of TES is the aspect ratio. Figure 10b shows the temperature distribution along the bed at the end the charging phase for two threshold values (θ = 0.01 and θ = 0.2). The aspect ratio influence was evaluated by considering three different heights of the bed during a charging phase: L = D (AR = 1), L = 2D (AR = 2) and L = 3D (AR = 3). There is a clear advantage in terms of storing capacity with a higher aspect ratio for both values of θ at the outlet section of the bed. The energy stored in the packed bed increases when the aspect ratio rises from AR = 1 to AR = 2 by 16% and by 9% from AR = 2 to AR = 3. For the condition θ = 0.2, the influence of aspect ratio on the increase of energy stored is lower. Energy increase of about 7% when the aspect ratio rises from AR = 1 to AR = 2 and 4% when the aspect ratio increases from AR = 2 to AR = 3. Finally, numerical simulations show a good agreement with experimental ones for both the outlet values of θ and confirm better results at the higher aspect ratio.

5. Conclusions

This work presents some results of an experimental investigation of a thermal energy storage system carried out at the Department of Mechanical, Chemical and Materials Engineering of the University of Cagliari. The test facility consists of an open circuit with an insulated steel tank filled with alumina beads that is used as the storage media while hot air is employed as HTF. It allows the performance of single phases and complete cycles of charge and discharge. All experimental results were compared with the numerical ones obtained with a 1-D model developed in Matlab-Simulink environment and with an axisymmetric 2-D model solved with the CFD code Ansys Fluent. In both cases, a two-equation transient model was implemented to separately calculate the fluid and solid temperatures. The Matlab model allows calculation of only the axial temperature distribution, while with the CFD model it is also possible to calculate the radial temperature distribution of the bed, which is thermally influenced by the wall. To correctly predict the transport process and heat transfer through the packed bed, a mathematical model was implemented in the UDFs. Temperature-dependent parameters for fluids and solids were implemented in both models, while the variable porosity in radial direction, the thermal losses and the solid conductivity were introduced only in the Fluent model and proved to be decisive in obtaining good agreement with experimental results and thus not negligible. The influence of some operating conditions and physical characteristics on the system performance was analyzed. A complete cycle of charge/discharge was initially carried out and highlighted that if the fluid temperature in the outlet sections is imposed for both phases, it is possible to recover only a small part of the energy stored during the phase of charge. Other tests demonstrated a better charging efficiency with higher aspect ratio values. The numerical results obtained with the different simulation models showed some differences linked to the assumptions used. The one-dimensional model built in Matlab-Simulink environment has the advantage of requiring a significantly lower amount of computing resources than the 2-D CFD model. It also provides good results on axial temperature distribution along the porous bed. The main drawback of this model is linked to its inability to provide a correct evaluation of the accumulated energy. Although a 2-D model requires greater computational effort, it allows simulation of the behavior of the whole bed and the proper calculation of the amount of energy stored by the system compared to the 1D model. Further developments should involve the analysis of the system under repeated charge and discharge cycles, in order to verify the storage capacity of the porous bed when operating conditions are closer to the real ones.

Acknowledgments

This work was supported in the framework of the research project “Modelling control and testing of innovative thermal energy storage systems” funded by the Sardinia Regional Government, L.R. 7/2007 “Promotion of scientific research and technology innovation in Sardinia”, project n° CRP-60193/2012.

Author Contributions

All the authors contribute extensively to the work presented in the paper. In particular: Mario Cascetta and Simone Arena mainly developed the two-dimensional model, Fabio Serra and Efisio Casti mainly performed experiments and analyzed data. Giorgio Cau, responsible for the laboratory, and Pierpaolo Puddu conceived and designed the experiments and the computational tasks. In addition, and Mario Cascetta and Fabio Serra developed the one-dimensional model with the support of Pierpaolo Puddu. All authors contributed to the analysis of the results. According to their specialization, each author wrote a part of the article, which in substance has been finally rewritten and reviewed with the contribution of all the authors in equal measure.

Conflicts of Interest

The authors declare no conflict of interest.

References

  1. Kousksou, T.; Bruel, P.; Jamil, A.; ElRhafiki, T.; Zeraouli, Y. Energy storage: Applications and challenges. Sol. Energy Mater. Sol. Cells 2014, 120, 59–80. [Google Scholar] [CrossRef]
  2. Tian, Y.; Zhao, C.Y. A review of solar collectors and thermal energy storage in solar thermal applications. Appl. Energy 2013, 104, 538–553. [Google Scholar] [CrossRef] [Green Version]
  3. Barbour, E.; Mignard, D.; Ding, Y.; Li, Y. Adiabatic Compressed air energy storage with packed bed thermal energy storage. Appl. Energy 2015, 155, 804–815. [Google Scholar] [CrossRef]
  4. Laguerre, O.; Ben, S.; Alvarez, G.; Flick, D. Transient heat transfer by free convection in a packed bed of spheres: Comparison between two modelling approaches and experimental results. Appl. Therm. Eng. 2008, 28, 14–24. [Google Scholar] [CrossRef]
  5. Du Toit, C.G.; Rousseau, P.G.; Greyvenstein, G.P.; Landman, W.A. A systems CFD model of a packed bed high temperature gas-cooled nuclear reactor. Int. J. Ther. Sci. 2006, 45, 70–85. [Google Scholar] [CrossRef]
  6. Souza, G.F.M.V.; Miranda, R.F.; Lobato, F.S.; Barrozo, M.A.S. Simultaneous heat and mass transfer in a fixed bed dryer. Appl. Therm. Eng. 2015, 90, 38–44. [Google Scholar] [CrossRef]
  7. Afandizadeh, S.; Foumeny, E.A. Design of packed bed reactors: Guides to catalyst shape, size, and loading selection. Appl. Therm. Eng. 2001, 21, 669–682. [Google Scholar] [CrossRef]
  8. Singh, S.; Dhiman, P. Exergoeconomic analysis of recyclic packed bed solar air heater-sustained air heating system for buildings. J. Energy Storage 2016, 5, 33–47. [Google Scholar] [CrossRef]
  9. Mehling, H.; Cabeza, L.F. Heat and Cold Storage with PCM; Springer: Heidelberg, Germany, 2008. [Google Scholar]
  10. Singh, H.; Saini, R.P.; Saini, J.S. A review on packed bed solar energy storage systems. Renew. Sustain. Energy Rev. 2010, 14, 1059–1069. [Google Scholar] [CrossRef]
  11. Sharma, A.; Tyagi, V.V.; Chen, C.R.; Buddhi, D. Review on thermal energy storage with phase change materials and applications. Renew. Sustain. Energy Rev. 2009, 13, 318–345. [Google Scholar] [CrossRef]
  12. Cot-Gores, J.; Castell, A.; Cabeza, L.F. Thermochemical energy storage and conversion: A state of the art review of the experimental research under practical conditions. Renew. Sustain. Energy Rev. 2012, 16, 5207–5224. [Google Scholar] [CrossRef]
  13. Fernandes, D.; Pitié, F.; Cáceres, G.; Baeyens, J. Thermal energy storage: How previous findings determine current research priorities. Energy 2012, 39, 246–257. [Google Scholar] [CrossRef]
  14. Kuravi, S.; Trahan, J.; Goswami, D.Y.; Rahman, M.M.; Stefanokos, E.K. Thermal energy storage technologies and systems for concentrating solar power plants. Prog. Energy Combust. Sci. 2013, 39, 285–319. [Google Scholar] [CrossRef]
  15. Zanganeh, G.; Pedretti, A.; Haselbacher, A.; Steinfeld, A. Design of packed bed thermal energy storage systems for high-temperature industrial process heat. Appl. Energy 2015, 137, 812–822. [Google Scholar] [CrossRef]
  16. Hänchen, M.; Brückner, S.; Steinfeld, A. High-temperature thermal storage using a packed bed of rocks—Heat transfer analysis and experimental validation. Appl. Therm. Eng. 2011, 31, 1798–1806. [Google Scholar] [CrossRef]
  17. Zavattoni, S.A.; Barbato, M.C.; Pedretti, A.; Zanganeh, A.; Steinfeld, A. High temperature rock-bed TES system suitable for industrial-scale CSP plant—CFD analysis under charge/discharge cyclic conditions. Energy Procedia 2014, 46, 124–133. [Google Scholar] [CrossRef]
  18. Zanganeh, G.; Pedretti, A.; Zavattoni, S.; Barbato, M.; Steinfeld, A. Packed-bed thermal storage for concentrated solar power—Pilot-scale demonstration and industrial-scale design. Sol. Energy 2012, 86, 3084–3098. [Google Scholar]
  19. Anderson, R.; Shiri, S.; Bindra, H.; Morris, J.F. Experimental results and modeling of energy storage and recovery in a packed bed of alumina particles. Appl. Energy 2014, 119, 521–529. [Google Scholar] [CrossRef]
  20. Andreozzi, A.; Buonomo, B.; Manca, O.; Mesolella, P. Numerical investigation on sensible thermal energy storage with porous media for high temperature solar systems. J. Phys. Conf. Ser. 2012, 395, 12–15. [Google Scholar] [CrossRef]
  21. Andreozzi, A.; Buonomo, B.; Manca, O.; Tamburrino, S. Thermal energy storages analysis for high temperature in air solar systems. Appl. Therm. Eng. 2014, 71, 130–141. [Google Scholar] [CrossRef]
  22. Bruch, A.; Fourmiguè, J.; Couturier, R. Experimental and numerical investigation of a pilot-scale thermal oil packed bed thermal storage system for CSP power plant. Sor. Energy 2014, 105, 116–125. [Google Scholar] [CrossRef]
  23. Bruch, A.; Fourmigue, J.F.; Couturier, R.; Molina, S. Experimental and numerical investigation of stability of packed bed thermal energy storage for CSP power plant. Energy Procedia 2014, 49, 743–751. [Google Scholar] [CrossRef]
  24. Xu, C.; Li, X.; Wang, Z.; He, Y.; Bai, F. Effects of solid particle properties on the thermal performance of a packed-bed molten-salt thermocline thermal storage system. Appl. Therm. Eng. 2013, 57, 69–80. [Google Scholar] [CrossRef]
  25. Yang, Z.; Garimella, S.V. Thermal analysis of solar thermal energy storage in a molten-salt thermocline. Sol. Energy 2010, 84, 974–985. [Google Scholar] [CrossRef]
  26. Nithyanandam, K.; Pitchumani, R.; Mathur, A. Analysis of a latent thermocline storage system with encapsulated phase change materials for concentrating solar power. Appl. Energy 2014, 113, 1446–1460. [Google Scholar] [CrossRef]
  27. Bellan, S.; Gonzalez, J.; Romero, M.; Rahman, M.M.; Goswami, D.Y.; Stefanakos, E.K.; Couling, D. Numerical analysis of charging and discharging performance of a thermal energy storage system with encapsulated phase change material. Appl. Therm. Eng. 2014, 71, 481–500. [Google Scholar] [CrossRef]
  28. Bindra, H.; Bueno, P.; Morris, J.F.; Shinnar, R. Thermal analysis and exergy evaluation of packed bed thermal storage systems. Appl. Therm. Eng. 2013, 52, 255–263. [Google Scholar] [CrossRef]
  29. Zanganeh, G.; Commerford, M.; Haselbacher, A.; Pedretti, A.; Steinfeld, A. Stabilization of the outflow temperature of a packed-bed thermal energy storage by combining rocks with phase change materials. Appl. Therm. Eng. 2014, 70, 316–320. [Google Scholar] [CrossRef]
  30. Cascetta, M.; Cau, G.; Puddu, P.; Serra, F. Experimental investigation of a packed bed thermal energy storage system. J. Phys. Conf. Ser. 2015, 655, 12–18. [Google Scholar] [CrossRef]
  31. Cascetta, M.; Cau, G.; Puddu, P.; Serra, F. A study of a packed-bed thermal energy storage device: Test rig, experimental and numerical results. Energy Procedia 2015, 81, 987–994. [Google Scholar] [CrossRef]
  32. Touloukian, Y.S. Thermophysical Properties of High Temperature Solid Materials; Macmillan: London, UK, 1967. [Google Scholar]
  33. Kunii, D.; Smith, J.M. Heat transfer characteristics of porous rocks. AIChE J. 1960, 6, 71–78. [Google Scholar] [CrossRef]
  34. Cascetta, M.; Cau, G.; Puddu, P.; Serra, F. A comparison between CFD simulation and experimental investigation of a packed-bed thermal energy storage system. Appl. Therm. Eng. 2016, 98, 1263–1272. [Google Scholar] [CrossRef]
  35. Nield, D.A.; Bejan, A. Convection in Porous Media, 3rd ed.; Springer-Verlag: New York, NY, USA, 2006. [Google Scholar]
Figure 1. Simplified schematic of the test rig.
Energies 09 00758 g001
Figure 2. Boundary conditions of CFD model (a) charging phase (b) and discharging phase.
Energies 09 00758 g002
Figure 3. (a) Axial temperature distribution at the mass flow rate of 0.15 kg/s during charging phase (τ = 1 for 4705 s); (b) Axial temperature distribution at the mass flow rate of 0.15 kg/s during discharging phase (τ = 1 for 1995 s).
Energies 09 00758 g003
Figure 4. (a) Radial temperature distribution with mass flow rate of 0.15 kg/s during charging phase; (b) Radial temperature distribution with mass flow rate of 0.15 kg/s during discharging phase.
Energies 09 00758 g004
Figure 5. (a) Wall temperature distribution for a mass flow rate of 0.15 kg/s during charging phase; (b) Wall temperature distribution for a mass flow rate of 0.15 kg/s during discharging phase.
Energies 09 00758 g005
Figure 6. Fluid temperature contour plots in the porous bed.
Energies 09 00758 g006
Figure 7. Fluid temperature profiles for different outlet temperatures with a mass flow rate of 0.08 kg/s (τ = 1 for 8760 s); (a) Axial temperature profiles (b) Radial temperature profiles.
Energies 09 00758 g007
Figure 8. (a) Stored energy over maximum storable in % (Due to the radial temperature profile, the prediction of stored energy is overestimated when 1D model or experimental results are used); (b) Gain of stored energy for different values of θ at the outlet.
Energies 09 00758 g008
Figure 9. Temperature contour plots of the porous bed at different intervals of the overall time of charge up to θ = 0.3.
Energies 09 00758 g009
Figure 10. (a) Wall temperature distribution for θ up to 0.3 at the outlet section; (b) Influence of aspect ratio on axial temperature profile.
Energies 09 00758 g010
Table 1. Technical data of rig components.
ComponentsValues
Compressor delivered flow255–940 m3/h, FAD
Electrical heater max. power70 kW
Maximum air temperature300 °C
Bed height1.8 m
Bed diameter0.58 m
Alumina bead diameter7–9 mm
Alumina bead thermal conductivity (100 °C)30 W/mK
Alumina bead density3550 kg/m3
Alumina bead heat capacity (100 °C)902 J/kgK
Bed void fraction0.385–0.395
Tank coating thickness (Mineral wool)100 mm

