1. Introduction
The European Union (EU) strongly pursues the reduction of greenhouse gas (GHG) emissions in order to implement the Kyoto Protocol commitments, with a final target of 20% per year emissions saved by 2020 [
1,
2]. For this purpose, a better use of energy in urban areas assumes a crucial role, since they are responsible for almost 80% of total GHG emissions but, at the same time, they play a crucial role in the safeguarding of the environment and in creating more resilient urban conditions [
3].
The EU project CELSIUS (Combined Efficient Large Scale Integrated Urban Systems) aims to demonstrate the possibility of boosting energy efficiency through the smart integration of urban systems. District heating and cooling (DHC) can be enhanced by a smart waste energy recovery strategy involving different categories of plants and cities. Thus, 12 demonstration projects, covering the most major aspects of innovative urban heating and cooling for a smart city, were delivered in Gothenburg, Cologne, London, Rotterdam, and Genoa [
4].
The CELSIUS project is a co-funded project by European Union’s Seventh Framework Programme for research, technological development, and demonstration (grant agreement No. 314441) in the framework of smart cities projects. It supports the achievement of EU’s 20–20–20 goals by helping cities address energy resilience and security, energy poverty, as well as reducing GHG emissions [
5,
6,
7,
8]. By creating resilient low carbon energy system, Celsius cities will be able to support the energy needs and demands for citizens as well as contribute to the mitigation of climate change. An important part of the CELSIUS demonstration projects is devoted to show how cities can become more energy efficient by using the potential of DHC systems to capture and exploit the wide range of waste heat sources—heat being produced within the city and not being used, but just discharged into the local environment—that are available within cities [
9].
There is ever-increasing urgency for Europe to make the transformation to a low-carbon and resource-efficient economy to meet climate and energy security targets and, more importantly, to avoid catastrophic climate change. The important challenge is represented by the huge amount of waste or secondary energy generated but not captured. Waste heat produced in the EU would actually be sufficient for heating the EU’s entire building stock. At the same time, there is just not the heating distribution grid available to transfer it to where it is demanded, thus making it unusable. Therefore, it is currently necessary to demonstrate and develop innovative technologies capable of raising the recovery of waste energy. In addition, it is crucial to define, implement, and test business models that evaluate an agreed fair price, for example, in respect to industrial waste heat providers, delivering waste heat to a network or a final user.
The CELSIUS project will have 12 new demonstration projects and, in addition, 20 existing ones in Cologne, Genoa, Gothenburg, London, and Rotterdam. These cities will evaluate and apply the technical, social, and economic feasibility of the CELSIUS vision and concept and will use the experience and learning to compile a competitive and energy-efficient CELSIUS urban heating and cooling concept. The aim is that the product of the CELSIUS project, a toolbox, will then be able to support any city in Europe to maximize the utilization of its primary and secondary energy resources in an integrated way that minimizes its operational costs and carbon emissions whilst maximizing its energy efficiency.
In the case of Genoa, the crucial component of the demonstrator (named GE1 from now on, according to the nomenclature of the CELSIUS project) is a turbo expander (TE) that allows exploitation of the pressure drop between the natural gas national distribution line and the local one, producing electricity in a competitively clean way if compared to other technologies [
10]. This kind of technology is nowadays quite diffuse and considered (see e.g., [
11,
12,
13]), and its feasibility also makes it an important choice for developing countries or countries which suffer power crises [
14,
15,
16]. This waste energy recovery process has been successfully applied in several industrial sites [
17,
18]. The preheating of the natural gas and the sizing of the turbo expander are the main issues to be tackled in order to make a proper use of this technology [
19]. Several studies exist about thermoeconomic assessment of these systems, which are usually integrated with boilers or cogeneration units [
20,
21], and were also proposed as a hybrid solution coupled with natural gas running molten carbonate fuel cell used as preheater [
22]. Finally, the proper optimal functioning of such plants is necessarily subordinated to a certain level of energetic forecasting [
23] that usually relies upon the dynamic modeling of the different plant components [
24].
2. The Genoa Demonstrator
The demonstrator is installed in the industrial district of Genoa Gavette, located in the northern part of the city (latitude: 44.435; longitude: 8.959). The area includes different industrial activities, residential buildings, and offices. From the energy point of view, the whole district requires a high amount of heat and a certain electrical demand throughout the year. The industries’ activities of the area concern natural gas (NG) distribution and, specifically, a substation for NG expansion.
Natural gas is one of the most abundant and clean resources available on the planet (even though some geopolitical and environmental aspects could influence its availability [
25]), and is considered by the International Energy Agency to be one of the most promising fossil fuels, which analysts foresee as remaining dominant over the next decades for the world’s energy demand [
26].
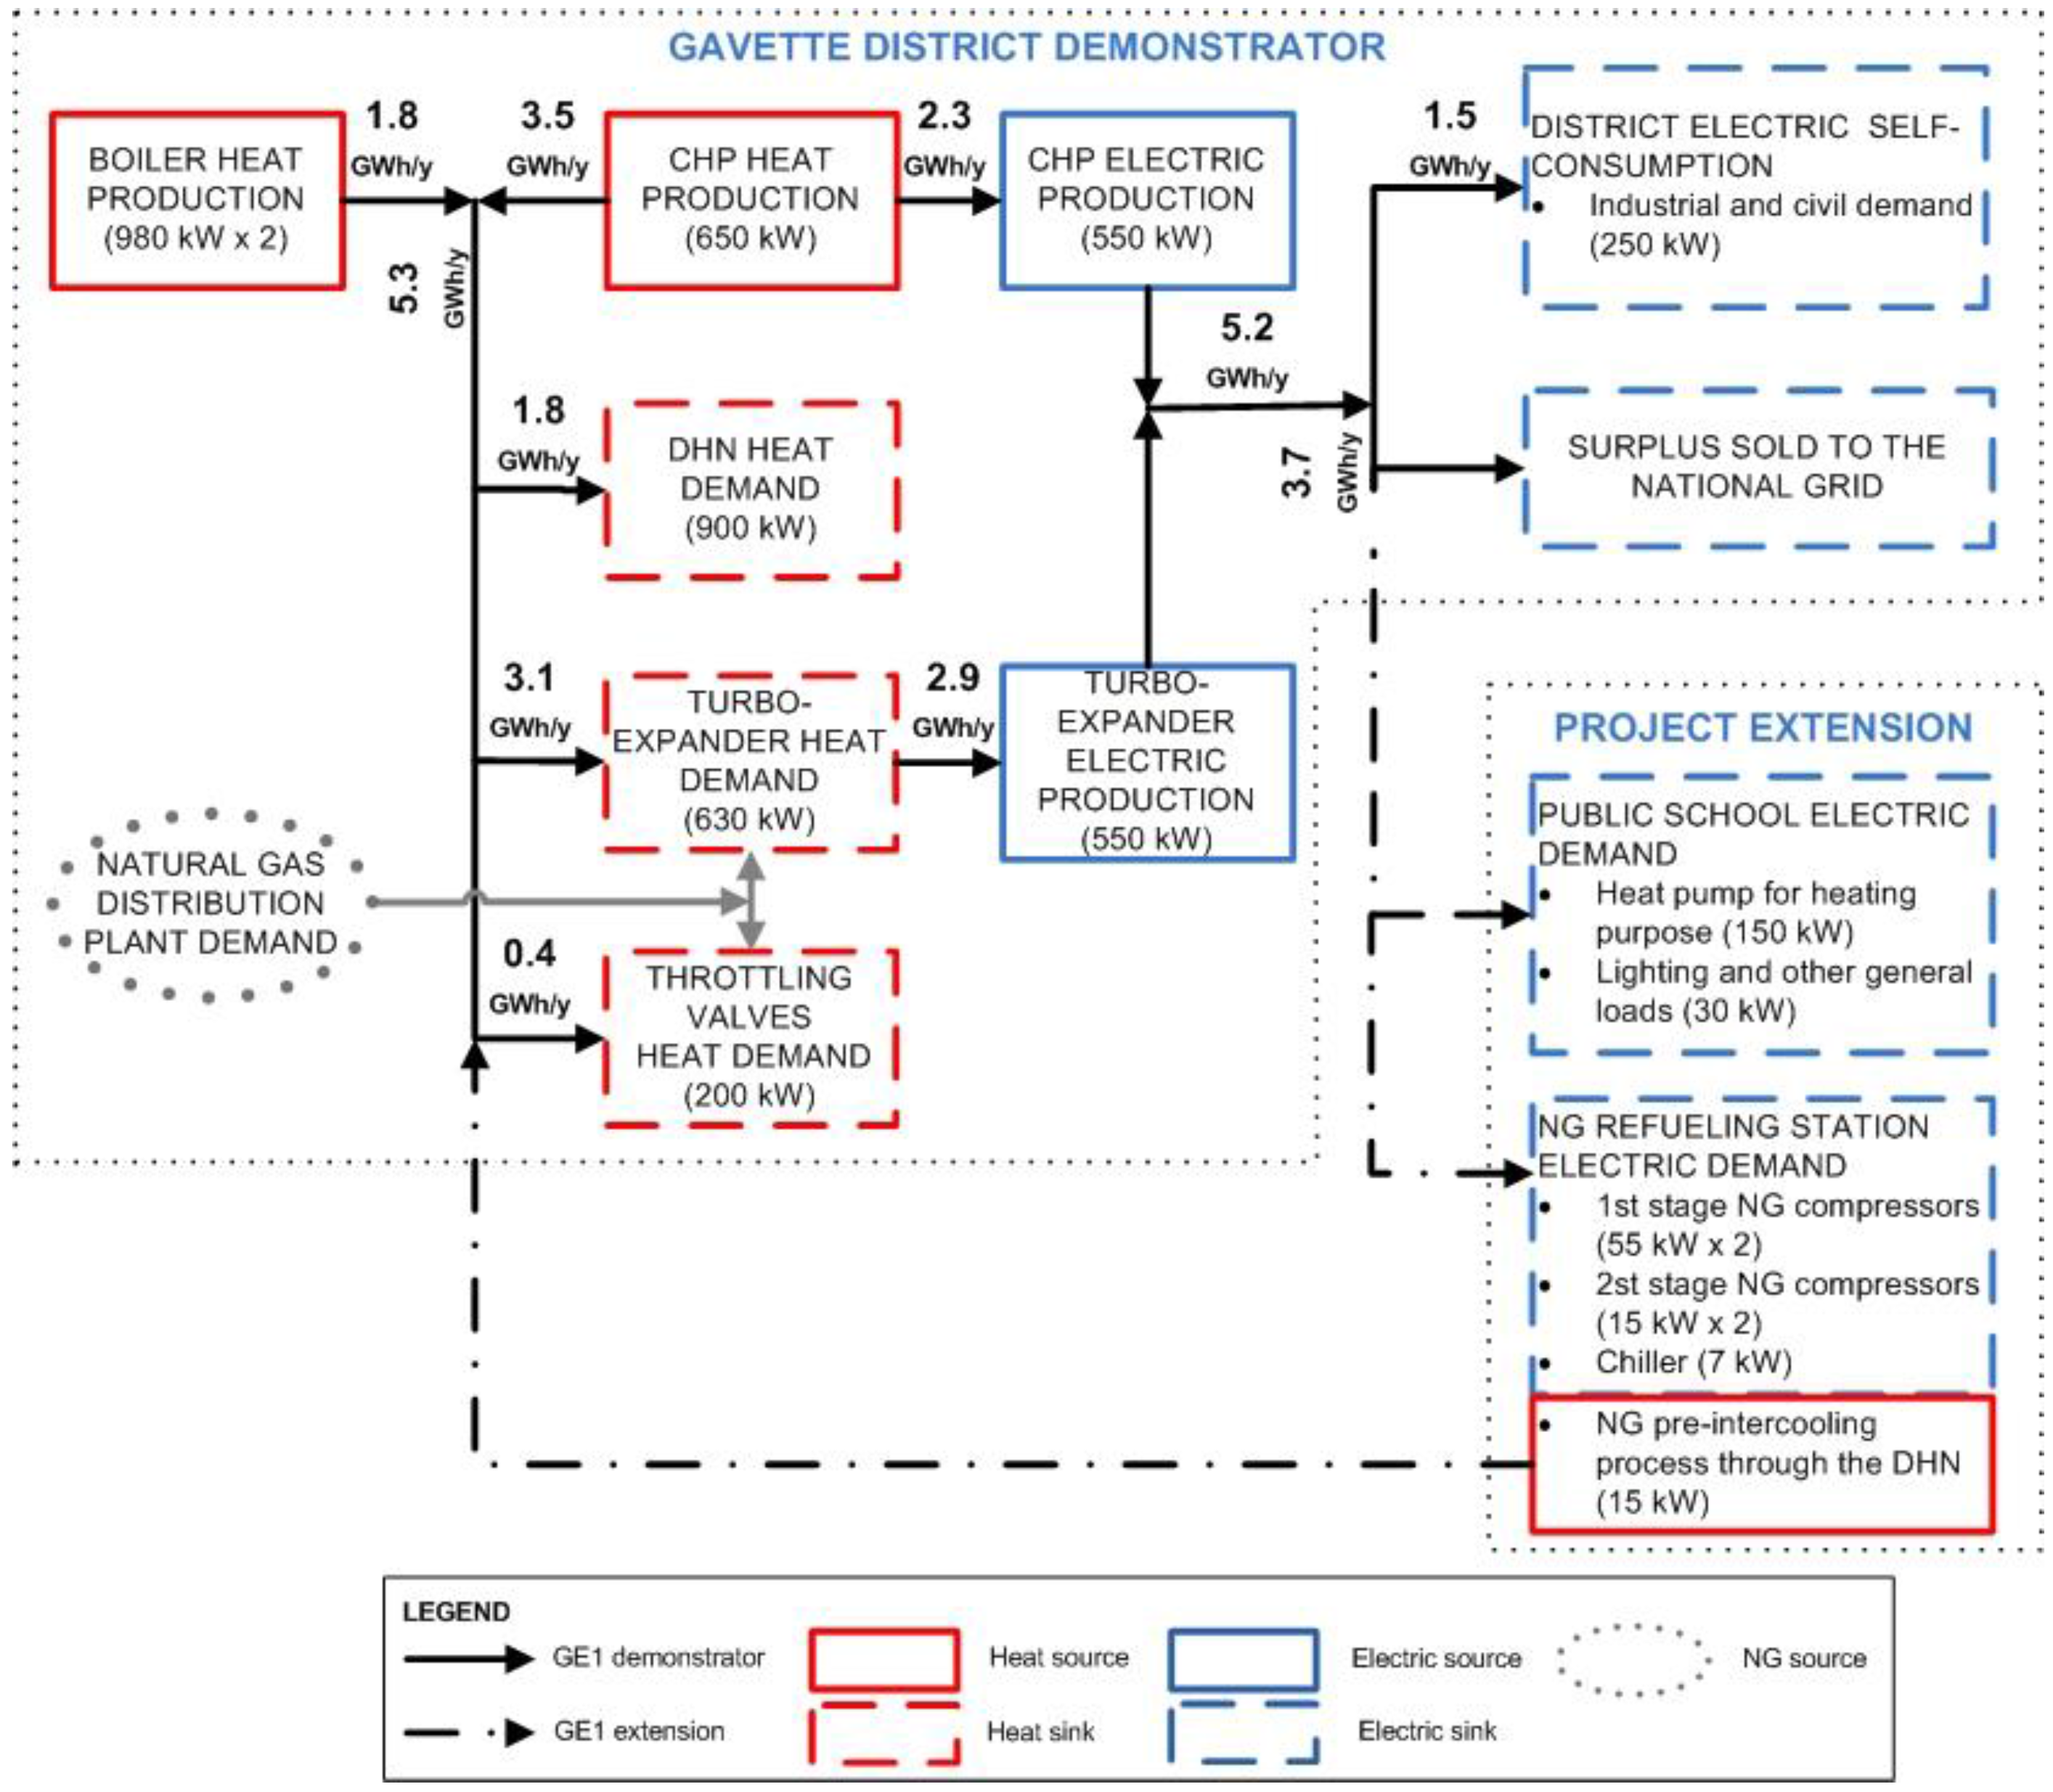
The Genoa’s demonstrator will promote improvements along the entire energy chain: from production through distribution to the final users. The project primarily includes the expansion of a district heating network (DHN), which will be powered by a high-efficiency combined heat and power (CHP) unit. In second place, but not least, it will be installed in a TE, an innovative system capable of converting the energy contained in the natural gas under pressure and converting it in electricity.
The high concentration of electric energy production, as described in the following paragraphs, provides the economic basis for a possible innovative improvement of the systems.
2.1. Overview of the Demonstrator
Indeed, the way in which CELSIUS promotes good practice for energy savings and CO2 footprint reduction is the realization of plants that demonstrate and confirm innovative technologies with renewable and waste energies. The demonstrator is located in a district equipped with an internal network for distribution of low-voltage electricity and a hot water DHN.
The electrical consumption, 250 kW at its peak and about 1.5 GWh/y, is mainly due to lighting of indoor and outdoor environments and the feeding of numerous offices in the area. The heat is instead necessary for different scopes: the buildings’ heating and the production of sanitary hot water, for approximately 900 kW and 1.8 GWh/y, and for industrial purpose in the NG expansion process.
In the NG expansion plant, the fluid is withdrawn from the national transport network at a pressure of 24 barg; it is then processed in order to reduce the pressure down to 5 barg, for its distribution at the city level. The expansion plant is designed to process a maximum of 60,000 Sm3/h of NG, and the flow rate of the gases is very variable: high in the winter and low in summer, and affected by the different types of uses of the fuel that in Genoa is mostly used for cooking and heating.
The expansion process, in conventional plants, uses throttling valves, which dissipate the pressure energy contained in the NG, and needs a substantial amount of heat. In the plant at issue, the pressure reduction, by means of the valves, involves a lowering of the gas temperature by about 10 °C and a subsequent heat demand of about 22.1 kJ for every kg of NG processed.
Within the CELSIUS project, a TE—placed in parallel to the throttling valves—is able, using a high amount of heat, to convert part of the mechanical energy of the gas into electricity that can be both consumed by users of the district or sold to the national electric market [
27,
28].
The nameplate capacity of the TE is 550 kWel. The flow rate, at the design point, is 22,500 Sm3/h, a value that is slightly lower than the average hourly flow rate of the plant, corresponding to a minimum flow rate of about 3500 Sm3/h, thus ensuring that the machine also operates when the NG demand is low.
The expansion process would result in an excessive reduction of the temperature of the expanded gas affecting the safety of the plant, thus throughout the NG expansion plant the fluid must be suitably preheated. The gas expansion through the TE results in a temperature reduction around 70 °C, which implies a heat consumption between 145 and 155 kJ per kg of NG processed. It can be immediately note that the expansion through TE appears much more expensive, in terms of heat, with respect to the throttling process, but it is also clear that the turbo-expansion process is able to produce between 100 and 125 kJ of electricity for each kg of NG processed, increasing the overall efficiency of the entire system.
Besides, a CHP unit is added into the thermal network, connected in series to the existing boilers, in order to improve the effectiveness of the whole process [
21,
29]. The CHP chosen is an internal combustion turbocharged engine, fueled with NG, capable of delivering, in nominal conditions, 550 kW
el and to recover about 630 kW
th from the engine cooling system, the intercooling process and the exhausts.
The users’ and the suppliers’ thermal and electric loads are strongly linked one to each other, and for this reason it is particularly interesting to observe the energy aspects of the demonstrator by means of numerical thermodynamic models, such as ones developed in Matlab-Simulink [
30]. A full description of the results obtained are present in [
31].
The main aspects regarding the energy demand of the users and the thermal and electrical output of the production units are listed below:
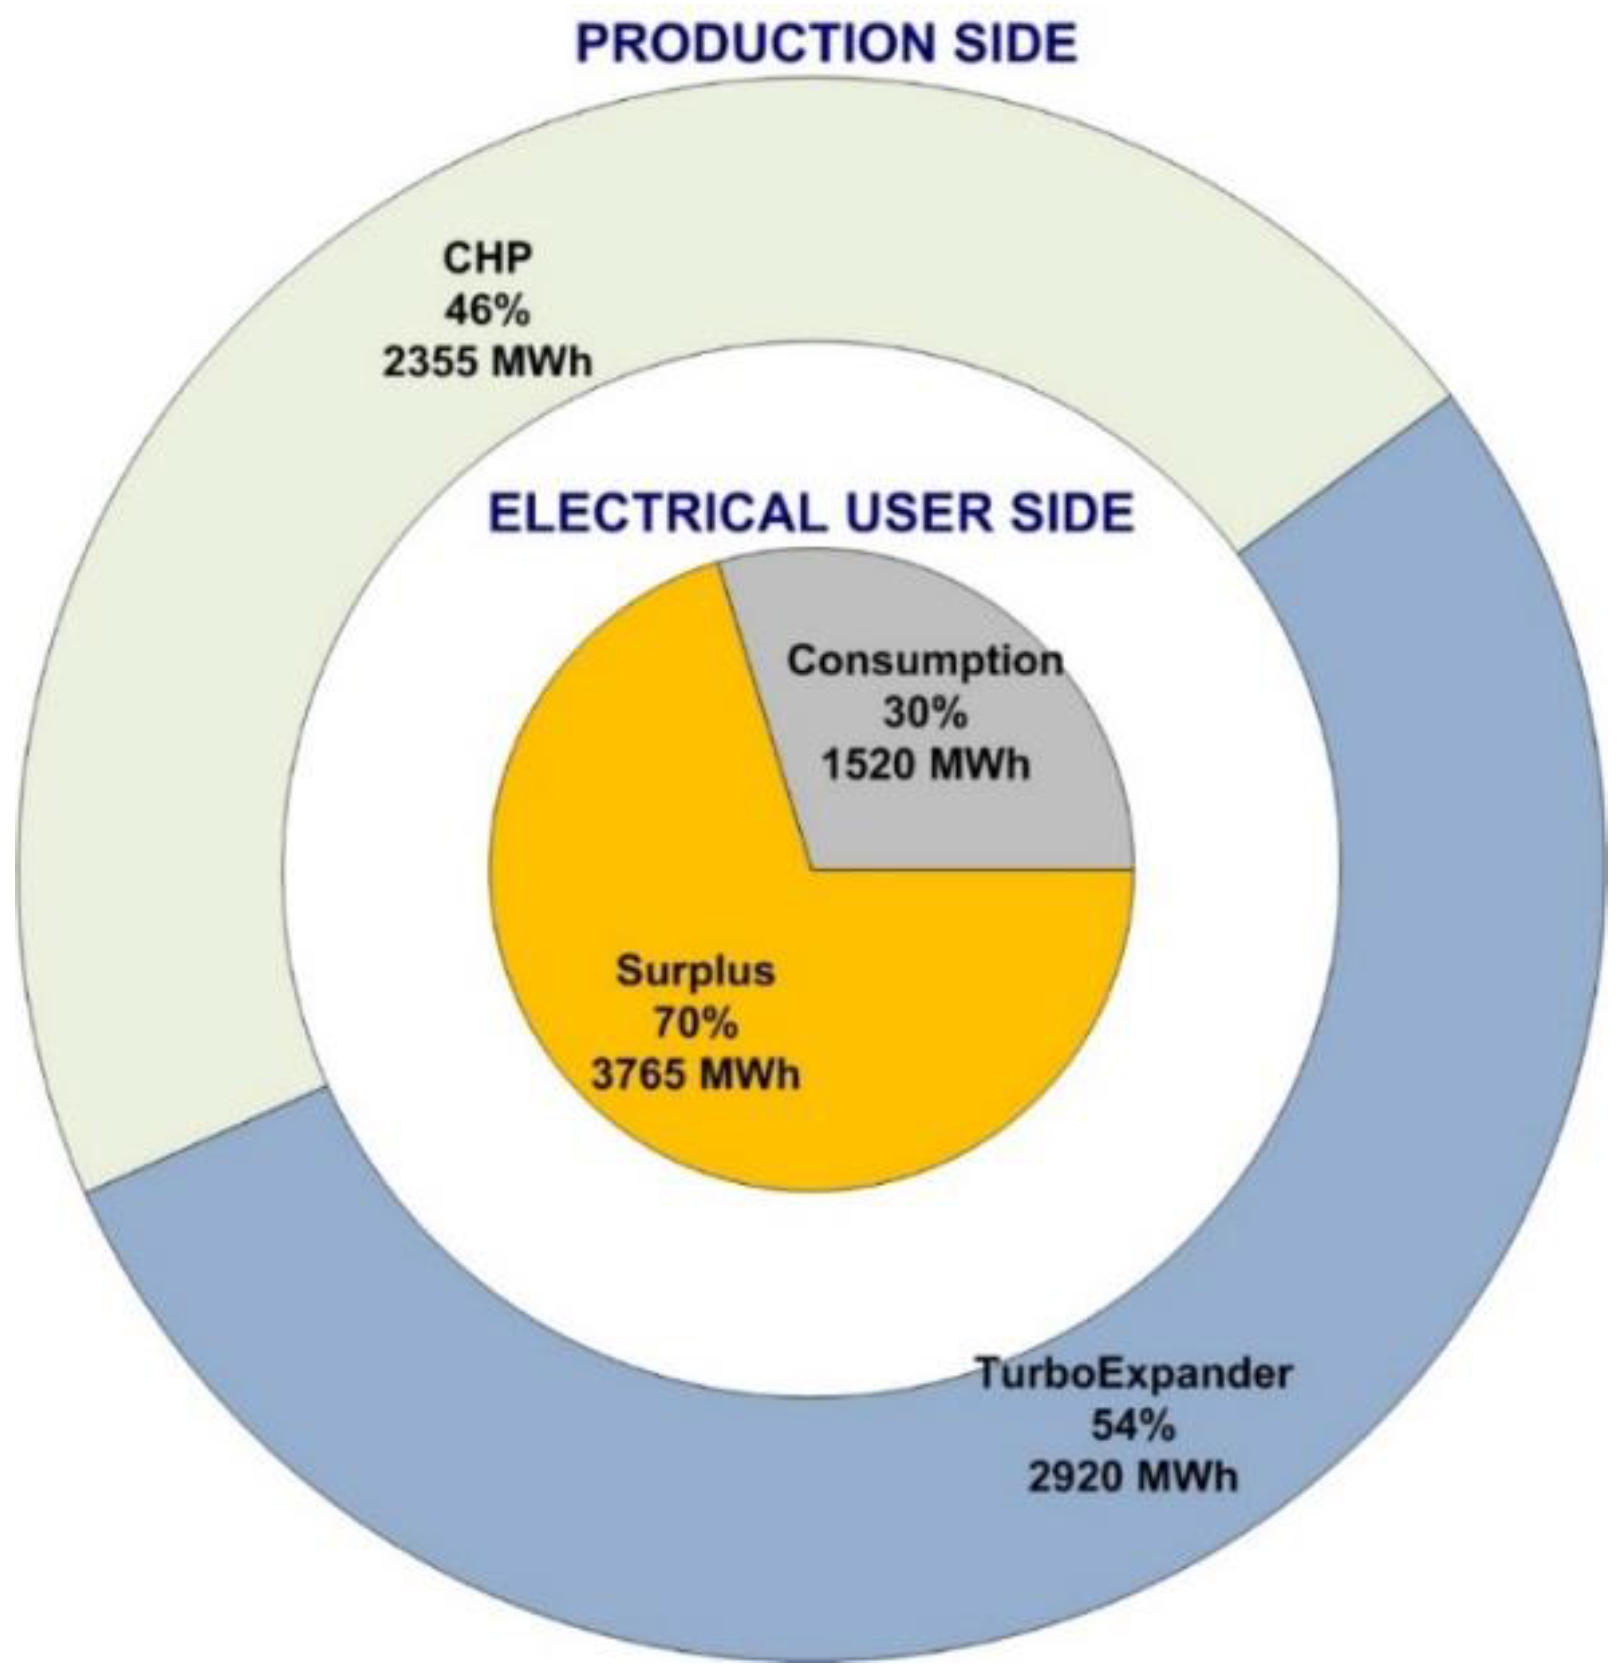
the whole electrics units can produce about 5.2 GWh
el/y, and 46% of that is produced by the CHP with the remaining 54% produced by the TE (
Figure 1);
the whole district needs about 1.5 GWhel/y, about the 30% of the total yearly production and the electric surplus is about 3.7 GWhel/y, 70% of which is generated during the heating season;
the whole district need about 5.3 GWhth/y per year, and 58% of that is supplied to the TE gas pre-heating system;
the TE produces about 2.9 GWhel/y using about 3.1 GWhth/y, indicating an average conversion efficiency above 90%;
if the two electric units, CHP and TE in series, are viewed as a single machine, the new production unit is capable of supplying 1.1 MWel with overall fuel conversion efficiency of over 80%.
2.2. Overview on the Demonstrator Extensions
A further step to improve the exploitation of wastes is the careful evaluation of the energy production of the demonstrator, which can be interesting to evaluate for additional potential end-users. As described above the demonstrator is able to produce electricity with high efficiency, with the current configuration such that only 30% of it would be consumed by the district. The remainder would be sold to the national grid with low economical returns. The sale of part of the electricity surplus, at prices close to those obtained from the sale to the national grid, to new users would not result in a loss to the economic budget of the plant but would lead to obvious savings to the connected users.
For this purpose, two different end-users have been identified: a public school and an NG station for private and public vehicles fueling; an energy flow diagram of the demonstrator upgraded by the extension is schematically shown in
Figure 2.
The public school is an old building, located in the north of the demonstrator area; a conventional, natural-gas-fired boiler feeds the heating system of the building; on the other hand, the electricity demand of the school, mainly related to the lighting system, is fed by the electrical national grid.
The refueling station (RS) picks up the NG from the 24 barg high-pressure national network, and raises the gas pressure up to 220 barg, which is the pressure level that is required to ensure a good fuel refilling of the tanks of motor vehicles. Compressors and all the others auxiliaries are powered by electricity purchased from the national electric grid. Since the compression process increases the NG temperature, the fluid is refrigerated to maximize the amount of gas stored in the intermediate tanks reservoir.
The most promising technical solutions, which are singled out to improve the whole energy chain, are:
covering the school and RS electricity demand by means of the energy produced by the demonstrator;
upgrading the thermal production system of the school using a heat pump integrated with the boiler;
recovering waste heat from the NG intercooling process in the RS using the return water of the DHN.
3. Extension of the Project to a Public School
Primary and secondary schools are one of those kinds of public buildings which are uniformly sparse in many area of the town. For this reason, they are one of the best users which are eligible to be selected as end-users of small and low-range district heating networks. Furthermore, schools are characterized by a common pattern of heat and electricity demand and this increases the replicability of the energy-saving actions, which have been designed for lowering the energy footprint of specific schools.
This section describes the analysis performed about the possibility of covering the energy demand of a school using the surplus energy produced by the demonstrator.
3.1. General Electric Loads
The electricity demand of the school is strictly related to lighting of the classrooms and, to a lesser extent, to the energy requirements of some small air conditioners, water heaters, and auxiliary systems of the heating plant.
The current yearly electrical consumption stands at 60 MWhel/y, the average value of monthly consumption stands at around 5.1 MWhel/month, with a seasonal fluctuation around the average, which is mainly due to the number of hours in which the building is open to the public.
The basic idea of improving the performance of the whole district is that the surplus generated by the GE1 demonstrator copes with the current electric power demand of the school.
The average daily power has been obtained from the monthly balances and the hours of operation of the plant. It is assumed, therefore, that the school is opened to the public on working days, from Monday to Friday, for 12 h a day from 8 a.m. to 8 p.m.
The average hourly electric load stands at 20 kWel, with a maximum peak at 30 kWel; the current electricity demand of the building is therefore very low when compared with electricity production of the demonstrator.
3.2. Heating System Thermal Loads
The thermal demands of the school building are mainly related to the winter space heating.
The yearly NG consumption is closely linked to the year’s climate harshness. The value of heating degree days (HDD, d·°C), calculated during the heating period only, is directly linked to the harshness of the climate and, consequently, to the yearly thermal demand of a building [
32,
33].
Table 1 shows the yearly NG consumed by the building’s thermal plant from 2013 to 2015 compared with the HDD obtained starting from the measure of the average temperature in Genoa.
There is a clear proportionality between the NG demand and the HDD value; this is deduced by evaluating the slight variations in specific consumption, i.e., the ratio between yearly NG consumption and HDD in each year taken into account. It possible to estimate the NG consumption for Genoa’s base year, normed for the region at 1440 °C × day [
34], of approximately 485 MWhNG/y.
The evaluation of the annual consumption together with the length of the heating period and the daily heating duration led to the estimation of the maximum heat flow rate of about 570 kW at the design point of external air temperature equal to 0 °C [
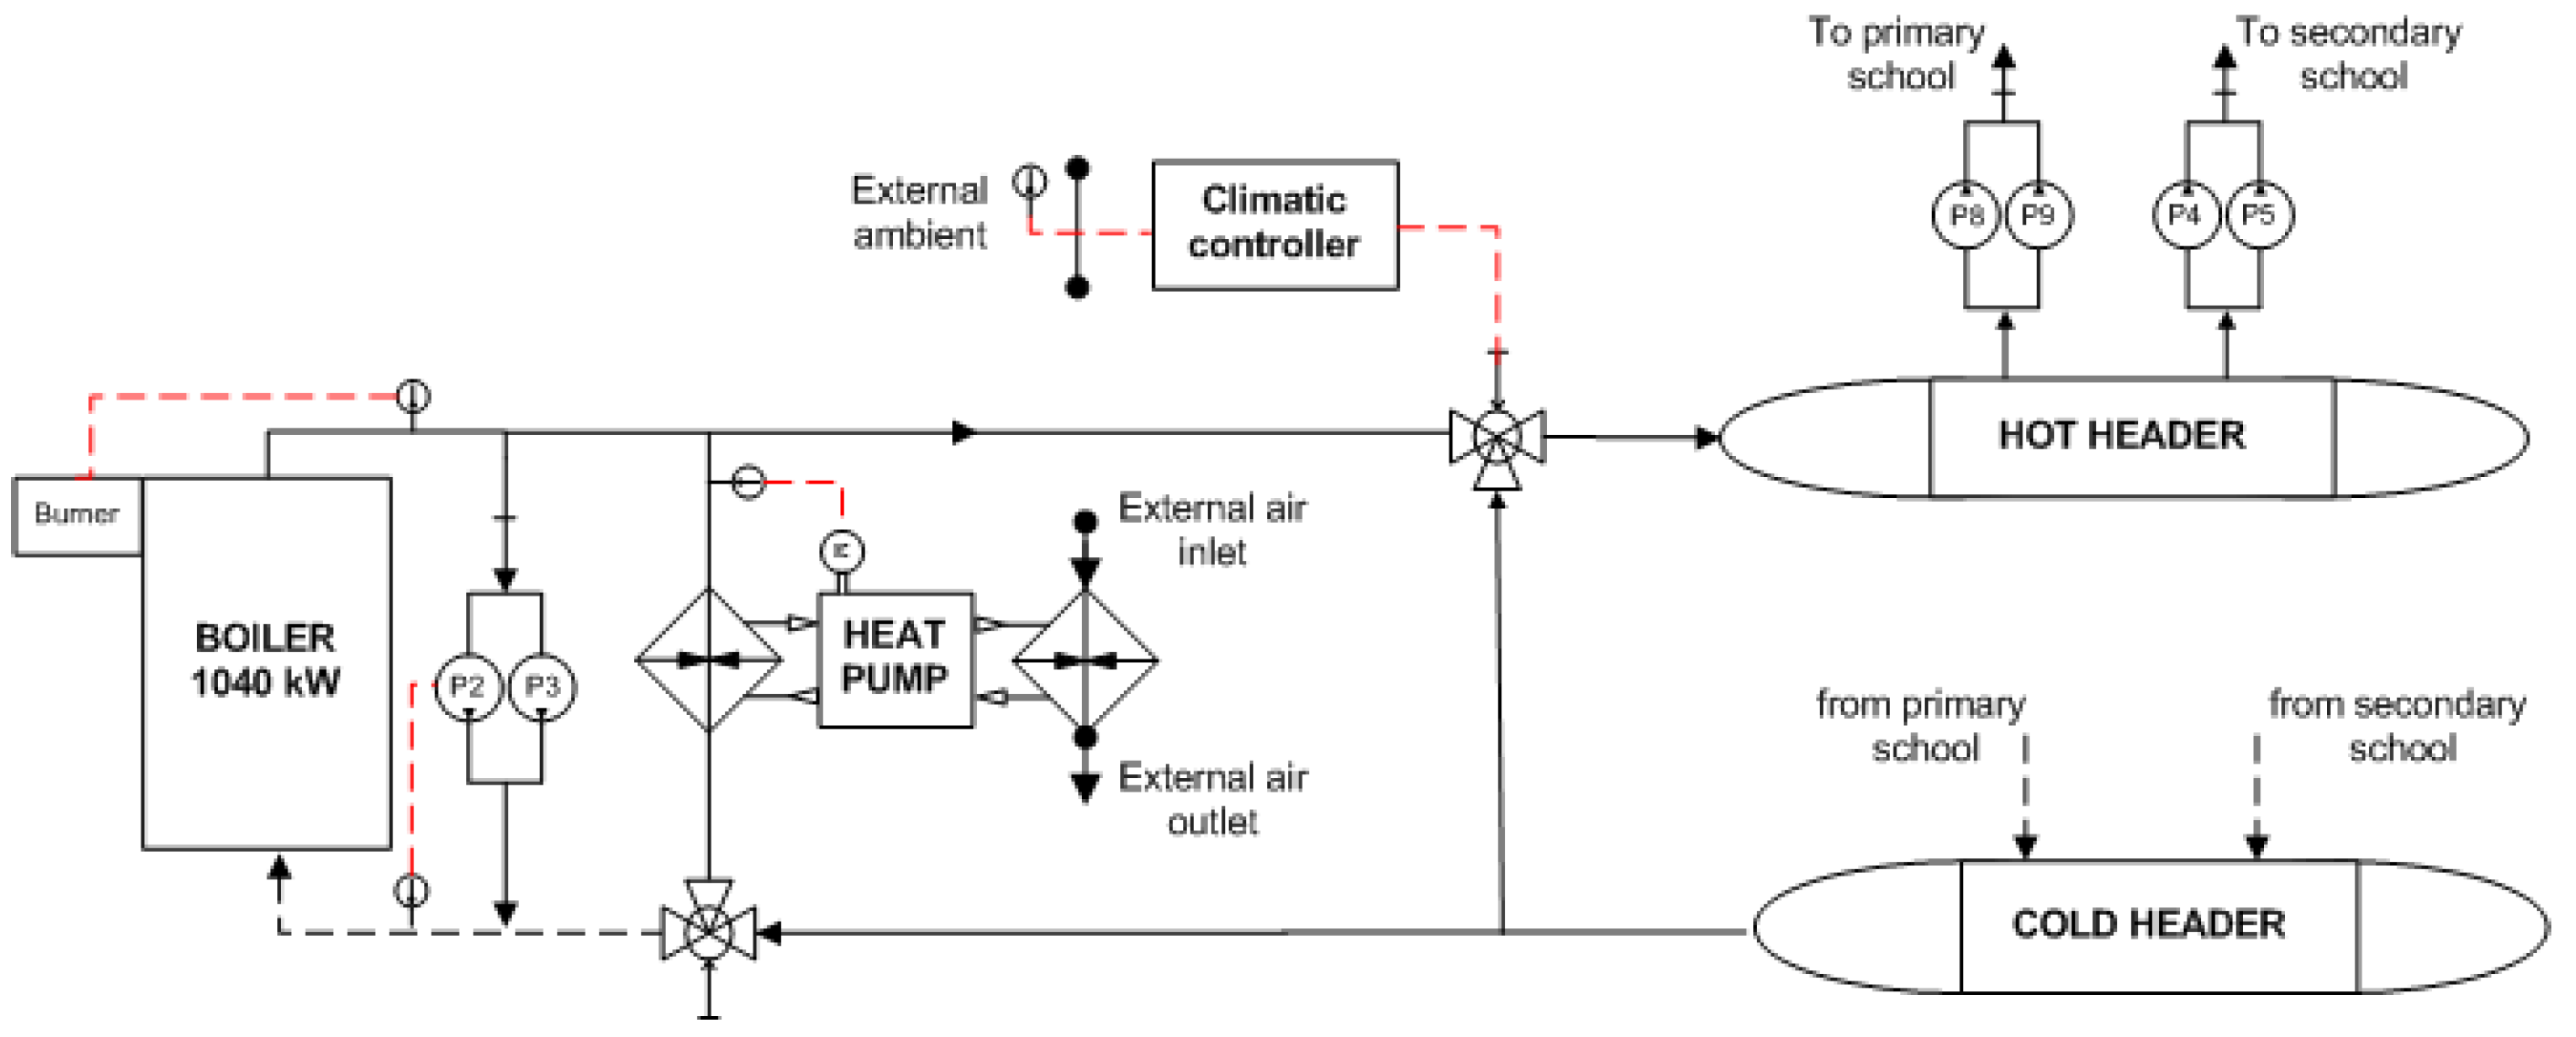
35]. The current heating system consists of a conventional, noncondensing boiler with a nominal capacity of 1040 kW
th. The internal distribution network consists of two branches, which supply heat respectively to the primary and to the secondary school, which are connected with the production system by two headers. Each branch runs through the first floor of the building horizontally, creating a ring that connects the radiators of the floor, from which several branches run vertically, creating columns that feed the radiators above.
The design of possible improvements of the present thermal system has been developed according to two main principles: high economic feasibility and low impact on existing thermal plants and buildings. The new solution must therefore:
not require changes in the internal distribution system;
keep, as far as possible, the current control system.
A solution that allows compliance with these constraints is the installation of a high-temperature air heat pump (HP). This type of heat production system, different from the geothermal ones, uses outlet air as a low-temperature heat source.
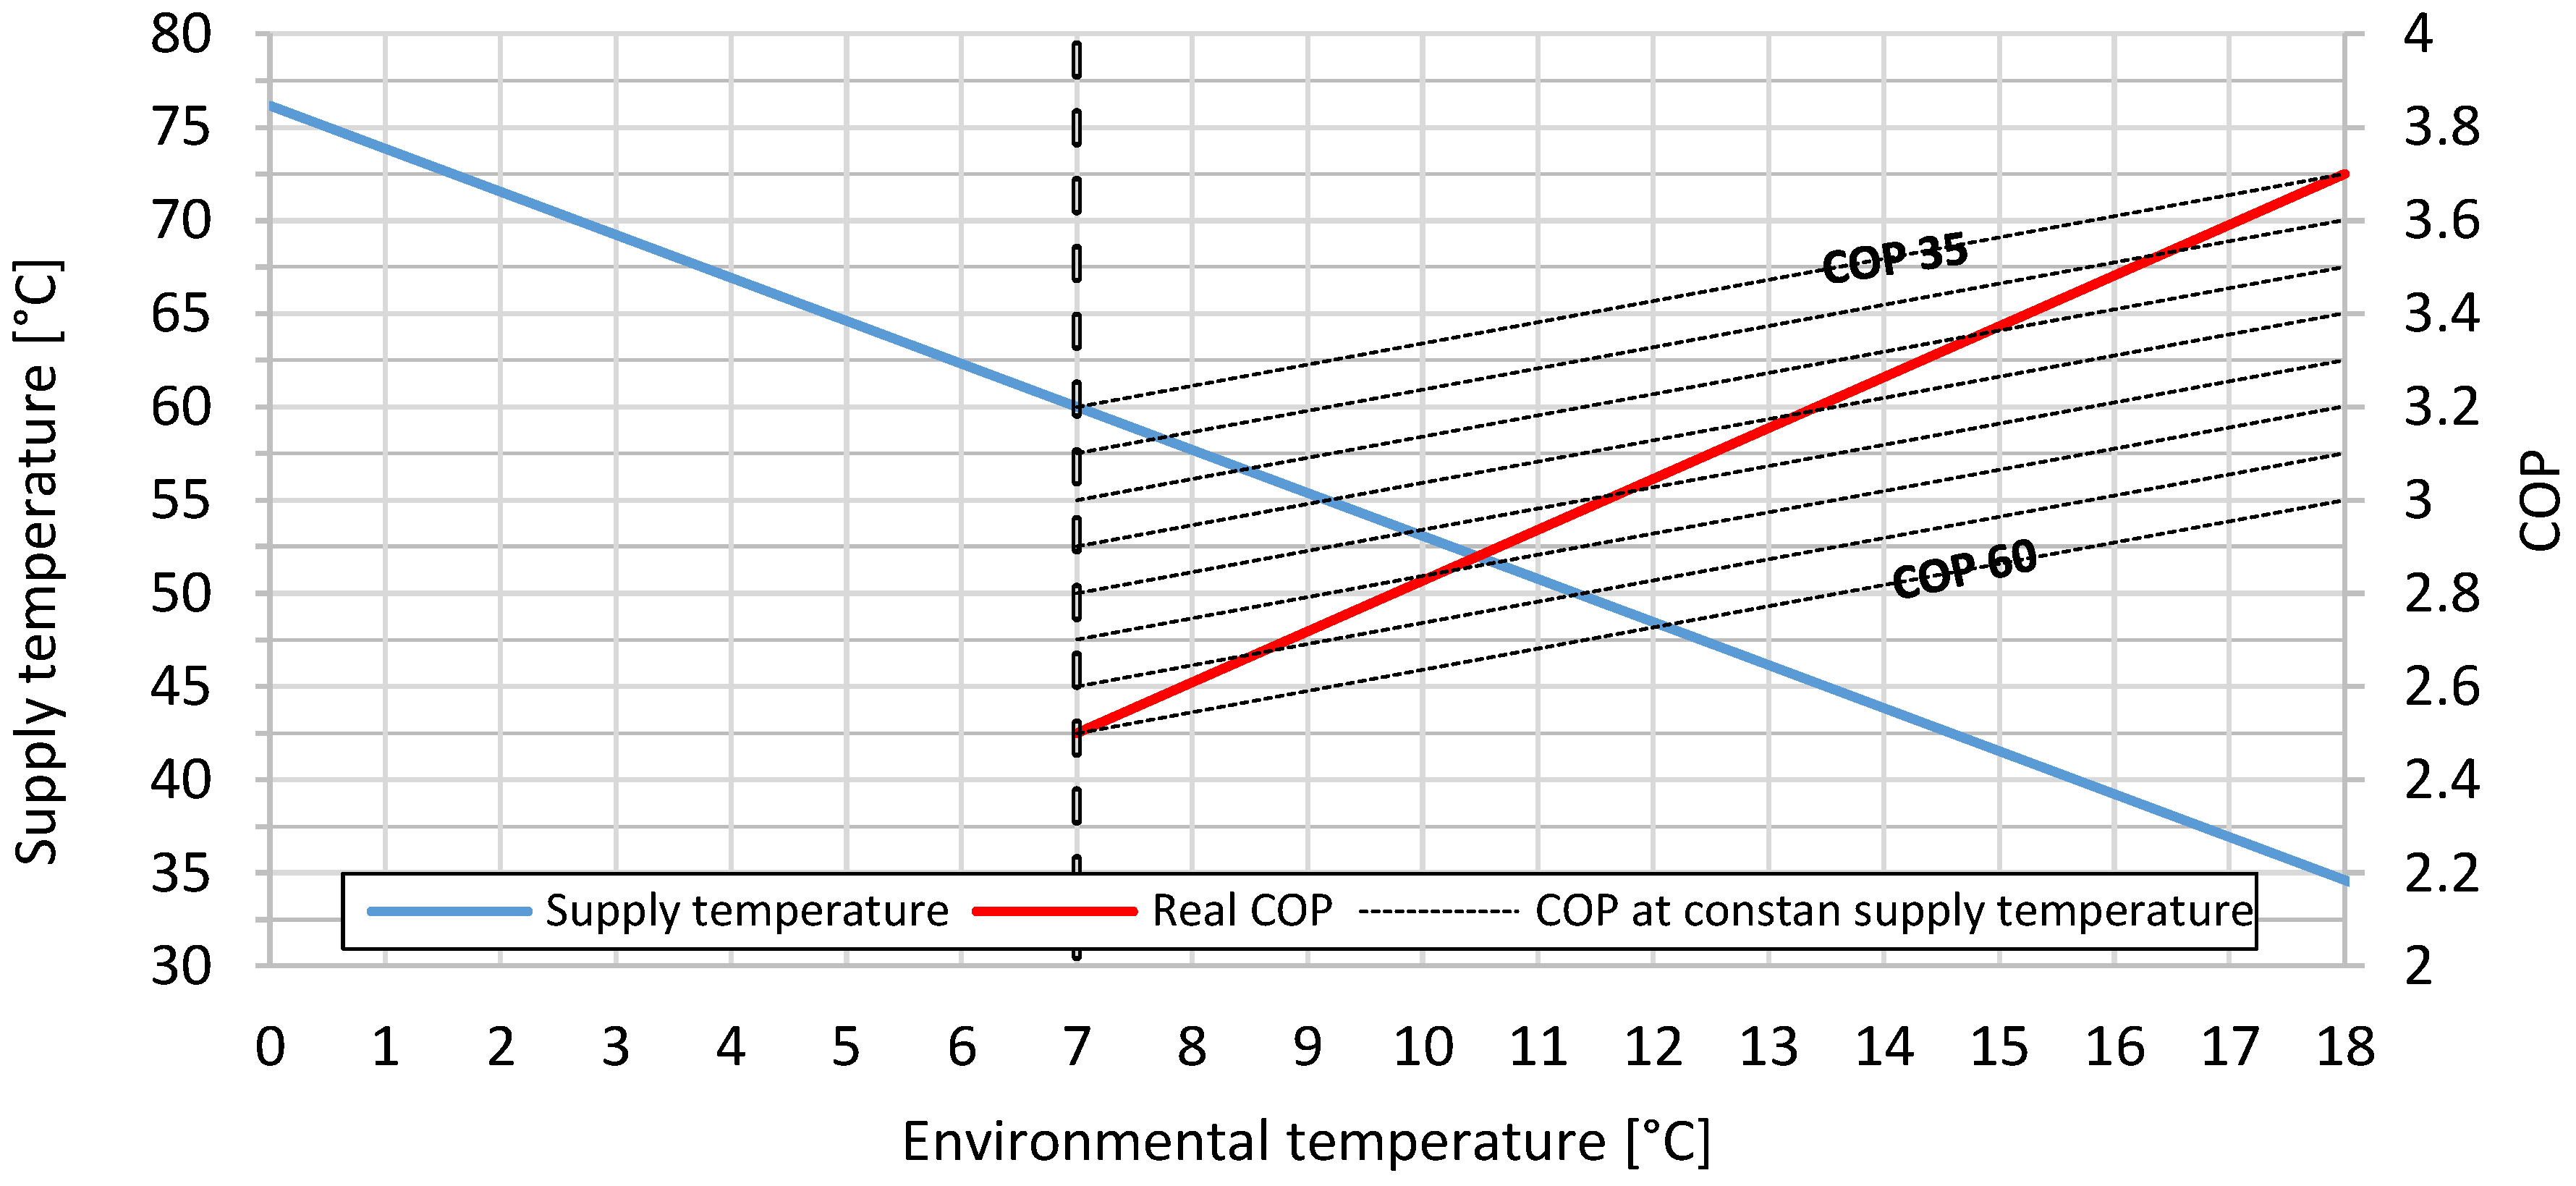
Since, in general, the coefficient of performance (COP) of any heat pump lowers as the temperature difference between the upper and lower sources increases, air HPs are particularly affected by this problem. Indeed, when outdoor conditions fall below 6–7 °C, the refrigerant inside of the heat pump must be at temperatures below 0 °C. Under these conditions, the moisture contained in the air can condense and freeze on the cold surface of the evaporator, increasing the thermal resistance, worsening then the heat exchange and consequently the COP.
Figure 3 reports the curves that have been utilized to evaluate the COP as a function of the external environment temperature.
First of all, the blue line describes the temperature at which water is supplied to the heating system: old heating systems, like the one which is installed in the school building, commonly control heat flow rate to the heated ambient by varying the water supply temperature. This type of control in known as “climatic regulation”. In our case, it consists of a function which linearly increases the temperature of the supply water as the external temperature decreases. The supply temperature ranges between approximately 80 °C, in the most severe conditions, to 30 °C in the warmer external conditions at which the heating system is still switched on. At an outside temperature of 7 °C, the system requires approximately 60 °C, a value that is easily achievable by current air HPs.
The second set of curves, which are represented in
Figure 3, are the dashed ones that are to be read on the left y-axis. They represent the curves of COP, as a function of the external temperature, with the supply temperature as a parameter, as they can be obtained from most of the technical sheets. In this case, for an air HP, the COP drops sharply when outside temperature is below 7 °C because of freezing and, for this reason, it has been decided not to draw the curves below such limit.
Finally, the red curve describes the combination of the two effects: the dependence of the performance of the HP connected to this specific heating system, which uses a climatic control of the supply temperature. In fact, the proper COP curve switches, from the lower to the upper ones, as the outside temperature increases and while we move to the right side of the diagram. For this reason, the effective COP curve, which properly estimates the overall effect of the external temperature on the COP of an air HP, is the red one. It is possible to estimate that the real COP curve of the HP, driven by this climatic control, ranges from about 2.5 (at 7 °C) to 3.7 at (18 °C).
The selected configuration (shown in
Figure 4) involves, for simplicity of realization, the parallel arrangement of the two thermal units with a control system that switches the load from one component to the other, depending on the environmental temperature. A motorized three-way valve (on–off type) is used for switching between the units, positioned in the return branch upstream of the HP, with the task of diverting the flow of water between the two units. In this way, the current control system is not modified, but only the control system of the new valve is added.
The new solution consists in a hybrid plant, in which the heat pump operates in moderate condition and, in addition, there is a backup boiler dimensioned to supply the maximum load required by the building.
3.3. GE1 Integration Strategy and Approach
From a general point of view, the intervention requires direct connection to the electricity meter of the school building to the electrical grid of Gavette district.
As already observed, the electrical current general demand of the school is limited in power and is constant during the year, whereas the one related to the HP is relevant but concentrated in the heating period only. The electric surplus generated by the demonstrator is very high, both in terms of available power and in daily energy, in the winter period.
From this point of view there are, therefore, no constraints limiting the electric power of the HP. It is then assumed to use a HP capable of absorbing up to 150 kWel; this unit can supply, assuming a COP of 2.5 in the less favorable conditions, up to 400 kWth, allowing its exclusive use, in the school, up to an outside temperature of 7 °C.
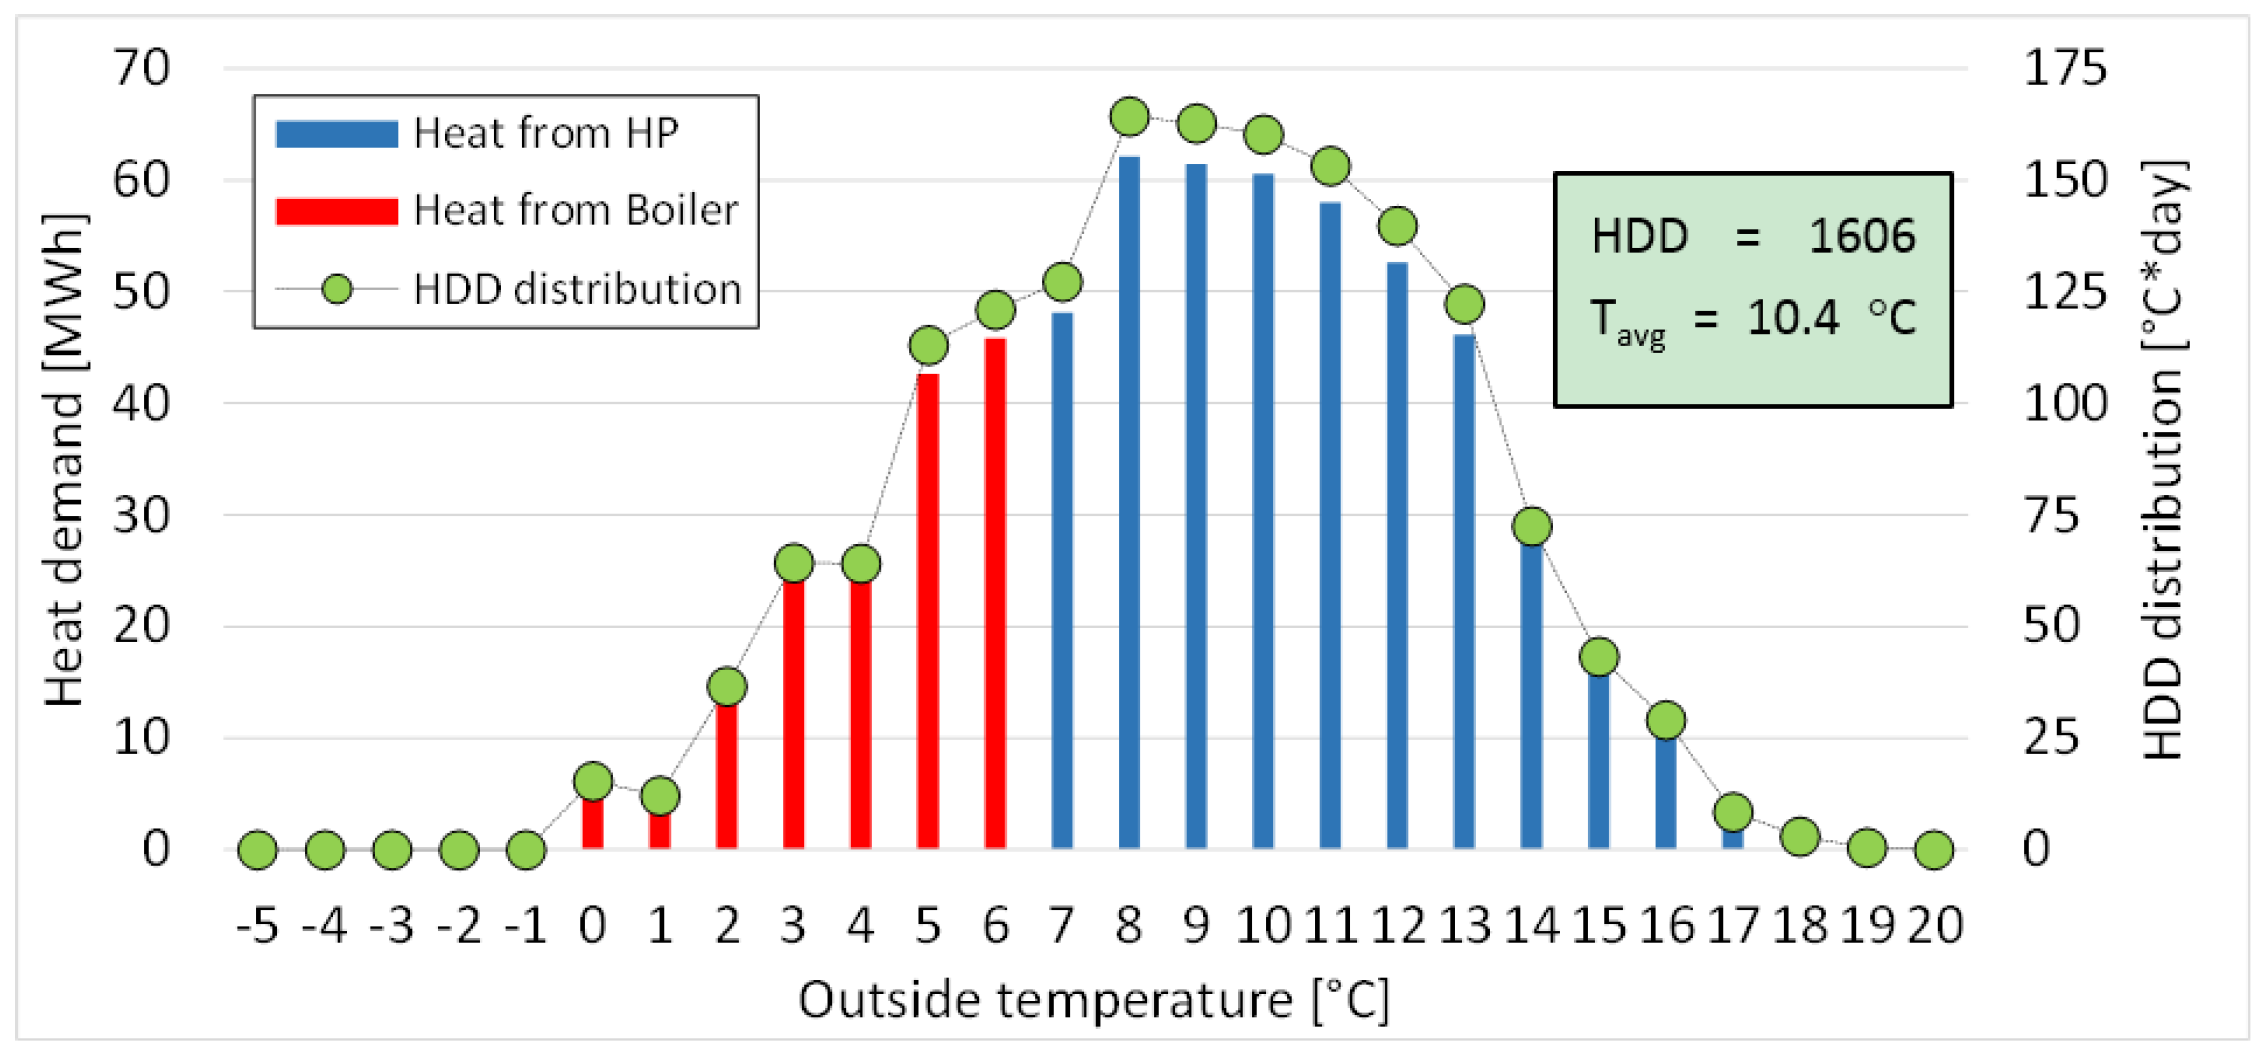
To estimate the yearly load of the HP and boiler, it is firstly necessary to analyze the average temperature distribution, over a heating period, in the selected zone. The analysis starts from the construction of the distribution curve of the average daily temperature from which, by means of a simple correlation, the corresponding HDD distribution curve is obtained.
Figure 5 shows (on the right axis) the HDD distribution curve for a “reference year” made by the average of the temperature distribution measured in Genoa from 2010 to 2015. It can be observed that most of the heat demand is concentrated in the central zone of the graph, from 7 to 13 °C, i.e., around the mean temperature value indicated for the city of Genoa in the heating period, which is equal to about 10 °C. The blue and red bars stand for the thermal energy supplied by the HP and by the boiler, for each temperature band, in case the switch temperature is 7 °C: these values are on the left axis.
In the reference year, characterized by 1606 HDD, the heat request by the school is about 352 MWhth/y, i.e., the conventional thermal plant, made by the boiler only, would require about 502 MWhNG/y equal to 50,400 Sm3.
With the integration of the HP it is possible to cover up to 73% of the heat requested by the building, equal to 259 MWhth/y: in case the details of the climate are available at daily frequency and the daily averaged external air temperature is known, it is possible to evaluate the consumption of an HP unit, taking into account that the COP depends on temperature. In this case, the consumption of the unit is about 92 MWhel/y, calculated using a COP variable with the external air temperature.
The boiler is called to supply the remaining 27% of the heat required by the building only, which corresponds to 132 MWhth/y, equal to about 13,300 Sm3 of NG. Hence the combined hybrid plant would lead to savings of 37,100 Sm3/y for the school.
It is worth noting that the sharing of energy demand as a function of the external temperature level, shown in
Figure 3, cannot be linearly transposed into CO
2 emissions because of two different aspects. The first reason is that, different from conventional boilers, HP converts electricity into heat with a COP, which is strongly affected by the external temperature; the second one is that it is not trivial to define univocally the CO
2 emission factor for power production.
The assessment of CO
2 production and saving, in the different configurations, are based on the following assumptions:
the conventional boilers burn NG and their efficiency of the existing boiler is roughly independent from the external temperature and it is equal to 0.8;
the HP uses electric power and, in case it would be driven by a climate control of the temperature of the supply water to the heating system, its COP would be the one displayed by the red curve of
Figure 3;
the electric power could be supplied to the HP either from the national grid or directly from the GE1 Demonstrator.
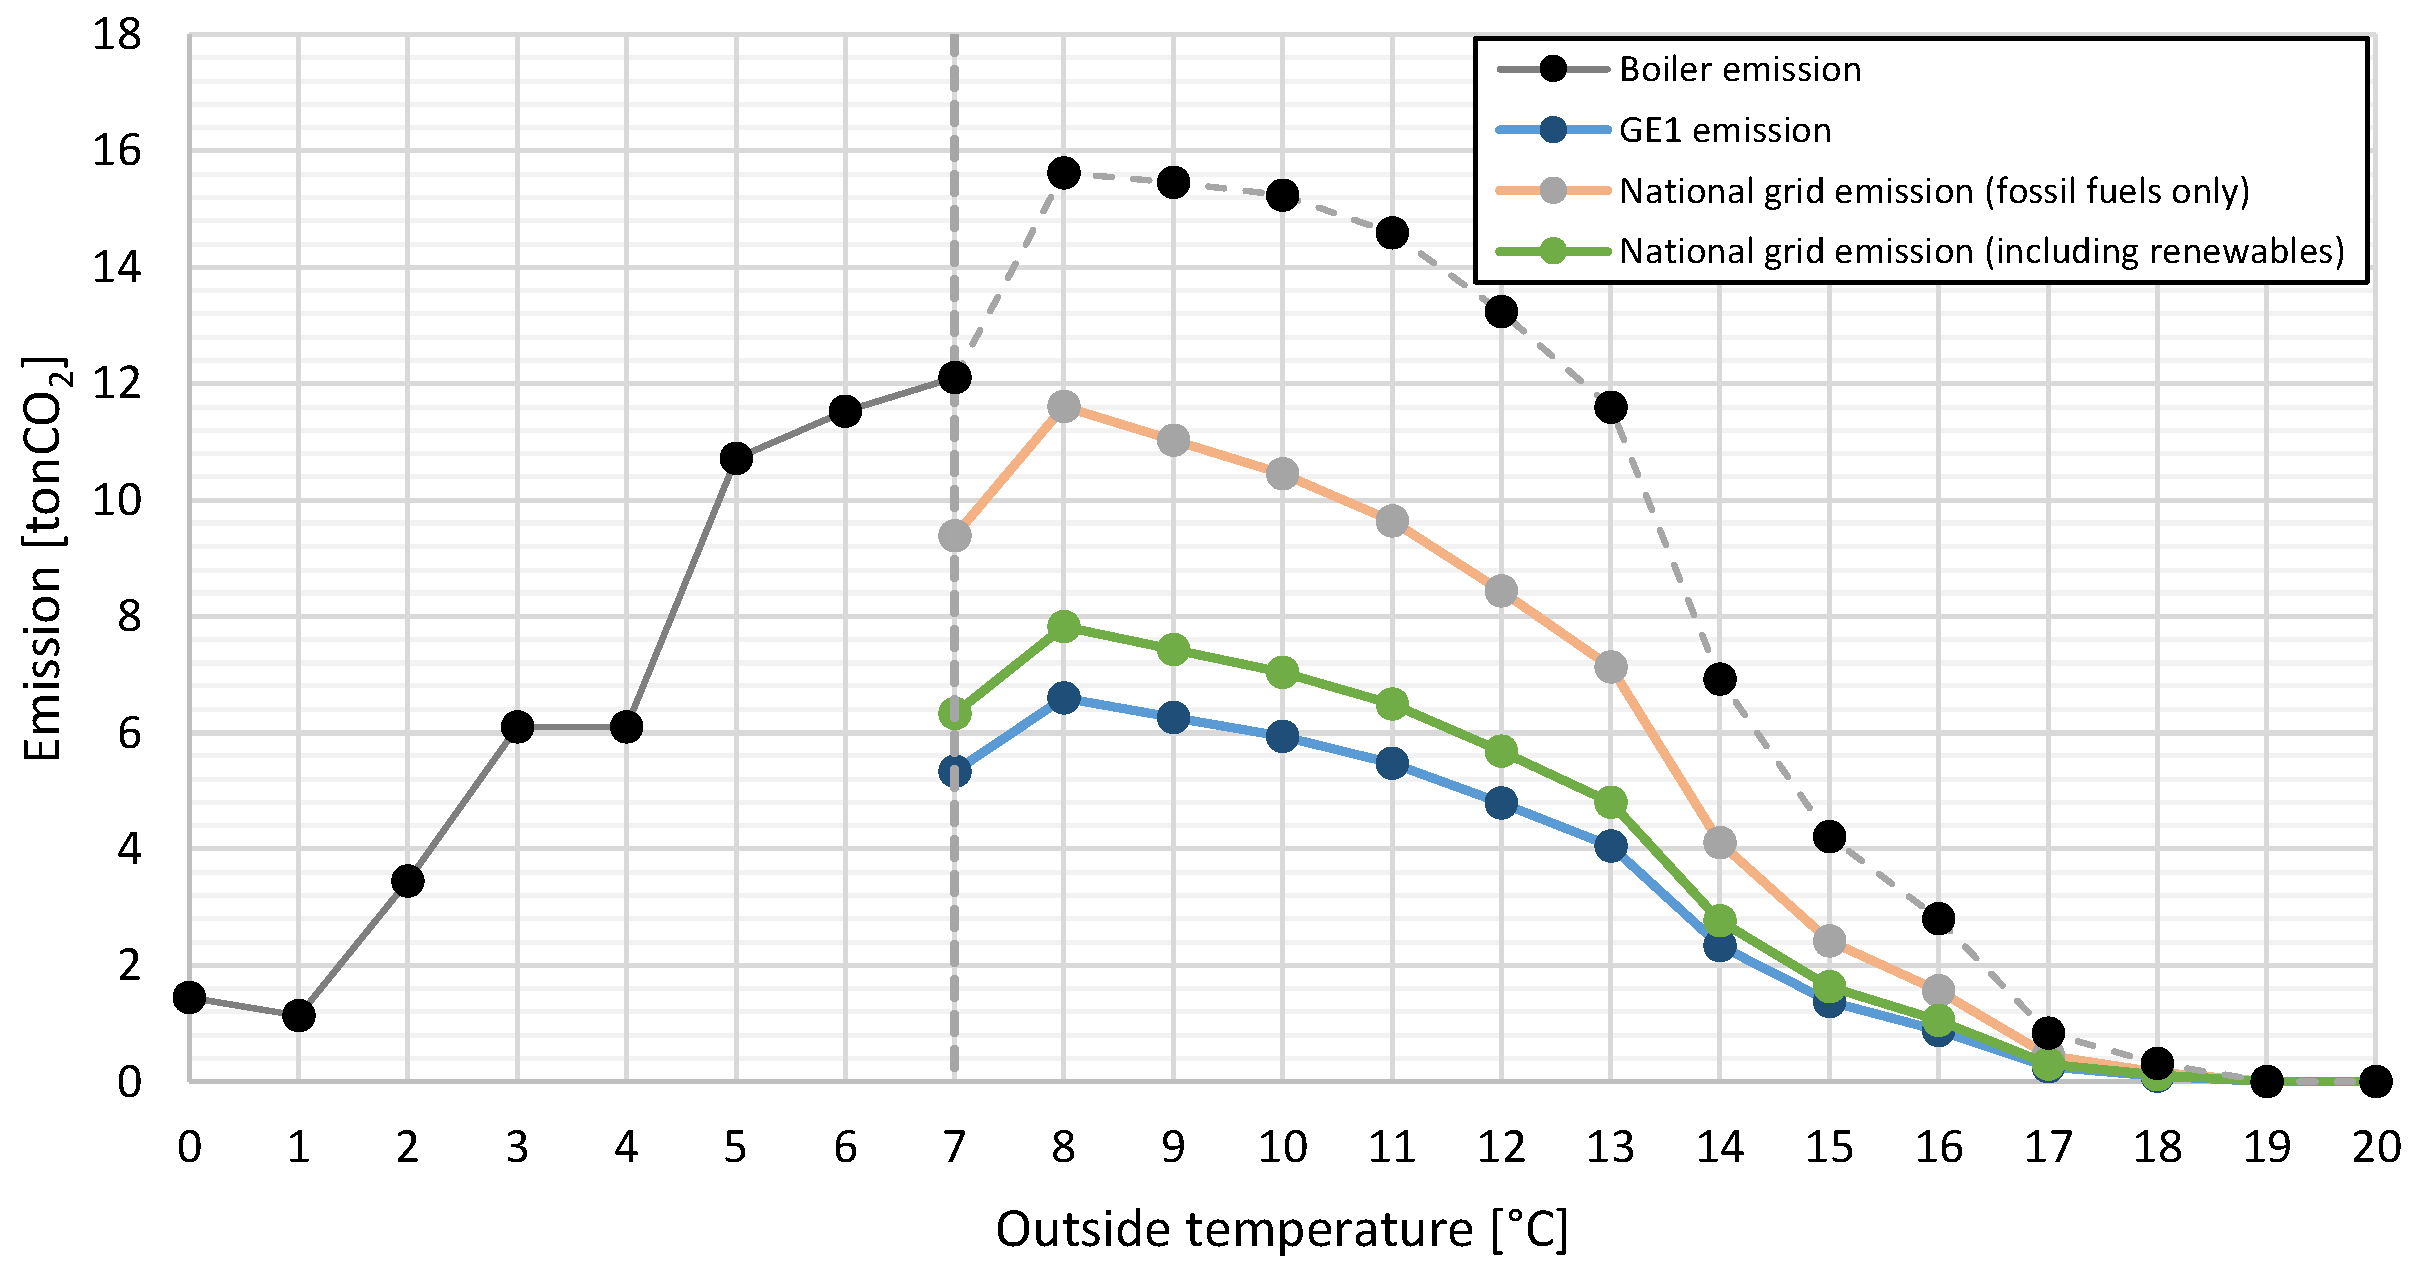
It is easy to compare CO2 emissions of the boilers and of the HP directly connected to the GE1 demonstrator because they both use NG as primary energy source. A little more complex is assessing the CO2 footprint of the HP fed by the national grid, because thermal power plants use many different fossil fuels and, moreover, there is an absolutely non-negligible amount of renewables.
The aggregated values—which are useful for estimating CO
2 footprint and overall conversion factors—are published yearly [
36] by the Italian National Institute for Environmental Protection and Research (ISPRA) and further studies and elaborations [
37] are available thanks to the National Agency for New Technologies, Energy and Sustainable Economic Development (ENEA).
The authors suggest using two different ways to assess CO
2 footprints. The first is to use the conversion factor e and the CO
2 emission of the fossil fuels only, the second is to use the values which are obtained with an overall estimation that includes the effect of the renewables.
Figure 6 reports the CO
2 footprint evaluated following this procedure.
4. Extension of the Project Extension to a Refueling Station
The need for matching the availability of wastes and the users’ demand, as an energy supplier, leads primarily to the problem of evaluating the possible users which lay in the proximities of the sources. The cost of infrastructures, which make the sources available far from the place they are produced, is often one of the main obstacles to the effective exploitation of wastes. For this reason, the mapping of the potential users led to consideration of the refueling station, RS, as one of the most promising new users. Natural gas is in fact rapidly growing as a fuel for vehicles, and this happens in particular in Italy, which has the biggest number of compressed natural gas (CNG) vehicles in Europe [
38].
The gas RS was built in 1989. The RS has a configuration where the CNG is directly supplied to users through a cascade storage supply method [
39]. Thanks to various plant surveys, it has been possible to notice that the RS underwent refurbishments during the years: the compression process has been split in two pressure stages and the refrigeration system has been upgraded at the same time to enable better performance of the entire plant.
The electricity demand for this plant has to be considered as quite a stochastic phenomenon, since the energy required for a given time length is mainly linked to the quantity of gas supplied, which depends on the vehicles’ flow and the type of tanks each of them has. However, for this case, it has been possible to observe a certain supply regularity characterized by a daily average of about 3500 Sm3, with highest peaks between 12 p.m. and 2 p.m.
4.1. Plant and Process Description
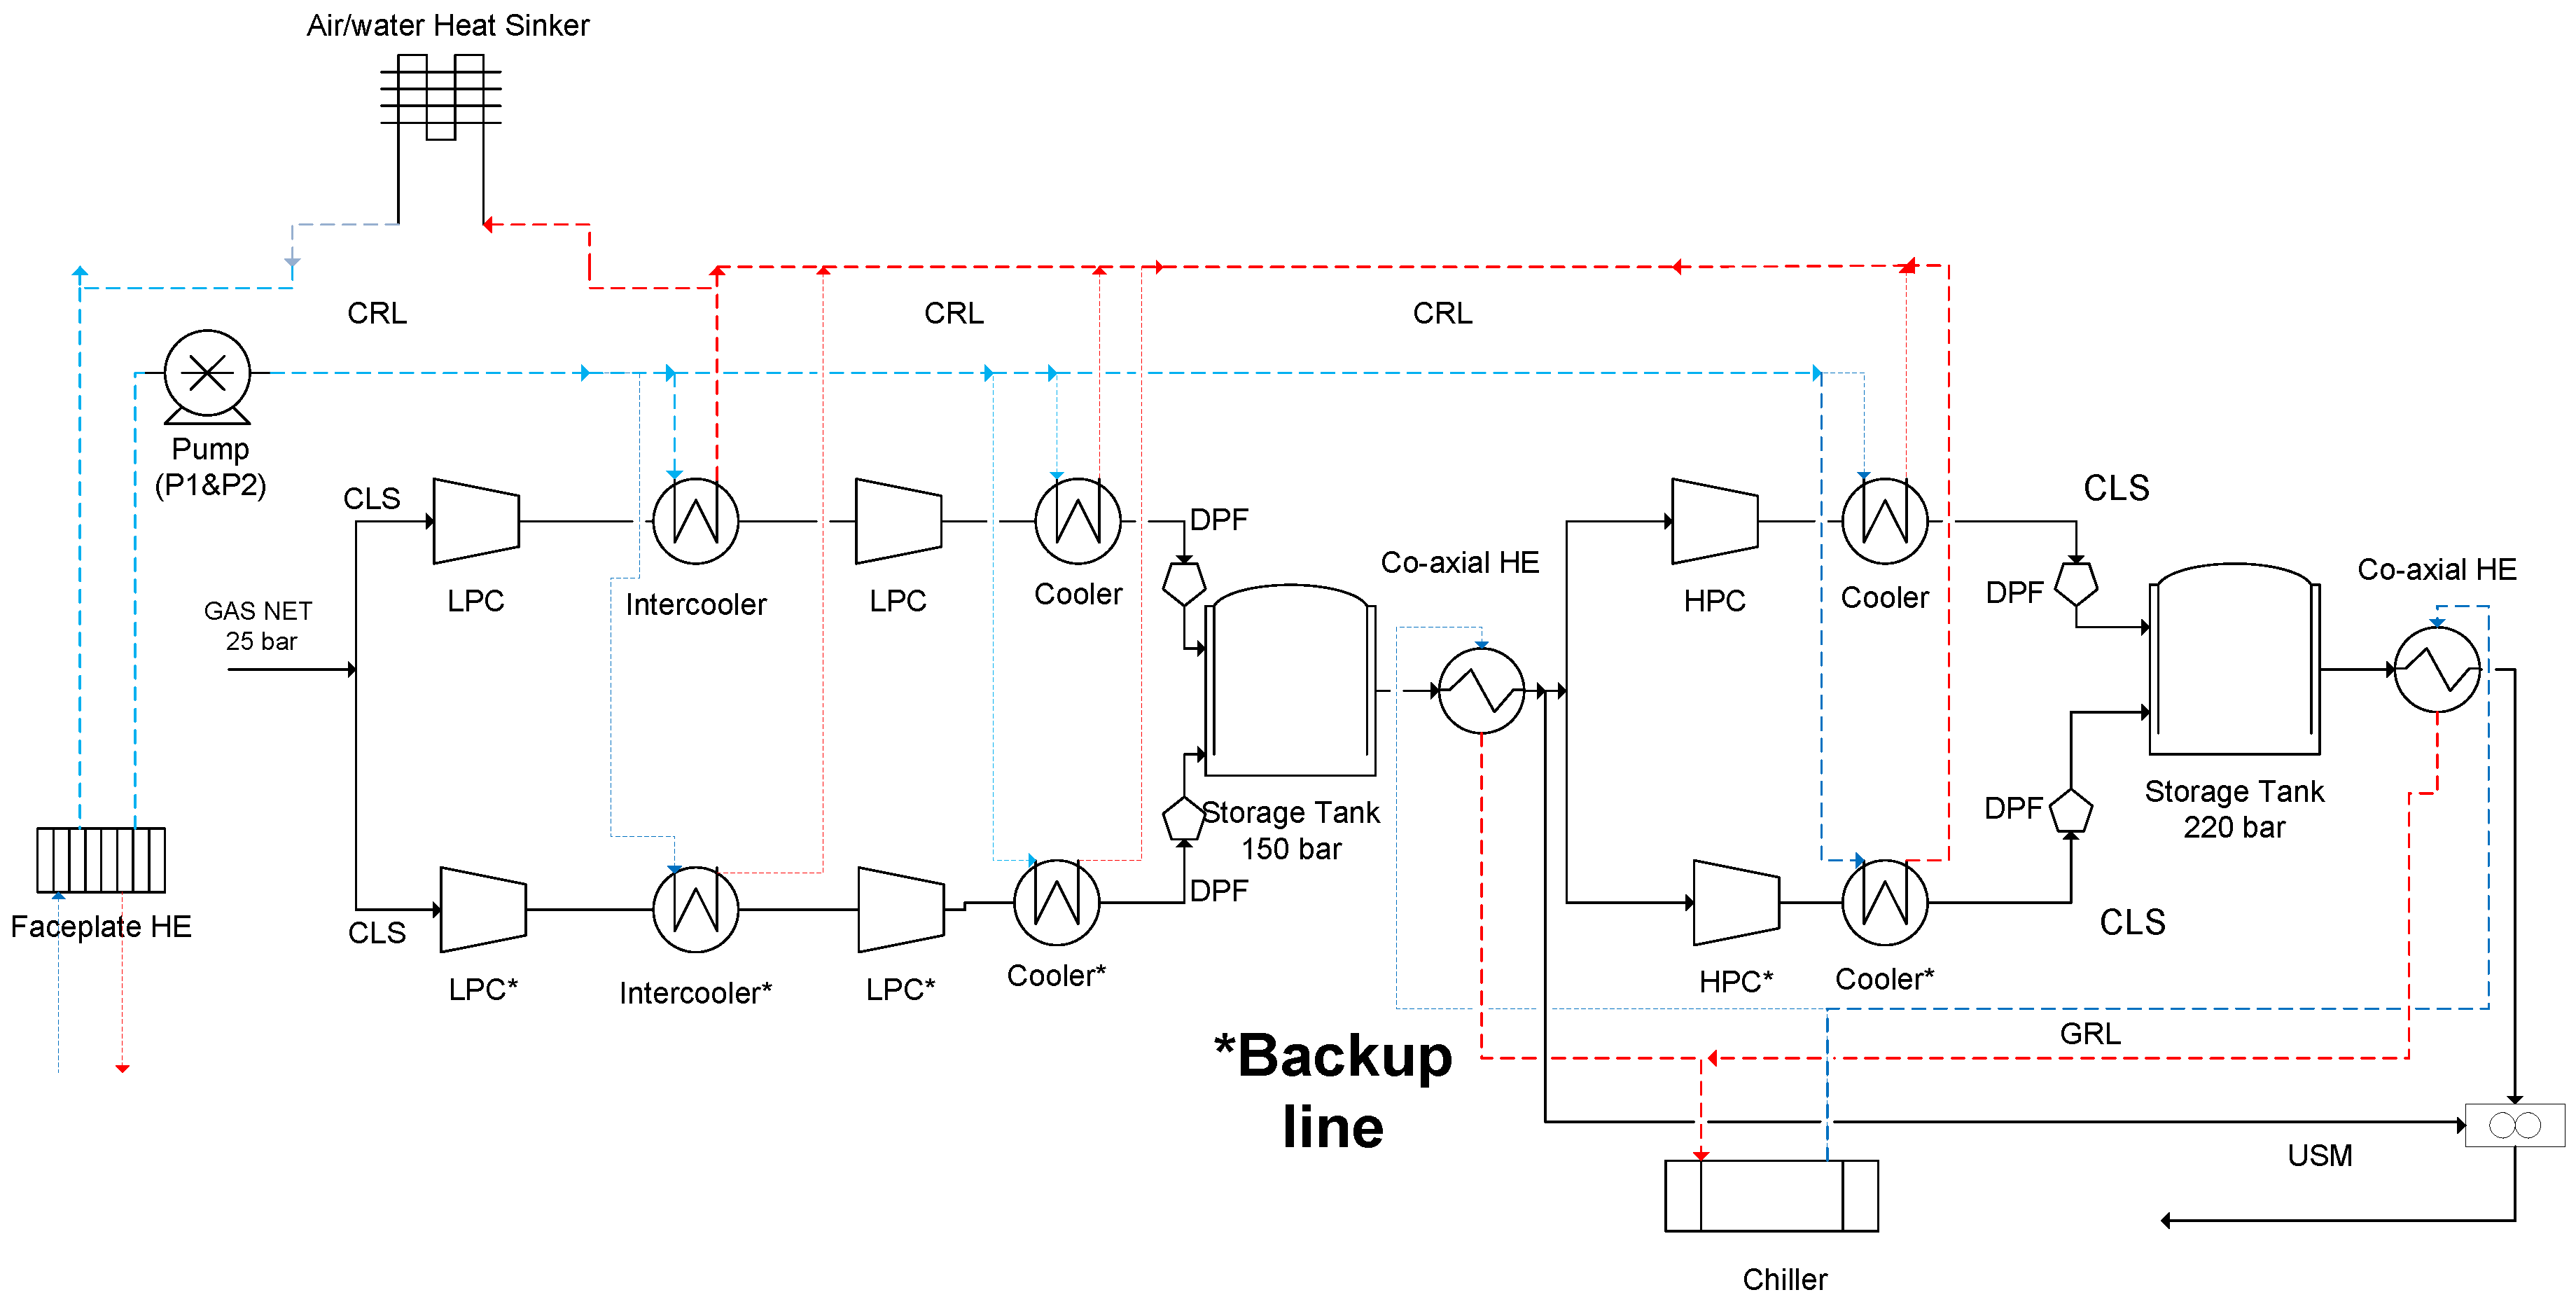
The CNG plant, shown in
Figure 7, consists in six main subsystems respectively: compression lines and storage (CLS), compressor refrigeration loop (CRL), gas refrigeration loop (GRL), damping panel and filtering (DPF), user supply and metering system (USM), and, finally, control and security system (CSS).
Currently, the compression system has two parallel lines (primary and secondary). The secondary line is used for backup and integration purposes. Each line is divided in two compression stages: a low-pressure compressor (LPC) and a high-pressure compressor (HPC), respectively driven by 55 and 15 kWel motors which raise gas pressure approximately from 25 to 150 barg and from 150 to 220 barg, depending on the working conditions.
The LPC machine is provided with a gas/water intercooler and an internal refrigeration system, which are both connected to the CRL. The HPC, instead, just includes an internal refrigeration system.
Both LPC and HPC are coupled with the electric motors by means of a hydraulic system. Based on the manufacturer’s information, LPC is capable of about 450 Sm3/h at a suction pressure of 26 barg and for the HPC it is 650 Sm3/h at a suction pressure of 151 barg.
LPC storage consists in two tanks of 1014 L each and, for the HPC, it consists in 10 tanks of 80 L each for a total storing volume of 800 L. The CRL is constituted by a water loop with two parallel pumps of 1.5 kWel each (one for backup purposes). The returning water flows through a plate heat exchanger and is cooled down by the disposable water coming from the aqueduct in those rare cases in which the air/water heat sinker does not accomplish the cooling process.
The compressed natural gas coming out from the HPC and LPC contains a small fraction of lube oil. Hence, before the gas enters in the DPF, it flows in a separation filter, which generates a non-negligible pressure drop. In the DPF there is also a complex system of pipes and valves which dampens pressure fluctuations generated by the compressors. The damping panel include a passive security control system made of relief valves.
The refrigeration of the compressed gas coming out from the HPC is made through two coaxial heat exchangers: one is installed downstream of the HPC right before the USM, increasing the quantity of CNG storable at each vehicle recharge cycle. The other one is positioned right before the HPCs.
The refrigeration water for this subprocess is refrigerated by means of a compact 31.4 kWth air-cooled chiller with an energy efficiency ratio (EER) of 4.6 (evaporator water inlet/outlet temperature 20/15 °C, external air temperature 25 °C).
Finally, the CNG is metered in a metering station and supplied (and metered) to users at four car dispensers and at two heavy vehicles dispensers. The control of the CNG plant is based on a ON/OFF logic with two pressure set points, which are 150 and 220 barg, switched on and switched off, respectively.
The primary water pumps’ (P1 and P2) control is based on an ON/OFF logic, controlled by the temperature of the returning water located in a 100 L pool. If the water temperature increases beyond a certain value, the thermostat will close the electrical circuit, activating the backup pump P2. At the same time, the air/water heat sinker could be activated to support the cooling process basing on the returning water temperature.
Concerning the GRL control strategy, the dedicated 31.4 kWth chiller is controlled in order to ensure a constant water temperature of 6 °C during the plant operations independent of the CLS’s operating conditions.
4.2. Preliminary Energy Analysis and GE1 Integration
The energy flow estimation has been carried out by using Honeywell UniSim Design software: a dynamic simulation tool which allows estimating the electricity consumption repartition in between the plant components for a given quantity of gas supplied.
The compressed natural gas plant taken in consideration for this study has been subjected to an in-depth energy analysis carried out through on-site surveys, billing analysis, and numerical simulations.
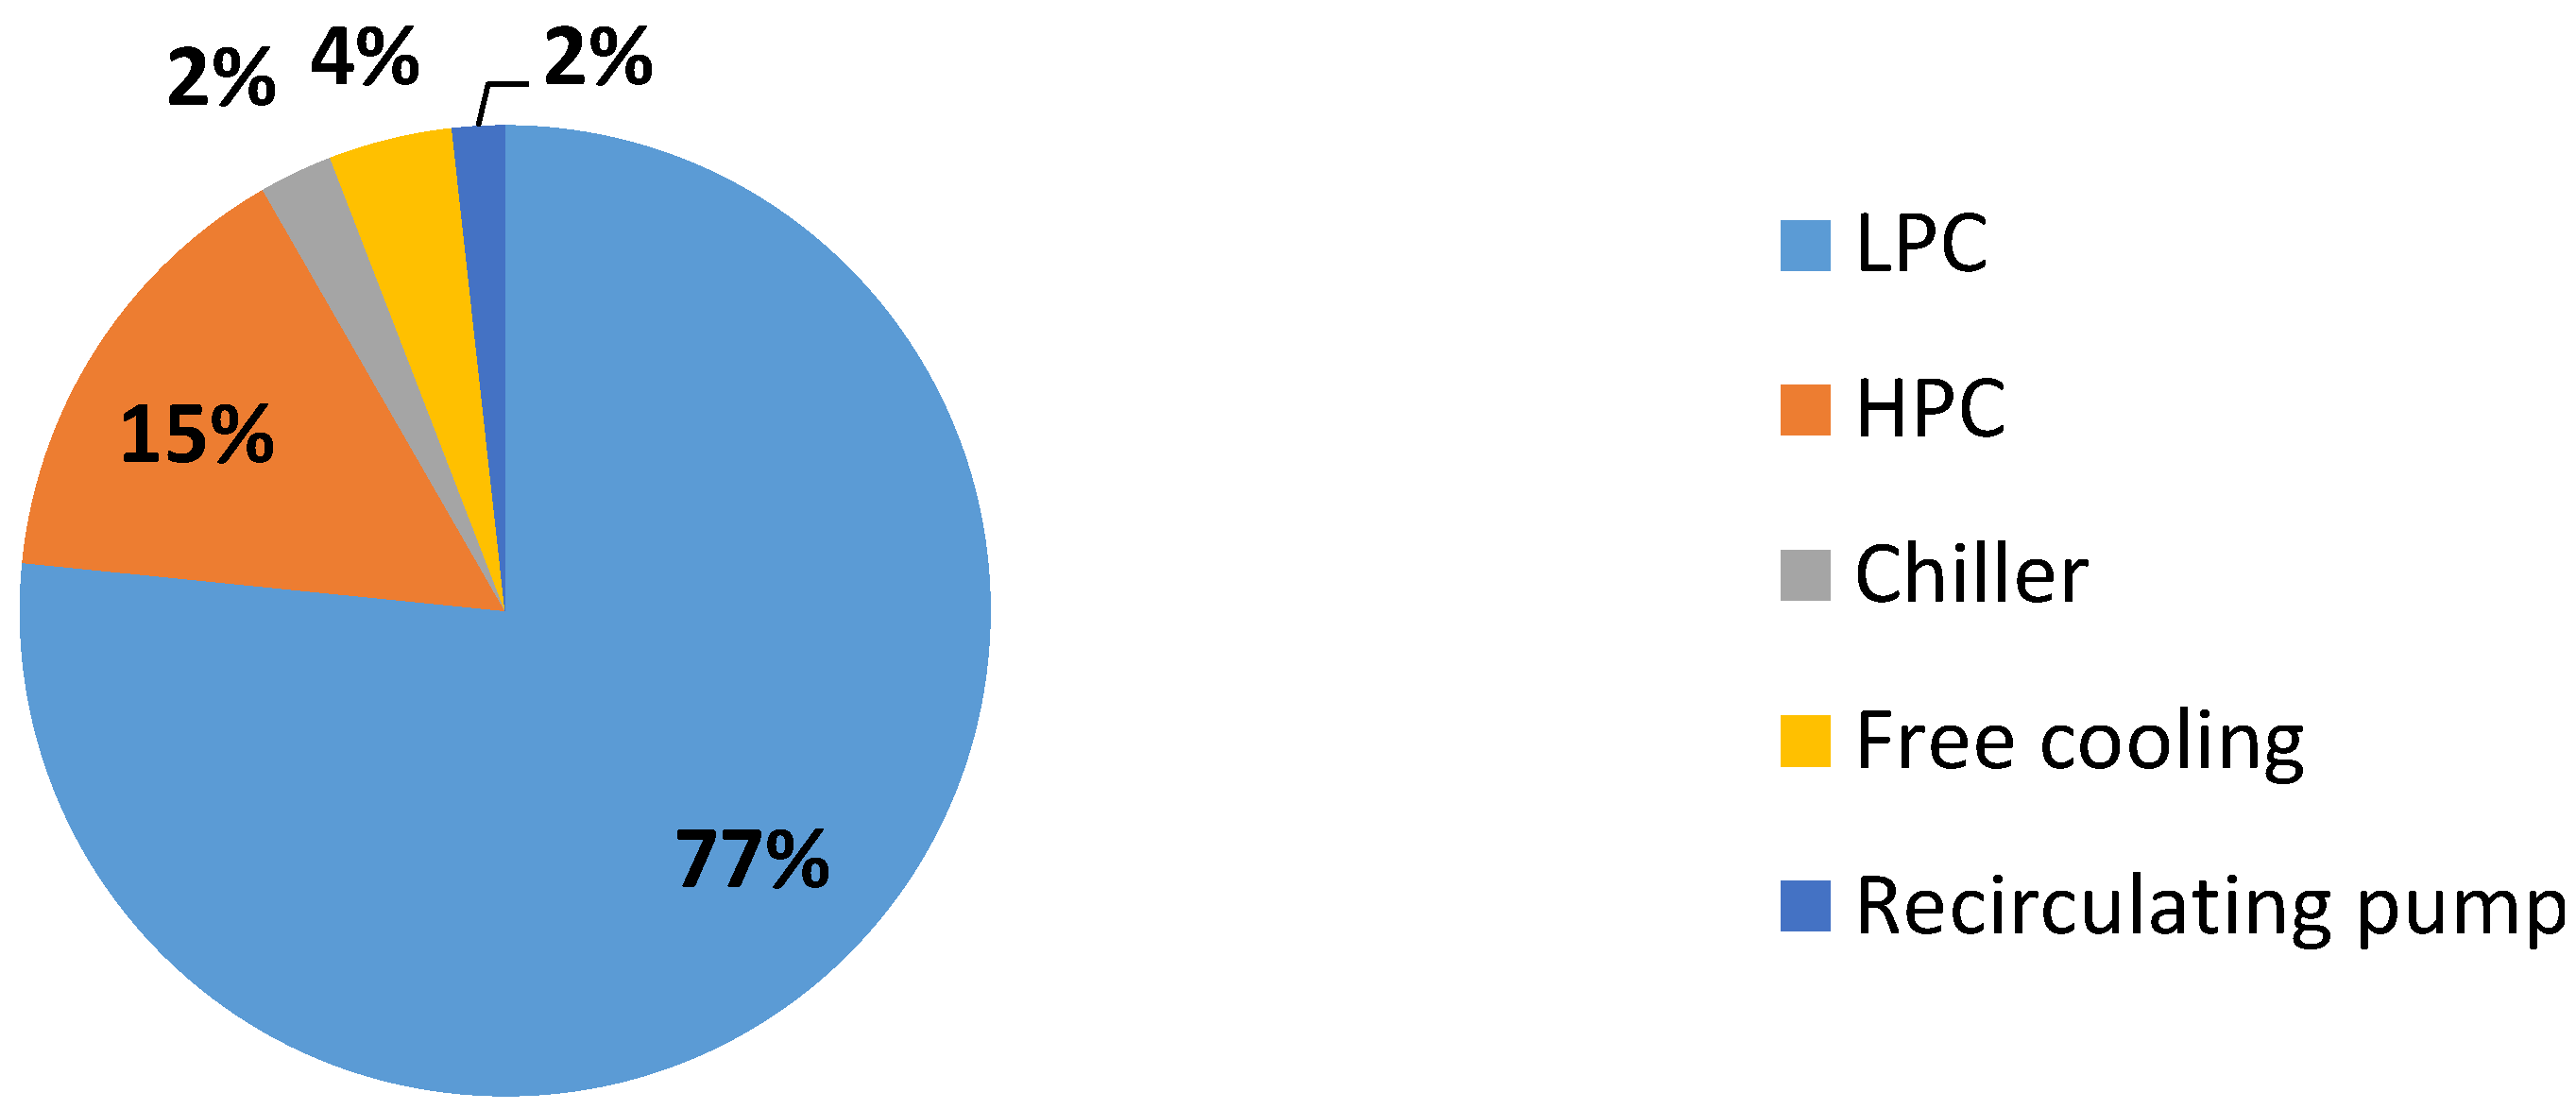
Figure 8 shows the current electricity consumption repartition relative to the plant process for a given quantity of gas supplied by the RS. This quantity does not include auxiliary systems of the building envelope where the plant is actually located, e.g., lighting consumption. Then, they refer just to the plant components and auxiliary systems.
These values shown in
Figure 8 refers to a simulation time length of 30 minutes considering initial storage tanks’ pressure of 150 and 220 bar
g, respectively, with a constant outside temperature of 15 °C. Considering the same quantity of CNG supplied, the annual mean electricity consumption repartition is expected to follow almost the same percentages shown in
Figure 8 with just slight differences since some operating and boundary conditions could consistently change over time, influencing the plant operating conditions.
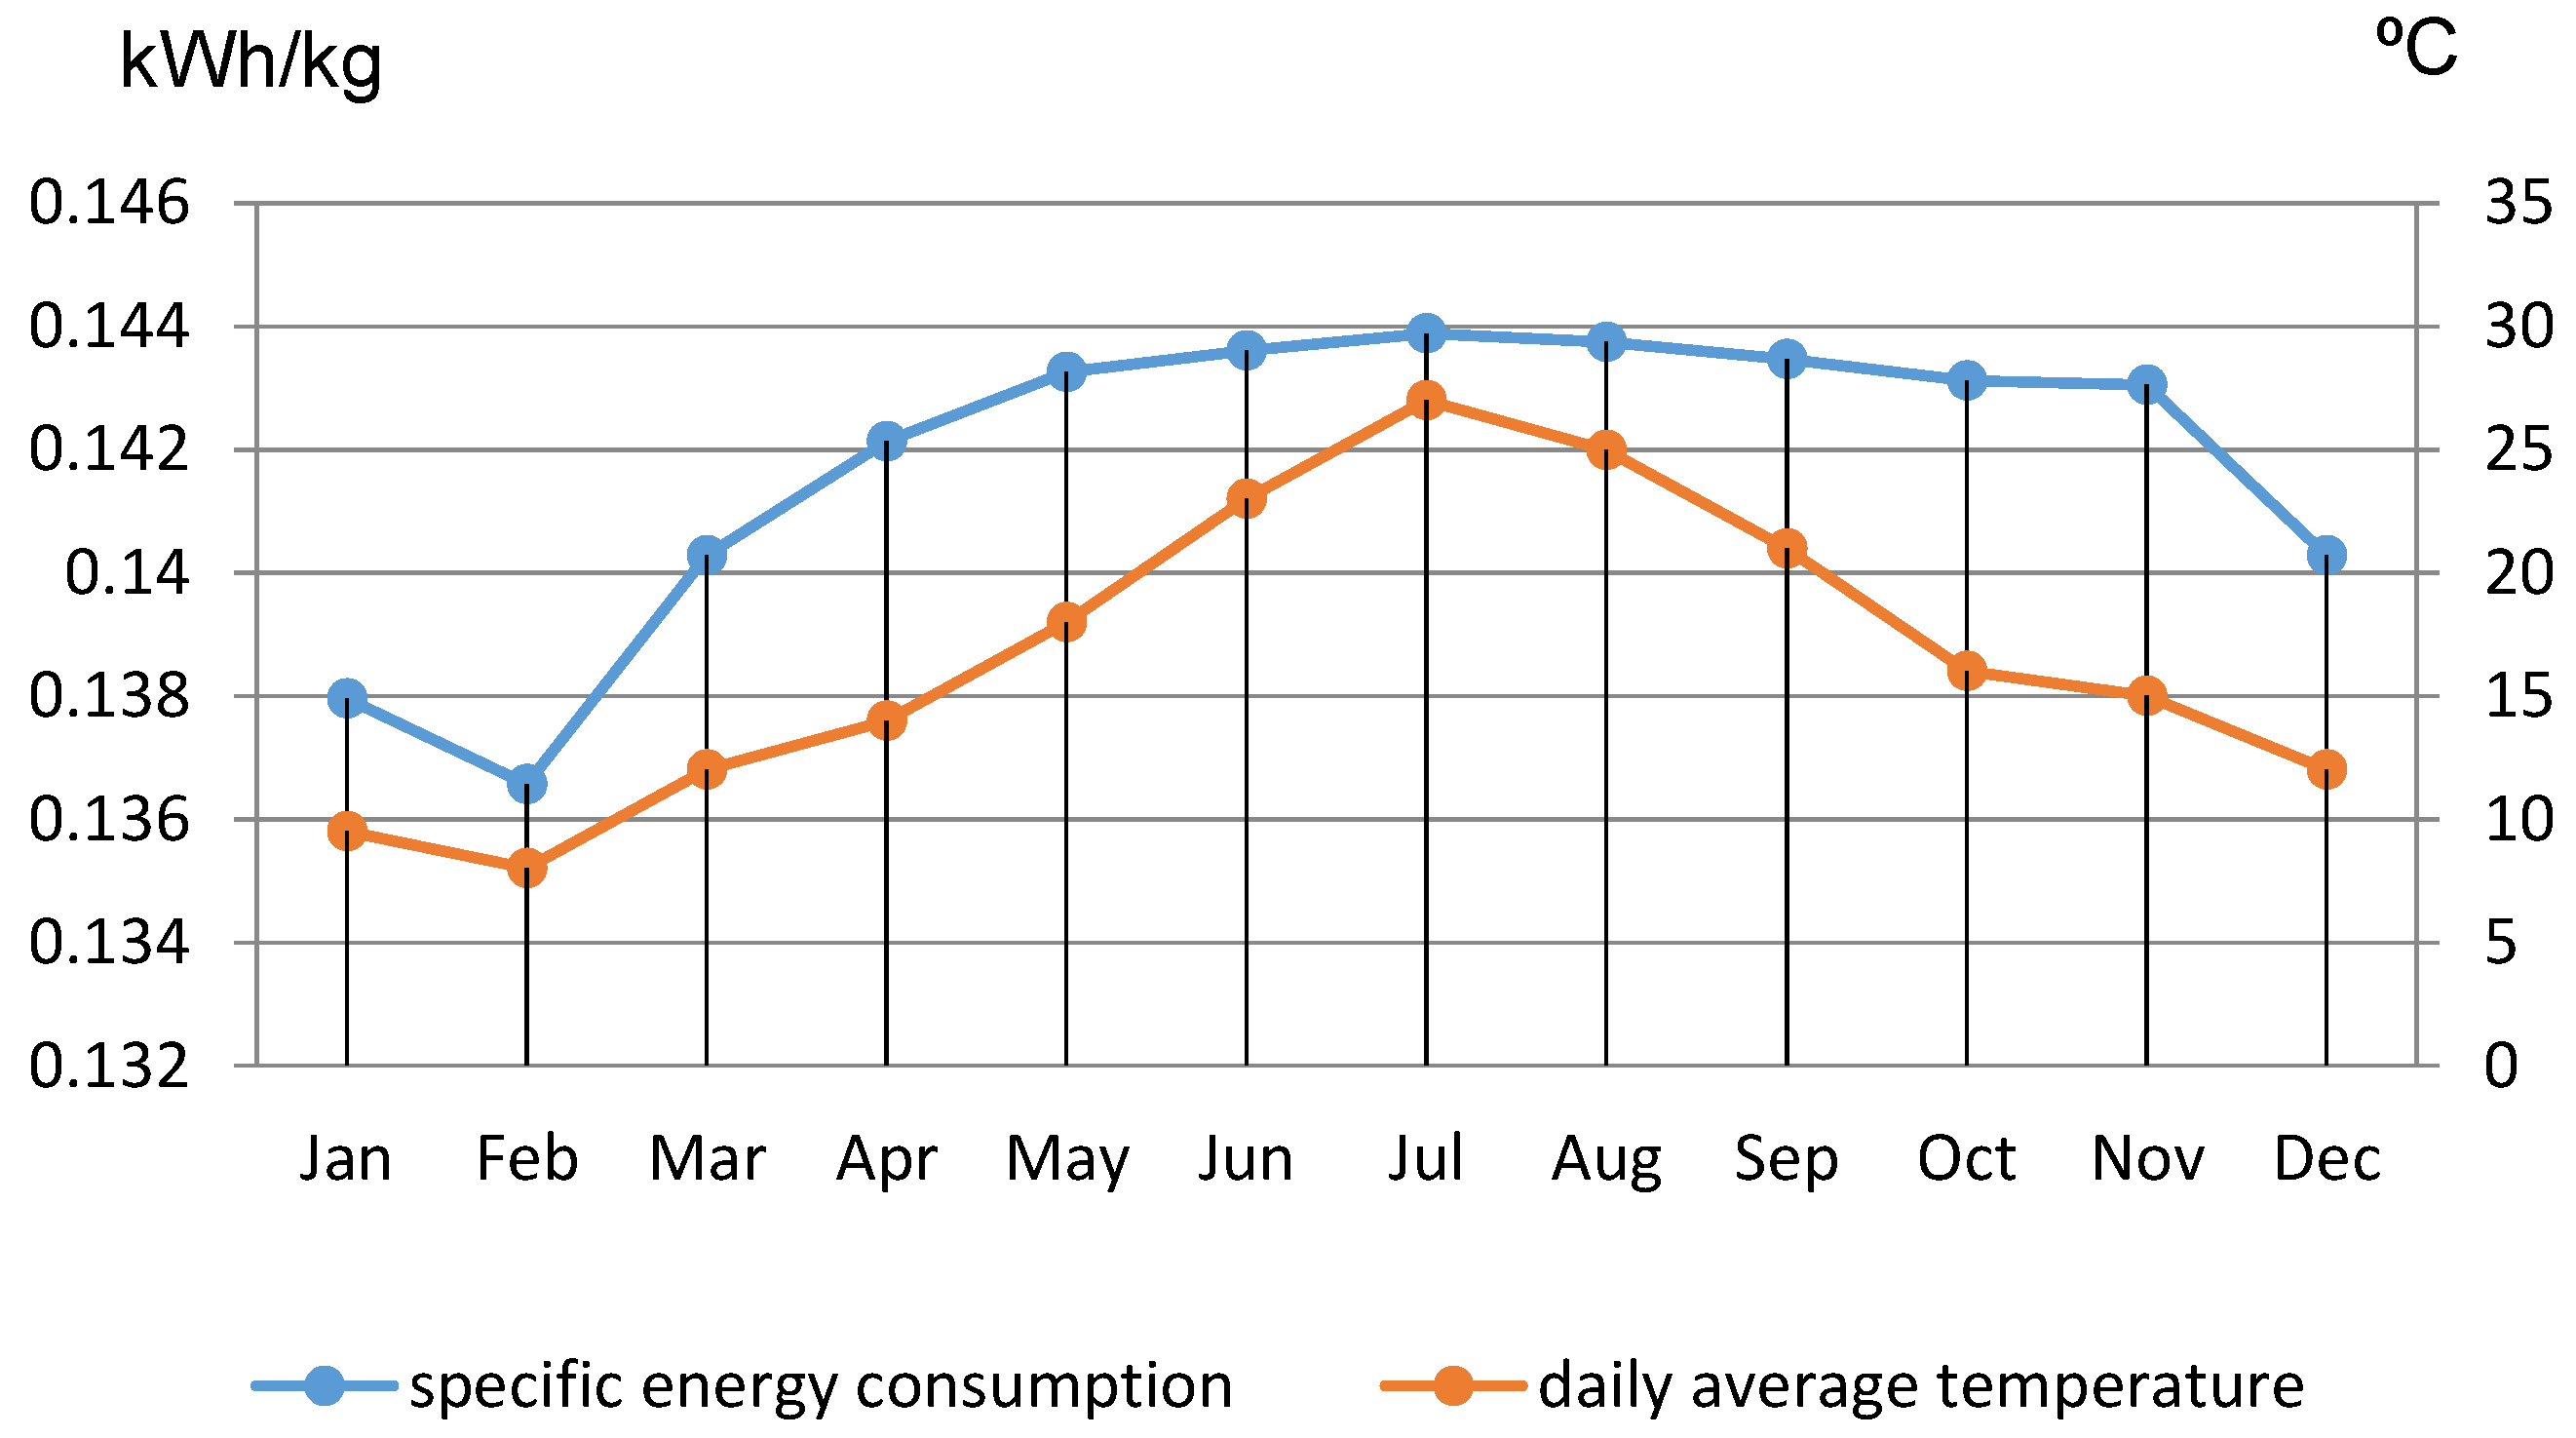
For instance, the value of the outside temperature directly influences the cooling process, which is strongly related to the thermodynamic performances of the entire compression process. As clearly shown in
Figure 8, LPCs and HPCs are obviously mainly responsible for the energy consumption for this plant process. On the other hand,
Figure 9 shows the variation of the specific compression energy required by the process compared with the average daily outdoor temperature.
At this stage, one of the most promising network configurations, to achieve a proper and sustainable use of the energy surplus deriving from the GE1, would be the direct connection of the RS to the GE1 grid to enable the direct exploitation of the electricity produced by the GE1. This approach would lead in a more sustainable primary energy use compared with the case in which the electricity derives from the national grid, since energy transmission losses would be avoided. Besides, local electricity production is increased, thus carrying out the sustainable energy planning of the Municipality of Genoa [
40].
Further enhancements could come from the possibility of preheating the returning water of the DHN using the heat generated by the compression process. More precisely, the DHN returning water has an average temperature of 60 °C depending on the operating and ambient conditions, and it can be used in support of the cooling process of the LPC intercooler where the first and the second compression-stage temperature reaches an average value of 110 °C. In this condition, it is sufficient to install a heat exchanger to enable preheating of the DHN returning water. This configuration may present some technical issues that suggest some minor modifications of the compressor manufacturing configuration, certainly for machine models. Then, it might represent a technical limitation in certain cases. On the other hand, this integration strategy would bring in a slight reduction of the primary energy used by the GE1 for heating the DHN’s water.
Finally, considering the entire CNG plant system, the energy benefits deriving from the cited upgrade and configuration are clearly summarized in
Table 2. Here, it has been estimated that 50 MWh
th per year might be recovered by the DHN from the RS plant process by considering a mean daily outdoor temperature of about 15 °C and, as previously mentioned, a constant temperature of 60 °C and 110 °C for the DHN’s returning water. This would result in a slight electricity reduction for the RS, that might range between 3 MWh
el/y and 5 MWh
el/y, considering a mean daily outdoor temperature of 10 °C and 20 °C, respectively, at 1.38 Sm
3/year of NG supplied. These savings are mostly due to a reduction in the heat load of the refrigerating units. The total mean electric consumption is then about 139 MWh
el/y, equal to the 2.7% of the yearly surplus of the GE1.
In this case, particular limits in terms of plant size or climatology of the area were not observed.
5. Conclusions
A wide possibility of energy savings and of CO2 footprint reduction comes from the exploitation of waste energy and from the matching of the features and the necessities of the users and of the suppliers.
The possibility of accomplishing this task is strongly influenced by the availability of infrastructures connecting the actors of this process, which are commonly placed away from others in space and in time.
In this paper, the need for integration led the authors to focus on two upgrades of an existing plant: the assessment of primary energy consumption for both the plants, both in the current configuration and in the configuration integrated with the demonstrator, is described.
Both analyzed interventions of the school and of the refueling station showed good results in terms of savings of heating energy in the first case, of electricity in the other one, with an energy consumption reduction respectively equal to 37,100 Sm3/y for the school and up to 5 MWhel/h for the RS.
With regard to the intervention on the school, a decrease of the net annual demand of natural gas at the expense of a significant increase of the electrical consumption was observed. The total mean electric consumption is about 152 MWhel/y, equal to 4.1% of the yearly surplus of the GE1 (or 5.8% of the surplus produced in the heating period only).
The studies allowed the observation of the performance of the heating system, with special attention to the HP, under varying climatic conditions. In particular, it can be observed that an air HP can operate efficiently only in climatic zones (or periods of the year) with a mean temperature above 7 °C.
The total electric demand (sum of the two interventions) represents about 6.8% of the yearly surplus of the GE1, i.e., the total yearly self-consumption ratio of the whole plant increases from 30% to about 34%. This outcome has shown the great potential that grid integration and energy recovery from NG expansion has for urban networks, thus improving energy efficiency in the cities. In this way, a very promising scenario with regard to the energy efficiency enhancement and GHG emissions reduction in urban areas was proposed.
Obtained results are now to be capitalized on and exploited through the dissemination of the developed technology, based on smart coupling between gas, heating, and electrical networks, which creates an effective and flexible systems integration.
The present study suggests a good level of replicability for the integrated energy grids being studied. NG expansion stations are widely present in urban areas and the demonstrator works with low mass flow rates as well, thus showing its large scalability. Moreover, the fact that the technology was tested in a city with a mild climate strengthens its reliability, since colder (more heating) and warm (more cooling) climates would further benefit of the proposed solutions. This broad applicability, which is clearly evident from the energy point of view, must be assessed financially and economically, with a specific focus on the role of tariffs rewarding CO
2 emissions reduction and on the savings that can be achieved by a large series production of the components, expressly of the turbo expander. However, these relevant topics fall beyond the scope of the present paper. Financial and economic analysis of the implemented solutions was developed by other partners in the CELSIUS consortium and relevant material can be found in the project website [
41].
As further step for this research, it might be necessary to focus research effort on other aspects that might include optimal integrated system design and control. More precisely, it would be interesting to develop multiobjective mathematical models to achieve: (1) an optimal design of the systems’ components and (2) an optimal control of the system itself. For this second purpose, it might be necessary to consider the possibility of enhancing the system’s components, including thermal and/or electrical storage technologies and, moreover, in order to achieve an online control, it is surely necessary to define proper multiload prediction models that allow a forecast with a time horizon of about 1–2 h.
Finally, the strong integration between the demonstrator and the energy policy of the city of Genoa must be underlined. In fact, the Sustainable Energy Action Plan adopted by the Municipality attributes an important role to DHC, from which a strong contribution to GHG emissions reduction is expected [
40]. At the same time, the current pricing of NG and electricity strongly limits the construction and running of CHP plants, if not carrying any added value in terms of waste energy recovery and energy grids integration. The presence in the city of Genoa of seven hubs connecting national and local NG grid offers many opportunities to replicate the tested technology. At a different level, the CELSIUS project is strongly pushing the dissemination of the demonstrators implemented within the project. More than 50 EU cities already joined the partnership as CELSIUS cities, i.e., as cities willing to replicate the waste-energy recovery solutions developed through the project, including the Genoa demonstrator.


