Article

Chemical Flooding in Heavy-Oil Reservoirs: From Technical Investigation to Optimization Using Response Surface Methodology

Department of Energy Resources Engineering, Inha University, Incheon 402-751, Korea
*
Author to whom correspondence should be addressed.
Energies 2016, 9(9), 711; https://doi.org/10.3390/en9090711
Submission received: 30 June 2016 / Revised: 23 August 2016 / Accepted: 1 September 2016 / Published: 5 September 2016
(This article belongs to the Special Issue Nanotechnology for Oil and Gas Applications)

Abstract

:
Heavy-oil resources represent a large percentage of global oil and gas reserves, however, owing to the high viscosity, enhanced oil recovery (EOR) techniques are critical issues for extracting this type of crude oil from the reservoir. According to the survey data in Oil & Gas Journal, thermal methods are the most widely utilized in EOR projects in heavy oil fields in the US and Canada, and there are not many successful chemical flooding projects for heavy oil reported elsewhere in the world. However, thermal methods such as steam injection might be restricted in cases of thin formations, overlying permafrost, or reservoir depths over 4500 ft, for which chemical flooding becomes a better option for recovering crude oil. Moreover, owing to the considerable fluctuations in the oil price, chemical injection plans should be employed consistently in terms of either technical or economic viewpoints. The numerical studies in this work aim to clarify the predominant chemical injection schemes among the various combinations of chemical agents involving alkali (A), surfactant (S) and polymer (P) for specific heavy-oil reservoir conditions. The feasibilities of all potential injection sequences are evaluated in the pre-evaluation stage in order to select the most efficient injection scheme according to the variation in the oil price which is based on practical market values. Finally, optimization procedures in the post-evaluation stage are carried out for the most economic injection plan by an effective mathematic tool with the purpose of gaining highest Net Present Value (NPV) of the project. In technical terms, the numerical studies confirm the predominant performances of sequences in which alkali-surfactant-polymer (ASP) solution is injected after the first preflushing water whereby the recovery factor can be higher than 47%. In particular, the oil production performances are improved by injecting a buffering viscous fluid right after the first chemical slug rather than using a water slug in between. The results of the pre-evaluation show that two sequences of the ASP group have the highest NPV corresponding to the dissimilar applied oil prices. In the post-evaluation, the successful use of response surface methodology (RSM) in the estimation and optimization procedures with coefficients of determination R2 greater than 0.97 shows that the project can possibly gain 4.47 $MM at a mean oil price of 46.5 $/bbl with the field scale of a quarter five-spot pattern. Further, with the novel assumption of normal distribution for the oil price variation, the chemical flooding sequence of concurrent alkali-surfactant-polymer injection with a buffering polymer solution is evaluated as the most feasible scheme owing to the achievement of the highest NPV at the highly possible oil price of 40–55 $/bbl compared to the other scheme.

Graphical Abstract

1. Introduction

Heavy oil is one of the major commercial deposits on Earth, with the three largest reserves belonging to Russia, Canada and Venezuela; in particular this type of crude oil is the main resource in Northern Alberta in Canada [1,2]. Basically, heavy oil is defined as crude oil which has a viscosity ranging from 100 to 10,000 cp and gravity smaller than 20 oAPI; thus, the requisite oil recovery methods face many challenges compared to those used for conventional oil reservoirs [1]. Recently, the utilization of chemical flooding has become an attractive and feasible method for recovering a large volume of heavy oil when the traditional thermal methods are not suitable, as in the case of thin pay-zone reservoirs or when overlying permafrost exists [3]. Many previous works have demonstrated the proper applications of alkaline (A)–surfactant (S)–polymer (P) injections in the Enhanced Oil Recovery (EOR) stage for both conventional and heavy-oil reservoirs. Atsenuwa, et al. classified heavy oil with viscosities that ranged from 50 to 50,000 cp, they pointed out that the capillary forces between water and heavy oil are higher than those between water and light oil [4]. Asghari and Nakutnyy carried out experimental work on the application of polyacrylamide for extracting heavy oil; they concluded that a polymer concentration in the injected fluid higher than 5000 ppm is required to effectively recover oil for injection rates of less than 29.6 m3/day [5]. Nevertheless, by using polymer with viscosities in the range of 2000–5000 cp to sweep the trapped oil by core-flood tests, Bodino et al. observed an insignificant increase in the recovery factor when the viscosity of the polymer solution was changed from 3 to 60 cp [6]. In terms of the use in offshore heavy-oil reservoirs, Kang and Jian presented the main problems on oil recovery and concluded that the water salinity was the most important factor affecting the success of polymer flooding processes [7]. Alsofi et al. demonstrated that the streamline simulation scheme showed better performance than the conventional simulation scheme for polymer core-flood tests; further, they determined that the polymer solution should be injected as soon as possible before any water flooding for achieving the best outcomes [8]. In contrast, Zhou et al. conducted experiments on various chemical flooding sequences and showed the importance of a second polymer slug after the first chemical injection with an injected water slug in between [9]. They also found that the polymer was the most dominant element in chemical flooding, and the polymer concentration was the crucial factor in enhanced heavy oil recovery. Even though core-flood tests are always carried out in laboratories before executing any pilot tests in the field, Yooybari et al. found that prediction of the oil recovery using core-flood investigations was unreliable compared to the use of field measurements; they stressed that the most important part of a successful polymer flooding process must be derived on the basis of the screening procedures from the viewpoints of either technical or economic feasibility [10].
Although the utilization of polymer mainly aims to improve the sweep efficiency by properly controlling the mobility of the displacing fluids, alkali and surfactant were also considered as the most effective agents for making the oil moveable by reducing the interfacial tension (IFT) between oil and water (O-W). Dong et al. investigated the displacement mechanisms of alkaline–surfactant flooding by using the glass micromodel, the results showed that alkaline injection formed the water-in-oil (W/O) emulsion and effectively blocked the water channels, therefore improved the sweep efficiency; furthermore, the addition of a dilute surfactant to an alkaline solution could form an oil-in-water (O/W) emulsion, which makes the heavy-oil droplets moveable [11]. Theoretically, alkali generates an in-situ surfactant in the reservoir by reacting with the natural acid components of the oil, and this agent also can partly alter the rock wettability in some specific rock systems [12,13]. Pei et al. demonstrated the highly sensitive effects of alkali on the IFT properties for heavy oil with low acid number compared to the oil with high acid number [14]. In their experimental works, they also determined a cost-effective EOR process when utilizing alkaline flooding for acidic heavy-oil reservoira; in particular, Na2CO3 performed better than NaOH in terms of lowering the IFT value. Basically, the combination of alkali, surfactant, and polymer in appropriate concentrations helps to drastically improve the heavy oil production compared to the use of individual agents [15,16,17]. In the work of Luo et al., surfactant–polymer flooding has been demonstrated to be a favorable combination for a heavy-oil sample from Western Canada when the alkaline solution was prone to cause severe scaling near the wellbore region; they determined that it was difficult to form the O/W emulsion with a SP system owing to its high viscosity, thereby decreasing the oil recovery enhancement level [18]. Further, the work of Feng et al. affirmed the ineffective application of the combined ASP flooding due to the severe problems of emulsification as well as precipitation [19]. Moreover, SP flooding could increase the recovery factor by 13%–20%, which was significantly higher than single polymer flooding under the same conditions. However, they found that only the surfactant could not reduce the IFT between O-W to the desired ultralow value. On the contrary, the combined ASP flooding was demonstrated to be more attractive than SP flooding in the work of Bataweel and Nasr-EI-Din in terms of reaching the ultralow IFT and high tertiary heavy oil recovery [20]. Therefore, the most effective combinations so far are still of concern owing to the dependences on the reservoir conditions, oil properties, laboratory testing conditions, and feasible practical application in the field.
Among the disputes concerning chemical use, there are controversies regarding the use of optimization algorithms as they must be perfectly applied to obtain the highest profit or maximize the ultimate oil recovery with the lowest time and cost expenses. The work of Zerpa et al. evaluated the optimization algorithms of surrogate models for various scenarios of ASP flooding in terms of the objective function and oil recovery factor for conventional oil reservoirs. They investigated the use of multiple surrogates for identifying alternative optimal solutions corresponding to different regions of the design space [21]. Moreover, the response surface approach for ASP flooding proposed by Zerpa et al. proved to be an effective mathematic methodology for optimizing the chemical slug size in comparison with the suggested volume from a laboratory design [22]. Regarding real applications in the field, a response surface has been considered to optimize the alkali and surfactant concentrations in the clastic reservoir of the Angsi field in the Malay basin, as in the published works of Ghadami et al. [23]. They concluded that it was not necessary to take into account all of the parameters in the sensitivity analysis; instead, only the effects of the important designed chemical parameters such as the chemical concentrations, initiation time, or slug sizes needed to be investigated. Although there are few published works that use the RSM methods in the sensitivity analysis and optimization of chemical flooding so far, this mathematical tool has been successfully applied in other geological uncertainty processes. The main effect method which displays first-order Sobol indices for the response surface was used for uncertainty and sensitivity analysis on assessing the CO2 injectivity, area of review and gas migration rate in the work of Dai et al. for carbon sequestration [24]. In the recent research of Dai et al. the response surface analysis was conducted by using the multi-variate adaptive regression spline for the risk factor metric in CO2 injection and storage [
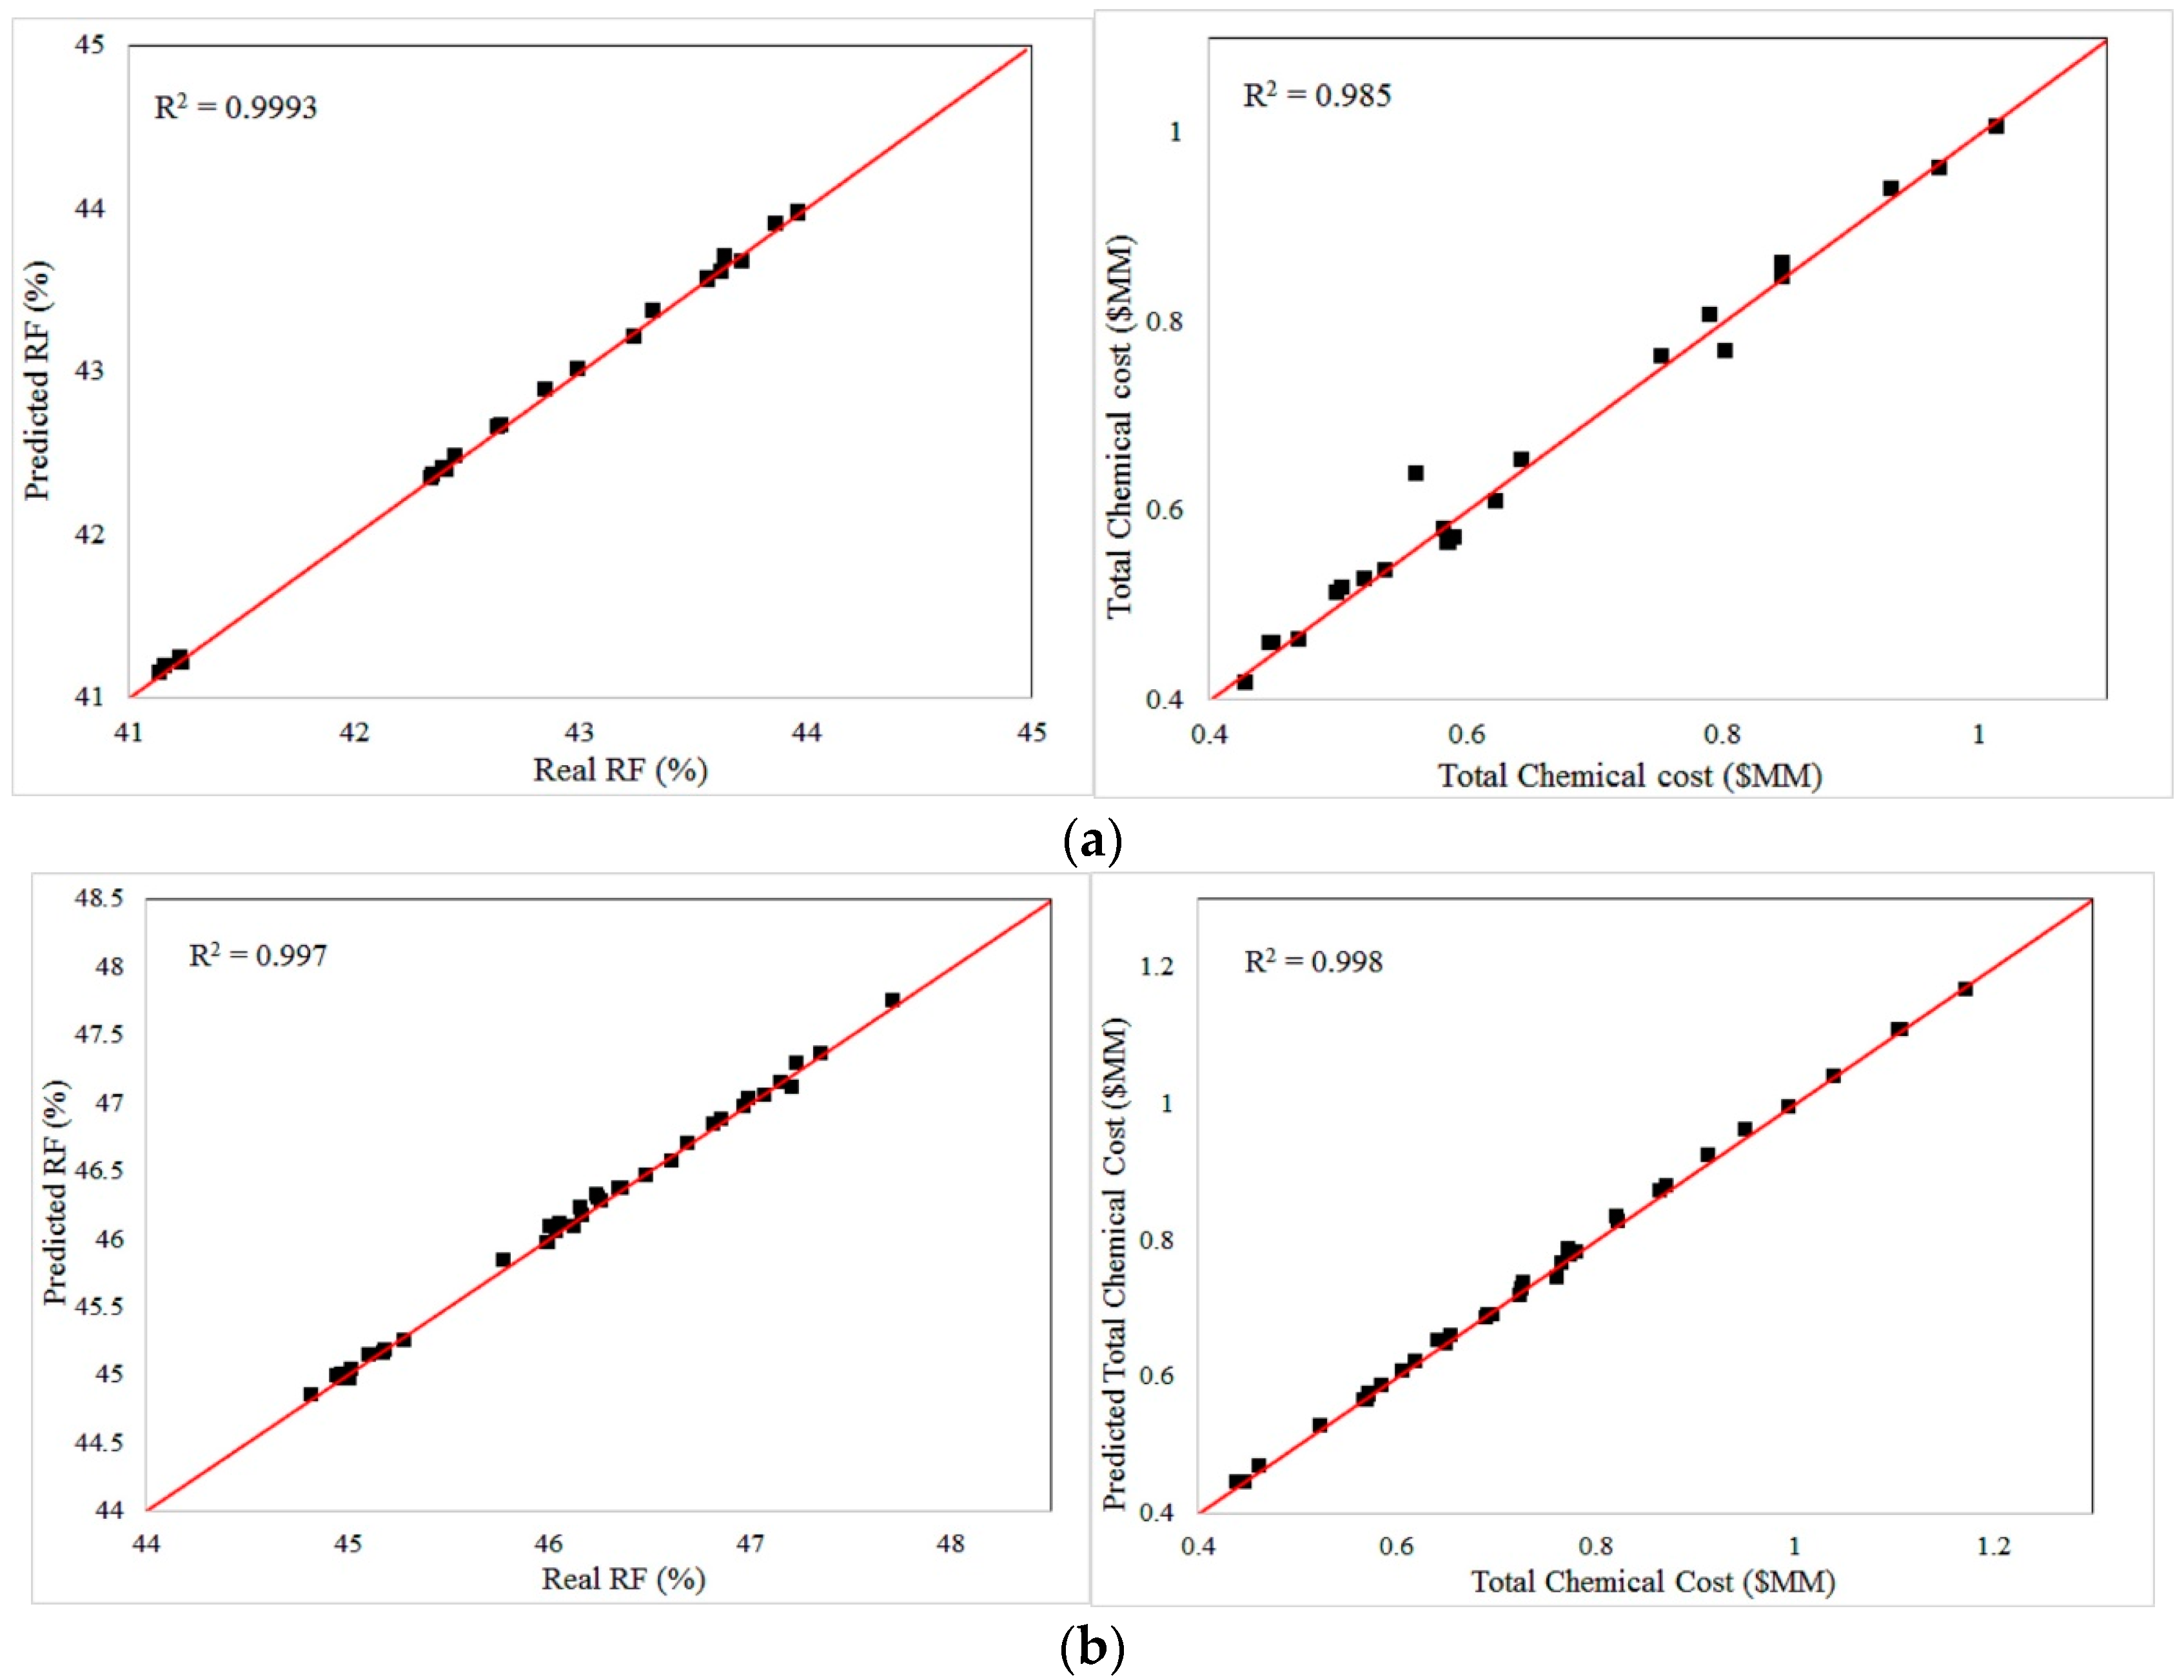
25]. From the results, the obtained coefficients of determination, R2, were higher than 0.95 and absolutely indicated the reliable representation of the response models for evaluating the interactions of CO2, oil, gas and brine water for CO2-EOR environmental issues. Moreover, the study of Pan et al. about uncertainty analysis of CO2-EOR processes concluded that the determination value R2 larger than 0.9 was acceptable for predicting the physical behaviors of the processes by the integrated RSM and Monte Carlo algorithms [26].
As there are many controversies regarding the utilization of chemicals for viscous oil recovery, this work investigates the flooding performances of different potentially combined chemical agents for the enhanced heavy-oil recovery by numerical studies in order to determine the most efficient combination for specific reservoir conditions. A heavy-oil reservoir model with quarter five-spot pattern is in the STARS simulator of the Computed Modelling Group (CMG). Both the injector and producer are horizontal wells installed in the near-bottom layers owing to the high productivity [
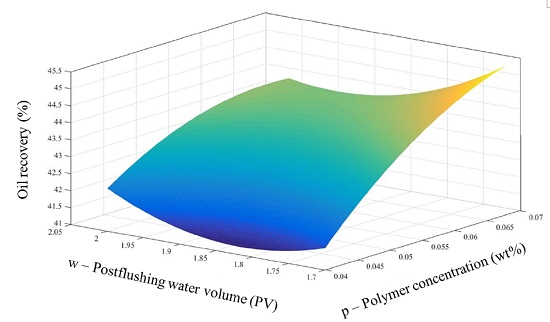
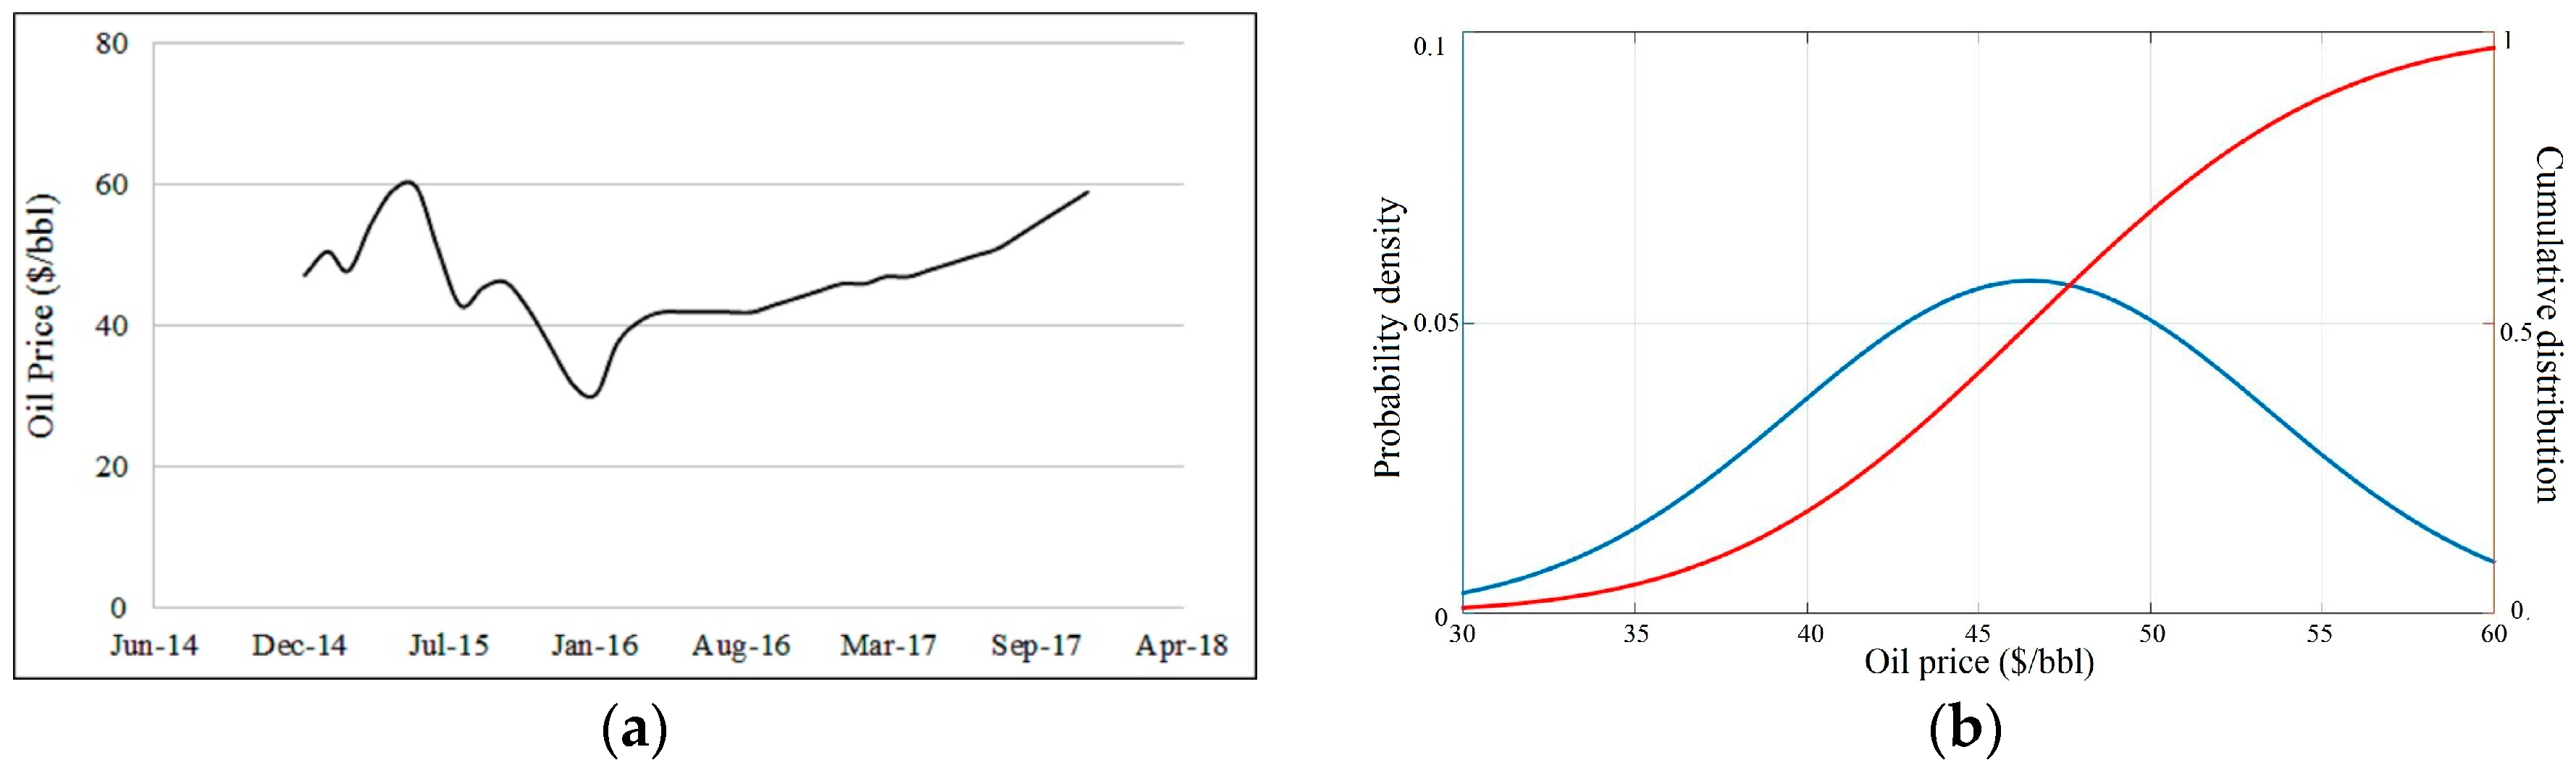
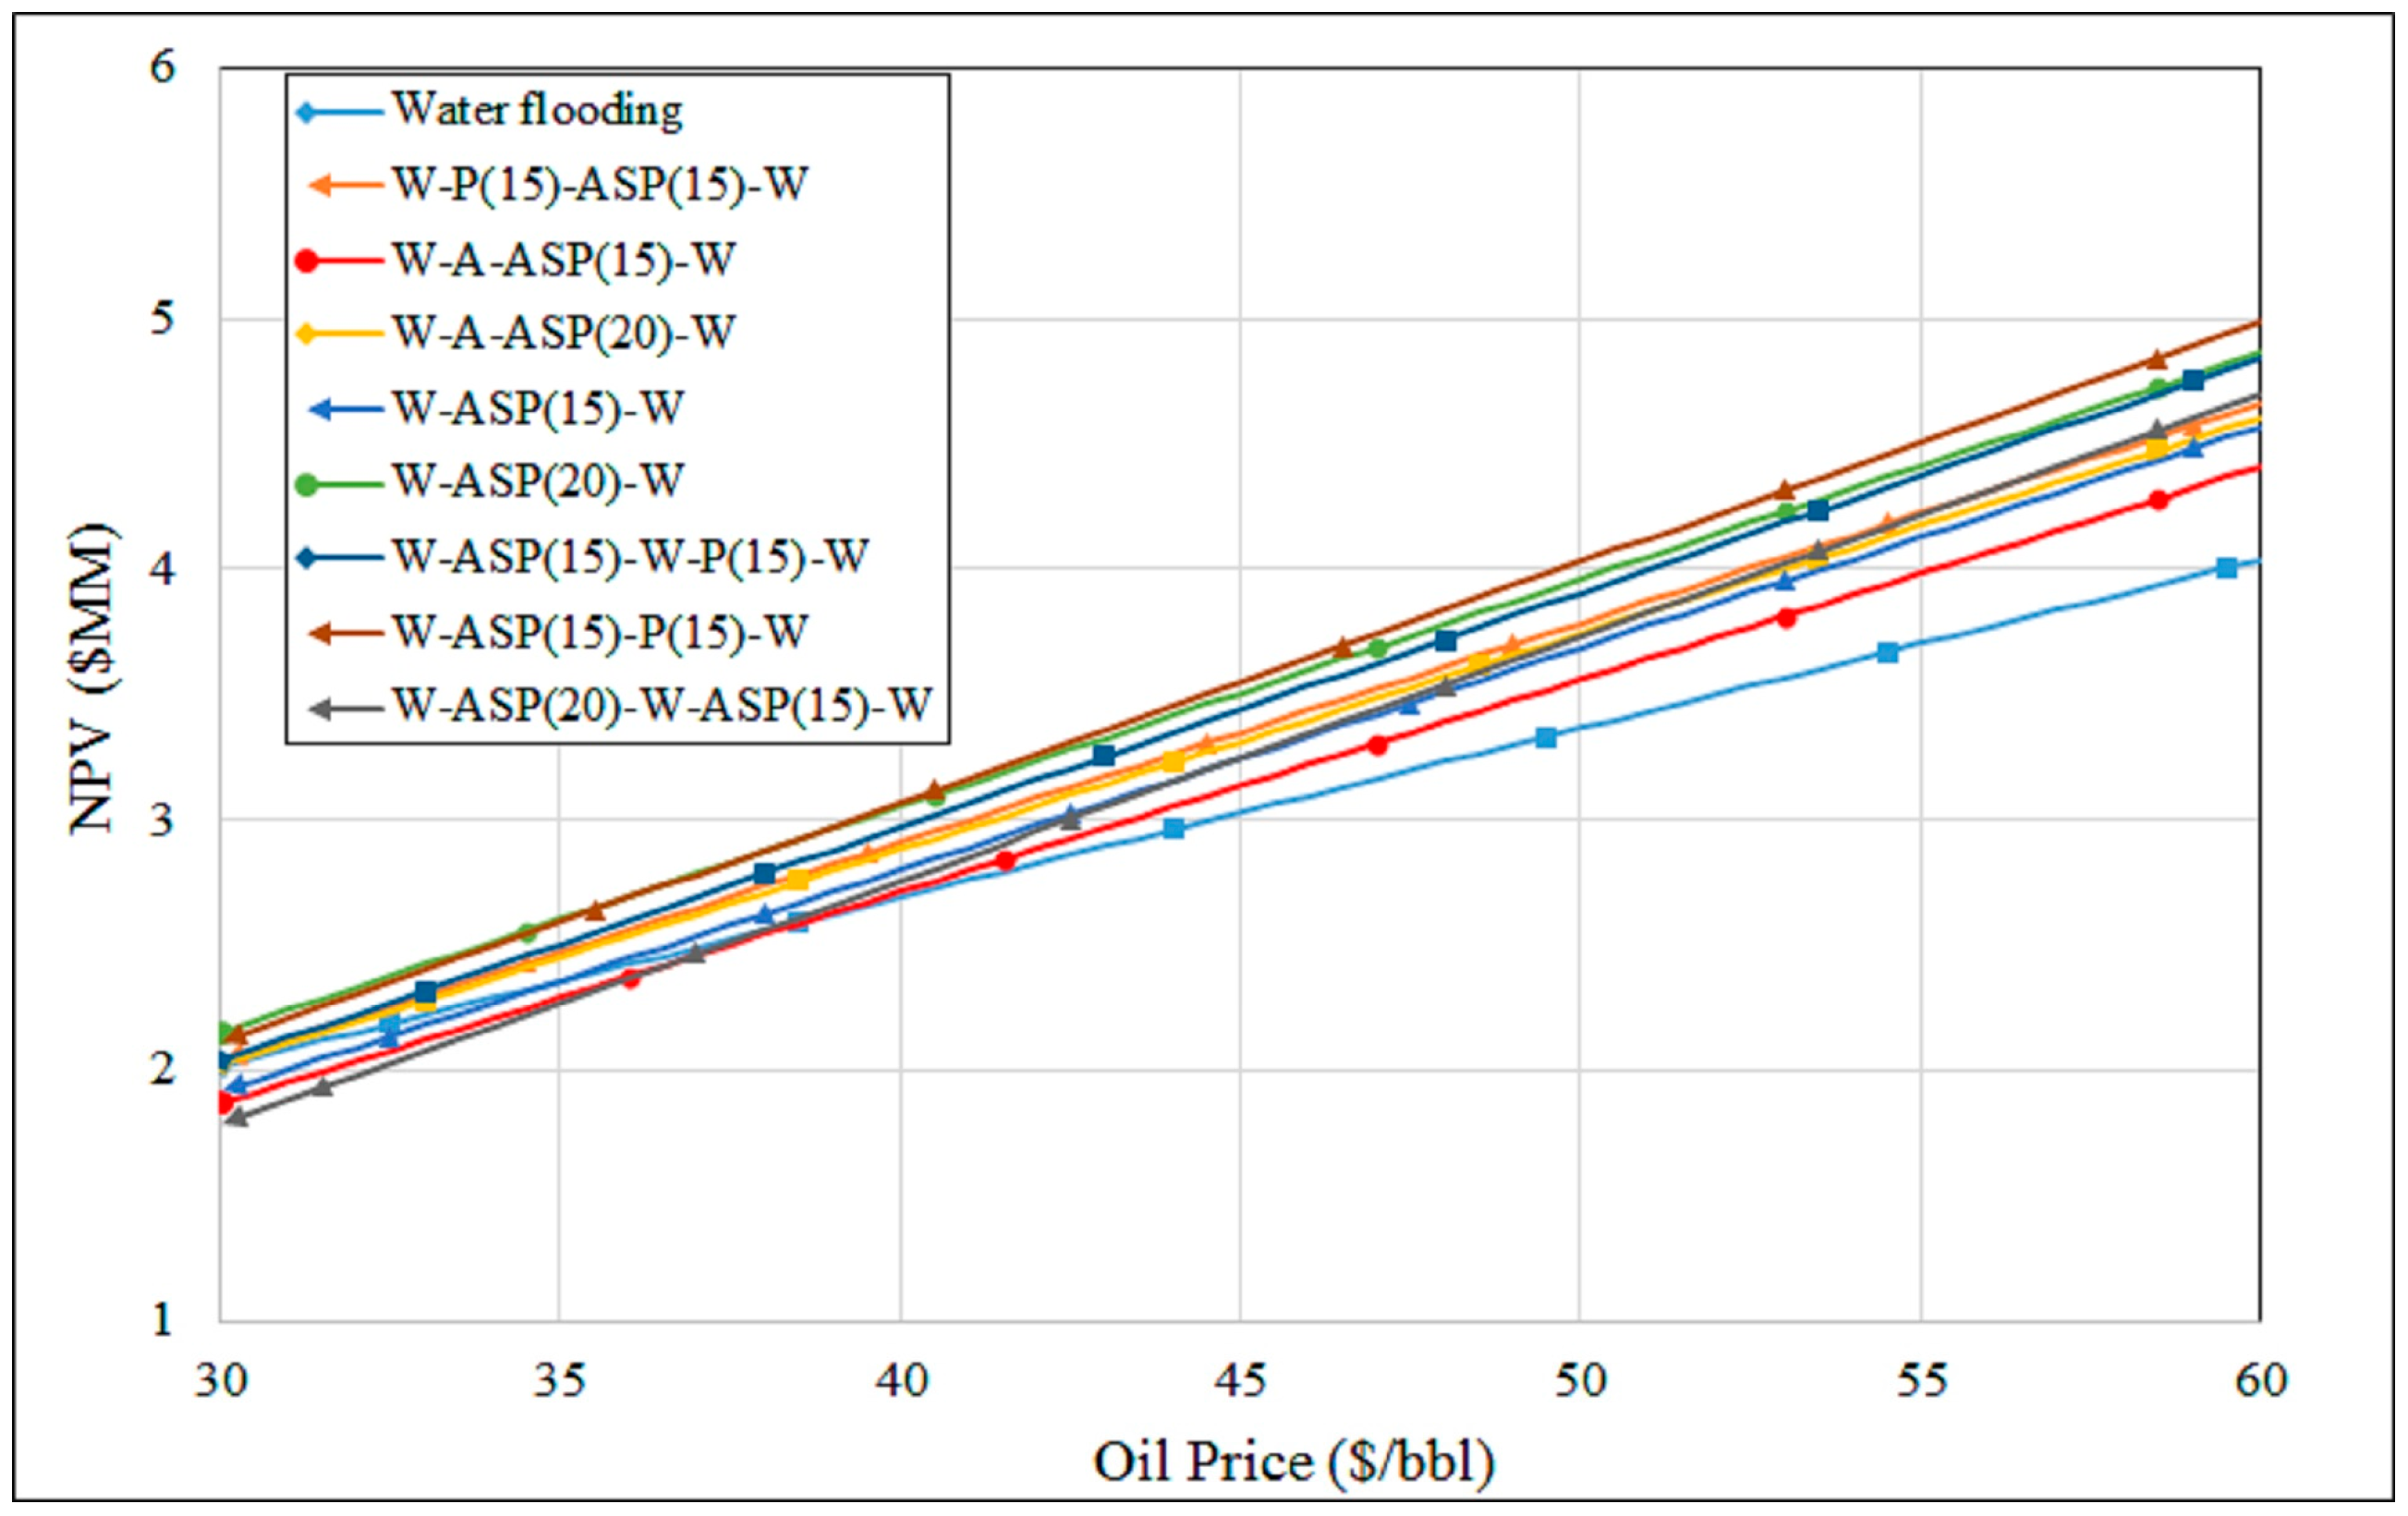
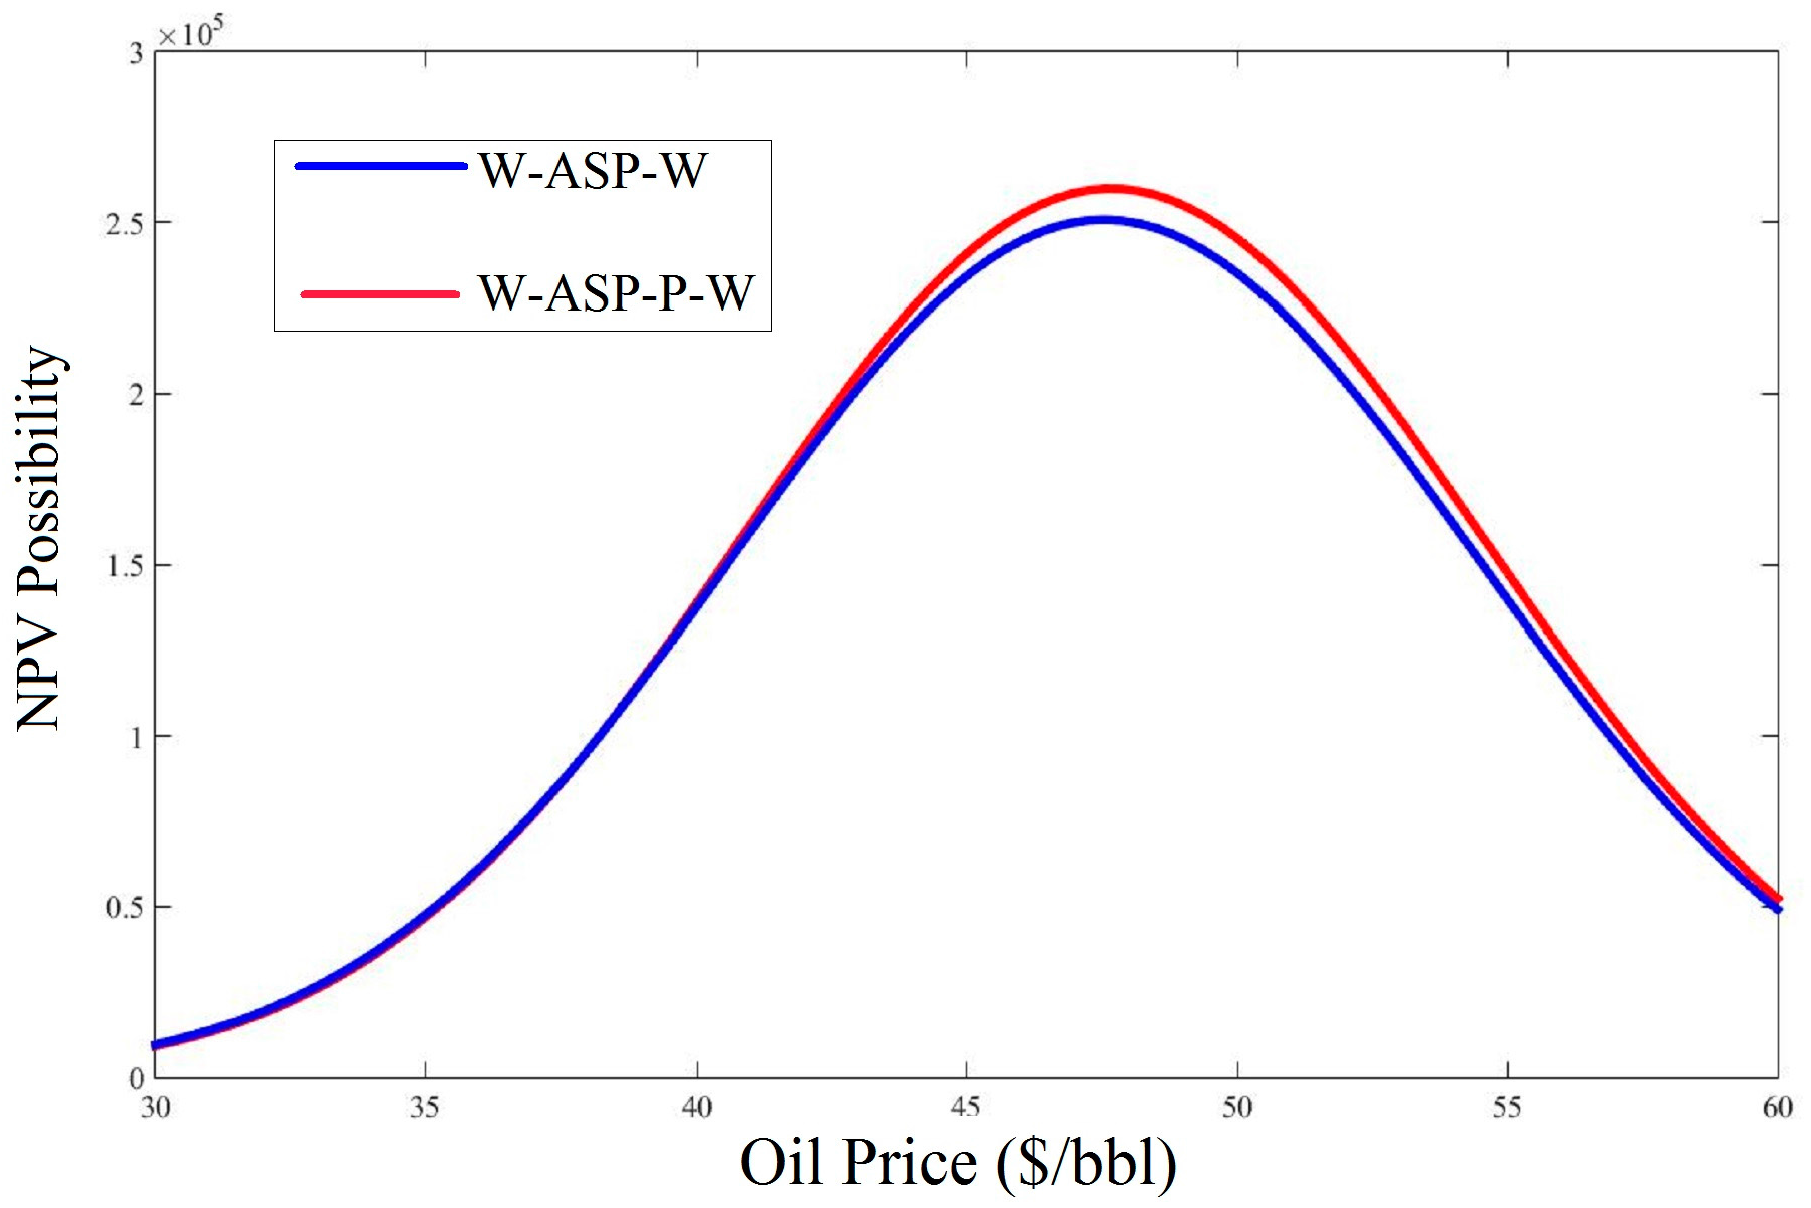
27]. All possible potential chemical flooding sequences are grouped and investigated separately before carrying out the pre-evaluation stage where the general commercial assessments are primarily considered. The fixed chemical costs and the variation in the oil price are proposed for the economic pre-evaluation instead of fully applying the financial terms of the project. In the economic post-evaluation, the quadratic response surface models are applied for the purpose of optimizing the final net present value (NPV) as well as the uncertainty of the calculated NPV according to the oil price variation.
Practically, the consideration of both technical and economic aspects—as in this work—assist considerably in understanding the performances of disparate flooding processes, thereafter properly selecting the most outstanding flooding sequences, and finally contributing to comprehensive evaluations for the uncertainty analysis. As there has been no published consideration of an RSM for the optimization of enhanced heavy oil recovery by chemical flooding, the novel approach described in this work will promisingly contribute to the real project assessment with a simpler but still effective tool. Moreover, as the chemical flooding processes have been integrated into the STARS simulator and demonstrated to have high accuracy level of simulation by previous works [28], the three-dimension (3D) numerical results of this study can be certainly acceptable and reliable for reference by the industry.

2. Reservoir Model

The 3D model of a specific heavy-oil reservoir consisting of five different permeable layers is built. Either the porosity or permeability are interpolated by using the geostatistical function of the simulator, with the range values of 0.28–0.35 for the porosity throughout the entire reservoir and a range values of 700–4000 mD for the absolute permeability, as listed in Table 1. Generally, these assumptions are necessary to simplify the reservoir model as a multi-layer system when closely adopting the practical conditions of a real reservoir. The dimensions of the reservoir in a quarter five-spot pattern are 114.33 × 114.33 × 10.67 m3 with a designed grid system of 30 × 30 × 5 gridblocks. The initial setup conditions of the reservoir were partly obtained from the work of Zhou et al. [9]. The horizontal injection and production wells are installed so that they are completely parallel with a length of 110.2 m. In terms of the wettability, the reservoir rock is assumed to be a water-wet rock system with the water saturation of 25% at the initial time, and only two phases (oil and water) are considered for the simulation runs.
Obviously, the reservoir conditions are completely adequate for utilizing chemical flooding according to the published screening criteria of the hydrocarbon formation types and initial fluid properties as well as well pattern design of the heavy-oil reservoir. In detail, the reservoir temperature is much less than 93.3 °C which is the limit point for surfactant and alkaline flooding, while polymer solution can maintain its viscosity at 99 °C [29]. Furthermore, as other requirements such as the nonexistence of gas cap or aquifer, absolute permeability higher than 10 mD, formation water salinity not over 50,000 ppm and the smallest moveable oil saturation of 30%, the considered reservoir is a great candidate for deploying chemical injection in term of technical aspects.

3. Flooding Strategies

Many previous works have demonstrated successful injection plans by using either single or combined chemical flooding to improve heavy-oil production. A very early pilot test in the Gudong oil field including four injectors and nine producers observed successful results, in which the ultimate oil recovery by ASP flooding increased by 13.4% compared to water flooding, where the oil recover rate could reach 76.6 t/day [30]. The later commercial tests of ASP flooding in the Central Xinger area of the Daqing oil field with a total of 45 wells also demonstrated satisfactory production performance, where the oil rate could be up to 180 t/d and the obtained oil recovery by ASP flooding was nearly 21.52% of the original oil in place (OOIP) [31]. Further, the most recent report in 2014 of Oil & Gas Journal presented the officially successful polymer flooding projects in the Pelican Lake field, with a total oil production rate higher than 3180 m3/day. With thin pay zones and highly viscous oil properties, the utilization of chemical flooding has been proposed to extract the crude oil in the west-central part of Saskatchewan (Canada) as the thermal method is unsuitable and water flooding could only recover 8.5% of the OOIP in some reservoirs [18].
Theoretically, the use of alkali aims to generate an in-situ surfactant/soap by reacting with the natural acids in oil in order to reduce the IFT between O-W, which makes the removal of crude oil easier thereafter [32,33]. Furthermore, the penetration of the alkaline solution into the crude oil causes the formation of a W/O emulsion, thereby reducing the mobility of the displacing fluids and diverting the injected fluids into the unswept region, resulting in an improvement in the sweep efficiency [34]. A synthetic surfactant is mainly employed to reduce the IFT between O-W by forming a microemulsion with a limited range of concentrations [35]. The combination of alkali and the synthetic surfactant (AS) helps to reduce the IFT between O-W in higher level, thereby remedying the issues of alone alkaline injection, such as generating insufficient IFT reduction due to the lack of the in-situ generated surfactant due to low acid contents in oil [36]. However, the injected fluids for AS flooding still have very low viscosity compared with that of crude oil; therefore, the improvement in the mobility is not considerable to sweep the reservoir thoroughly, and causing the water channel as a consequence. The injection of the polymer solution is a unique method for increasing the viscosity of the displacing fluids, thereby significantly improving the sweep efficiency as a result of better mobility control and water channel mitigation. In addition, in a multi-layer system, the injected water containing polymer also develops the crossflow between the low- and high-permeability layers that is resulted from the shear-thinning behavior of the polymer solution [37]. The contemporary injection of alkali, synthetic surfactant, or both of them with the polymer solution will increase the displacement efficiency as the result of the IFT reduction at high level, combining with the improvement on the sweep efficiency by enlarging the oil swept area caused by blocking the water channel assistant, thereby enhancing the final oil recovery [38]. In summary, the most relevant possibility for combined chemical injection can basically be AS or ASP solutions. Further, the fluid slug injected after the preflushing water and before the final postflushing water should also be taken into consider in order to perfectly enhance the flooding performance.
Artificial water (or simply “water”) is generated by adding salt to clean water. The base cases of the flooding strategies for all sequences are presented in Table 2. Principally, all sequences are initiated with a preflushing water slug and terminated with a postflushing water slug. The concentrations of the individual flood types are designed as follows:
Water flooding: complete water injection throughout the project.
A—2.08% in volume (vol %) alkali in the solution.
AS—(proceeding after A) 3.9 vol % alkali combined with 4.2 vol % surfactant in the solution.
AS—(proceeding after W) 1.68 vol % alkali combined with 0.04 vol % surfactant in the solution.
ASP(15)—2.12 vol % alkali combined with 0.132 vol % surfactant and 540-ppm polymer in the solution. Initially, the fluid has a viscosity of nearly 15 cp.
ASP(20)—2.12 vol % alkali combined with 0.132 vol % surfactant and 680-ppm polymer in the solution. Initially, the fluid has a viscosity of approximately 20 cp.
P(15)—550-ppm polymer in the solution. Initially, the fluid has a viscosity of approximately 15 cp.
P(20)—690-ppm polymer in the solution. Initially, the fluid has a viscosity of nearly 20 cp.
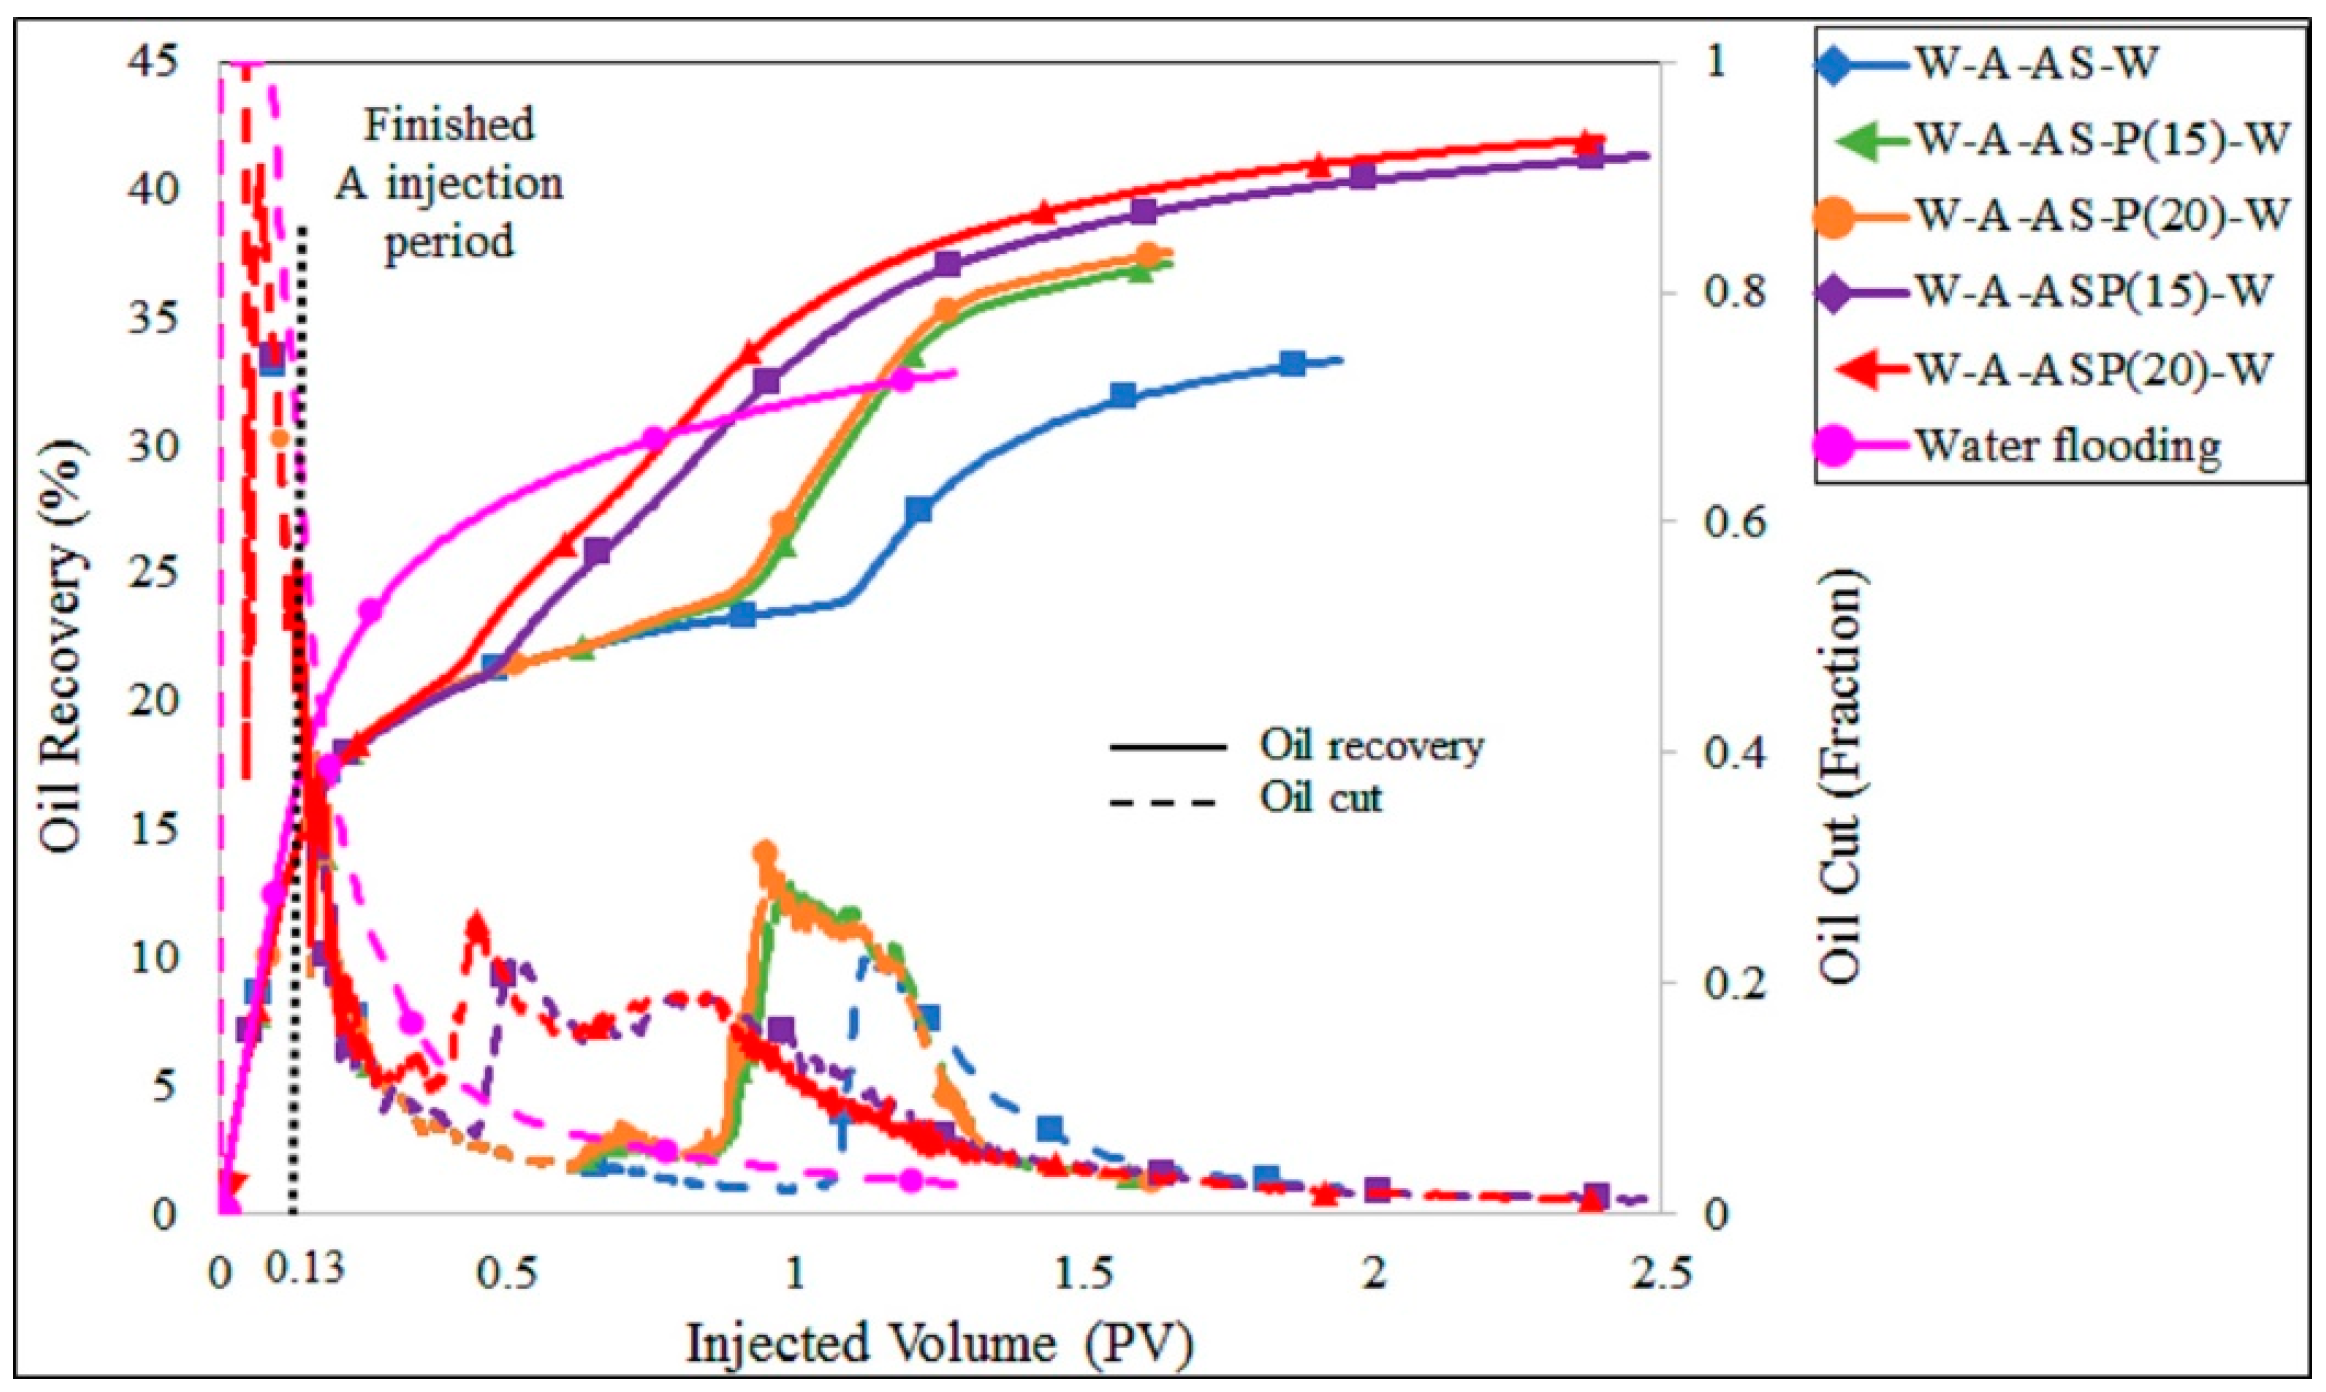
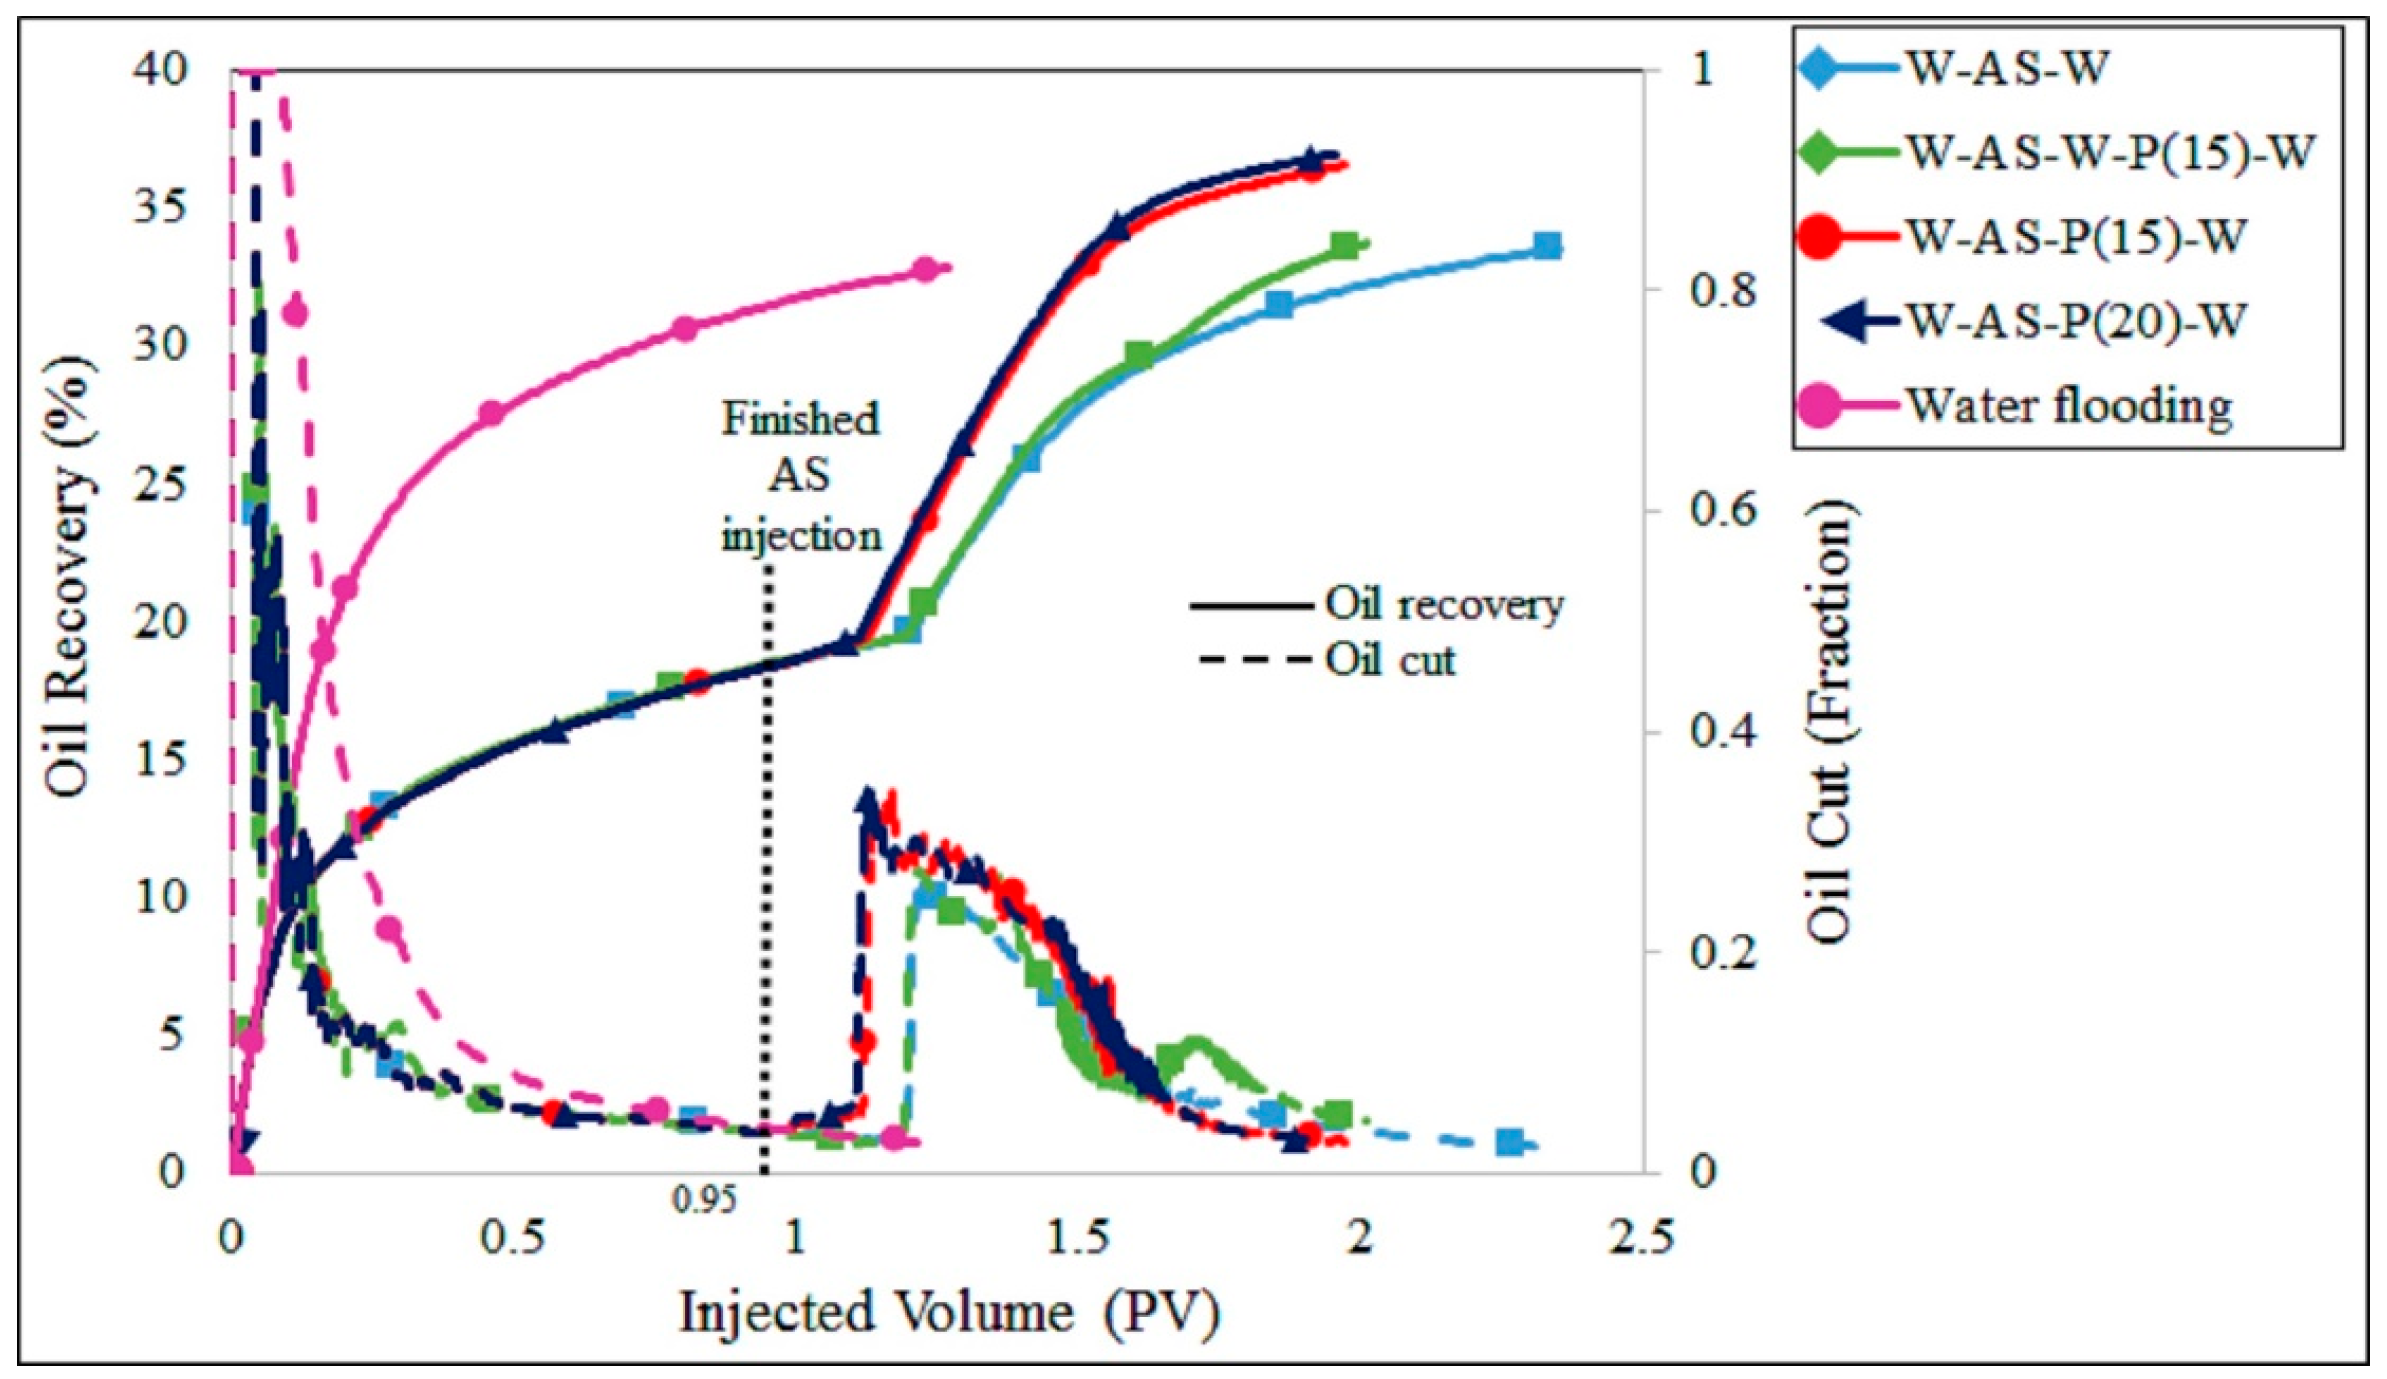
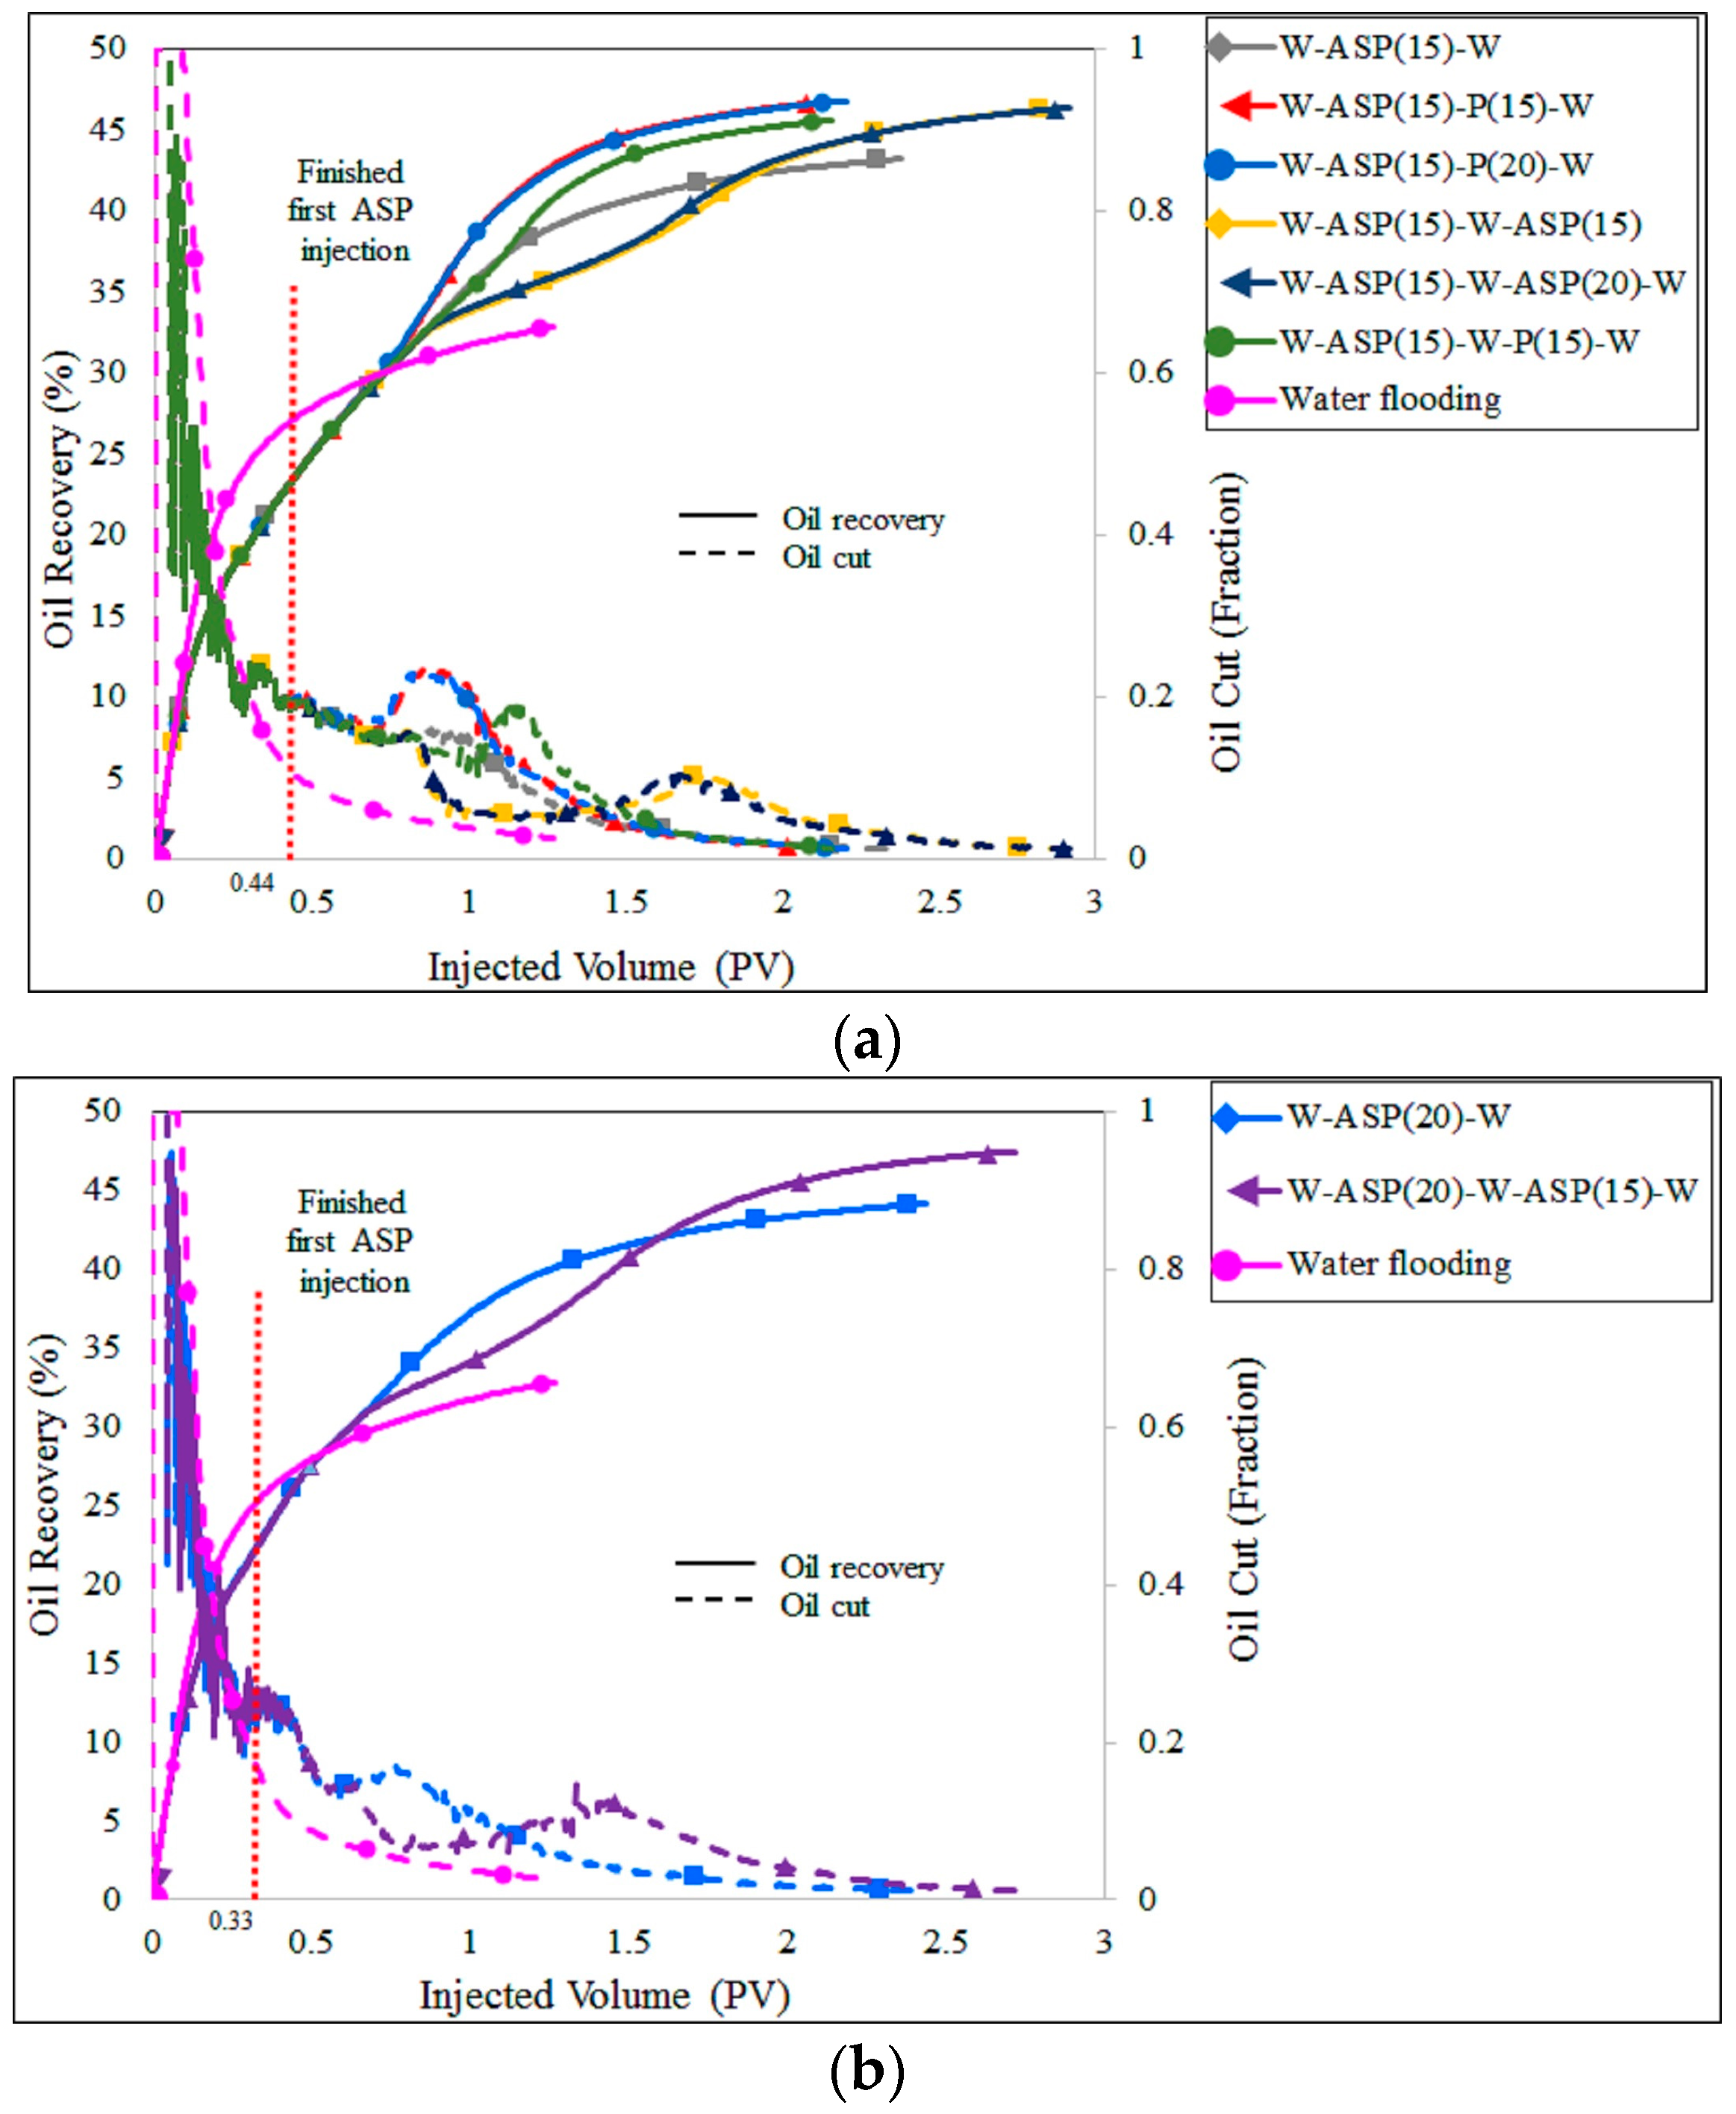
On the basis of the first chemical slug type after preflushing with water, the flooding sequences can be divided into four main groups of flooding, namely (A), (AS), (ASP), and (P), as presented in Table 2. These groups are analyzed separately before being considered for a comprehensive evaluation. The similar injection strategies in each group with a final oil rate of 1.59 m
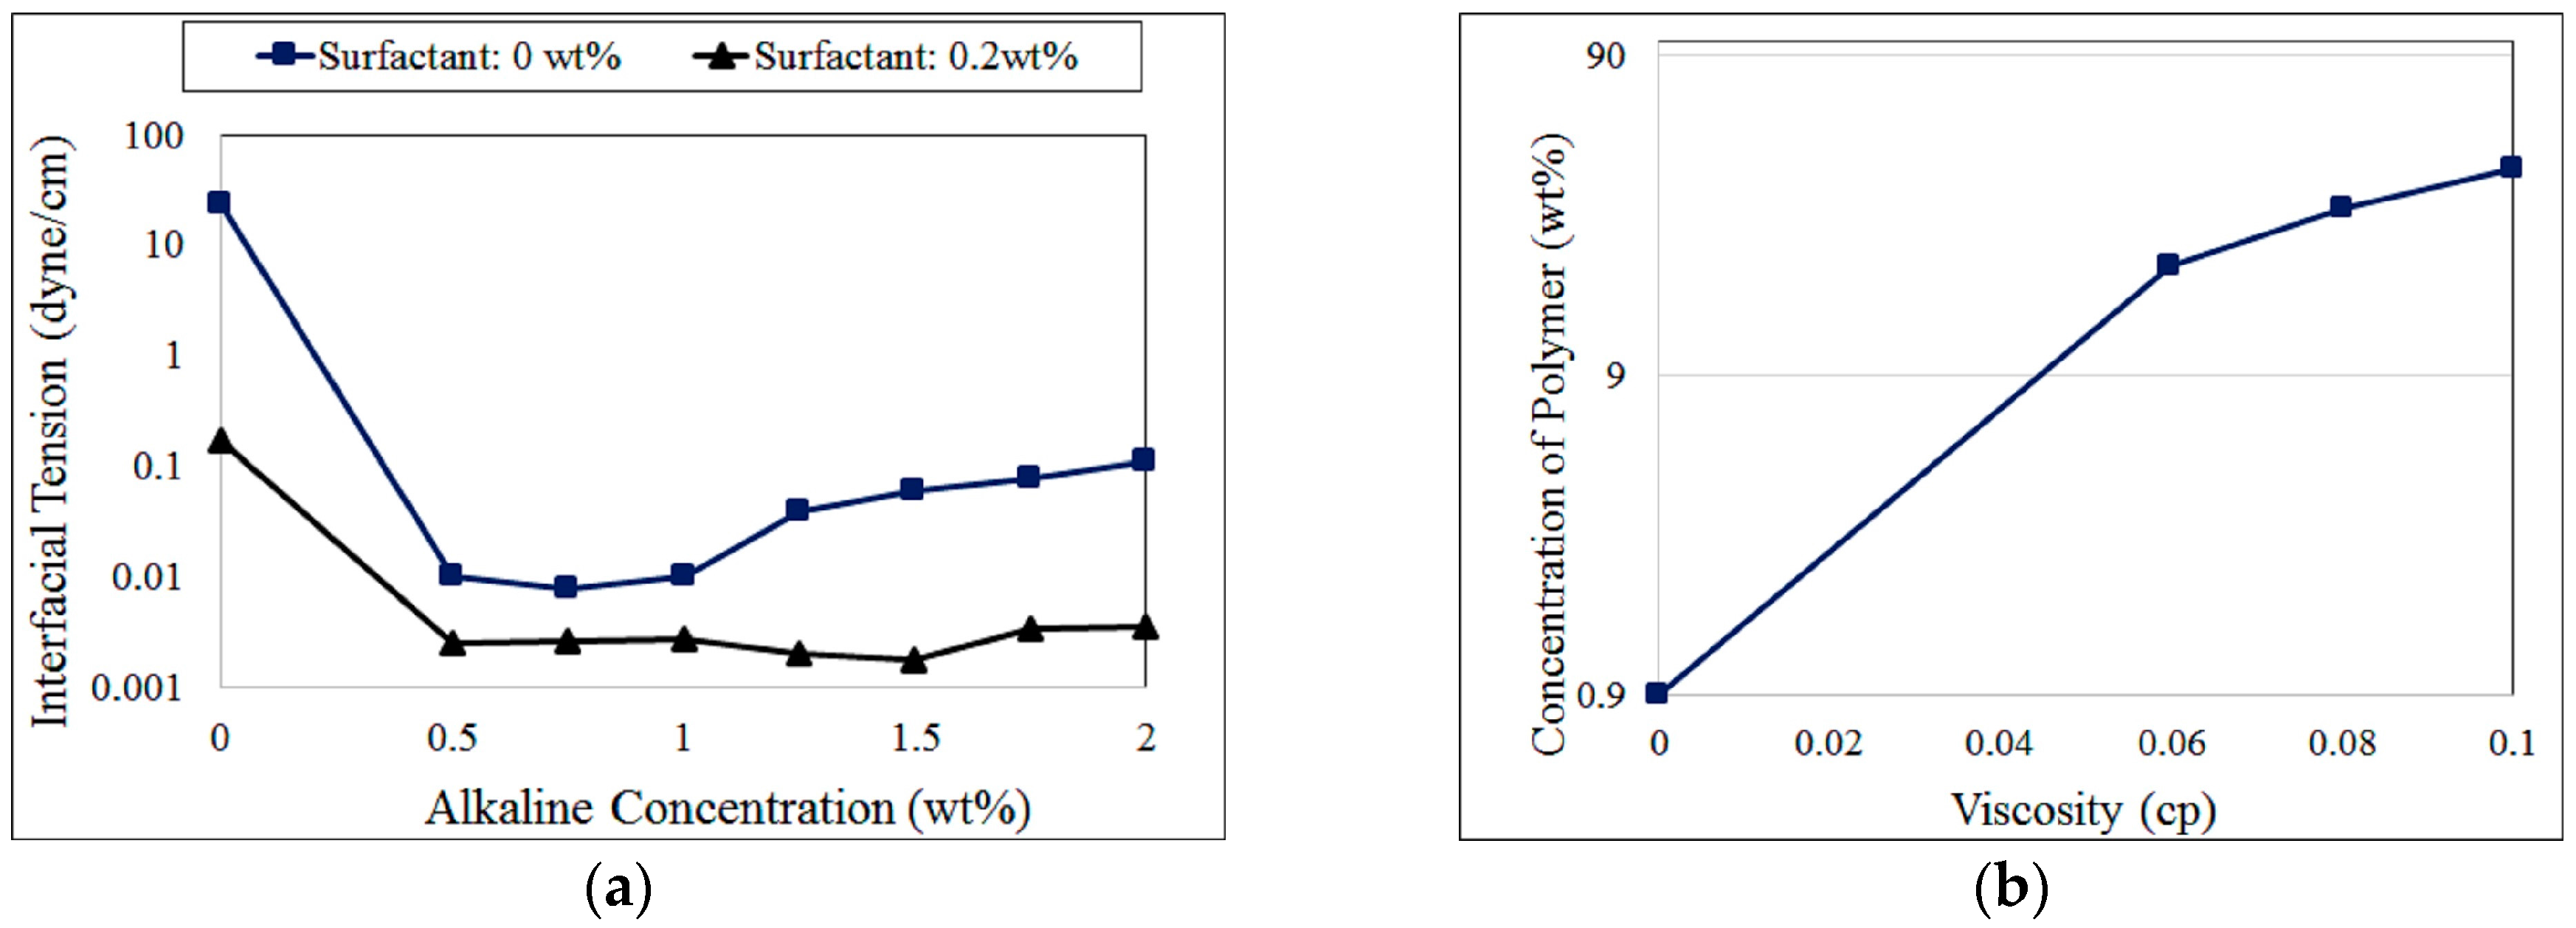
3/day were proposed in order to better compare the effectiveness of the chemical changes in the sequences. The specific concentrations of the flood types were selected on the basis of the results of IFT measurements and the viscosity of the injection fluids. 
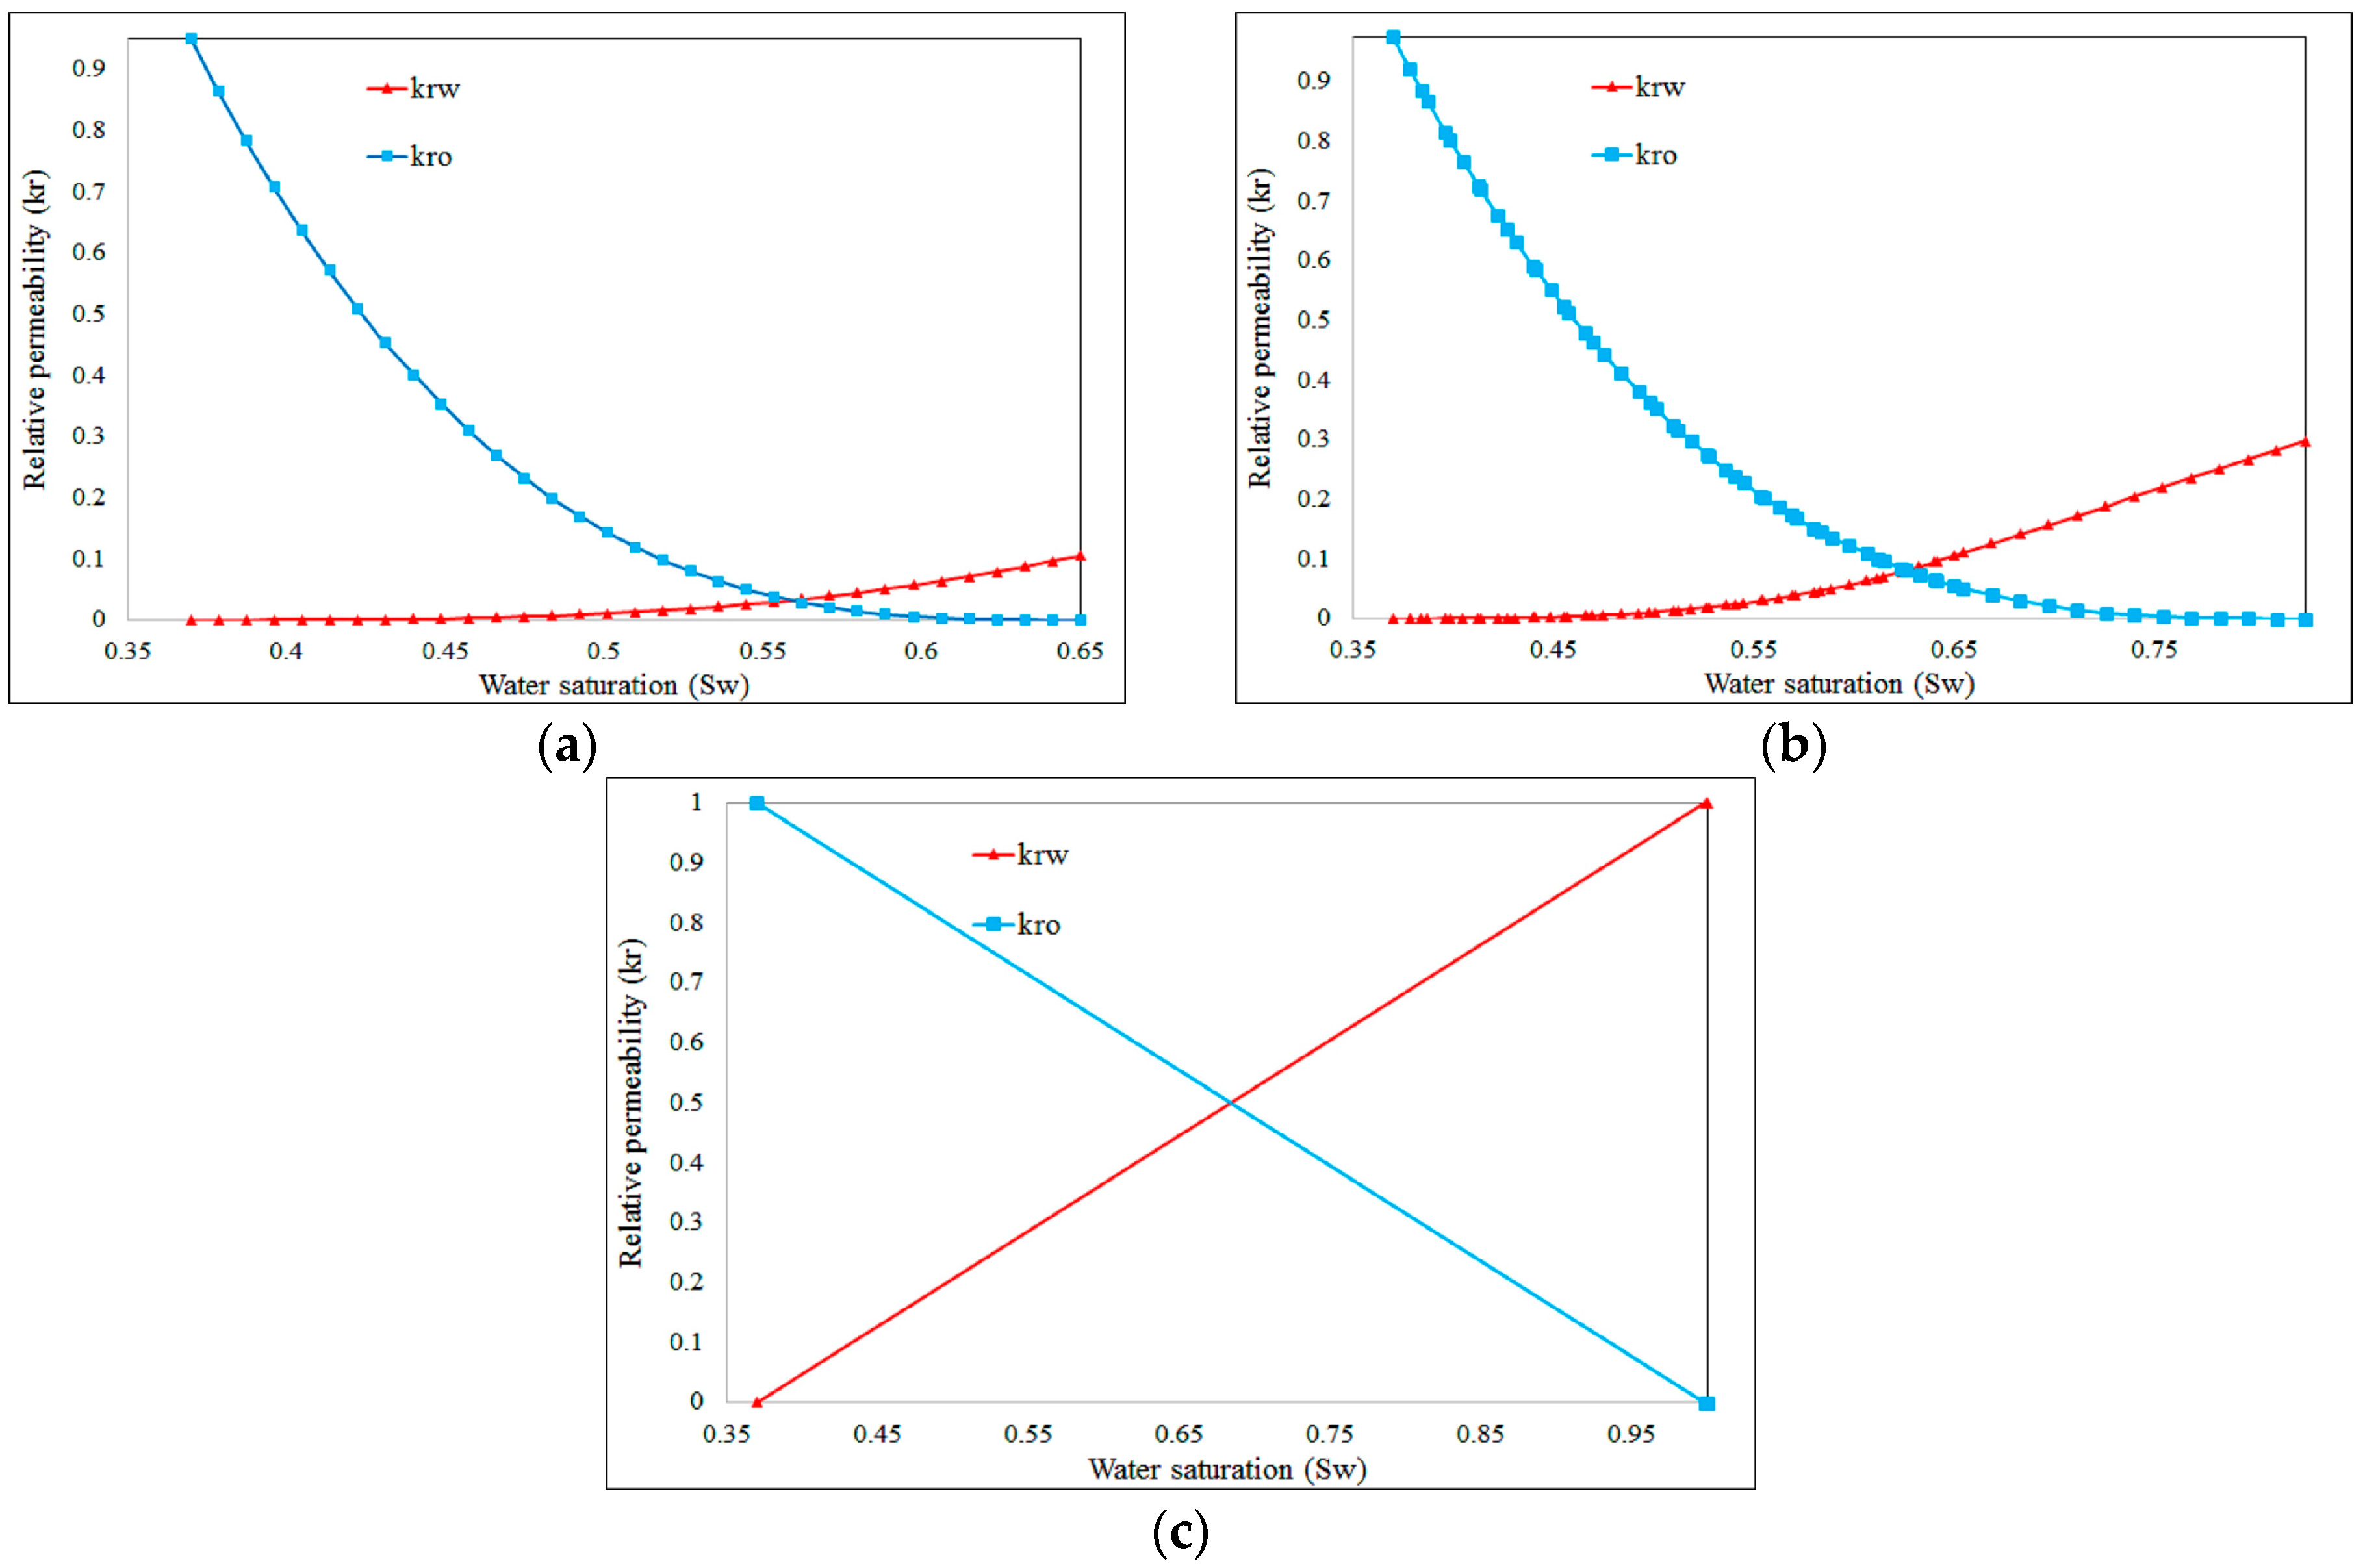
Figure 1 shows the fundamental chemical properties used for the simulation studies including the IFT characteristics and the viscosity behavior of the polymer solution. On the basis of the chemical data, the wettability condition of rock-fluid properties will be changed according to the interpolation scheme of the simulator when surfactant concentration increases. In detail, the addition of surfactant causes a reduction of IFT and an increase of capillary number, therefore lowering the residual oil saturation and straightening the relative permeability curves [39].
Following the default sets of critical capillary number in STARS (CMG), the residual oil saturation of zero can be obtained from the capillary number (Nc) of 1.2 × 10⁻³ and the relative permeability curves can become straight line when Nc reaches 2.3 × 10⁻¹.
The relative permeability curves for the initial conditions and after being interpolated are presented in Figure 2.

4. Results and Discussion

4.1. Base Cases

4.1.1. (P) Group—Polymer Solution is the First Chemical Slug

A single polymer solution was injected in one year after about 0.017 pore volume (PV) of preflushing water flooding and followed by an ASP injection. The purpose of using a polymer for the first chemical slug is to mitigate the formation of displacing-fluid channeling that follows afterward. ASP injection after a short polymer flooding substantially increases the oil production as a result of the easier movement of viscous oil due to the strong reduction in the IFT as well as the proper mobility of the displacing fluids. However, the increase of oil production can be observed close to the end of ASP injection or at the beginning of the final water injection afterward. As presented in Figure 3, the oil cuts of both chemical sequences increase from the middle of the ASP injection stage until nearly 1 PV of total injected fluids, from approximately 10% to 20%, before gradually decreasing. However, in the complete water flooding, the oil cut continuously decreases without any restoration until the end of the process.
Obviously, the increase in the solution viscosity from 15 to 20 cp corresponding with the increase of the polymer concentration from 550 to 690 ppm did not improve the oil production; in contrast, it slightly worsened the oil recovery performance. In detail, with a final oil rate of 1.59 m3/day, the W-P(15)-ASP(15)-W sequence recovered approximately 42.7% of the oil in place (OIP) after a total of 2.35 PV of liquids had been injected, whereas the oil recovery of the W-P(20)-ASP(15)-W sequence was 42.6% with 2.41 PV of injected liquids. The results also points out the very low injectivity of water flooding, with 1.27 PV of injected fluids, compared to that of chemical flooding, demonstrating the effective reduction in the IFT as well as the improvement in the sweep efficiency of the chemical agents buffered by the postflushing water.

4.1.2. (A) Group—Alkali Solution is the First Chemical Slug

In this group, an alkaline solution is the first chemical slug after a preflushing water injection and followed by an AS or an ASP slug. Theoretically, the use of the alkaline solution aims to form a W/O emulsion which decreases the mobility of the displacing fluids and enlarges the swept area [15]. The utilization of the combination of alkali and surfactant afterward could yield more progressive reduction on the IFT than the utilization of the single alkali solution. However, the opposite issue occurs when the AS solution easily flows and bypasses the oil as a result of the broken W/O emulsion, thereby leaving a substantial oil volume behind [40]. The ineffective performance of W-A-AS-W flooding is evidently shown in Figure 4 in comparison with the other chemical flooding sequences.
As presented in Figure 4, the sequence without buffering polymer only produced approximately 33.4% of the OIP after injecting 1.94 PV liquids; this injected volume was absolutely higher than those of W-A-AS-P(15)-W and W-A-AS-P(20)-W sequences, even though the oil recovery is inversely lower. In detail, using the buffering polymer solution after an AS injection really improved the oil production performance, with 37.1% and 37.6% of the OIP were recovered corresponding with the injections of 550-ppm and 680-ppm polymer solutions, respectively. This evidently demonstrates that the injection of a polymer solution is an effective way to remedy the circumstances in which the displacing fluids overflow or bypass the crude oil. However, the ASP solution is the better buffering fluid after an alkaline injection in this group.
As shown in Figure 4, the alkaline injection followed by 0.3 PV of the ASP(15) solution results in the recovery of 41.3% of the OIP, whereas 42.0% of the OIP is obtained with the injection ASP(20) solution in one year, indicating an improvement in the sweep efficiency corresponding with the increase of the polymer concentration in the ASP solution. These results again confirm that the relevant application of the combined ASP solution as the second injected agent makes the oil properly moveable with a buffered water injection, which is easily recognized by the sudden increases of the oil cuts after the second chemical slug is injected.

4.1.3. (AS) Group—Combined Alkali-Surfactant Solution is the First Chemical Slug

The injection of a combined AS solution after the first preflushing liquid exhibits relatively inefficient sweep performance, even in cases where a polymer solution is used for buffering. In detail, the W-AS-W sequence only produces 33.5% of the OIP after a total of 2.35 PV of displacing fluid has been injected, whereas in the sequences that use a buffering polymer after an AS injection, the oil recoveries are 36.5% and 36.9% for the W-AS-P(15)-W and W-AS-P(20)-W sequences, respectively (Figure 5).
Further, the utilization of a water slug between two chemical injections, as in the W-AS-W-P(15)-W sequence, also does not improve the recovery factor, basically demonstrating the low possibility of extracting considerably a considerably large oil volume after an AS injection.
From the results for this group, it is realized that the combined AS flooding should not be the first chemical injection, even though this combination results in an ultralow IFT of the W-O. This is also the crucial difference between heavy oil and conventional crude oil, in which the residual oil is more favorably moveable with a significant reduction in the IFT [41].

4.1.4. (ASP) Group—Combined Alkali-Surfactant-Polymer is the First Chemical Slug

From the numerical results of the other groups, the (ASP) group presumably offers better performance by employing the most favorable combination of chemical flooding conditions. However, in terms of the mobility ratio between the displacing fluid and the displaced fluid, the value is still not favorable owing to the extremely high viscosity of the crude oil [42]. Therefore, the improvements in the EOR performances are still within a limited range, despite the properly designed injection strategies. As presented in Figure 6, the use of only one chemical slug, as in W-ASP(15)-W and W-ASP(20)-W sequences, results in final oil recoveries of 43.2% and 44.1%, respectively, and is much more effective than complete water flooding in terms of either the oil production or liquid injectivity. These results again confirm the enhancement in the oil recovery when increasing the viscosity of the ASP solution from 15 to 20 cp.
The utilization of the buffering polymer solution evidently shows a recovery factor improvement; however, it is also shown that the injection of the polymer immediately after ASP flooding gives better results than the use of a water slug size in between. In detail, the W-ASP(15)-P(15)-W sequence produces approximately 46.7% of the OIP after injecting 2.2 PV liquids, whereas the oil recovery of the W-ASP(15)-W-P(15)-W sequence is 45.6% for an equal injected volume (Figure 6). Further, the increase in the oil recovery as observed is not very significant according to the increase of viscosity of the polymer solution, as demonstrated by the small improvement in the oil recovery between the W-ASP(15)-P(20)-W and W-ASP(15)-P(15)-W sequence.

4.1.5. Economic Pre-Evaluation

From the results of various chemical flooding sequences, it is easily recognized that the sequences of the (ASP) group result in the predominant EOR performances compared to the other groups. Figure 7 shows a comparison of the performances of all high-potential chemical flooding sequences versus water flooding in terms of the cumulative oil production with a final oil rate of 1.59 m3/day. As presented, the W-ASP(20)-W-ASP(15) results in the highest oil production but also needs the highest injected volume, whereas the representatives of the (P) group perform better than those of the (A) group. Owing to inefficient sweeping and unfavorable EOR performance, the sequences of the (AS) group are not considered for the economic evaluation.
The oil price and the costs of the chemical agents are taken into account when computing the general profit of the EOR stage. For the chemical costs, the unit price of alkali, surfactant, and polymer are listed in Table 3 [43].
The oil price is taken from the forecasted results of the EIA group as shown in Figure 8a. This work assumes a range of 30–60 $/bbl for the oil price variation, corresponding to a normal distribution with the mean value of 46.5161 $/bbl. The comprehensive comparison for different possible sequences is clearly presented in Table 4. From the table, the ultimate recovery factors at the equal final oil rate for all sequences do not exhibit large different, with the maximum difference being less than 7%. However, the sequence results in the highest oil recovery yet consumed also the highest chemical expense; in particular, the total cost of this sequence is much higher than the other. Therefore, presumably the repeat of injecting ASP solution might not be economic, despite achieving the best technical results.
Indeed, the commercial issue—as presented in Figure 9, which clearly shows that W-ASP(20)-W-ASP(15)-W is not the relevant option for any oil price value. In detail, with values below 37 $/bbl, the W-ASP(20)-W sequence achieves the highest NPV, but the W-ASP(15)-P(15)-W sequence still provides the most economic strategy when the oil price is higher than 37 $/bbl.

4.2. Optimization Processes

4.2.1. Response Surface Methodology Approach

After recognizing the most economical flooding sequences for the base case, it is necessary to extend the results for optimization in order to maximize the possible NPVs. From the pre-evaluation, the base case sequences of W-ASP(20)-W and W-ASP(15)-P(15)-W performs most effectively in terms of either a high oil recovery or maximum NPV corresponding to the validated oil price; therefore, the optimization processes will only focus on these sequences.
Response surfaces are proposed to estimate the objective functions from the effective designed variables [44]. Typically, the final target NPV is always considered as an objective function. However, as the probable oil price is taken into account, the recovery factor (RF) and the total chemical expense until the end of the project (CC), which are two important components that mainly determine the NPV, are analyzed in this study. For the W-ASP(20)-W sequence, the objective function is formulated as follows:
RF = C0 + C1a + C2s + C3p + C4w + C11a2 + C22s2 + C33p2 + C44w2 + C12as + C13ap + C14aw + C23sp + C24sw + C34pw.
where a, s, and p are independent variables representing the concentrations in weight percent of the alkali, surfactant, and polymer, respectively; w is the slug size of the postflushing water; and Cx and Cxy are coefficients (x, y: 1, 2, 3, 4). Because the total used chemical cost is independent of the postflushing water volume, w is neglected in formula for CC, as follows:
CC = c0 + c1a + c2s + c3p + c11a2 + c22s2 + c33p2 + c12as + c13ap + c23sp.
where cx and cxy are coefficients.
For the W-ASP(15)-P(15)-W sequence, it is important to note that the polymer concentrations must be distinguished for the first and second chemical slugs as they are designed independently. Therefore, the response surfaces RF and CC for this base-case sequence are more complicated and depend on a higher number of coefficients denoted by Bx, Bxy, bx, and bxy as follows:
RF = B0 + B1a + B2p1 + B3s + B4p2 + B5w + B11a2 + B22p12 + B33s2 + B44p22 + B55w2 + B12ap1 + B13as + B14ap2 + B15aw + B23p1s + B24p1p2 + B25p1w + B34sp2 + B35sw + B45p2w.
CC = b0 + b1a + b2p1 + b3s + b4p2 + b11a2 + b22p12 + b33s2 + b44p22 + b12ap1 + b13as + b14ap2 + b15aw + b23p1s + b24p1p2 + b34sp2.
where p1 and p2 are the polymer concentrations (wt %) in the first and second chemical slugs, respectively. Basically, the viscosity of the injected liquids will be altered following a change in the polymer concentration. Therefore, the base-case sequences can be generally renamed as W-ASP-W and W-ASP-P-W without mentioning the specific viscosity of the solution.

4.2.2. Economic Post-Evaluation

Table 5 presents the ranges of all variables for constructing the D-optimal three-level factorial designs. From the technical results of the pre-evaluation, the threshold of the polymer concentration of 0.068 wt % is used to limit the viscosity of the displacing solution, which is lower than 30 cp owing to the gradual increase in RF. For the simulations, sample sets of 23 designs for W-ASP-W and 38 designs for W-ASP-P-W have been obtained for analysis. By matrix transformation and the least-squares method, the coefficients were successfully calculated, as listed in Table 6.
The high coefficients of determination in Figure 10 (the R2 values are greater than 0.97) evidently indicate the accuracy of the prediction process by the RSM as well as the suitability of the variable ranges.
The relationships between the designed variables and the recovery factors are visually illustrated in Figure 11. Obviously, an increase in the chemical concentration always causes an enhancement in the oil recovery, and the maximum RF might be achieved at the upper threshold of an individual agent. On the contrary, the optimal values of RF are not proportional to the postflushing volume, indicating that it is not necessary to increase volume of the buffering water in order to significantly promote oil production for a specific final oil rate.
As the response functions have been obtained for the recovery factors and chemical costs, the NPV can be directly calculated and optimized for the assumed change in the oil price. Figure 12 shows the NPVs for thousands of different chemical concentrations among 600,000 tested cases for the range of oil prices from 30 to 60 $/bbl and the optimized NPV for both flooding sequences. From Figure 12c, it is easily recognized that the selection of one flooding sequence is not unique as the change in oil price also changes the optimized result. In detail, W-ASP-W can benefit by approximately 3.5 million dollars when the maximum dominant oil price is 38 $/bbl, whereas the W-ASP-P-W sequence is much more favorable at the higher oil price values. The optimal concentrations corresponding to the maximum NPVs of the two sequences are listed in Table 7. As observed, the optimal values of all agents reach the thresholds, indicating the possible extension of the ranges for applying the RSM for the purpose of optimizing the NPV.
Regarding the uncertainty in the project, as discussed previously, the work applies a normal distribution for the oil price to assess the possible contexts of the flooding project. The possibility number is defined by the product of the NPV and the probability as the certainty of obtaining profit is high for a high possibility number. From the possibility curves in Figure 13, the highly possible occurrence of the oil price falls in the range of 40–55 $/bbl, corresponding to the optimized NPV of 3.78–5.4 $MM. However, at the highest possible oil price of approximately 46.5 $/bbl, the maximized NPV can reach 4.47 $MM. Further, for this range of oil prices, the W-ASP-P-W sequence is more preferable for deployment than the other.
The final results evidently indicate the completely possible extension of the chemical flooding project on a higher scale as it has been profitably applied in the quarter five-spot scale. The prudent design of the well configuration will properly be scaled up for implementation in a real oil field. The use of parallel horizontal wells in this work absolutely results in the best potential performances of the flooding processes; however, the complicated well patterns after scaling up might require the different injection plans in order to attain the highest benefit. Therefore, the consideration of well pattern designs needs to be involved in future works in order to fully understand the feasible chemical application on the EOR for a heavy crude oil reservoir.

5. Conclusions

The numerical study of various chemical flooding sequences with optimization procedures using RSM has demonstrated the feasibility of chemical flooding for enhancing heavy oil recovery from either the technical or economics point of views. The following critical conclusions are drawn for the results:
-
Combined alkali-surfactant-polymer solution has been proven as the outstanding displacing fluid to recover heavy oil from either the technical or economics point of views. A buffering polymer slug is also necessary for the design right after the previous chemical slug in order to relevantly improve the sweep efficiency.
-
The proper application of response surface methodology, in which the coefficients of determination are higher than 0.97 for estimation, has demonstrated that this mathematical tool is fully qualified to optimize the chemical concentration design and support the economic analysis. However, the range values should be extended consistently in order to investigate the full potential of chemical employments.
-
For the change of oil price from 30 to 60 $/bbl, two chemical flooding schemes show the importance of considering the effect of possible market variations on the project decision. Further, the simply proposed statistical distribution for oil price contributes to a more confident evaluation as well as to reduce the uncertainty of the project.
Currently, the utilization of chemical flooding for heavy oil is facing more challenges regarding the uncertainty as well as the feasibility of the projects, particularly when the oil price is in an unfavorable situation. Therefore, the contributory investigations and proposed methods of this work promise to be helpful in future research as well as in practical EOR implementations in the petroleum industry.

Author Contributions

All authors have worked on this manuscript together and all authors have read and approved the final manuscript.

Conflicts of Interest

The authors declare no conflicts of interest.

References

  1. Dusseault, M.B.; Shafiei, A. Oil Sands. In Ullmann’s Encyclopedia of Industrial Chemistry; Wiley-VCH: Weinheim, Germany, 2011. [Google Scholar]
  2. Hofmann, H.; Babadagli, T.; Zimmermann, G. Hot water generation for oil sand processing from enhanced geothermal systems: Process simulation for different hydraulic fracturing scenarios. Appl. Energy 2014, 113, 524–547. [Google Scholar] [CrossRef]
  3. Delamaide, E.; Zaitoun, A.; Renard, G.; Tabary, R. Pelican Lake Field: First successful application of polymer flooding in a heavy oil reservoir. In Proceedings of the SPE Enhanced Oil Recovery Conference, Kuala Lumpur, Malaysia, 2–4 July 2015.
  4. Atsenuwa, J.; Taiwo, O.; Dala, J.; Mohammed, I.; Olafuyi, O. Effect of viscosity of heavy oil (class-A) on oil recovery in SP flooding using lauryl sulphate and gum arabic. In Proceedings of the Nigeria Annual International Conference and Exhibition, Lagos, Nigeria, 5–7 August 2014.
  5. Asghari, K.; Nakutnyy, P. Experimental results of polymer flooding of heavy oil reservoirs. In Proceedings of the Canadian International Petroleum Conference/SPE Gas Technology Symposium 2008 Joint Conference, Calgary, AB, Canada, 17–19 June 2008.
  6. Bodino, I.; Carreras, E.S.; Levitt, D.; Jouenne, S.; Bourrel, M. Polymer flooding of heavy oil under adverse mobility conditions. In Proceedings of the SPE Enhanced Oil Recovery Conference, Kuala Lumpur, Malaysia, 2–4 July 2013.
  7. Kang, X.; Jian, Z. Offshore heavy oil polymer flooding test in JZW area. In Proceedings of the SPE Heavy Oil Conference Canada, Calgary, AB, Canada, 11–13 June 2013.
  8. Alsofi, A.M.; Blunt, M.J. Polymer flooding design and optimization under economic uncertainty. J. Petro. Sci. Eng. 2014, 124, 46–59. [Google Scholar] [CrossRef]
  9. Zhou, X.; Dong, M.; Maini, B. The dominant mechanism of enhanced heavy oil recovery by chemical flooding in a two-dimensional physical model. Fuel 2013, 108, 261–268. [Google Scholar] [CrossRef]
  10. Jooybari, H.S.; Dejam, M.; Chen, Z. Heavy oil polymer flooding from laboratory core floods to pilots tests and field Applications: half century studies. J. Petro. Sci. Eng. 2016, 142, 85–100. [Google Scholar] [CrossRef]
  11. Dong, M.; Liu, Q.; Li, A. Displacement mechanisms of enhanced heavy oil recovery by alkaline flooding in a micromodel. Particuology 2012, 10, 298–305. [Google Scholar] [CrossRef]
  12. Liu, Q.; Dong, M.; Ma, S.; Tu, Y. Surfactant enhanced alkaline flooding for Western Canadian heavy oil recovery. Colloids. Surf. A Physicochem. Eng. Asp. 2007, 293, 63–71. [Google Scholar] [CrossRef]
  13. Sharma, T.; Velmurugan, N.; Patel, P.; Chon, B.H.; Sangwai, J.S. Use of oil-in-water pickering emulsion stabilized by nanoparticles in combination with polymer flood for enhanced oil recovery. Petro. Sci. Technol. 2015, 33, 1595–1604. [Google Scholar] [CrossRef]
  14. Pei, H.; Zhang, G.; Ge, J.; Jin, L.; Ding, L. Study on the variation of dynamic interfacial tension in the process of alkaline flooding for heavy oil. Fuel 2013, 104, 372–378. [Google Scholar] [CrossRef]
  15. Gong, H.; Li, Y.; Dong, M.; Ma, S.; Liu, W. Effect of wettability alteration on enhanced heavy oil recovery by alkaline flooding. Colloids. Surf. A Physicochem. Eng. Asp. 2016, 488, 28–35. [Google Scholar] [CrossRef]
  16. Tang, M.; Zhang, G.; Ge, J.; Jiang, P.; Liu, Q.; Pei, H.; Chen, L. Investigation into the mechanisms of heavy oil recovery by novel alkaline flooding. Colloids. Surf. A Physicochem. Eng. Asp. 2013, 421, 91–100. [Google Scholar] [CrossRef]
  17. Jang, S.B.; Chon, B.H. Surfactant-polymer flooding characteristics for heavy oil recovery with varying injection volumes of surfactant and polymer. Korean Soc. J. Geosystem Eng. 2014, 17, 150–156. [Google Scholar] [CrossRef]
  18. Luo, P.; Wu, Y.; Huang, S. Optimized surfactant-polymer flooding for western Canadian heavy oils. In Proceedings of the SPE Heavy Oil Conference Canada, Calgary, AB, Canada, 11–13 June 2013.
  19. Feng, A.; Zhang, G.; Ge, J.; Jiang, P.; Pei, H.; Zhang, J.; Li, R. Study of surfactant-polymer flooding in heavy oil reservoirs. In Proceedings of the SPE Heavy Oil Conference Canada, Calgary, AB, Canada, 12–14 June 2012.
  20. Bataweel, M.A.; Nasr-EI-Din, H.A. ASP vs SP Flooding in high salinity/hardness and temperature in sandstone cores. In Proceedings of the SPE EOR Conference at Oil and Gas West Asia, Muscat, Oman, 16–18 April 2012.
  21. Zerpa, L.E.; Queipo, N.V.; Pintos, S.; Salager, J.L. An optimization methodology of alkaline-surfactant-polymer flooding processes using field scale numerical simulation and multiple surrogates. J. Petro. Sci. Eng. 2005, 47, 197–208. [Google Scholar] [CrossRef]
  22. Zerpa, L.E.; Queipo, N.V.; Pintos, S.; Tillero, E.; Alter, D. An efficient response surface approach for the optimization of ASP flooding processes: ASP pilot project LL-03 reservoir. In Proceedings of the 2007 SPE Latini American and Caribbean Petroleum Engineering Conference, Buenos Aires, Argentina, 15–18 April 2007.
  23. Ghadami, N.; Das, A.K.; Tunio, K.H.; Sabzabadi, A. Sensitivity analysis and optimization of alkaline-surfactant flooding in a thin clastic reservoir. In Proceedings of the International Petroleum Technology Conference, Doha, Qatar, 6–9 December 2015.
  24. Dai, Z.; Stauffer, P.H.; Carey, J.W.; Middleton, R.S.; Lu, Z.; Jacobs, J.F.; Telleen, K.H.; Spangler, L.H. Pre-site characterization risk analysis for commercial-scale carbon sequestration. Environ. Sci. Technol. 2014, 4, 3908–3915. [Google Scholar] [CrossRef] [PubMed]
  25. Dai, Z.; Viswanathan, H.; Middleton, R.; Pan, F.; Ampomah, W.; Yang, C.; Jia, W.; Xiao, T.; Lee, S.Y.; McPherson, B.J.; et al. CO2 accounting and risk analysis for CO2 sequestration at enhanced oil recovery sites. Environ. Sci. Technol. 2016, 50, 7546–7554. [Google Scholar] [CrossRef] [PubMed]
  26. Pan, F.; McPherson, B.J.; Dai, Z.; Jia, W.; Lee, S.Y.; Ampomah, W.; Viswanathan, H.; Esser, R. Uncertainty analysis of carbon sequestration in an active CO2-EOR field. Int. J. Greenh. Gas Con. 2016, 51, 18–28. [Google Scholar] [CrossRef]
  27. Van, S.L.; Chon, B.H. The performance of surfactant-polymer flooding in horizontal wells consisting of multilayers in a reservoir system. Energies 2016, 9, 244. [Google Scholar] [CrossRef]
  28. Sinha, A.K.; Bera, A.; Raipuria, V.; Kumar, A.; Mandal, A.; Kumar, T. Numerical simulation of enhanced oil recovery by alkali-surfactant-polymer floodings. Petrol. Sci. Technol. 2015, 33, 1229–1237. [Google Scholar] [CrossRef]
  29. Delamaide, E. Polymer flooding of heavy oil—from screening to full-field extension. In Proceedings of the SPE Heavy and Extra Heavy Oil Conference: Latin America, Medellín, Colombia, 24–26 September 2014.
  30. Qu, Z.; Zhang, Y.; Zhang, X.; Dai, J. A successful ASP flooding pilot in Gudong oil field. In Proceedings of the SPE/DOE Improved Oil Recovery Symposium, Tulsa, OK, USA, 19–22 April 1998.
  31. Li, H.; Liao, G.; Han, P.; Yang, Z.; Wu, X.; Chen, G.; Xu, D.; Jin, P. Alkaline/Surfactant/Polymer (ASP) commercial flooding test in Central Xing2 area of Daqing oilfield. In Proceedings of the SPE International Improved Oil Recovery Conference in Asia Pacific, Kuala Lumpur, Malaysia, 20–21 October 2003.
  32. Kazempour, M.; Alvarado, V.; Manrique, E.J.; Izadi, M. Impact of alkaline-surfactant-polymer flooding model on upscaled recovery predictions: medium and heavy oils. In Proceedings of the SPE Heavy and Extra Heavy Oil Conference: Latin America, Medellin, Colombia, 24–26 September 2014.
  33. Najafabadi, N.F.; Delshad, M.; Han, C.; Sepehrnoori, K. Formulations for a three-phase, fully implicit, parallel, EOS Compositional surfactant-polymer flooding simulator. J. Petro. Sci. Eng. 2012, 86, 257–271. [Google Scholar] [CrossRef]
  34. Dong, M.; Ma, S.; Liu, Q. Enhanced heavy oil recovery through interfacial instability: A study of chemical flooding for Brintnell heavy oil. Fuel 2009, 88, 1049–1056. [Google Scholar] [CrossRef]
  35. Dehghan, A.A.; Masihi, M.; Ayatollahi, S. Phase behavior and interfacial tension evaluation of a newly designed surfactant on heavy oil displacement efficiency; effects of salinity, wettability, and capillary pressure. Fluid. Phase. Equilib. 2015, 396, 20–27. [Google Scholar] [CrossRef]
  36. Jamaloei, B.Y.; Asghari, K.; Kharrat, R. The investigation of suitability of different capillary number definitions for flow behavior characterization of surfactant-based chemical flooding in heavy oil reservoirs. J. Petro. Sci. Eng. 2012, 90, 48–55. [Google Scholar] [CrossRef]
  37. Lee, K.S. Performance of polymer flood with shear-thinning fluid in heterogeneous layered systems with crossflow. Energies 2011, 4, 1112–1128. [Google Scholar] [CrossRef]
  38. Ashrafizadeh, M.; Ahmad, R.S.A.; Sadeghnejad, S. Improvement of polymer flooding using in-situ releasing of smart nano-scale polymer particles in porous media. Energ. Explor. Exploit. 2012, 30, 915–940. [Google Scholar] [CrossRef]
  39. Computer Modelling Group Ltd. (CMG). STARS User Guide: Advanced Processes & Thermal Reservoir Simulator; Version 2014; CMG: Calgary, AB, Canada, 2014. [Google Scholar]
  40. Wijeratne, D.I.E.N.; Havorsen, B.M. Computational study of fingering phenomenon in heavy oil reservoir with water drive. Fuel 2015, 158, 306–314. [Google Scholar] [CrossRef]
  41. Carrero, E.; Queipo, N.V.; Pintos, S.; Zerpa, L.E. Global sensitivity analysis of alkali-surfactant-polymer enhanced oil recovery processes. J. Petro. Sci. Eng. 2007, 58, 30–42. [Google Scholar] [CrossRef]
  42. Jamaloei, B.Y.; Kharrat, R.; Torabi, F. A mechanistic analysis of viscous fingering in low-tension polymer flooding in heavy oil reservoirs. J. Petro. Sci. Eng. 2011, 78, 228–232. [Google Scholar] [CrossRef]
  43. Chen, X.; Feng, Q.; Wu, X.; Zhao, G. A pilot numerical simulation case study for chemical EOR feasibility evaluation. J. Petro. Explor. Prod. Technol. 2015. [Google Scholar] [CrossRef]
  44. Li, L.; Khorsandi, S.; Johns, R.T.; Dilmore, R.M. CO2 enhanced oil recovery and storage using a gravity-enhanced process. Int. J. Greenh. Gas. Con. 2015, 42, 502–515. [Google Scholar] [CrossRef]
Figure 1. Chemical properties used for the simulation: (a) the dependence of IFT values of O-W on the alkaline concentrations corresponding with no surfactant and 0.2 wt % surfactant in the solution; (b) viscosity behavior of the polymer solution.
Energies 09 00711 g001
Figure 2. Progression of relative permeability curves following the increase of surfactant: (a) initial condition; (b) intermediate curves formed by interpolation scheme; (c) straighten curves.
Energies 09 00711 g002
Figure 3. Oil production performance of water flooding and two flooding sequences of the (P) group in which the first injected polymer solutions have viscosity of 15 and 20 cp.
Energies 09 00711 g003
Figure 4. Oil production performance of water flooding and the sequences of the (A) group. The injections of a buffering ASP solution after the first alkaline flooding prove to be more efficient than using an AS slug with a buffering polymer solution, whereas the sequence without a buffering viscous fluid results in the worst performance owing to the severe oil bypassing mechanism.
Energies 09 00711 g004
Figure 5. Oil production performance of water flooding and the sequences of the (AS) group. The employments of AS solution right after the preflushing water does not improve the oil recovery significantly compared to water flooding even when using a buffering polymer solution.
Energies 09 00711 g005
Figure 6. Oil production performance of water flooding and the sequences of the (ASP) group: (a) first chemical slug is 15 cp ASP solution; (b) first chemical slug is 20 cp ASP solution. The repeated injections of ASP solution with a slug of water in between achieve the highest oil recovery than the sequences using a buffering polymer solution.
Energies 09 00711 g006
Figure 7. Comparison of the cumulative oil production between the most potential flooding sequences of each group and water flooding. The sequence W-ASP(20)-W-ASP(15)-W performs the highest oil production and also requires highest injected volume.
Energies 09 00711 g007
Figure 8. (a) The historical and forecasted oil price (www.eia.gov); (b) Normal distribution of the oil price: probability density and cumulative distribution curves, with the maximum, minimum and mean values are 60, 30 and 46.5 $/bbl, respectively.
Energies 09 00711 g008
Figure 9. NPVs of different potential chemical flooding sequences and water flooding according to the change of the oil price from 30 to 60 $/bbl.
Energies 09 00711 g009
Figure 10. Estimated results of the oil recovery factor and total chemical expenses by the RSM: (a) W-ASP-W; (b) W-ASP-P-W.
Energies 09 00711 g010
Figure 11. Correlations between the design variables and the response surfaces. W-ASP-W: (a1) a-s vs. RF; (a2) a-p vs. RF; (a3) p-w vs. RF. W-ASP-P-W: (b1) a-p2 vs. RF; (b2) p2 -w vs. RF. Within the range of the designs, the increases in the chemical concentration corresponding to a low injected volume of postflushing fluid help to improve the ultimate recovery factor.
Energies 09 00711 g011
Figure 12. NPVs for various oil prices: (a) 1000 estimated cases and the optimal case of W-ASP-W; (b) 1000 cases and the optimal case of W-ASP-P-W; (c) comparison of the most optimal cases of the two sequences.
Energies 09 00711 g012
Figure 13. NPV possibility curves following the normal distribution of the oil price for the most optimal case of two sequences.
Energies 09 00711 g013
Table 1. Parameters used for the initial reservoir conditions.
Initial Reservoir ConditionValue
Grid size30 × 30 × 5 cells
Thickness10.67 m
Initial reservoir pressure2.76 MPa
Reservoir temperature32 °C
Porosity0.28–0.35
Horizontal permeability (kh)700–4000 mD
Vertical permeability (kv)0.1kh mD
Fluid Properties
Oil saturation0.75
Oil gravity12 °API
Oil viscosity1202 cp
Residual oil saturation after water flooding0.37
Initial salinity (for all blocks)20,000 ppm
Table 2. Injection strategies of the flooding sequences.
Injected Schedules Flooding SequenceAASPASP
Water Flooding----
(A) Group
W-A-AS-W1.5 years1 year--
W-A-AS-P(15)-W1.5 years1 year1 year-
W-A-AS-P(20)-W1.5 years1 year1 year-
W-A-ASP(15)-W1.5 years--1 year
W-A-ASP(20)-W1.5 years--1 year
(AS) Group
W-AS-W-2 years--
W-AS-P(15)-W-2 years1 year-
W-AS-P(20)-W-2 years1 year-
W-AS-W-P(15)-W-2 years1 year-
(ASP) Group
W-ASP(15)-W---3 years
W-ASP(20)-W---3 years
W-ASP(15)-P(15)-W--1 year3 years
W-ASP(15)-P(20)-W--1 year3 years
W-ASP(15)-W-P(15)-W--1 year3 years
W-ASP(15)-W-ASP(15)-W---1st: 3 years
---2nd: 1 year
W-ASP(15)-W-ASP(15)-W---1st: 3 years
---2nd: 1 year
W-ASP(20)-W-ASP(15)-W---1st: 3 years
---2nd: 1 year
(P) Group
W-P(15)-ASP(15)-W--1 year2 years
W-P(20)-ASP(15)-W--1 year2 years
Note: 1st and 2nd indicate first and second chemical slugs, respectively.
Table 3. Chemical costs.
Chemical TypePriceUnit
Polymer price3.68$USD/kg
Surfactant price4.06$USD/kg
Alkali price1.32$USD/kg
Table 4. Detail comparison of different flooding sequences in terms of recovery factor, total injected volume and chemical expenses.
Flooding SequencesRecovery Factor (%)Injected Volume (PV)Total Chemical Expense ($)
W-P(15)-ASP(15)-W42.692.35588,813
W-A-ASP(15)-W41.302.47670,533
W-A-ASP(20)-W41.982.40588,939
W-ASP(15)-W43.222.39743,436
W-ASP(20)-W44.132.44562,662
W-ASP(15)-W-P(15)-W45.582.15764,705
W-ASP(15)-P(15)-W46.752.16761,886
W-ASP(20)-W-ASP(15)-W47.442.721,131,358
Table 5. Constraints of the design variables (wt %).
CasesW-ASP-WW-ASP-P-W
Variablesaspwap1sp2w
Max1.40.60.06821.40.0680.60.0681.7
Min10.30.041.710.040.30.041.1
Base case1.360.5030.0681.91.360.0540.5030.0551.47
Table 6. Response surface coefficients for W-ASP-W and W-ASP-P-W.
CoefficientsValuesCoefficientsValues (×108)CoefficientsValuesCoefficientsValues (×108)
C00.6142c00B00.3538b00.01
C10.28c10.0088B10.0228b10.0093
C20.0466c20.0292B22.2488b2−0.3635
C37.4985c3−0.1847B3−0.0051b30.0165
C4−0.6701c110.0004B40.2634b4−0.069
C110.0215c22−0.0039B50.0048b11−0.002
C220.0067c332.3103B11−0.0149b223.2961
C33−27.1621c12−0.0035B22−3.0412b330.0008
C440.3032c13−0.087B330.0135b440.1953
C120.0379c23−0.2475B446.0844b12−0.0662
C130.7571 B550.1173b130.0021
C14−0.2093 B121.1032b140.0239
C230.1191 B130.0134b23−0.2195
C34−0.0597 B140.3774b240.3589
B15−0.0444b34−0.0001
B231.1761
B2420.1639
B25−2.8556
B340.6633
B35−0.0779
B45−1.8925
Table 7. Optimal values of the design variables corresponding to the optimized NPV (wt %).
W-ASP-WW-ASP-P-W
aspwap1sp2w
1.40.60.0681.71.40.0680.60.0681.1

