1. Introduction
In recent years, subwavelength grating (SWG) structures have been identified as promising candidates for realizing high conversion efficiency in photovoltaics or solar cells due to their small amount of reflection losses. If the period or pitch of a single grating structure is less than the wavelength of the incident light then it behaves like a homogeneous medium with an effective refractive index [
1]. Therefore, the SWG structures can provide gradual changes of the refractive index that confirm an excellent antireflective (AR) and light-trapping properties into the substrate compared to a planar- or flat-type thin film substrates [
1,
2]. This type of nano-grating or nano-rod structure performs as a single layer AR coating, whereas the triangular (such as, conical or perfect cone) and parabolic shaped nano-grating structures are performing as a multilayer broadband AR coating [
3,
4,
5,
6,
7,
8]. There are some other reports found in the literature related to improving the optical gain in solar cell systems, including surface plasmon resonance-based multilayer structures and also a new design of GaAs solar cells [
9,
10,
11,
12].
There are several types of losses in solar cell that always reduces its conversion efficiency. Among them, the reflection loss is one of the most important factor that decreases the conversion efficiency of solar cells significantly. The thin-film AR coating can minimize the reflection losses only for certain ranges of wavelengths and the formation of coating on film can be a complex process, as well as having several drawbacks, such as, adhesion and thermal mismatch, etc., and the instability under thermal cycling [
2,
3,
4,
8]. Therefore, the SWG structure (i.e., triangular or conical shaped) has a gradual change in refractive index that lead to a lesser reflection losses over a wide range of wavelengths and the angle of incidences [
2,
8,
13,
14,
15,
16,
17].
In this paper, a finite-difference time domain (FDTD) simulation tool is used to simulate the reflection losses for different types of nano-grating structures or shapes [
9,
10,
11,
16,
17,
18,
19,
20,
21,
22]. We have considered the following nano-grating profiles: (i) rectangular-; (ii) trapezoidal (i.e., truncated cone or hatch top)-; and (iii) triangular (i.e., conical or perfect cone)-shaped, which is used for the simulation. From the simulation results, an optimum nano-grating height and pitch or period for the SWG structures were optimized. The reflection loss for a rectangular-shaped SWG structure is >30%, but for a triangular (i.e., conical or perfect cone)-shaped SWG structure, the refractive index changes gradually in several steps; finally, the reflection loss is about 2%. However, the intermediate structures (such as, trapezoidal- or truncated cone- and parabolic-shaped), the reflection loss is lower than the rectangular-shaped SWG structure, but higher than the triangular (i.e., conical or perfect cone)-shaped SWG structures. This reduction of reflection losses confirms the improvement of conversion efficiency in solar cells. The optimized SWG structures confirm that the reflection loss is about 2%, which is about 28% less than that of a flat type substrate or a rectangular shaped nano-grating structure.
This paper is organized as follows: the introduction is in
Section 1,
Section 2 consists of an antireflective coating, moth’s-eye principle, and the SWG structure. Geometric shape design of nano-gratings is discussed in
Section 3. The design of nano-grating structures is discussed in
Section 4. A nano-structures simulation by using FDTD simulation tool is in
Section 5.
Section 6 presents the simulation results and discussion. Finally, the conclusion is presented in
Section 7.
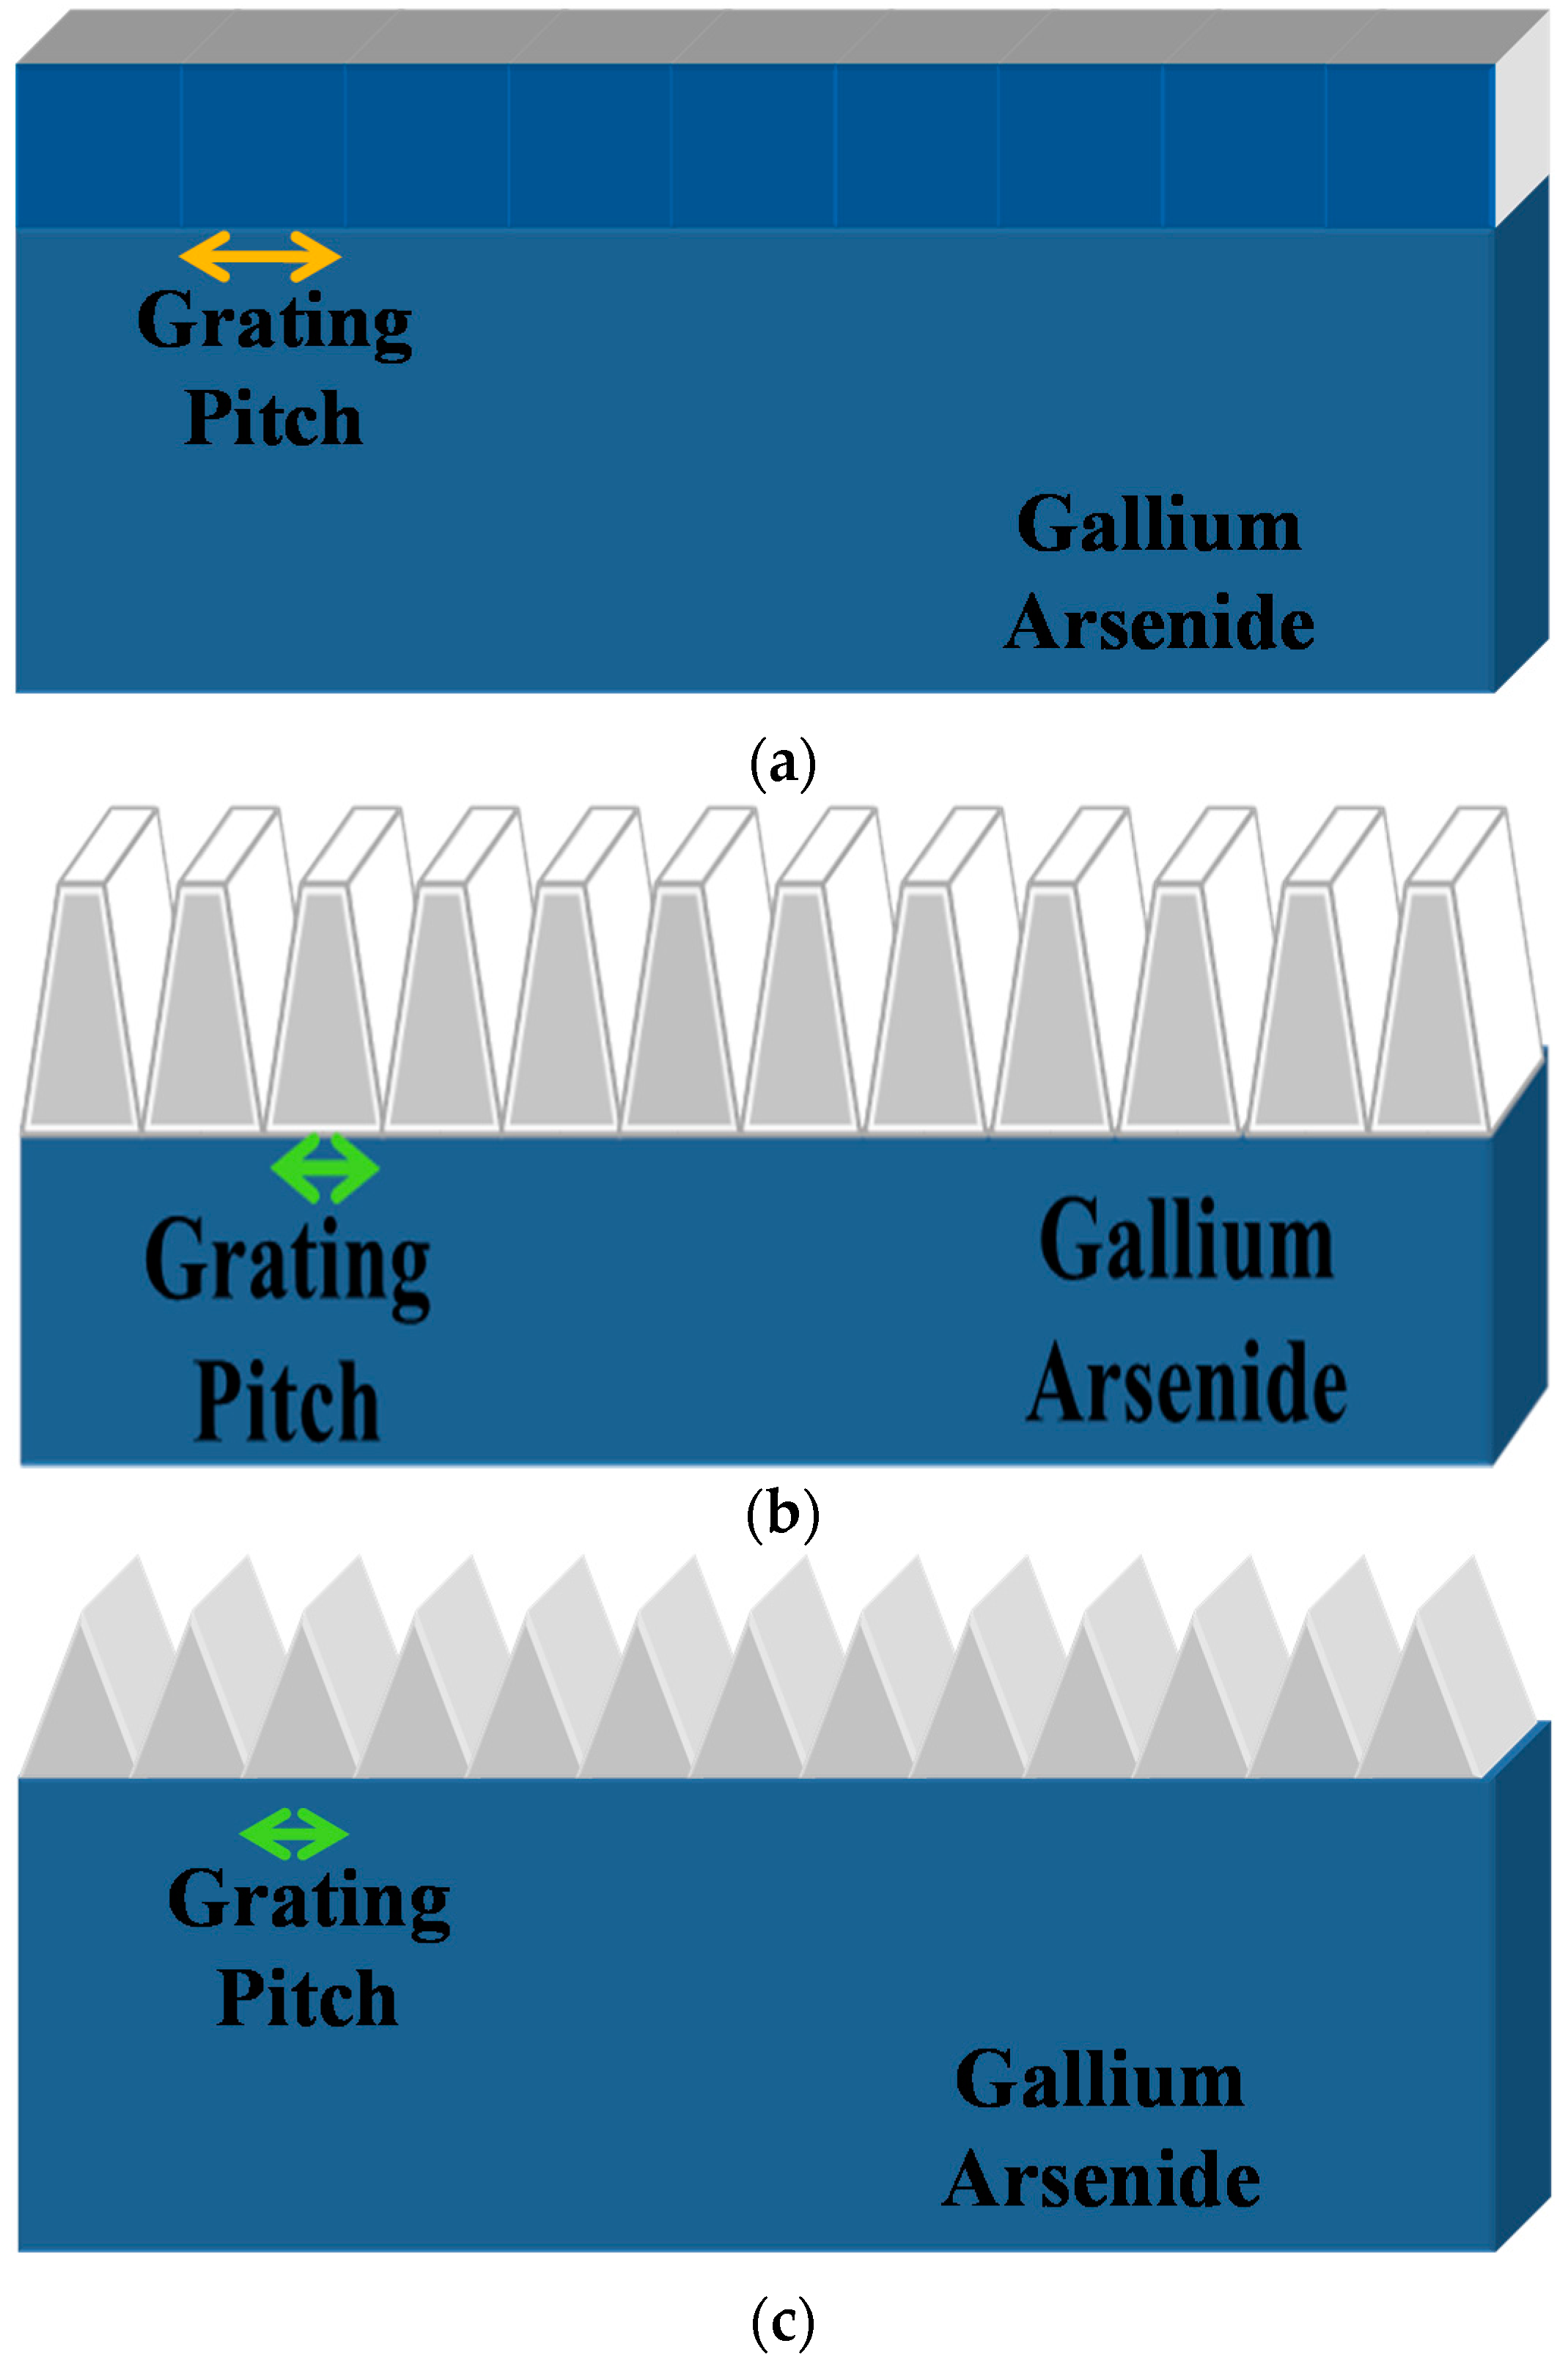
3. Geometric Shape Design of Nano-Gratings
This section briefly discussed the geometric shape design of nano-grating structure on the GaAs substrates. The SWG structures are namely; (i) rectangular-shaped SWG (as shown in
Figure 4c); (ii) trapezoidal-shaped SWG with different aspect ratios (i.e., 0.1, 0.2, 0.5, 0.8, and 0.9) as shown in
Figure 4b; and (iii) triangular-shaped SWG (as shown in
Figure 4a).
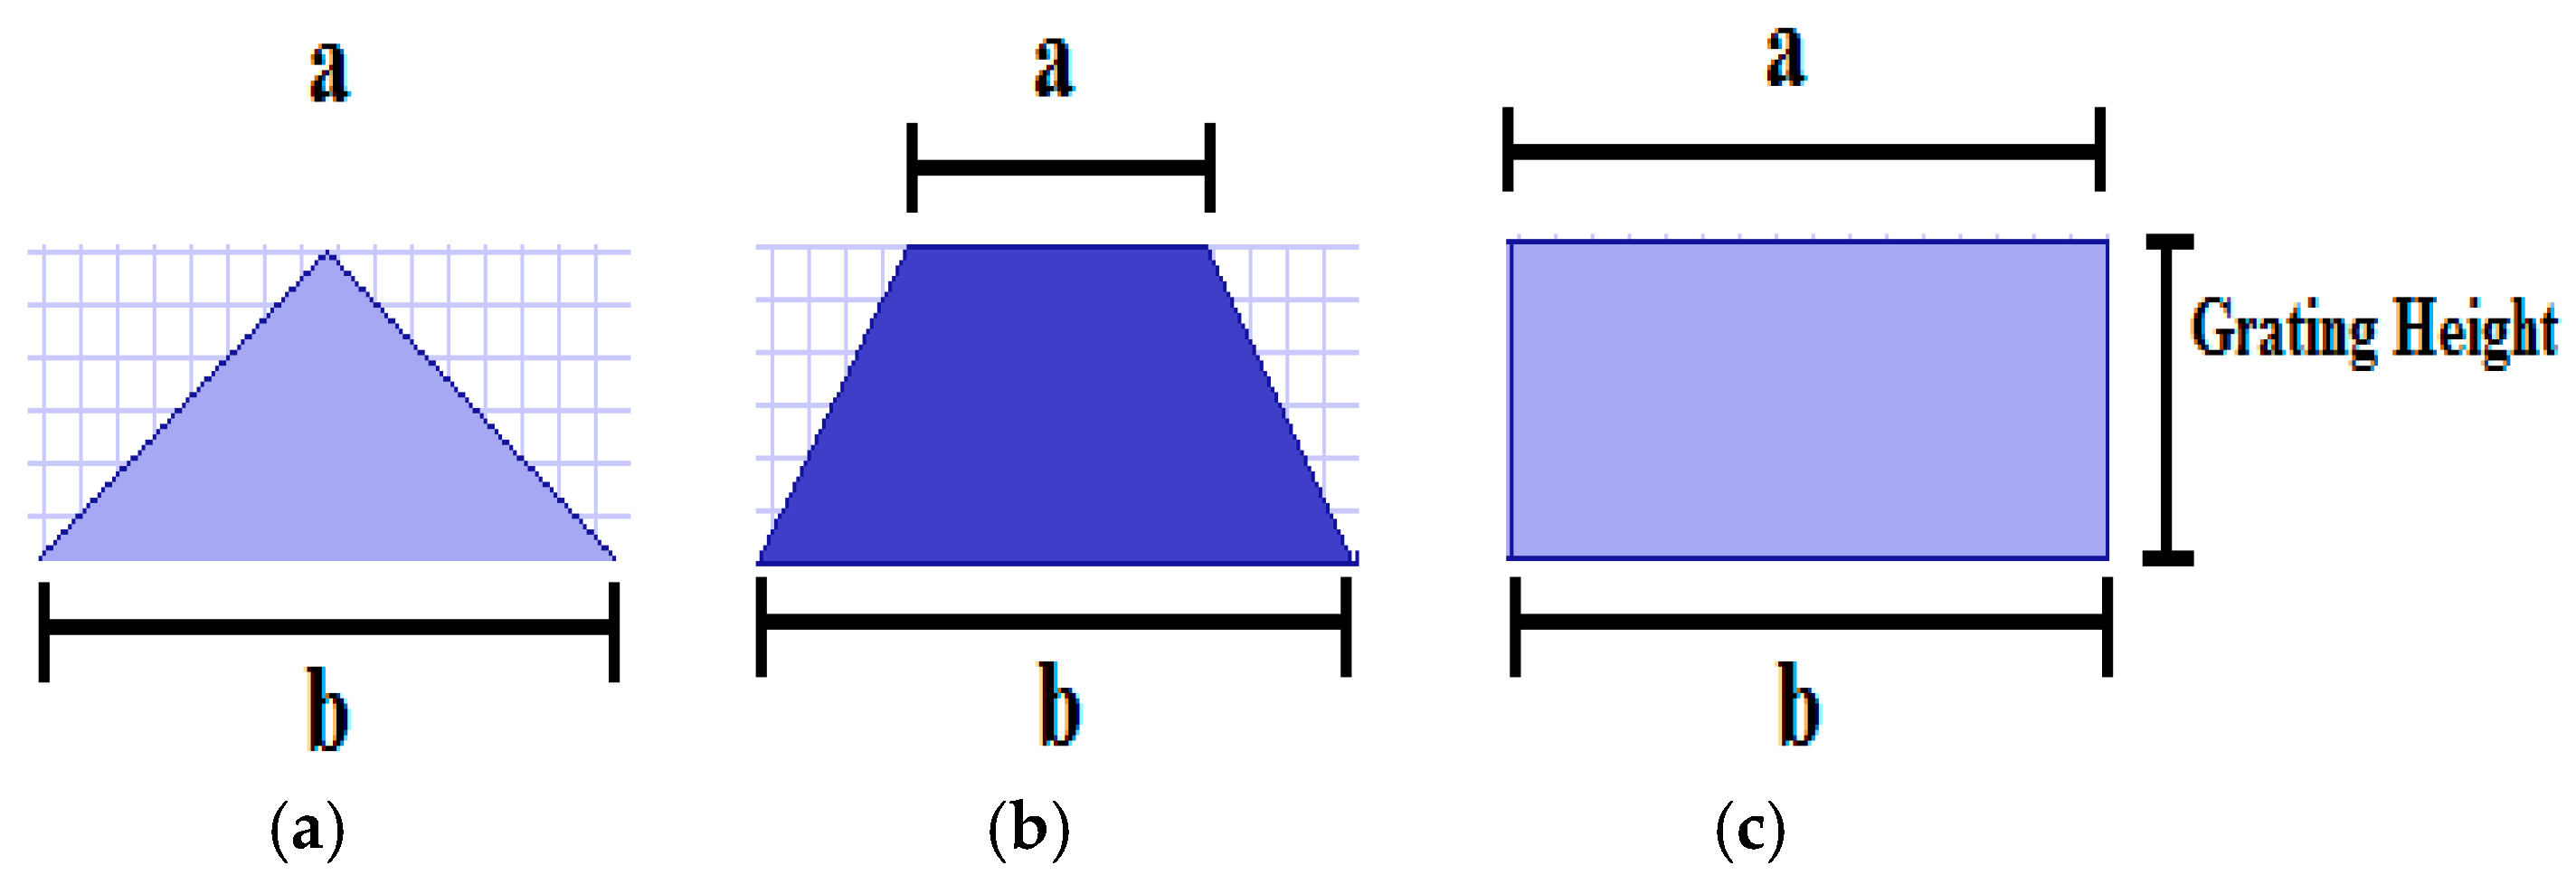
The term aspect ratio (
AspR) is defined as the ratio between the top length over the base length of a trapezoid, triangle, and/or rectangle [
5,
6,
14,
16,
17]. It is clear from
Figure 5 that the
AspR can be written as follows:
where, “
a” is the top length and “
b” is the base length of the geometric shapes (such as, triangle, trapezoid, and rectangle). For a rectangular-shaped nano-grating profile, the
AspR is ‘1’ (i.e., the top and base length of the rectangle is equal) and for the triangular-shaped nano-grating profile, the
AspR is ‘0’ (i.e., the top length of the triangle is ‘0’ compared to the base length of the triangle). However, for a trapezoidal-shaped nano-grating the
AspR is 0 < (
a/
b) < 1, i.e., it lies between ‘0’ to ‘1’ (such as, 0.1–0.9.). These nano-grating shapes play an important role for the light trapping inside the substrate that affect on the conversion efficiency of solar cells. Therefore, the design of nano-grating structures is essential to reduce the light reflection losses and improve the conversion efficiency in GaAs solar cells. In the next section, the design of nano-grating structures is discussed briefly.
4. Design of Nano-Grating Structures
This section discussed about the nano-gratings shape design and modeling of nano-gratings structures (i.e., SWG structures). The light reflection is strongly dependent on the nano-grating structures; therefore, an appropriate design of nano-grating structure is important and essential to model for reduction of reflection losses of light. For this reason, the nano-grating shapes are designed and optimized to reduce the light reflection losses from the surface of the GaAs solar cells or panels. The modeled nano-structured gratings are: (i) rectangular-shaped nano-grating profile (as shown in
Figure 5a); (ii) trapezoidal-shaped nano-grating profile with different aspect ratios of 0.1–0.9 (as shown in
Figure 5b); and (iii) triangular-shaped nano-grating profile (as shown in
Figure 5c). Here, we discussed all these nano-grating shapes as shown in
Figure 5a–c. For the rectangular-shaped nano-grating profile, the aspect ratio is ‘1’ (i.e., the top and base length of the trapezoid is equal), for trapezoidal-shaped nano-grating profile, the aspect ratio varies from ‘0.1–0.9’ (i.e., it depends on the top length of the trapezoid), and for the triangular-shaped nano-grating profile, the aspect ratio is ‘0’ (i.e., the top length of the trapezoid is zero compared to the base length of the trapezoid). These shapes are used for the simulation and analyzed the results for light reflection of the SWG structures [
5,
6,
14,
16,
17].
5. Nano-Structures Simulation by FDTD
The Optiwave FDTD (OptiFDTD) simulation tool is a very powerful, highly-integrated software that allows computer aided design and advanced simulation of passive photonic components.
The FDTD method is an intuitive way to solve the partial differential equations numerically [
19]. It is a simple method utilizes the central difference approximation to discretize the two Maxwell’s curl equations, namely, Faraday’s and Ampere’s laws, both in time and spatial domains, and then it solves the resulting equations numerically to derive the electric and magnetic field distributions at each time step using an explicit leapfrog scheme. The FDTD solution, thus derived, is second-order accurate, and is stable if the time step satisfies the Courant condition. One of the most important attributes of the FDTD algorithm is that it is appropriately parallel in nature, i.e., parallel processing in both the time and spatial domains, because it only requires exchange of information at the interfaces of the sub-domains in the parallel processing scheme, which consequently makes it faster and more efficient [
20].
The OptiFDTD software package is based on the FDTD algorithm was originally proposed by K. S. Yee in 1966 [
21,
22]. It introduced a modeling technique with second order central differences to solve the Maxwell equations applying a finite difference approach (or mathematics). The FDTD algorithm can directly calculate the value of E (electric field intensity) and H (magnetic field intensity) at different points of the computational domain. Since then, it has been used for several applications and many extensions of the basic algorithm have been developed [
22,
23,
24,
25,
26,
27,
28].
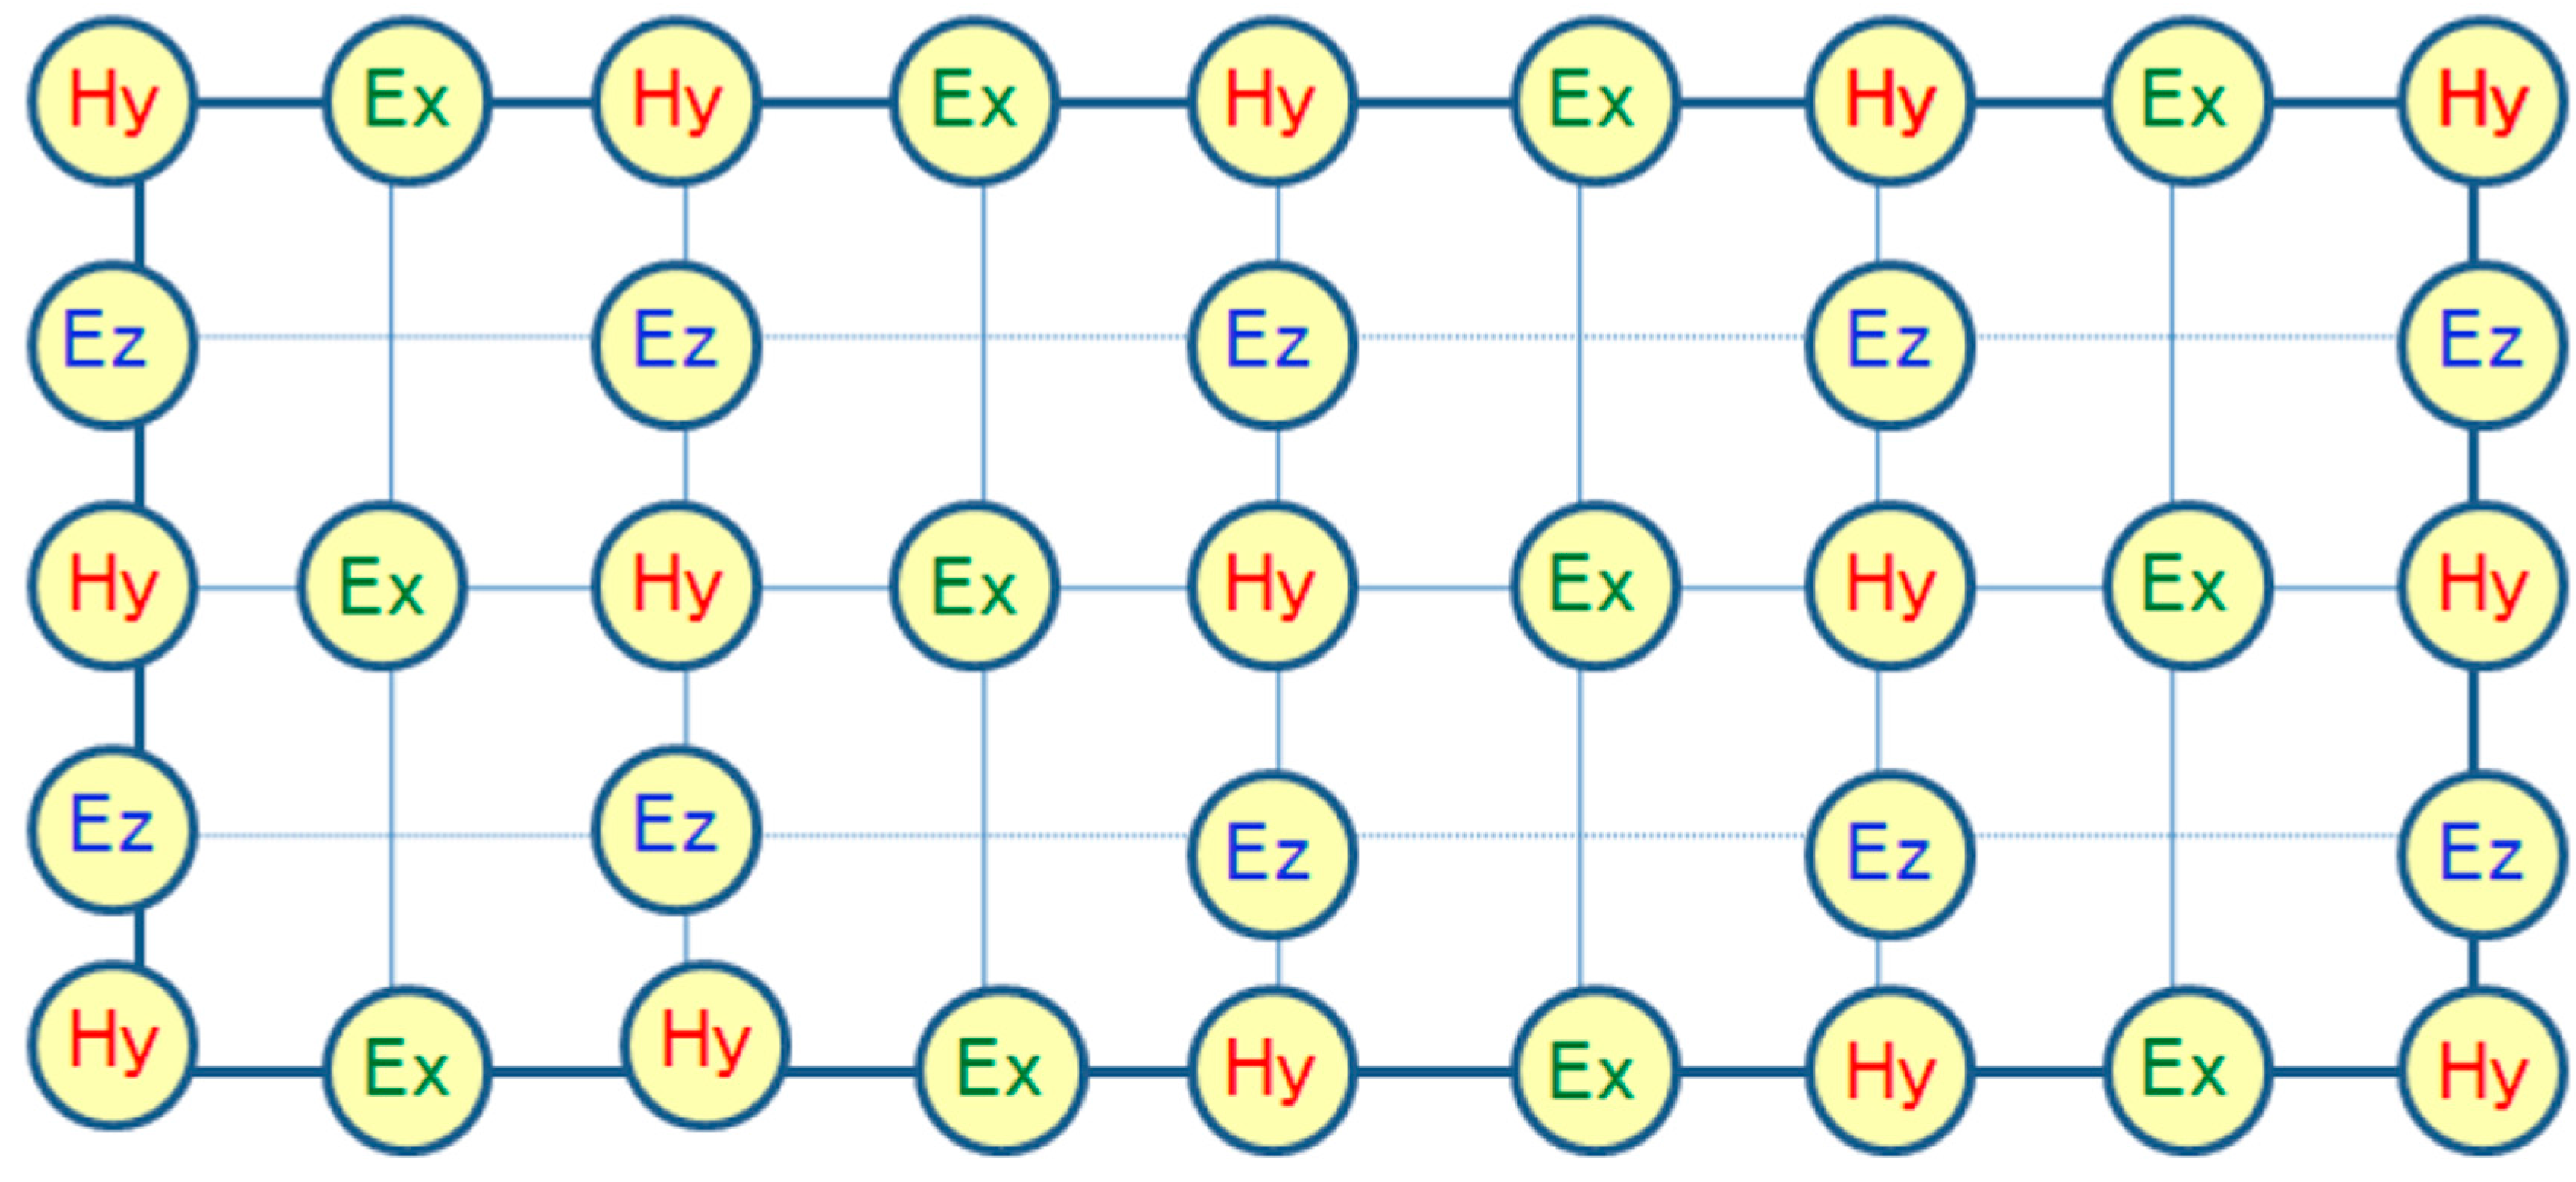
In the two-dimensional (2D) FDTD simulation for TM wave (
Ex,
Hy,
Ez—nonzero components, propagation along with
Z, transverse field variations along with
X) in lossless media, Maxwell's equations take the following form:
The location of the TM fields in the computational domain (mesh) follows the same philosophy as shown in the following
Figure 6.
Figure 6 shows the basic numerical representation of a 2D computational domain of OptiFDTD software for nano-grating structures simulation. Now, the electric field components
Ex and
Ez are associated with the cell edges, while the magnetic field
Hy is located at the center of the cell.
6. Simulation Results and Discussion
In this section, we discussed the simulation results of SWG structures. The simulation results obtained by using the OptiFDTD software package, which is based on the FDTD method that was developed by Optiwave Inc. (Ottawa, ON, Canada) [
22]. This FDTD software gives numerical solutions by using Maxwell’s equation.
The FDTD simulation tool is used to calculate the light reflection losses of SWG structures (here, GaAs solar cells) for conversion efficiency improvement. The nano-grating pitch or period and height of the SWG structures were varied to realize the minimum reflection losses in GaAs solar cells.
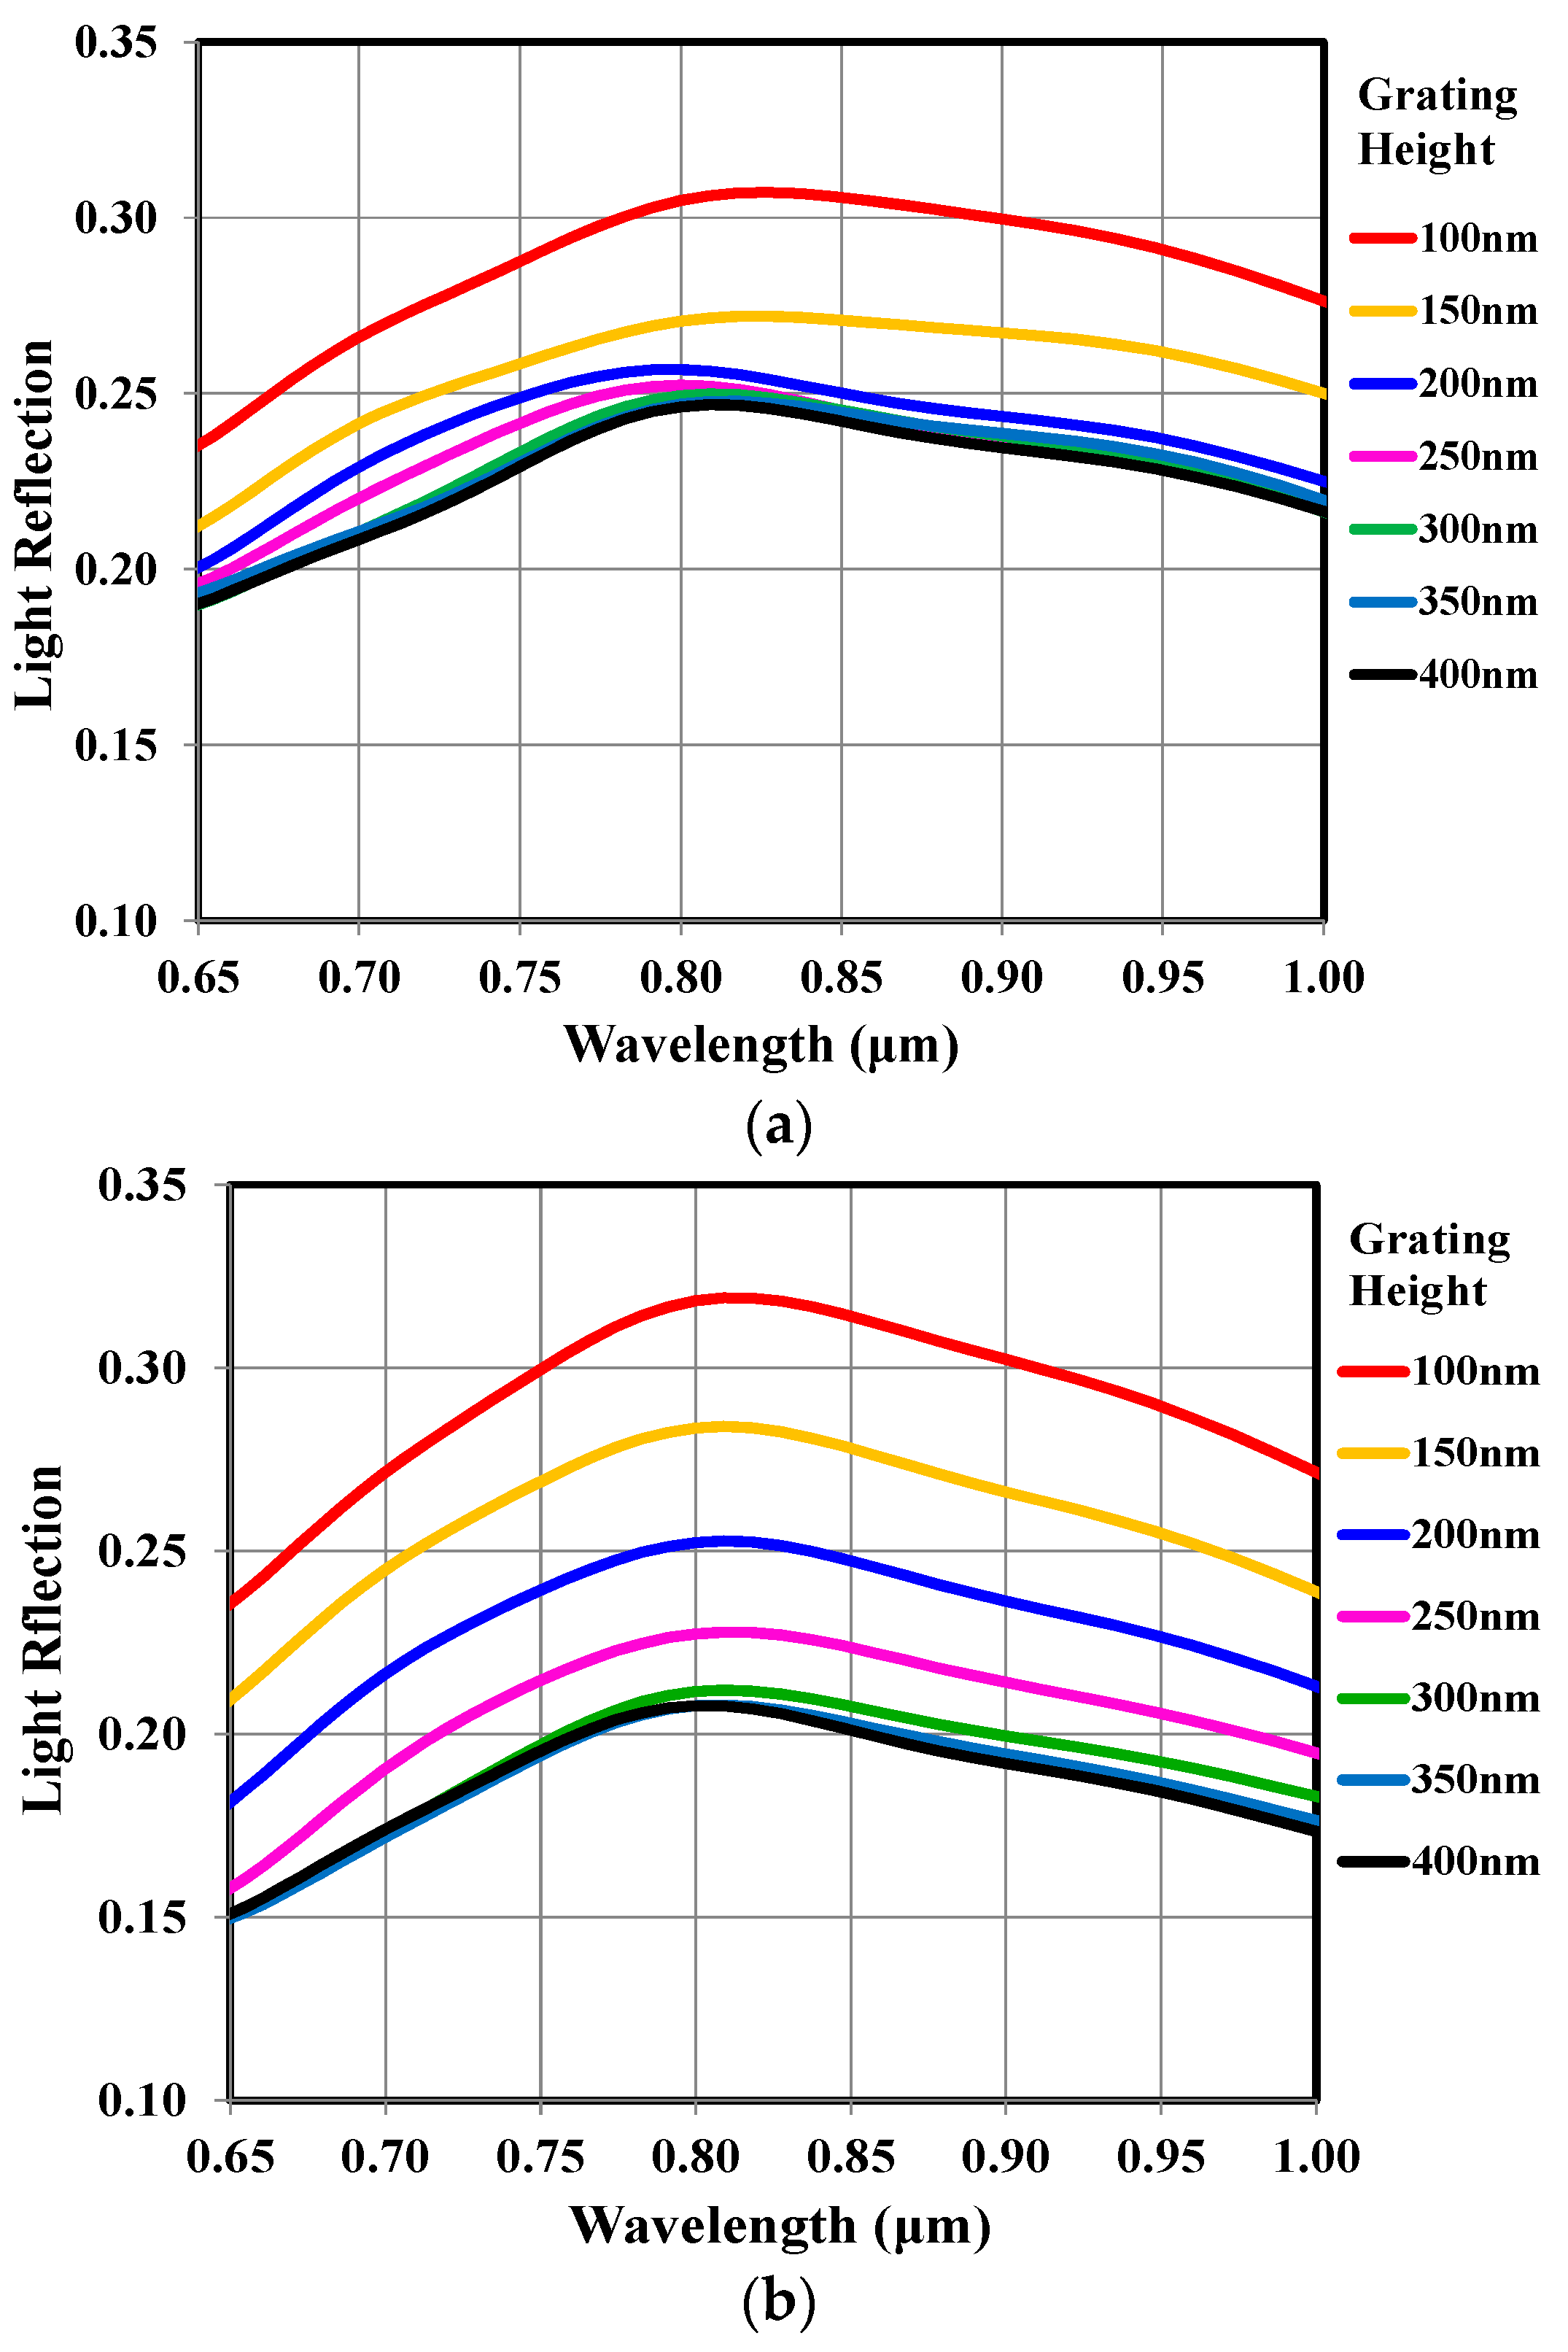
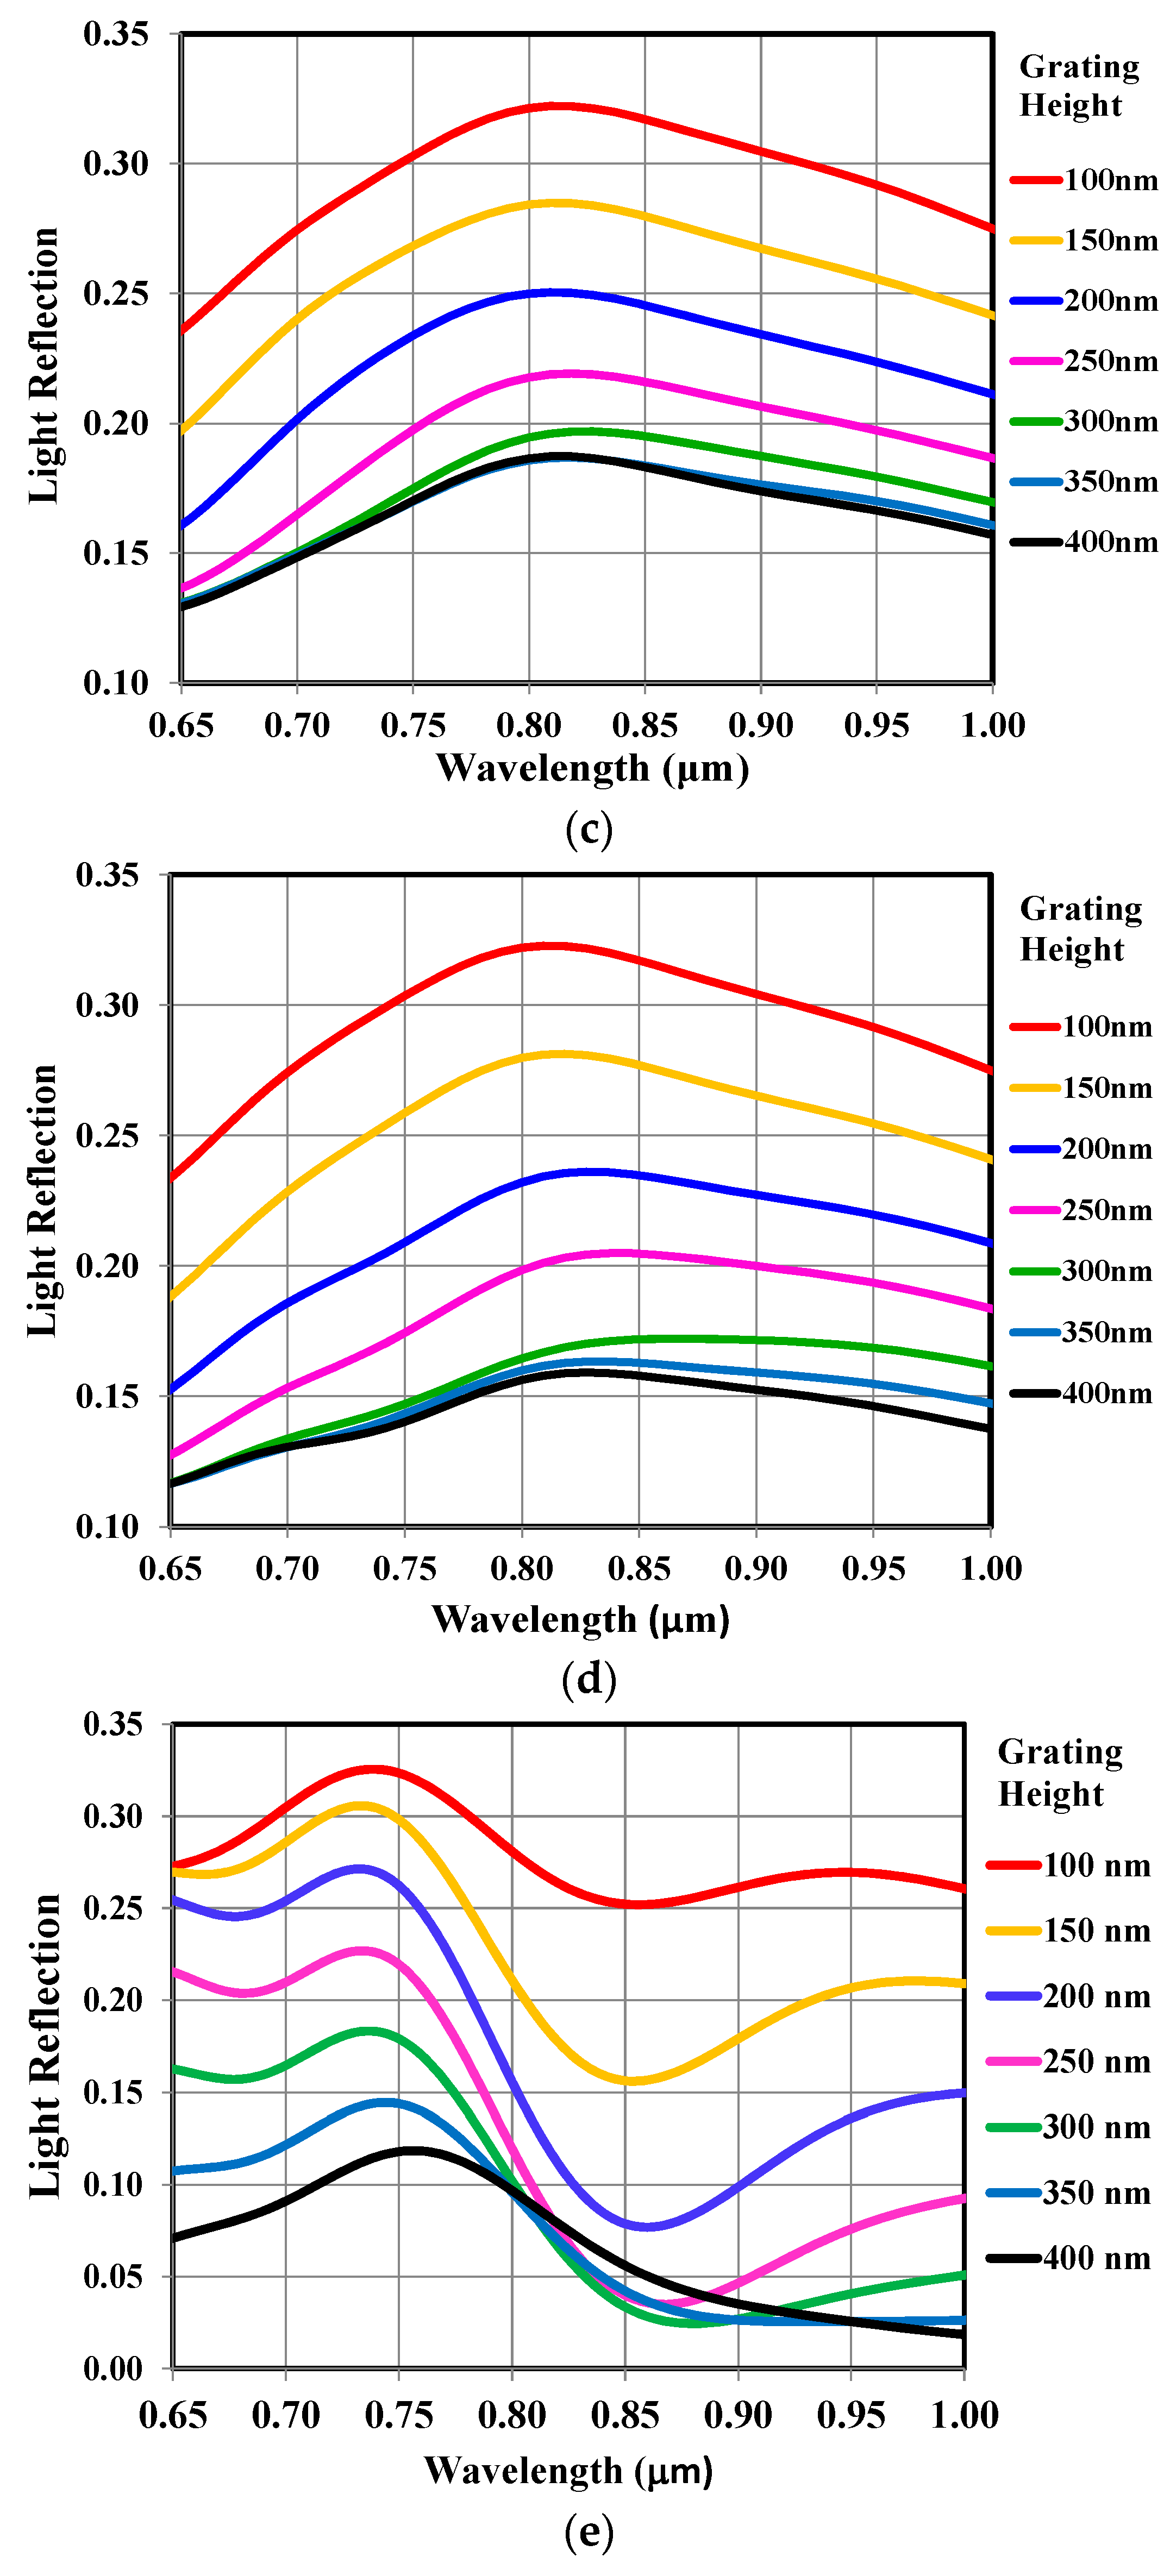
Figure 7 shows the light reflection losses spectra for several nano-grating heights (such as, the heights are varied from 100 nm to 400 nm) with different pitches or periods. The pitches or periods for this simulation are: (
Figure 7a) 200 nm, (7b) 300 nm, (7c) 350 nm, (7d) 400 nm, and (7e) 830 nm. For this simulation, the incident light wavelength was kept constant at 830 nm. The simulated results show that with the increase of nano-grating heights, the light reflection reduces and reached to the saturation of light reflection at 300 nm. In this case, the nano-grating height about 300 nm has the minimum light reflection losses for GaAs solar cells. This is due to the saturation of the nano-grating’s height for this specific design. Hence, this results confirm that when the nano-grating height is about 300 nm the light reflection loss is minimum. It has also been observed that the light reflection for 300 nm and 350 nm nano-grating height is very close. This nano-grating height for light reflection is minimum and it is saturated, which is the similar tendency as reported in [
3]. When the nano-grating height increases further, such as the nano-grating height is 400 nm, the light reflection again increases as shown in
Figure 7. It has again confirmed from the
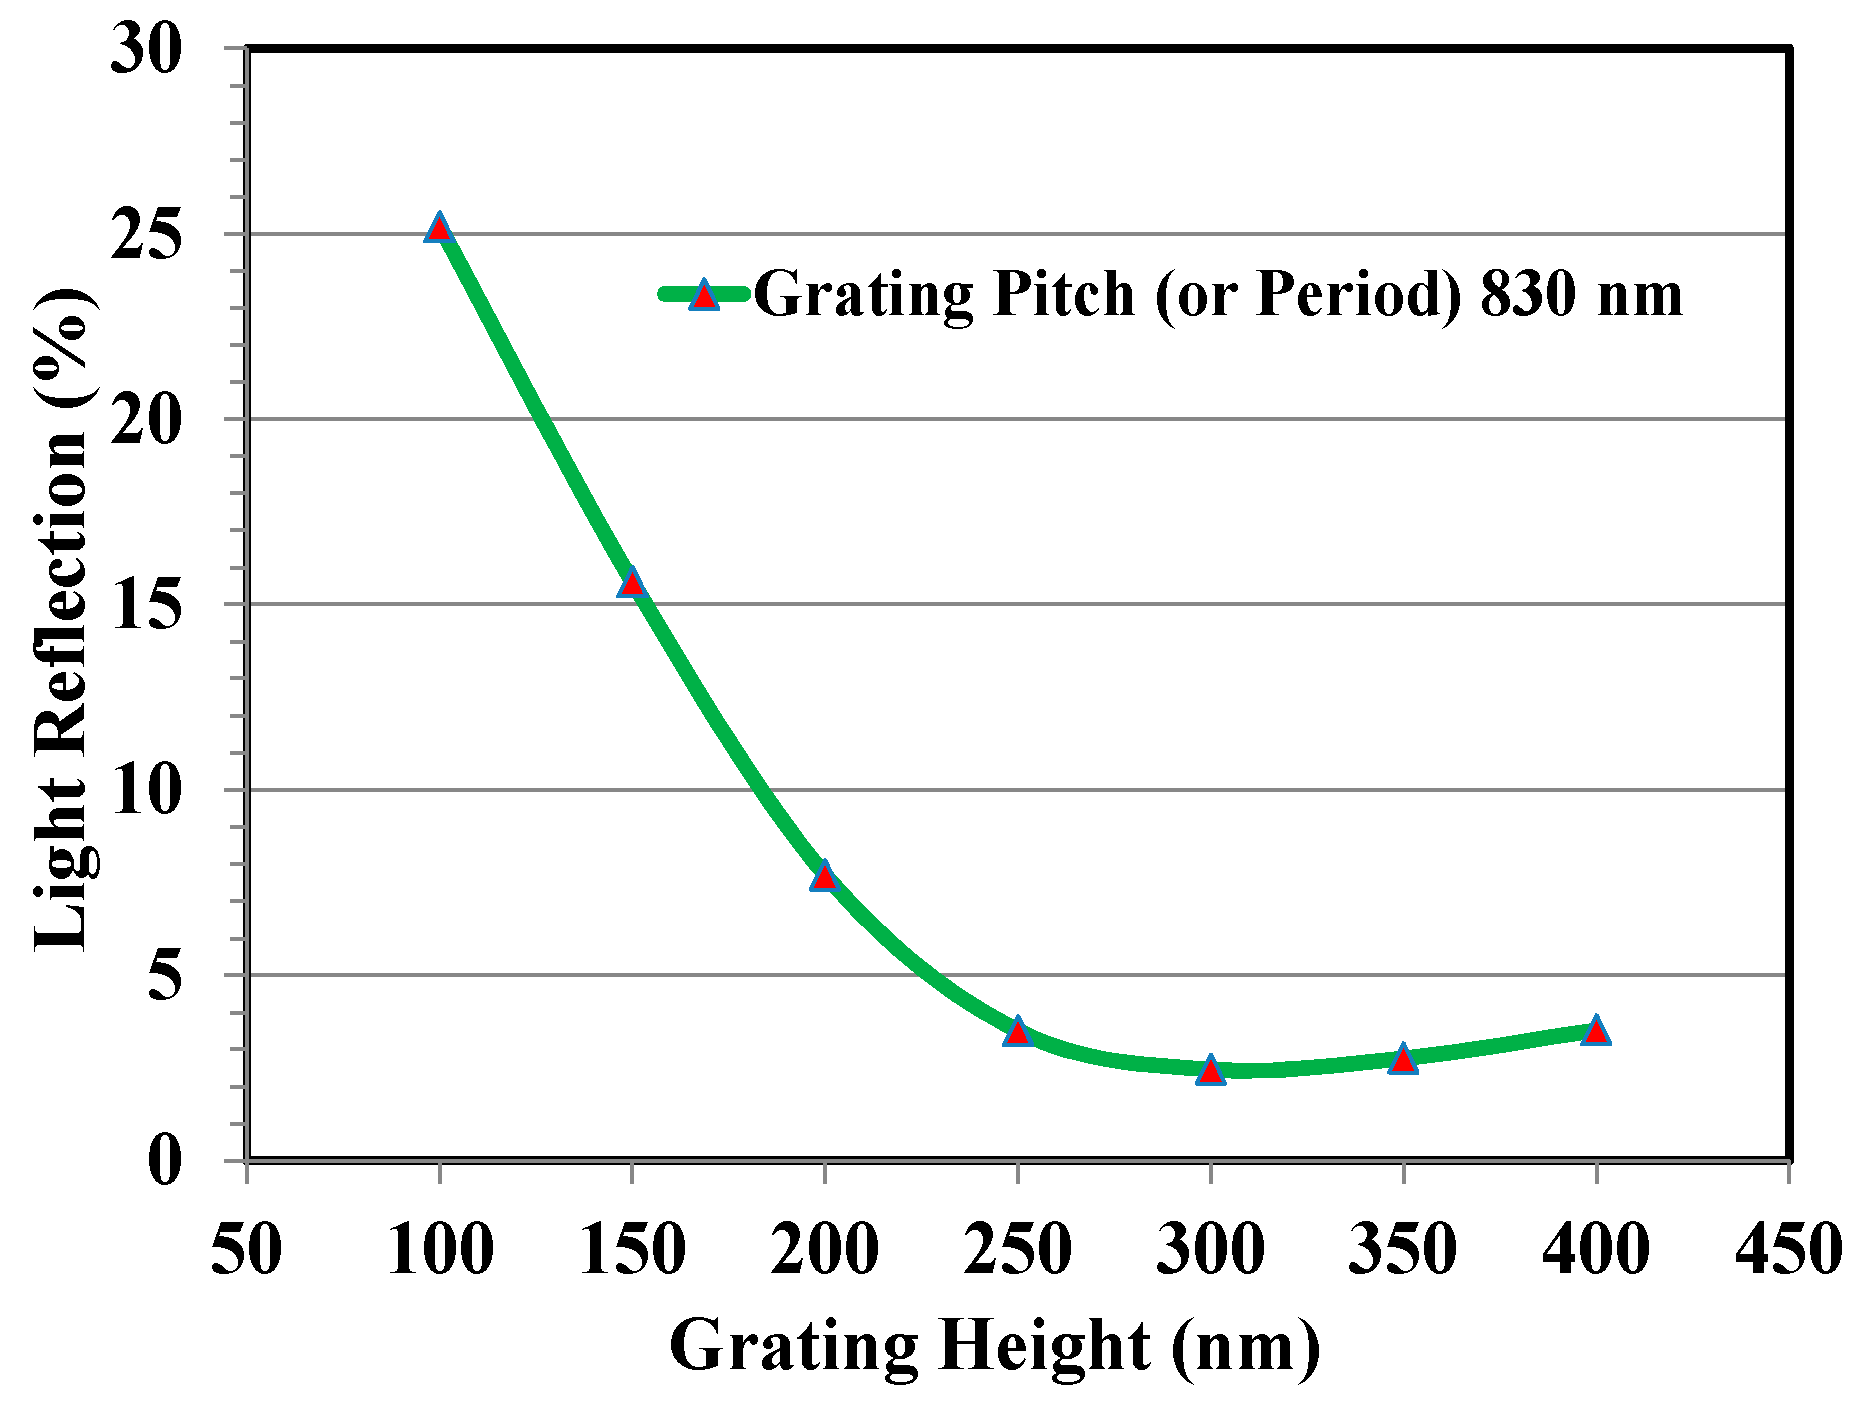
Figure 8. The light reflection versus nano-grating height is plotted in
Figure 8 using the data of
Figure 7e when the nano-grating pitch or period is 830 nm.
Figure 8 shows the simulated minimum light reflection versus the nano-grating height characteristics for a triangular (i.e., conical or perfect cone)-shaped nano-grating structure of GaAs having a constant period at 830 nm. The minimum light reflection about 2% was observed at 300 nm nano-grating height. However, when the nano-grating heights further increased to 350 nm and 400 nm, then the light reflection increased further to higher order direction, such as about 4%. Therefore, this results indicated that the nano-grating height about 300 nm has the minimum reflection losses for GaAs solar cells. This simulated results confirmed that the nano-grating height about 300 nm is the optimum nano-grating height for minimum light reflection losses of GaAs solar cells. Hence, most of the incident light passes through the GaAs substrate without reflecting back to the air (i.e., reduced the light reflection losses) and it increases the conversion efficiency of GaAs solar cells significantly.
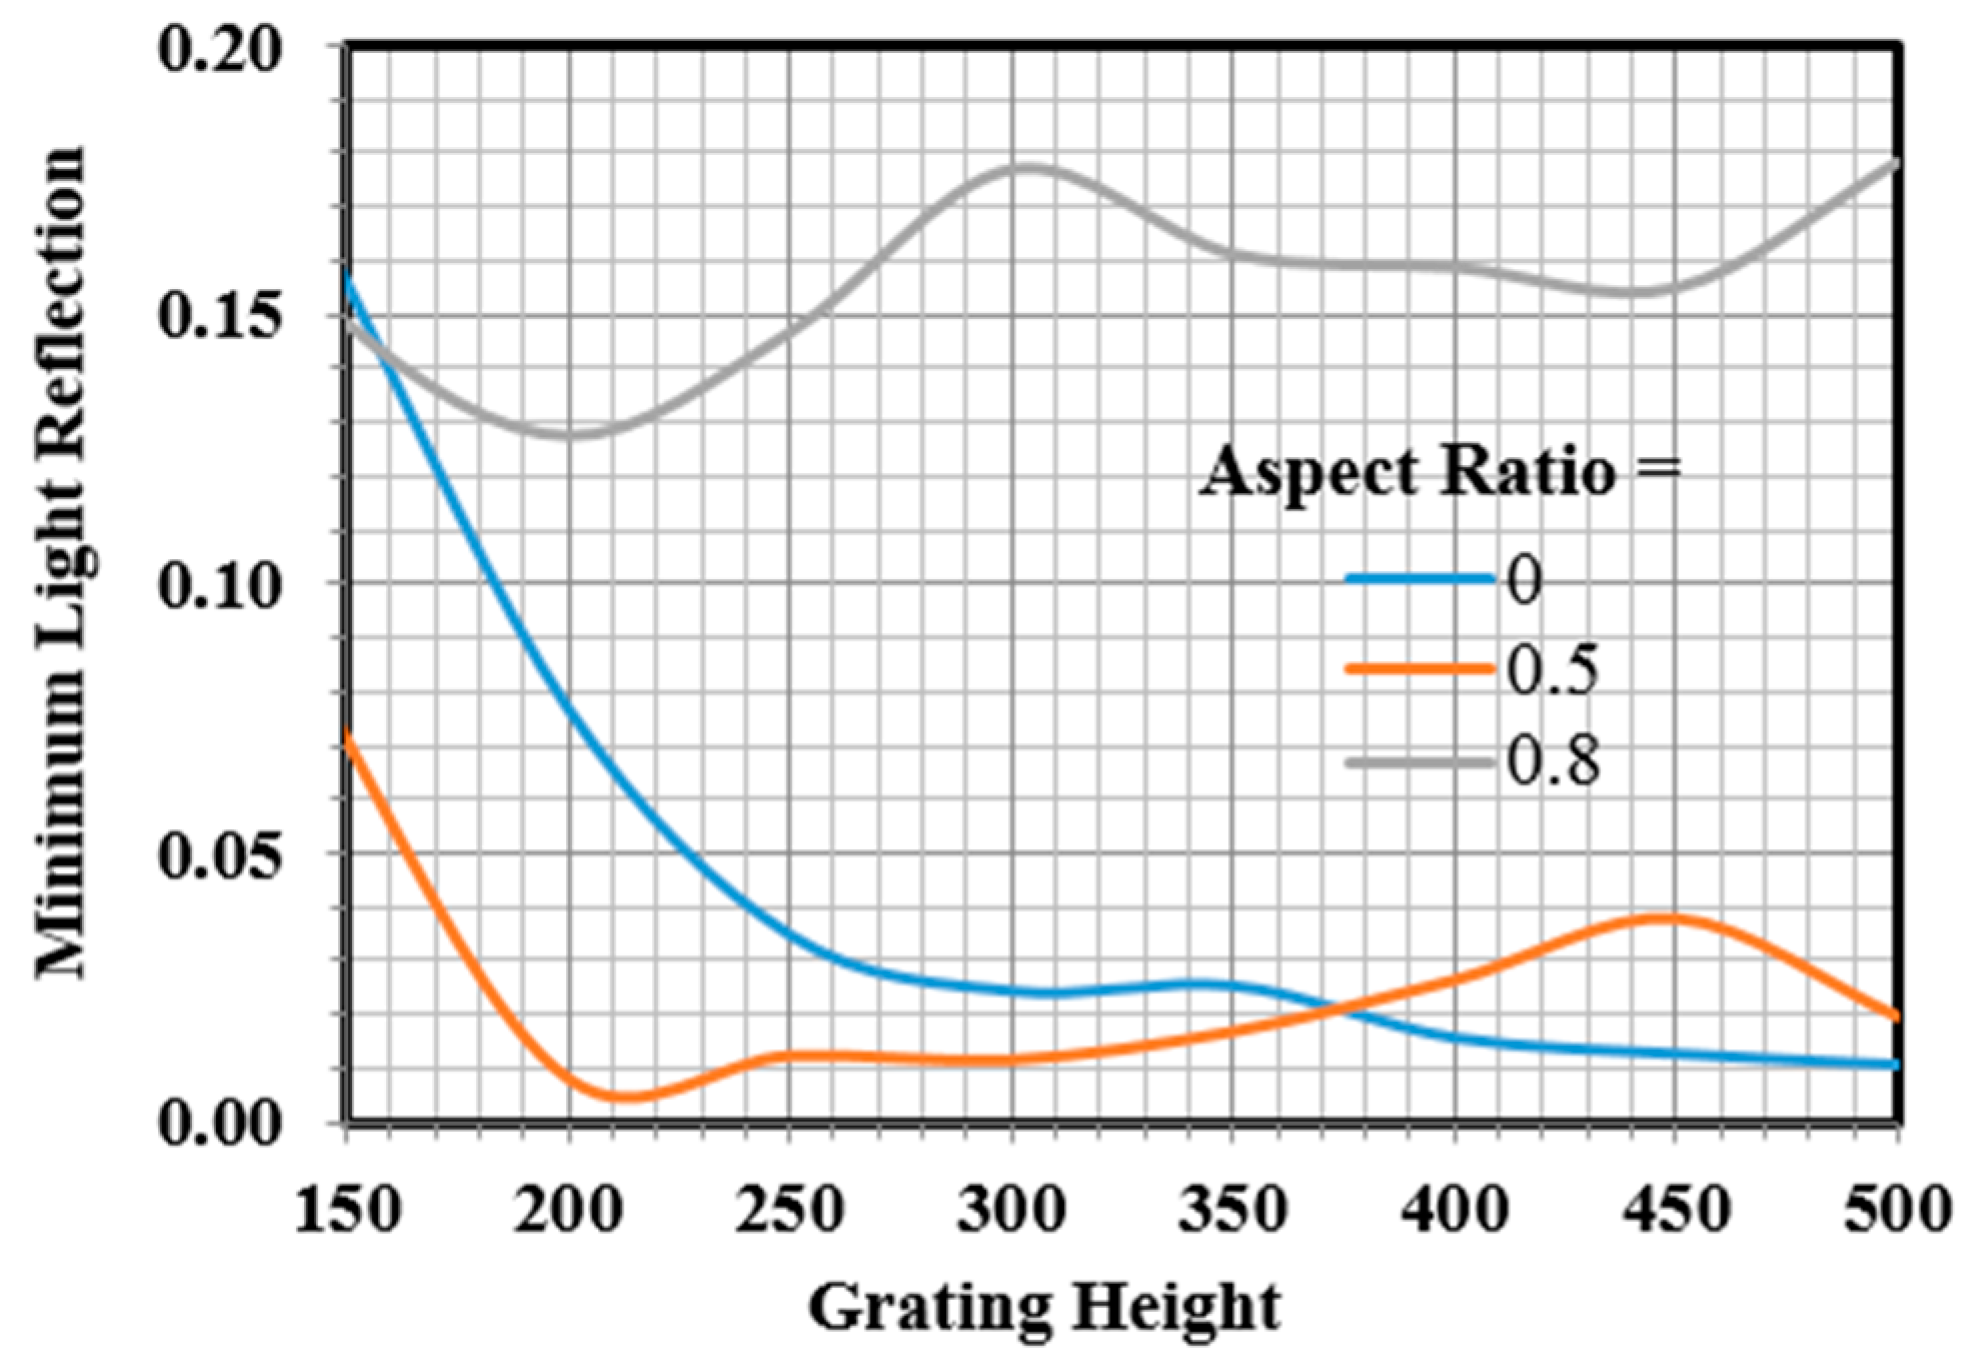
For minimum light reflection, we have considered different aspect ratio’s for the nano-grating period or pitches of 830-nm to obtain the minimum light reflection for GaAs solar cells structure. The parameter “aspect ratio” controls the shape of the nano-grating structure.
Figure 9 shows the minimum light reflection loss for the nano-grating pitch (or period) of 830 nm. For this case, the minimum light reflection is approximately 1%–2% with the nano-grating height of 300–400 nm, when the aspect ratio is ‘0’. However, the light reflection is increased to 1%–4% (with the aspect ratio of 0.5) and the nano-grating height of 250–450 nm; and reaches to 13%–17% with the aspect ratio of 0.8 and the nano-grating height of 200–450 nm.
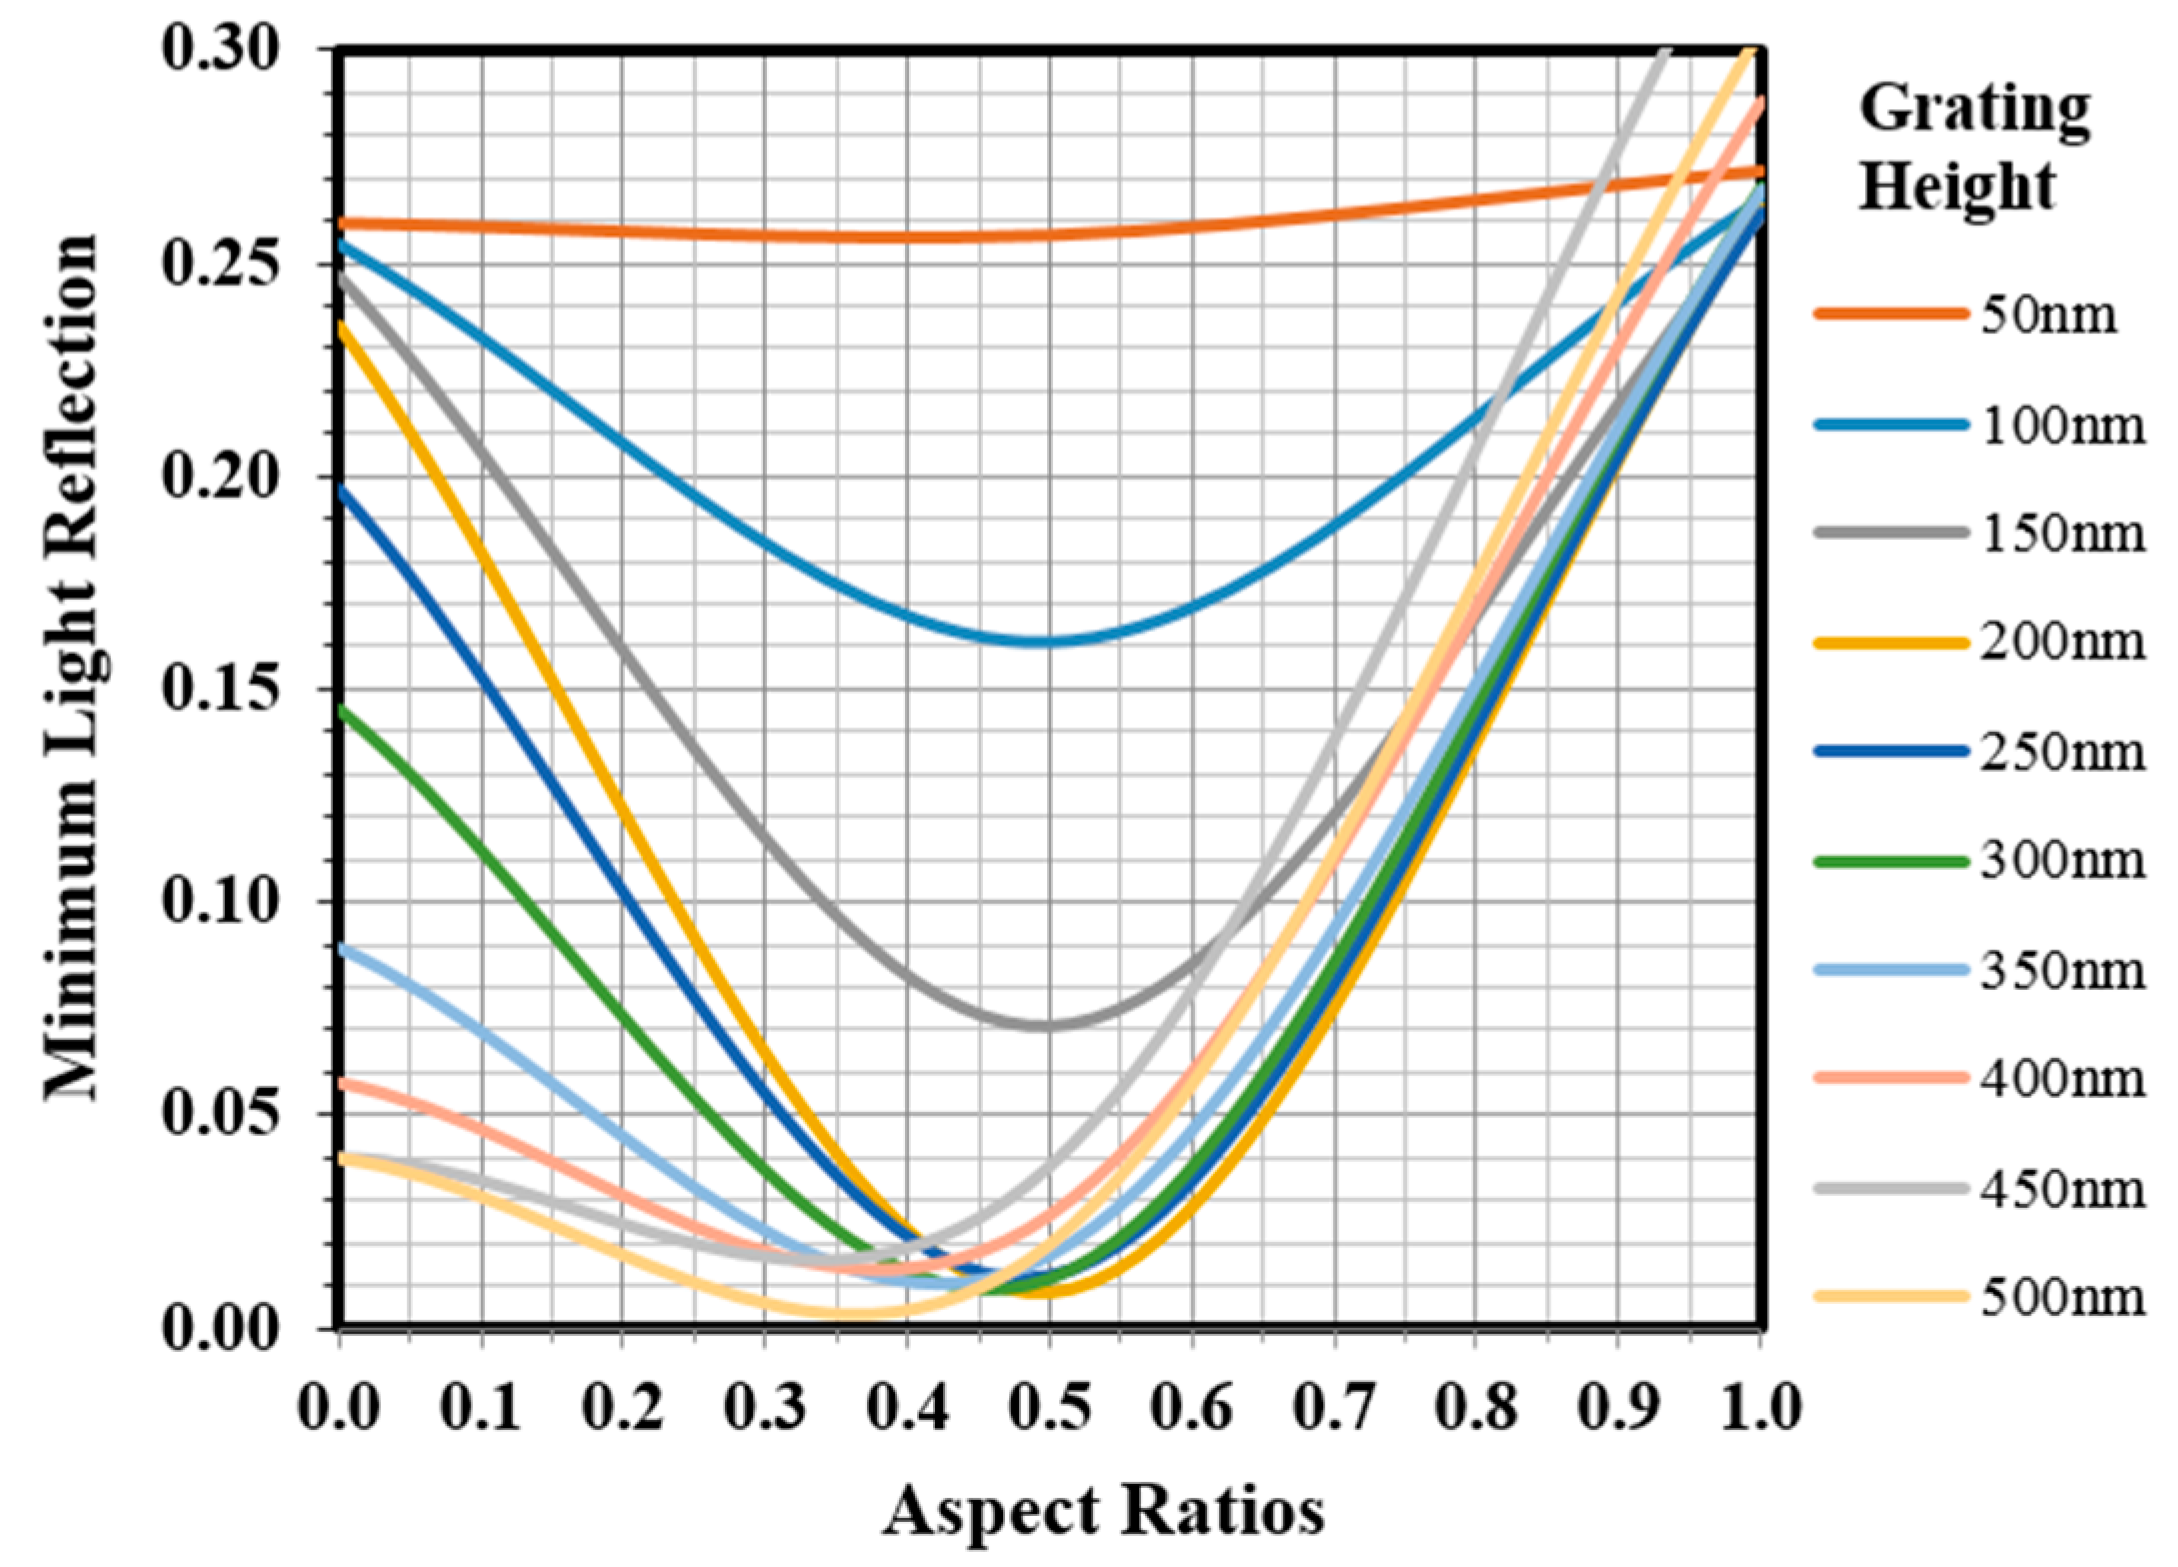
Figure 10 shows the minimum light reflection versus the aspect ratio characteristics for different nano-grating heights. For this study, the nano-grating height is varied from 50 nm to 500 nm. For this case, the nano-grating period is kept constant at 830 nm. Here, the aspect ratio is varied from ‘0’ to ‘1’. As discussed earlier, when the aspect ratio is ‘0’ then the shape of the nano-grating is triangular and when the aspect ratio is >0 but <1, then the shape of the nano-grating is trapezoidal. However, when the aspect ratio is ‘1’ then the shape of the nano-grating is rectangular. The simulated results show the light reflection for 50 nm grating height is >26%, which is like a flat type (about 30% light reflection) substrates. From the plot, it shows clearly that when the nano-grating height increasing from 50 nm to 250–350 nm, then the light reflection is decreasing sharply and drops to about 2%. However, if further increasing the nano-grating height, the reflection loss is increasing rapidly and reached toward to the flat type of substrates, like a 50 nm nano-grating height.
7. Conclusions
In conclusion, this paper reported the design and analysis of nano-structured gratings that can improve the conversion efficiency in GaAs solar cells. The light reflection is about 2% with an optimized nano-grating height of about 300 nm and the period of about 830 nm, which is about 28% lower than that of flat type substrates. The light reflection is calculated by the FDTD simulation tool. The simulated results confirm that the light reflection of a rectangular-shaped nano-grating structure is about 30%, however, the light reflection becomes about 2% for a triangular (i.e., conical or perfect cone)-shaped nano-grating structure, because the refractive index changes gradually in several steps and reduces the light reflection losses from the surface of the substrates or panels. From the simulations, it also noticed that the intermediate structures (i.e., trapezoidal- and parabolic-shaped), the light reflection loss is lower than the rectangular shaped nano-grating structure but higher than the triangular-shaped nano-grating structure. The simulated results confirm that the reduction of light reflection losses will increase the conversion efficiency significantly in GaAs solar cells can be correlated to a practical example of higher conversion efficiency achieved in thin layer dielectric-coated graphene/GaAs solar cells [
12]. Therefore, it has confirmed that the triangular (i.e., conical or perfect cone)-shaped nano-grating structures are an excellent alternative antireflective (AR) coating for the reduction of light reflection losses and improve the conversion efficiency in GaAs solar cells for a sustainable future.

