Article

Online Air-Conditioning Energy Management under Coalitional Game Framework in Smart Community

1
School of Electrical and Electronic Engineering, North China Electric Power University, Beijing 102206, China
2
Electric Power Research Institute, China Southern Power Grid Co., Ltd., Guangzhou 510080, China
*
Author to whom correspondence should be addressed.
Energies 2016, 9(9), 689; https://doi.org/10.3390/en9090689
Submission received: 31 July 2016 / Revised: 22 August 2016 / Accepted: 25 August 2016 / Published: 29 August 2016
(This article belongs to the Special Issue Smart Home Energy Management)

Abstract

:
Motivated by the potential ability of air conditioning (A/C) units in demand response, this paper explores how to utilize A/C units to increase the profit of a smart community. A coalitional game between the households and the load serving entity (LSE) in a smart community is studied, where the LSE joins by selling renewable energy to householders and providing an energy saving service to them through an A/C controller. The A/C controller is designed to reduce the amount of electricity purchased from the main grid by controlling A/C units. An online A/C energy management algorithm is developed, based on Lyapunov optimization, that considers both the A/C energy consumption and the thermal comfort level of consumers. In order to quantify the contribution of A/C units, the Shapley value is adopted for distribution of the reward among the participating householders and the LSE, based on their contribution. The simulation result verifies the effectiveness of the proposed coalitional game for a smart community and the algorithm for A/C.

1. Introduction

With more electricity-consuming products coming into our daily lives, such as electrical vehicles and air conditioning (A/C) systems, load demand increases dramatically and imposes significant burdens on the existing power grid [1,2]. Along with developments in smart grid technologies—such as two-way communication networks and advanced metering infrastructure [3,4]—the control and monitoring of end use loads at the appliance level in smart households is realized [5,6]. The new information and communication technology infrastructures allow faster and more efficient communications, which offers numerous technical benefits and flexibilities and makes cooperation between utility providers and consumers possible [7,8].
The end users are indeed becoming aware of taking part in the sustainable operation of the energy system within an overall smart community strategy [9,10], rationalizing the amount of energy required by controllable loads [11], or by wisely scheduling run times of smart appliances that are likely to be shifted in time [12,13], and also turning themselves into potential carbon-free generators of energy, through the use of renewable resources [14,15]. Among the smart appliances in households, A/C has traditionally drawn more attention than other end use loads because of its ability to shift energy consumption within a certain time period by storing electricity as thermal energy [16,17]. On the other hand, A/C is one of the major consumers of energy and has a significant influence on the overall energy usage of households. Controlling the energy consumption of A/C can lead to significant energy savings for smart households [18]. The potential of A/C units for load balancing/regulation service has been evaluated in [19]. However, the load control of A/Cs adversely impacts the thermal comfort of customers. Reducing the discomfort of consumers is a top priority in the energy management of A/C units. To this end, studying the energy consumption behavior of A/C units and developing algorithms for effective control without compromising users’ comfort have become an important part of energy management research [20].
In the last few years, some studies have been devoted to the intelligent and interactive management of A/C units. Some papers need to be based on the forecast value of system variables to solve the optimization issues for A/C energy management. For example, [21] developed an innovative event-based approach to minimize the A/C’s day-ahead energy cost, which is based on the forecast information of the system. In [22], a novel intelligent residential A/C system controller is set forth to provide optimal comfort/cost trade-offs for the residents. However, the controller needs to use weather forecast information. Hong et al. [23] aimed to obtain the optimal temperature scheduling for A/Cs according to the day-ahead electricity prices and the forecasted outdoor temperature. In the load control strategy of [24] A/C temperatures were set according to the forecasted prices and outdoor temperatures 24 h in advance. Meanwhile, some other papers formulate the A/C control problem as an optimization problem with complex constraints and need to analyze a large number of historical data or adopt complex traditional algorithms, including model predictive control [25], genetic algorithms [26], and dynamic programming [27], which is of high computational complexity. For instance, a centralized optimal control algorithm with comfortable room temperature consideration is proposed in [28] by controlling the operational set-point of A/C units. However, the control algorithm relies on the population information of the room temperature, which makes it vulnerable to implementation online. Sun et al. [29] developed a methodology which combines stochastic programming and rollout techniques for controlling A/Cs in order to minimize the electricity cost. In [30], a mixed integer multi-scale stochastic optimization problem was formulated, and an algorithm based on model predictive control was proposed for the scheduling A/Cs for a home energy management system.
From the above, the existing studies on A/C energy management have fully reflected the potential ability of A/C units on the demand side. However, most of them are based on forecasting models or complex computation, which is not suitable for practical application. As for the forecasting model, due to the time-dependent uncertainties in weather condition, the unpredictable behavior of customers, and the intermittent nature of renewable energy resources [31], the forecasting error of these sources of information is relatively large [32], making the energy management of A/C much more challenging. On the other hand, the contribution of A/C in the demand response is not quantified in these researches. The householders cannot get the corresponding reward, which is disadvantageous for the long-term cooperation between householders and the load serving entity (LSE). In brief, there is a need for a cooperative strategy with a fair reward allocation scheme and a control algorithm for A/C units with low computational complexity. In this paper, motivated by A/C units’ potential in demand response, a coalitional game for a smart community and an online energy management algorithm for A/C units are proposed. In the algorithm, we tackle the A/C energy management problem with a Lyapunov optimization approach [33], which is a useful technique for solving stochastic network optimization and does not rely on any future information.
The main contributions of this paper are summarized as follows:
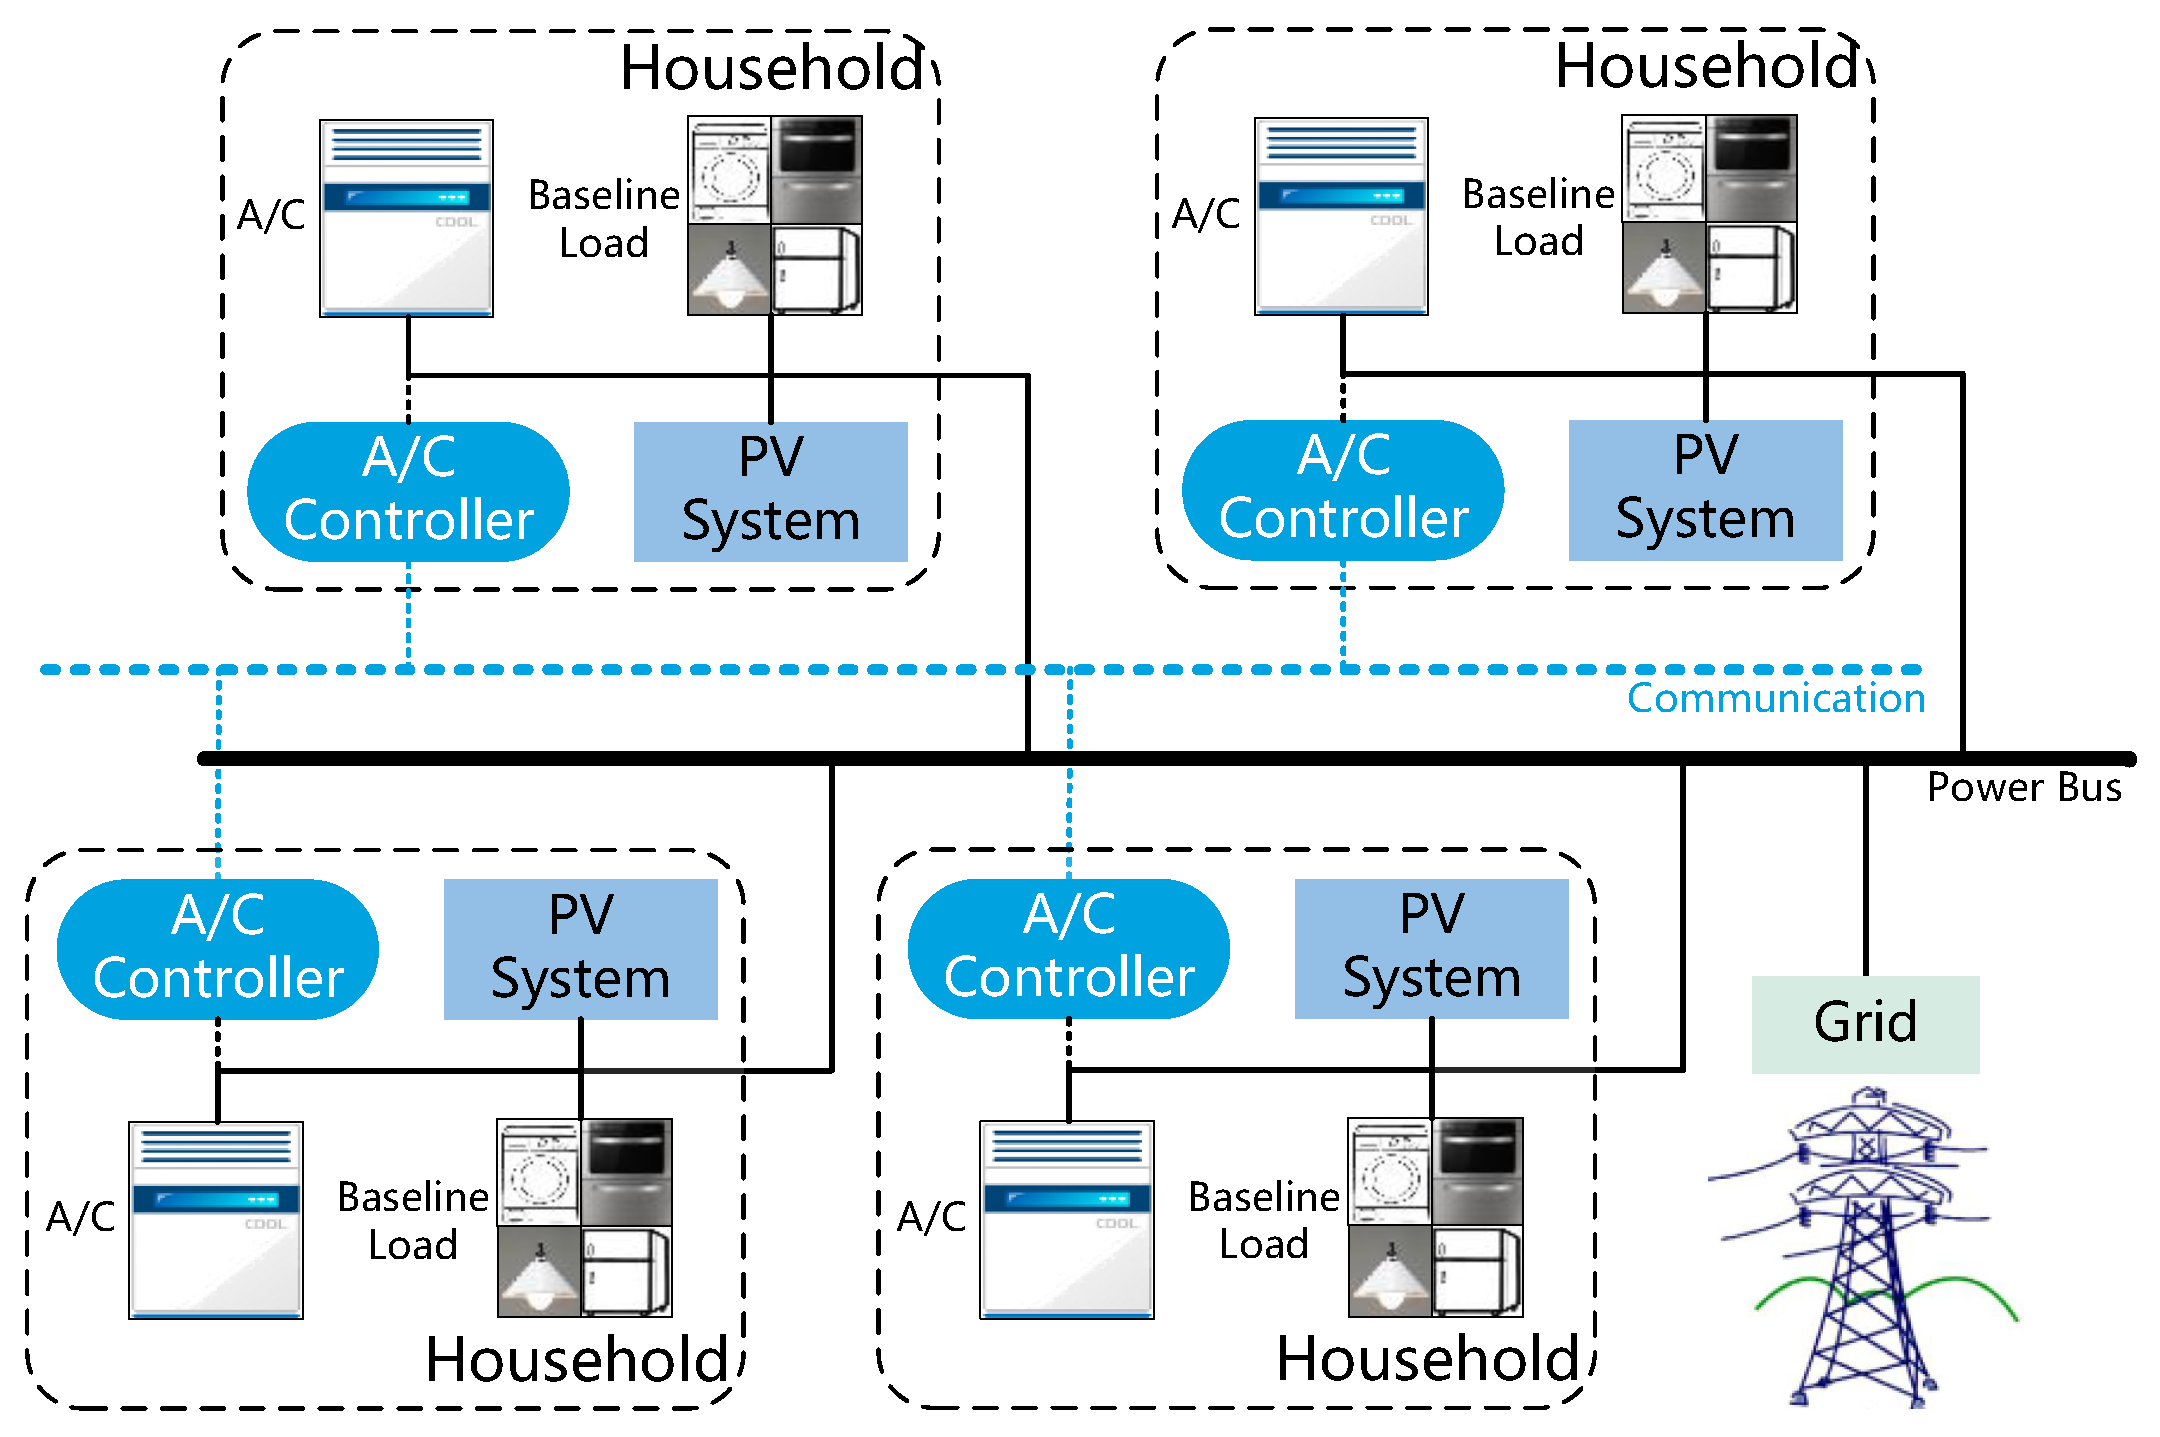
  • A coalitional game framework is established between smart households and the LSE to improve the revenue of the community. The LSE sells renewable energy to the householders and provides energy saving service for A/C units in the household through an A/C controller. A suitable utility function is proposed to capture the benefit to the coalition. The game is economically beneficial to both the households and the LSE, with the improvement of the self-consumption for renewable energy.
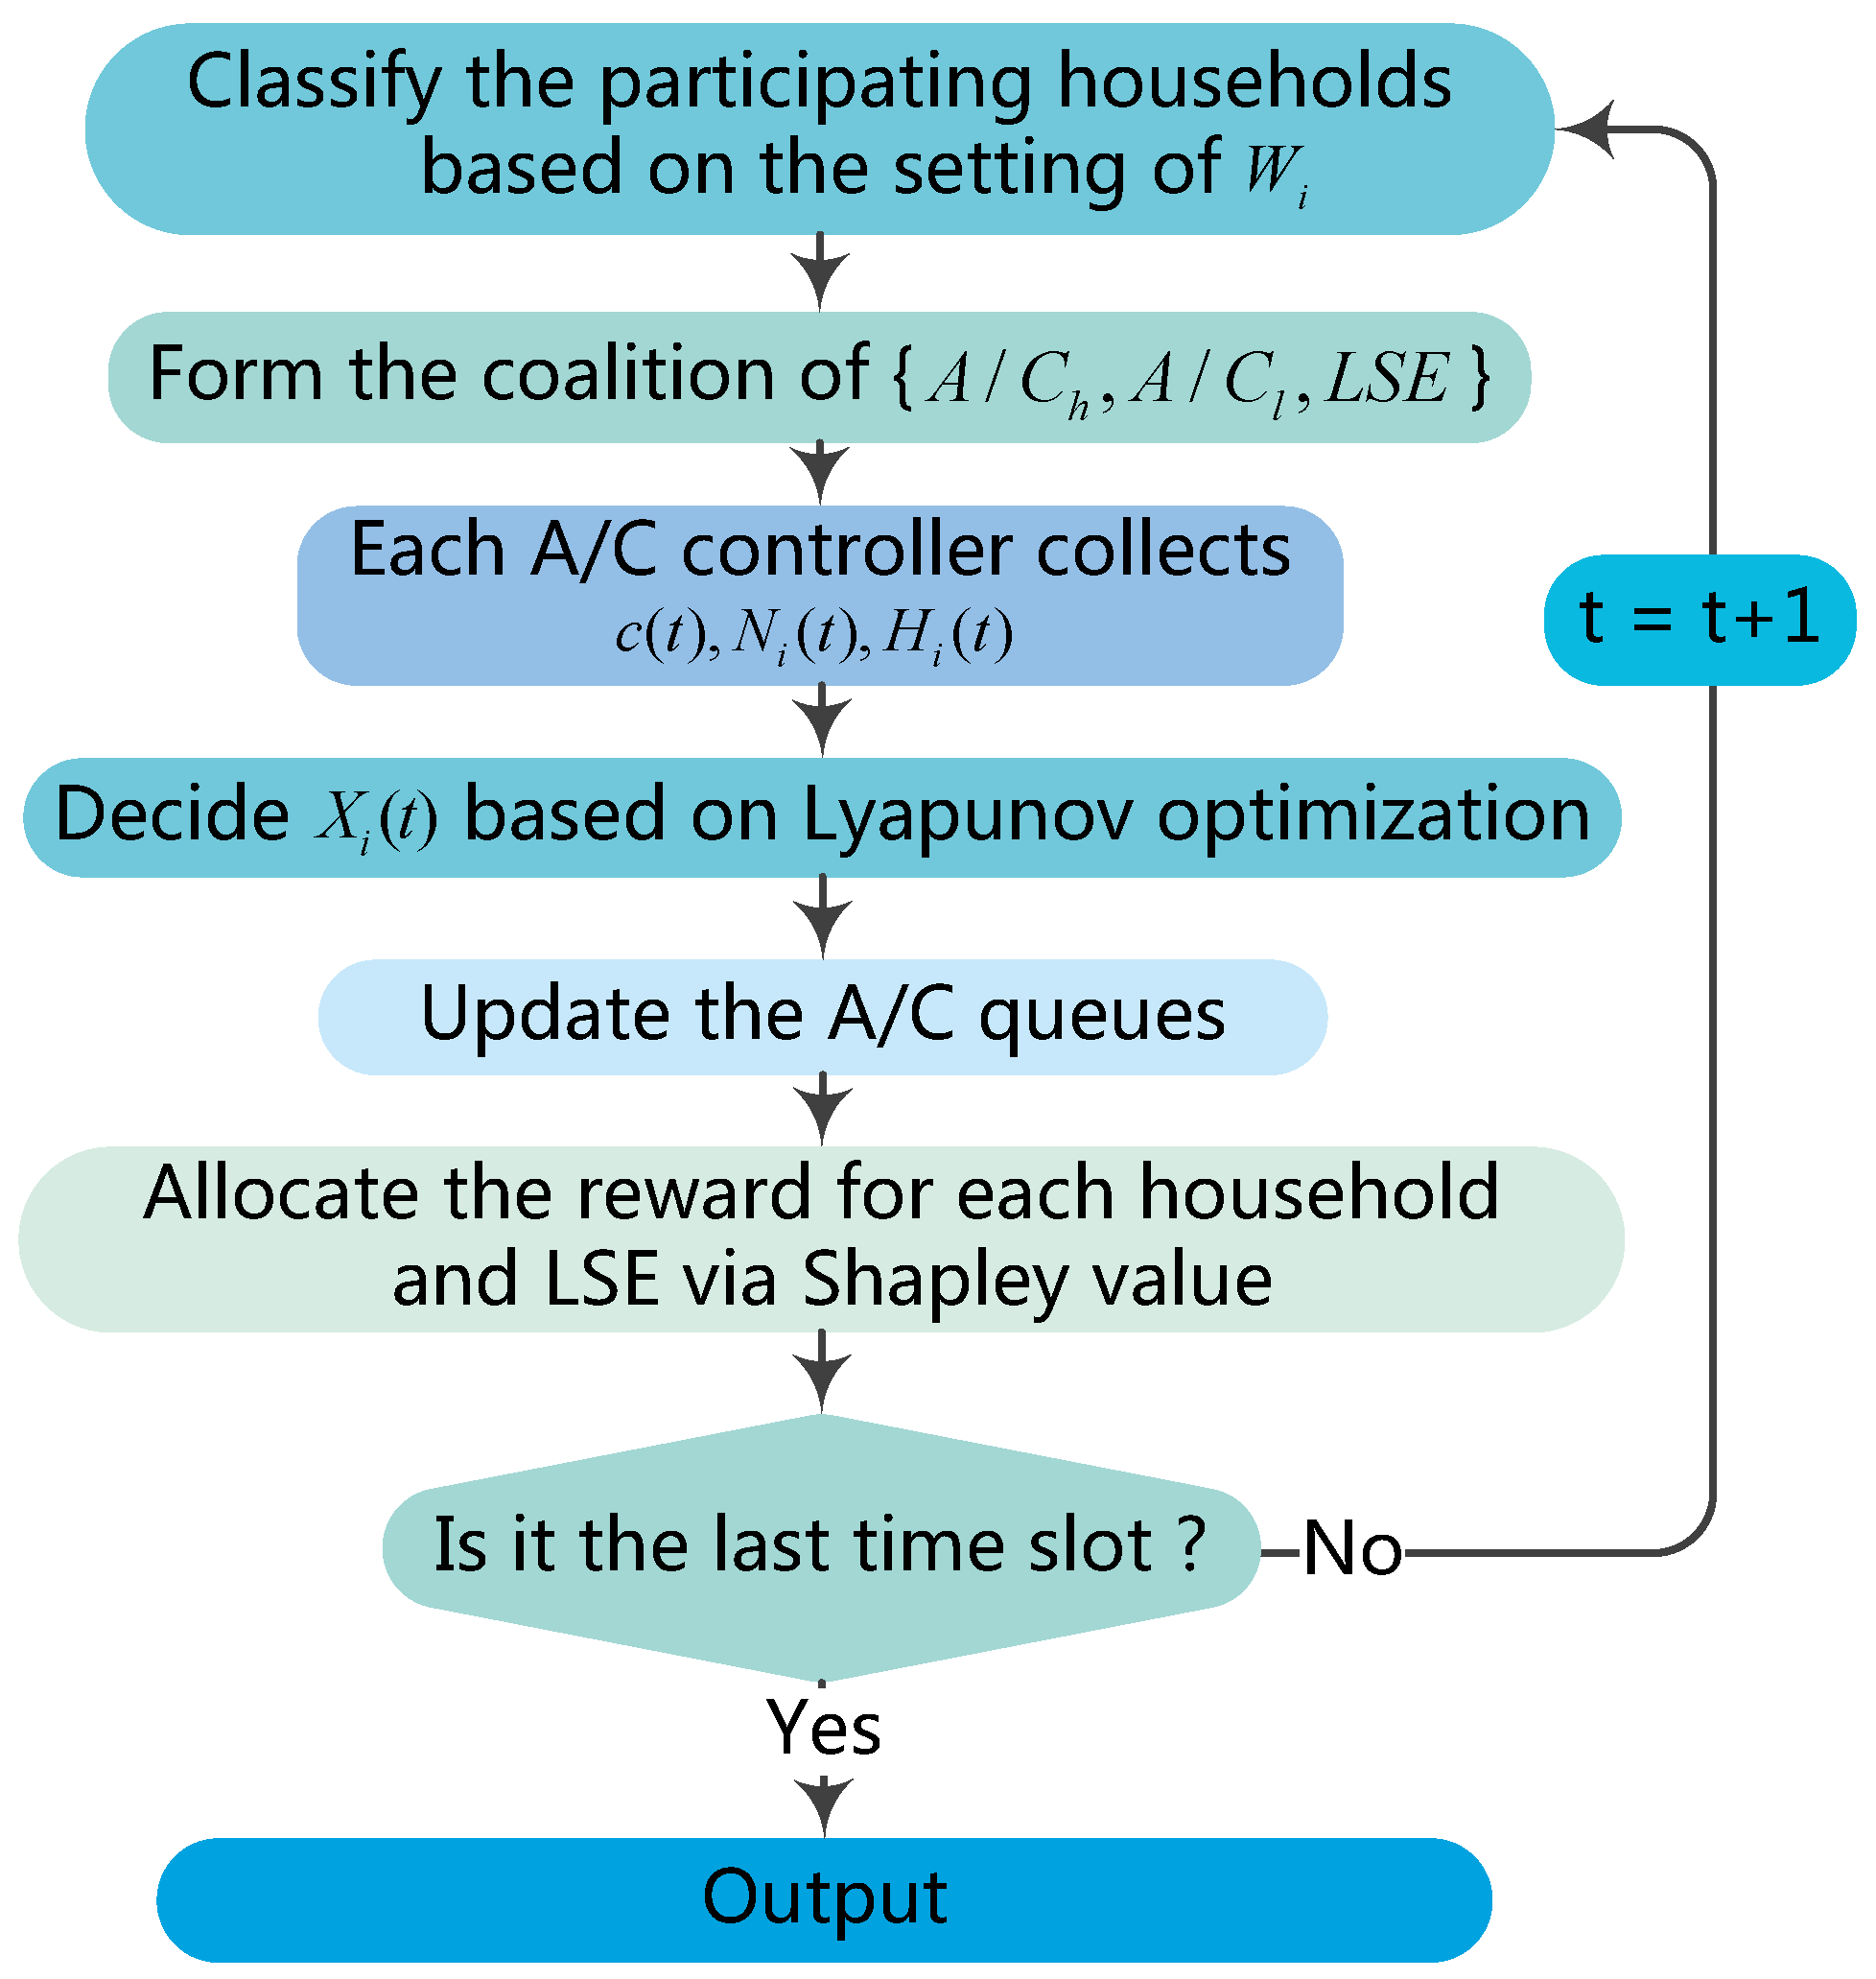
  • In the A/C controller provided by the LSE, an online energy management algorithm based on Lyapunov optimization is developed for A/C units to reduce the amount of electricity purchased from the main grid and further increase the revenue of the coalition. It does not rely on any future information, and could quickly make decisions under the fluctuation of weather conditions, renewable generation, load demands, and prices. The decision at each slot can be made by only using the current observations, which has high efficiency and requires small computational resources.
  • The Shapley value is adopted to allocate the reward of each member in the coalition, which provides a fair and unique solution for the coalitional game. The contribution of each participating householder is quantified, which is beneficial for the long-term operation of the coalition. The simulation result verifies that a householder with a greater contribution would get more benefits.
The rest of this paper is organized as follows. In Section 2, we begin with the introduction of the system model and the description of the operation mode of the smart community considered in this study. To improve the revenue of the smart community, we propose a coalitional game and the corresponding reward allocation scheme for the participating households and LSE in Section 3. In the A/C controller of each participating household—which is provided by LSE in the game—we develop an online algorithm for A/C to solve the cost minimization problem of each household in Section 4. Simulation results based on real-world data are presented and analysed in Section 5. Finally, some concluding remarks are presented in Section 6.

2. System Model and Operation Mode

2.1. System Model

A graphical representation of the smart community is shown in Figure 1. It consists of N households that are served by an LSE. Each household is equipped with rooftop photovoltaic (PV) panels and an A/C controller which are installed and owned by the LSE. The A/C controller can execute the energy management algorithm to control the operation of the A/C unit.
The rooftop PV system consists of PV panels, inverters, and relevant filters. The output of the PV system is dynamic and difficult to predict, because it depends on the weather conditions. The household load is classified into two groups: A/C and baseline load. A/C is the single controllable appliance in this paper. The control is conducted in terms of switching A/C unit on/off states with a guarantee of thermal comfort levels that are experienced by the householders. For each household i, denote by S i ( t ) the output of the PV system (in units of kWh) and by L i , b the baseline load (in units of kWh) at time t. Define N i ( t ) = max ( S i ( t ) L i , b , 0 ) as the surplus PV energy after meeting the baseline load. The surplus PV energy N i ( t ) will be consumed by A/C or be sold to the main grid.
The thermal dynamic behavior of household A/C is modelled based on the equivalent thermal parameters approach [19]. As for household i, when A/C is on over the period [ t k , t k + 1 ] , the indoor temperature at time t k + 1 increases to T k + 1 , which is given by:
T k + 1 = T 0 + Q R ( T 0 + Q R T k ) exp ( t k + 1 t k R C )
When A/C is off over the period [ t k , t k + 1 ] , the indoor temperature at time t k + 1 drops to T k + 1 , which is given by:
T k + 1 = T 0 ( T 0 T k ) exp ( t k + 1 t k R C )
where T k is the indoor temperature at time t k . T 0 is the temperature of the surrounding air. Q is the equivalent operational heat rates (W). R is the equivalent thermal resistances (C/W). C is the equivalent heat capacities (J/C) [19,34]. These thermal coefficients can be estimated with statistical and regression techniques by fitting the observed performance data to the equations [35].

2.2. Operation Mode

The LSE installs the PV panels for each householder in the smart community and makes profit by cooperating with householders or selling PV energy to the main grid. When a householder cooperates with the LSE to form a coalition, the householder could utilize its rooftop PV system to satisfy its load demand. The selling price of PV power by the LSE is the same as the price by the main grid. However, the householder will get certain rewards from the LSE, according to their contribution in the coalition. Furthermore, the LSE will help the householder reduce the electricity bill through the A/C controller. If the householder does not cooperate with the LSE, their rooftop PV energy will be totally sold to the main grid and their A/C will operate on its own.
Since the LSE offers rewards and energy saving services to the participating households in the coalition, it is reasonable to assume that the households will be interested in participating in the coalition. On the other hand, as the feed-in tariff of PV power is considerably smaller than the selling price by the main grid, the LSE will also benefit greatly from cooperation with the householders, as the coalition will promote the self-consumption of PV energy.

3. Coalitional Game for the Smart Community

Coalitional game is a branch of game theory that studies whether a group of players—i.e., the households and the LSE in this paper—can be better off if they decide to join in a coalition [36]. A coalitional game is defined by ( N , v ) , where N is the set of participating players and v : 2 N R is a function that assigns every coalition M N a real number which represents the rewards achieved by M .

3.1. Proposed Coalitional Game

In this paper, the smart households and LSE in N form a coalition M . The reward that the coalition of M can obtain is the increased profit under the coalitional game compared with that of the independent mode, under which the participating households do not cooperate with each other and operate independently. The value function v ( M ) for the coalition M can be defined as:
v ( M ) = F a ( M ) F c ( M ) , M N
where F a ( M ) is the total cost of all players when they do not cooperate with each other. F c ( M ) is the overall cost of the coalition under the coalitional game. Since Equation (3) represents the revenue of the coalition M , it can be divided in any arbitrary manner between the members. Therefore, the proposed coalitional game v ( M ) is a game with transferrable utility [37].
Theorem 1. 
Consider N = { 1 , 2 , , N } as the set of N households in the community where the LSE provides PV panels for every householder. The reward will increase for the households as more of them agree to form a coalition M N with the LSE.
Proof. 
Given the fact that the feed-in-tariff of PV power is lower than the purchasing price from the main grid, the self-consumption of PV power would be beneficial for both the households and the LSE. As more households from N form a coalition with the LSE to consume the PV power, the electricity purchased from the main grid will reduce, and at the same time, the expected rewards of the coalition will increase. Additionally, the participating householders will get certain rewards according to their contribution to the coalition. Therefore, it would always be beneficial for each household to join the coalition in order to reap greater payments. ☐
According to Theorem 1, the proposed coalitional game will manifest itself in increased profit that can be shared among the participating households and the LSE in the coalition.

3.2. Reward Allocation Scheme

It has been demonstrated in Theorem 1 that the proposed coalition could result in increased profits for the whole group of players. In this section, we will clearly show how the cultivated rewards from the coalition should be shared among the participating players. The Shapley value is adopted to allocate the increased profits among the participating players.
The Shapley value is a solution concept that provides a unique expected payoff allocation for a given coalitional game ( N , v ). It describes an effective approach to the fair allocation of gains obtained by cooperation among the players of a coalitional game. The concept of the Shapley value (which was developed axiomatically by Shapley [38]) considers the relative importance of each player to the game in deciding the payoff to be allocated to the players. ϕ i ( v ) denotes the payoff to each player i N . Fairness is defined as satisfying the following four axioms, which a payoff allocation scheme would reasonably be expected to satisfy.
(1) (Efficiency) The entire payoff is divided among the participating players without excess remains, which can be described as i N ϕ i ( v ) = v ( N ) .
(2) (Symmetry) Two participants that contribute equally are rewarded equally. Let S { i , j } = , if v ( S ) { i } = v ( S ) { j } then ϕ i ( v ) = ϕ j ( v ) .
(3) (Null player) Participants that do not contribute receive no payoff. Let S { i } = , if v ( S ) { i } = v ( S ) then ϕ i ( v ) = 0 .
(4) (Linearity) The total payoff rewarded for contributing to two games is the sum of the payoffs that would be awarded for contributing to each of the two games individually. If v 1 and v 2 are two value functions then ϕ i ( v 1 + v 2 ) = ϕ i ( v 1 ) + ϕ i ( v 2 ) .
The Shapley value can be shown to be the only payment distribution method that satisfies these four axioms, with the added benefit that the solution is unique. Mathematically, the Shapley value ϕ i ( v ) of a player i is given by:
ϕ i ( v ) = S N { i } | S | ! ( N | S | 1 ) ! N ! [ v ( S { i } ) v ( S ) ]
The Shapley value ϕ i ( v ) can be interpreted as the expected marginal contribution that player i makes to any coalition of N , assuming all orderings are equally likely. Thus, the Shapley value takes into account all possible coalitional dynamics and negotiation scenarios among the players and comes up with a single unique way of distributing the value v ( N ) of the grand coalition among all the players [39]. In this paper, we adopt the Shapley value as the reward allocation technique for the participating householders and the LSE.

4. Online Energy Management Algorithm in the A/C (Air Conditioning) Controller

4.1. Queues of A/C

We assume that at any time t of the day, each household i M , where M N , joins the coalition and gets the energy saving service of the A/C controller. A/C is the main regulation object in the controller. The set of electricity demand for A/Cs can be described as:
L ( t ) [ L 1 ( t ) , L 2 ( t ) , , L M ( t ) ] , t [ 1 , 2 , , T ]
where L ( t ) is the set of electricity demand for A/Cs in each participating household at time slot t. M is the number of participating households in coalition M . T is the number of time slots in the whole operation cycle. The electricity demand of A/C in household i needs to satisfy:
0 L i ( t ) L i , max
where L i , max is the maximum demand of the A/C in household i per time slot.
The demand of A/C is randomly given in real time based on indoor temperature variation. The standard temperature of A/C is set by householders and can be denoted as T i , s e t . The comfort level of householders can be evaluated through the deviation degree of indoor temperature from T i , s e t . The data in the simulation is all gathered in winter and A/C is mainly for heating. When the indoor temperature is lower than T i , s e t , A/C is supposed to start running to raise the indoor temperature, which dynamically generates the demand L ( t ) . However, as the temperature variation in an acceptable range does not influence the experience of occupants, the demand does not need to be satisfied immediately. It can be deferred with a guarantee of comfort level for householders. The set of actual electricity consumption for A/Cs can be described as:
X ( t ) [ X 1 ( t ) , X 2 ( t ) , , X M ( t ) ] , t [ 1 , 2 , , T ]
where X ( t ) is the set of actual electricity consumption for A/Cs in each participating household at time slot t. The actual electricity consumption of the A/C in household i needs to satisfy:
X i ( t ) [ 0 , J i ]
where J i is the rated electricity consumption of the A/C in household i per time slot.
The uncompleted electricity demands of A/C in household i are accumulated, and thus form the A/C queue H i ( t ) . The queue length means the amount of electricity demand that is deferred. The set of A/C queues can be described as:
H ( t ) [ H 1 ( t ) , H 2 ( t ) , , H M ( t ) ] , t [ 1 , 2 , , T ]
where H ( t ) is the set of A/C queues in each participating household at time slot t. The states of A/C queues change with the random variation of indoor temperature and the execution results of the A/C controller. Specifically, the future state of H ( t ) is driven by stochastic arrival L ( t ) and execution process X ( t ) , according to the following dynamic equation.
H i ( t + 1 ) = H i ( t ) X i ( t ) + L i ( t ) , i [ 1 , 2 , , N ]

4.2. Problem Formulation

As the baseline load is fixed, the corresponding electricity cost is constant. The main objective of the A/C controller is to minimize the cost generated by A/C. The electricity purchased from the main grid can be calculated as:
G i ( t ) = max [ X i ( t ) N i ( t ) , 0 ] = X i ( t ) [ 1 N i ( t ) / J i ]
where G i ( t ) is the amount of electricity that needs to be purchased from the main grid for the A/C in household i. As the value of X i ( t ) is either 0 or W i , the amount of electricity purchased from the main grid at time slot t in Equation (11) can be further converted to X i ( t ) [ 1 N i ( t ) / J i ] . If X i ( t ) = 0 , the amount of G i ( t ) is 0; If X i ( t ) = J i , the corresponding amount is X i ( t ) N i ( t ) .
The electricity cost generated by A/C in household i at time slot t can be calculated as:
F i ( t ) = c ( t ) · G i ( t )
where c ( t ) is the electricity price of the main grid.
The A/C controller is designed to lower the cost as much as possible. The online A/C energy management algorithm can be described as: at time slot t, the A/C controller receives information about c ( t ) , N i ( t ) , and H i ( t ) . On the premise of guaranteeing comfort level and stability of A/C queues H ( t ) , the A/C controller aims at minimizing the electricity cost generated by A/C by controlling the A/C operation statuses. For household i, the problem can be expressed as:
min lim t 1 t τ = 0 t 1 F i ( τ ) s . t . ( 8 ) , A / C q u e u e s a r e m e a n r a t e s t a b l e i , t .
The A/C queue H i ( t ) is called mean rate stable [40] if
lim t E { | H i ( t ) | } t = 0
The algorithm in the A/C controller is supposed to guarantee the stability of A/C queues, in addition to minimizing the electricity cost. The thermal comfort level of householders should be ensured, which means that the A/C demands will not be put off infinitely. The stability of A/C queues can be interpreted as the principle that the A/C load demand cannot be unlimitedly accumulated, and should be responded to in a reasonable delay range.

4.3. Lyapunov Optimization

For household i, Lyapunov function L ( H i ( t ) ) H i ( t ) 2 / 2 is defined as a scalar measure of the congestion in the A/C queue. The Lyapunov drift for slot t is defined as:
Δ ( H i ( t ) ) E { L ( H i ( t + 1 ) ) L ( H i ( t ) ) }
where Δ ( H i ( t ) ) is the variation of the Lyapunov function over a time slot, which represents the stability of the A/C queue. The variation depends on the random arrival of demands for A/C and the decisions of A/C controller.
Based on the drift-plus-penalty method [40], an online A/C energy management algorithm is designed. At every time slot, based on the information acquired by the A/C controller, the value of X ( t ) is decided to minimize the drift-plus-penalty expression as follows
Δ ( H i ( t ) ) + W i · E { F i ( t ) }
where W i is the weight parameter, which illustrates how much importance the householder attaches to the cost minimization. If W i = 0 , it corresponds to the pure system stability problem by minimizing the Lyapunov drift. Minimizing Δ ( H i ( t ) ) alone would push the A/C towards lower backlog, but would incur a large penalty on the cost. Therefore, the algorithm is designed to minimize the weighted sum of drift and penalty. W i represents the tradeoff between stabilizing A/C queues and minimizing the cost. It is set based on the A/C power level and the user preference between cost and delay.
Lemma 2. 
For any control policy that satisfies the constraints in (13), the drift-plus-penalty expression satisfies
Δ ( H i ( t ) ) + W i · E { F i ( t ) } B i + W i · E { c ( t ) X i ( t ) [ 1 N i ( t ) / J i ] } + E [ H i ( t ) ( L i ( t ) X i ( t ) ) ]
where the constant B i is defined as
B i L i , max 2 + J i 2 2
Proof. 
A bound can be computed on the Lyapunov drift as follows:
Δ ( H i ( t ) ) = E { L ( H i ( t + 1 ) ) L ( H i ( t ) ) } = 1 2 E [ H i ( t + 1 ) 2 H i ( t ) 2 ] = 1 2 E [ ( H i ( t ) X i ( t ) + L i ( t ) ) 2 H i ( t ) 2 ] 1 2 E [ L i ( t ) 2 + X i ( t ) 2 + 2 H i ( t ) ( L i ( t ) X i ( t ) ) ] = 1 2 E [ L i ( t ) 2 + X i ( t ) 2 ] + E [ H i ( t ) ( L i ( t ) X i ( t ) ) ]
and thus B i can be defined as Equation (18). Using Equations (6) and (8), we have
Δ ( H i ( t ) ) B i + E [ Q i ( t ) ( L i ( t ) X i ( t ) ) ]
adding the cost to both sides, we thus have Equation (17). ☐
The original problem Equation (13) is transformed into the following problem by minimizing the right-hand-side of Equation (17).
min X i ( t ) { W i · c ( t ) [ 1 N i ( t ) / J i ] H i ( t ) } s . t . ( 8 ) , i , t .
The above problem can be further reduced to the following simple threshold rule:
X i ( t ) = 0 , W i · c ( t ) [ 1 N i ( t ) / J i ] H i ( t ) > 0 J i , W i · c ( t ) [ 1 N i ( t ) / J i ] H i ( t ) < 0
It can be seen from (22) that the implementation of Lyapunov optimization is relatively simple, compared to traditional optimization algorithms. It does not need a priori statistical knowledge, and only relies on the instant information about system states at a given moment. The original complex A/C energy management problem is transformed into a linear programming problem, which largely reduces the computational complexity. Furthermore, it has no curse of dimensionality, and hence can be easily applied in extended formulations with multiple households and multiple A/C queues.
According to Equation (16), the weight parameter W i (which is set by the householder) is closely related to the deferrable degree of the A/C. With large W i , householders can achieve a lower electricity bill, but will suffer from the excessive reduction of indoor temperature. With small W i , the comfort level of householders is guaranteed, but the electricity cost would be relatively higher. According to the setting of W i , the participating households in the community are classified into two groups: the group with higher deferrable degree A/Ch, and the group with lower deferrable degree A/Cl. A/Ch and A/Cl both cooperate with the load serving entity (LSE) to form a coalition. Thus, the set of participants in the coalition can be represented as M ={A/Ch, A/Cl, LSE}. The reward of A/Cl, A/Ch, and LSE will be allocated via the Shapley value. As for the households in A/Ch and A/Cl, their reward will be distributed according to their contributions to the consumption of PV energy. The overall flowchart of the operation strategy in the smart community is shown in Figure 2.

5. Case Study

5.1. Basic Data

In order to evaluate the effectiveness of the proposed coalitional game and online A/C energy management algorithm, a smart community including six households and an LSE was selected as the research object. The simulation was conducted in Matlab for one day, and the time resolution was 10 min. Considering the fact that the households are close to each other in geographic distance, the PV generation of these households takes the same data. Meanwhile, in order to compare the difference between A/Ch and A/Cl, the baseline load demand of these households also takes the same data. The data of PV generation and baseline load are all collected from the real-time measurements from real households, which are shown in Figure 3.
The time-of-use price c ( t ) adopted in the simulation is shown in Table 1.
The rated power of A/Cs in these households is set as 3 kW. According to the setting of W i , the six households are classified into A/Ch and A/Cl. The specific parameters of A/Cs in these households are shown in Table 2.
In order to verify the effectiveness of the proposed coalitional game and energy management algorithm, the independent operation mode is taken as the comparison case. The comparison of the features between the cooperative mode and independent mode is shown in Table 3.

5.2. Analysis of Results

In the proposed coalitional game, householders can get certain rewards and the energy saving service of A/C controller. At the same time, the self-consumption of PV energy is improved, which will benefit the LSE greatly. The results of a comparison between the proposed coalitional game and independent operation mode are shown in Table 4.
It can be seen from Table 4 that the revenue under the proposed game is significantly improved. The value of the coalition is just the increased profit, which can be expressed as v ( M ) = 69.8427 . The amount of electricity purchased from the main grid is considerably reduced under the cooperative mode. The specific comparison of real-time results for purchased electricity is shown in Figure 4. It can be seen that during the most times in a day, householders need to purchase more electricity from the main grid under the independent operation mode.
The reward of the coalition is closely related to the configuration of PV generation in each household. The simulation analyses the effect of PV generation to the reward. The result of sensitivity analysis is shown in Figure 5. With the increase of PV capacity, as the amount of electricity that needs to be purchased from the main grid decreases, the reward of the coalition increases.
As for the effect of online energy management algorithm in A/C controller, the cost comparison for A/Ch and A/Cl is shown in Table 5.
The simulation results in Table 5 coincide with the theoretical analysis in Section 4.3. The performance of the online energy management algorithm in the A/C controller is closely associated with the setting of weight parameter W i . When W i gradually increases, the average backlog of queues would increase, and the cost would decrease. As described in Section 5.1, the only difference between A/Ch and A/Cl is the setting of W i . The cost of A/Ch is lower than A/Cl, but the backlog of A/C queues in A/Ch is larger than that in A/Cl. Thus, the theoretical analysis is validated. As for the guarantee of comfort level, the comparison of the indoor temperature in these households and the outdoor temperature is shown in Figure 6.
From Figure 6, it can be seen that the lowest indoor temperature in these households is 19 C, which does not influence the comfort level of householders in winter. When the queue of an A/C has accumulated to a certain degree, or the price drops, the A/C controller will start the A/C to guarantee the comfort level and economic efficiency of the householder.

5.3. Allocation Result of Rewards

According to (4), the Shapley value of the participating players in the coalition is calculated in Table 6, Table 7 and Table 8.
According to the Shapley value method, the reward of the three players is shown in Table 9.
Table 9 shows that the reward of A/Ch is more than the one of A/Cl. Combined with Table 5, it can be known that the households in A/Ch adopt a larger value of W i , which provides the A/C controller with larger space for regulation and thus makes greater contribution to the cost reduction of the grand coalition. Therefore, the households in A/Ch get more payment in the coalition. According to the consumption of PV energy, the reward of each household is shown in Table 10.

6. Conclusions

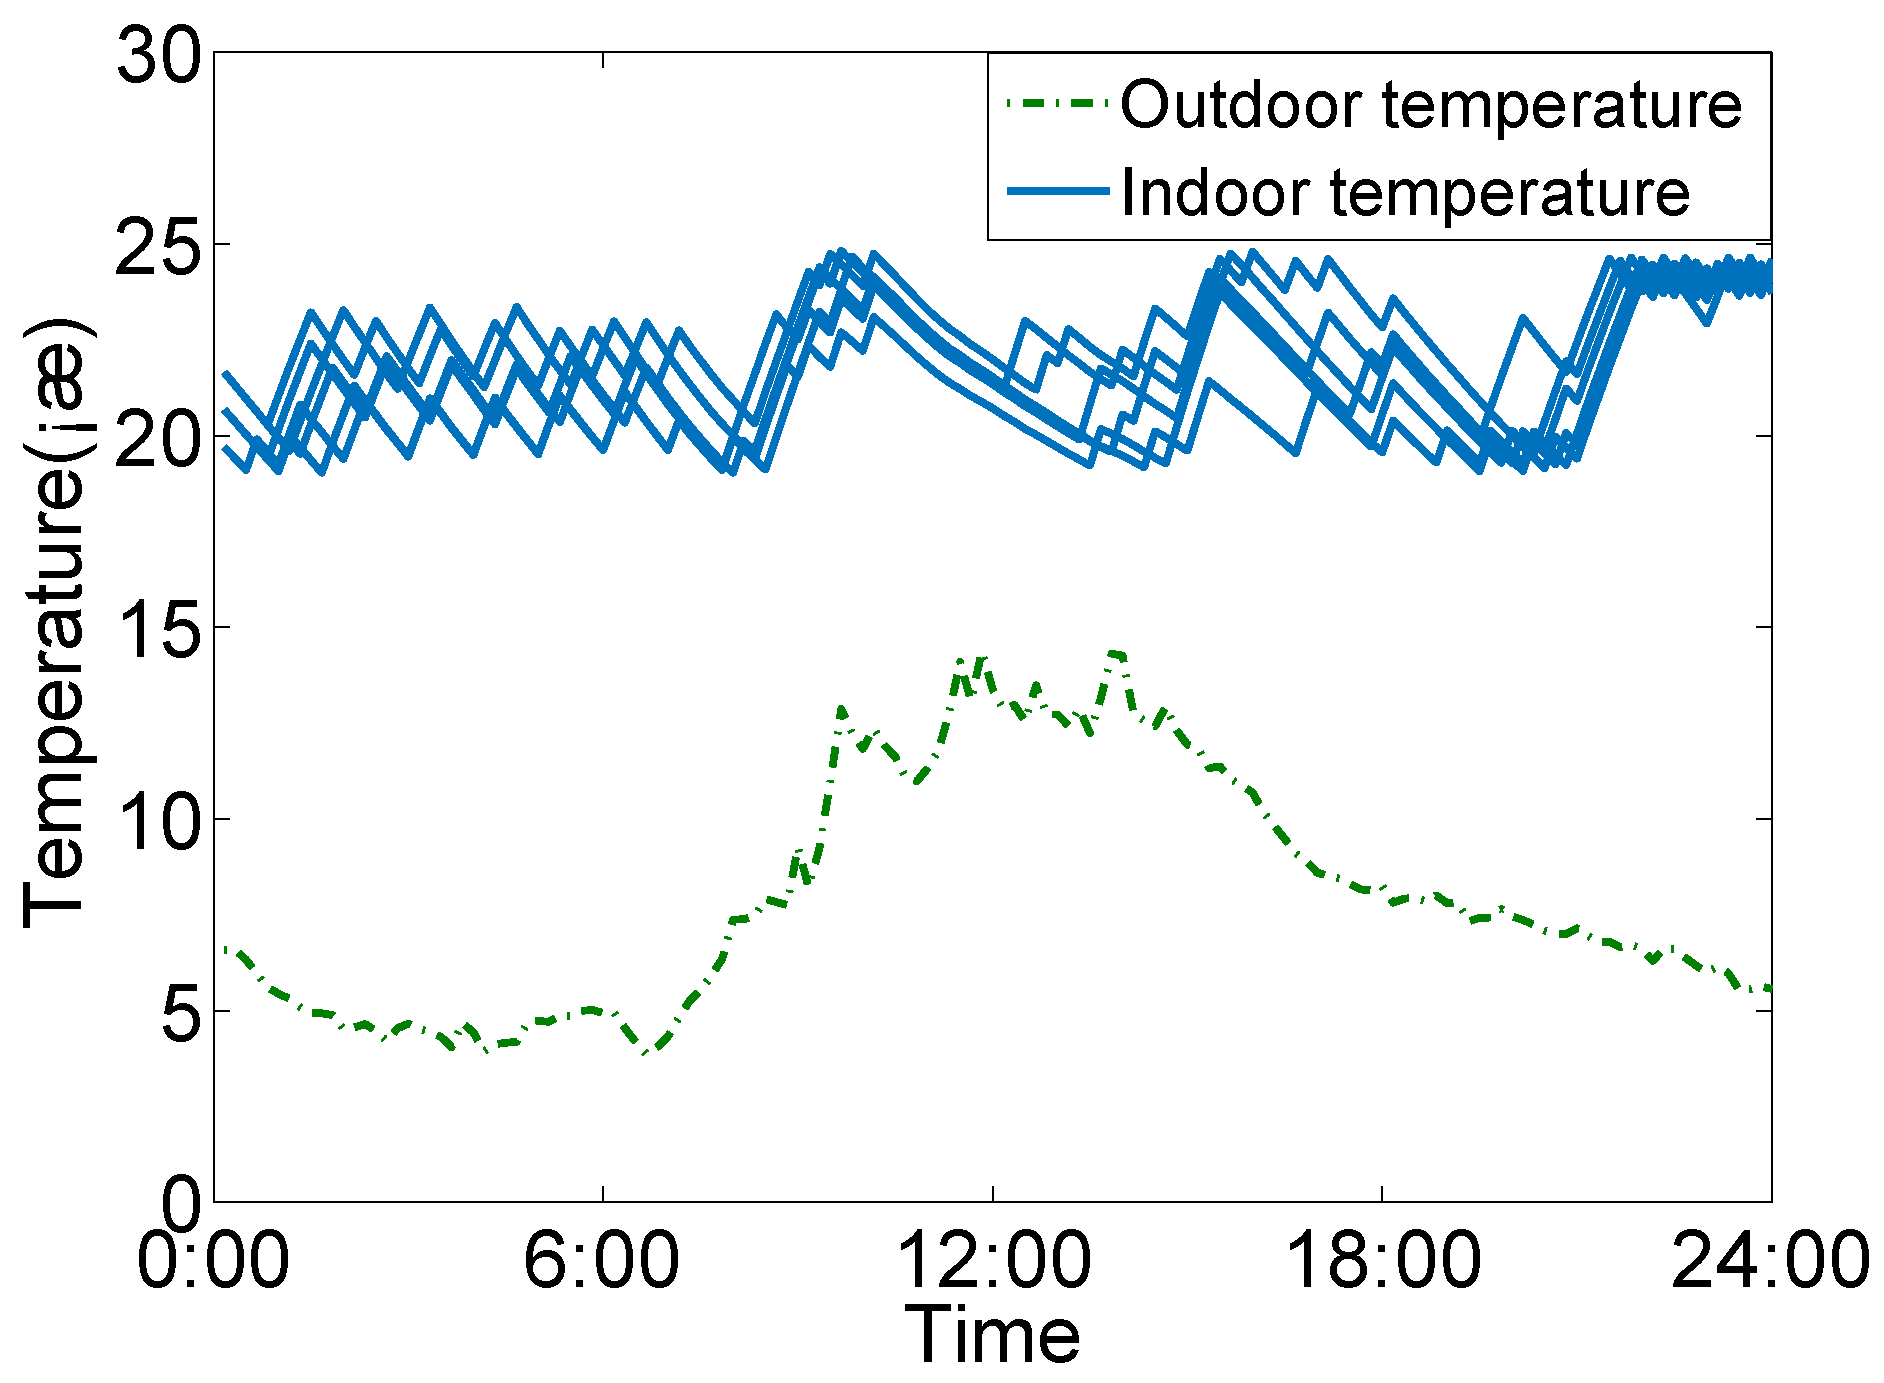
This paper has proposed a theoretical coalitional game approach for the cooperation between households and LSE in a smart community. In the coalitional game, householders can be considerably rewarded and acquire energy saving service from the A/C controller by purchasing PV energy from the LSE. Moreover, in the A/C controller that the LSE provides for the participating householders, an online energy management algorithm based on Lyapunov optimization is developed for the control of A/C units to reduce the amount of electricity purchased from the main grid and further increase the revenue of the coalition. This algorithm transfers the original A/C energy management problem into a linear programming problem, which effectively reduces the computational complexity. The Shapley value has been adopted to divide the reward of the coalition among the participating members, based on their contribution. Through simulation with realistic data from the residential community, we have shown that the proposed coalitional game and A/C energy management algorithm can effectively increase the profits of householders and the LSE compared to the noncooperative case.
Our results demonstrate that the proposed coalitional game has significant potential to serve as an effective means of improving the profitability of the LSE and cutting the expenses of householders. As for practical application, the operation mode based on the proposed coalitional game can be used to help community planners to improve the total revenue. Particularly, the time complexity of the proposed algorithm is low and the required computational resource is small, which makes the algorithm suitable to be integrated into the embedded system in smart households. Moreover, the algorithm can be implemented in a distributed way, which has fewer communication costs. The A/C controller based on the proposed algorithm can be used to determine the least-cost schedules of A/C while guaranteeing householders’ comfortable experiences. When setting the weight parameters in the A/C controller, householders are able to choose a larger value in order to get more payments.

Acknowledgments

This work was supported in part by the National High-tech R&D Program of China (863 Program) (No. 2014AA052001) and in part by the Fundamental Research Funds for the Central Universities (No. 2015ZD02).

Author Contributions

Wei Fan and Nian Liu proposed the coalitional game and online energy management algorithm, performed simulations and wrote the paper. Jianhua Zhang and Jinyong Lei provided his theoretical knowledge in the energy domain, also reviewed and refined the paper.

Conflicts of Interest

The authors declare no conflict of interest.

Abbreviations

The following abbreviations are used in this manuscript:
A/C
Air conditioning
PV
Photovoltaic
LSE
Load serving entity

References

  1. Jiang, B.; Fei, Y. Smart home in smart microgrid: A cost-effective energy ecosystem with intelligent hierarchical agents. IEEE Trans. Smart Grid 2015, 6, 3–13. [Google Scholar] [CrossRef]
  2. Zhou, Y.; Chen, Y.; Xu, G. Distributed energy resources with home energy management in smart grid. In Proceedings of the 2014 IEEE 23rd International Symposium on Industrial Electronics (ISIE), Istanbul, Turkey, 1–4 June 2014.
  3. Liu, N.; Chen, J.; Zhu, L.; Zhang, J.; He, Y. A key management scheme for secure communications of advanced metering infrastructure in smart grid. IEEE Trans. Ind. Electron. 2013, 60, 4746–4756. [Google Scholar] [CrossRef]
  4. Siano, P.; Graditi, G.; Atrigna, M.; Piccolo, A. Designing and testing decision support and energy management systems for smart homes. J. Ambient Intelligence Humaniz. Comput. 2013, 4, 651–661. [Google Scholar] [CrossRef]
  5. Chen, C.; Duan, S.; Cai, T.; Liu, B.; Hu, G. Smart energy management system for optimal microgrid economic operation. IET renew. power gener. 2011, 5, 258–267. [Google Scholar] [CrossRef]
  6. De Silva, L.C.; Morikawa, C.; Petra, I.M. State of the art of smart homes. Eng. Appl. Artif. Intelligence 2012, 25, 1313–1321. [Google Scholar] [CrossRef]
  7. Graditi, G.; Ippolito, M.; Lamedica, R.; Piccolo, A.; Ruvio, A.; Santini, E.; Siano, P.; Zizzo, G. Innovative control logics for a rational utilization of electric loads and air-conditioning systems in a residential building. Energy Build. 2015, 102, 1–17. [Google Scholar] [CrossRef]
  8. Ma, L.; Liu, N.; Wang, L.; Zhang, J.; Lei, J.; Zeng, Z.; Wang, C.; Cheng, M. Multi-party energy management for smart building cluster with PV systems using automatic demand response. Energy Build. 2016, 121, 11–21. [Google Scholar] [CrossRef]
  9. Zhao, P.; Suryanarayanan, S.; Simoes, M.G. An energy management system for building structures using a multi-agent decision-making control methodology. IEEE Trans. Ind. Appl. 2013, 49, 322–330. [Google Scholar] [CrossRef]
  10. Kumar, Y.P.; Bhimasingu, R. Renewable energy based microgrid system sizing and energy management for green buildings. J. Mod. Power Syst. Clean Energy 2015, 3, 1–13. [Google Scholar] [CrossRef] [Green Version]
  11. Graditi, G.; Ippolito, M.; Telaretti, E.; Zizzo, G. Technical and economical assessment of distributed electrochemical storages for load shifting applications: An Italian case study. Renew. Sustain. Energy Rev. 2016, 57, 515–523. [Google Scholar] [CrossRef]
  12. Dusonchet, L.; Ippolito, M.; Telaretti, E.; Zizzo, G.; Graditi, G. An optimal operating strategy for combined RES-based generators and electric storage systems for load shifting applications. In Proceedings of the 2013 Fourth International Conference on Power Engineering (POWERENG), Energy and Electrical Drives, Istanbul, Turkey, 13–17 May 2013.
  13. Sanseverino, E.R.; Di Silvestre, M.; Zizzo, G.; Graditi, G. Energy efficient operation in smart grids: Optimal management of shiftable loads and storage systems. In Proceedings of the 2012 International Symposium on Power Electronics, Electrical Drives, Automation and Motion (SPEEDAM), Sorrento, Italy, 20–22 June 2012.
  14. Graditi, G.; Di Silvestre, M.L.; Gallea, R.; Sanseverino, E.R. Heuristic-based shiftable loads optimal management in smart micro-grids. IEEE Trans. Ind. Inform. 2015, 11, 271–280. [Google Scholar] [CrossRef]
  15. Di Silvestre, M.; Graditi, G.; Ippolito, M.; Sanseverino, E.R.; Zizzo, G. Robust multi-objective optimal dispatch of distributed energy resources in micro-grids. In Proceedings of the 2011 IEEE Trondheim PowerTech, Trondheim, Norway, 19–23 June 2011.
  16. Zhang, Y.; Lu, N. Parameter selection for a centralized thermostatically controlled appliances load controller used for intra-hour load balancing. IEEE Trans. Smart Grid 2013, 4, 2100–2108. [Google Scholar] [CrossRef]
  17. Miltiades, C.A. Your HVAC System can Manage its Own Energy Use: Advantages of Variable Refrigerant Flow (VRF) Zoning Systems. Energy Eng. 2014, 111, 32–40. [Google Scholar]
  18. Wu, Z.; Jia, Q.S.; Guan, X. Optimal Control of Multiroom HVAC System: An Event-Based Approach. IEEE Trans. Control Syst. Technol. 2016, 24, 662–669. [Google Scholar] [CrossRef]
  19. Lu, N. An evaluation of the HVAC load potential for providing load balancing service. IEEE Trans. Smart Grid 2012, 3, 1263–1270. [Google Scholar] [CrossRef]
  20. Hassan, N.U.; Khalid, Y.I.; Yuen, C.; Tushar, W. Customer engagement plans for peak load reduction in residential smart grids. IEEE Trans. Smart Grid 2015, 6, 3029–3041. [Google Scholar] [CrossRef]
  21. Sun, B.; Luh, P.B.; Jia, Q.S.; Yan, B. Event-Based Optimization Within the Lagrangian Relaxation Framework for Energy Savings in HVAC Systems. IEEE Trans. Autom. Sci. Eng. 2015, 12, 1396–1406. [Google Scholar] [CrossRef]
  22. Thomas, A.G.; Jahangiri, P.; Wu, D.; Cai, C.; Zhao, H.; Aliprantis, D.C.; Tesfatsion, L. Intelligent residential air-conditioning system with smart-grid functionality. IEEE Trans. Smart Grid 2012, 3, 2240–2251. [Google Scholar] [CrossRef]
  23. Hong, Y.Y.; Lin, J.K.; Wu, C.P.; Chuang, C.C. Multi-objective air-conditioning control considering fuzzy parameters using immune clonal selection programming. IEEE Trans. Smart Grid 2012, 3, 1603–1610. [Google Scholar] [CrossRef]
  24. Tiptipakorn, S.; Lee, W.J. A residential consumer-centered load control strategy in real-time electricity pricing environment. In Proceedings of the 2007 39th North American Power Symposium, Las Cruces, NM, USA, 30 September–2 October 2007.
  25. Ma, Y.; Borrelli, F.; Hencey, B.; Coffey, B.; Bengea, S.; Haves, P. Model predictive control for the operation of building cooling systems. IEEE Trans. Control Syst. Technol. 2012, 20, 796–803. [Google Scholar]
  26. Xu, X.; Wang, S.; Sun, Z.; Xiao, F. A model-based optimal ventilation control strategy of multi-zone VAV air-conditioning systems. Appl. Therm. Eng. 2009, 29, 91–104. [Google Scholar] [CrossRef]
  27. Xu, J.; Luh, P.B.; Blankson, W.E.; Jerdonek, R.; Shaikh, K. An optimization-based approach for facility energy management with uncertainties. HVAC&R Res. 2005, 11, 215–237. [Google Scholar]
  28. Parkinson, S.; Wang, D.; Crawford, C.; Djilali, N. Comfort-constrained distributed heat pump management. Energy Procedia 2011, 12, 849–855. [Google Scholar] [CrossRef]
  29. Sun, B.; Luh, P.B.; Jia, Q.S.; Jiang, Z.; Wang, F.; Song, C. Building energy management: Integrated control of active and passive heating, cooling, lighting, shading, and ventilation systems. IEEE Trans. Autom. Sci. Eng. 2013, 10, 588–602. [Google Scholar]
  30. Yu, Z.; Jia, L.; Murphy-Hoye, M.C.; Pratt, A.; Tong, L. Modeling and stochastic control for home energy management. IEEE Trans. Smart Grid 2013, 4, 2244–2255. [Google Scholar] [CrossRef]
  31. Yang, M.; Lin, Y.; Zhu, S.; Han, X.; Wang, H. Multi-dimensional scenario forecast for generation of multiple wind farms. J. Mod. Power Syst. Clean Energy 2015, 3, 361–370. [Google Scholar] [CrossRef]
  32. Liu, N.; Tang, Q.; Zhang, J.; Fan, W.; Liu, J. A hybrid forecasting model with parameter optimization for short-term load forecasting of micro-grids. Appl. Energy 2014, 129, 336–345. [Google Scholar] [CrossRef]
  33. Fan, W.; Liu, N.; Zhang, J. An online algorithm based on Lyapunov optimization for energy management of household micro-grids. In Proceedings of the 2015 IEEE PES Asia-Pacific Power and Energy Engineering Conference (APPEEC), Brisbane, Australia, 15–18 November 2015.
  34. Wang, D.; Ge, S.; Jia, H.; Wang, C.; Zhou, Y.; Lu, N.; Kong, X. A demand response and battery storage coordination algorithm for providing microgrid tie-line smoothing services. IEEE Trans. Sustain. Energy 2014, 5, 476–486. [Google Scholar] [CrossRef]
  35. Lu, N.; Zhang, Y. Design considerations of a centralized load controller using thermostatically controlled appliances for continuous regulation reserves. IEEE Trans. Smart Grid 2013, 4, 914–921. [Google Scholar] [CrossRef]
  36. O’Brien, G.; El Gamal, A.; Rajagopal, R. Shapley value estimation for compensation of participants in demand response programs. IEEE Trans. Smart Grid 2015, 6, 2837–2844. [Google Scholar] [CrossRef]
  37. Saad, W.; Han, Z.; Debbah, M.; Hjorungnes, A.; Basar, T. Coalitional game theory for communication networks. IEEE Signal Process. Mag. 2009, 26, 77–97. [Google Scholar] [CrossRef]
  38. Shapley, L.S. A value for n-person games. Shapley Value 1988, 31–40. [Google Scholar]
  39. Narayanam, R.; Narahari, Y. A shapley value-based approach to discover influential nodes in social networks. IEEE Trans. Autom. Sci. Eng. 2011, 8, 130–147. [Google Scholar] [CrossRef]
  40. Neely, M.J. Stochastic network optimization with application to communication and queueing systems. Synth. Lect. Commun. Netw. 2010, 3, 1–211. [Google Scholar] [CrossRef]
Figure 1. Structure of the smart community. A/C: air conditioning; PV: photovoltaic.
Energies 09 00689 g001
Figure 2. Flowchart of the operation strategy in the smart community. LSE: load serving entity.
Energies 09 00689 g002
Figure 3. PV generation and baseline load of households.
Energies 09 00689 g003
Figure 4. Comparison of purchased electricity from the main grid.
Energies 09 00689 g004
Figure 5. Sensitivity analysis of PV generation.
Energies 09 00689 g005
Figure 6. Comparison of outdoor temperature and indoor temperature.
Energies 09 00689 g006
Table 1. Time-of-use price.
TimePrice (RMB/kWh)
10:00–15:00, 18:00–21:001.37
7:00–10:00, 15:00–18:00, 21:00–23:000.8
23:00–7:000.37
Table 2. A/C (air conditioning) parameters of households.
A/ChA/Cl
HouseholdStandard Temperature ( C) W i HouseholdStandard Temperature ( C) W i
12084205
22185215
32286225
Table 3. Comparison of cooperative mode and independent mode.
Operation ModeHouseholdersUtility Company
CooperativePV energy + A/C controller + Rewardssell PV energy and share rewards to householders
Independentoperate on their ownsell all PV energy to the main grid
Table 4. Comparison of revenue between the two operation modes.
Operation ModeIndependent ModeCooperative Mode
Revenue (RMB) 248.8419 178.9992
Amount of electricity purchased from the main grid (kWh)360.9796274.5141
Table 5. Cost comparison of A/Ch (higher deferrable degree) and A/Cl (lower deferrable degree).
GroupA/ChA/Cl
Total cost (RMB)88.577390.4218
Cost from the main grid (RMB)95.471997.3211
Average backlog of A/C queues (kWh)731.8333439.6667
Table 6. Reward of A/Ch.
S { i } A/ChA/Ch, A/ClA/Ch, LSEA/Ch, A/Cl, LSE
v ( S { i } ) 0035.843669.8427
v ( S ) 00033.9991
| S | ! ( N | S | 1 ) ! N ! 1/31/61/61/3
| S | ! ( N | S | 1 ) ! N ! [ v ( S { i } ) v ( S ) ] 005.973911.9479
Table 7. Reward of A/Cl.
S { i } A/ClA/Ch, A/ClA/Cl, LSEA/Ch, A/Cl, LSE
v ( S { i } ) 0033.999169.8427
v ( S ) 00035.8436
| S | ! ( N | S | 1 ) ! N ! 1/31/61/61/3
| S | ! ( N | S | 1 ) ! N ! [ v ( S { i } ) v ( S ) ] 005.666511.3330
Table 8. Reward of LSE.
S { i } LSEA/Ch, LSEA/Cl, LSEA/Ch, A/Cl, LSE
v ( S { i } ) 035.843633.999169.8427
v ( S ) 0000
| S | ! ( N | S | 1 ) ! N ! 1/31/61/61/3
| S | ! ( N | S | 1 ) ! N ! [ v ( S { i } ) v ( S ) ] 05.97405.666523.2809
Table 9. Reward of players.
iA/ChA/ClLSE
ϕ i ( v ) 17.921816.999534.9214
Table 10. Reward of each household.
A/ChA/Cl
HouseholdReward (RMB)HouseholdReward (RMB)
15.897645.6088
25.976555.6282
36.047665.7625

