
The Solarevolution: Much More with Way Less, Right Now—The Disruptive Shift to Renewables

Abstract
:
1. Introduction
- Renewable solutions must be reconfigured for the delivery of essential services. Reconfiguring is not the same as substitution; renewables will deliver energy services with forms that may be radically different from the forms that were originally invented on the premise of burning fossil fuels.
- Renewable energy sources directly coupled to services are generally more accessible than energy sources that must be transported great distances.
- For high leverage, application technologies must be hyper-efficient, e.g., more efficient by a factor of ten (“10×”) in comparison to artifacts still lingering from the fossil fuel era.
2. History
2.1. History of Limits
2.2. A Brief History of Fire and Electricity
- Benjamin Franklin (1706–1790)—The nature of electricity, 1752: Benjamin Franklin, the most prolific early scientist in the New World, explored the nature of electricity, capturing electricity in a jar with a kite in a lightning storm.
- Alessandro Volta (1745–1827)—The battery, 1800: A breakthrough by Alessandro Volta in 1800 evolved into the primary device that was used to produce electricity for nearly a century.
- Samuel F B Morse (1791–1872)—The telegraph, 1844: Samuel Morse started a revolution in communication with the telegraph that revolutionized long-distance communication 172 years ago. It worked by transmitting electrical signals over a wire laid between stations.
- Alexander Graham Bell (1847–1922)—The telephone, 1876: Another communication revolution underpinned by electricity, the telephone, was perfected just 140 years ago.
- Thomas Edison (1847–1931)—The light bulb, 1879: Another profound early use of electricity was to produce light. Only 136 years ago, the wink of an eye in human history, Thomas Edison was finally successful after many failed tests to create an electric light that endured for many hours.
3. Power Shift: The Transition to Renewables
3.1. Renewable Energy Can Actually Meet Humanity’s Needs, as Thomas Edison Envisioned a Century Ago
- Economics: Renewable energy is economical, here and now.
- Disruption not substitution: The emerging solar economy is fostering a design revolution. Designs configured for renewables will deliver energy services that yield well-being far beyond what was possible in the fossil fuels era.
- Intermittency: The Sun’s energy is constant; fossil fuels are here today, gone tomorrow.
- Time to market: The Silicon Valley culture and its spinoff of crowdsourcing have enabled innovators to navigate around the incumbency.
- Net energy chain: Energy Return on Energy Investment (EROEI or simply EROI) and efficiency: The net energy of renewables is now higher than the net energy of fossil fuels and when combined with solar-based design is sufficient to leverage the Solarevolution.
3.2. Economics: Renewable Energy Is Economical, Here and Now
- Intrinsic costs: materials, energy, labor, overhead, profit, maintenance and decommissioning (in the context of fair trade).
- Policy: modification of costs by government intervention.
- Unaccounted costs: costs ignored, but experienced in the marketplace or the environment.
- Theft: losses created by entities operating outside of existing accounting and policy boundaries.
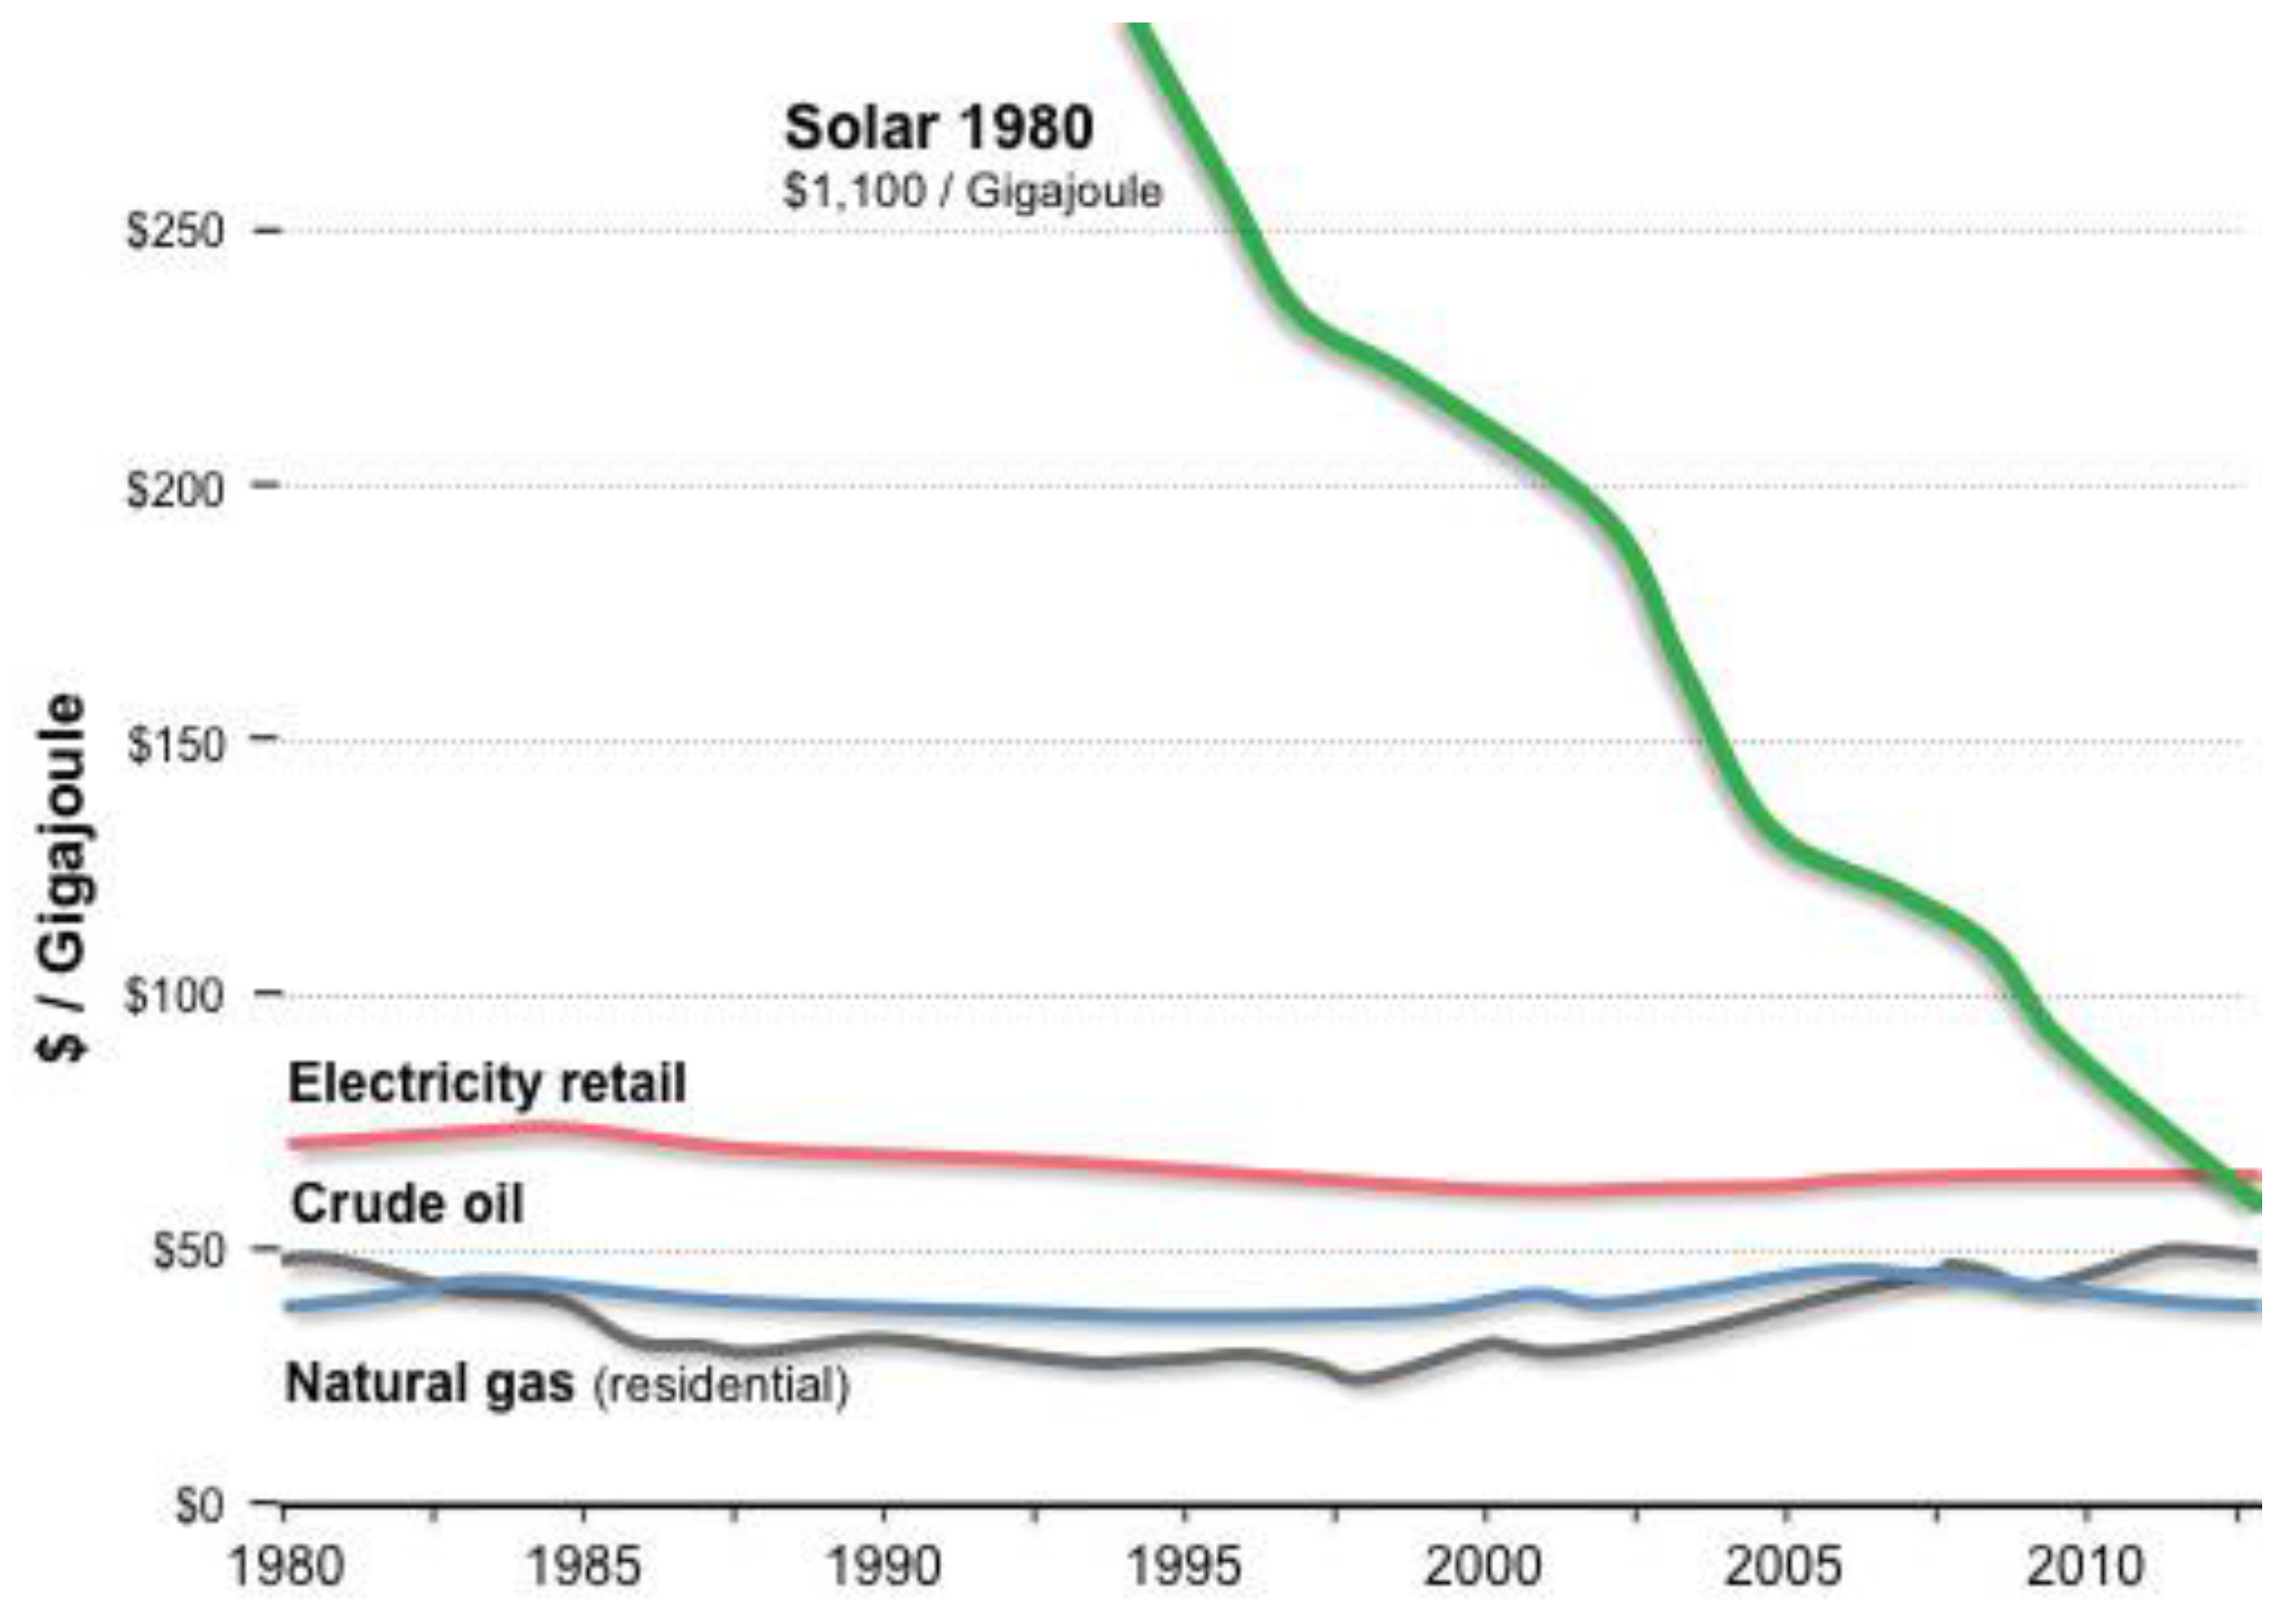
- Intrinsic costs: The cost to exploit fossil fuels increases with time. With each passing day, finite resources are exhausted, and therefore, new supplies necessarily become harder to discover and require more effort to extract. Though improvements in technology may temporarily reverse that trend, inevitably, costs will rise over time. Renewable energy technology, on the other hand, is less mature, and industry continues effectively to focus on doing more with less, e.g., solar cells become thinner, more efficient and easier to mass produce. The slow increase in oil and coal costs and the concomitant dramatic reduction in the cost of solar in the past decade can be seen in Figure 1.
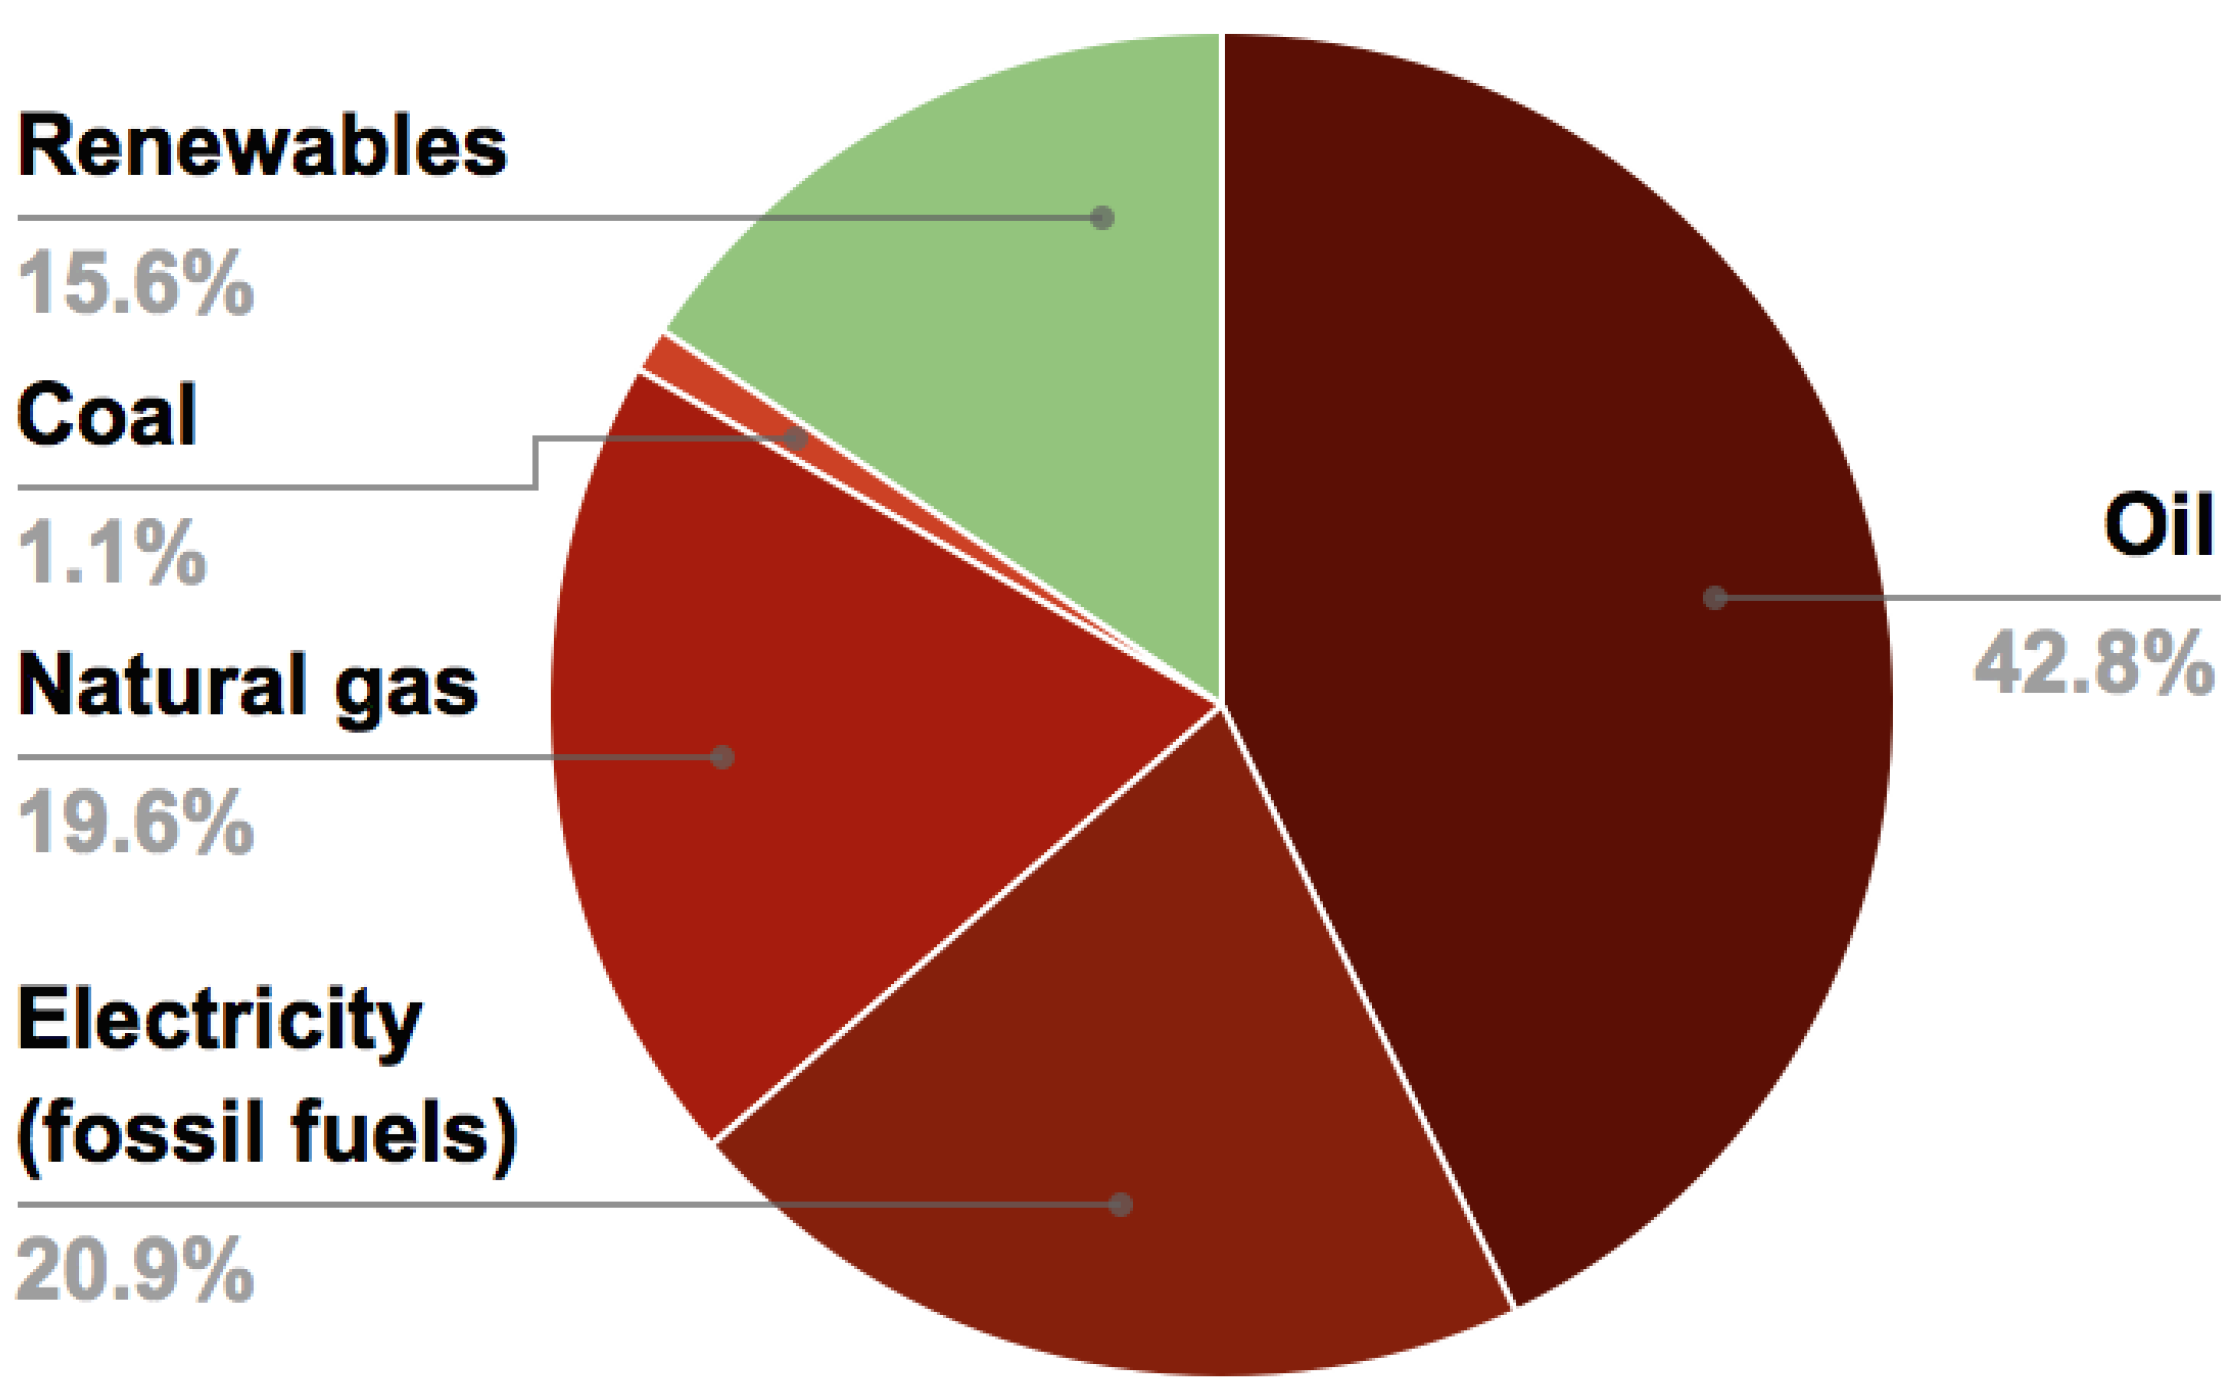
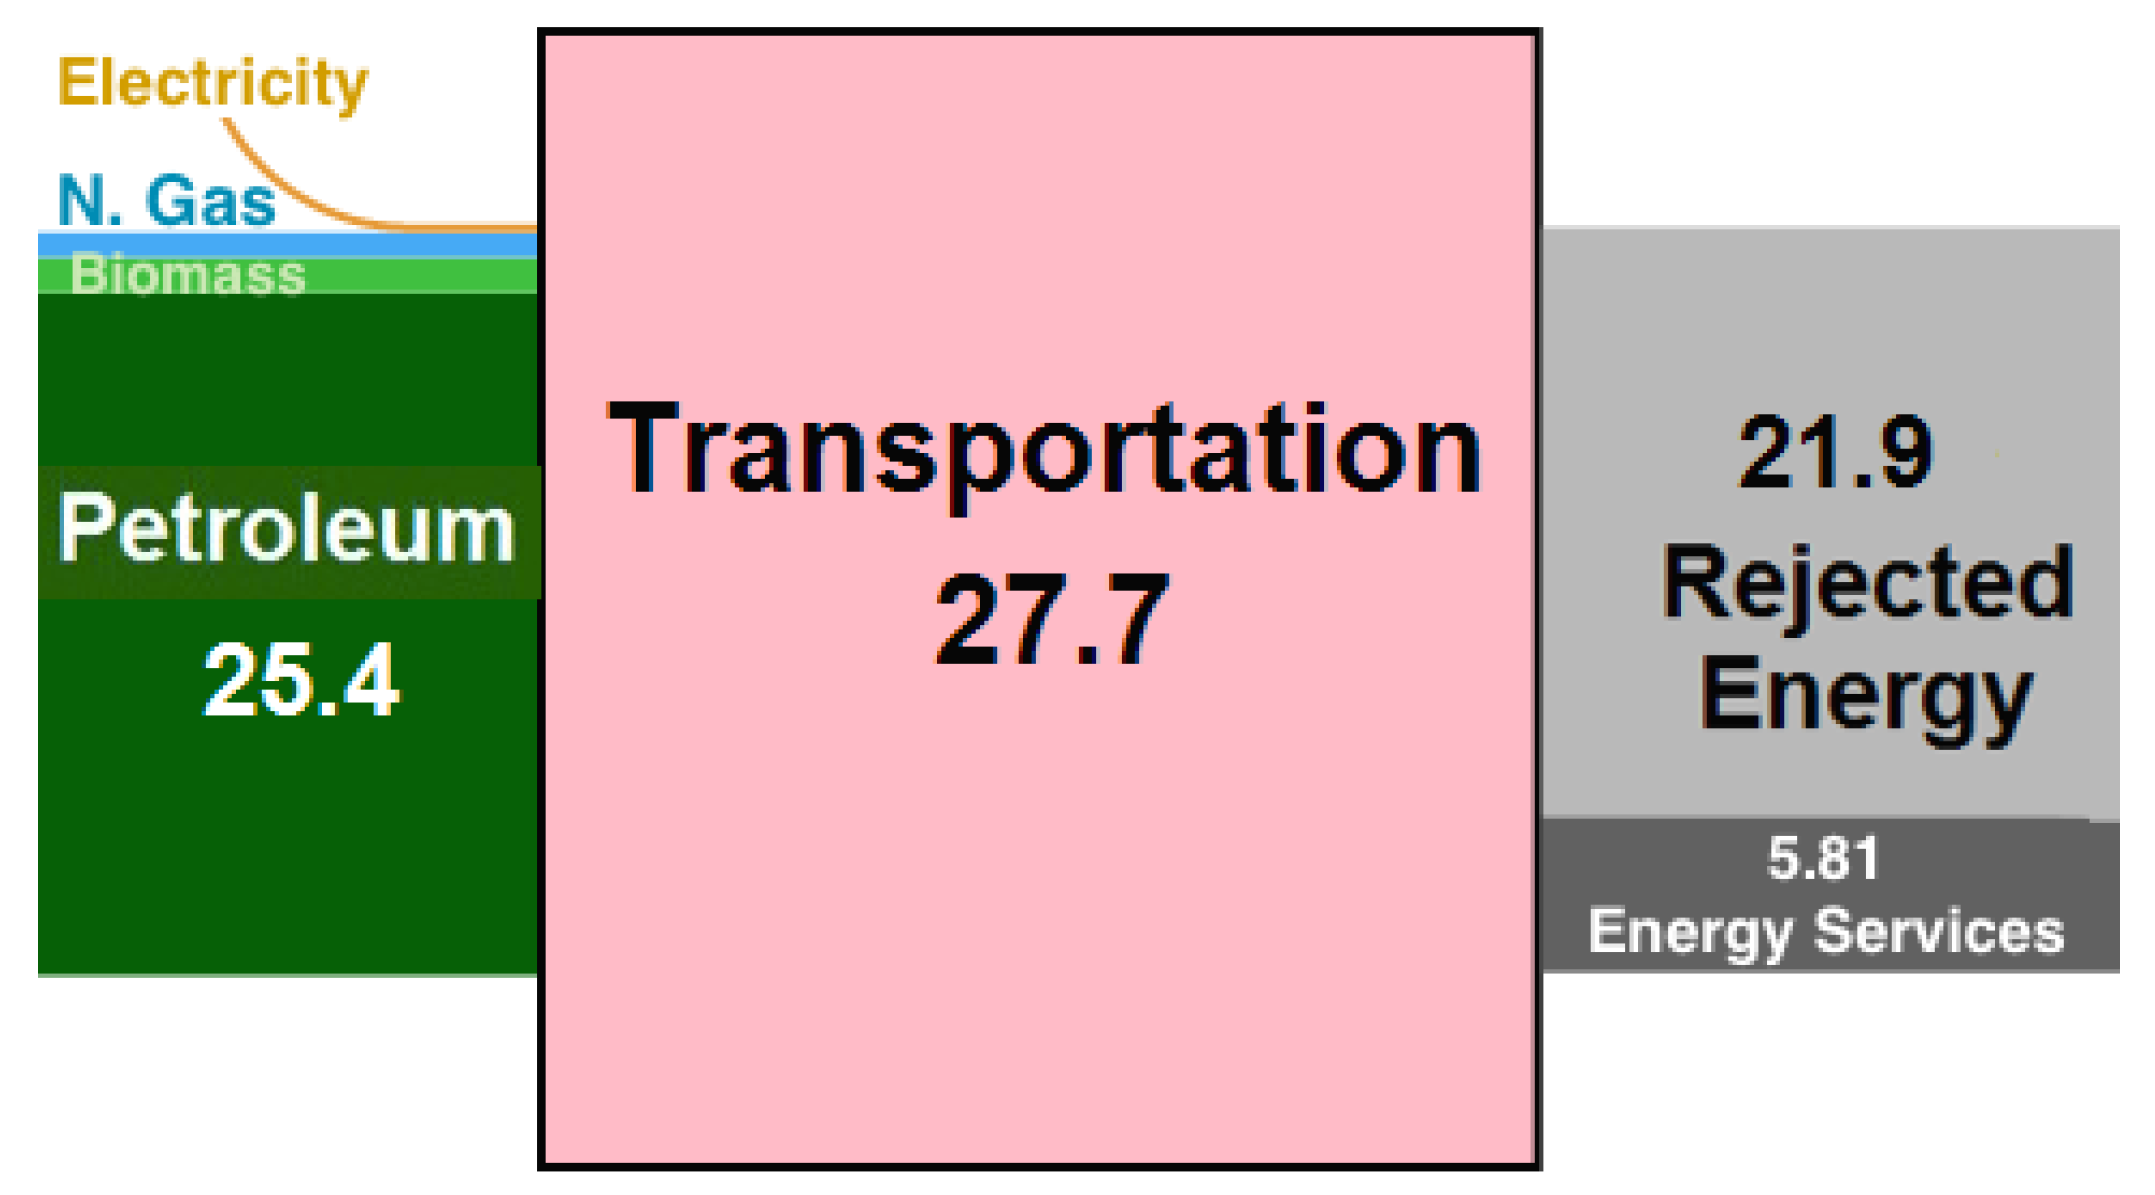
- Policy: Something may be deemed “uneconomical” and out of favor simply because of a hidden (or perhaps visible) subsidy to the advantage of competing forces. Market distortions that favor one stakeholder group over another are often justified by economic arguments, but underlying such distortions are policies based on value propositions, which bear scrutiny. Determining competitive advantages is challenging, because economic rationale invoked as an instrument of policy may favor outdated priorities. As can be seen in Figure 2, long-established policies based on plundering fossil fuels continue to blindly favor the energy incumbency and with few exceptions have not yet been modified to reflect the policies initiated at Kyoto and reinforced at COP 21 to mitigate climate change.
- Unaccounted costs: For one individual it might cost less to incinerate waste or toss garbage “out” than to pay for trash service, but over time, the cost to society will increase. Therefore, the originally ignored cost of garbage collection has become an accepted cost in modern society. On the other hand, when individuals or businesses start their engines (in cars or power plants) and push waste gases and particulates (“pollution”) into the atmosphere, the cost of waste is externalized, not yet fully accounted. One of the most sophisticated judicial agencies in the world, the venerable U.S. Supreme Court, was conflicted on this question of cost allocation for pollution as recently as early 2016 [15].
- Theft: “Fossil fuels” is a widely accepted misnomer for hydrocarbons (coal, oil, natural gas), a rhetorical classification which serves to justify relegating these intrinsically valuable materials to expediency, to one-time use, burned up and gone forever. Hydrocarbons in general, as precursors to key materials, such as cement, steel, plastics and other durable goods, have significant value to any economy, now and into the distant future. When arrangements of whatever stripe are made to transfer hydrocarbon wealth with no benefit to the citizenry of one country to others who burn that wealth, gone forever, to support their bloated economies, the difference between the value of that oil to create well-being for the people of an exporting country compared to the absurdly low price of oil in the global marketplace is theft. For example, oil exported per capita in Nigeria is 200 gallons/year, while consumption is 24 gallons, only 12% of exports, equal to 2.6% of U.S. per capita consumption of 900 gallons per year.Hydrocarbons are also being massively stolen from youth (those who do not yet have a voice in policy) and future generations (those not yet born). Not only that, some countries have strong enough currency to incur massive debt and accumulate trade deficits sufficient to keep importing oil, delaying accountability for decades. Future generations will inherit the burden of that debt in their maturity, without a voice in the present.
3.3. Disruption Not Substitution: The Emerging Solar Economy Is Fostering a Design Revolution; Designs Configured for Renewables Will Deliver Well-Being, Far beyond What Was Possible in the Fossil Fuels Era
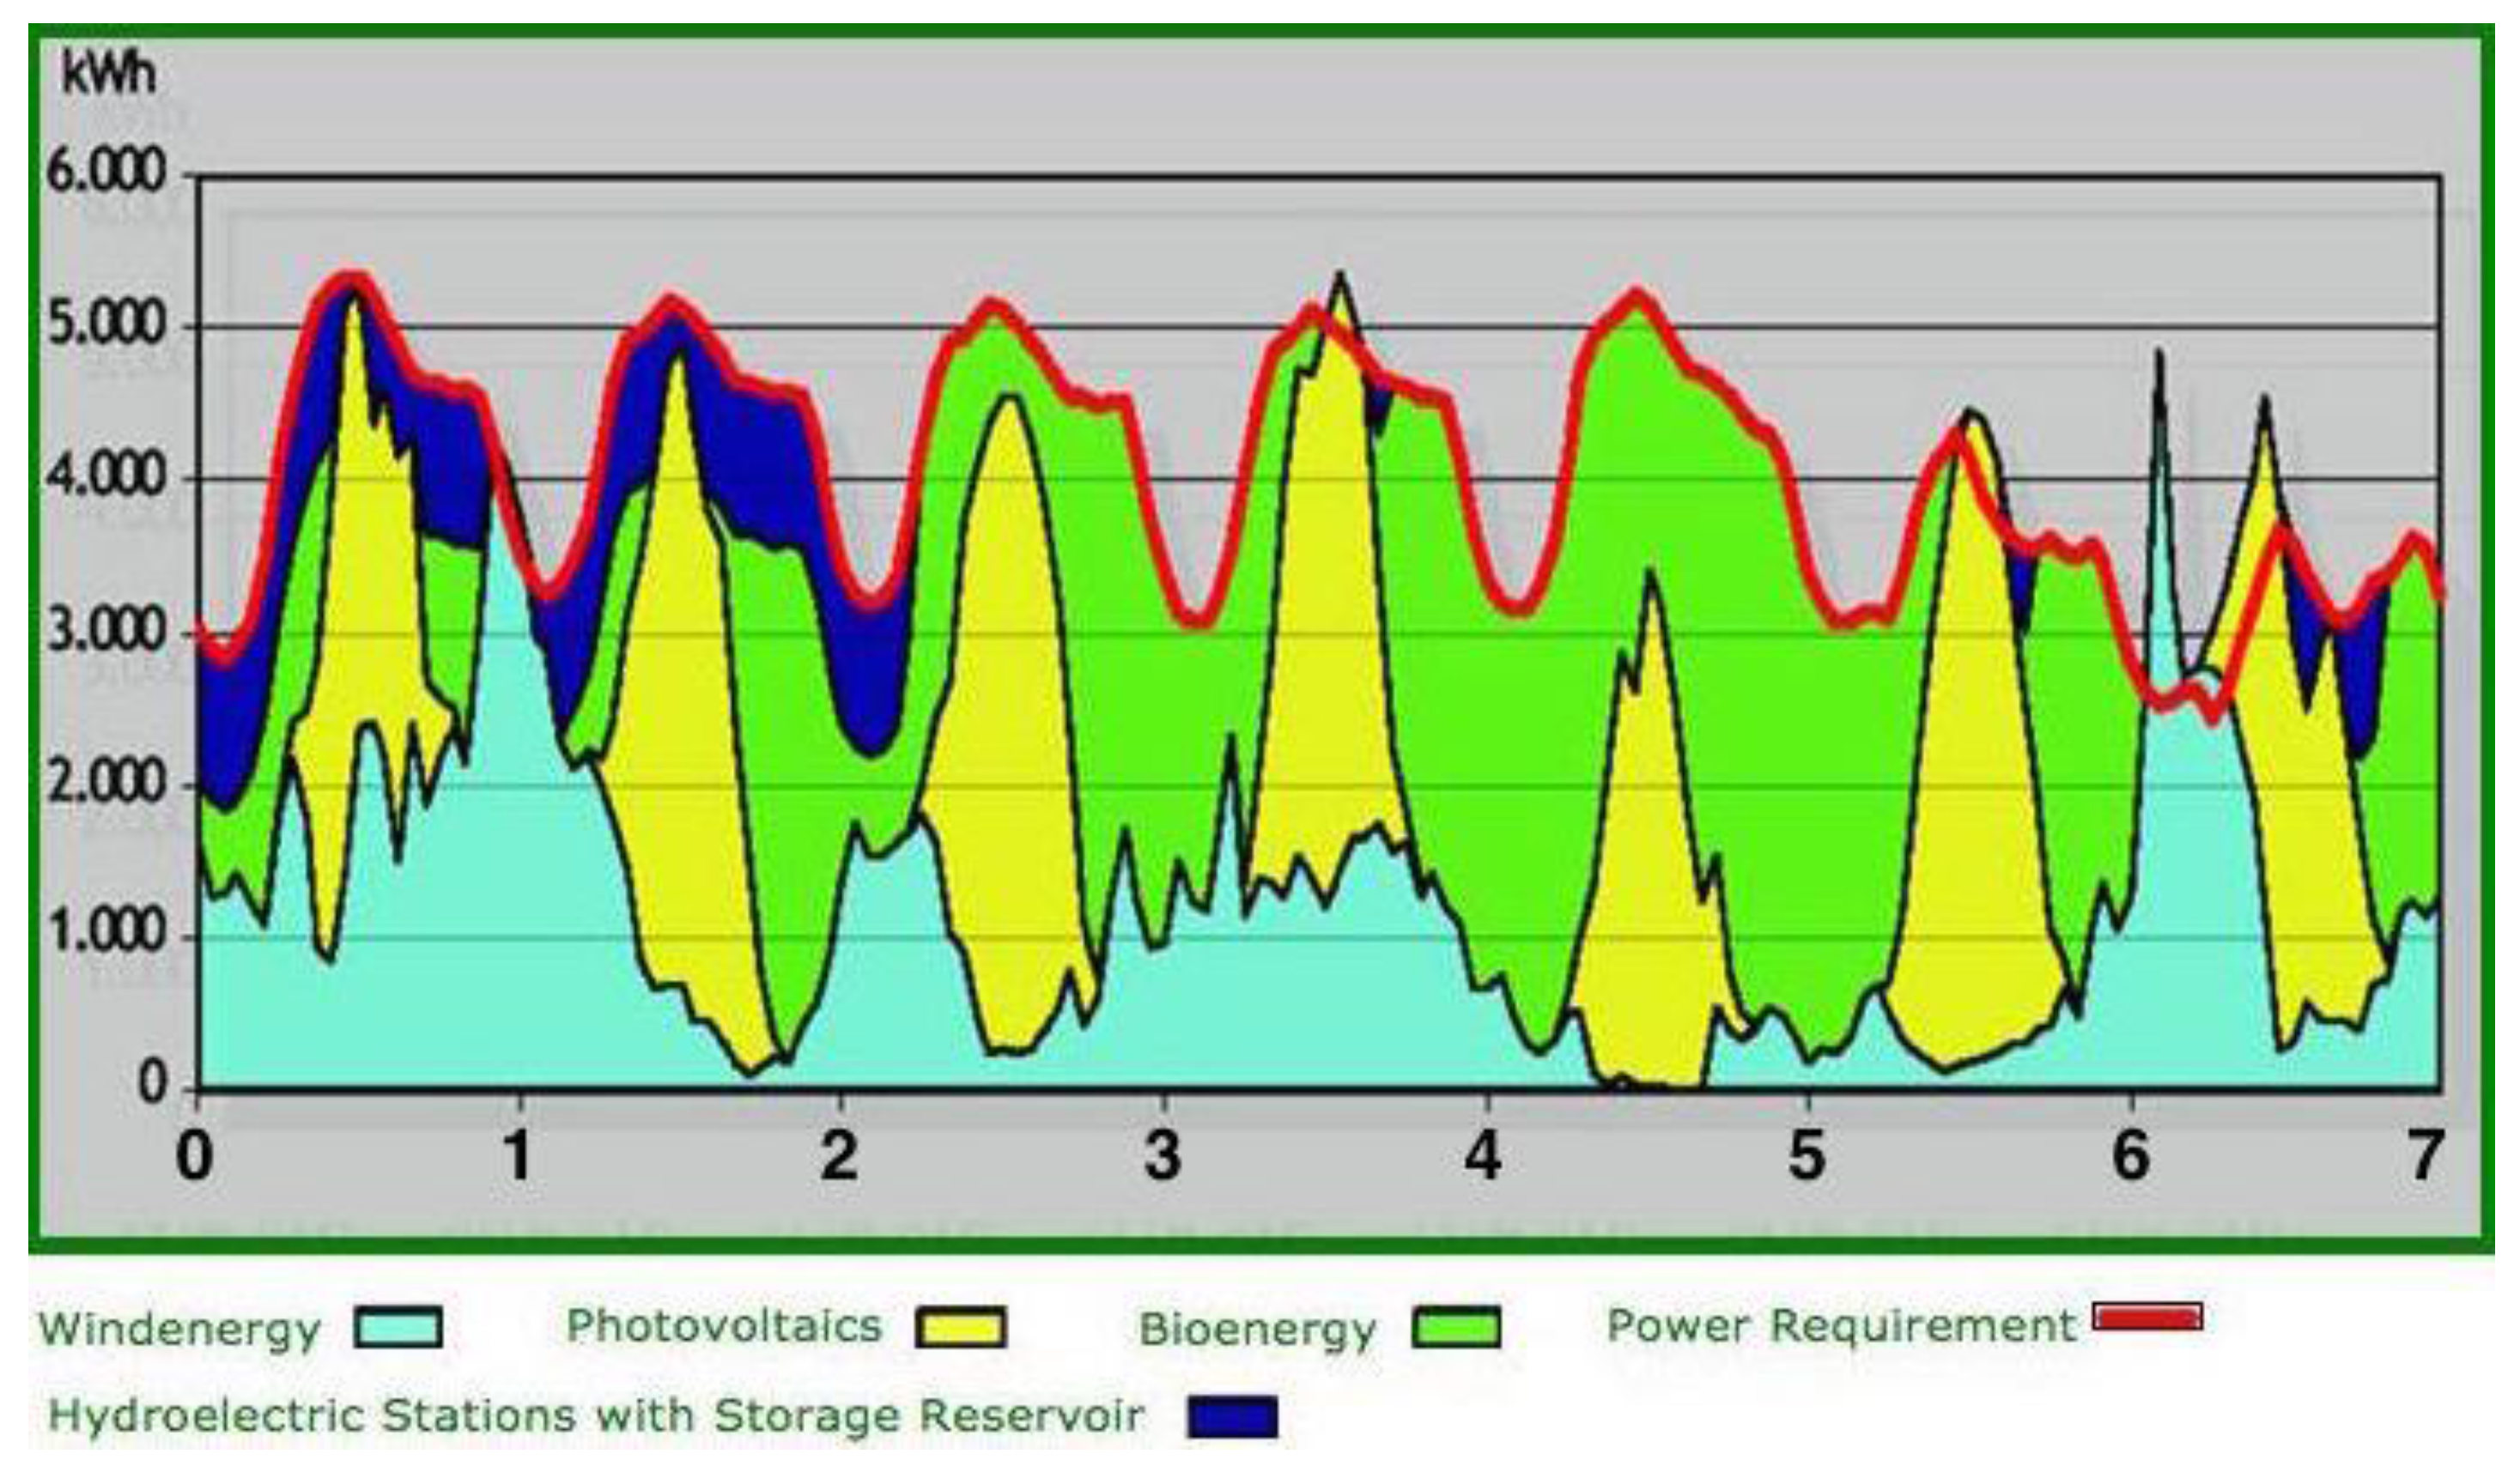
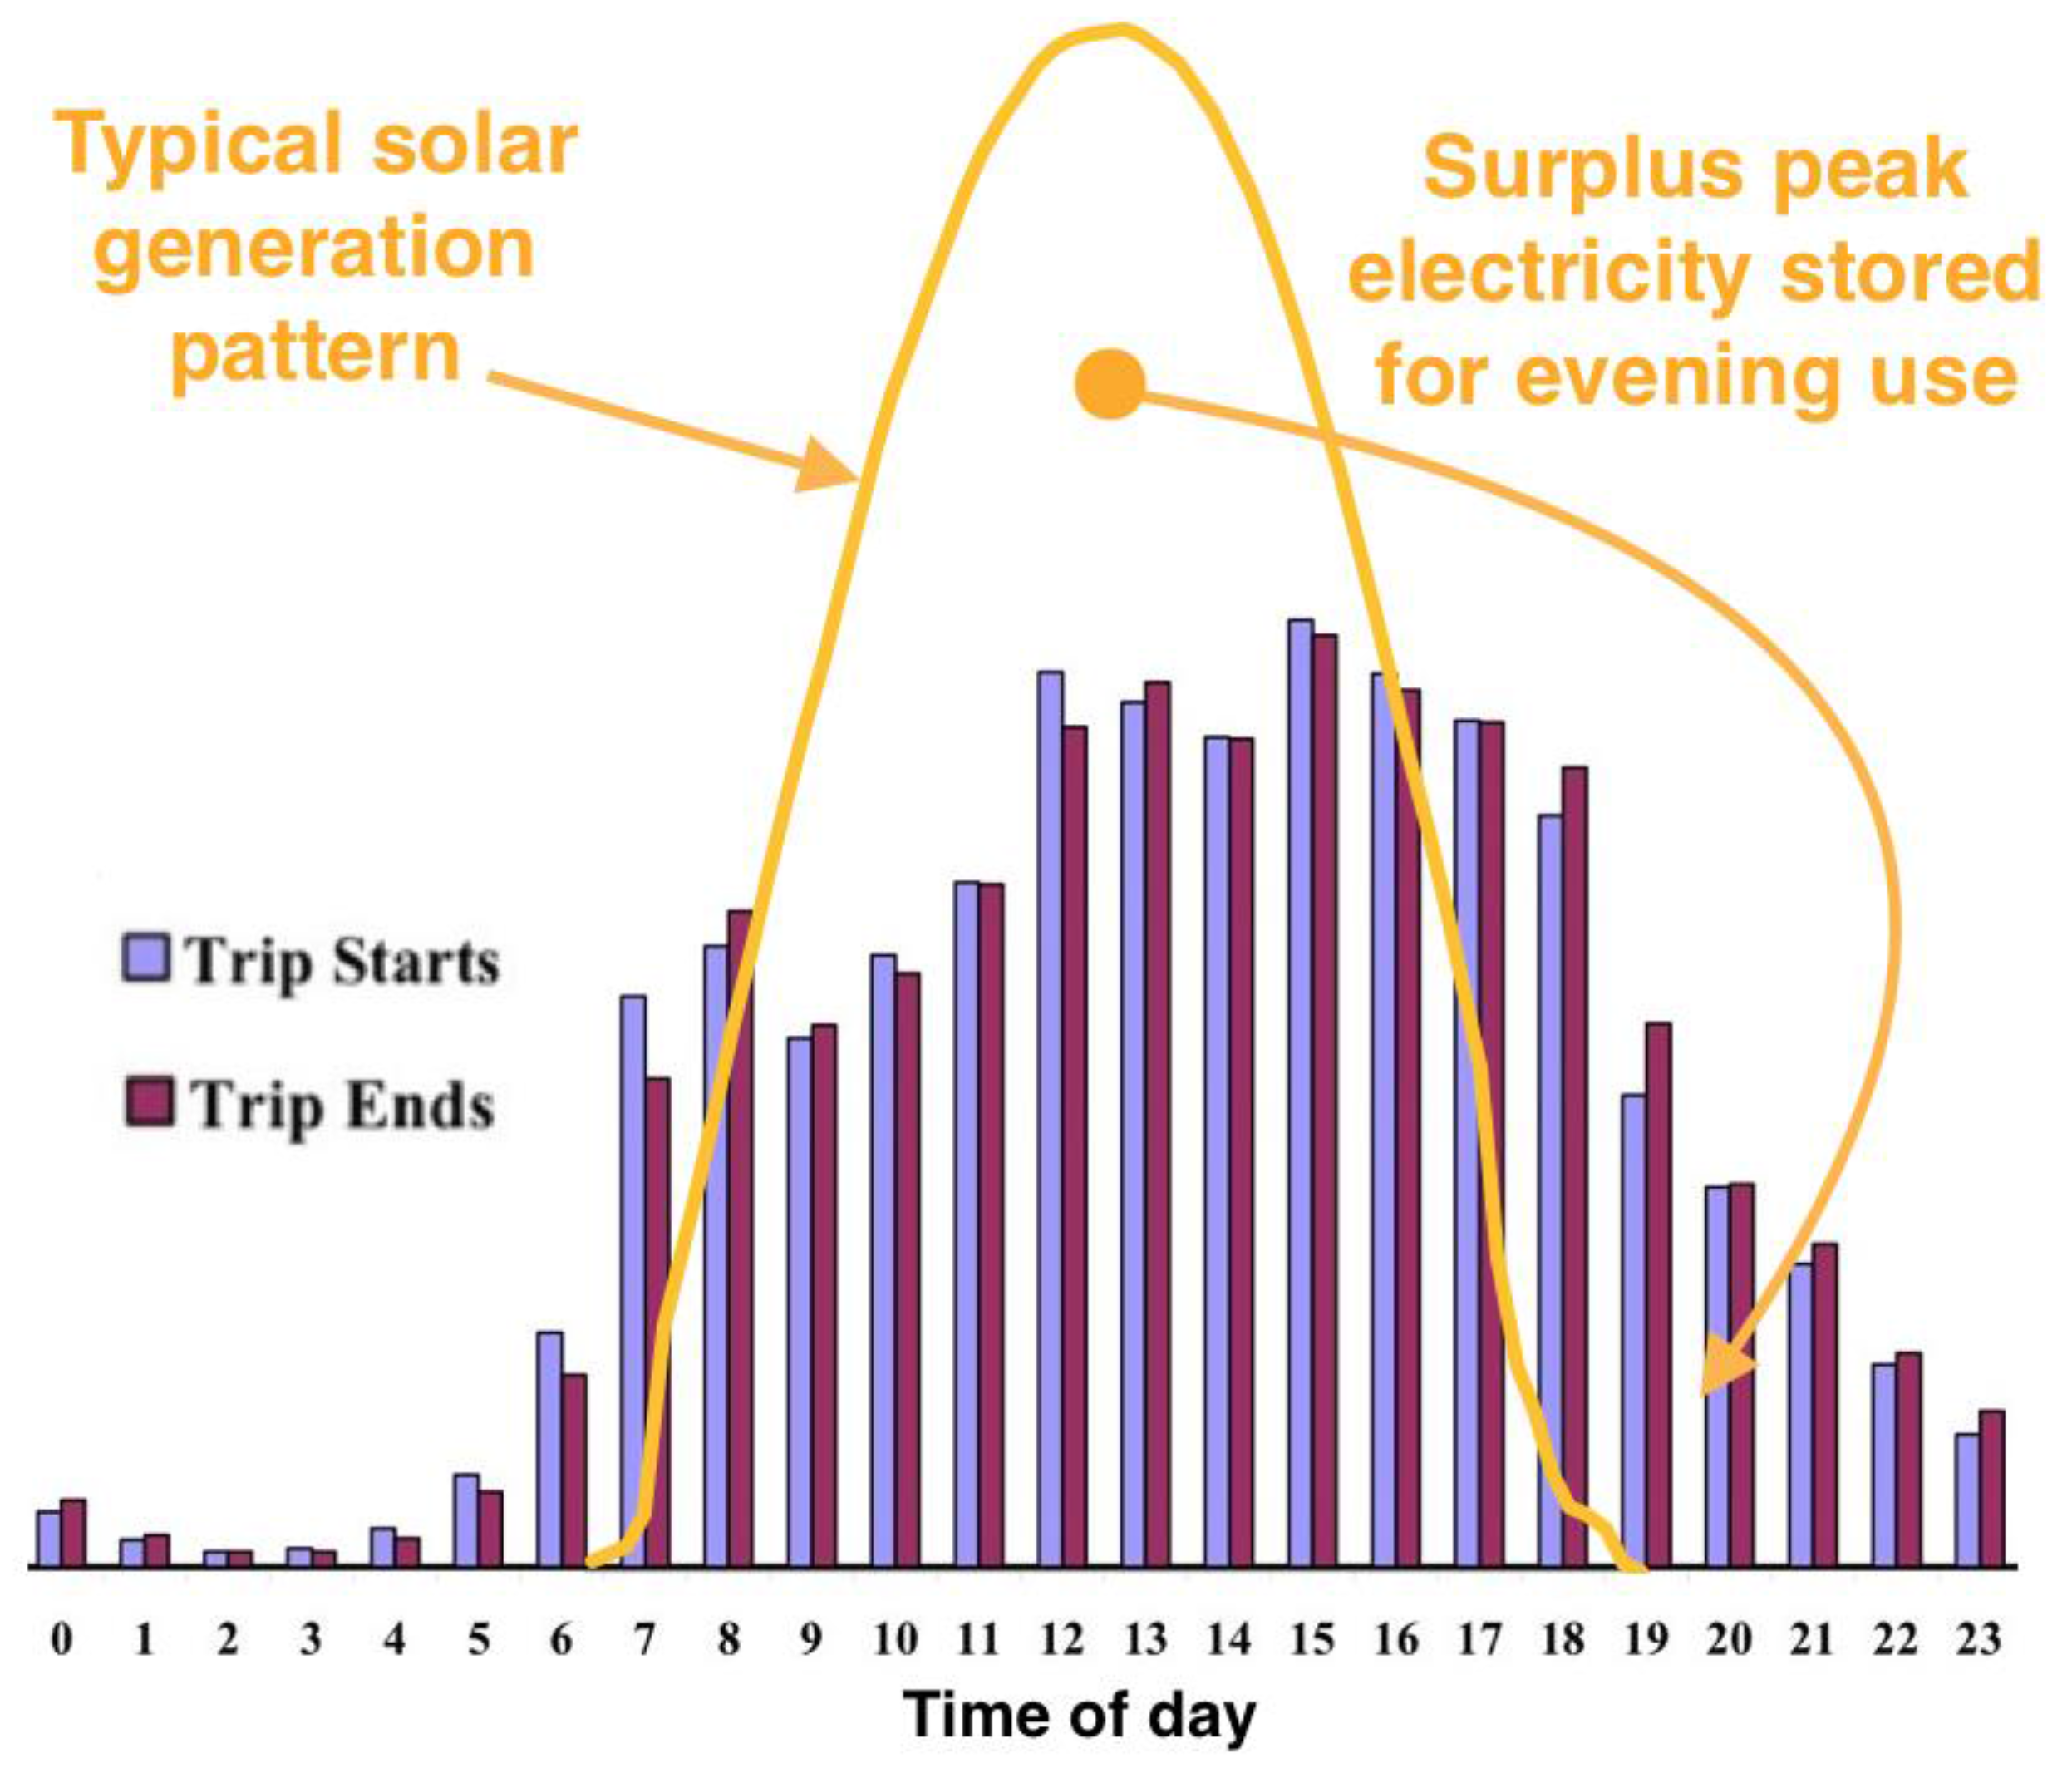
3.4. Intermittency: The Sun’s Energy Is Constant; Fossil Fuels Are Here Today, Gone Tomorrow
3.5. Time to Market: The Silicon Valley Culture and Its Spinoff of Crowdsourcing Have Enabled Innovators to Navigate around the Incumbency
3.6. Net Energy (Energy Return on Energy Investment / EROEI / EROI) and Efficiency: The Net Energy of Renewables Is Higher than the Net Energy of Fossil Fuels and Is Sufficient to Leverage the Solarevolution
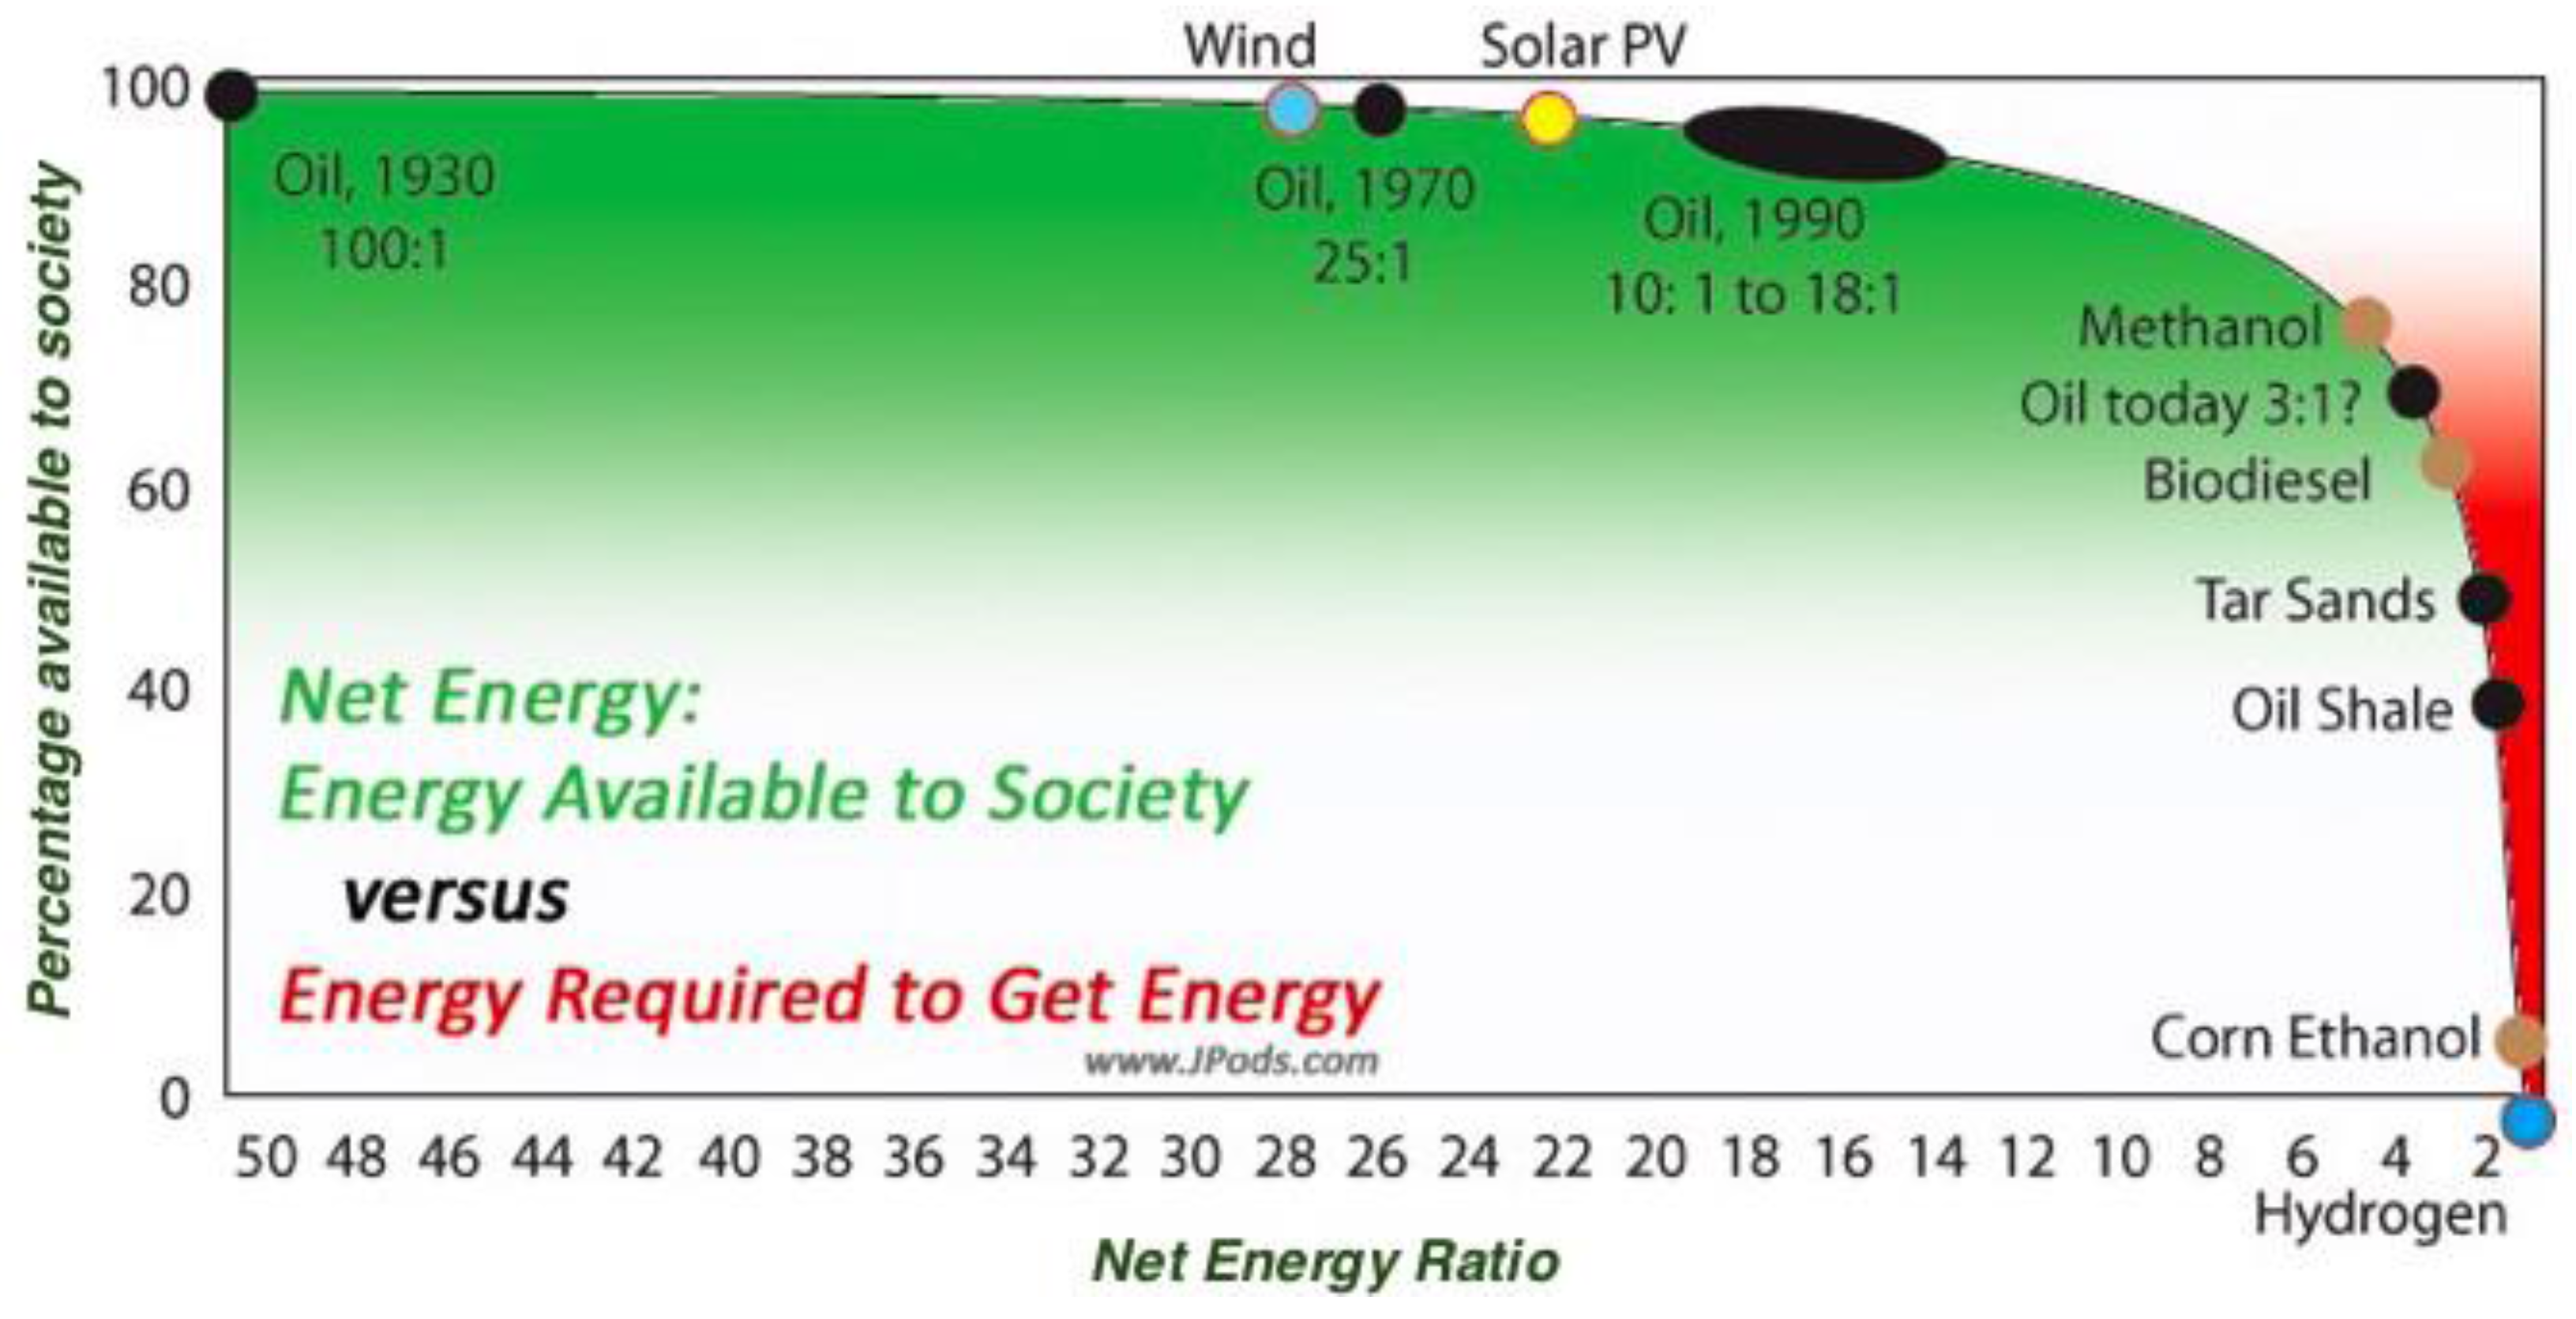
- Net energy of fossil fuels: In the early days of coal mining (the 1600s and earlier) and oil drilling (from 1859), extraction was relatively easy, and yields were bountiful. A gallon of oil invested in drilling and pumping would “return” 100 gallons (Figure 9). Then, as conventional easy oil was exploited fully, other forms of oil were pursued with increasingly costly methods (both financially and energetically). New fields today have low net energy yields; extraction is typically short lived and energy-intensive, with high carbon emissions.
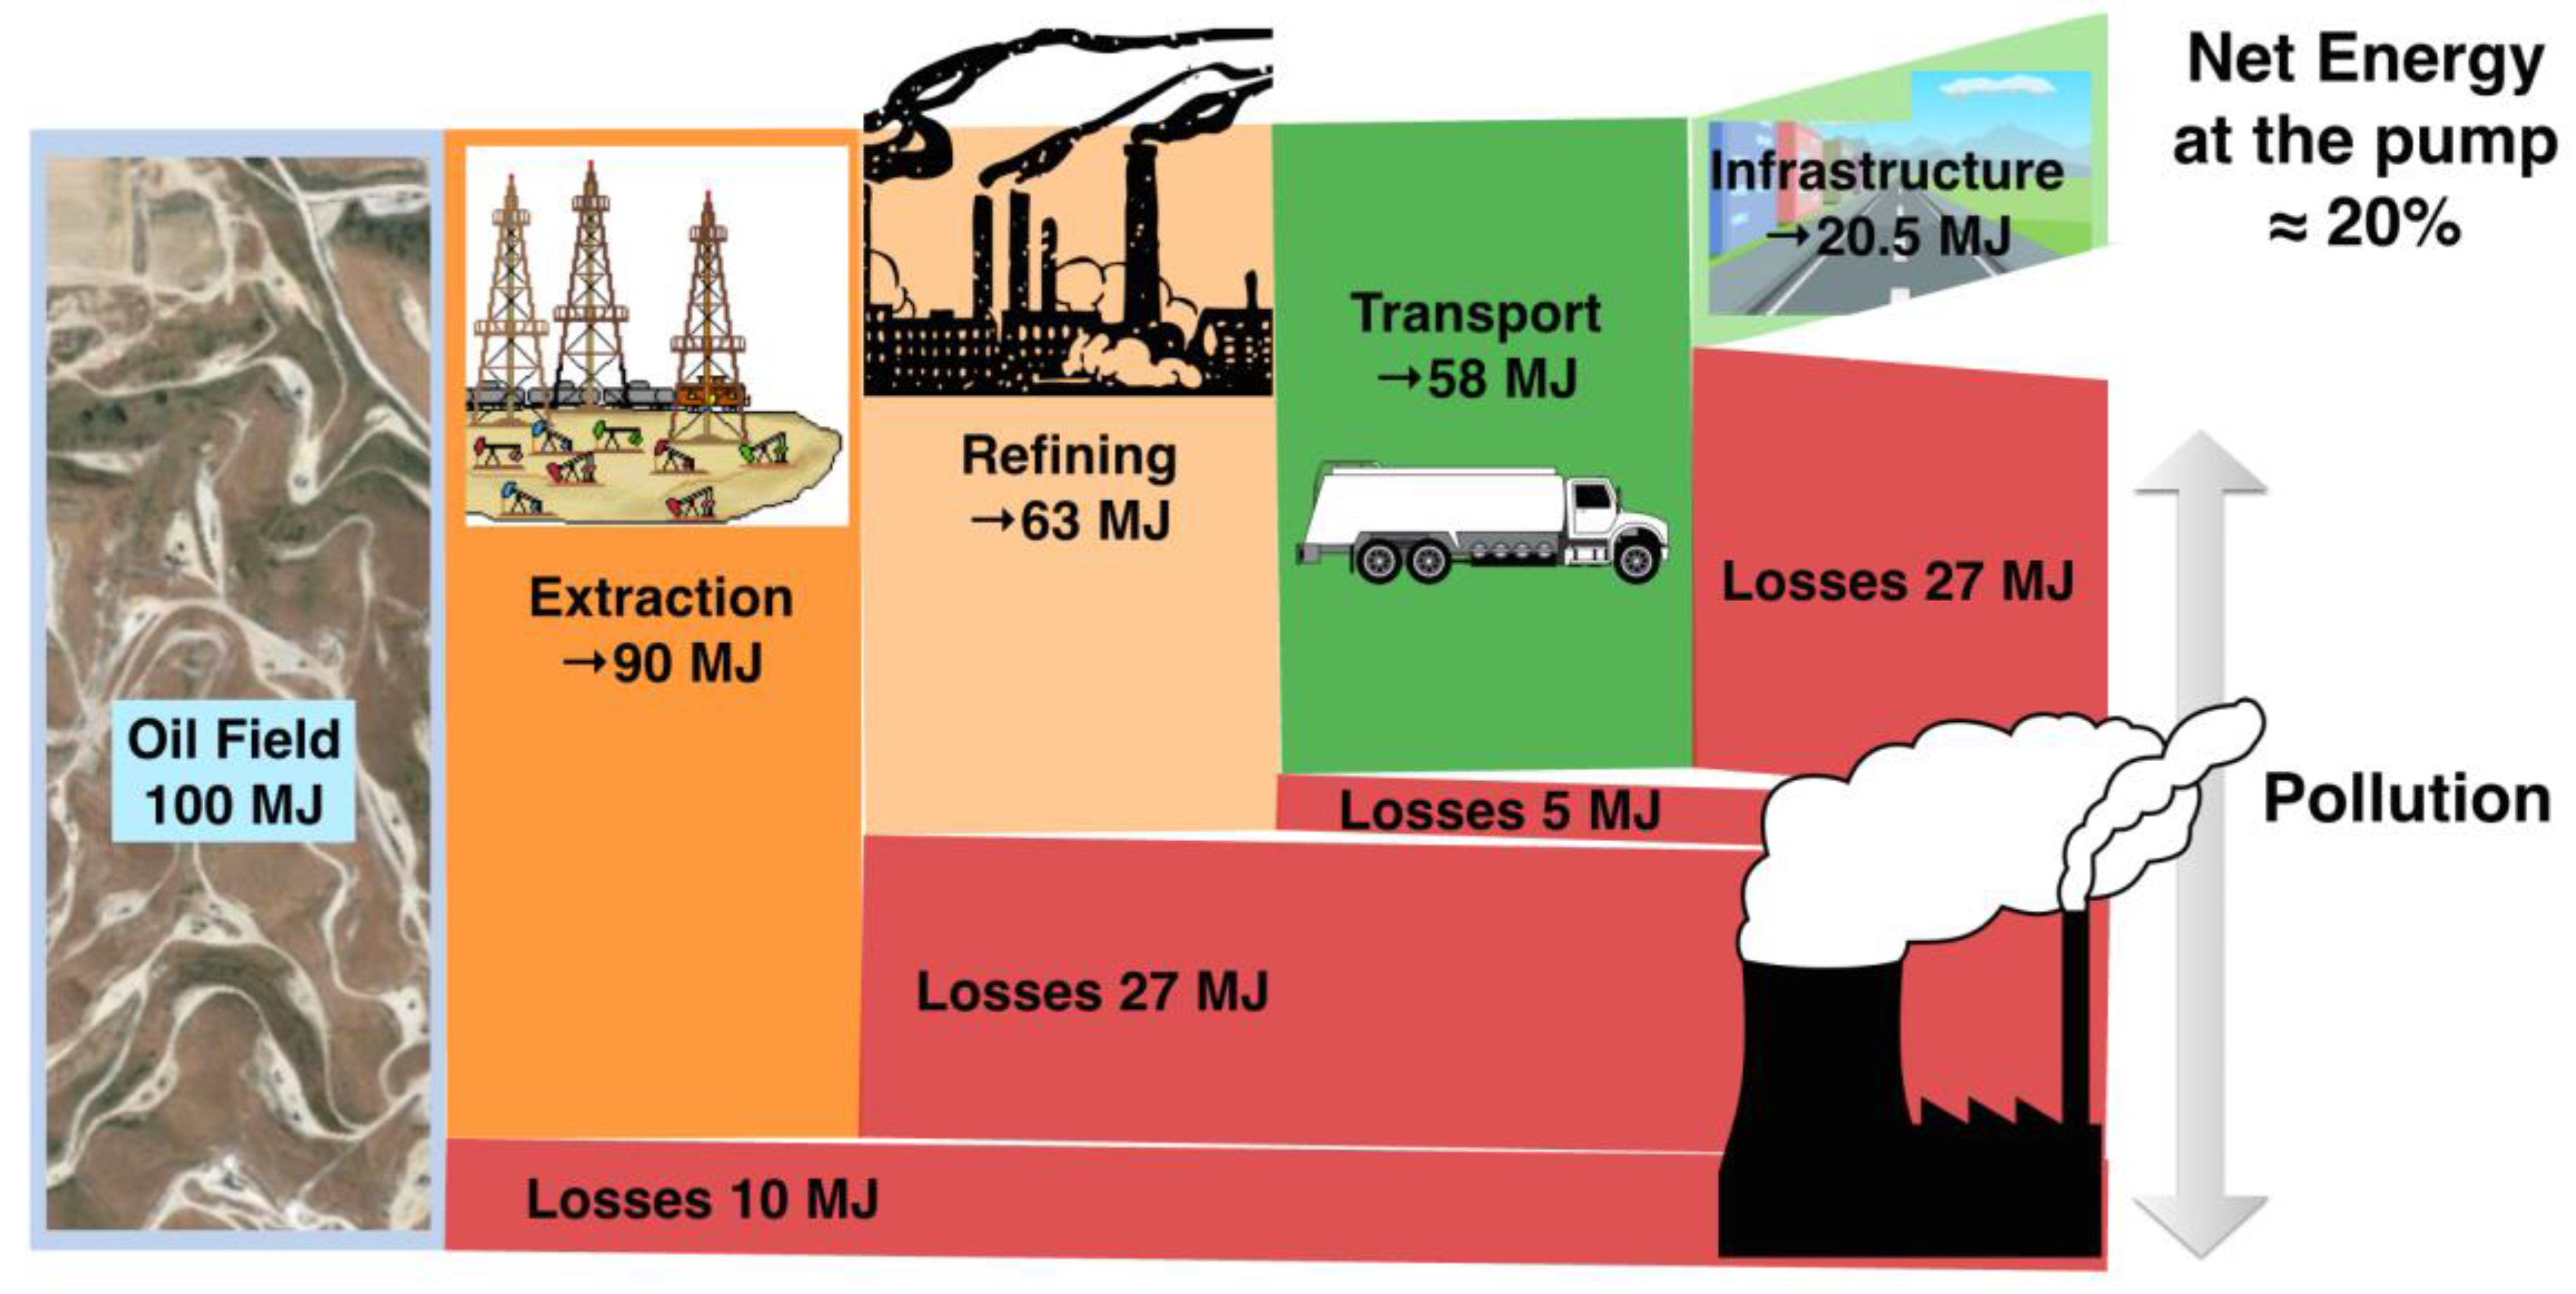
- Minimum net energy (EROI): In the context of ever lower net energy yields for fossil fuels, it is not surprising to hear the argument from Charles Hall that a minimum EROI of 10 is essential to the functioning of modern civilization [26]. It is easy to understand how that somewhat arbitrary guess came to be. When scientists first discovered the physics of heat and work and inventors created technology to exploit that understanding, engines were crude and fossil fuels were relatively easy to obtain. Engineering was inadvertently wasteful. Watt’s early steam engines were less than 2% efficient. Steam locomotives (coal) reached only 6% efficiency in the U.S. around 1930 when they were superseded by diesel engines (oil). The very high EROI of early coal extraction was not coincidental; it was essential to the viable functioning of early steam engines with such low efficiencies.The same applies to oil. A most revealing narrative is the sequence of losses seen in each step of extracting and processing petroleum, as depicted in Figure 10. Starting with 100 units of energy buried in an oil field, the remaining energy at a gasoline station is only 20.5 units. Putting those 20.5 units into an automobile with 13% average conversion yields 20.5% × 13% = 2.7%. Considering that less than 10% of a vehicle’s mass is its passenger load, the entire energy chain drops down to a grotesque 2.7% × 10% ≈ 0.3% actual net efficiency. No wonder Hall claims the necessity of an EROI of 10 for a civilized world [27] instead of an EROI of 1.1 (say) that our ancestors needed to survive. Our fancy computerized burn-baby-burn artifacts are just glorified brute force.Giving Hall the benefit of the doubt, is that minimum EROI of 10 for the fossil fuel economy applicable to the Solar Economy? No, even if the EROI of renewable energy generation turns out to be lower than anticipated, electric artifacts are becoming increasingly efficient. The complete renewable energy chain will outperform the fossil fuel energy chain. That is what the Solar Design Revolution is all about.
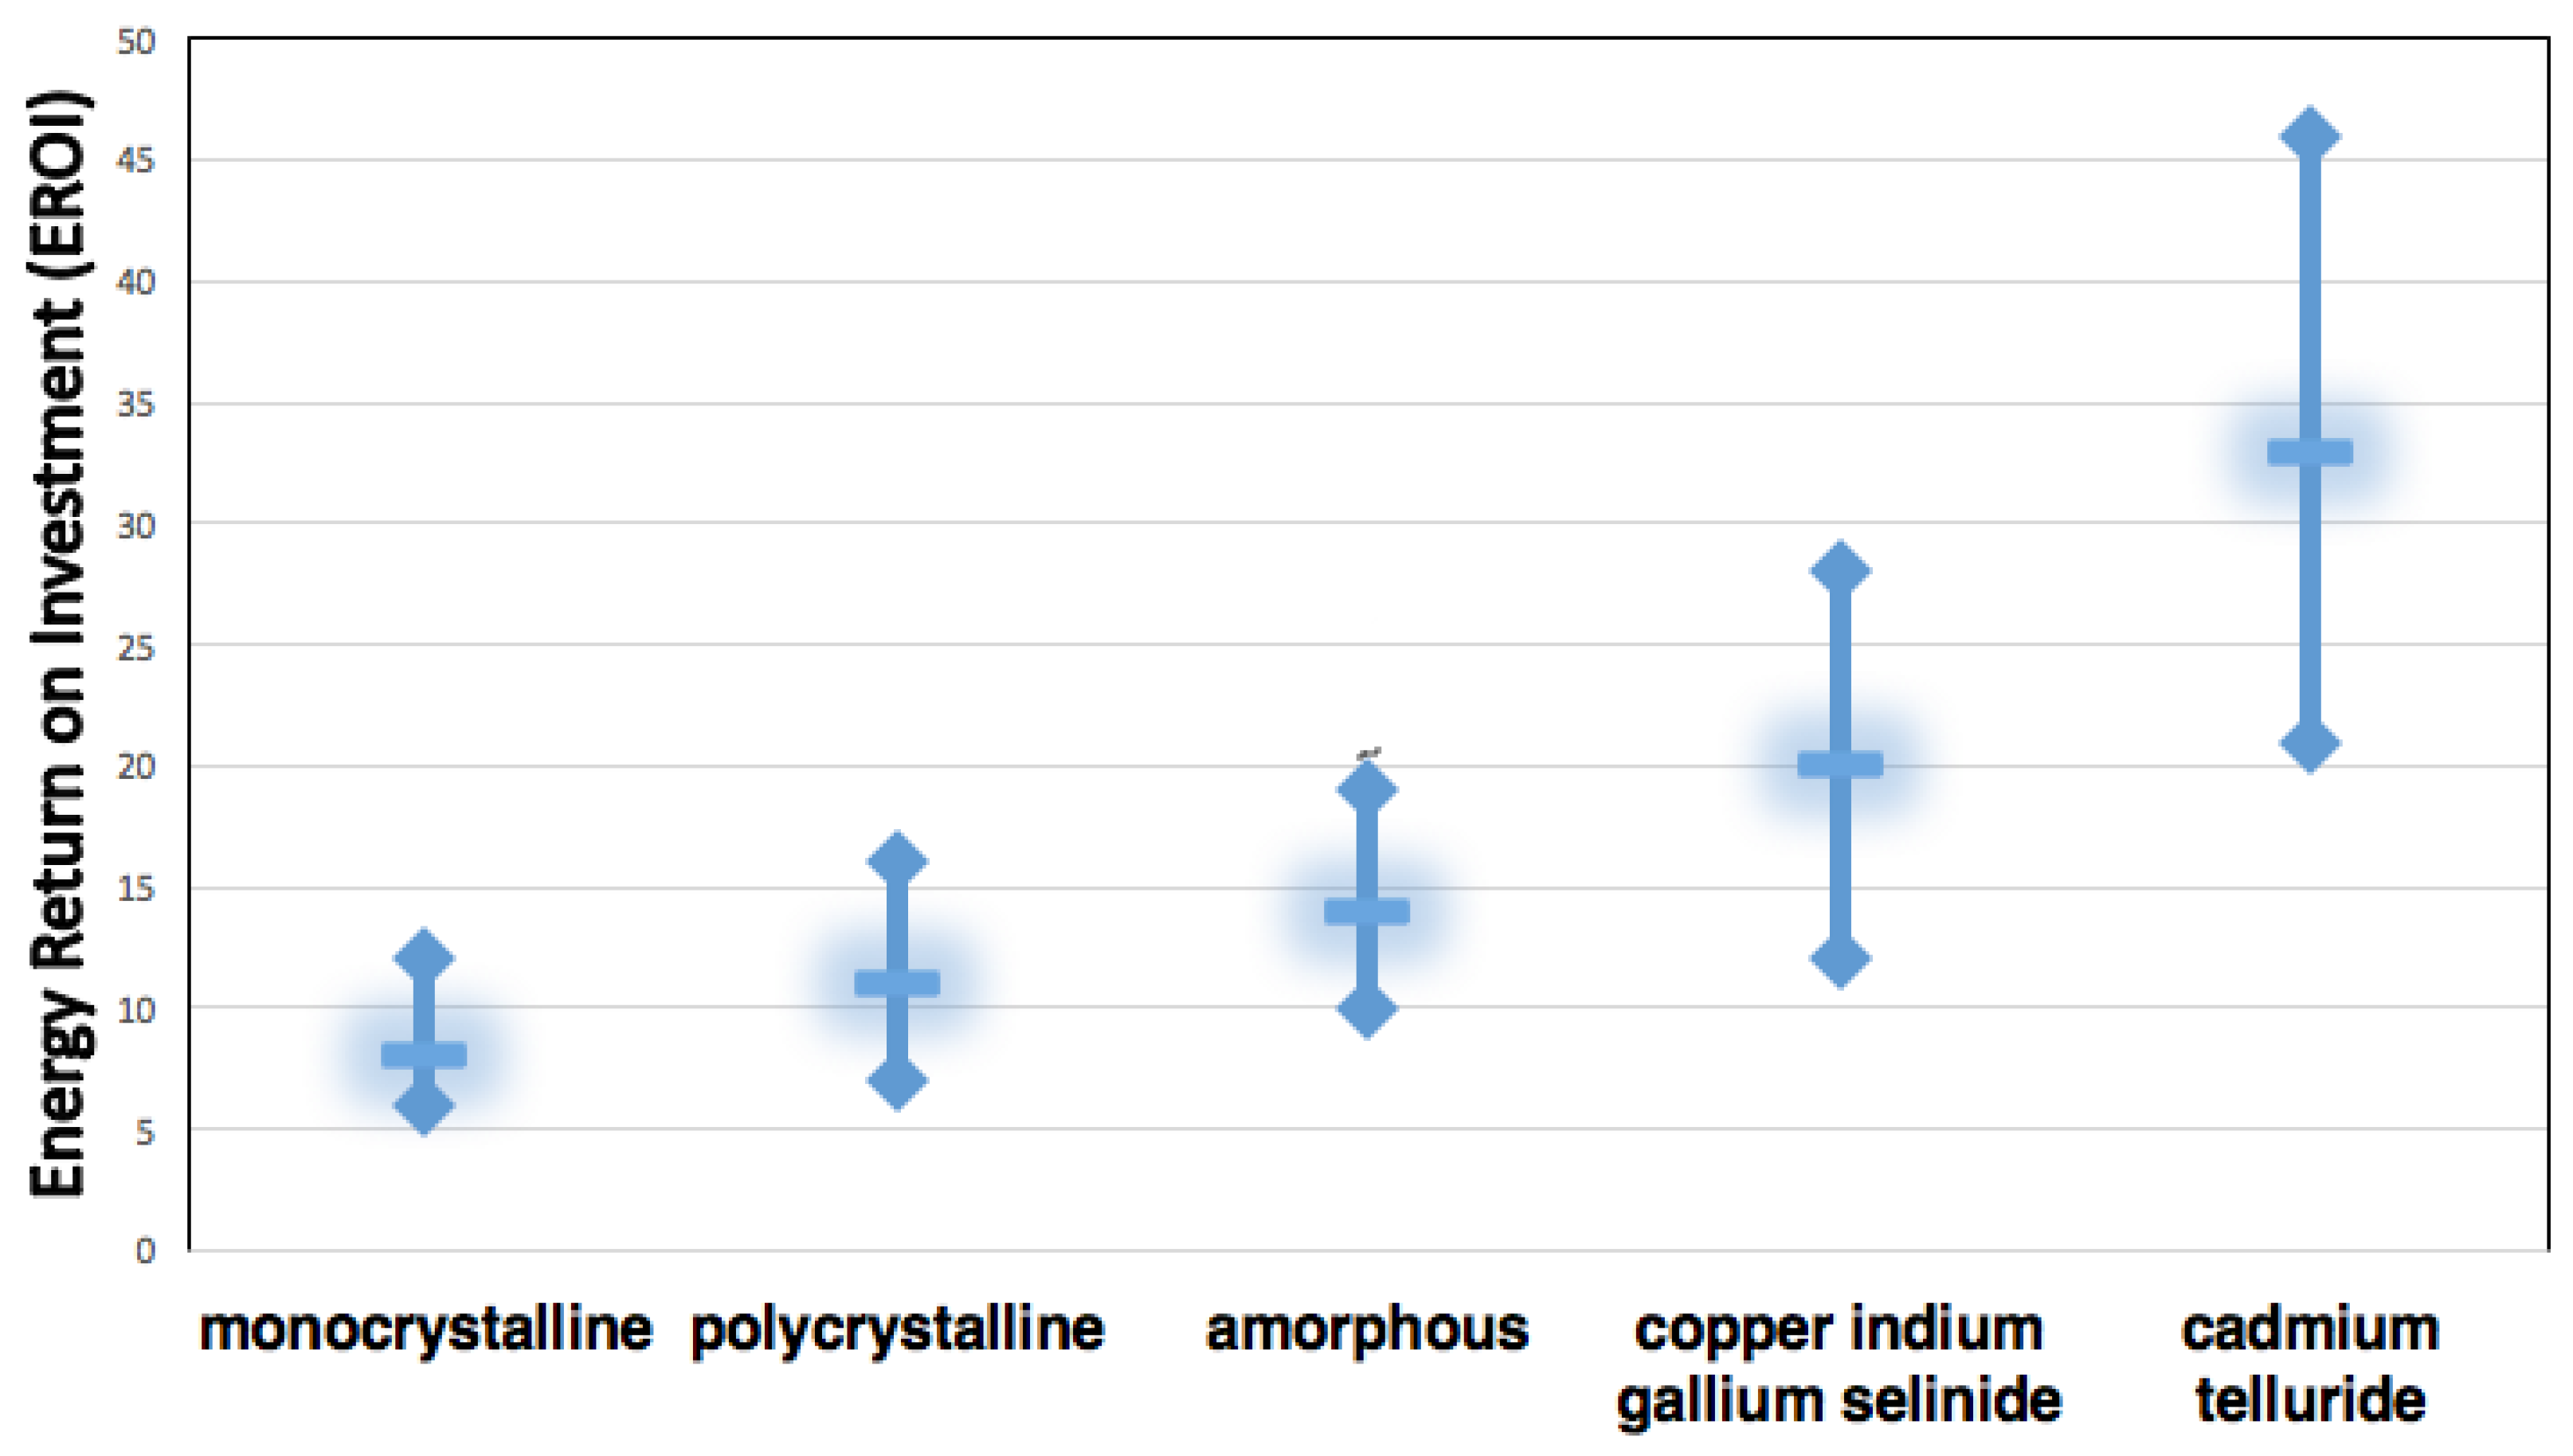
- Net Energy of Renewables: The success of the Solarevolution of course depends on the ability of solar/wind energy devices to produce significant net energy, that is, much more energy than is required to make them. An inconclusive debate has endured for a number of years, with high observed EROI asserted by, e.g., Raugei and Fthenakis [29] and others, versus low observed EROI asserted by solar energy specialist Pedro Prieto with support from Charles Hall, who first quantified the principle of net energy as EROI, building on the research of ecologist Howard Odum [30]. “Prieto and Hall conclude that the EROI of solar photovoltaics is only 2.45, very low despite Spain’s ideal sunny climate. Germany’s EROI is probably 20% to 33% less (1.6 to 2), due to less sunlight and efficient rooftop installations [31].”A fundamental flaw of the Prieto-Hall analysis is the well-intentioned use of economic value as a proxy for energy. Noting a given country’s aggregate energy consumption and its GDP, one can crudely approximate the energy embodied in any given purchase based on its price and the national energy use per dollar per year. Prieto and Hall calculated this for Spain to be 1.99 kWh per U.S. dollar of GDP generated [31].Proxy energy is meaningful, for example, to distinguish between the embodied energy in a solar system installed on wooden racks by an impoverished electrician walking to work barefoot in Africa versus the same size system installed on aluminum racks by a California electrician who drives a long distance to work in a truck, earning enough for frequent vacations in Hawaii. This proxy, however, is flawed because economics is an instrument of policy, not a fundamental metric, e.g., BTUs or kilowatt-hours, leading to analysis which is inherently distorted and amplified by the “economic” framework (i.e., energy policy) in which any given project is embedded. Thus the Prieto-Hall proxy analysis based on Spain’s economy, substantially dependent on imported fossil fuels, is questionable.On the other end of the EROI debate, several others including Raugei and Fthenakis calculate a range of PV EROI between 20 and 40 (see Figure 9), and for comparison, they calculate the EROI of oil at 10–30 and coal, without Carbon Capture and Storage (CCS), at 40–80 [29].Another survey, by Bhandari et al [32], indicates a lower range of values that render the levels in Figure 9 to be optimistic, except for high EROI Cadmium Telluride (CdTe) thin film modules (Figure 11), but nonetheless in the same range and superior to the values indicated for oil today. These disparate conclusions indicate wide discrepancies in methodology and underlying assumptions. However, might there be other fundamental principles of energy overlooked in the analysis that further distort the net energy debate?
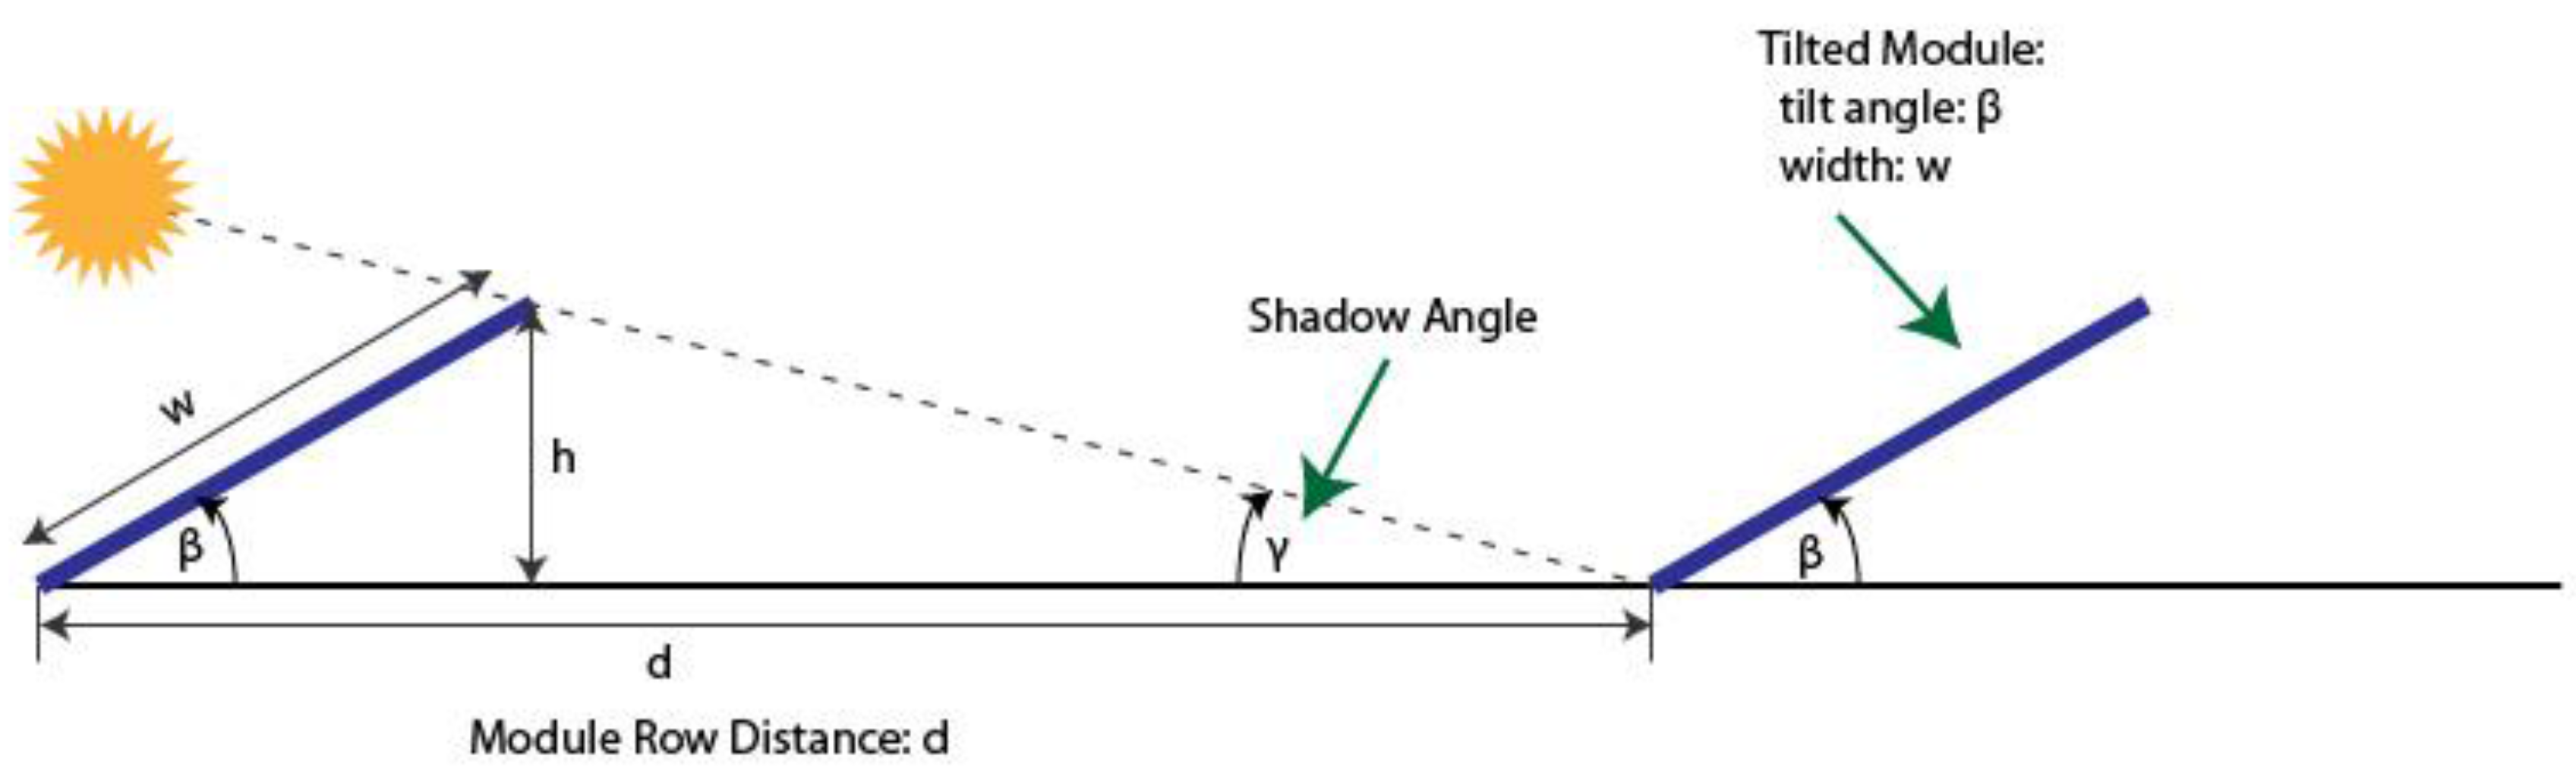
- Aperture efficiency and land efficiency: Aperture efficiency of solar is given significant attention in the media as a key indicator of potential cost savings. The aperture of a solar array is that portion of modules that directly face the Sun, in contrast to the efficiency of an entire system. By analogy, while the entire front of a camera receives light, it is only the lens that gathers the light to produce an image. Multiple rows of solar modules are separated to minimize self-shading while optimizing space allocation. For example, in Figure 12, the solar aperture “w” with row spacing “d” yields a “fill factor” of “w/d”, which at mid-latitudes might be on the order of 1/3. Then, with a solar module at the high efficiency of 21%, the net efficiency to land would be 21% × 33% = 7%.Optimizing this fill factor, balancing the cost of land and the cost of solar is important to installations of solar farms in open landscapes, but has little relevance whenever solar is installed on a mobile device, a solar race car, the pitched roof of a home or along an elevated transit guideway. In such cases, the fill factor can be considered to be close to 100%, as self-shading does not occur per se.
- Net energy of biofuels: The evident exception to high net energy (EROI) for renewables is the low net energy of liquid biofuels. This has been the source of much confusion because biofuels have been classified as renewable, whereas in fact, they are not. Photosynthesis is a natural process, and direct burning of biomass (e.g., firewood) has relatively high net energy yield and in moderation could be harvested in perpetuity. However, converting biomass into liquid fuels has burdensome inefficiencies (see Figure 9). To illustrate: with abundant water, about 1% of sunshine converts into biomass. Planting and harvesting (using fossil fuel-powered equipment) and the refining process (using coal-fired electricity) convert perhaps a third of the energy in biomass to a liquid form. Then, conversion in an internal combustion engine (with Carnot efficiency limits, friction and other losses) combines to exploit 13% for propulsion; the net result is 1% × 33% × 13% = 0.04% [34]. Fuels derived from algae may do better, but current algae producing machinery is material-intensive, and in spite of optimistic claims, hard data are elusive. Energy has to be used to pump water for irrigation, and if it were necessary to use the biomass itself to operate harvesters and the refining process, or to rejuvenate the soil, then the resulting EROI would be less than unity, i.e., non-renewable. These calculations are foreboding when farmers weigh their options for their fields. Since the process has little or no net energy yield, only misaligned government policy (subsidies) could possibly motivate the effort, which arguably could be rational for a farmer who has no children to inherit a depleted farm, but not otherwise.
4. Solutions
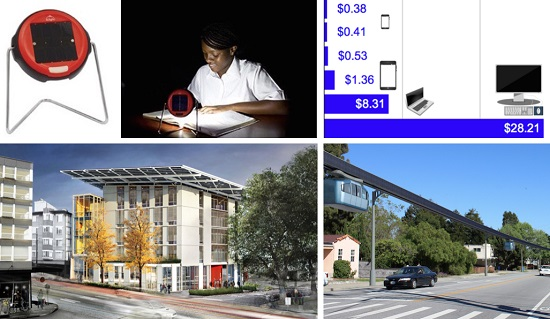
- Lighting: Solar-powered LED lights use 5× less energy than incandescent lights and 100× less energy per unit of light than kerosene lamps. Evidence: solar-powered LED D.Lights vs. kerosene lamps.
- Communications: Tablets and smart phones use 10× to 100× less energy than desktop computers and are more accessible. Evidence: tablets and smart phones vs. desktop computers.
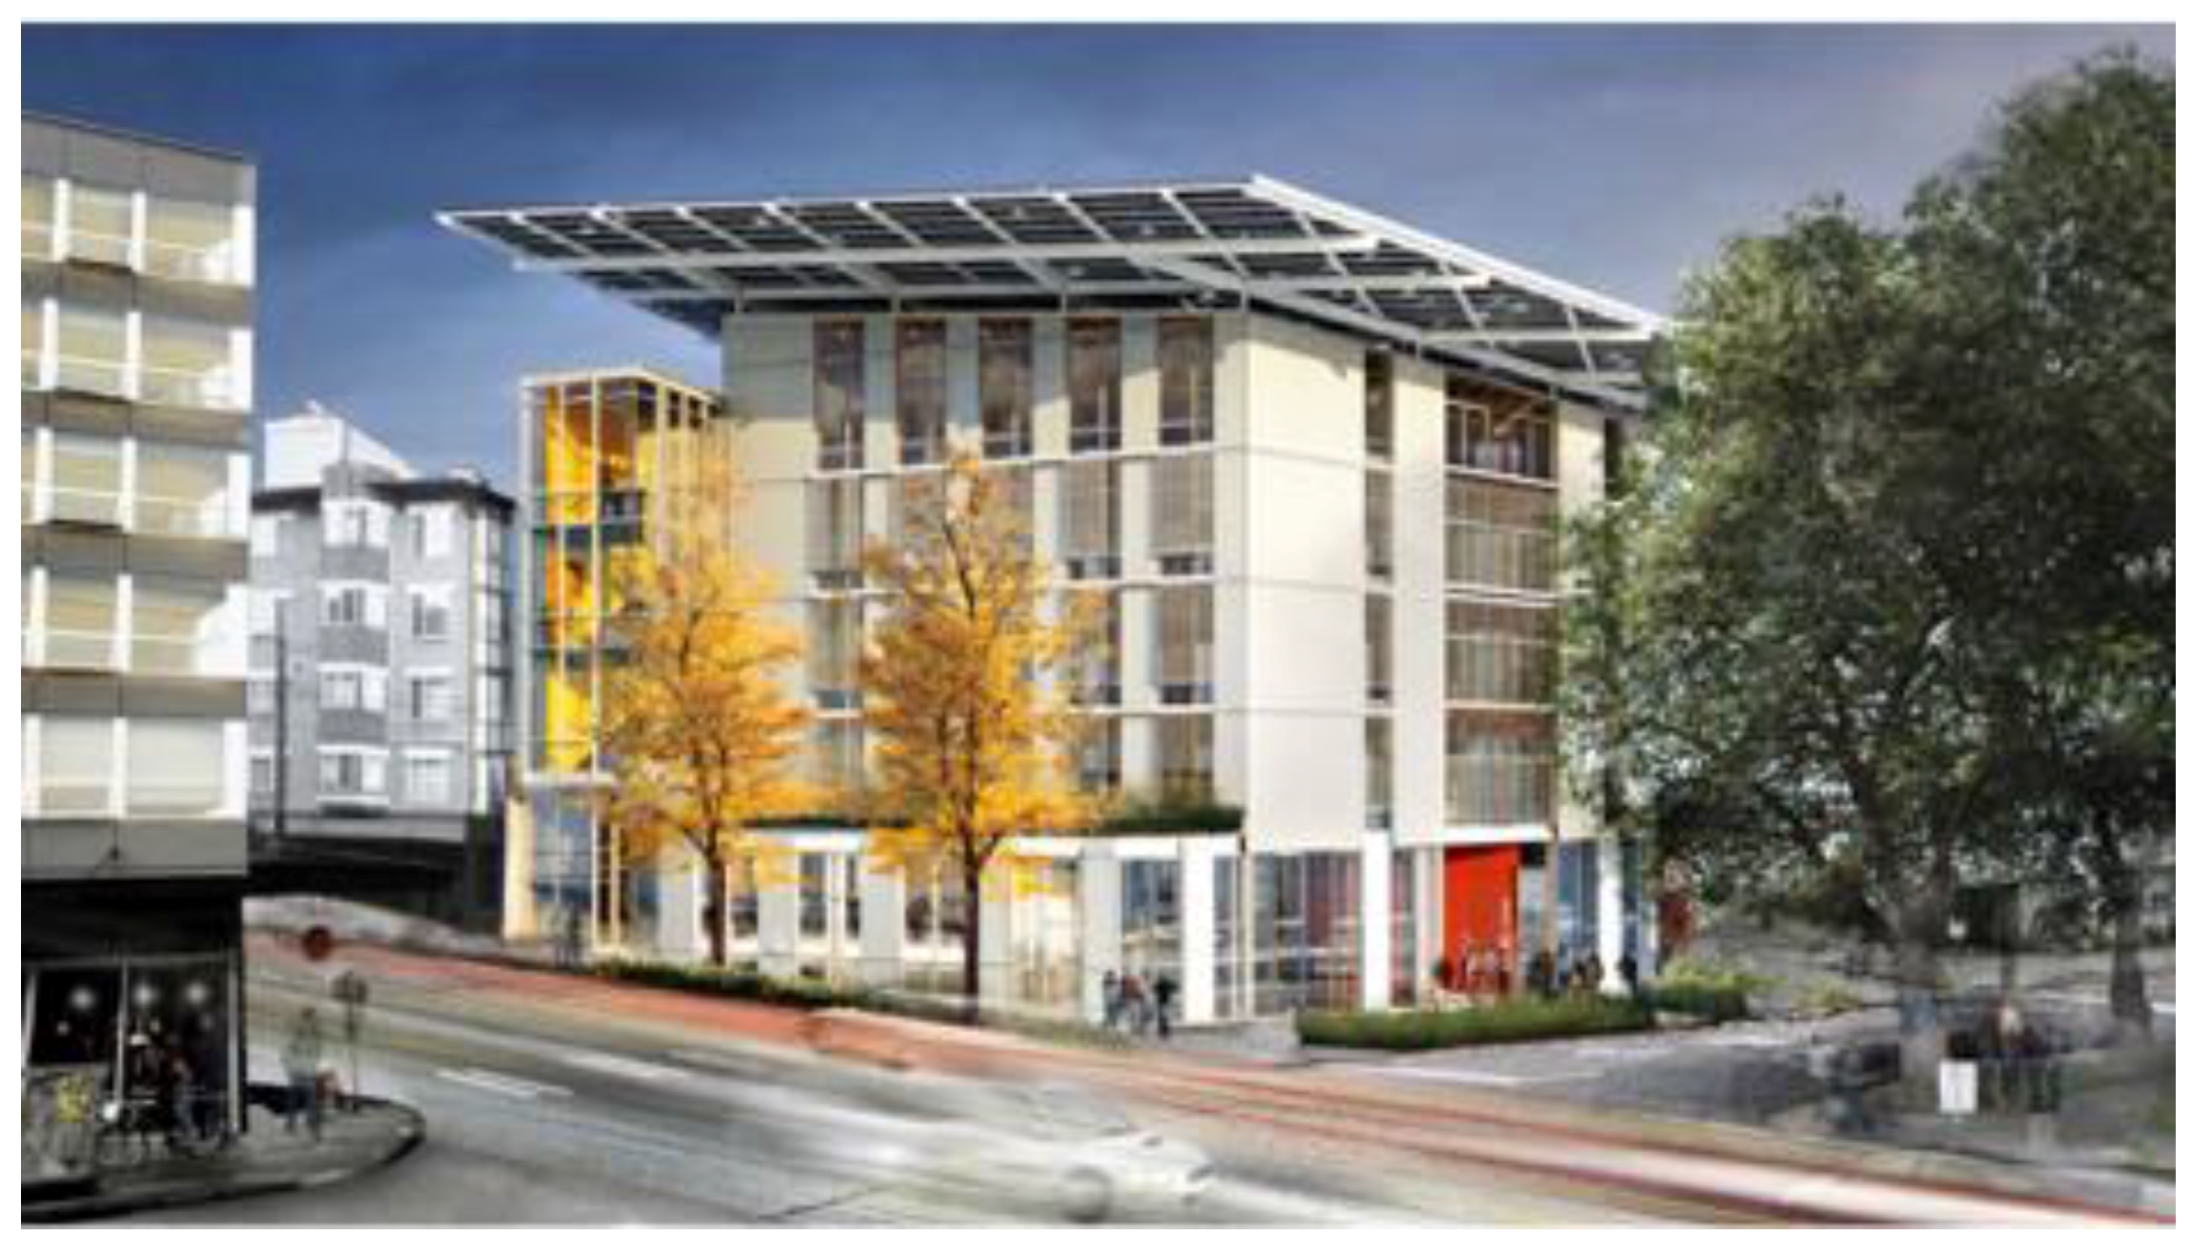
- Architecture: Passive solar buildings use 10× less commercial energy than conventional buildings. The energy economics of the Living Building Challenge deliver remarkable improvements over time. Evidence: Bullitt Center, Seattle.
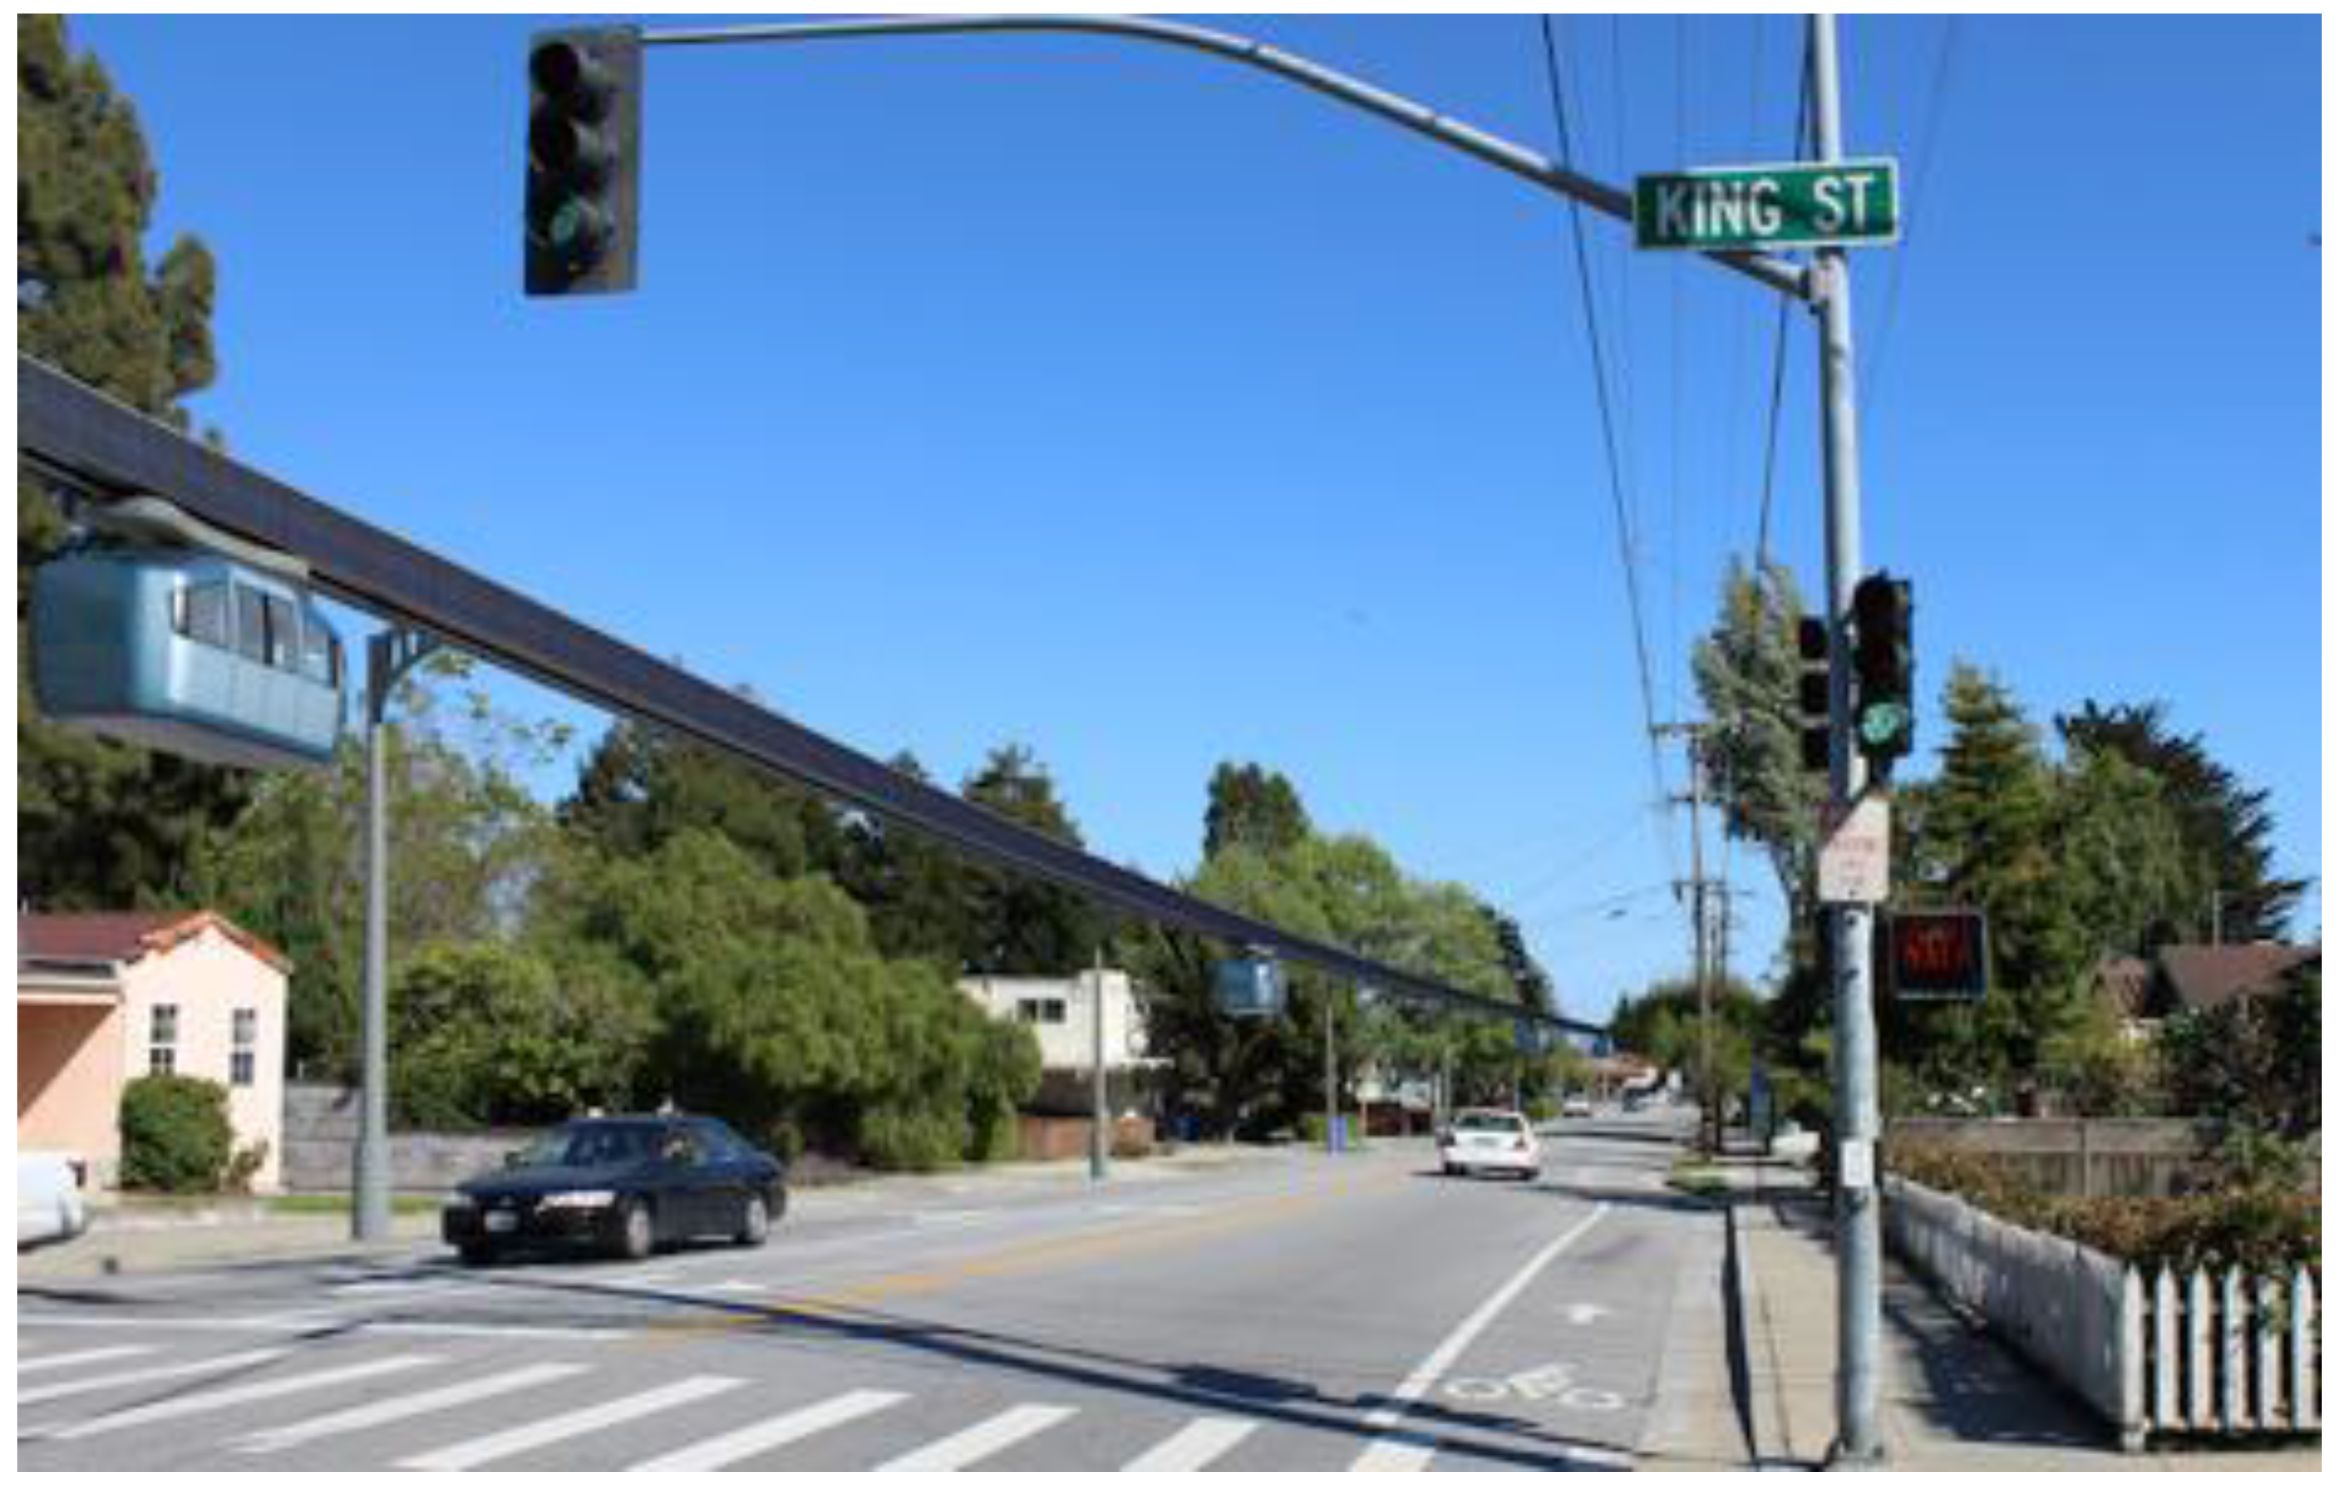
- Transit: A 100% solar, net-zero-carbon transportation system is under development. It is elevated, making it more than just energy efficient; it is also faster and orders of magnitude safer than cars. (An EV powered by photovoltaics is not the answer. The laws of physics prevail; in accidents with cars, pedestrians lose; they are not equipped with air-bags.) Evidence: SANE (Solar, Automated, Nonstop, Elevated) transportation.
4.1. Example A, Lighting: Personal Energy Servers, the D.Light® Solar Lantern
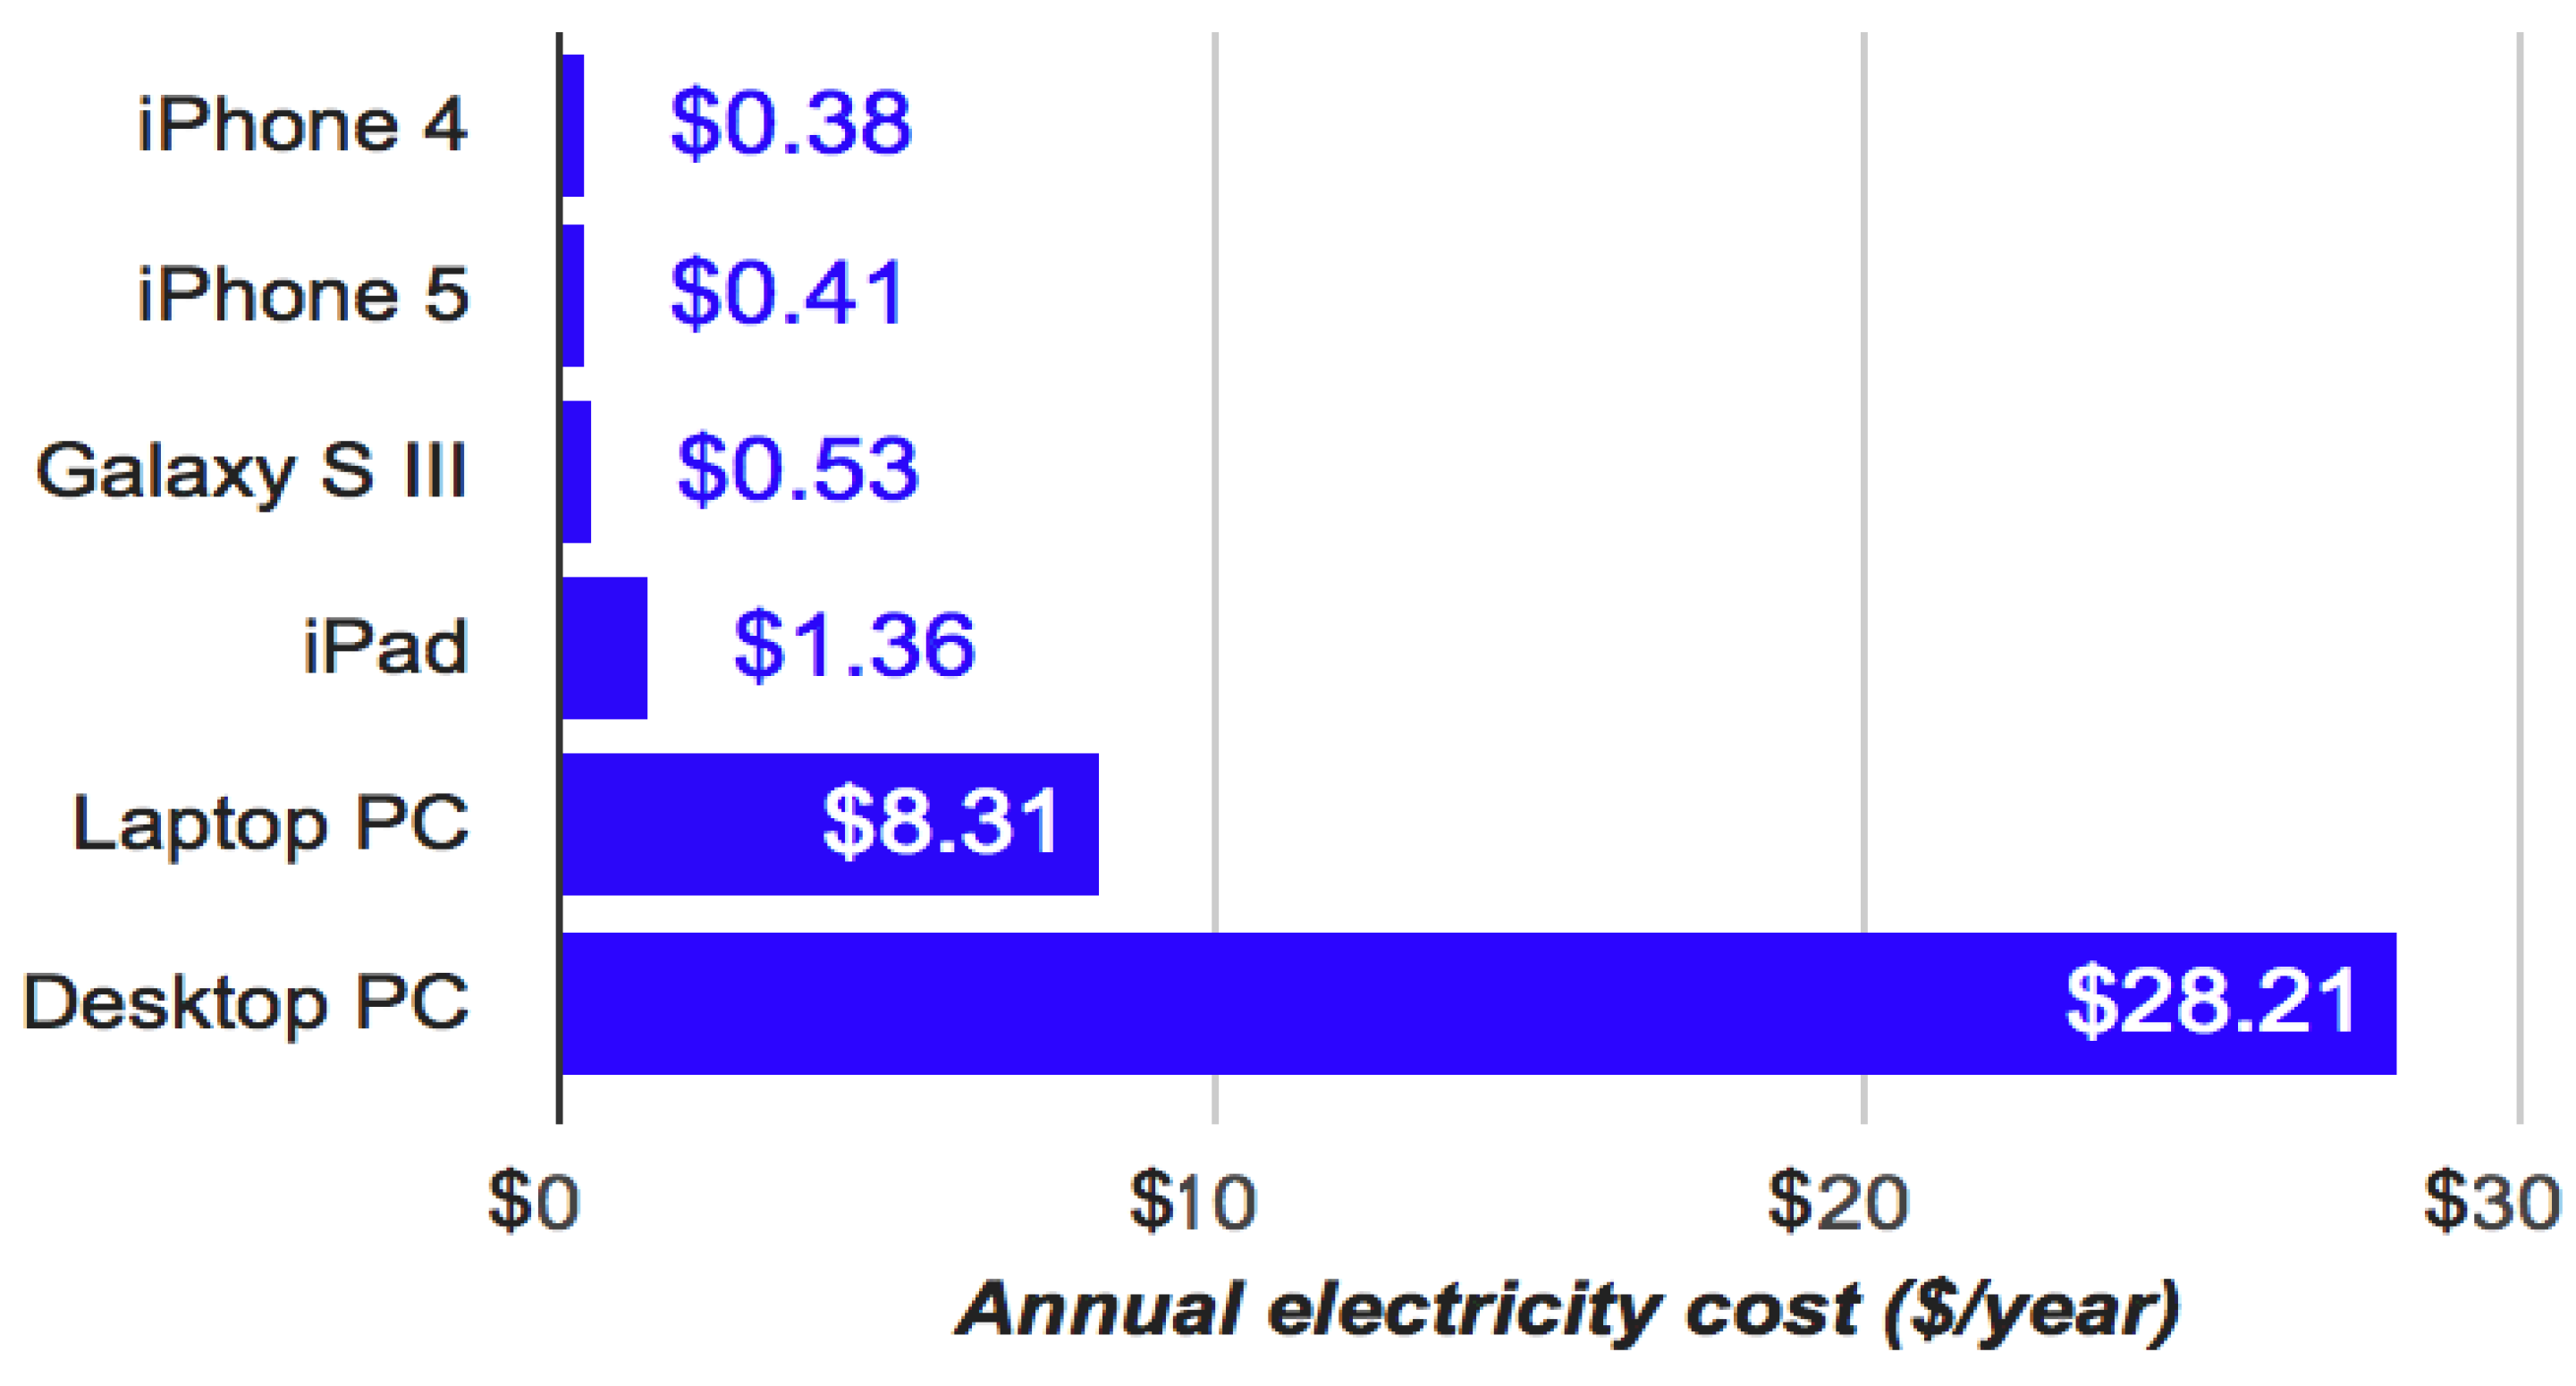
4.2. Example B, Communications: From Desktops with CRT Monitors to Laptops to Tablets and Phones
4.3. Example C, Architecture: The Living Building Challenge
- Building lifespan: 250 years.
- Energy: 1330 m2 (14,300 ft2) solar array generated 60% more electricity than the building used in 2014, 16 kBtu/sq.ft./year Energy Use Index (EUI) compared to 150 kBtu/sq.ft./year national median office building, extensive ground water heat pump system.
- Daylighting: 82% of the interior is infused with natural daylight.
- Water: 56,000 gallon (210,000 liter) cistern (with extensive filtering) for rainwater catchment.
- Transportation: 100 out of 100 WalkScore, bike racks, no automobile parking.
4.4. Example D, Transportation: SANE Mobility Systems
5. Discussion
- The 10× Solar Design Revolution, embracing Boulding’s Third Moderately Cheerful Theorem, a 10× invention of the solar-charged LED lamp to supersede the kerosene lantern; versus,
- Incremental 1.1× or 2× improvements to preserve the incumbency, serving only to validate Boulding’s Second Dismal Theorem, the 1.1× “good money after bad” solution, to convert cars from gasoline to natural gas, or the 2× adaptation of the solar charged electric car to replace the gasoline powered car.
- Stated differently, we have arrived at this point in the human saga with a choice between (1) adhering to the dwindling net energy of fossil fuel sources (e.g., fracking, tar sands, deep offshore) coupled with incrementally more efficient artifacts (1.1× higher CAFÉ standards, 2× better hybrid electric cars), or (2) improving the net energy of solar sourcing devices (solar panels, micro-grid storage) coupled with appliances consuming 10× less energy (solar LED lanterns, solar charged smart phones, passive solar living buildings, SANE transit systems).
- Primitive is living in balance with nature with net energy greater than 1 in the legacy solar economy (nomads, rainforest villagers) which was ubiquitous until perhaps ten thousand years ago, when animal husbandry and irrigation brought more energy into human society. The Solarevolution can provide access to modest energy services that will improve the lives of this population group.
- Poverty is living on the edge of a fossil fuel world, deprived of land for cultivation and lacking sufficient fossil fuels to thrive (slums, shanty towns). The Solarevolution can bring more energy services to this population without exacerbating climate change.
- The climate refugee is living where drought has overtaken the supply of basic nutrients, resulting in net energy less than 1, whereby survival depends upon imported nutrients. The Solarevolution may be the only way to restore stability within this population.
- The Peak Oil refugee is living in chaos, in a world of artifacts dependent on fossil fuels after fossil fuel supplies have dwindled or disappeared (Syria, Yemen). Fossil fuel subsidies will only postpone misery. The Solarevolution must be invoked to restore order within this population.
- Overshoot is living luxuriously in a fossil fuel economy which is destined to collapse; it’s only a matter of time. This large community is especially vulnerable to resource shortages. The Solarevolution is critical to stability of energy-intensive urban communities.
- Rebalance is living lightly on the earth, in a solar economy with ultra-efficient novel devices, unencumbered by the burden of maintaining fossil fuel-hungry artifacts.
6. Conclusions: The 10× Solarevolution
Acknowledgments
Conflicts of Interest
References
- Lovelock, J. The Ages of Gaia: A Biography of Our Living Earth; Oxford University Press: Oxford, UK, 2000. [Google Scholar]
- Daly, H. Economics for a Full World. 2015. Available online: http://www.greattransition.org/publication/economics-for-a-full-world (accessed on 27 March 2016).
- Malthus, T.R. An Essay on the Principle of Population; J. Johnson: London, UK, 1798. [Google Scholar]
- Boulding, K.E. Collected Papers of Kenneth Boulding; Colorado Associated U. Press: Boulder, CO, USA, 1971; Volume 2, p. 137. [Google Scholar]
- Jevons, W.S. The Coal Question; Macmillan and Co.: London, UK, 1865. [Google Scholar]
- Hubbert, M.K. Energy from Fossil Fuels. Science 1949, 109, 103–109. [Google Scholar] [CrossRef] [PubMed]
- Fuller, R. B. Fuller Quote. 1947. Available online: http://quotes.yourdictionary.com/author/buckminster-fuller/159795 (accessed on 13 February 2016).
- Fuller, R.B. R. Buckminster Fuller on Education; University of Massachusetts Press: Amherst, MA, USA, 1979; p. 153. [Google Scholar]
- Wikipedia. Ephemeralization. Available online: https://en.wikipedia.org/wiki/Ephemeralization (accessed on 27 March 2016).
- Huddle, N. Surviving: The Best Game on Earth; Schocken Books: New York, NY, USA, 1984; p. 177. [Google Scholar]
- Wikipedia. Fire. Available online: https://en.wikipedia.org/wiki/Fire (accessed on 27 March 2016).
- Hubbard, E. Good Men and Great: Volume 1 of Little Journeys to the Homes of the Great; W.H. Wise & Company: New York, NY, USA, 1916. [Google Scholar]
- McConnell, B. Solar Energy: This Is What a Disruptive Technology Looks Like. Available online: https://medium.com/@brianmsf/solar-energy-this-is-what-a-disruptive-technology-looks-like-cbc9fdd91209 (accessed 10 August 2016).
- International Energy Agency. Fossil Fuel Subsidy Database. Available online: http://www.worldenergyoutlook.org/resources/energysubsidies/fossilfuelsubsidydatabase/ (accessed on 10 August 2016).
- West Virginia, et al. V EPA, et al. 577 U.S. 15A773, Order in Pending Case, 2016–02–09. Available online: https://www.supremecourt.gov/orders/courtorders/020916zr_21p3.pdf (accessed on 10 August 2016).
- Lawrence Livermore National Laboratory. Energy Flow Charts: Charting the Complex Relationships among Energy, Water, and Carbon. Available online: https://flowcharts.llnl.gov/ (accessed on 10 August 2016).
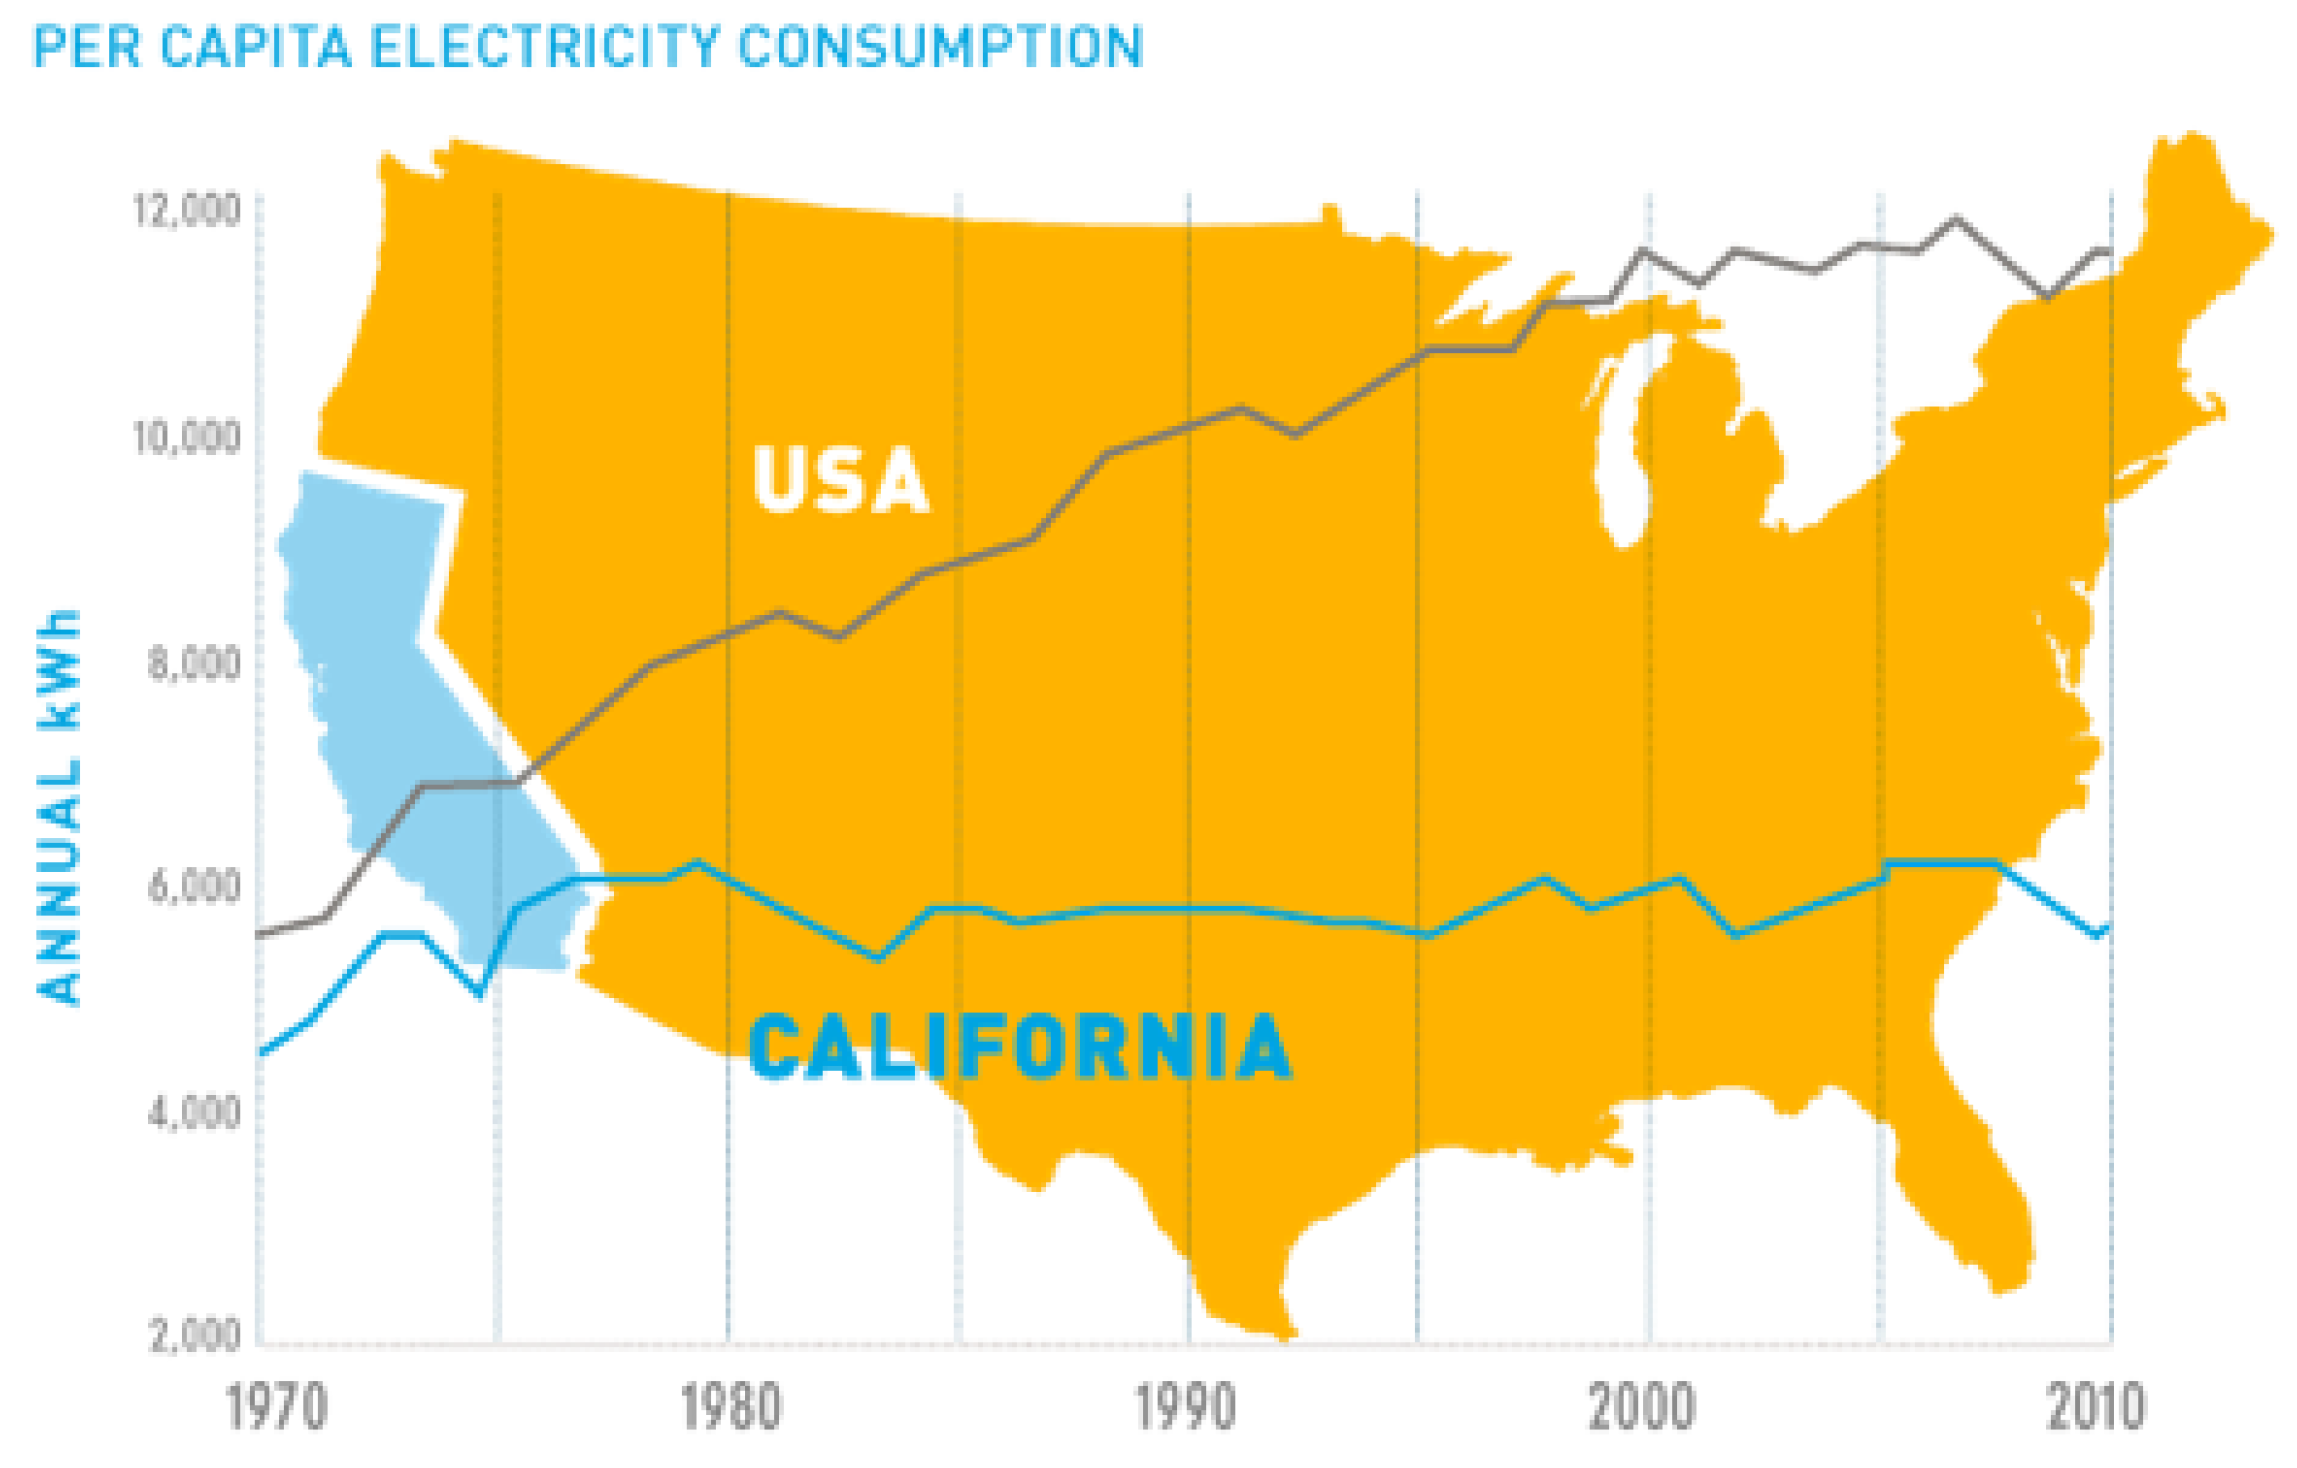
- Wang, D. California Is Proof That Energy Efficiency Works. 18 July 2013. Available online: http://www.greentechmedia.com/articles/read/California-Is-Proof-That-Energy-Efficiency-Works (accessed on 26 December 2015).
- Copernicus, N. De Revolutionibus Orbium Coelestium (On the Revolutions of the Celestial Spheres); Johannes Petreius: Nuremberg, Holy Roman Empire, 1543. [Google Scholar]
- Ren21. Renewables 2014 Global Status Report. Available online: http://www.ren21.net/Portals/0/documents/Resources/GSR/2014/GSR2014_full%20report_low%20res.pdf (accessed on 8 May 2016).
- Perez, R.; Perez, M. A fundamental look at energy reserves for the planet. Int. Energy Agency SHC Programme Sol. Update 2009, 50, 2–3. [Google Scholar]
- Swenson, R. Energy Storage Innovation. 2016. Available online: http://solarnations.blogspot.com/2016/05/energy-storage-innovation.html (accessed on 8 May 2016).
- Fell, H.-J. Die “Energie-Wende”: From nuclear and fossil power to renewable energy sources. In Presented at the Podcar City Conference, Berlin, Germany, 20 September 2012.
- Barth, M. Analysis of GPS-Based Vehicle Activity Data and Their Impact on CO2 Emissions. Center for Environmental Research and Technology, University of California Riverside, U.S.A., 2007; p. 15. Available online: http://www.arb.ca.gov/research/seminars/barth/barth.pdf (accessed on 18 August 2016). [Google Scholar]
- Swenson, R. How Can We Turn Sun Radiation into Automotion? 6 November 2007. Available online: http://www.solarevolution.com/PRT/Sweden/SunPodcarsStockholm20071006.pdf (accessed on 26 June 2016).
- James, W. Net Energy Decline. Available online: http://jpods.com/node/212 (accessed on 26 June 2016).
- Hall, C.; Lambert, J. The Balloon Diagram and Your Future; SUNY College of Environmental Science and Forestry: Syracuse, NY, USA, 2009. [Google Scholar]
- Hall, C.A.S.; Lambert, J.G.; Balogh, S.B. EROI of different fuels and the implications for society. Energy Policy 2014, 64, 141–152. [Google Scholar] [CrossRef]
- Lambert, J.; Lambert, G. Life, Liberty, and the Pursuit of Energy: Understanding the Psychology of Depleting Oil Resources; Karnak Books: London, UK, 2016; in preparation. [Google Scholar]
- Marco, R.; Fullana-i-Palmer, P.; Fthenakis, V. The energy return on energy investment (EROI) of photovoltaics: Methodology and comparisons with fossil fuel life cycles. Energy Policy 2012, 45, 576–582. [Google Scholar]
- Hall, C.A.; Cleveland, C.J. Petroleum drilling and production in the United States: Yield per effort and net energy analysis. Science 1981, 211, 576–579. [Google Scholar] [CrossRef] [PubMed]
- Prieto, P.A.; Hall, C. Spain’s Photovoltaic Revolution, The Energy Return on Investment; Springer-Verlag: New York, NY, USA, 2013. [Google Scholar]
- Bhandari, K.P.; Collier, J.M.; Ellingson, R.J.; Apul, D.S. Energy Payback Time (EPBT) and Energy Return on Energy Invested (EROI) of Solar Photovoltaic Systems: A Systematic Review and Meta-Analysis. Renew. Sustain. Energy Rev. 2015, 47, 133–141. [Google Scholar] [CrossRef]
- Green Rhino Energy. Impact of Shading. Available online: http://www.greenrhinoenergy.com/solar/performance/shading.php (accessed on 8 May 2016).
- Swenson, R. What Percentage of Our Energy Demand Can Be Replaced by Renewables? 2011-06-04. Available online: http://solarnations.blogspot.com/2011/06/what-percentage-of-our-energy-demand.html (accessed on 26 June 2016).
- Power for All. Available online: http://www.solar-aid.org/power-for-all/ (accessed on 26 June 2016).
- Anonymous. D.Light S2: The Learning Light. Available online: http://www.dlight.com/solar-lighting-products/single-function/dlight-s2/ (accessed on 25 June 2016).
- Opower. How Much Does It Cost to Charge an iPhone 5? A thought-Provokingly Modest $0.41/year. Available online: https://blog.opower.com/2012/09/how-much-does-it-cost-to-charge-an-iphone-5-a-thought-provokingly-modest-0–41year/ (accessed on 27 March 2016).
- The Bullitt Foundation. The Greenest Commercial Building in the World. Available online: http://www.bullittcenter.org/ (accessed on 18 January 2016).
- Furman, B. Innovating Automatic Transit Technologies with Students. ATRA Pulse. Available online: http://www.advancedtransit.org/wp-content/uploads/2016/01/ATRA-Pulse-Article-for-January-2016-Innovating-Automated-Transit-Technology-With-Students.pdf (accessed on 27 March 2016).
- Photomontage of Podcar and Guideway on King Street at Bay Street; The International Institute of Sustainable Transportation: Santa Cruz, CA, USA, 2015.


© 2016 by the author; licensee MDPI, Basel, Switzerland. This article is an open access article distributed under the terms and conditions of the Creative Commons Attribution (CC-BY) license (http://creativecommons.org/licenses/by/4.0/).
Share and Cite
Swenson, R. The Solarevolution: Much More with Way Less, Right Now—The Disruptive Shift to Renewables. Energies 2016, 9, 676. https://doi.org/10.3390/en9090676
Swenson R. The Solarevolution: Much More with Way Less, Right Now—The Disruptive Shift to Renewables. Energies. 2016; 9(9):676. https://doi.org/10.3390/en9090676
Chicago/Turabian StyleSwenson, Ron. 2016. "The Solarevolution: Much More with Way Less, Right Now—The Disruptive Shift to Renewables" Energies 9, no. 9: 676. https://doi.org/10.3390/en9090676