Article

The Energy and Environmental Performance of Ground-Mounted Photovoltaic Systems—A Timely Update

1
Department of Science and Technology, Parthenope University of Naples, Centro Direzionale-Isola C4, Naples 80143, Italy
2
Department of Mechanical Engineering and Mathematical Sciences, Oxford Brookes University, Wheatley OX33 1HK, UK
3
Center for Life Cycle Analysis, Columbia University, New York, NY 10027, USA
4
Photovoltaic Environmental Research Center, Brookhaven National Laboratory, Upton, NY 11973, USA
*
Author to whom correspondence should be addressed.
Energies 2016, 9(8), 622; https://doi.org/10.3390/en9080622
Submission received: 26 May 2016 / Revised: 4 July 2016 / Accepted: 27 July 2016 / Published: 8 August 2016
(This article belongs to the Special Issue Life-Cycle Assessment of Energy Systems in Current and Evolving Grids)

Abstract

:
Given photovoltaics’ (PVs) constant improvements in terms of material usage and energy efficiency, this paper provides a timely update on their life-cycle energy and environmental performance. Single-crystalline Si (sc-Si), multi-crystalline Si (mc-Si), cadmium telluride (CdTe) and copper indium gallium diselenide (CIGS) systems are analysed, considering the actual country of production and adapting the input electricity mix accordingly. Energy pay-back time (EPBT) results for fixed-tilt ground mounted installations range from 0.5 years for CdTe PV at high-irradiation (2300 kWh/(m2·yr)) to 2.8 years for sc-Si PV at low-irradiation (1000 kWh/(m2·yr)), with corresponding quality-adjusted energy return on investment (EROIPE-eq) values ranging from over 60 to ~10. Global warming potential (GWP) per kWhel averages out at ~30 g(CO2-eq), with lower values (down to ~10 g) for CdTe PV at high irradiation, and up to ~80 g for Chinese sc-Si PV at low irradiation. In general, results point to CdTe PV as the best performing technology from an environmental life-cycle perspective, also showing a remarkable improvement for current production modules in comparison with previous generations. Finally, we determined that one-axis tracking installations can improve the environmental profile of PV systems by approximately 10% for most impact metrics.

Graphical Abstract

1. Introduction

Nowadays, one of the most important environmental challenges is to reduce the use of fossil fuels, such as coal, oil, and natural gas, and the associated greenhouse gas (GHG) emissions into the atmosphere. In particular, electricity and heat production accounts for one quarter of the world’s GHG emissions [1]; in parallel with this, United Nations projections show that world population is growing significantly, as are the related rates of per capita consumption [2].
Meanwhile, the global solar photovoltaic (PV) market has been growing rapidly to address this issue and to meet the increasing demand for green power; PV’s cumulative installed capacity at the end of 2015 was 227 GWp [3], resulting from 100-fold growth over 14 years of development. The compound annual growth rate (CAGR) of PV installations was 44% between 2000 and 2014. The market in Europe has progressed from 7 GWp in 2014 to around 8 GWp in 2015, while in the US it has grown to 7.3 GWp, with large-scale and third-party ownership dominating. China and Japan have become the biggest PV markets with annual (2014) deployments of 11 GWp and 9.5 GWp respectively, and corresponding cumulative capacities of 28.2 GWp and 23.3 GWp [3]. In addition, several established markets have confirmed their maturity, including Korea with 1.0 GWp, Australia with 0.9 GWp, and Canada with 0.6 GWp [3].
PV systems may be classified into first, second, and third generation technologies—first generation technologies are based on single- and multi-crystalline silicon (c-Si); second generation technologies consist of thin film technologies such as amorphous silicon (a-Si), multi-junction thin silicon film (a-Si/µc-Si), cadmium telluride (CdTe), copper indium (di)selenide/(di)sulphide (CIS), and copper indium gallium (di)selenide/(di)sulphide (CIGS); third generation technologies include concentrator PVs, organics, and others [4].
Within this variety of technologies, Si-wafer based (first generation) technologies account for approximately 92% of total production, while CdTe PV represents the largest contributor to non-silicon based PV systems. Currently, the market for CdTe PV is still virtually dominated by a single producer, First Solar (Springerville, AZ, USA), with over 10 GW installed worldwide [5].
Generally, PV systems can be mounted on roof tops—commonly named building adapted photovoltaic (BAPV) systems, and they can be integrated into building facades or roofs—also referred to as building integrated photovoltaic (BIPV) systems, or they can be mounted on frames directly on the ground.
There has been constant improvement in the material and energy efficiency of PV cells and panels [6,7,8,9,10,11,12,13,14]; therefore, an up-to-date estimate of the energy and environmental performance of PV technologies is of key importance for long-term energy strategy decisions.
This paper provides such an update from both the life cycle assessment (LCA) and net energy analysis (NEA) perspectives for the main commercially relevant large-scale PV technologies as of today [3], namely: single-crystalline Si (sc-Si), multi-crystalline Si (mc-Si), CdTe, and CIGS.

2. Methodology

2.1. Life Cycle Assessment

LCA is a discipline widely used in the scientific community and it is considered to be the most comprehensive approach to assessing the environmental impact and overall efficiency of a product or a system throughout all stages of its life cycle. LCA takes into account a product’s full life cycle from the extraction of resources and the production of raw materials, to manufacturing, distribution, use and re-use, maintenance, and finally recycling and disposal of the final product—including all transportation and use of energy carriers. Since its inception and first standardization by the society of environmental toxicology and chemistry (SETAC) [15], LCA has become more and more complex, eventually leading to International Organization for Standardization (ISO) Standards 14040 and 14044 [16,17]. The latter are followed here, as well as the more PV-specific guidelines provided by the International Energy Agency (IEA) [18].
Besides addressing a number of environmental impact categories, such as global warming, ozone depletion, and acidification, LCA also allows the calculation of the total primary energy (PE) harvested from the environment in order to produce a given amount of end product (i.e., electricity in the case of PV), commonly named cumulative energy demand (CED) [19].
In the case of a PV system, the CED is thus defined as:
CED = (PE + Inv)/Outel
where PE is the primary energy (sunlight) directly harvested from nature by the PV system and converted into electricity over its entire lifetime; Inv is the additional PE indirectly “invested” in order to produce, deploy, maintain, and decommission the PV system; Outel is the total energy output over the PV system’s lifetime, in units of electricity.
The main indication provided by the CED is related to the system’s efficiency in using PE resources. However, consistent with LCA’s long-term focus, the CED makes no differentiation between the energy that is directly extracted, delivered, and transformed (PE) and the energy that needs to be invested in order to do so (Inv).

2.2. Net Energy Analysis

NEA offers an alternative point of view on the performance of energy production systems such as PVs: it evaluates how effective (as contrasted to efficient) a system is at exploiting PE resources and converting them into usable energy carriers. In other words, the purpose of NEA is to quantify the extent to which a given system or process is able to provide a positive energy surplus to the end user, also referred to as net energy gain (NEG), after accounting for all the energy losses occurring along process chains (such as extraction, transformation, delivery, and others) as well as for all the additional energy investments that are required in order to carry out the same chain of processes [20,21,22,23,24,25,26].
The principle metric of NEA is the energy return on investment (EROI), which is calculated as the ratio of the energy delivered to society to the sum of energy carriers diverted from other societal uses. Specifically, for a PV system [27], and using the same nomenclature as in Equation (1):
EROIel = Outel/Inv
also:
EROIPE-eq = OutPE-eq/Inv = (OutelG)/Inv
where OutPE-eq is the energy delivered to society in units of equivalent PE; ηG is the life cycle energy efficiency of the electricity grid of the country or region where the analysed PV system is deployed (calculated as the ratio of the yearly electricity output of the entire grid to the total PE harvested from the environment for the operation of the grid in the same year).
At the very minimum, the EROIPE-eq of an electricity production system must be higher than 1, i.e., the system must ensure the provision of a positive net energy gain (NEG) to the end user:
NEG = OutPE-eqInv
In fact, it is actually important that the system has a sufficiently large EROI, beyond unity. In other words, EROIPE-eq > 1 (implying NEG > 0) is a necessary but not sufficient condition, given that the purpose of an electricity production system is to contribute to the support of the entire energy metabolism of a modern society, and not just to provide enough net energy to support itself [28,29,30].
The accurate quantification of the minimum EROIPE-eq that makes a technology viable depends on a number of factors related to the energy supply mix for each country considered, and is beyond the scope of this paper. In any case, it is important to keep in mind the all-important non-linear relation of EROIPE-eq to the actual ratio of net–to–gross (NTG) energy output:
NTG = (OutPE-eqInv)/OutPE-eq = (EROIPE-eq − 1)/EROIPE-eq
The energy pay back time (EPBT) is also calculated for each PV technology considered. EPBT measures how many years it takes for the PV system to return an amount of electricity that is considered to be equivalent to the PE invested. In other words, the EPBT is the time after which the system is able to provide a positive NEG. Operationally:
EPBT = Inv/[(Outel/T)/ηG)] = T/EROIPE-eq
where T is the lifetime of the PV system, measured in years.
In this paper, the calculations of EROIPE-eq and EPBT are based on a generalized average grid mix efficiency (ηG ≈ 0.30), assuming a common grid mix largely reliant on thermal technologies. This is in order to provide sufficiently generic information and to ensure that the comparison of all the analysed technologies is consistent both internally and externally with most other literature reviews. In other words, this means that the two metrics (EROIPE-eq and EPBT) do not refer to any specific country with its own electricity grid mix, but to a theoretical average representative mix, and that in order to be strictly applicable to a specific country, their values would have to be adapted based on the real life-cycle efficiency of its grid.

2.3. Data Sources and Scope

In order to carry out the analysis in the most consistent way possible, all the performance indicators were calculated based on the same underlying inventory data. The main background data source was the Ecoinvent V3.1 Database (Ecoinvent, Zurich, Switzerland) [31]; whenever needed, the data were adapted to the actual production conditions in order to be as accurate and realistic as possible. In particular, the latest electricity generation mixes of the countries of production were used.
Regarding the foreground inventory, all the outputs were estimated based on the latest available data. For CdTe PV, the most up-to-date production data were provided directly by First Solar, who also provided information on the balance of system (BOS) for typical ground-mounted installations (this same installation type was extended to apply to all other technologies too). For c-Si PV and CIGS technologies, the inventory data source was the latest IEA-photovoltaic power systems (PVPS) Task 12 Report [32].
In particular, the latter refers to a literature study published in 2014 but reporting data from 2011 [33]. This means that the original inventory database used for our c-Si analysis is ultimately not very recent—but it is still the most up to date reliable source of information available. Also, in our analysis, the efficiencies of all the PV technologies as well as the electric mixtures used in the Si supply chain and for PV module production (Section 3.2) have been updated to reflect the current (2015) situation.
End of life (EOL) management and decommissioning of the PV systems were not included in this work because these depend of a number of factors and specific conditions, such as the exact location of the PV plant, the type of PV panel, transport costs, logistic criteria, production quantities, weight per Wp, and others [34]—and making specific assumptions in this regard would not be consistent with the aim of the paper to provide an average worldwide high-level point of view. However, including EOL stages may in fact not result in a worsening of the overall energy and environmental performance, since the recycling of the PV components can often provide environmental and economic benefits, especially for c-Si PV panels, given the high value of recycled aluminium and silicon [35].
The contribution of energy storage is likewise not included in our analyses. First, since the main focus is on a high-level comparison between a range of different PV technologies—not an analysis of specific countries and particular locations—energy storage is beyond the scope of this paper. Secondly, many electricity production technologies, including but not limited to PVs, are unable to single-handedly follow the dynamics of societal electricity demand. Hence, energy storage deployment is required at grid level—rather than for each electricity generation technology taken in isolation [36]. Thirdly, even when performing an analysis at grid level, it is recommended to take into account the smoothing effect produced by the combination of renewable energy sources, such as PV and wind [37].
Finally, from a practical standpoint, the analysis was performed using the LCA software package SimaPro 8 (Pré Consultants, Amersfoort, The Netherlands) [38]—and impact assessment was performed by means of the CML method developed by Leiden University in the Netherlands [39].

3. System Descriptions

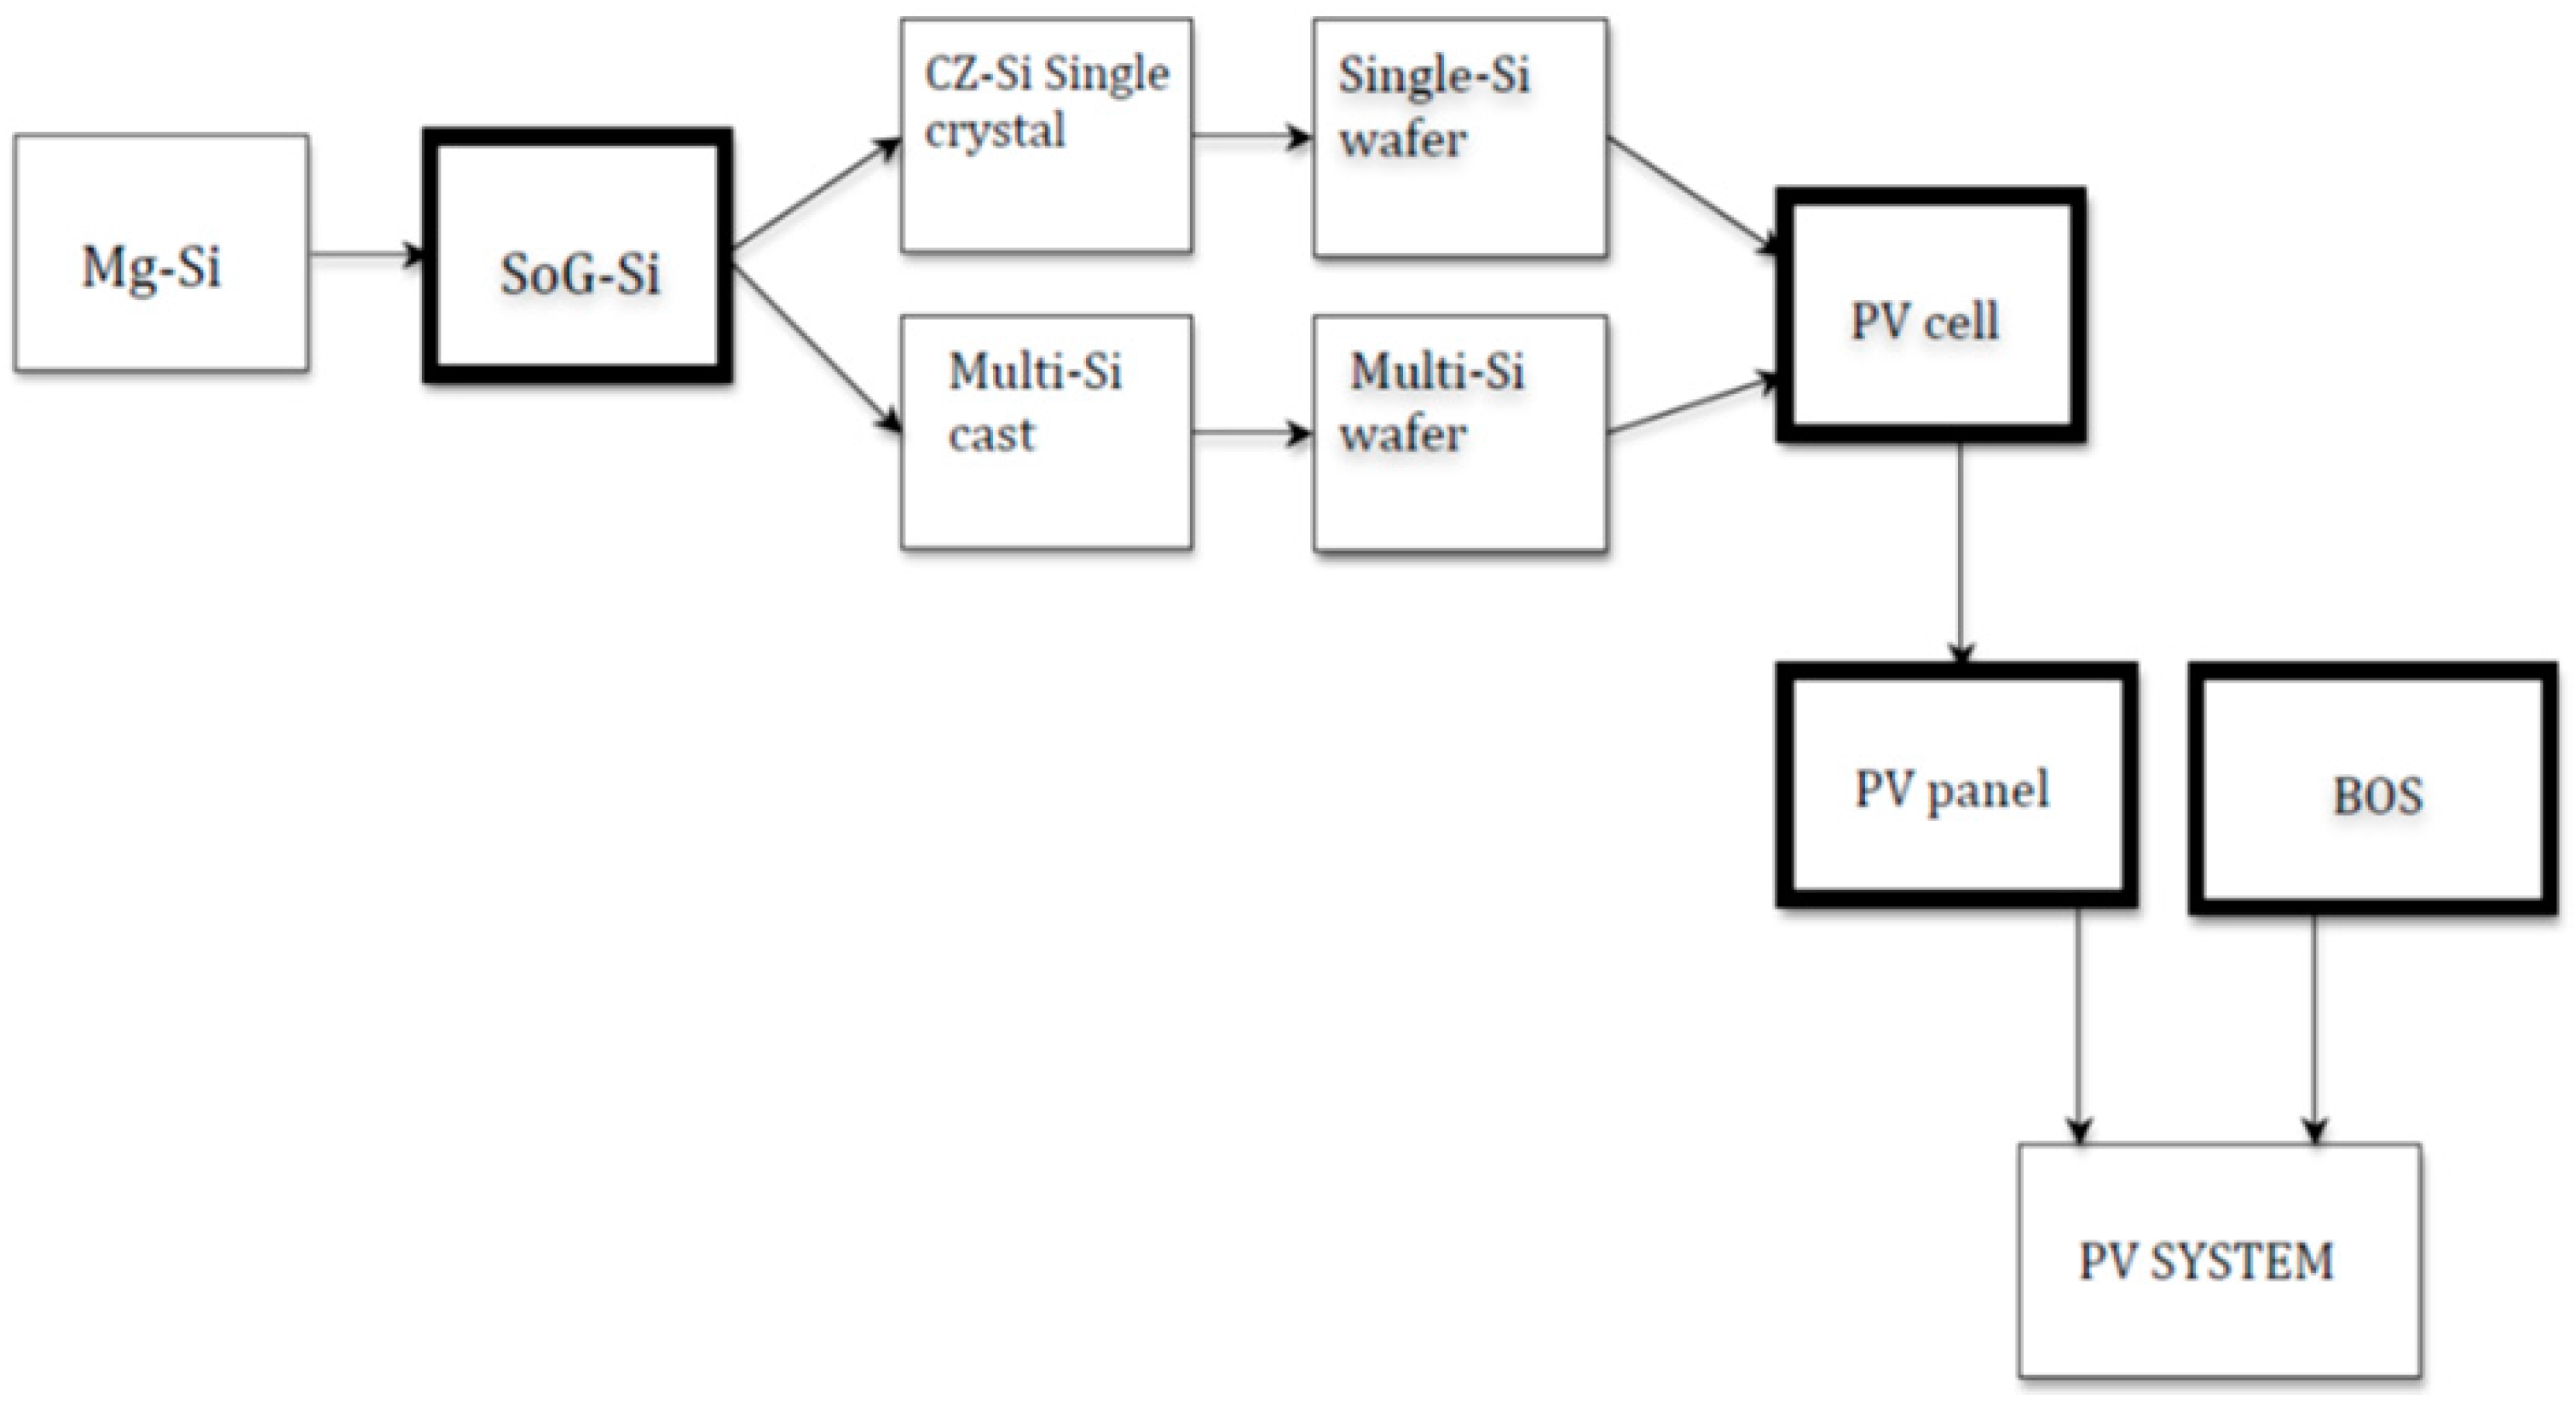
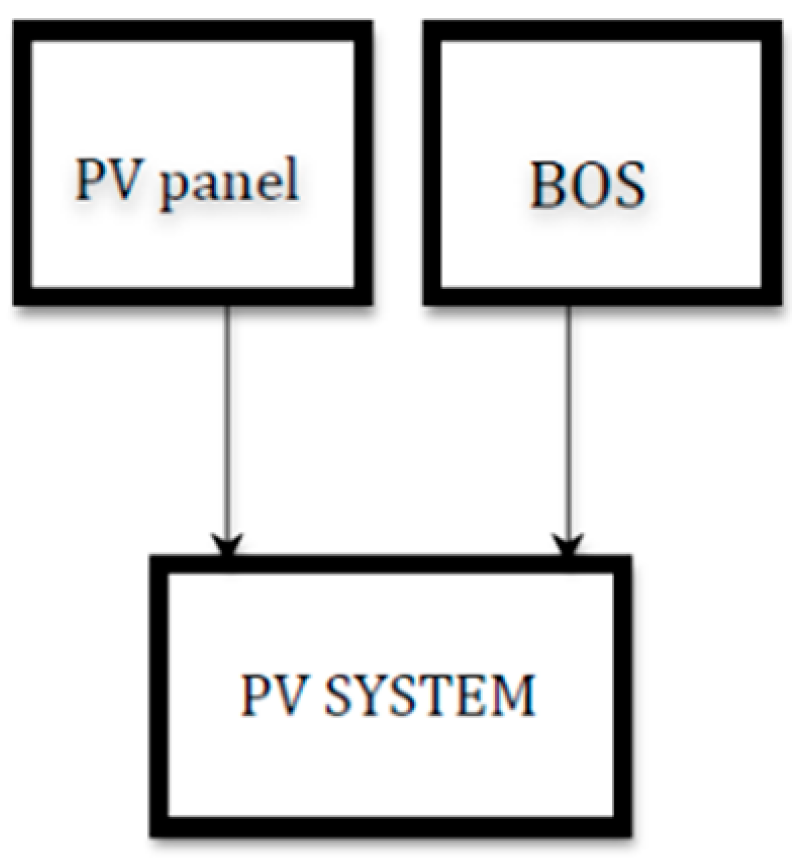
3.1. Photovoltaic System Process Stages

The PV systems analysed are composed of PV panels and BOS (mechanical and electrical components such as inverters, transformers, and cables, as well as system operation and maintenance). The PV panel technologies considered are: sc-Si, mc-Si, CdTe, and CIGS.
In particular, with regard to c-Si manufacturing, there are more steps to arrive at the final product in comparison with thin-film PVs (CdTe and CIGS), and a comparatively large amount of energy is required for the production of crystalline silicon [10,31].
Figure 1 and Figure 2 show the respective flow diagrams for the c-Si and thin film PV systems. In particular, Figure 1 illustrates each step of the manufacturing chain for sc-Si and mc-Si PV panels. After the metallurgical (MG) and solar grade (SoG) Si production stages, mc-Si ingots are cast and sawn into wafers: sc-Si PV cells additionally require an intermediate Czochralski (CZ) recrystallization step. Then, the individual PV cells are encapsulated between glass panes and assembled into framed PV panels, and finally the PV system is completed by the addition of the BOS. In contrast, Figure 2 shows that the simpler flow diagrams for CdTe and CIGS technologies. Incidentally, the thin film PV panels are also glass-glass sandwiches, but devoid of metal frames.

3.2. Production Sites and Electricity Mixes

Each analysed PV system is also classified by country of production. The c-Si PV production chain is classified into three main producing regions: Europe, China, and the USA, according to the data source used [32]. The sc-Si and mc-Si wafers used in Chinese PV manufacturing are entirely sourced domestically; of those used in US PV manufacturing, 66% are produced in China and 34% domestically; and for those used in European PV manufacturing, 89% is produced locally and 11% in China. Regarding CdTe PV panels, the two production countries as of 2016 are Malaysia and the USA, in accordance with the data provided by the leading company in this sector (First Solar). The main production countries for CIGS PV are Japan (Solar Frontier) [40], to which our analysis refers, and China (Hanergy). All further upstream steps in the Si supply chain are analysed considering their actual geographical location—for instance, the production of MG-Si is divided among the main global producers, i.e., China, Russia, Norway and the United States [41].
The individual local updated electricity mixes used for all PV module manufacturing and for the Si supplying countries are also considered in our analysis, since they influence the amount of PE ultimately required for each production process, as well as the associated environmental impacts (Norwegian and Japanese data from the IEA [42]; Chinese and USA data from the U.S. Energy Information Administration (EIA) [43]; Russian and European data from the World Bank (world development indicators) [44]; Malaysian data from the Peninsular Malaysia electricity supply industry outlook [45].)

4. Results and Discussion

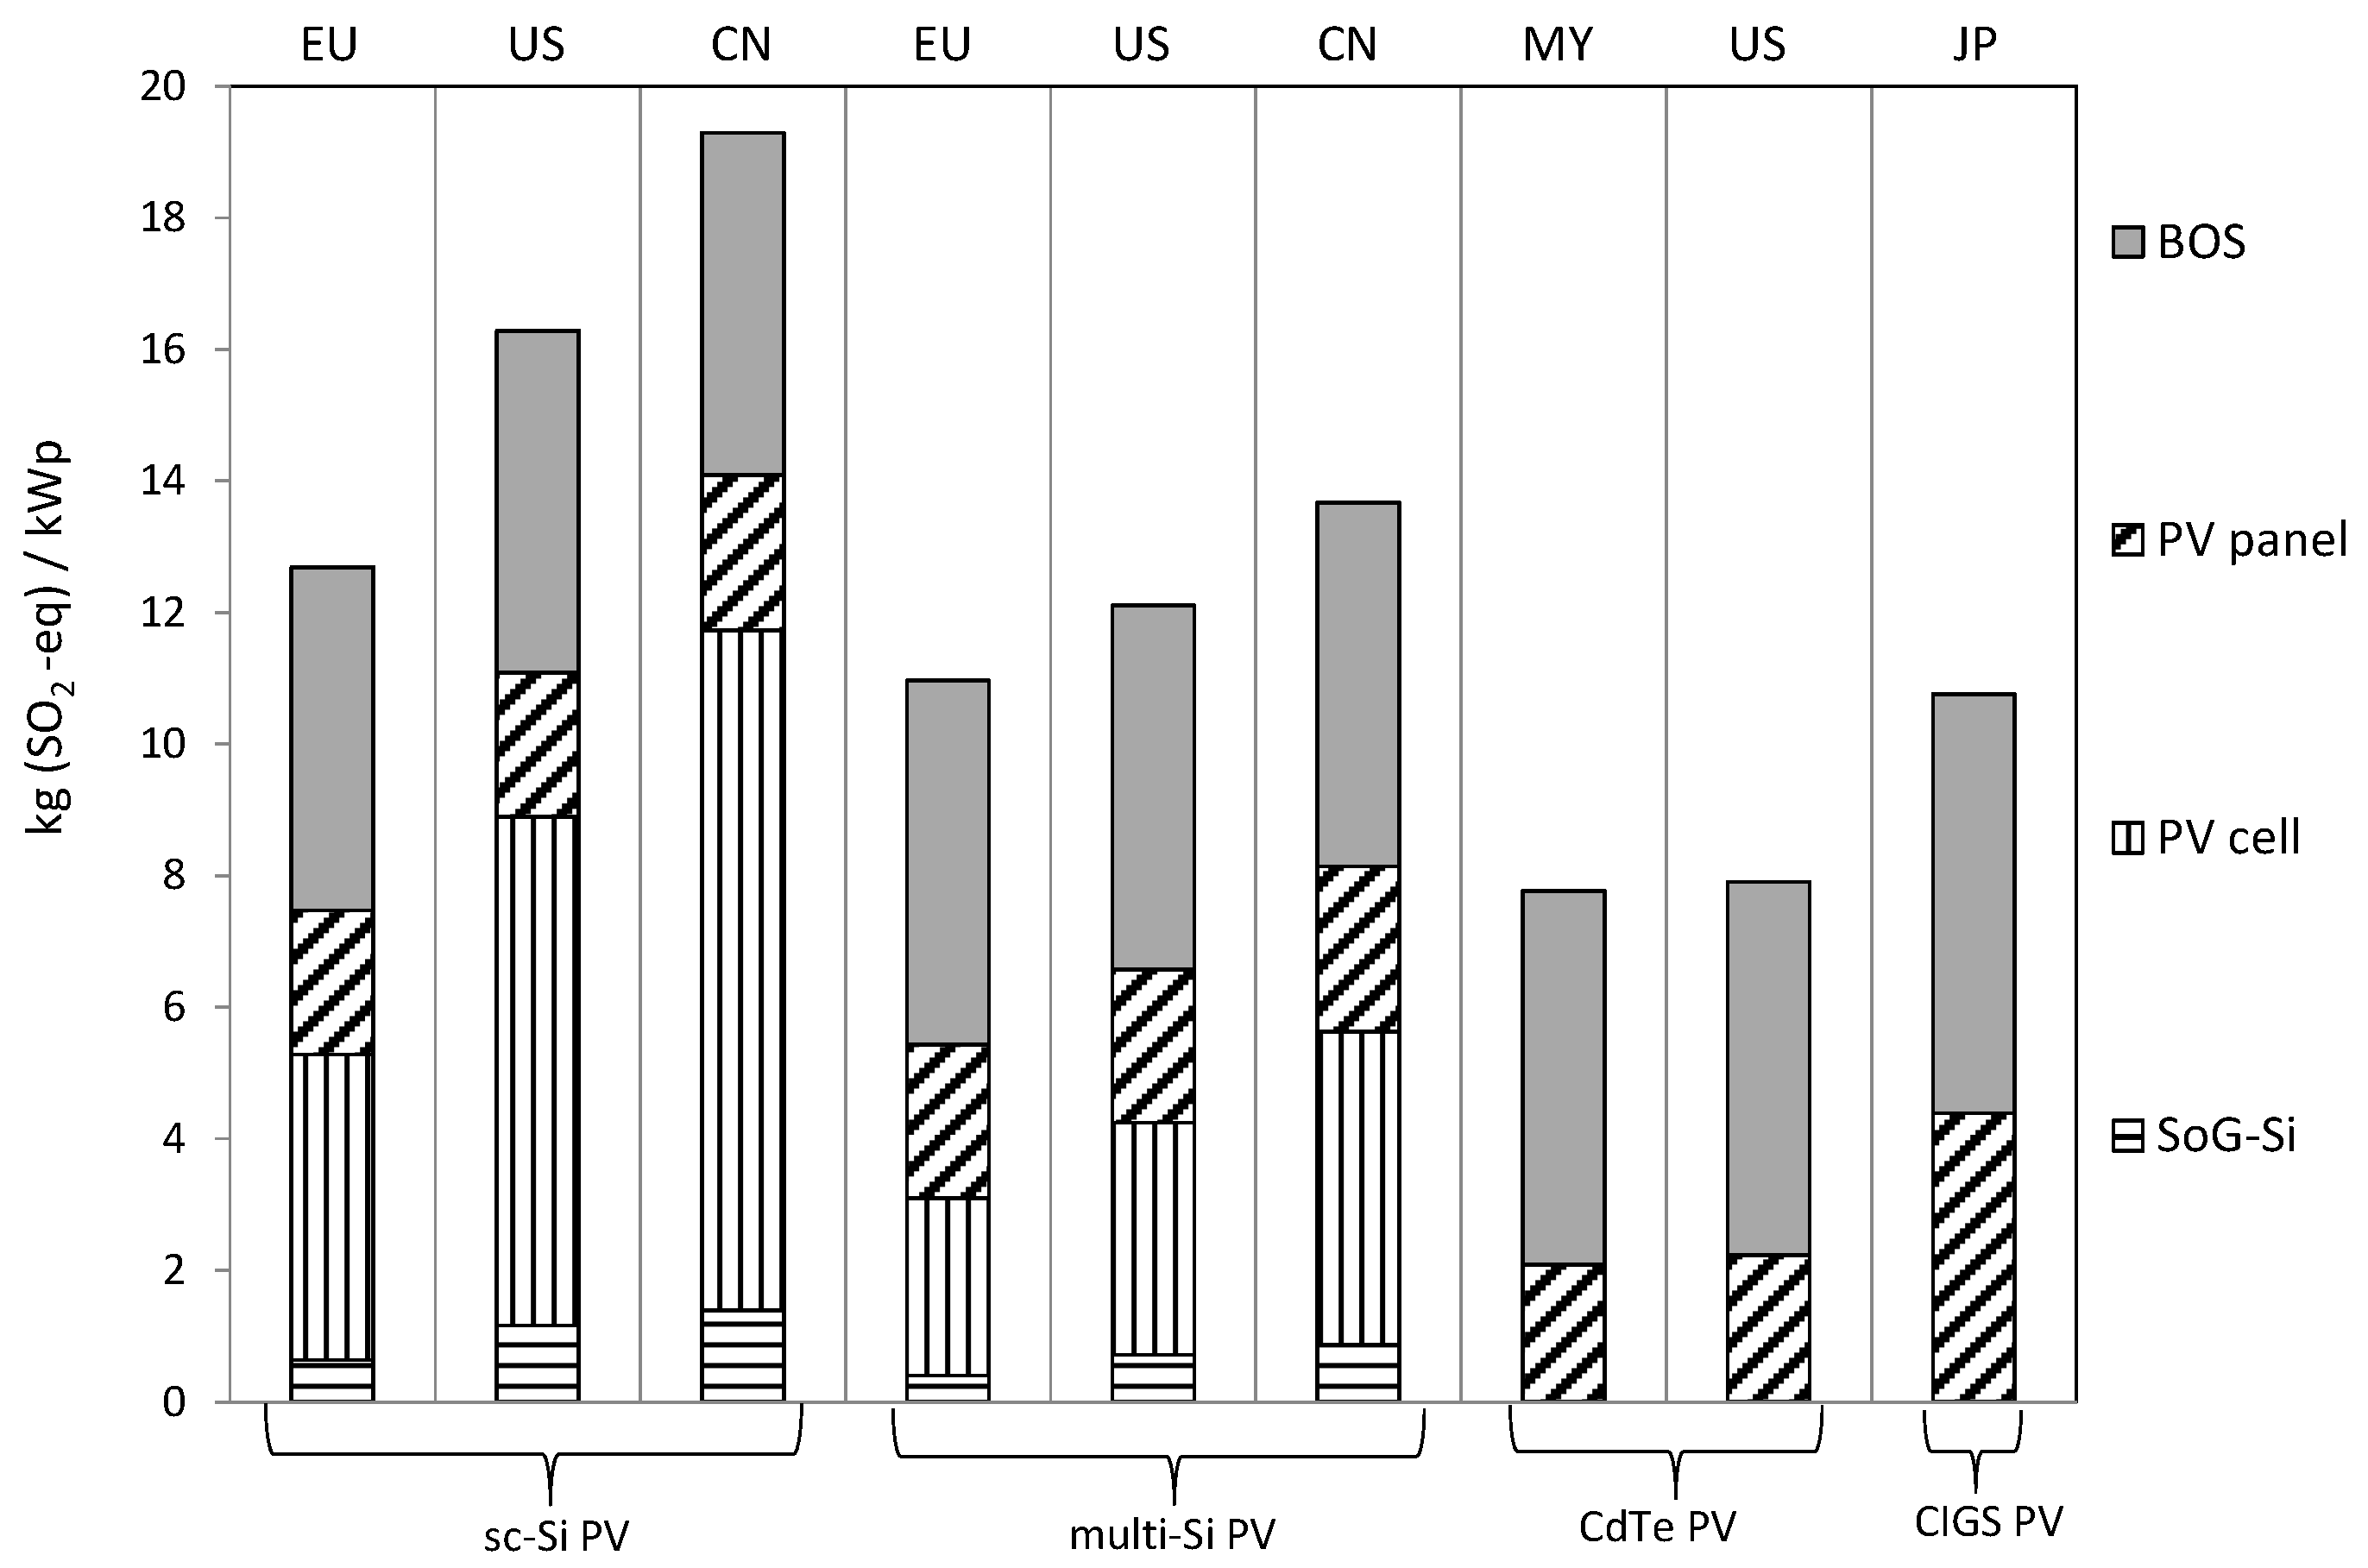
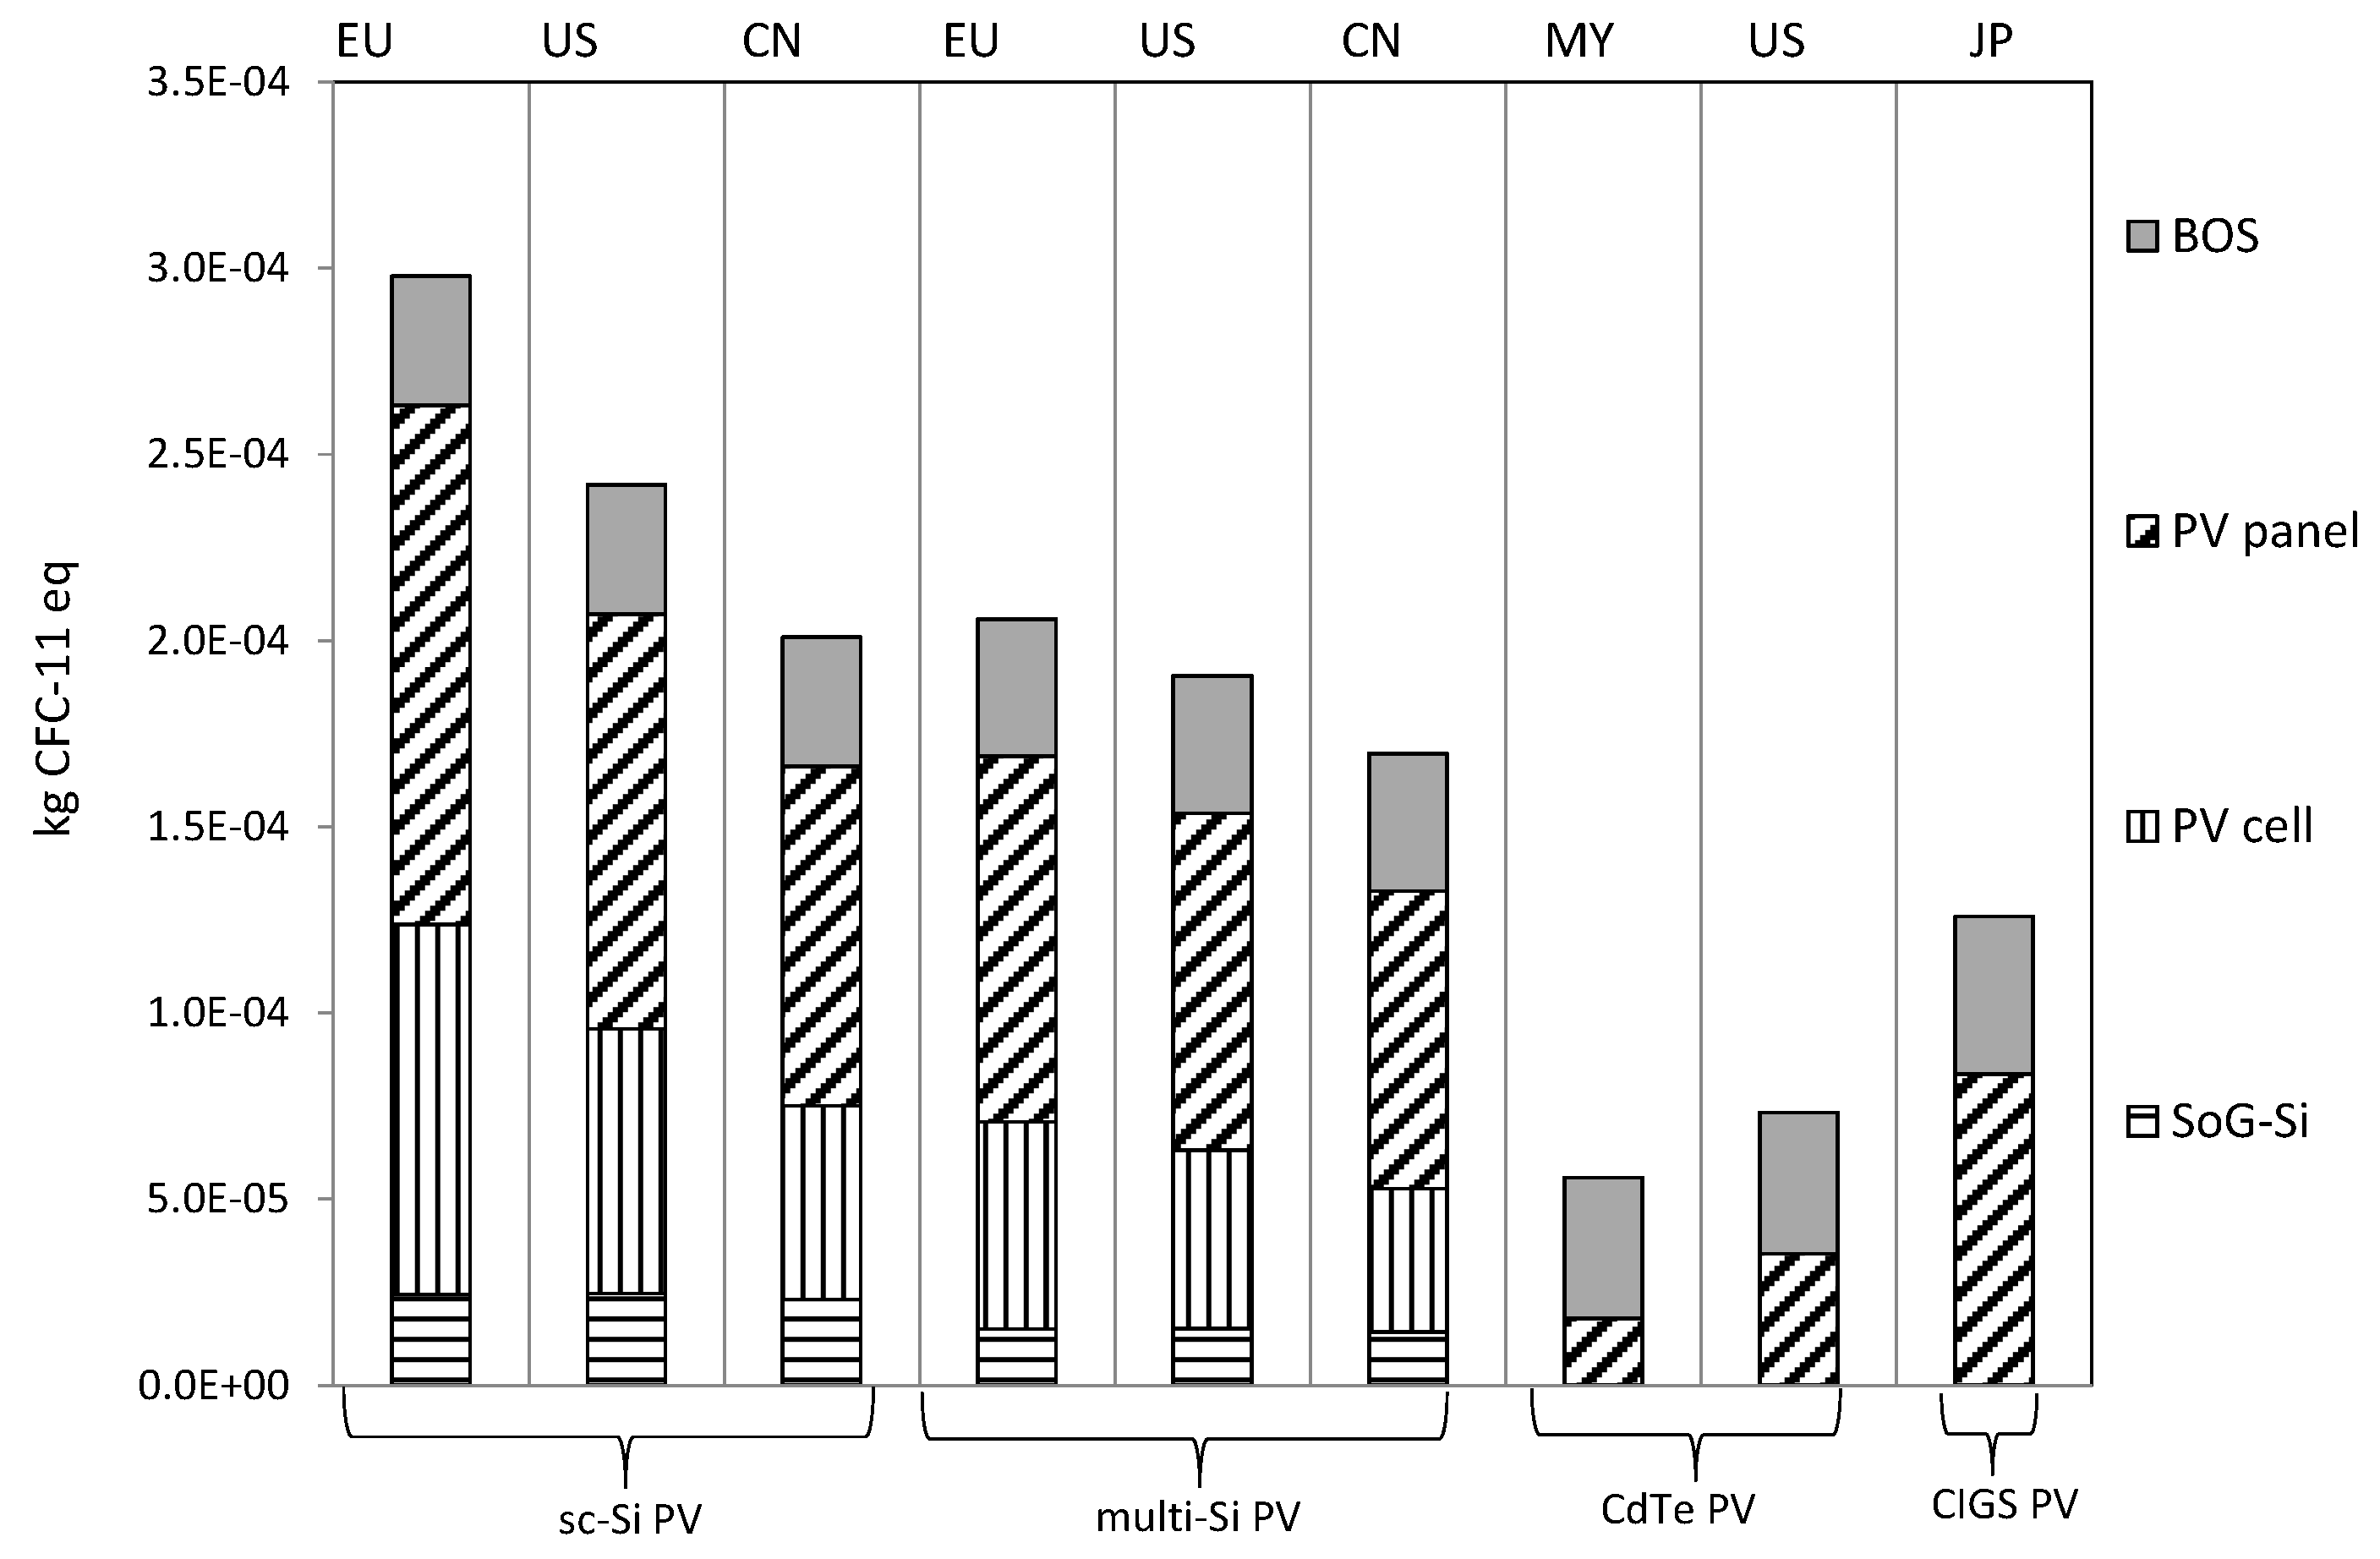
4.1. Fixed-Tilt Ground-Mounted Photovoltaic Systems

Figure 3 shows the CED of the analysed PV systems, while Figure 4, Figure 5 and Figure 6 illustrate the respective LCA impact indicators, namely global warming potential (GWP), acidification potential (AP), and ozone depletion potential (ODP), all expressed per kWp—the stacked bars show the individual contributions of the main life cycle stages. Each PV technology is also shown separately according to the country or region in which it was manufactured. The average efficiency for each technology is assumed in accordance with the latest report by the Fraunhofer Institute for Solar Energy Systems [40], specifically: 17% for sc-Si PV, 16% for mc-Si, 15.6% for CdTe PV, and 14% for CIGS PV.
The results clearly show that the most impacting step for c-Si technologies is from SoG-Si supply to finished PV cells, which includes ingot/crystal growth and wafer and cell production, and especially so in the case of sc-Si PV systems (because of the energy intensive CZ crystal growth process).
Figure 3 highlights that, per kWp, c-Si PV systems are overall twice as energy-demanding to produce as CdTe PV systems. Figure 4 illustrates the resulting GWP indicator per kWp: c-Si PV technologies generally have higher values in comparison with thin film PV panels, and in particular, the lowest GWP values are for CdTe PV, especially when production takes place in Malaysia. A similar trend is shown in Figure 5, in which the lower values of AP per kWp are those for CdTe PV, and secondly for CIGS PV; conversely, sc-Si PV shows the highest AP values, followed by mc-Si PV. Also in terms of ODP results (Figure 6), CdTe PV is still the best performer, followed by CIGS PV, and then mc-Si and sc-Si PV.
These new results show a remarkable improvement for current production CdTe PV modules when compared to similar modules produced in 2005 (the most recent production year for which CdTe PV inventory data are directly available in the Ecoinvent V3.1 Database). Over one decade, the CED per kWp for the CdTe PV modules manufactured in the US has been reduced by approximately 62%, while the GWP, ODP, and AP results are also down by respectively 63%, 65%, and 71%. The current CdTe PV systems also show improvements when compared to previously published results [46] referring to more recent (2010–2011) production data; in this case the CED is down by approximately 30%, and the GWP is down by 37%.
It is noted, however, that the CED of complete ground-mounted CdTe PV systems are not much lower than previously reported values, because the new inventory data for the ground-mounted BOS provided by First Solar led to a higher energy demand (831 MJ/m2) than the previously used data from the c-Si PV BOS (542 MJ/m2, First Solar) [47]. The same also applies to the calculated EPBT values (Table 1).
From a geographical perspective, it is also clear from the results that the considered impact indicators (GWP, AP, ODP) are generally lower when the manufacturing takes place in Europe in comparison with the USA and China, and in particular the Chinese production chain consistently shows the highest indicator values. This is despite the fact that the CED associated to the Chinese c-Si PV production is actually slightly lower than that for the European and USA manufacturing chains—this seeming incongruence depends on the large reliance of the Chinese electric grid on coal [43]. The input grid mix composition is also responsible for a significant share of the impacts in the case of CIGS PV produced in Japan (a country where, after the 2011 nuclear incident in Fukushima, over 90% of the energy resources used for electricity generation are fossil fuels [42]).
The BOS contribution is generally fairly low, with the partial exception of the AP results, which are negatively affected by the comparatively large amounts of copper and aluminium required.
Figure 7, Figure 8, Figure 9 and Figure 10 then illustrate the same results (CED, GWP, AP and ODP) expressed per kWhel. These results are computed assuming a performance ratio of 0.8 and a lifetime of 30 years [18]. Also, in order to provide results applicable to different contexts, three different irradiation levels are used, which are respectively representative of irradiation on a south-facing, latitude-tilted plane in Central-Northern Europe (1000 kWh/(m2·yr)), Central-Southern Europe (1700 kWh/(m2·yr)), and the Southwestern United States (2300 kWh/(m2·yr)). In the figures, different symbol sizes (small, medium, and large, respectively) are used to refer to these three specific irradiation levels.
Unsurprisingly, the best energy and environmental performance as measured by all considered metrics is that of CdTe PV systems installed in the Southwestern US, with CIGS PV as a close second. At the other end of the scale, the highest impact in terms of GWP and AP are those for the Chinese produced sc-Si PV, mainly due to this technology’s higher demand for input electricity, coupled with the prominence of coal in the Chinese electricity grid mix.
As illustrated in Table 1, the energy pay-back times of the analysed PV technologies were found to range from 6 months (for CdTe PV installed in the US South-West) to approximately 2–3 years (for c-Si PV installed in Central-Northern Europe).
Figure 11 illustrates the positioning of the analysed PV systems along the curve defined by the non-linear relation of EROIPE-eq to NTG (often referred to as the “net energy cliff” [48]). This figure makes it abundantly clear that, while the individual EROIPE-eq values for the different PV systems over the three considered irradiation levels span a comparatively large range—from ~10 for sc-Si PV at 1000 kWh/(m2·yr) to ~60 for CdTe PV at 2300 kWh/(m2·yr)—in fact, all data points sit on what may be considered the “safe”, quasi-horizontal portion of the “cliff”. In other words, all PV systems afford the benefit of over 90% of their gross energy output being available as net usable energy to the end user (NTG > 0.9).

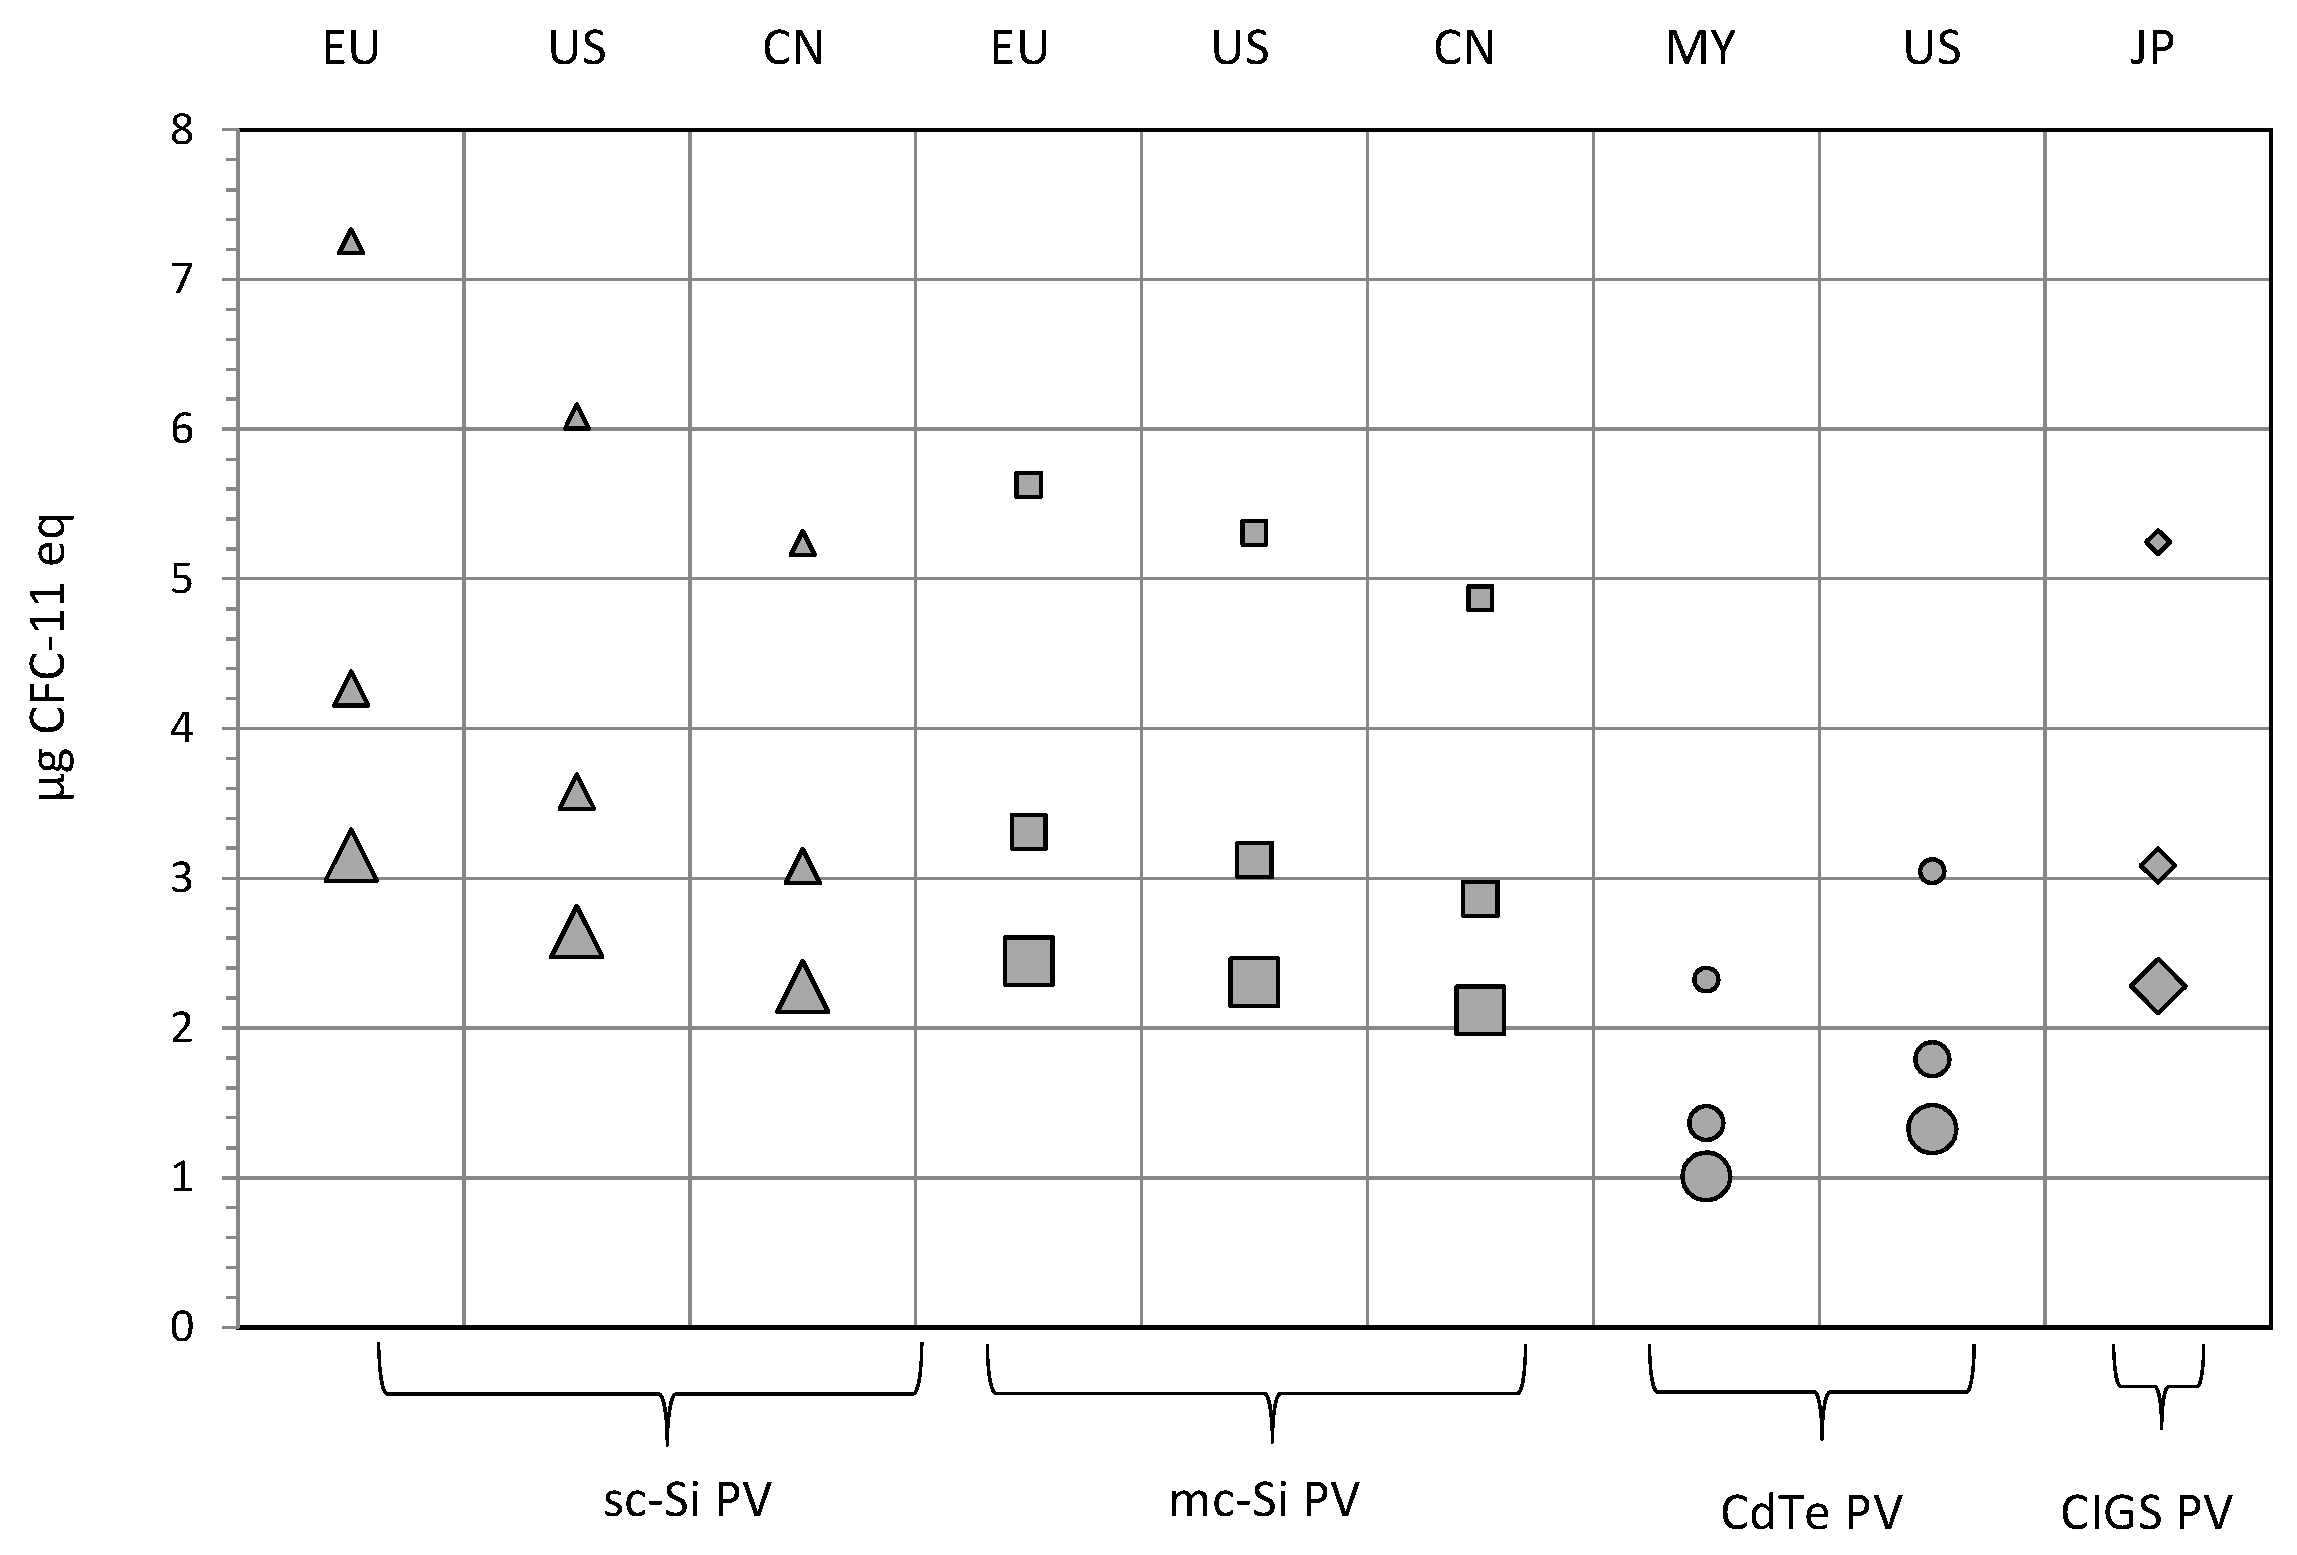
4.2. A Comparison to 1-Axis Tracking Installations

Generally, tracking PV systems provide the benefit of boosting the energy yield in comparison with fixed-tilt installations because the panels are mounted on a structure that follows the movement of the sun. In particular, one-axis trackers have one degree of freedom (the movement occurs along a single axis of rotation). The results shown below correspond to a horizontal rotational axis in the North-South (N-S) direction with the panels facing East in the morning and facing West in the late afternoon. Tracking could be further optimized with the horizontal rotational axis tilted south if the topography allows, which would give the benefit of a flatter profile throughout the day.
On one hand, the invested energy (and associated environmental impacts) for building the tracking BOS are higher than for conventional fixed-tilt PV systems, since tracking installations require larger amounts of structural steel and copper cabling; also, they use electricity during the usage phase for tracking actuators. On the other hand, the key advantage of tracking systems is the ability to harvest more direct beam irradiance, thereby requiring fewer PV modules per kWh produced in comparison with fixed-tilt installations.
The energy and environmental performance of tracking systems are highly influenced by site latitude and diffused light conditions; in particular, sites with lower (<40%) diffused light benefit more from tracking systems. Also, the gain in PV yield is reported to range from +10% to +24% over tropical and subtropical latitudes (0°–40°) [49].
Table 2 shows the maximum achievable variations in LCA impact assessment results (GWP, AP, OPD) and EPBTs for a range of one-axis tracking PV systems, expressed as relative to the corresponding values for fixed-tilt PV installations, assuming a best-case scenario of 2300 kWh/(m2·yr) irradiation, and +24% enhanced capture efficiency with respect to latitude tilt fixed installations.
In general terms, the c-Si PV systems were found to benefit the most from tracking installations (over −10% impact). Instead, the advantage from tracking for CdTe PV (and also to a lesser extent for CIGS PV) appear to be much smaller, due to the very good performance of these thin film technologies in the first place, and hence the comparatively larger share of their overall impacts are due to the BOS itself.

5. Conclusions

Overall, the ongoing improvements in terms of material usage for and energy efficiency of the range of commercially-available PV technologies have been shown to be paralleled by correspondingly better life-cycle energy and environmental performance. The most remarkable achievements have been obtained by CdTe PV, which can boast a two-thirds reduction in environmental impacts over the decade since its introduction to the market. Also importantly, our results definitively put to rest the often voiced concerns about PV not providing large-enough net energy returns per unit of energy invested: all analysed PV technologies have been shown to be able to afford a >90% net-to-gross energy return ratio, even when deployed in less-than-optimal locations (e.g. at Central-Northern latitudes). On the other hand, the additional benefit of employing a tracking BOS is not as clear-cut, and depends on the individual PV technology as well as on specific local conditions (high irradiation, low diffused light).

Acknowledgments

The authors gratefully acknowledge the supply of up-to-date inventory information on CdTe PV production by First Solar, Inc.

Author Contributions

Vasilis Fthenakis conceived and designed the study; Enrica Leccisi performed the experimental work; Enrica Leccisi and Marco Raugei analyzed the data; Vasilis Fthenakis contributed materials and analysis insight; Enrica Leccisi and Marco Raugei wrote the paper.

Conflicts of Interest

The authors declare no conflict of interest.

References

  1. Intergovernmental Panel on Climate Change (IPCC). Climate Change 2014: Mitigation of Climate Change; Cambridge University Press: New York, NY, USA, 2014. [Google Scholar]
  2. World Population Prospects: The 2015 Revision, Key Findings and Advance Tables; Working Paper No. ESA/P/WP.241; United Nations Department of Economic and Social Affairs, Population Division: New York, NY, USA, 2015.
  3. Snapshot of Global Photovoltaic Markets; Report IEA PVPS T1-29:2016; International Energy Agency (IEA): Paris, France, 2015.
  4. Global Market Outlook for Solar Power 2015–2019; Solar Power Europe, European Photovoltaic Industry Association: Brussels, Belgium, 2015.
  5. First Solar. Taking Energy Forward, Providing Comprehensive Solar Solutions to Diversify Your Energy Portfolio, 2016. Available online: http://www.firstsolar.com/ (accessed on 10 May 2016).
  6. Alsema, E. Energy requirements of thin-film solar cell modules—A review. Renew. Sustain. Energy Rev. 1998, 2, 387–415. [Google Scholar] [CrossRef]
  7. Alsema, E. Energy pay-back time and CO2 emissions of PV systems. Prog. Photovolt. 2000, 8, 17–25. [Google Scholar] [CrossRef]
  8. Alsema, E.; Nieuwlaar, E. Energy viability of photovoltaic systems. Energy Policy 2000, 28, 999–1010. [Google Scholar] [CrossRef]
  9. Fthenakis, V.M. Life cycle impact analysis of cadmium in CdTe PV production. Renew. Sustain. Energy Rev. 2004, 8, 303–334. [Google Scholar] [CrossRef]
  10. De Wild-Sholten, M.; Alsema, E. Towards cleaner solar PV: Environmental and health impacts of crystalline silicon photovoltaics. Refocus 2004, 5, 46–49. [Google Scholar] [CrossRef]
  11. Fthenakis, V.M.; Kim, H.C.; Alsema, E. Emissions from photovoltaic life cycles. Environ. Sci. Technol. 2008, 42, 2168–2174. [Google Scholar] [CrossRef] [PubMed]
  12. Fthenakis, V.M.; Held, M.; Kim, H.C.; Raugei, M.; Krones, J. Update of energy payback times and environmental impacts of photovoltaics. In Proceedings of the 24th European Photovoltaic Solar Energy Conference and Exhibition, Hamburg, Germany, 21–25 September 2009.
  13. Raugei, M.; Fullana-i-Palmer, P.; Fthenakis, V.M. The energy return on energy investment (EROI) of photovoltaics: Methodology and comparisons with fossil fuel life cycles. Energy Policy 2012, 45, 576–582. [Google Scholar] [CrossRef]
  14. Dale, M.; Benson, S.M. The energy balance of the photovoltaic (PV) industry—Is the PV industry a net energy provider? Environ. Sci. Technol. 2013, 47, 3482–3489. [Google Scholar] [CrossRef] [PubMed]
  15. Consoli, F.; Allen, D.; Boustead, I.; De Oude, N.; Fava, J.; Franklin, R.; Jensen, A.A.; Parrish, R.; Perriman, R.; Postlethwaite, D.; et al. Guidelines for Life-Cycle Assessment: A “Code of Practice”; Society of Environmental Toxicology and Chemistry: Sesimbra, Portugal, 1993. [Google Scholar]
  16. Environmental Management—Life Cycle Assessment—Principles and Framework; ISO 14040:2006; International Standardization Organization: Geneva, Switzerland, 2010.
  17. Environmental Management—Life Cycle Assessment—Requirements and Guidelines; ISO 14044:2006; International Standardization Organization: Geneva, Switzerland, 2010.
  18. Fthenakis, V.; Frischknecht, R.; Raugei, M.; Kim, H.C.; Alsema, E.; Held, M.; De Wild-Scholten, M. Methodology Guidelines on Life Cycle Assessment of Photovoltaic Electricity; Report IEA-PVPS T12-03:2011; International Energy Agency (IEA): Paris, France, 2016. [Google Scholar]
  19. Frischknecht, R.; Wyss, F.; Büsser Knöpfel, S.; Lützkendorf, T.; Balouktsi, M. Cumulative energy demand in LCA: The energy harvested approach. Int. J. Life Cycle Assess. 2015, 20, 957–969. [Google Scholar] [CrossRef]
  20. Leach, G. Net energy-is it any use? Energy Policy 1975, 3, 332–344. [Google Scholar] [CrossRef]
  21. Chambers, R.S.; Herendeen, R.A.; Joyce, J.J.; Penner, P.S. Gasohol: Does it or doesn’t produce positive net energy? Science 1979, 206, 789–795. [Google Scholar] [CrossRef] [PubMed]
  22. Herendeen, R. Net energy considerations. In Economic Analysis of Solar Thermal Energy Systems; West, R., Kreith, F., Eds.; MIT Press: Cambridge, MA, USA, 1988; pp. 255–273. [Google Scholar]
  23. Cleveland, C.J.; Costanza, R.; Hall, C.A.S.; Kaufmann, R. Energy and the U.S. economy: A biophysical perspective. Science 1984, 225, 890–897. [Google Scholar] [CrossRef] [PubMed]
  24. Cleveland, C.J. Energy quality and energy surplus in the extraction of fossil fuels in the U.S. Ecol. Indic. 1992, 6, 139–162. [Google Scholar] [CrossRef]
  25. Herendeen, R. Net Energy Analysis: Concepts and Methods. In Encyclopedia of Energy; Elsevier: Amsterdam, The Netherlands, 2004; pp. 283–289. [Google Scholar]
  26. Carbajales-Dale, M.; Barnhart, C.; Brandt, A.R.; Benson, S. A better currency for investing in a sustainable future. Nat. Clim. Chang. 2014, 4, 524–527. [Google Scholar] [CrossRef]
  27. Raugei, M.; Frischknecht, R.; Olson, C.; Sinha, P.; Heath, G. Methodological Guidelines on Net Energy Analysis of Photovoltaic Electricity; Report IEA-PVPS T12-071:2016; International Energy Agency (IEA): Paris, France, 2016. [Google Scholar]
  28. Hall, C.A.S.; Balogh, S.; Murphy, D.J.R. What is the minimum EROI that a sustainable society must have? Energies 2009, 2, 25–47. [Google Scholar] [CrossRef]
  29. Lambert, J.C.; Hall, C.A.S.; Balogh, S.; Gupta, A.; Arnold, M. Energy, EROI and quality of life. Energy Policy 2014, 64, 153–167. [Google Scholar] [CrossRef]
  30. Raugei, M.; Leccisi, E. A comprehensive assessment of the energy performance of the full range of electricity generation technologies deployed in the United Kingdom. Energy Policy 2016, 90, 46–59. [Google Scholar] [CrossRef]
  31. Ecoinvent Database, 2016. Available online: http://www.ecoinvent.org/ (accessed on 10 May 2016).
  32. Frischknecht, R.; Itten, R.; Sinha, P.; de Wild-Scholten, M.; Zhang, J.; Fthenakis, V.; Kim, H.C.; Raugei, M.; Stucki, M. Life Cycle Inventories and Life Cycle Assessment of Photovoltaic Systems; Report IEA-PVPS T12-04:2015; International Energy Agency (IEA): Paris, France, 2015. [Google Scholar]
  33. De Wild-Scholten, M. Life Cycle Assessment of Photovoltaics Status 2011, Part 1 Data Collection; SmartGreenScans: Groet, The Netherlands, 2014. [Google Scholar]
  34. Sander, K.; Schilling, S.; Reinschmidt, J.; Wambach, K.; Schlenker, S.; Müller, A.; Springer, J.; Fouquet, D.; Jelitte, A.; Stryi-Hipp, G.C. Study on the Development of a Take Back and Recovery System for Photovoltaic Products; Institut für Ökologie und Politik GmbH: Wuppertal, Germany, 2007. [Google Scholar]
  35. Corcelli, F.; Ripa, M.; Leccisi, E.; Cigolotti, V.; Fiandra, V.; Graditi, G.; Sannino, L.; Tammaro, M.; Ulgiati, S. Sustainable urban electricity supply chain—Indicators of material recovery and energy savings from crystalline silicon photovoltaic panels end-of-life. Ecol. Indic. 2016. [Google Scholar] [CrossRef]
  36. Carbajales-Dale, M.; Raugei, M.; Barnhart, C.J.; Fthenakis, V.M. Energy return on investment (EROI) of solar PV: An attempt at reconciliation. Proc. IEEE 2015, 103, 995–999. [Google Scholar] [CrossRef]
  37. Nikolakakis, T.; Fthenakis, V.M. The optimum mix of electricity from wind- and solar-sources in conventional power systems: Evaluating the case for New York State. Energy Policy 2011, 39, 6972–6980. [Google Scholar] [CrossRef]
  38. Pre Consultants 2014. SimaPro 8 LCA Software. Available online: https://www.pre-sustainability.com/simapro (accessed on 10 May 2016).
  39. CML-IA Characterisation Factors, 2016. Available online: http://www.universiteitleiden.nl/en/research/research-output/science/cml-ia-characterisation-factors (accessed on 10 May 2016).
  40. Photovoltaics Report; Fraunhofer Institute for Solar Energy Systems: Freiburg, Germany, 2016.
  41. Silicon, 2016. Available online: http://minerals.usgs.gov/minerals/pubs/commodity/silicon/mcs-2016-simet.pdf (accessed on 10 May 2016).
  42. Statistics Search, 2016. Available online: http://www.iea.org/statistics/statisticssearch/ (accessed on 10 May 2016).
  43. EIA U.S. Energy Information Administration. Today in Energy, 2016. Available online: http://www.eia.gov (accessed on 10 May 2016).
  44. Breakdown of Electricity Generation by Energy Source. The Shift Project Data Protal, 2014. Available online: http://www.tsp-data-portal.org/Breakdown-of-Electricity-Generation-by-Energy-Source#tspQvChart (accessed on 10 May 2016).
  45. Suruhanjaya Tenaga Energy Commission. Peninsular Malaysia Electricity Supply Industry Outolook 2014. Available online: http://www.st.gov.my/index.php/en/component/k2/item/606-peninsular-malaysia-electricity-supply-industry-outlook-2014.html (accessed on 10 May 2016).
  46. De Wild-Scholten, M. Energy payback time and carbon footprint of commercial photovoltaic systems. Sol. Energy Mater. Sol. Cells 2013, 119, 296–305. [Google Scholar] [CrossRef]
  47. Mason, J.; Fthenakis, V.M.; Hansen, T.; Kim, C. Energy pay-back and life cycle CO2 emissions of the BOS in an optimized 3.5 MW PV installation. Prog. Photovolt. Res. Appl. 2006, 14, 179–190. [Google Scholar] [CrossRef]
  48. Murphy, D.; Hall, C.A.S. Year in review—EROI or energy return on (energy) invested. Ann. N. Y. Acad. Sci. 2010, 1185, 102–118. [Google Scholar] [CrossRef] [PubMed]
  49. Sinha, P.; Schneider, M.; Dailey, S.; Jepson, C.; De Wild-Scholten, M. Eco-efficiency of CdTe photovoltaics with tracking systems. In Proceedings of the 39th IEEE Photovoltaic Specialists Conference (PVSC), Tampa, FL, USA, 16–21 June 2013.
Figure 1. Flow diagram for single-crystalline Si (sc-Si) and multi-crystalline Si (mc-Si) photovoltaic (PV) systems. SoG: solar grade; and CZ: Czochralski.
Energies 09 00622 g001
Figure 2. Flow diagram for cadmium telluride (CdTe) and copper indium gallium diselenide (CIGS) PV systems. BOS: balance of system.
Energies 09 00622 g002
Figure 3. Cumulative energy demand (CED) per kWp of the analysed PV systems.
Energies 09 00622 g003
Figure 4. Global warming potential (GWP) per kWp of the analysed PV systems.
Energies 09 00622 g004
Figure 5. Acidification potential (AP) per kWp of the analysed PV systems.
Energies 09 00622 g005
Figure 6. Ozone depletion potential (ODP) per kWp of the analysed PV systems.
Energies 09 00622 g006
Figure 7. CED per kWhel of the analysed PV systems, under three irradiation levels. Small symbols: 1000 kWh/(m2·yr); medium symbols: 1700 kWh/(m2·yr); and large symbols: 2300 kWh/(m2·yr).
Energies 09 00622 g007
Figure 8. GWP per kWhel of the analysed PV systems, under three irradiation levels. Small symbols: 1000 kWh/(m2·yr); medium symbols: 1700 kWh/(m2·yr); and large symbols: 2300 kWh/(m2·yr).
Energies 09 00622 g008
Figure 9. AP per kWhel of the analysed PV systems, under three irradiation levels. Small symbols: 1000 kWh/(m2·yr); medium symbols: 1700 kWh/(m2·yr); and large symbols: 2300 kWh/(m2·yr).
Energies 09 00622 g009
Figure 10. ODP per kWhel of the analysed PV systems, under three irradiation levels. Small symbols: 1000 kWh/(m2·yr); medium symbols: 1700 kWh/(m2·yr); and large symbols: 2300 kWh/(m2·yr).
Energies 09 00622 g010
Figure 11. Positioning of the analysed PV systems on the “net energy cliff” (illustrating the non-linear relation of the net-to-gross energy output ratio to the energy return on investment (EROIPE-eq)), under three irradiation levels. Small symbols: 1000 kWh/(m2·yr); medium symbols: 1700 kWh/(m2·yr); and large symbols: 2300 kWh/(m2·yr).
Energies 09 00622 g011
Table 1. Energy pay-back time (EPBT) of the analysed PV systems (mean values for the various production sites), corresponding to the three considered irradiation levels.
Irradiation and Grid Efficiency (η)sc-Si PVmc-Si PVCdTe PVCIGS PV
1000 kWh/(m2·yr); η = 0.32.82.11.11.9
1700 kWh/(m2·yr); η = 0.31.61.20.61.1
2300 kWh/(m2·yr); η = 0.31.20.90.50.8
Table 2. Life cycle impact assessment (LCIA) and EPBT results for one-axis tracking PV system installations, per kWhel and relative to fixed-tilt installations. Assumed irradiation: 2300 kWh/(m2·yr); assumed energy harvesting gain due to tracking: +24%.
Indicatorsc-Si PVmc-Si PVCdTe PVCIGS PV
GWP−14%−11%−1%−6%
AP−12%−9%−7%−16%
ODP−13%−11%−4%−9%
EPBT−13.2%−10.5%−2.3%−7.8%

