1. Introduction
EVs represent a promising technology due to their environmental friendliness and potential to reduce the dependence on fossil fuels [
1]. However, the integration of massive numbers of EVs is still regarded as a great challenge for electric power systems. The random charging behaviors of large-scale EVs in spatial and temporal domains may lead to a series of problems in the power grid, such as power congestion, under-voltage, and grid instability [
2,
3]. Considering that EVs can represent the distributed and mobile power demands in the near future, it’s meaningful and valuable to study the optimal charging strategy of EVs [
4,
5], so as to promote the large-scale application of EVs.
At present, studies on the optimal scheduling of EVs are generally performed considering spatial and temporal characteristics. Some optimization models have been proposed to coordinate EV users in the temporal domain [
6,
7,
8,
9]. In [
6], to optimize the objective functions including the loss and cost of purchased energy, an optimization approach to devise an efficient management strategy is proposed for EVs. In [
7], a multi-objective scheduling of EVs in a smart distribution system is proposed, so as to minimize the total operation cost and emissions. In [
8], to improve the security and economics of the grid operation, a model concerning with optimal power flow, statistic characteristics of EVs, EV owners’ degree of satisfaction, and the power grid cost is suggested. In [
9], the optimal charging strategy of EVs is suggested to smooth the daily curve, and the results can confirm its effectiveness.
Regarding the optimization models which can coordinate EV users in spatial domain, a few works have been done to date [
10,
11,
12]. In [
10], to reduce the impacts of disordered charging behaviors on the distribution network, multi-objective optimization including charging time, distance and dispatching charging load is investigated, and the complete EV charging load spatial allocation can be achieved. In [
11,
12], the corresponding authors discuss the charging strategies of plug-in EVs to improve the economic operation of the power grid and highlight the users’ benefits. In [
13,
14], the optimization strategies are based on the bilayer optimization at transmission and distribution system levels, and herein optimizing the peak-valley difference and reducing the network loss can be achieved, respectively. However, the interests of EV charging stations are ignored in the aforementioned works, and the incentive measures guiding the EVs to charge are not taken into account.
In fact, the electricity price is an effective means to guide the orderly charging behaviors of EVs. The pricing scheme conveys price and quantity information to the load aggregator to control plug-in EV fleet charging [
15,
16]. To apply peak shaving for power grid by scheduling the charging behaviors of EVs, the peak-valley TOU electricity price is discussed in [
17]. The TOU electricity price is discussed in [
18], and the optimal scheduling models of EVs based on the TOU price is proposed in [
19,
20].
The coordination strategies of plug-in EVs charging in smart grids based on real-time electricity price are proposed in [
21,
22], and this strategies are able to minimize the power losses and improve the voltage profiles. However, with the development of electricity market, charging stations will arrange certain electricity price policy to attract EVs to charge, and meanwhile the electricity price policy will be different in the temporal and spatial domains. Note that, the traditional electricity price can’t satisfy this requirement. Therefore, a new electricity price policy considering temporal and spatial characteristics must be studied. In addition, the charging behaviors of EVs may be absolutely stochastic for charging station in reality, so only partial EVs will respond to the electricity price to charge in related stations. Consequently, EV user responsivity to electricity price must be considered in the optimal strategy of EVs.
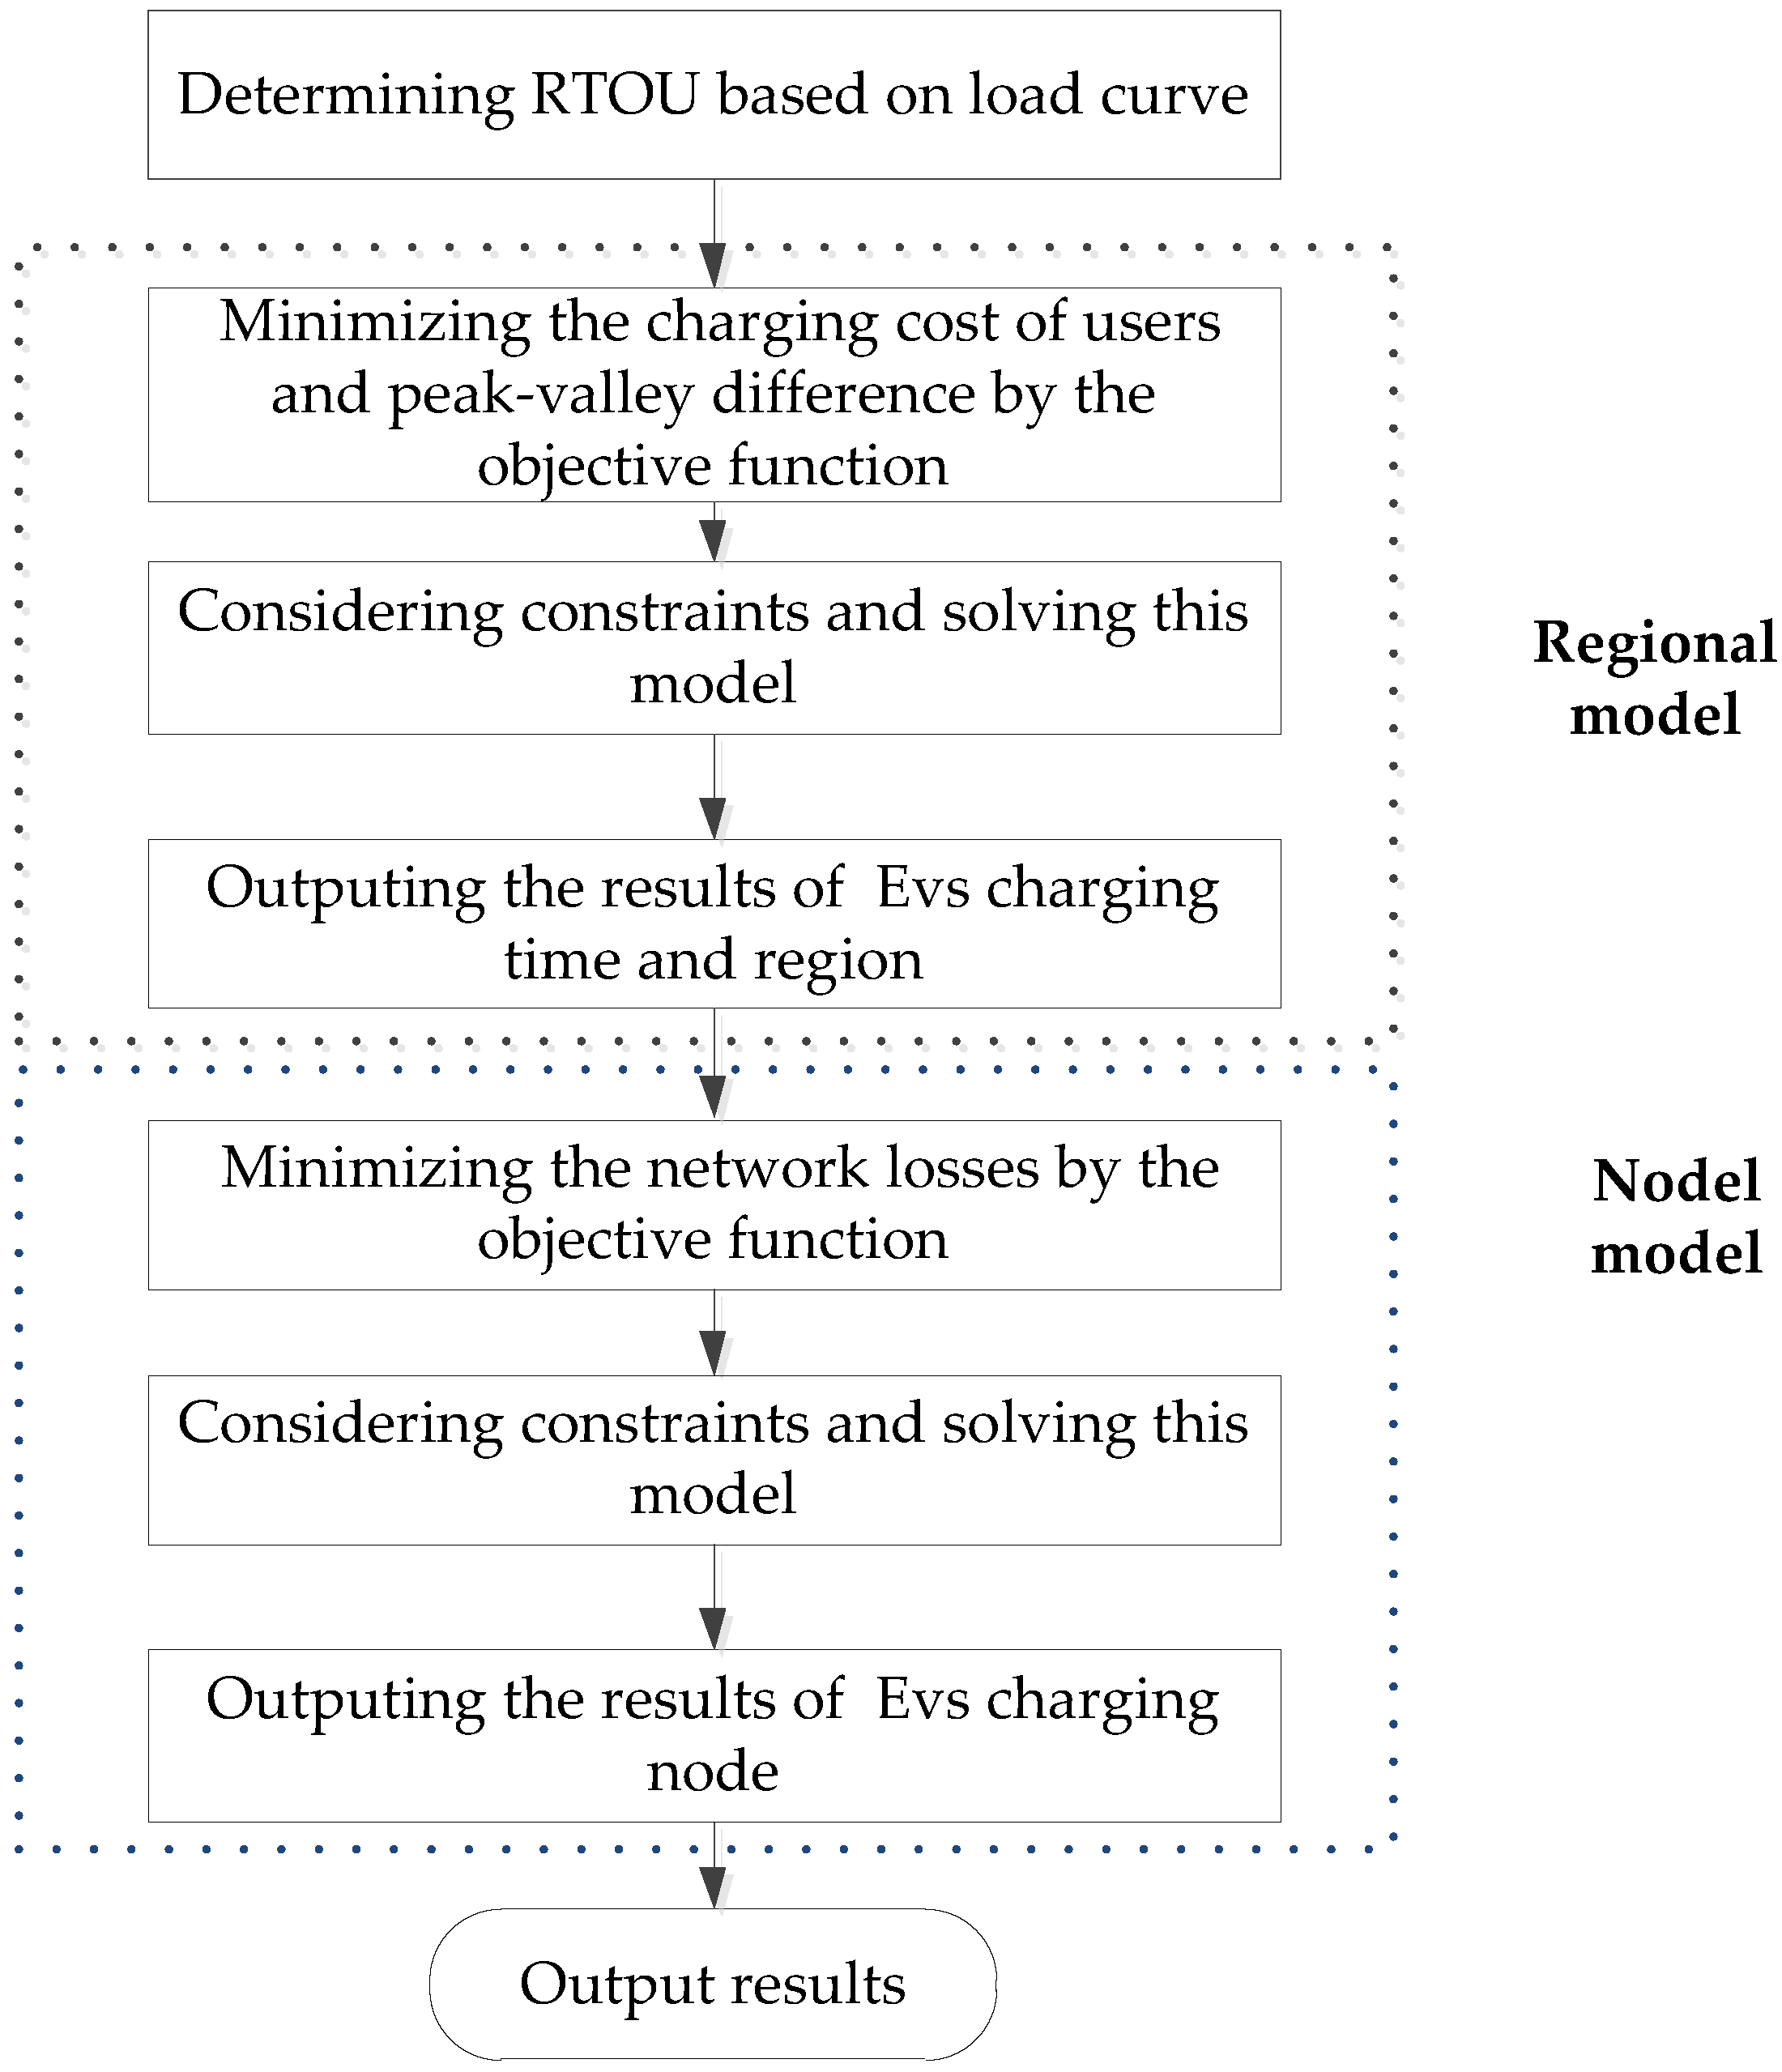
Table 1 generalizes the objectives of aforementioned works on the optimal scheduling of EVs. In this paper, our research group proposes a regional time-of-use (RTOU) electricity price-based optimal charging strategy for EVs considering the user responsivity. For that a typical urban zone is divided into four regions, the RTOU electricity price model can guide EVs when and where to charge, and also a bi-layer optimization charging strategy including regional-layer and node-layer models is suggested to schedule the EVs. The paper is organized as follows: a RTOU electricity price model is built in
Section 2.
Section 3 analyses the user responsivity to the RTOU electricity price. A bi-layer optimization model for coordinating EVs is proposed in
Section 4.
Section 5 is devoted to simulations of an IEEE 33-bus distribution network, and the performance of the proposed optimal charging strategy is verified. Finally, conclusions are drawn in
Section 6.
2. The Model of RTOU Electricity Price
In light of the commercial operation demands of EVs, different charging stations may need different electricity prices [
23]. Thus, a RTOU electricity price model considering temporal and spatial characteristics is discussed in this section. Compared with TOU electricity prices, the RTOU electricity prices in different regions are different. In a certain region, the RTOU electricity price consists of four electricity price levels [
24], and the following equation can be obtained:
where
ρ is the electricity price;
ρ1,
ρ2,
ρ3 and
ρ4 are the four-level electricity prices, respectively;
P is the daily load;
Pmin and
Pmax are the minimum and maximum daily loads in a day, respectively.
The values of
ρ1,
ρ2,
ρ3 and
ρ4 should be limited in a certain range according to the levels of user consumption.
ρmin is set to guarantee the benefits of the power grid considering commodity attribute of the electric power;
ρmax is set to guarantee the benefits of the EV users considering user acceptance for the electricity price. Meanwhile, the revenue of the power grid must be included:
where
ρmin and
ρmax are the minimum and maximum electricity prices, respectively.
is the load at time
t in zone
j after the application of RTOU electricity prices.
M is the number of zones, and
T is the duration, with the default value of 24.
C0 is the revenue of power grid before the application of RTOU electricity price:
where
and
ρ0 are the load at time
t and the electricity price before the application of the RTOU electricity price, respectively.
The relationship between the electricity price levels and the electricity power is expressed as:
where Δ
P is the difference of the lower or upper load boundary between the adjacent electricity price level, and it can be obtained by investigating local residents’ consumption habits and payment abilities.
In a way, Δ
P can be simplified as:
where
n is the number of electricity price levels, and its value is set as 4.
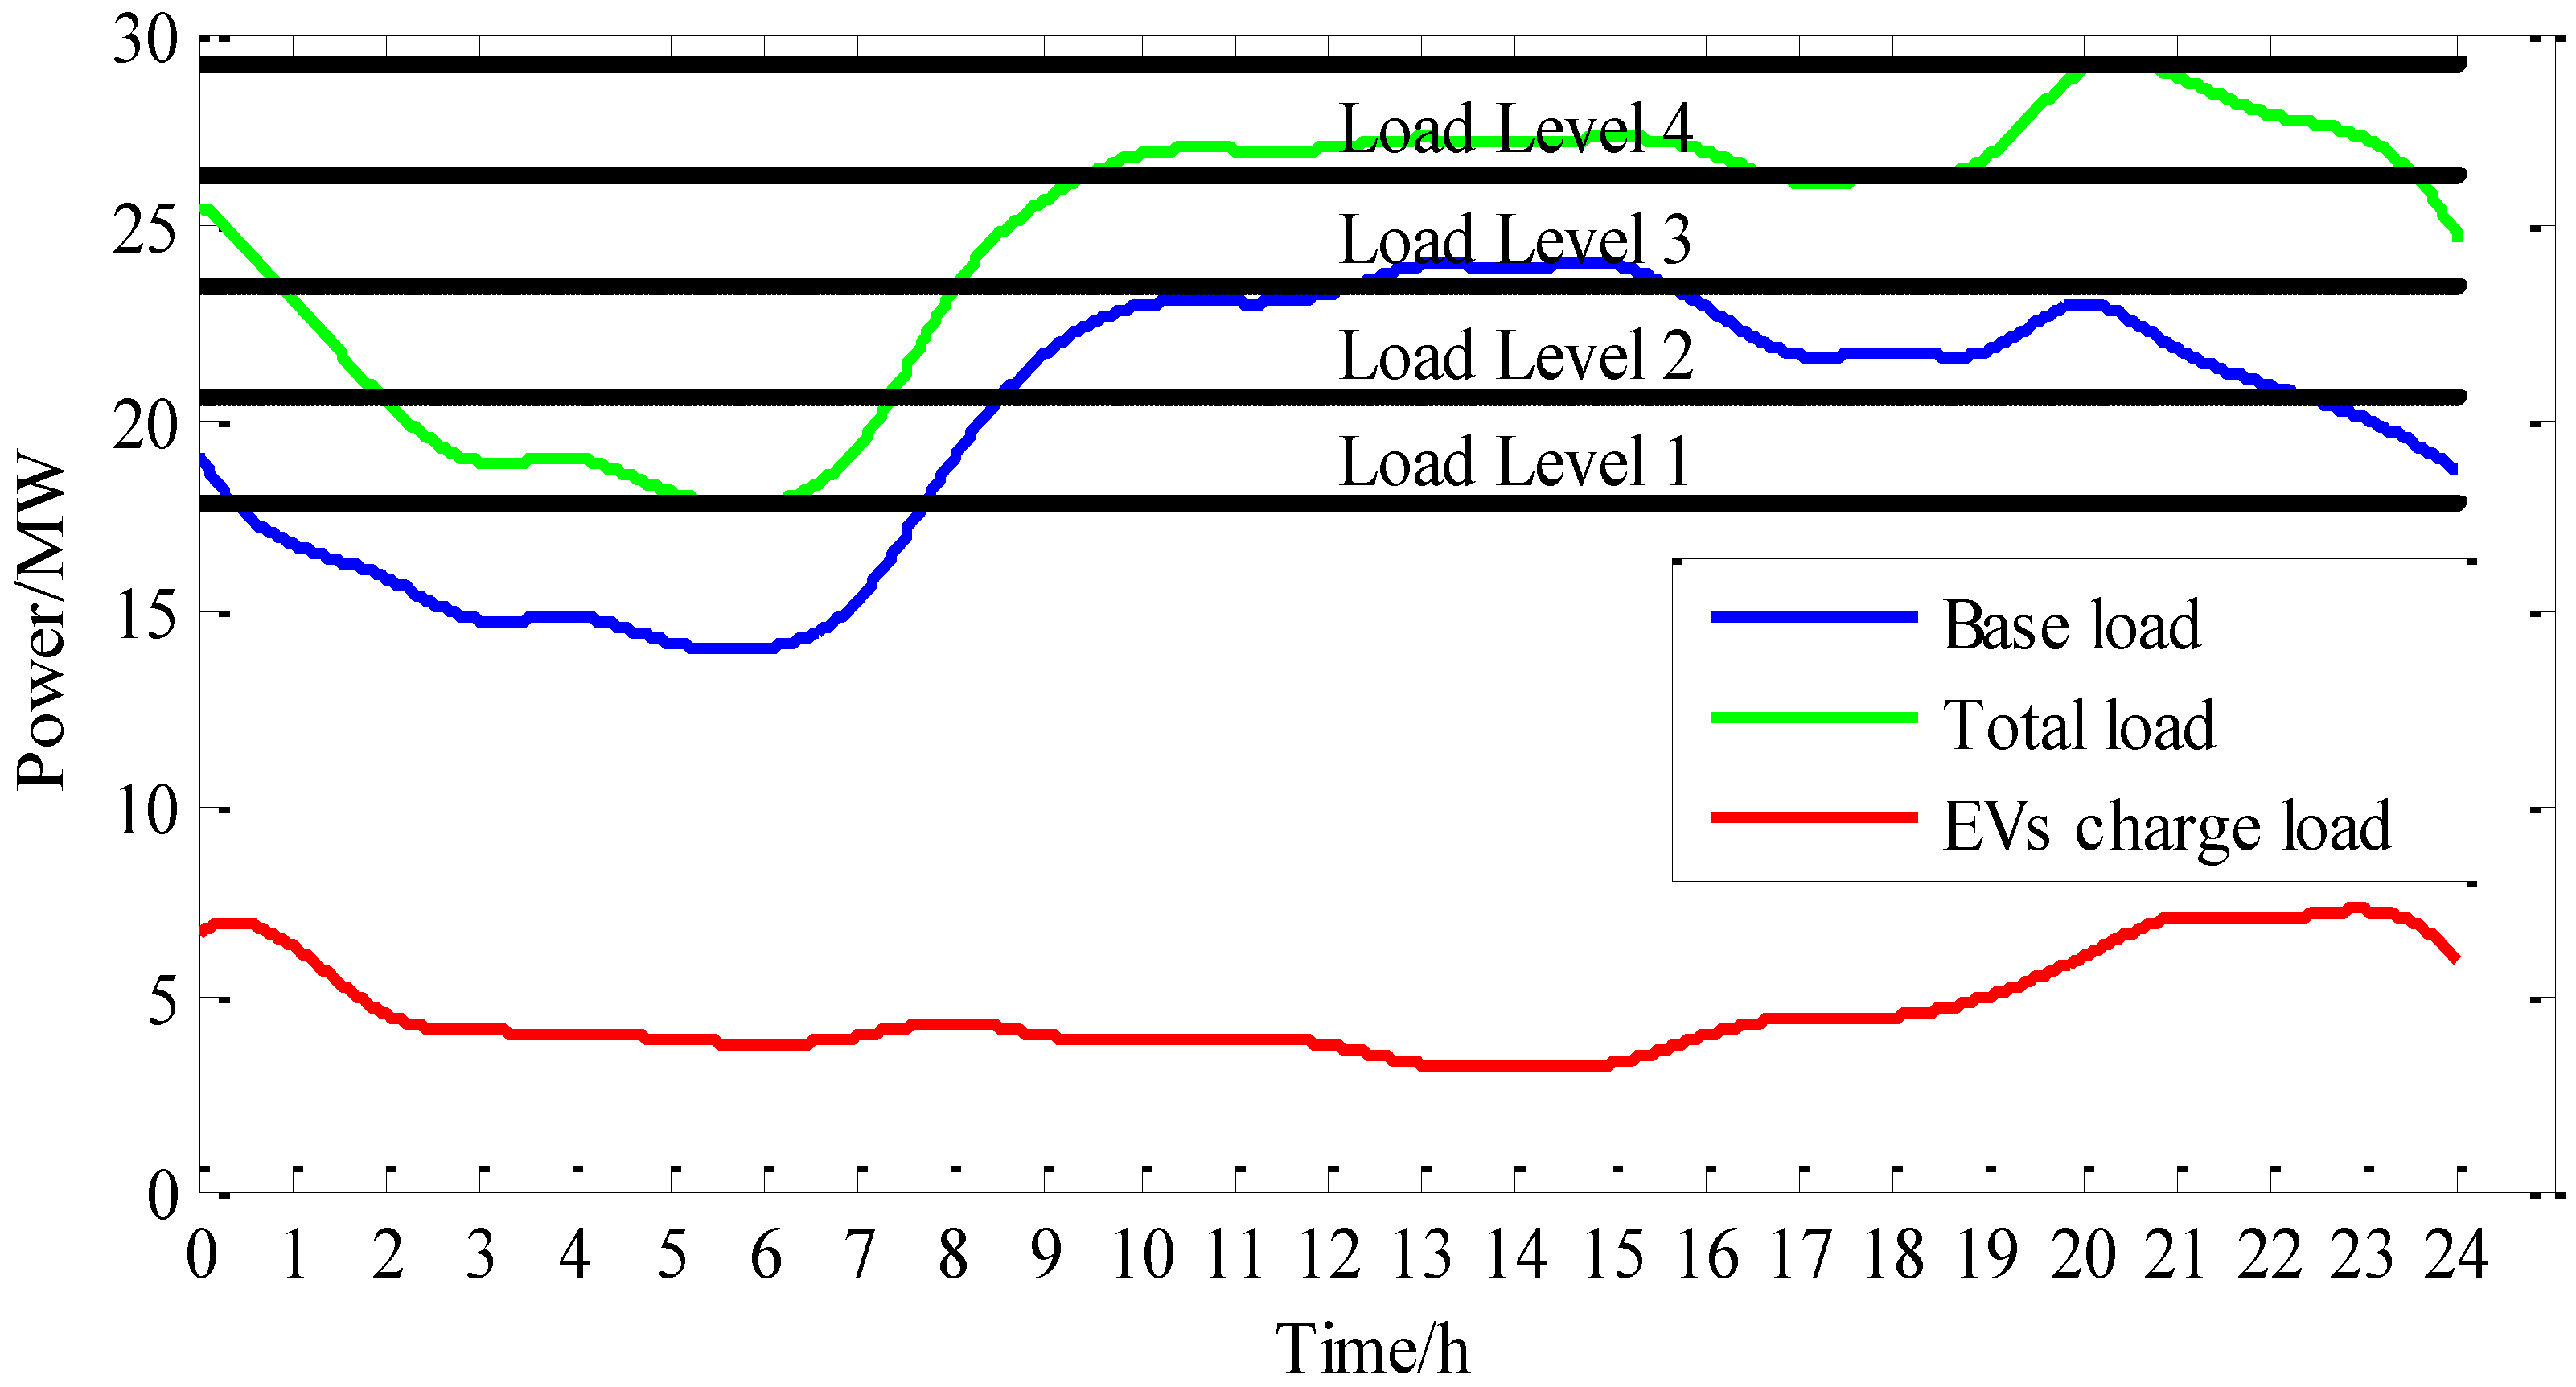
Figure 1 shows the RTOU electricity price model. The load curve is divided into four levels according to the maximal and minimal values of load level.
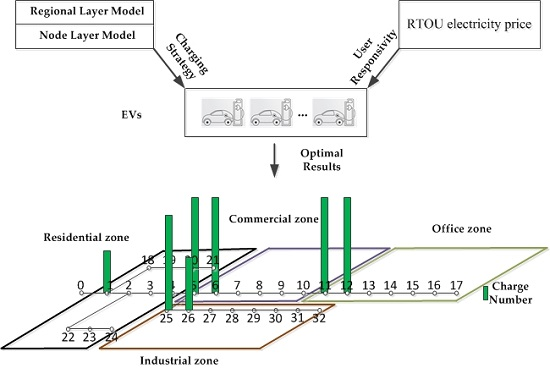
The four charging scenarios [
25] include uncontrolled charging, delayed charging, off-peak charging and continuous charging. The typical urban region consists of an industrial zone, a commercial zone, a residential zone and an office zone. In the uncontrolled charging case, EVs start to charge as soon as they are plugged in, and stop when the battery is fully charged. The delayed charging case is similar to the uncontrolled charging scenario. However, it requires only a modest infrastructure increase to delay initiation of household charging until 10 p.m. The off-peak charging scenario can provide a charging signal to lead EVs to charge in the optimal time for lower charging cost. For the continuous charging scenario, it assumes that the vehicle is continuously charged whenever it is not in motion. In view of the four zones and four charging modes, there are 16 charging scenarios. Since the analysis method for all of the scenarios is the same, one scenario is selected to investigate the characteristics, and the demonstrative scenario is shown in
Figure 2.
3. The User Responsivity to the RTOU Electricity Price
In fact, many factors will affect the charging behaviors of EVs [
26], such as the price policies, EV charging scenarios, user’s driving habits, SOC of batteries, and external environment. However, the purpose of EVs changing charging habits is to gain more economic benefits [
27], and these interests are reflected in the electricity price. In this section, the electricity price is pointedly taken into account. Price elasticity [
28] indicates the relationship between the electricity price and the number of responsive EVs, so the phenomenon of EV users’ response to electricity price can be described as follows:
where Δ
ρ is the variation of the electricity price,
ρ0 is the original electricity price; Δ
N, which represents the electricity consumption of EVs, is the variation of the number of charging EVs.
N is the original number of charging EVs; ε is the elasticity coefficient.
In general, the EV users’ responses will be affected by the price at the current time and the prices at other time. Meanwhile, after the application of the RTOU electricity prices, different regions have different electricity prices, so EV users’ responses are not only related to the current regional price, but also affected by the price of other regions. Therefore, the regional self-elasticity coefficients and the cross-elasticity coefficients are expressed as follows:
To simplify the calculation, the current regional and other regional mutual-elastic coefficients on different periods are converted into self-elasticity coefficients on a single period:
where
and
are the current regional and other regional elasticity coefficients at
t in zone
j, respectively.
The EVs charging elasticity coefficients of the current region and other regions are denoted as:
where
is the original number of EVs charging at time
t in zone
j.
Considering the influence of current regional and other regional elasticity coefficients, the number of charging EVs responding to the RTOU electricity price is calculated as follows:
To quantify the elasticity coefficients, the triangular fuzzy number [
29] is introduced:
where the fuzzy center
ε represents the average elasticity coefficient;
ε and
are the minimum and maximum price elasticity coefficients, respectively. The minimum and maximum number of EVs charging
and
at time
t in zone
j are obtained by Equation (11) with the minimum and maximum current regional coefficient
and other regional elasticity coefficients
.
5. Case Studies
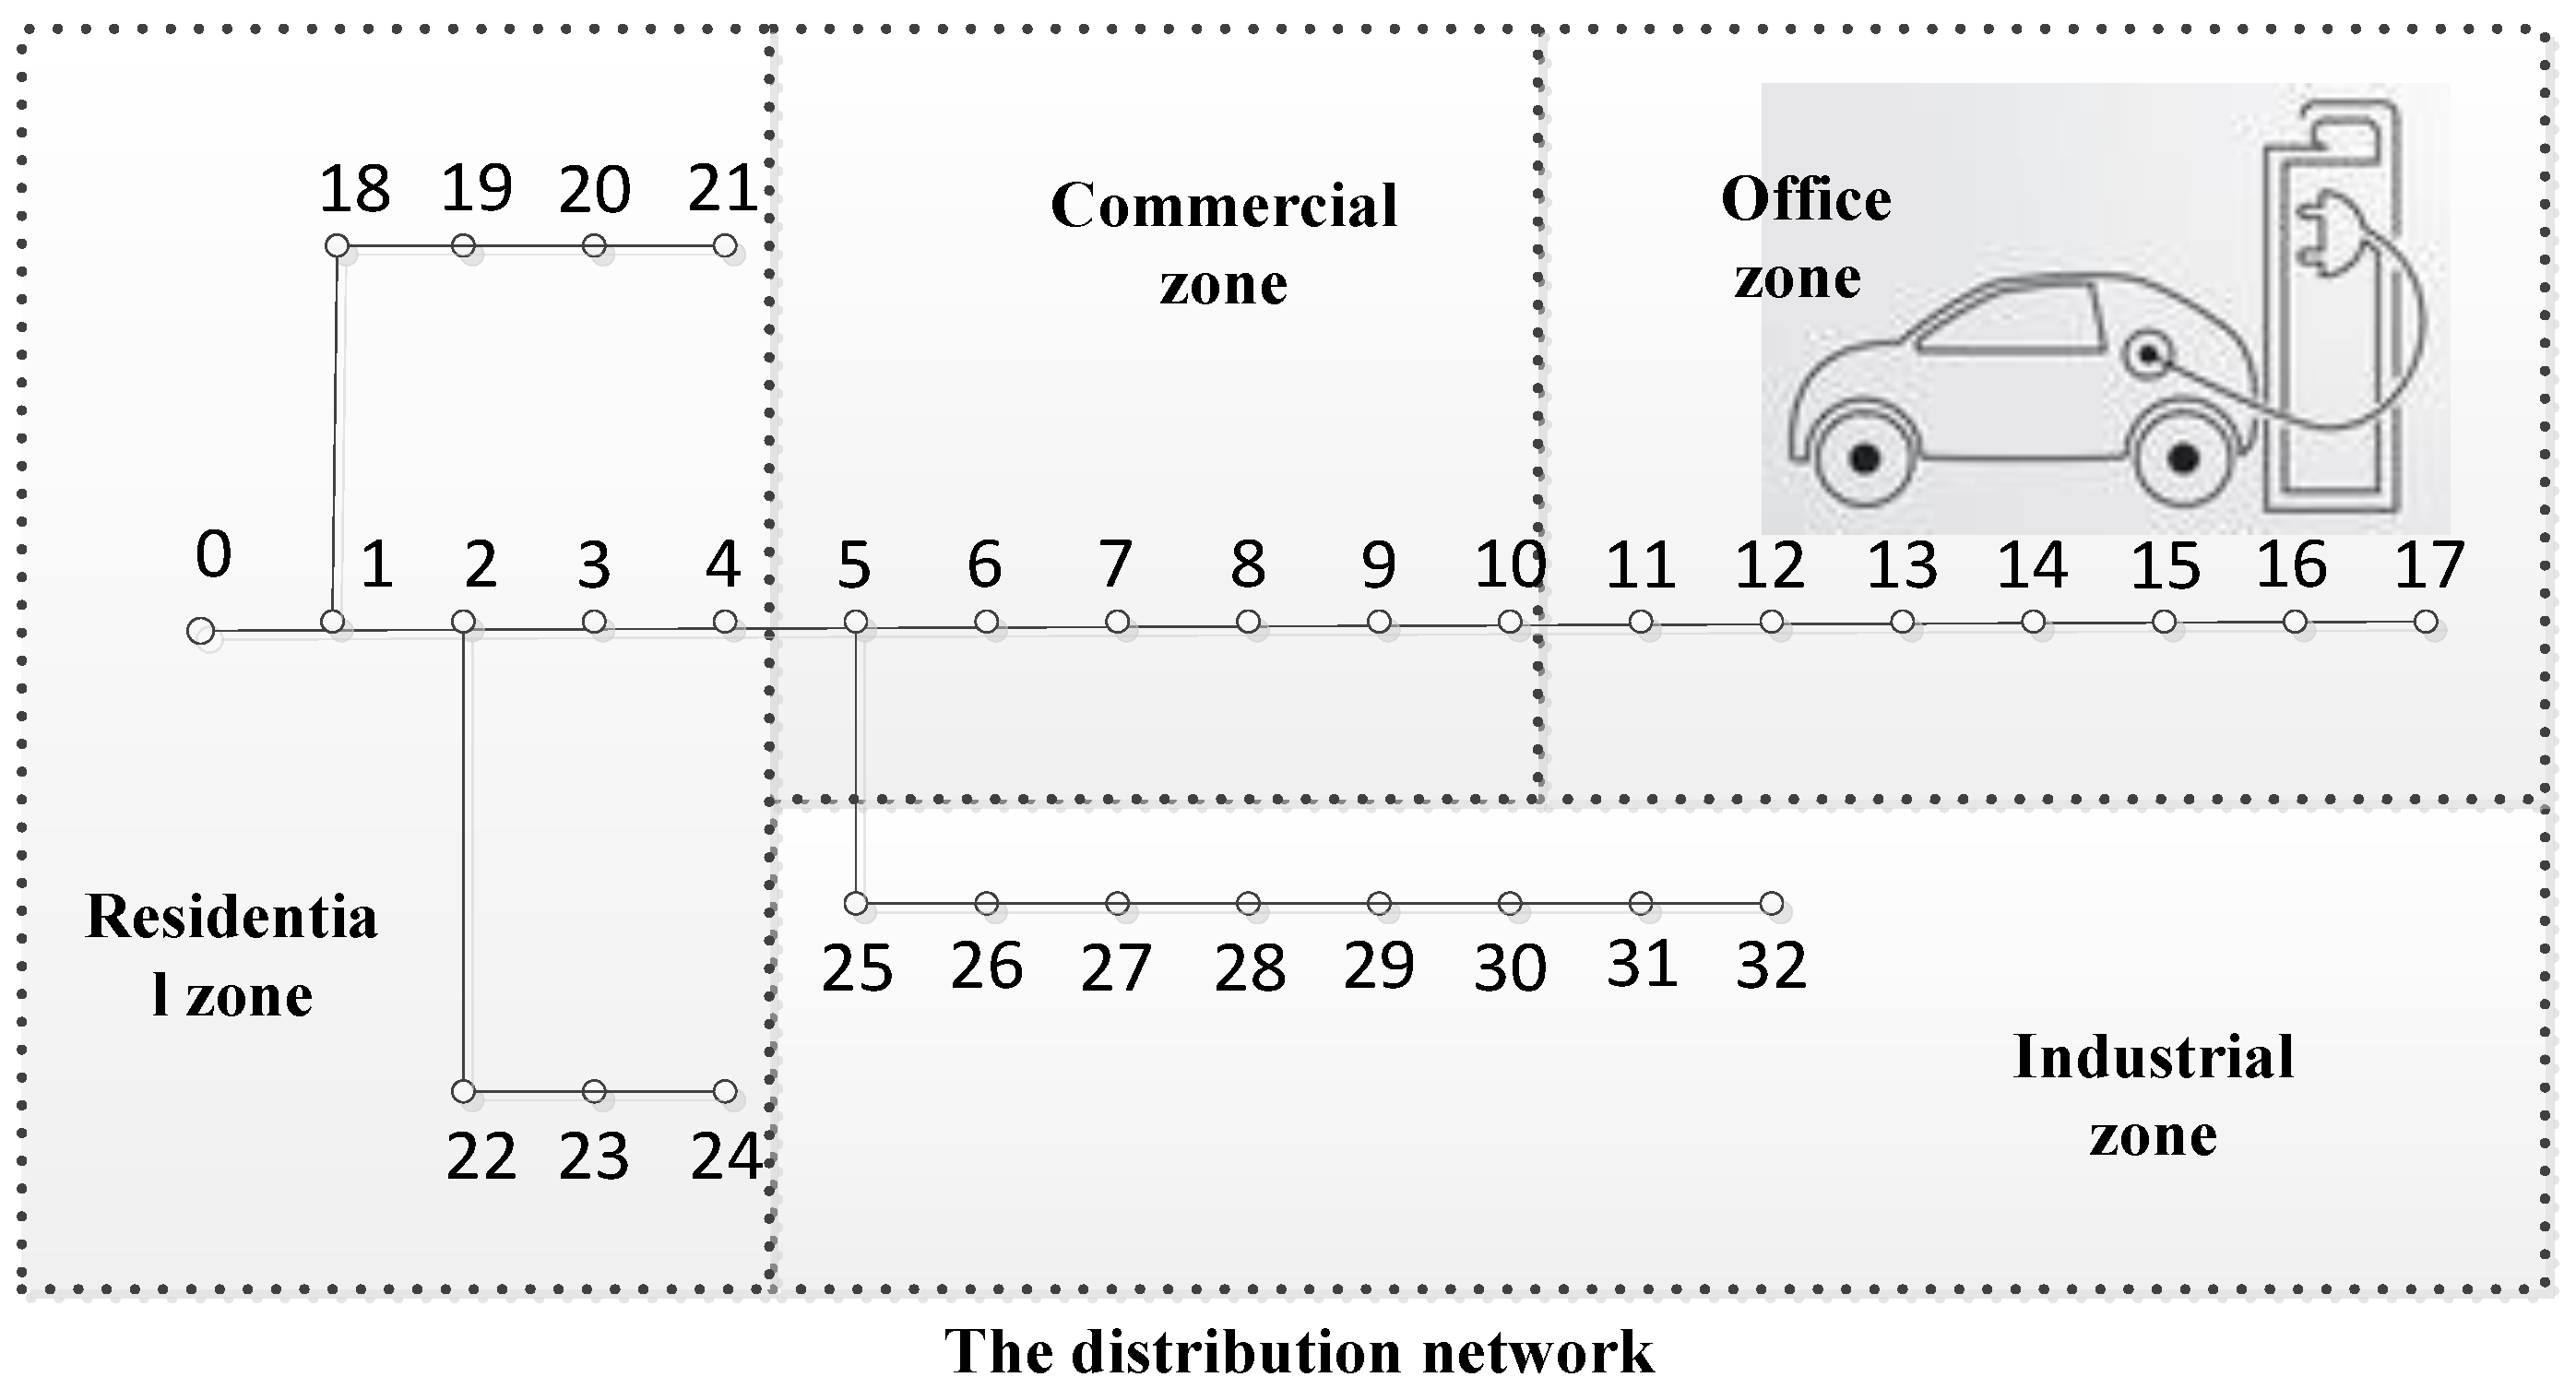
In this section, numeral simulations are carried out to illustrate the effectiveness of the proposed charging strategy for EVs. As shown in
Figure 4, an IEEE 33-bus distribution network is divided into four regions consisting of an industrial zone, a commercial zone, a residential zone and an office zone. Node 0 in the IEEE 33-bus system is a slack bus. In this distribution system, the base power is set as 100 MVA and the base voltage is set as 12.66 kV. The parameters of lines and the maximum load of nodes are obtained from literature [
33].
During the simulations,
ρ1 is set as 0.55 CNY/kWh;
ρ2 is set as 0.60 CNY/kWh;
ρ3 is set as 0.65 CNY/kWh;
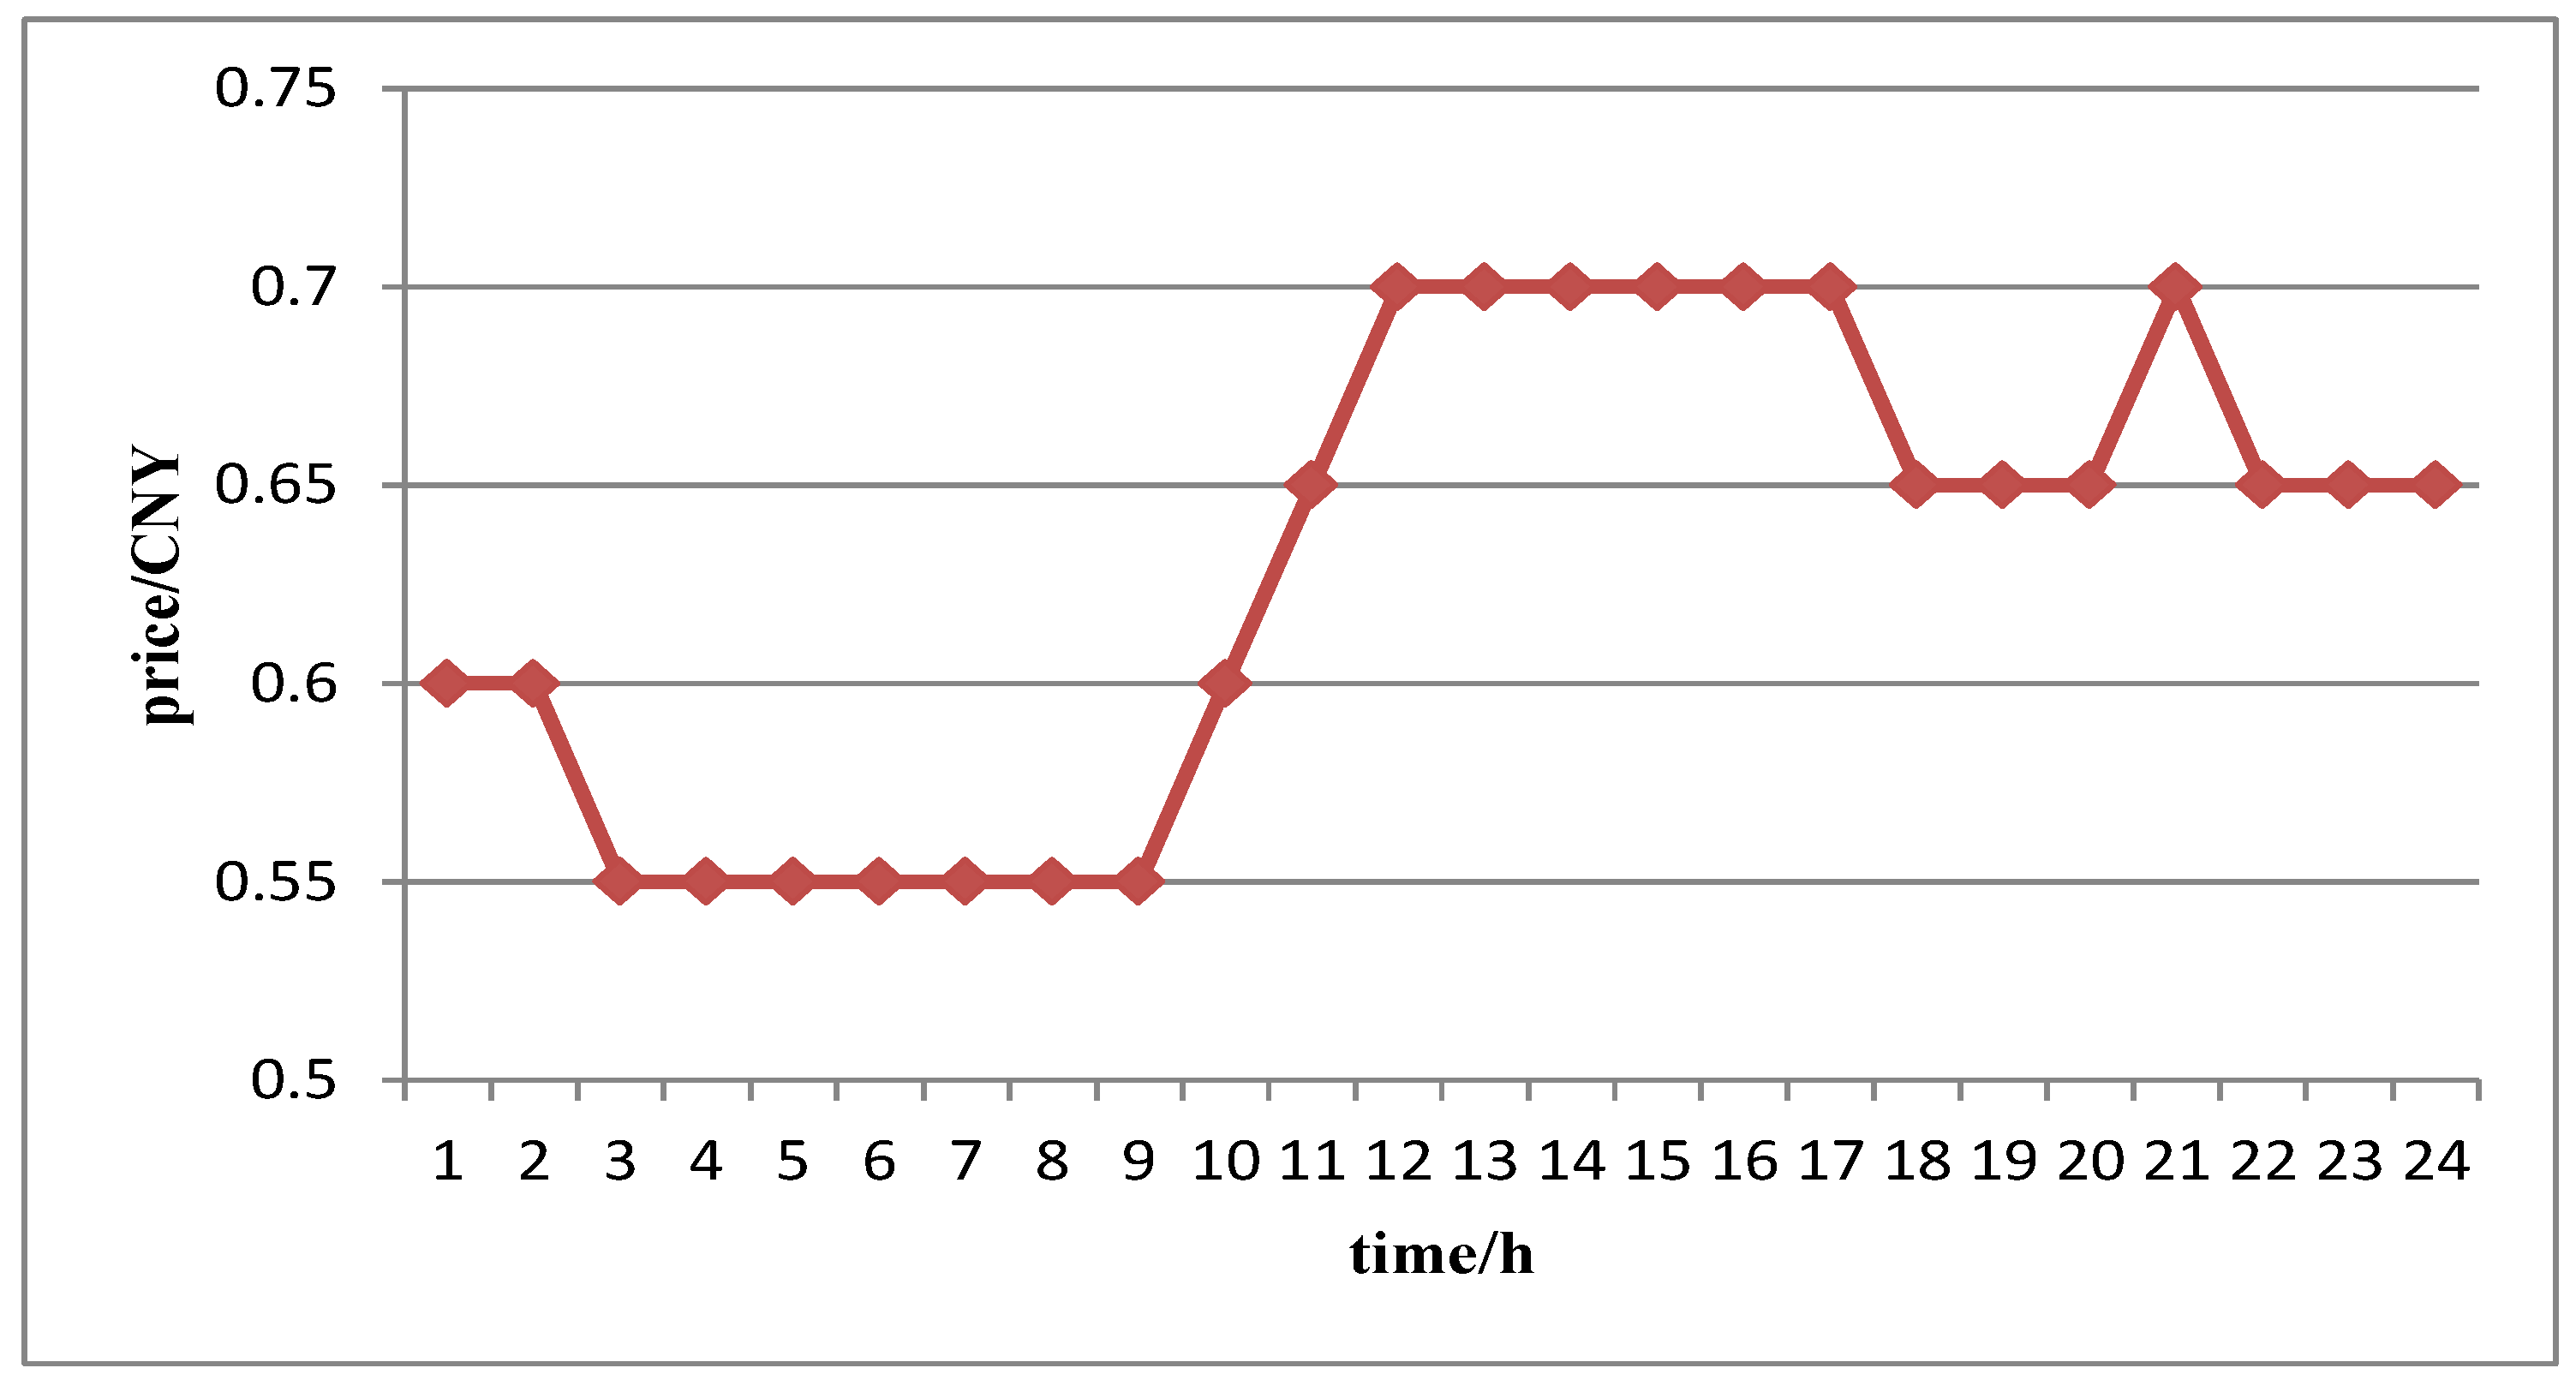
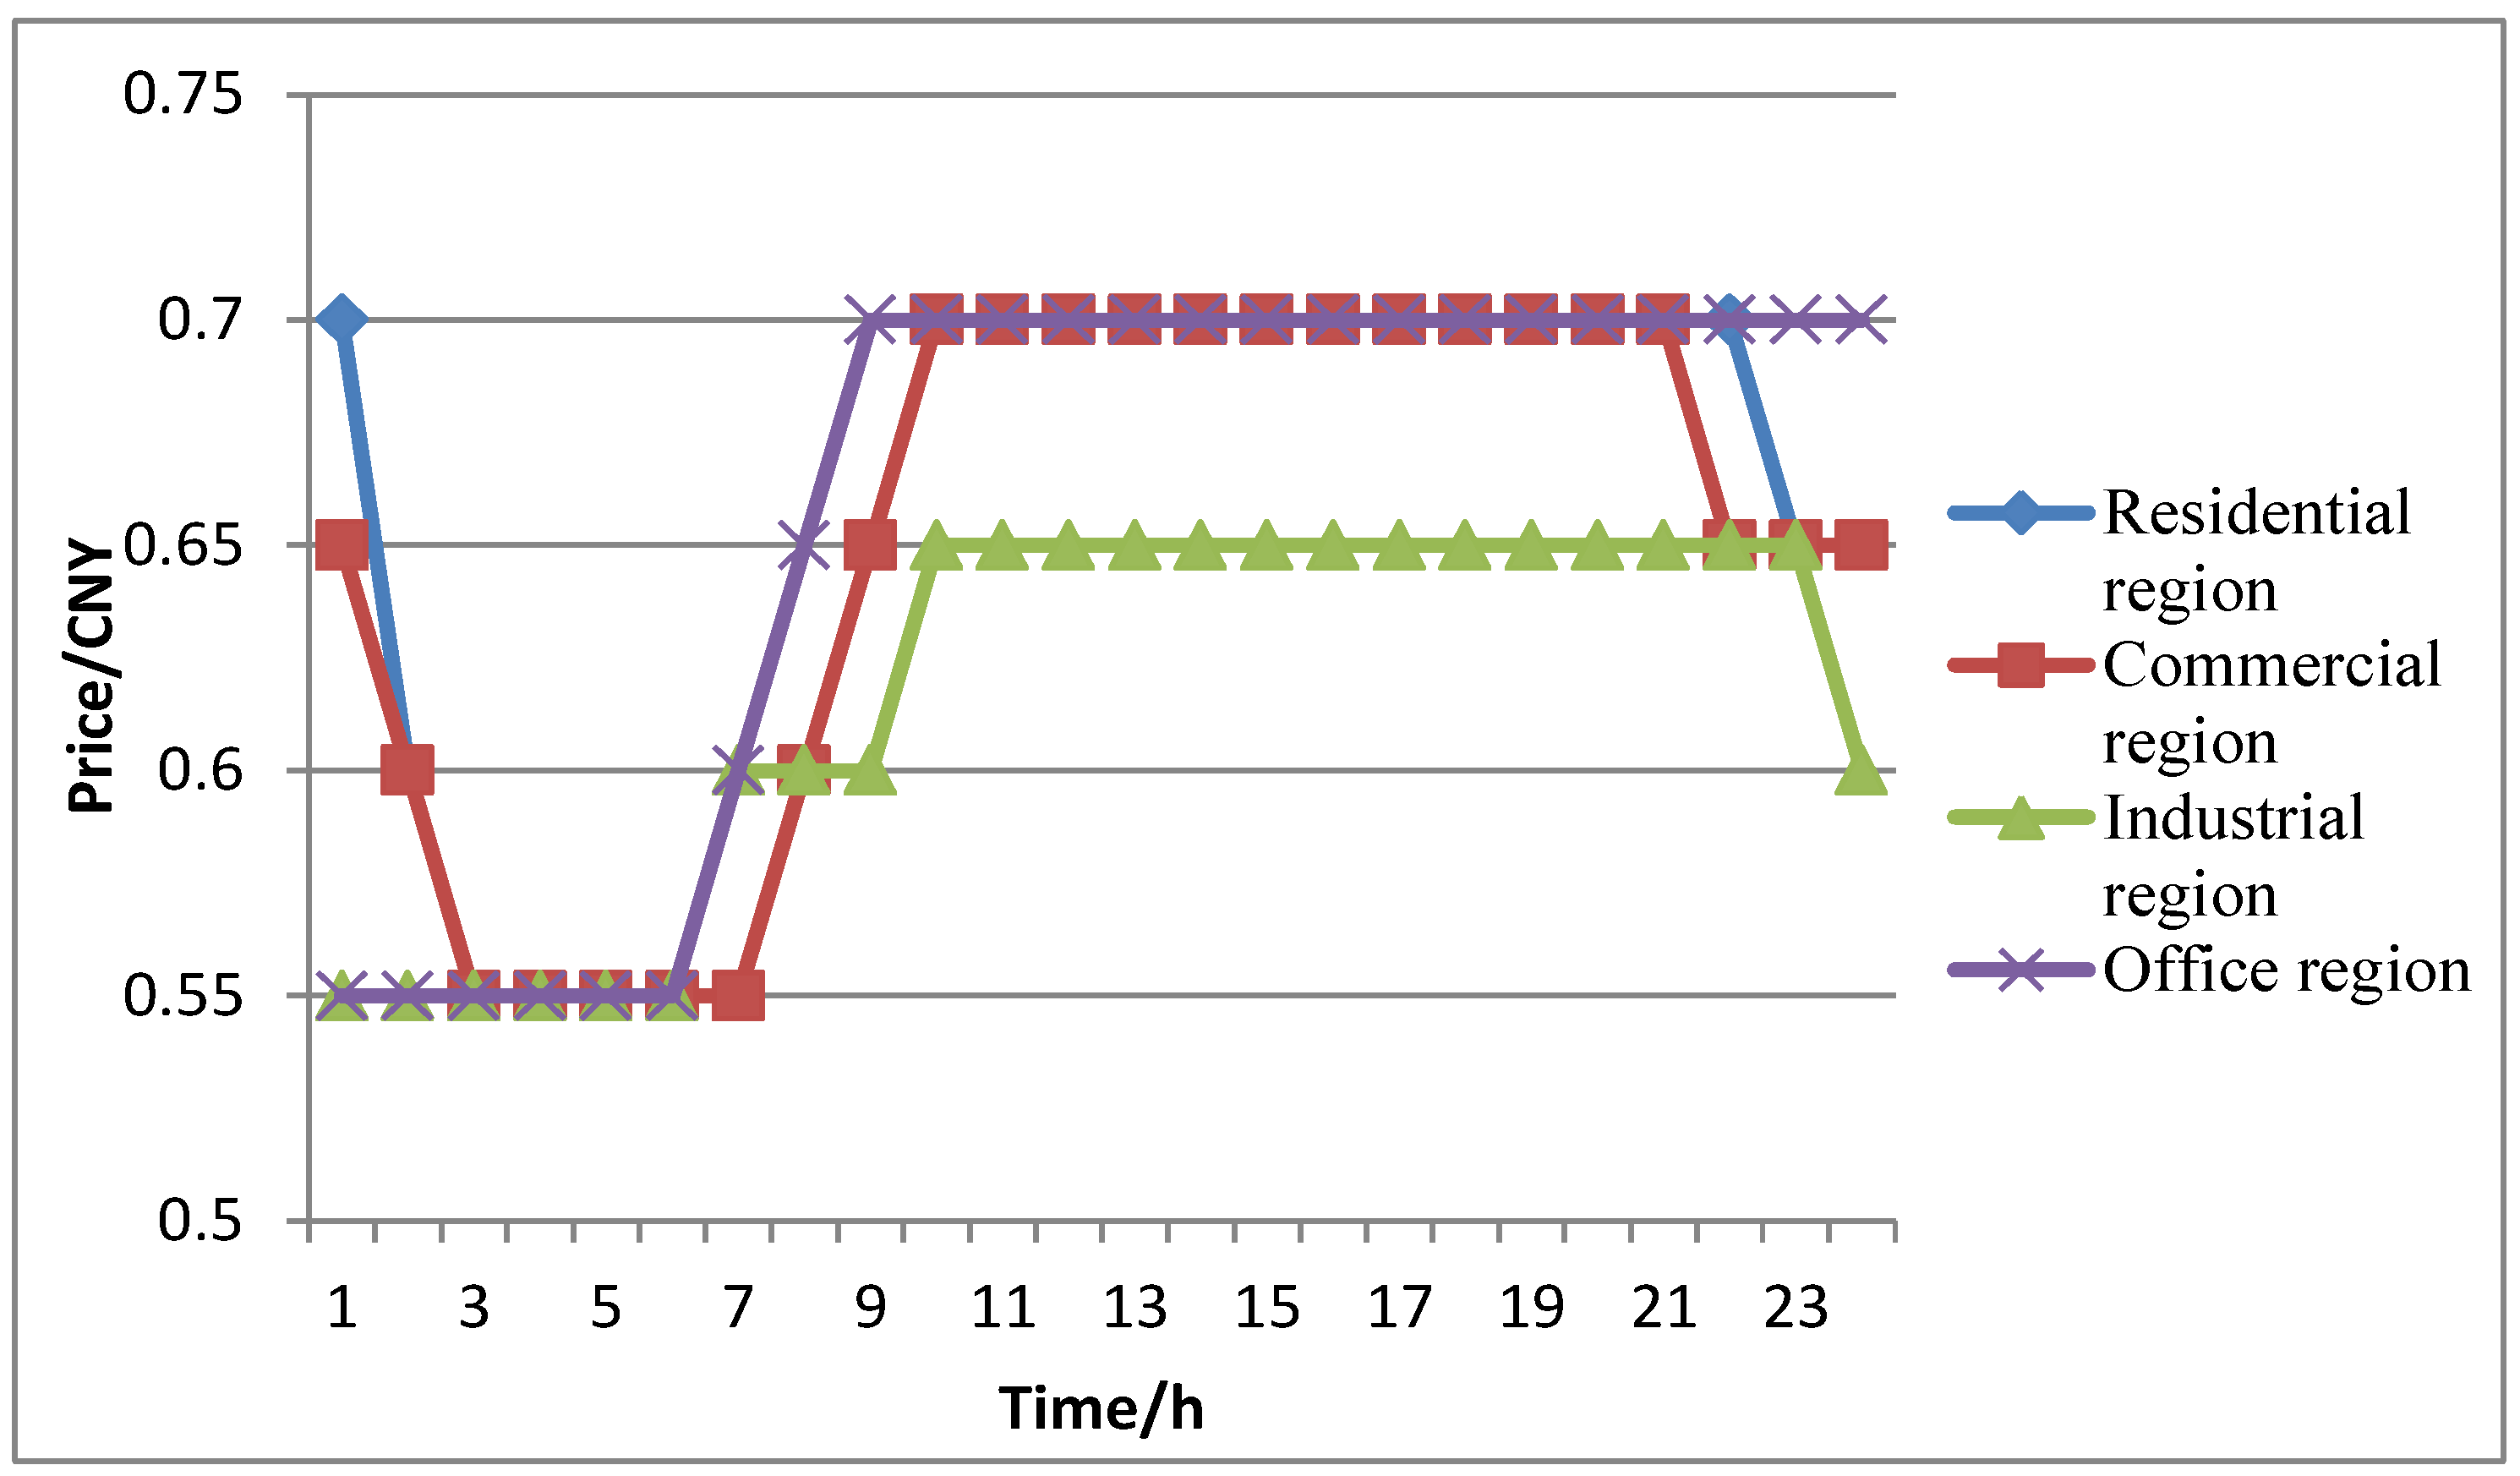
ρ4 is set as 0.70 CNY/kWh. The TOU electricity price and the RTOU electricity price are shown in
Figure 5 and
Figure 6, respectively.
5.1. Optimization Results of the Regional Layer Model
Four cases are studied in this section as follows:
- Case 1:
there are 1200 EVs with uncontrolled charging mode, and the electricity price of charging in this case is set as 0.65 CNY/kWh.
- Case 2:
there are 1200 EVs charging with the proposed optimization strategy, and the user responsivity is considered. The price profiles of charging in this case are shown in
Figure 6.
- Case 3:
there are 1200 EVs charging with the proposed optimization strategy, and the user responsivity isn’t considered. The price profiles of charging in this case are shown in
Figure 6.
- Case 4:
there are 1200 EVs charging with the proposed optimization strategy, and the user responsivity is considered. The price profiles of charging in this case are shown in
Figure 5. Compared with user responsivity to the RTOU electricity price, the phenomenon of EVs charging in the cross-region can be ignored.
The optimization of the regional model is a mixed-integer linear programming (MILP) problem which can be solved by the GMP-CPLEX solver in AIMMS [
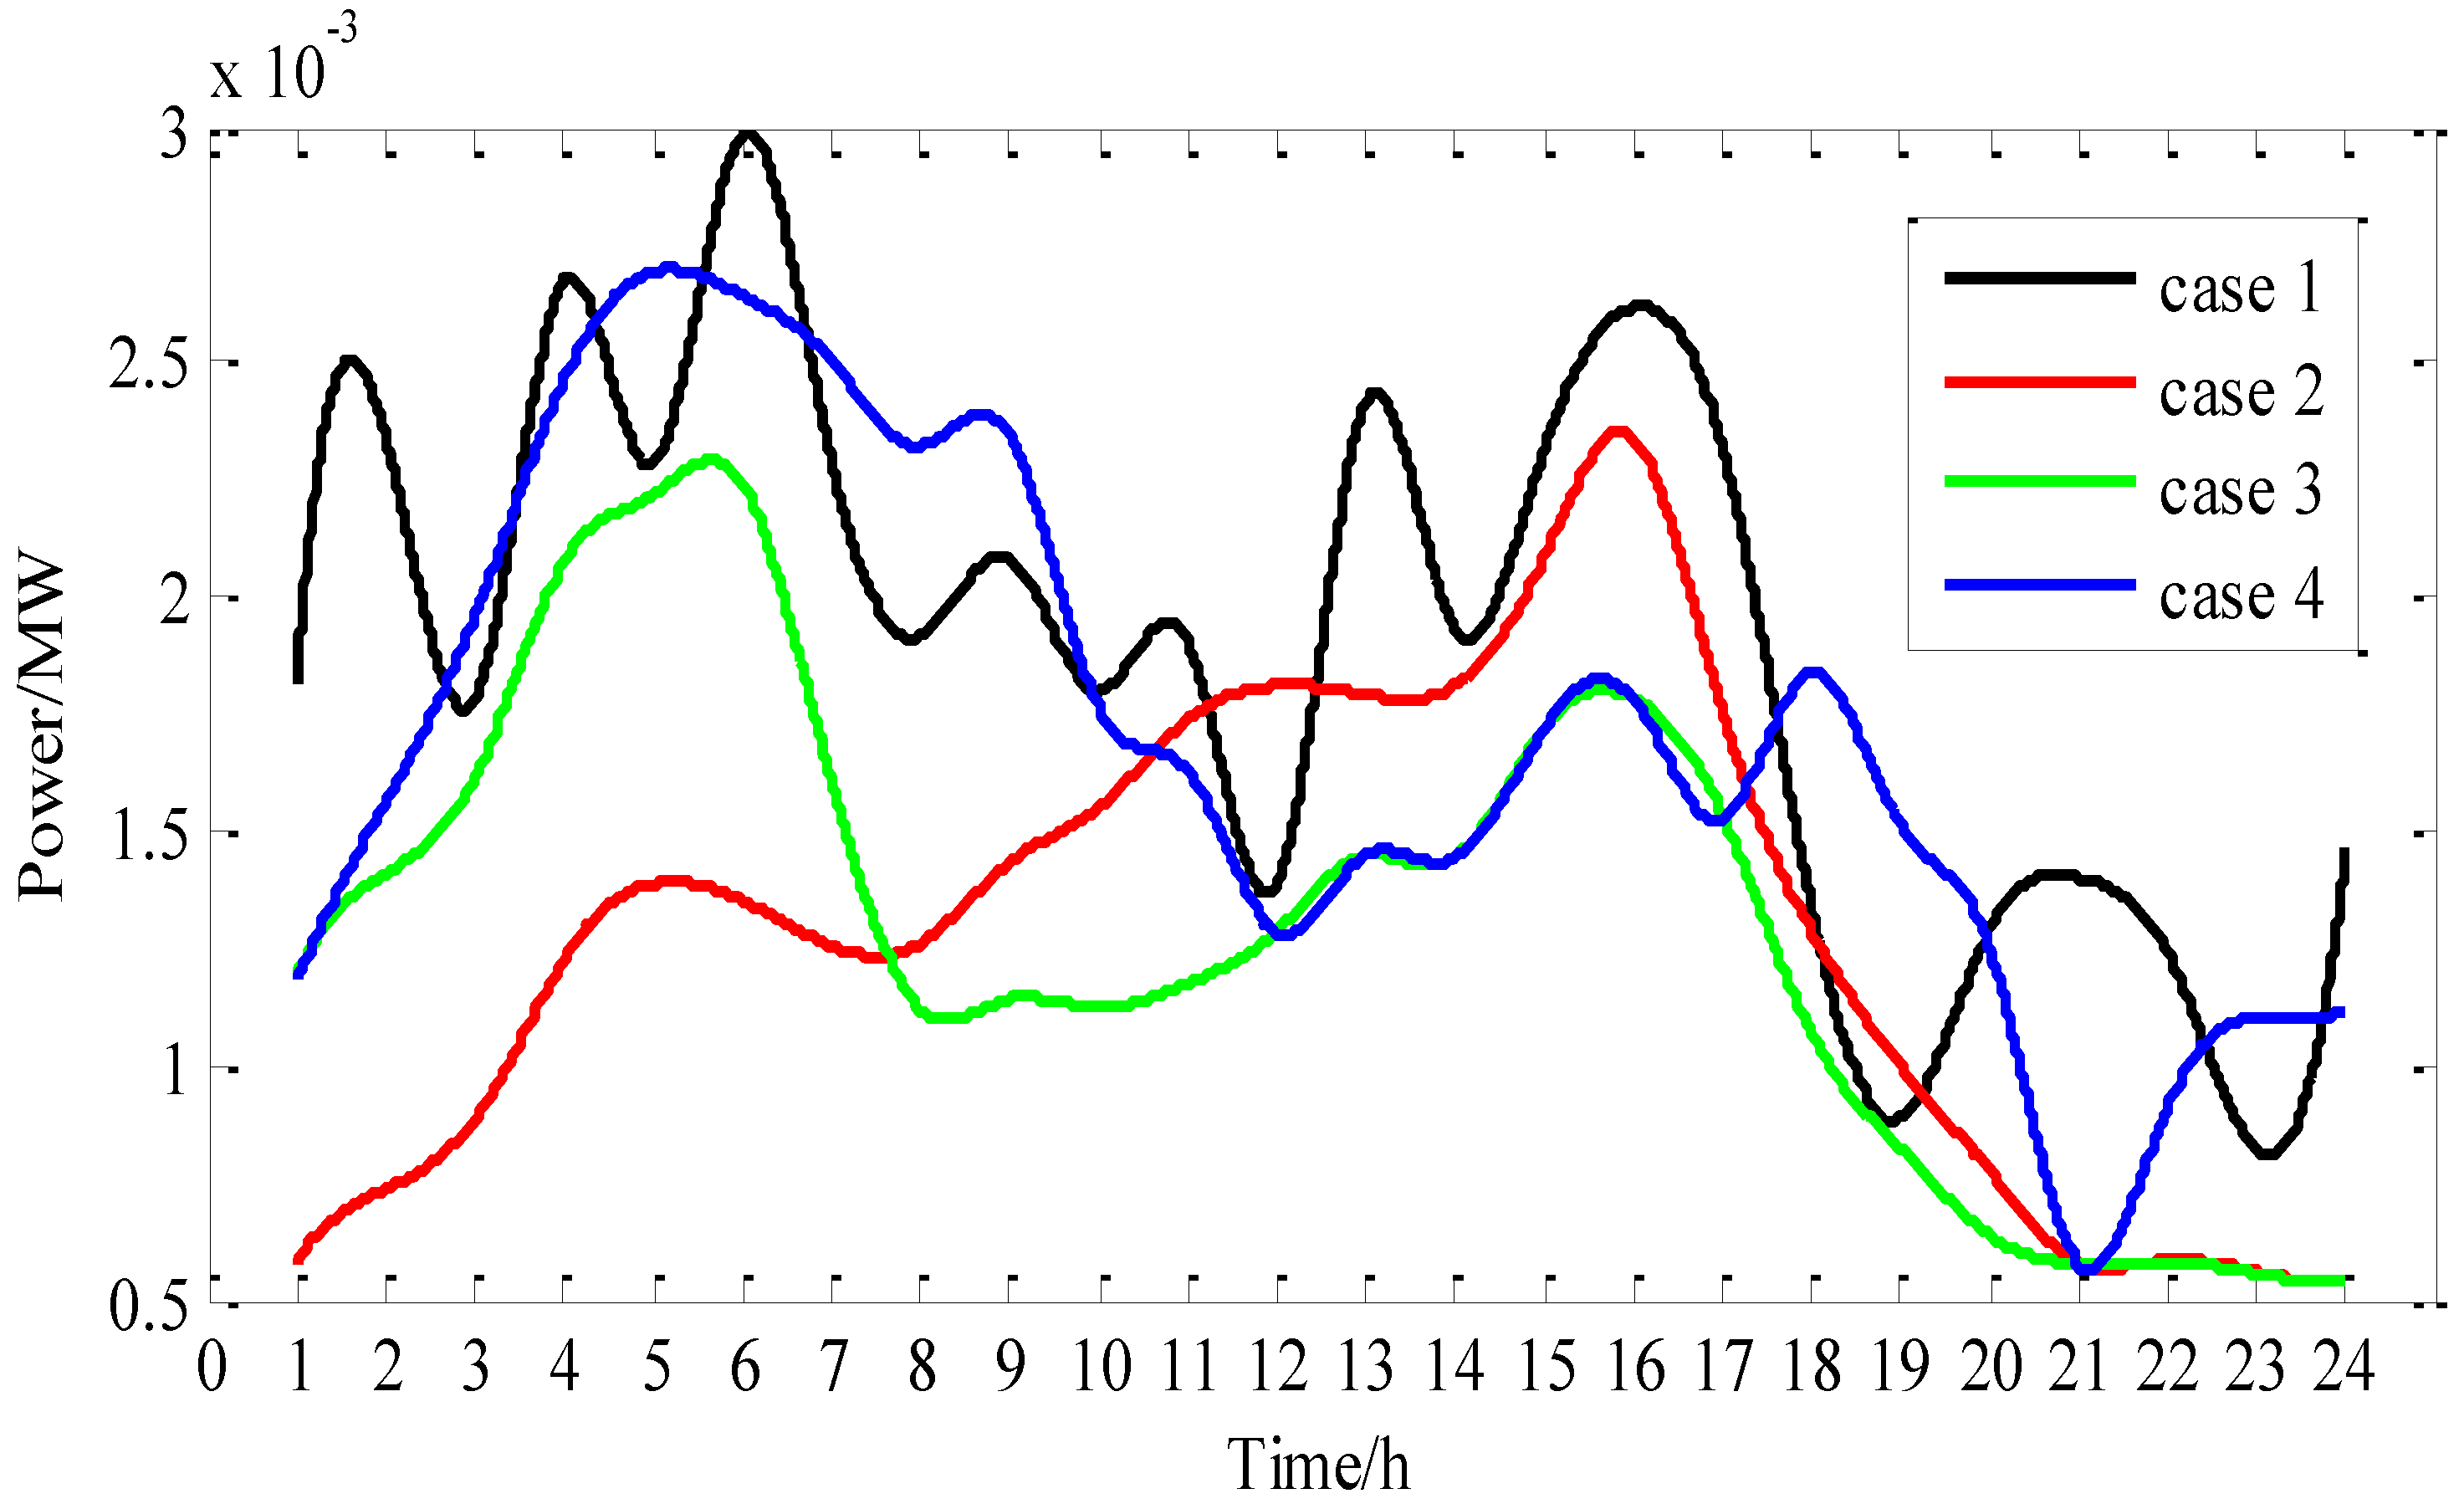
34]. The expectations of the objective function, peak-valley difference and charging cost for four cases are shown in
Table 2, and the load curves are shown in
Figure 7. Compared with case 1, the peak-valley difference and the user charging cost are decreased in cases 2, 3, 4. Without considering user responsivity in case 3, the performance of the peak-valley difference and the user charging cost will be better than that in case 2, because all the EVs are dispatched to charge by the RTOU electricity price. Compared with case 4 using the TOU electricity price, the optimal results of case 2 using the RTOU electricity price will be better.
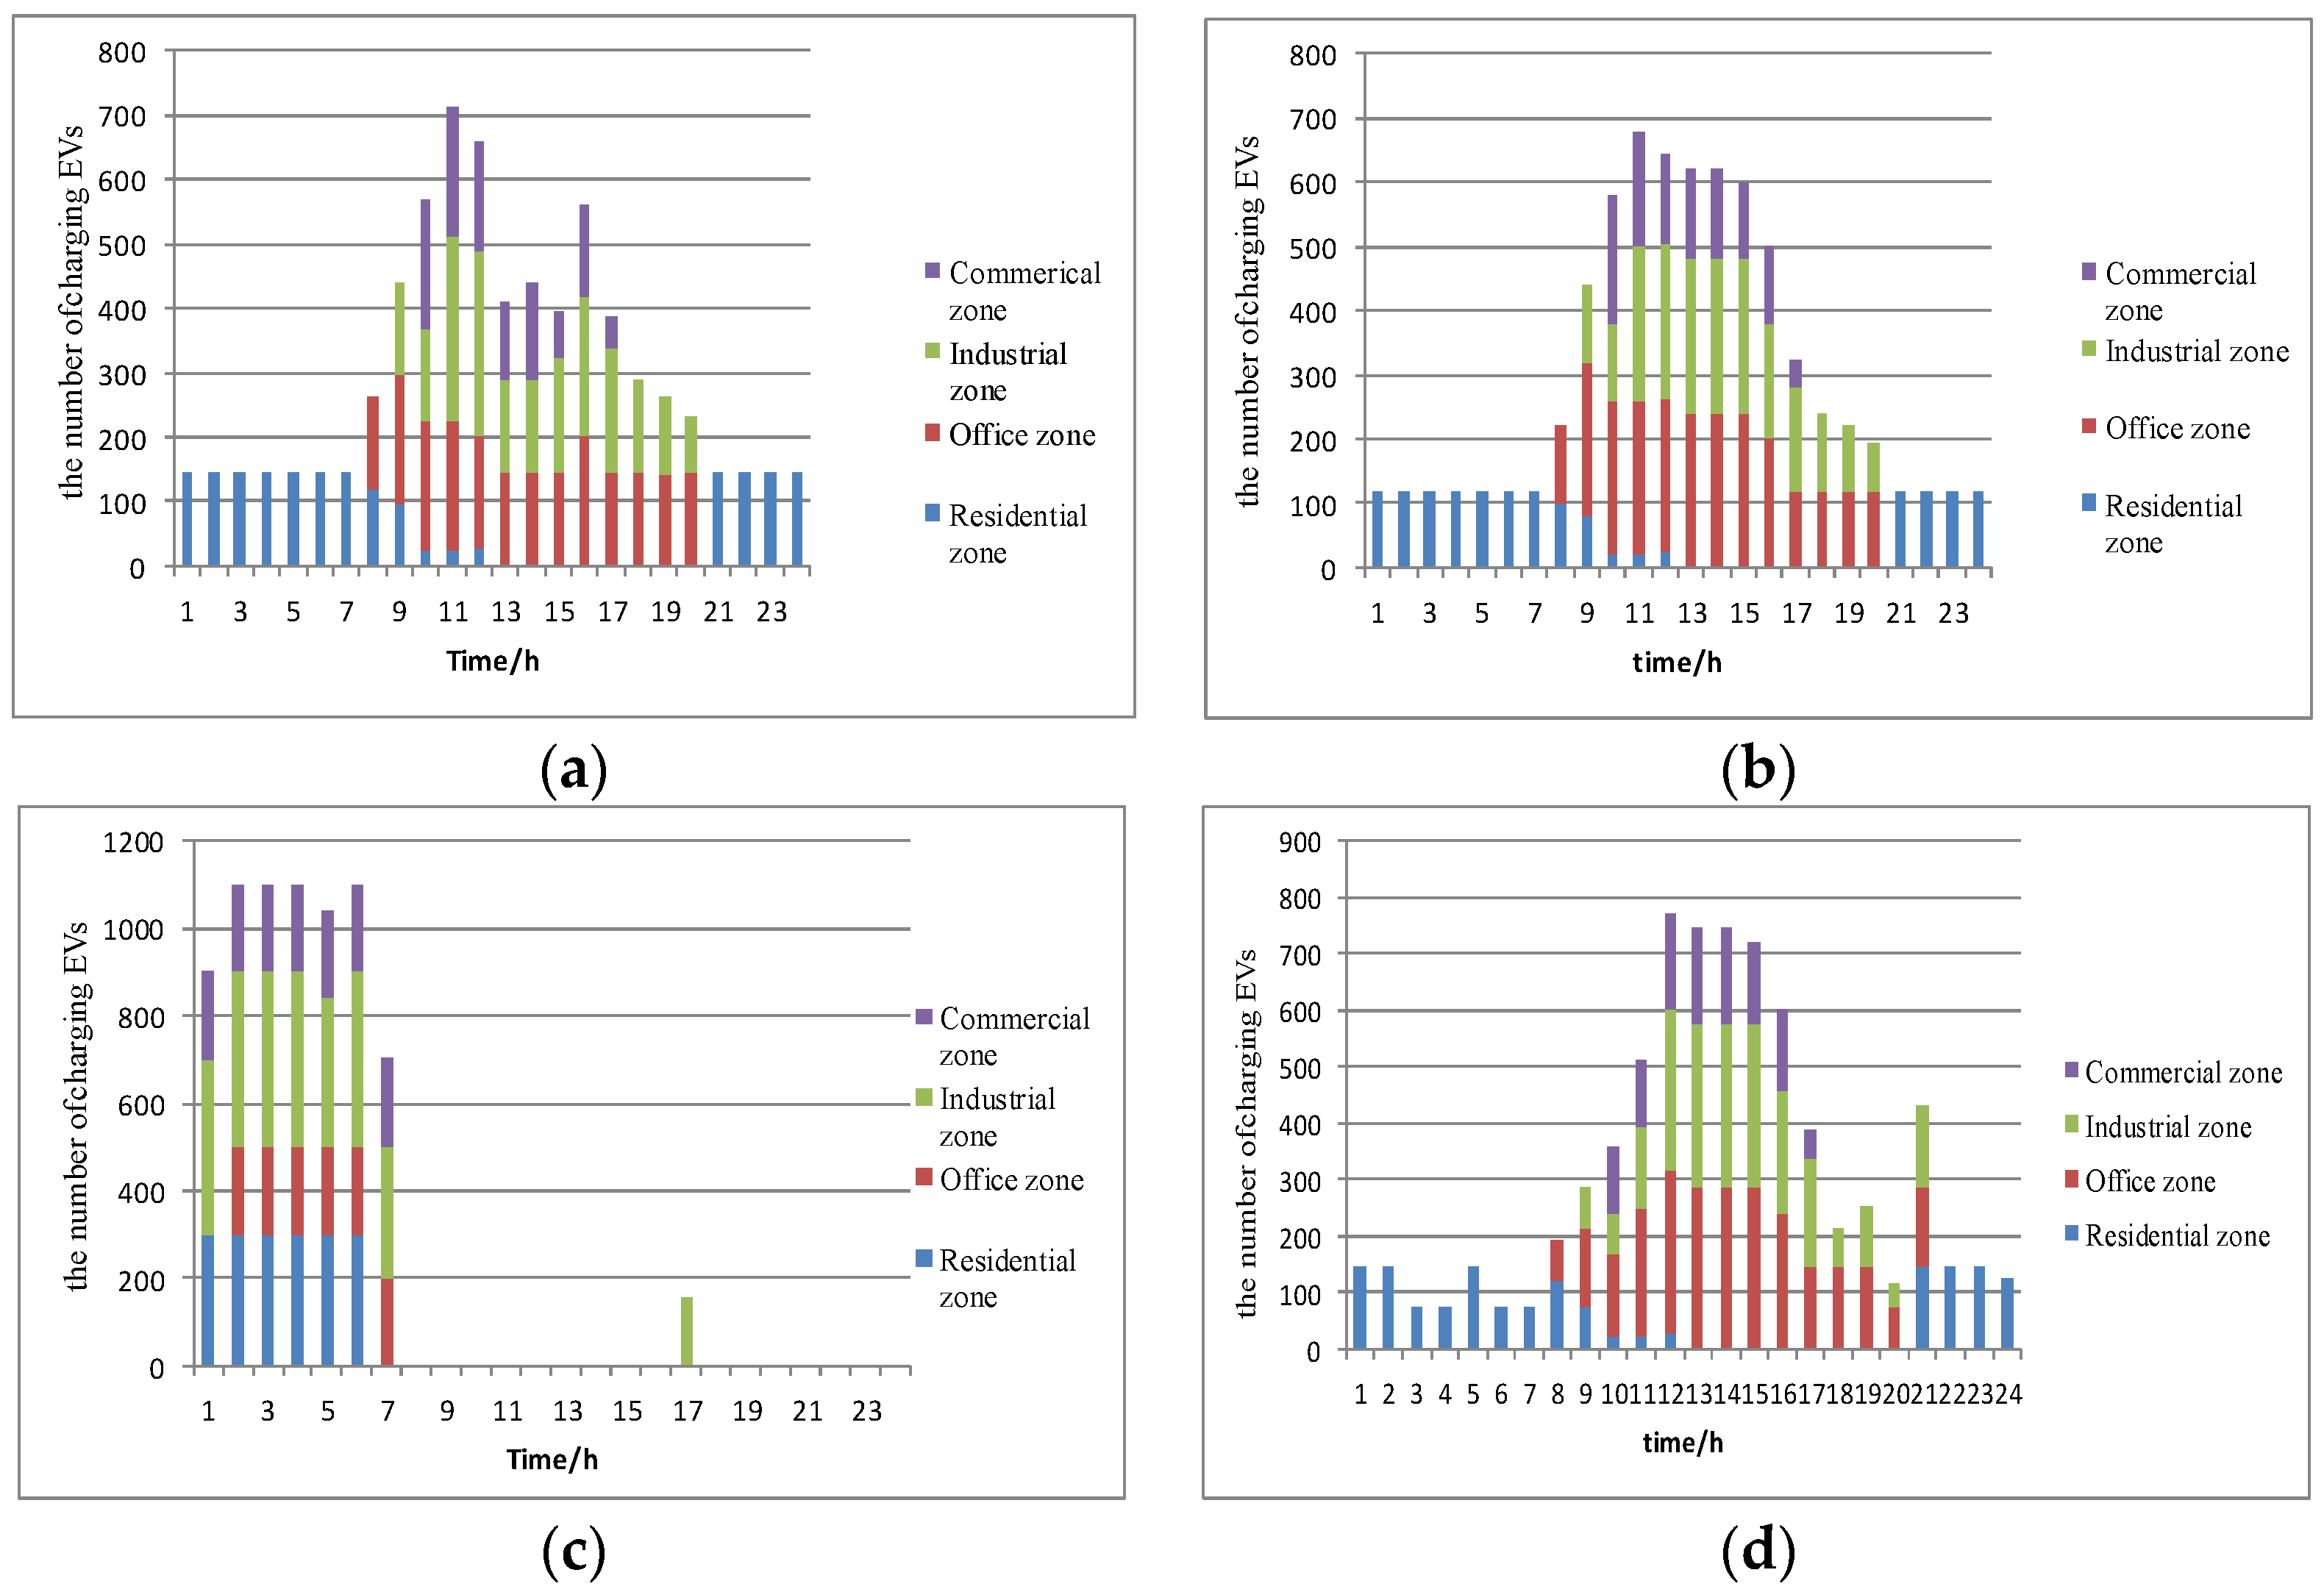
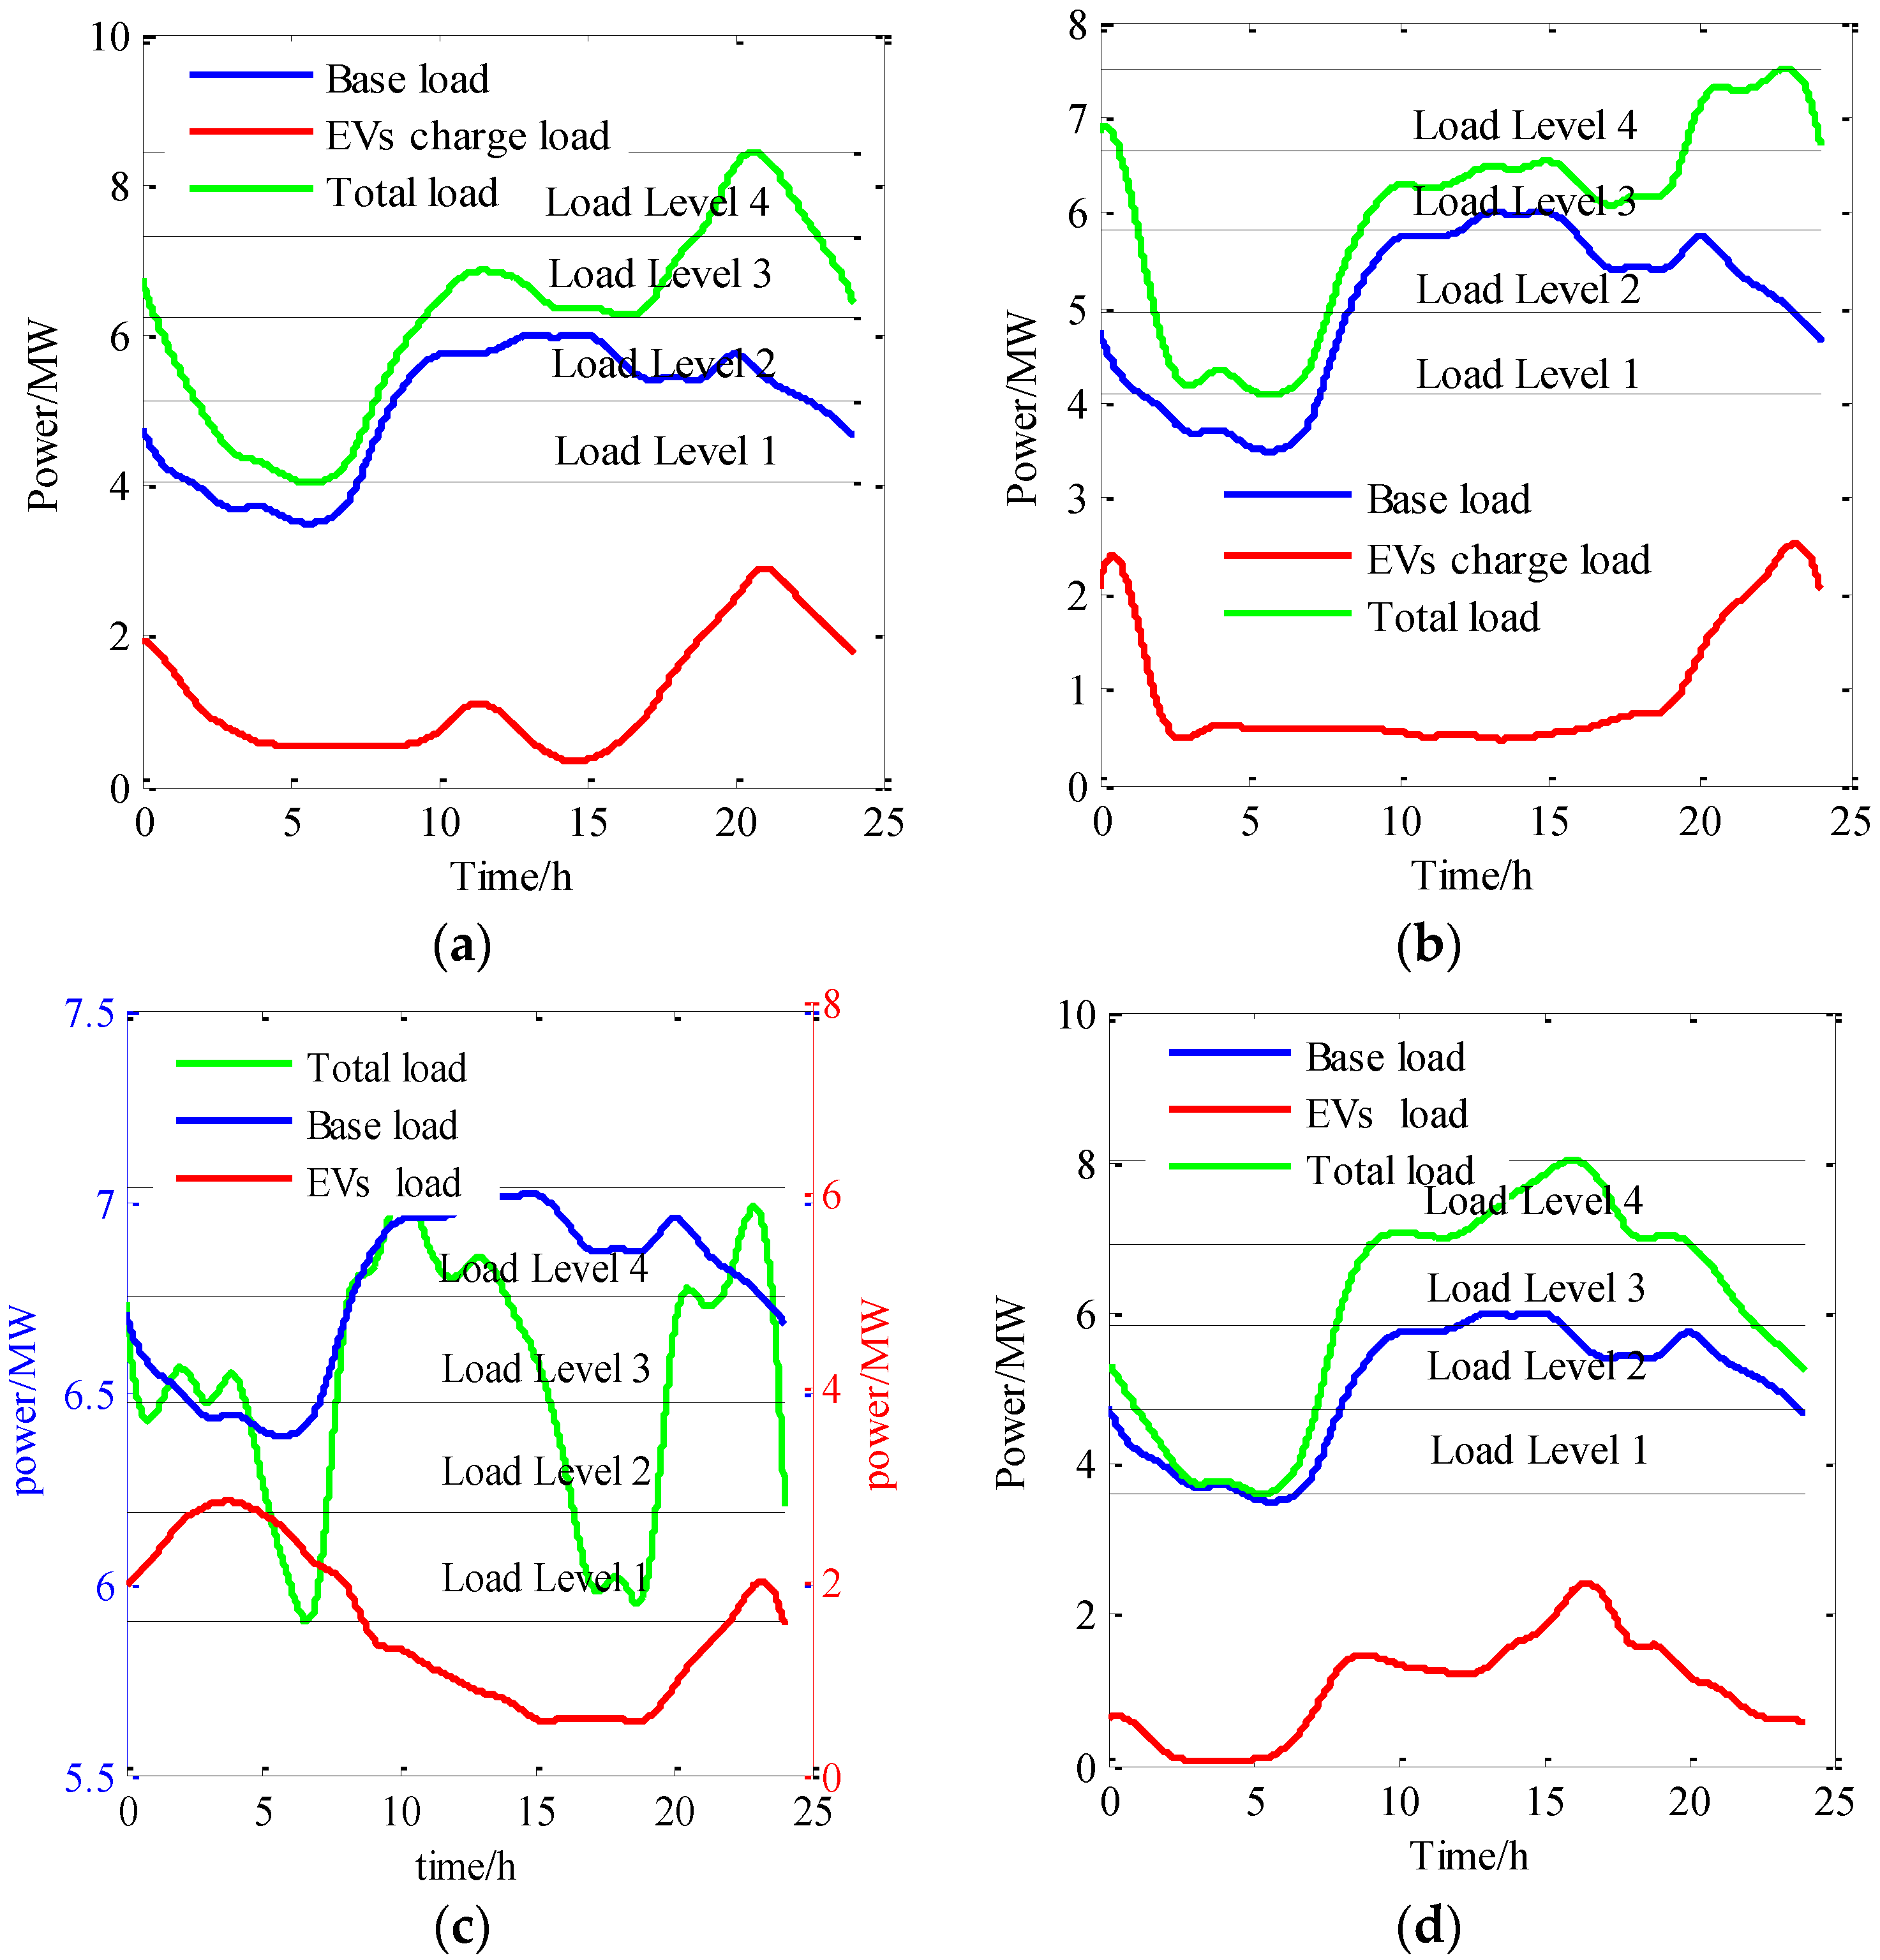
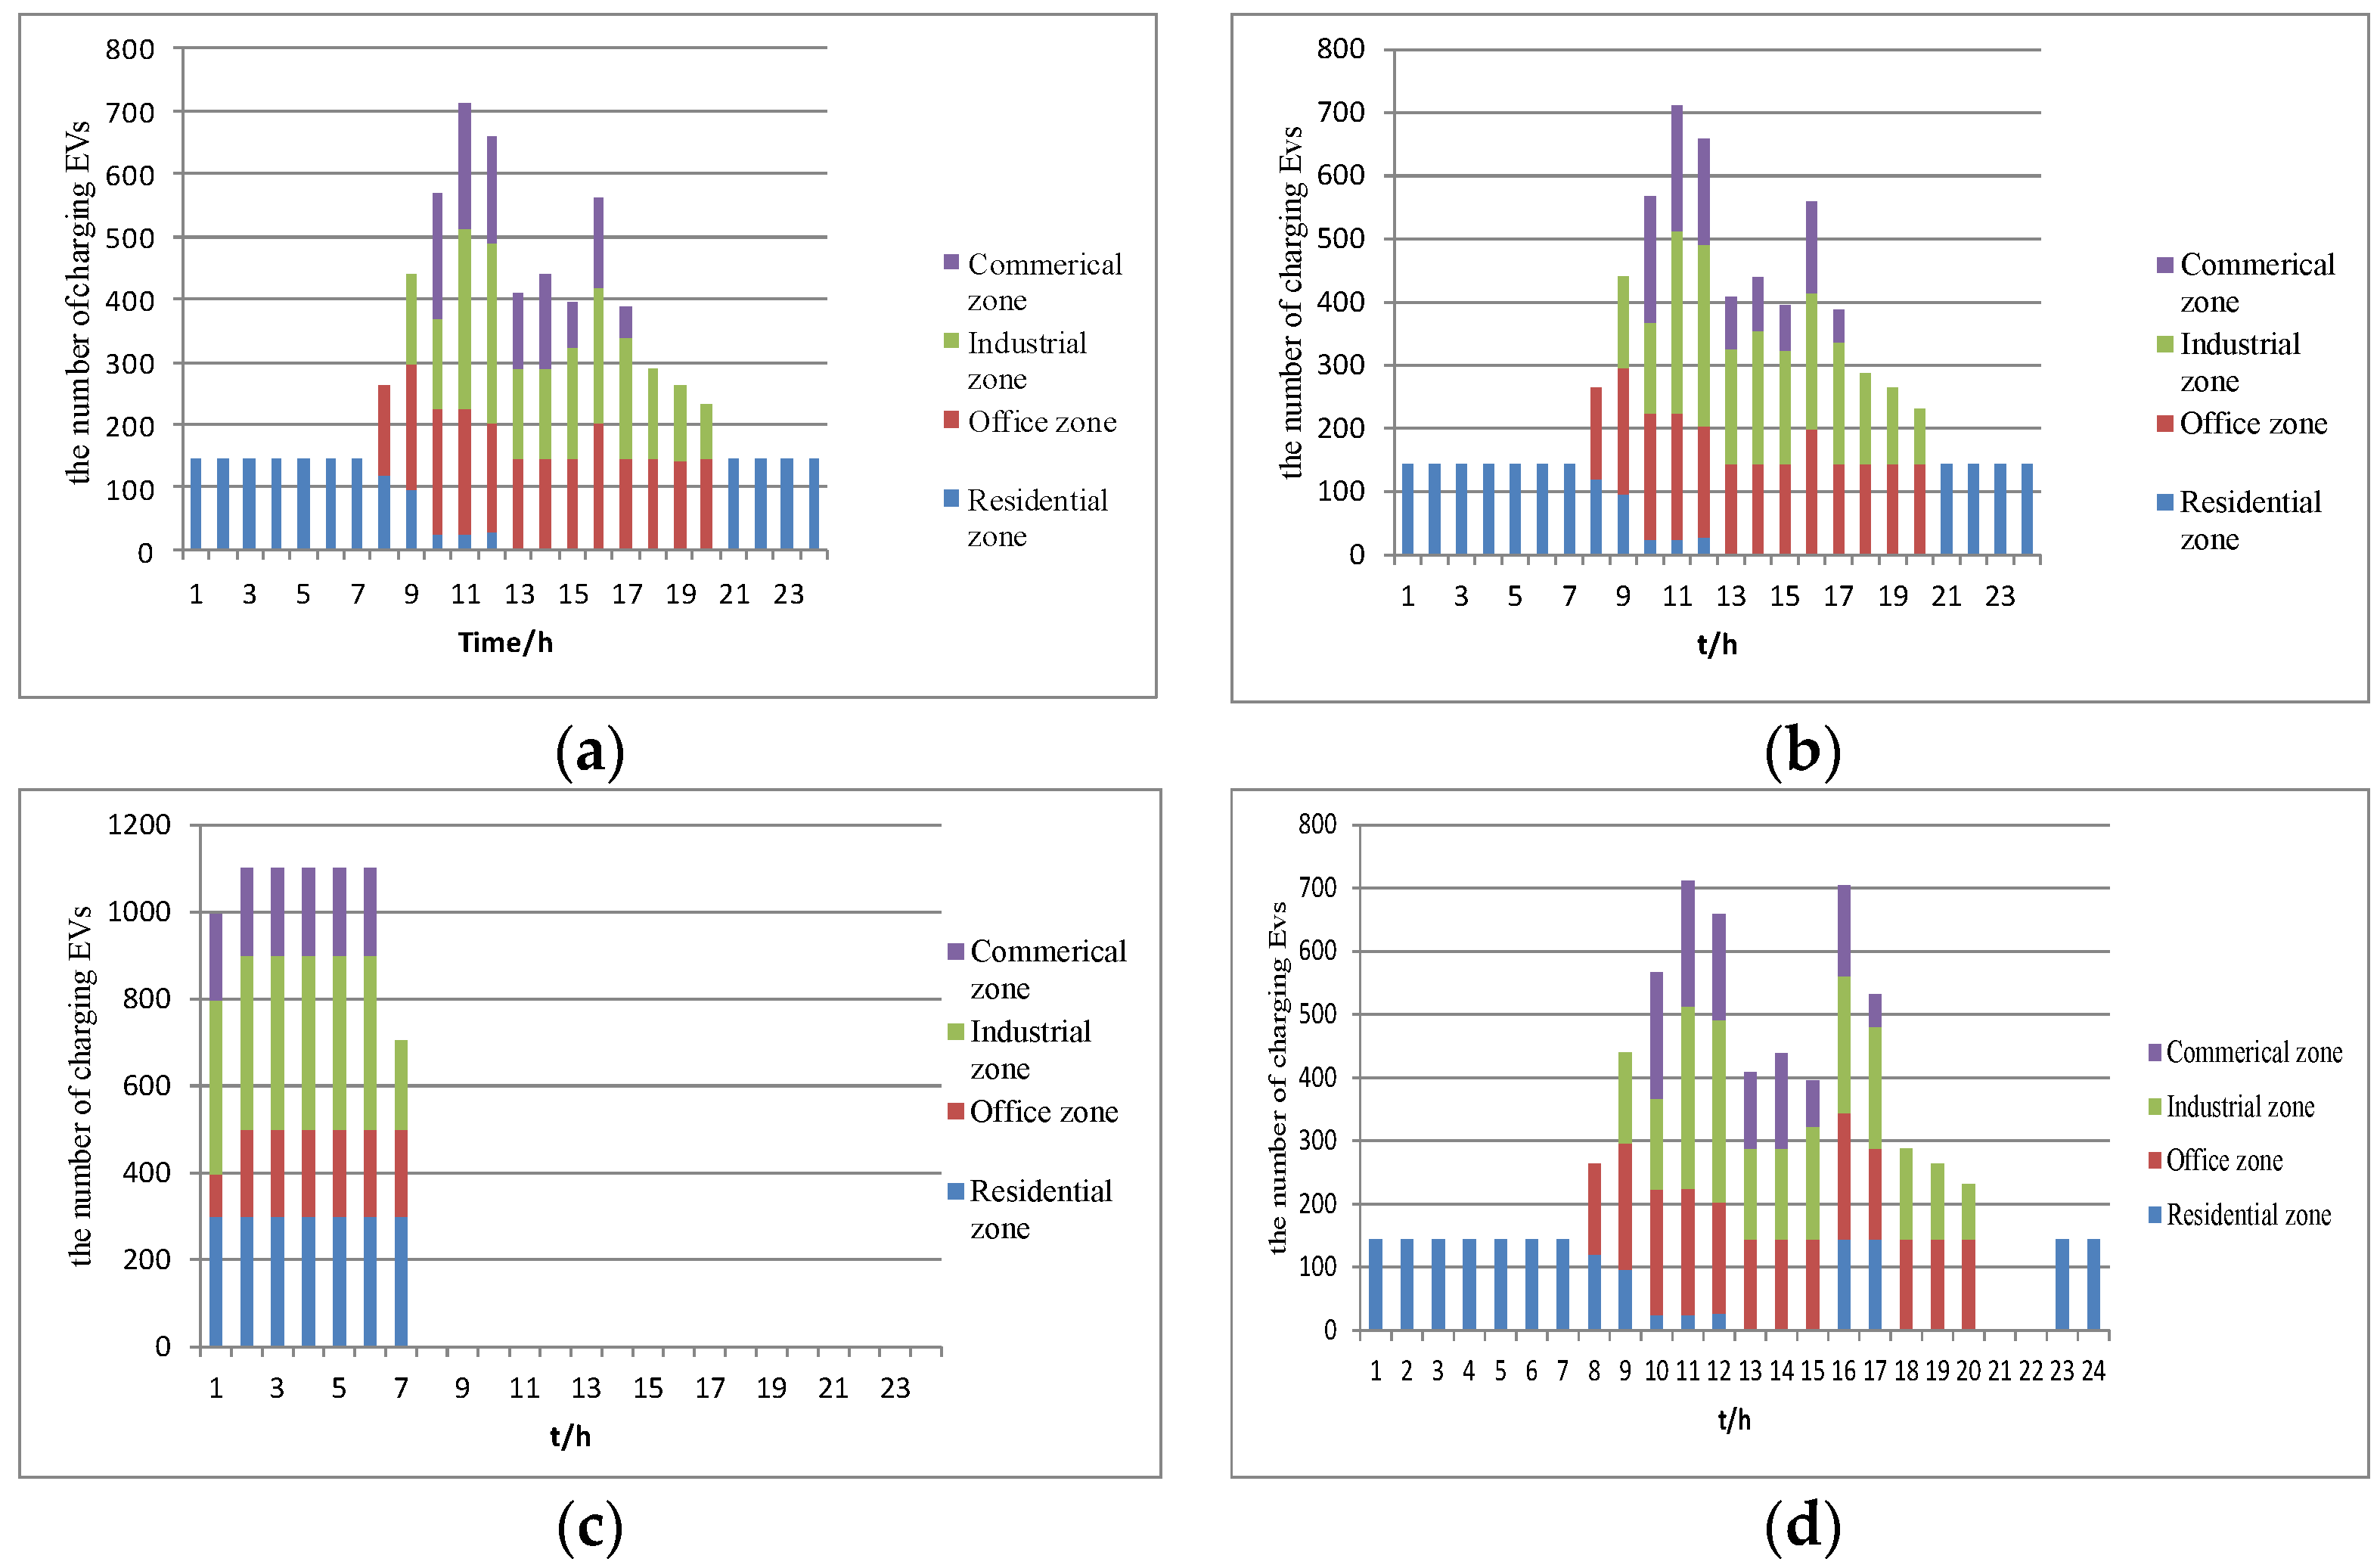
The optimization results in the regional layer model are shown in
Figure 8. Compared to the random charging behaviors of EVs in case 1, the optimized charging loads of EVs are concentrated at the time when the basic load and electricity price are small in cases 2–4. The impacts of user responsivity on EVs schedule are compared between case 2 and case 3. Without considering user responsivity in case 3, the total charging loads of EVs may concentrate during 1:00 a.m.–7:00 a.m. However, partial EVs prefer to charge at 8:00 a.m.–10:00 a.m. and 17:00 p.m.–19:00 p.m. in case 2. The impacts of different price profiles on EVs scheduling are compared between case 2 and case 4. Compared with case 2 using the RTOU electricity price, more EVs charging load concentrates at the time when the electricity price is small.
The regional simulation results are analyzed when different RTOU electricity prices and price elasticity coefficients are considered, so as to verify this paper’s viewpoint.
When
ρ1 is set as 0.5 CNY/kWh;
ρ2 is set as 0.65 CNY/kWh;
ρ3 is set as 0.75 CNY/kWh;
ρ4 is set as 0.90 CNY/kWh, the simulation results of the four cases are shown as
Figure 9.
From
Table 3, it is concluded that the change of tariff may only affect the specific values of scheduling results, but not change the qualitative conclusions shown in this paper. When driving habits, SOC of batteries and external environment change, the number of responsive EVs will change accordingly. In this paper, it means that the price elasticity coefficients will change.
Table 4 shows the simulation results of different price elasticity coefficients. In
Table 4, the change of price elasticity coefficients may only affect the specific values of scheduling results, but not change the qualitative conclusions. Moreover, driving habits, SOC of batteries and external environment have no effect on the proposed scheduling strategy.
5.2. The Optimization Results of the Node Layer Model
Four cases are studied in this section as follows:
- Case 5:
The number of EVs charging in the four regions is the same as case 1, and the charging behaviors of EVs are uncontrolled.
- Case 6:
The number of EVs charging in the four regions is the optimization results in case 2.
- Case 7:
The number of EVs charging in the four regions is the optimization results in case 3.
- Case 8:
The number of EVs charging in the four regions is the optimization results in case 4.
The optimization problem is a mixed-integer nonlinear programming (MINLP) which can be solved by the GMP-AOA solver in AIMMS [
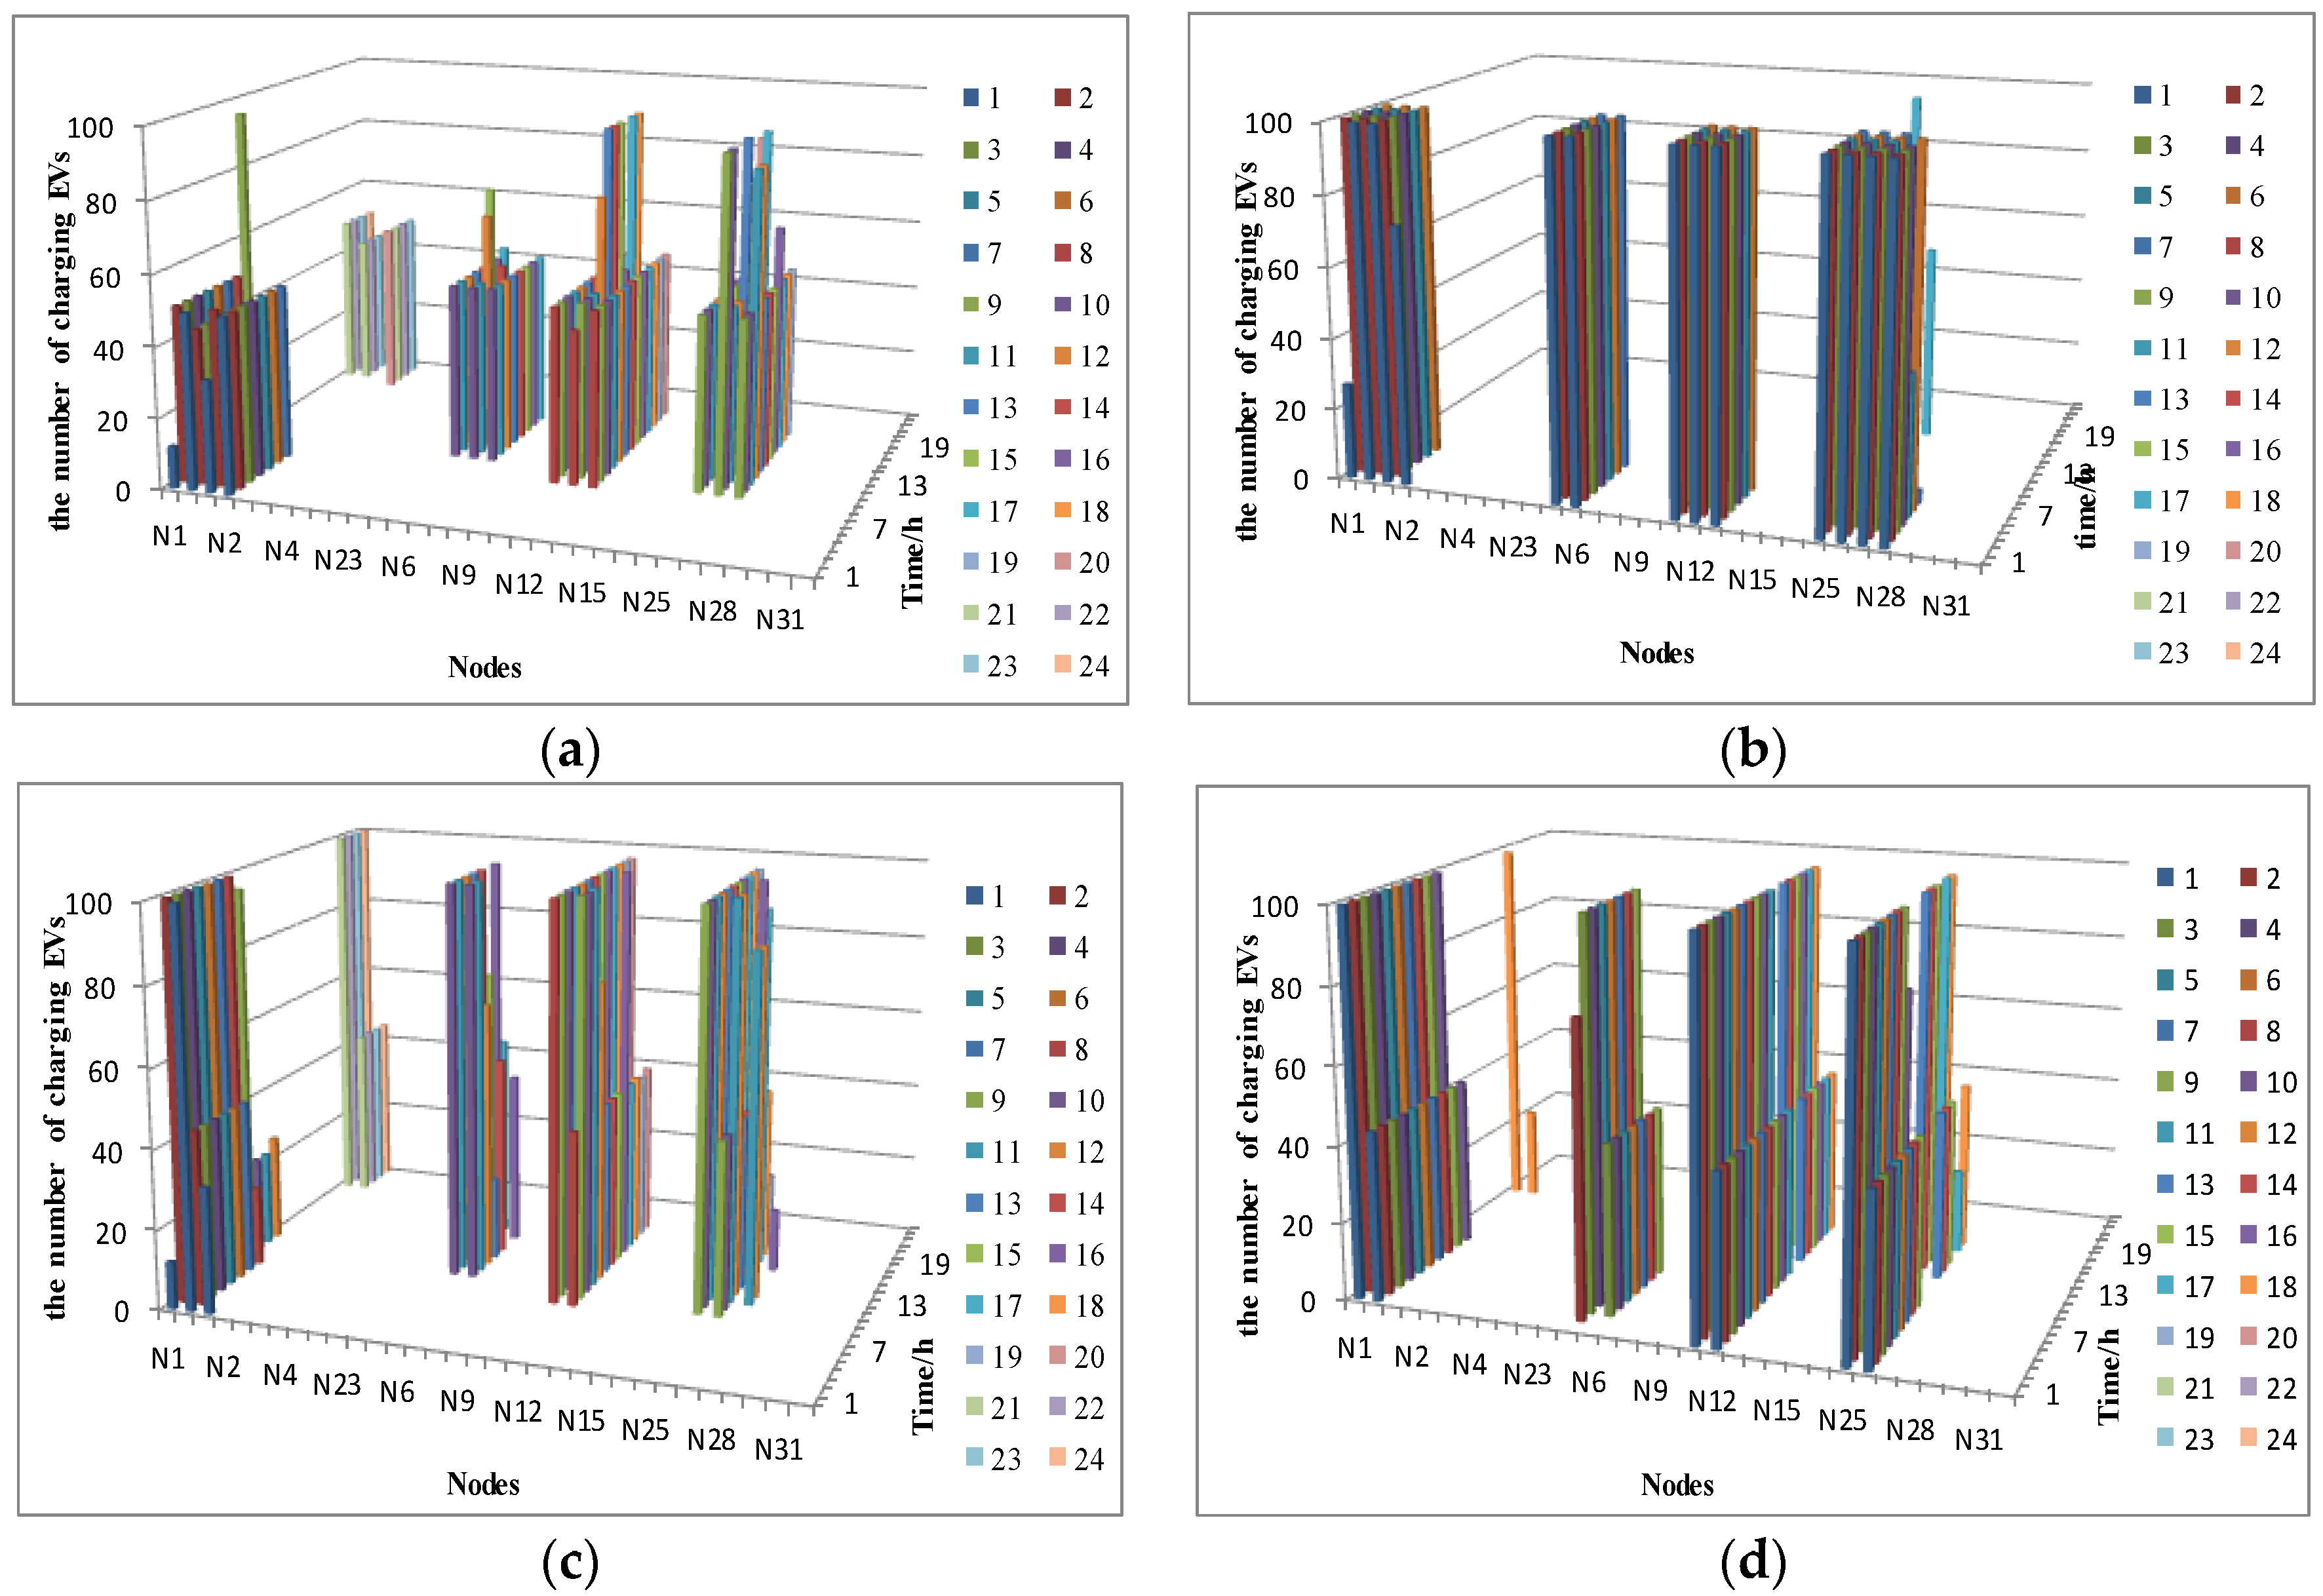
34]. The optimization results in the node layer model are shown in
Figure 10.
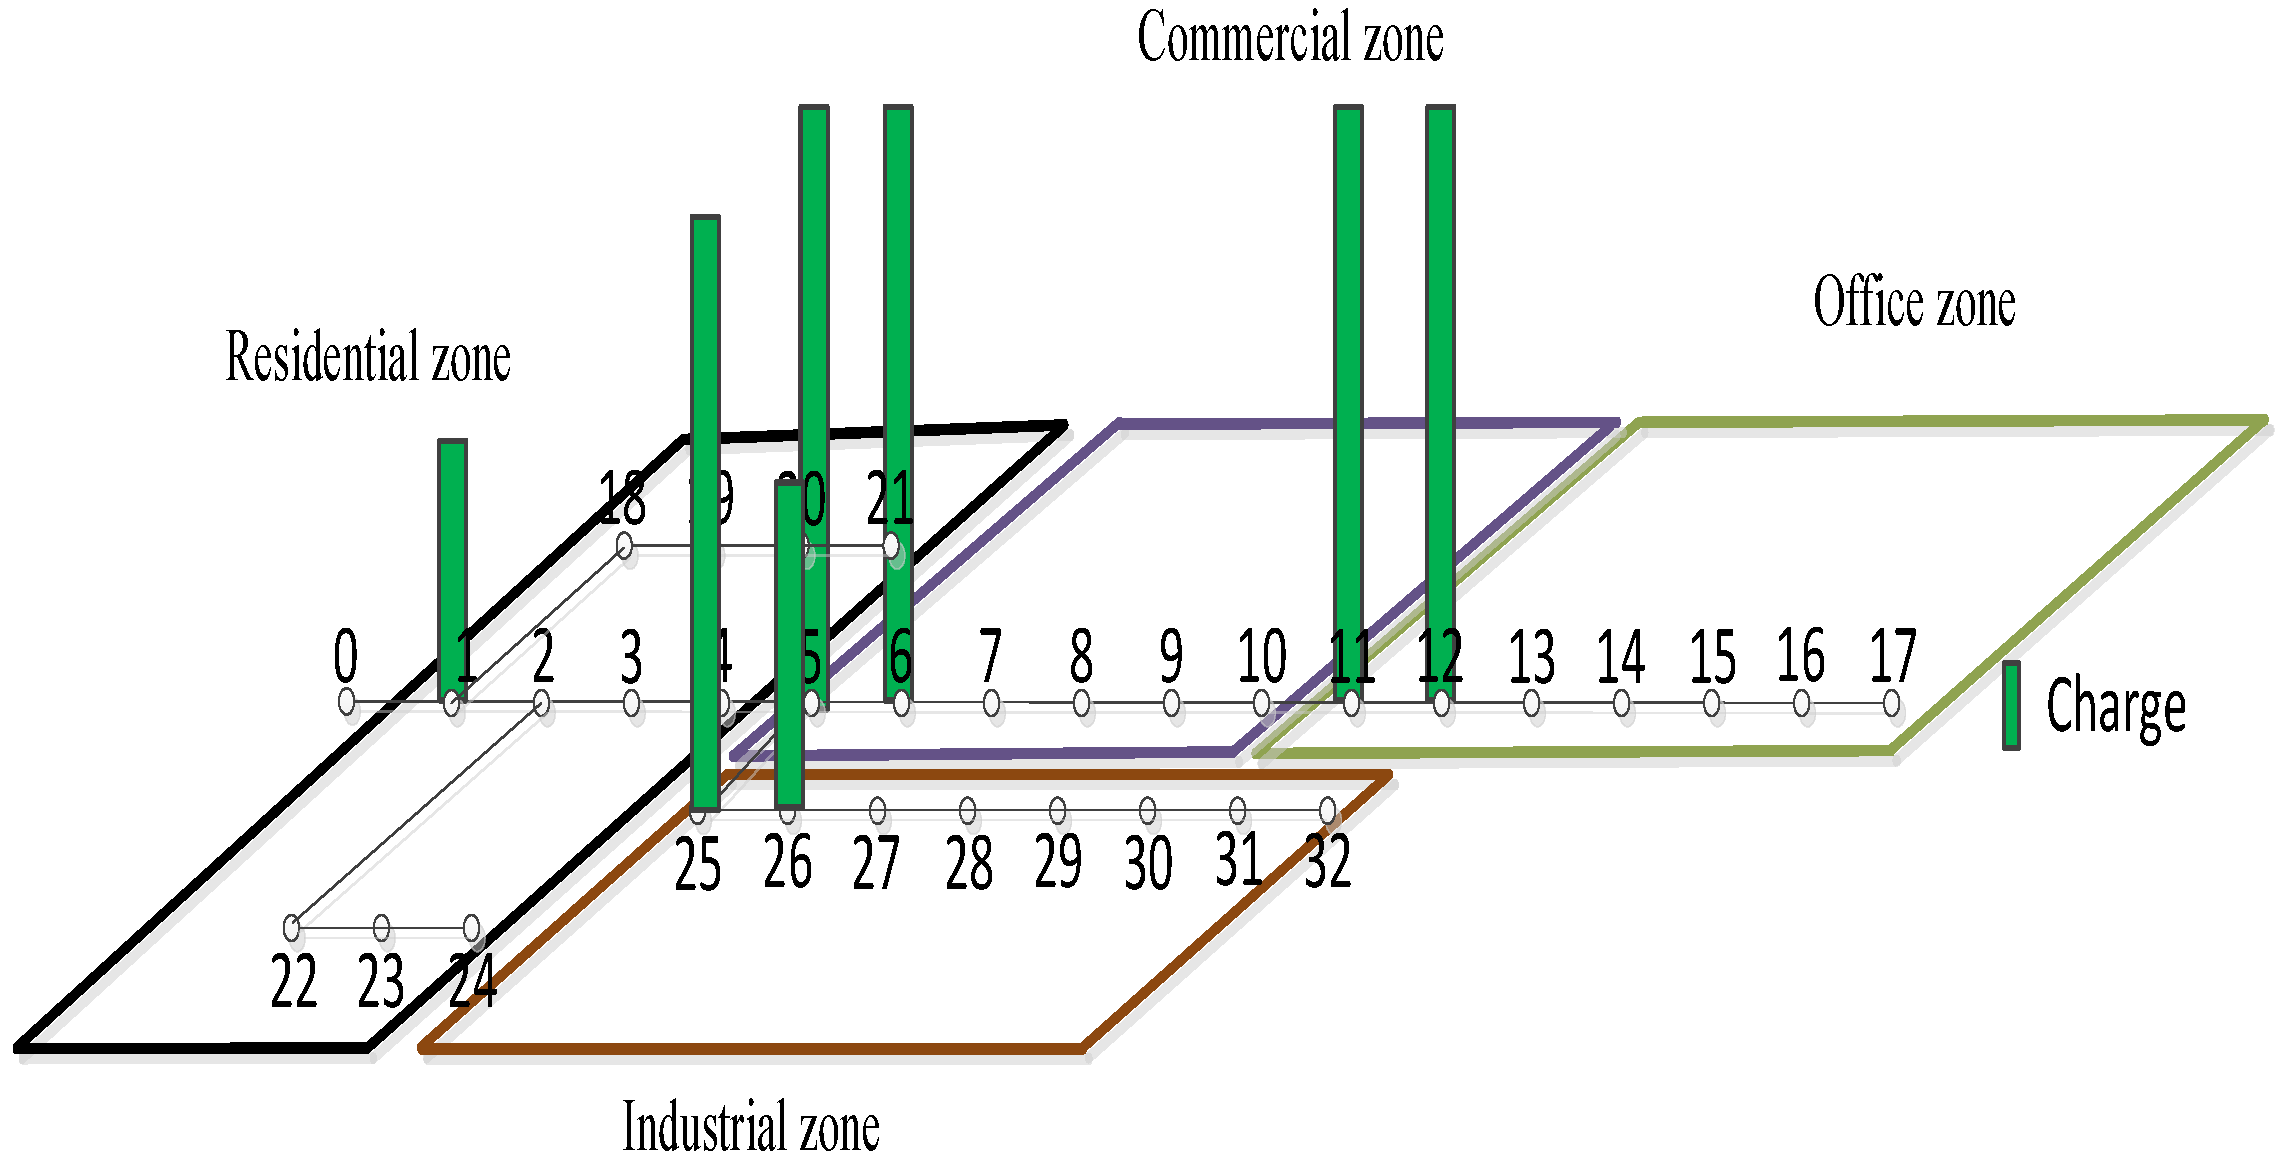
Figure 11 shows the EVs spatial distribution at 10:00 a.m. in case 6. From
Figure 10 and
Figure 11, the conclusion can be drawn that the optimized spatial charging distributions of EVs are concentrated in the nodes 1, 18, 5, 6, 11, 12, 13, 25, 26, 27 and 28 close to the beginning bus of each region. Thus, if the charging stations are located in the aforementioned nodes, the network losses caused by EVs charging loads can be well reduced.
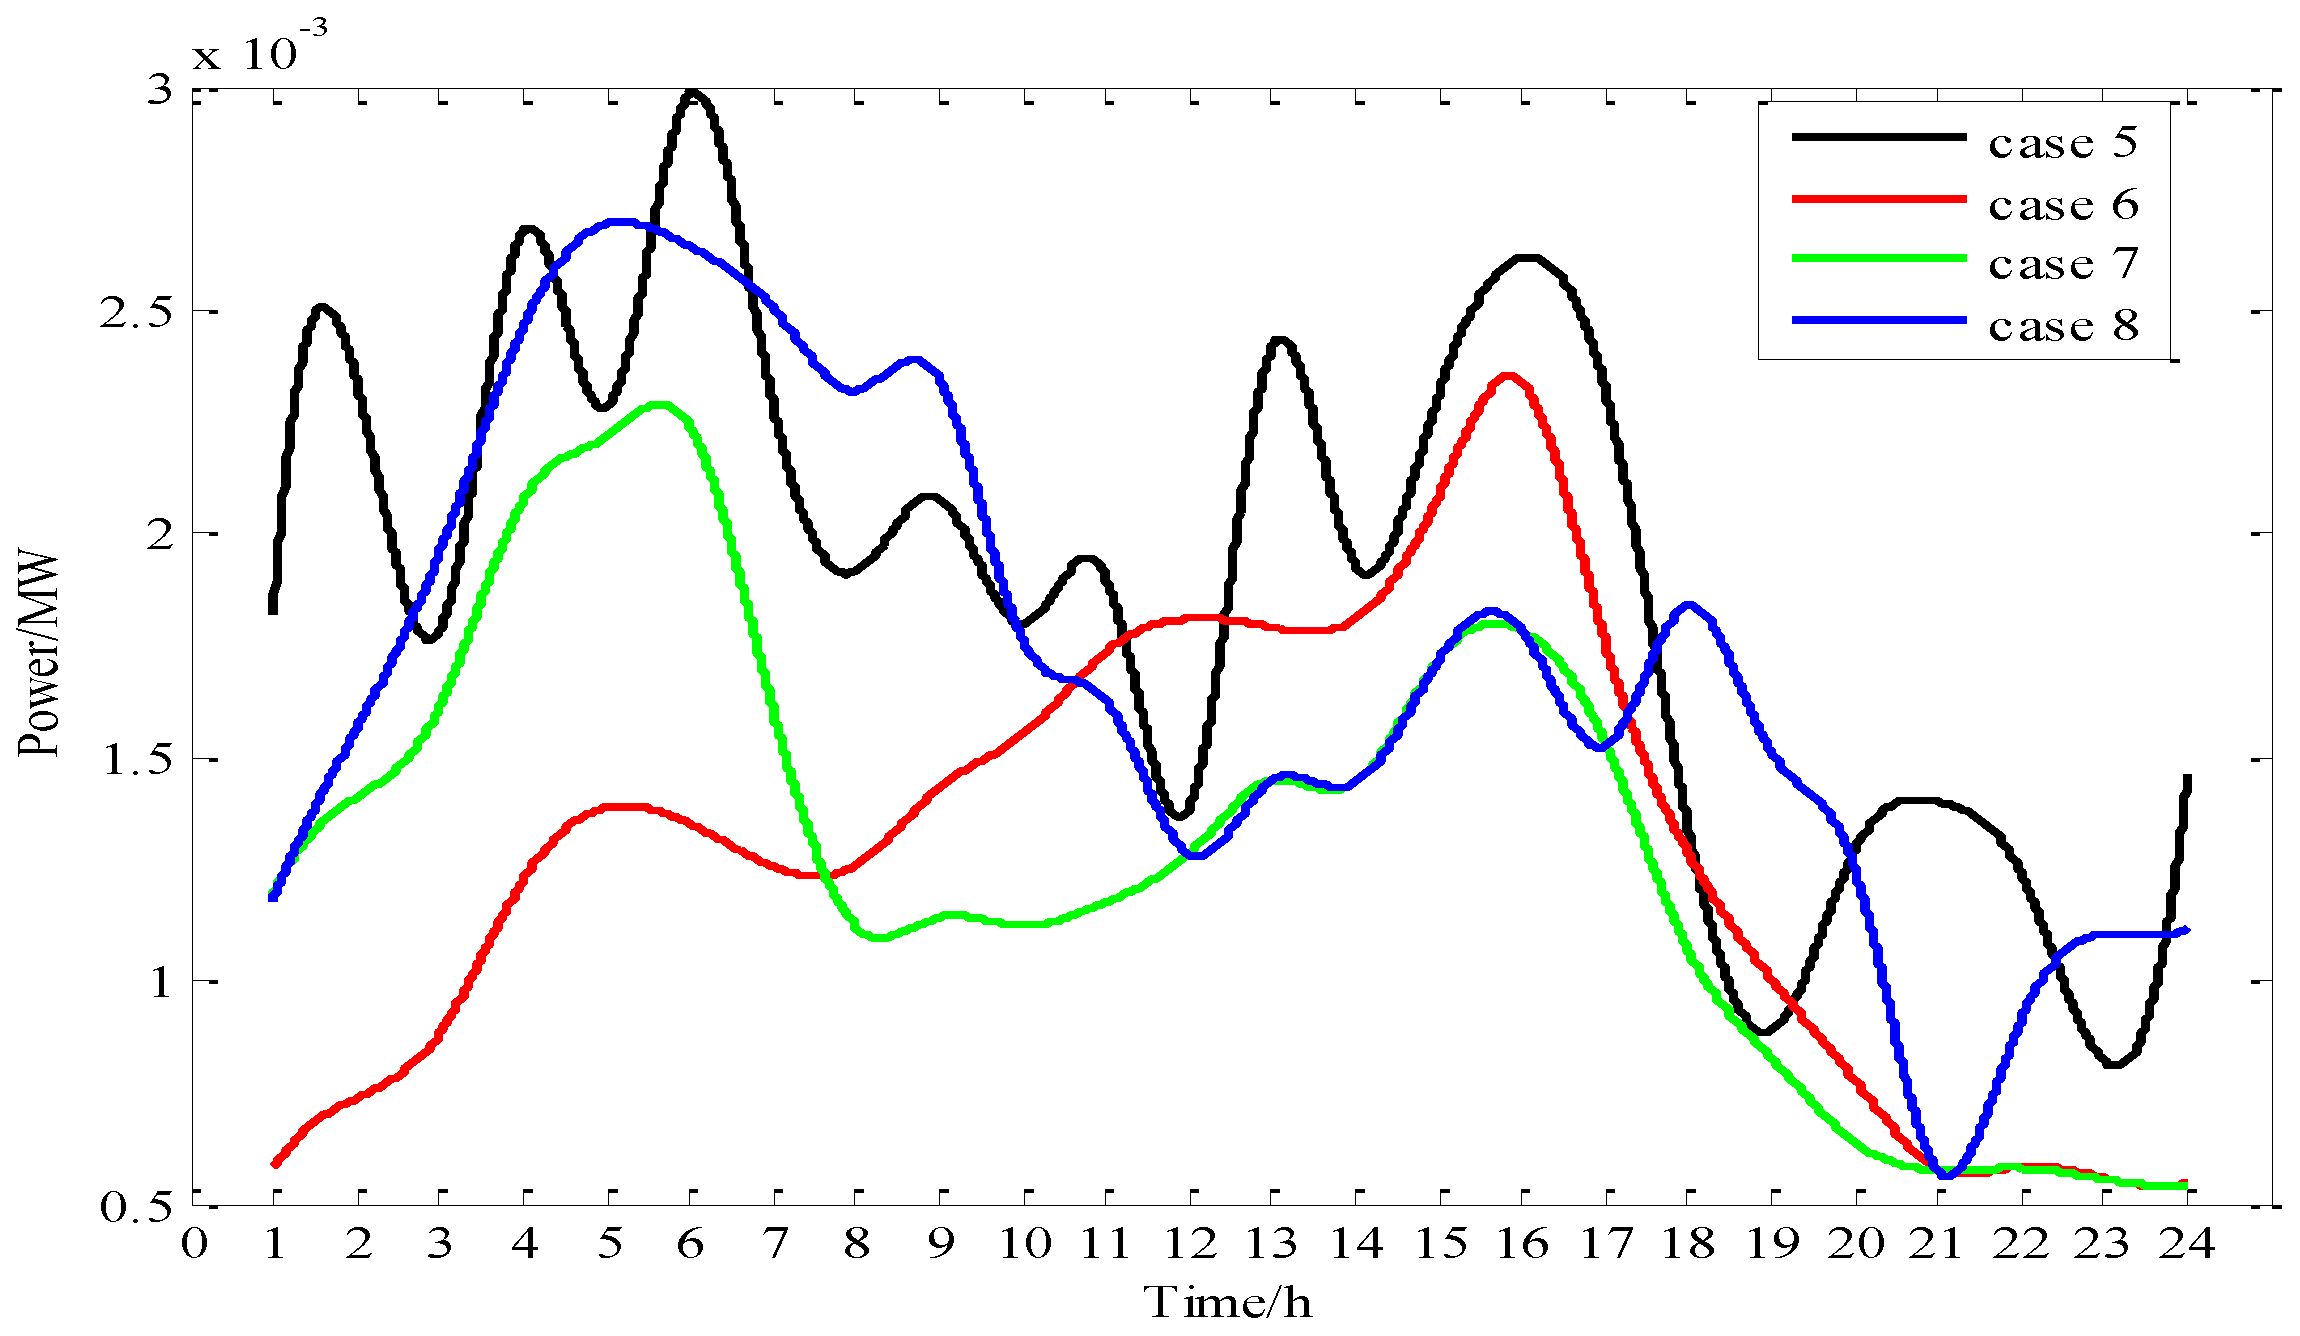
Figure 12 shows the network losses before and after optimization. The total network losses in case 5, case 6, case 7 and case 8 will be 0.0453 MW, 0.0303 MW, 0.0309 MW, and 0.0406 MW, respectively. Regarding case 2 and case 3 where user responsivity are respectively considered and ignored, their impacts on case 6 and case 7 are analyzed, respectively. Since the more concentration of EVs charging loads in time-domain in case 3 causes the loads decentralization in spatial domain, the optimization results in case 6 show better performance than that in case 7. For case 2 and case 4 where the RTOU electricity price and the TOU electricity price are adopted, respectively, their impacts on the node layer model are analyzed in case 6 and case 8. From the figure, the total network losses in case 6 are smaller than that in case 8. In addition, the curves of the network losses have different peak time, and the reason is that the temporal distribution of charging EVs is different in the four cases.
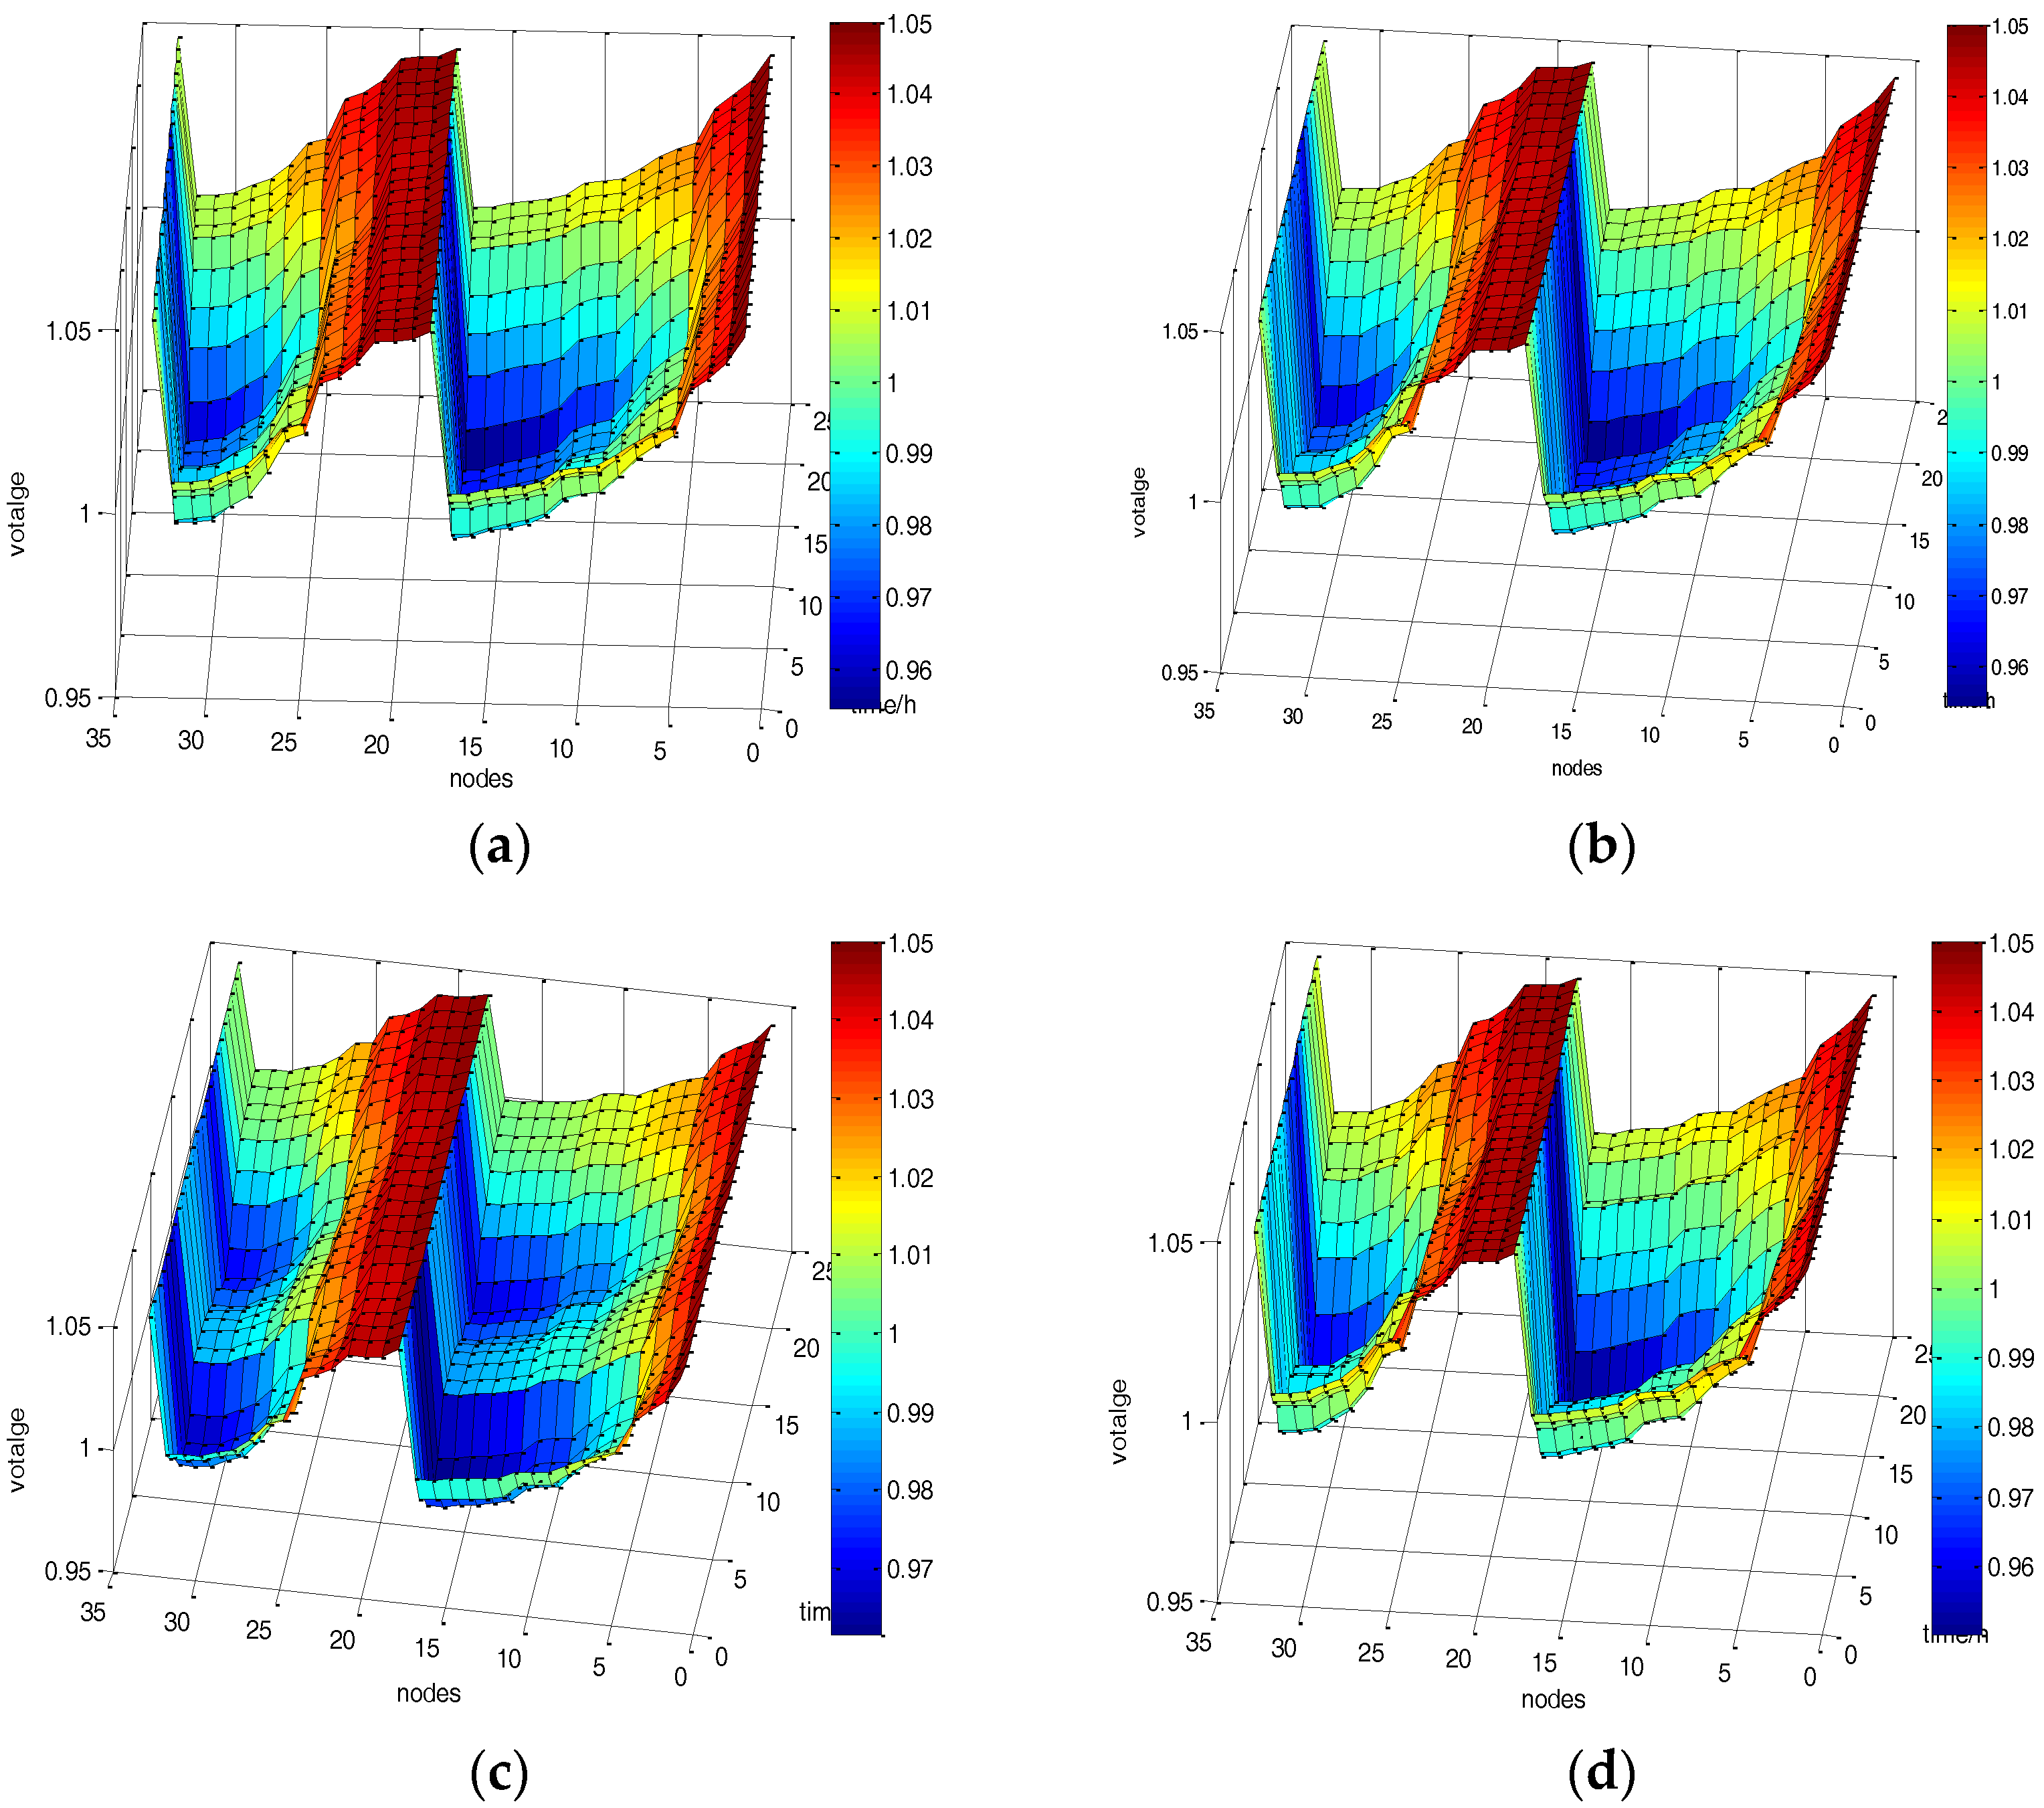
Figure 13 shows the voltage distributions under different cases. Compared with case 5, it is found that case 6, case 7 and case 8 will show better performance on the voltage levels of end nodes. Regarding case 2 and case 3 where user responsivity are respectively considered and ignored, their impacts on case 6 and case 7 are studied, respectively.
In view of that the more concentration of EVs charging loads in time-domain in case 3 causes the loads decentralization in spatial domain, the optimization results in case 6 show better performance than that in case 7. For case 2 and case 4 where the RTOU electricity price and the TOU electricity price are used, respectively, their impacts on the node layer model are analyzed in case 6 and case 8. It is observed that, the voltage levels of end nodes in case 6 are more preferable.
6. Conclusions
This paper’s main contribution is to propose a RTOU electricity price-based bilayer optimization charging strategy for EVs, and herein the benefits of distribution network and users are both taken into account. To analyze the impacts of the RTOU electricity price on the charging behaviors of EVs, the user responsivity is investigated by the method of elastic coefficient. From the simulations of an IEEE 33-bus distribution network, the performance of the proposed optimal charging strategy is verified, and some conclusions are drawn as follows:
- (1)
The effectiveness of the proposed optimization charging strategy can be confirmed. For the regional layer model which is designed to coordinate the EVs located in different time and space, it can shave the peak and fill the valley of load profiles, and the charging cost of users is well reduced. Concerning the node layer model which is built to schedule the EVs to charge in certain nodes, its application can decrease the network losses to a certain extent.
- (2)
Compared with the TOU electricity price, the RTOU electricity price can obtain better optimization results.
- (3)
When the user responsivity to the RTOU electricity price is taken into consideration, the optimal scheduling results are more similar to reality.
- (4)
If the charging stations are located in the nodes being close to the beginning bus of each region, the distribution network can potentially obtain better economic benefits.
In the near future, the optimal RTOU electricity price, real time tariff and feasible incentive measures will be studied further. Besides, some follow-up works related to the node layer model will be performed, and the EVs’ scheduling strategy based on the integration of transportation network and power grid will be taken into account. The results will be reported in later articles.


