
Solar Farm Suitability Using Geographic Information System Fuzzy Sets and Analytic Hierarchy Processes: Case Study of Ulleung Island, Korea


Abstract
:
1. Introduction
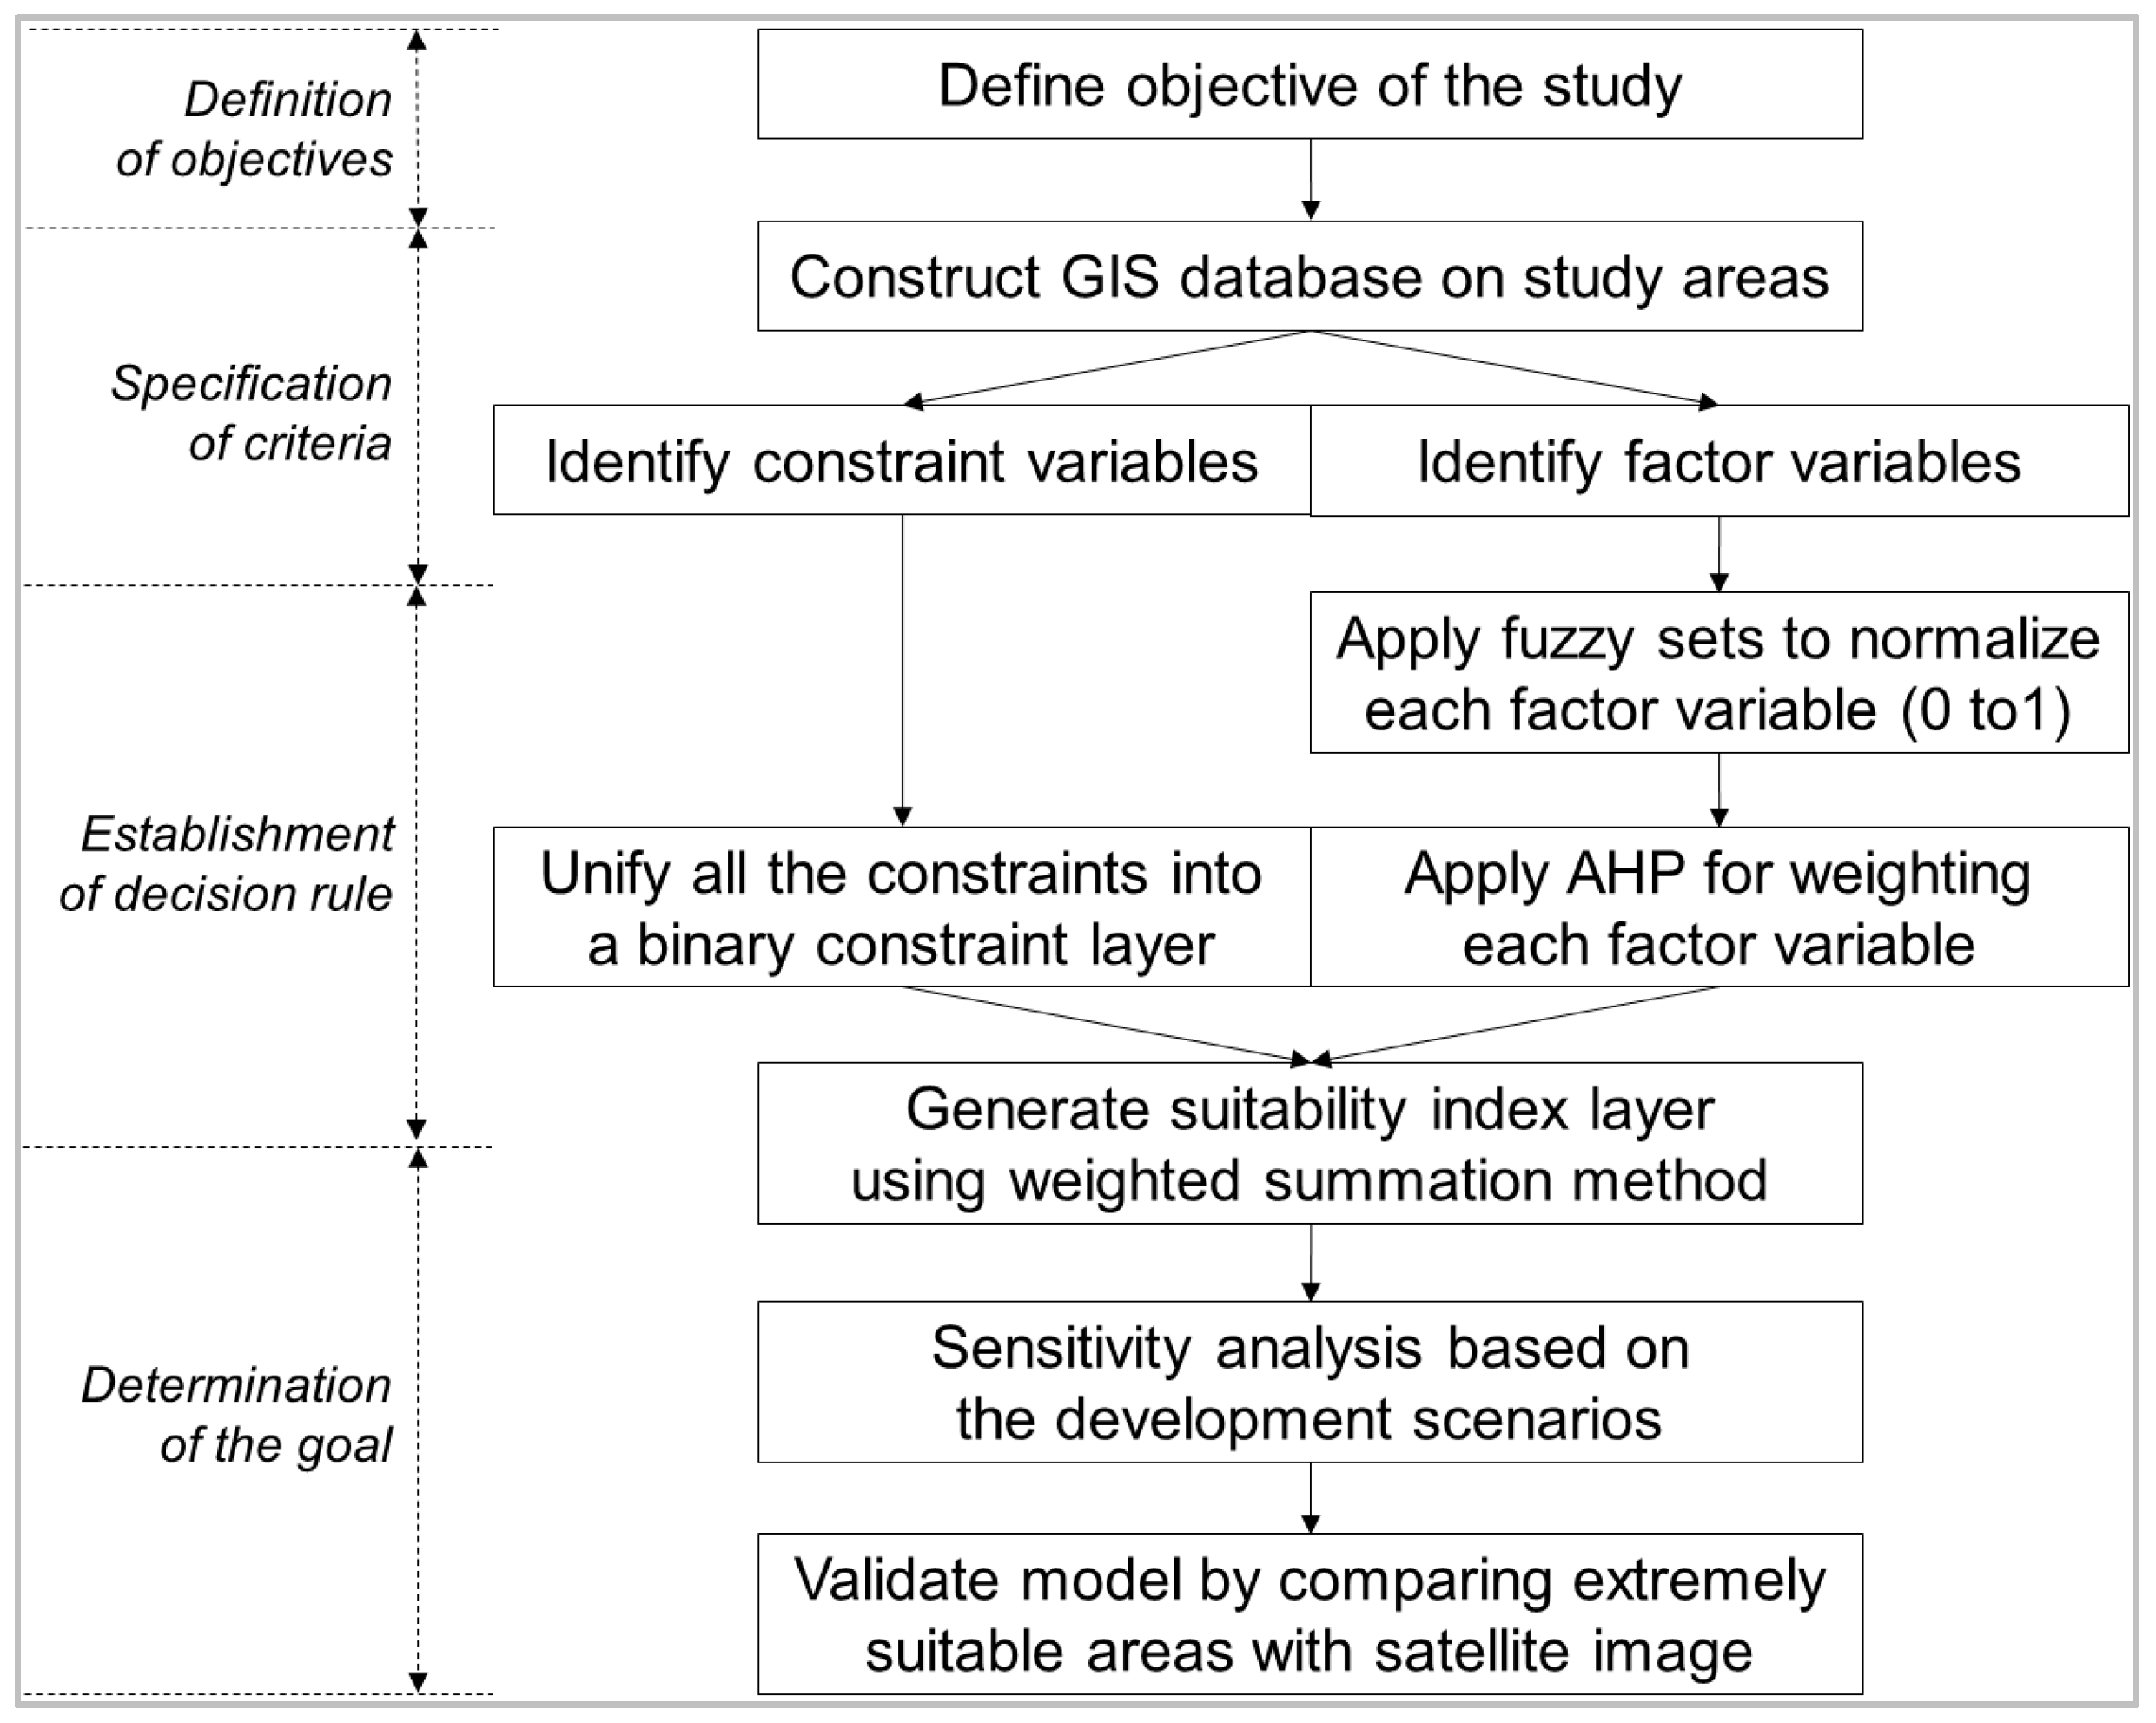
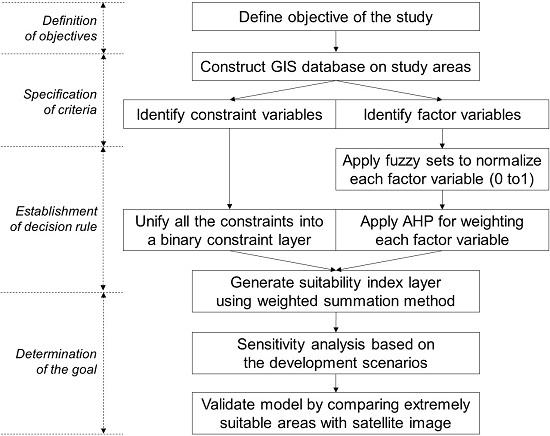
2. Methodology
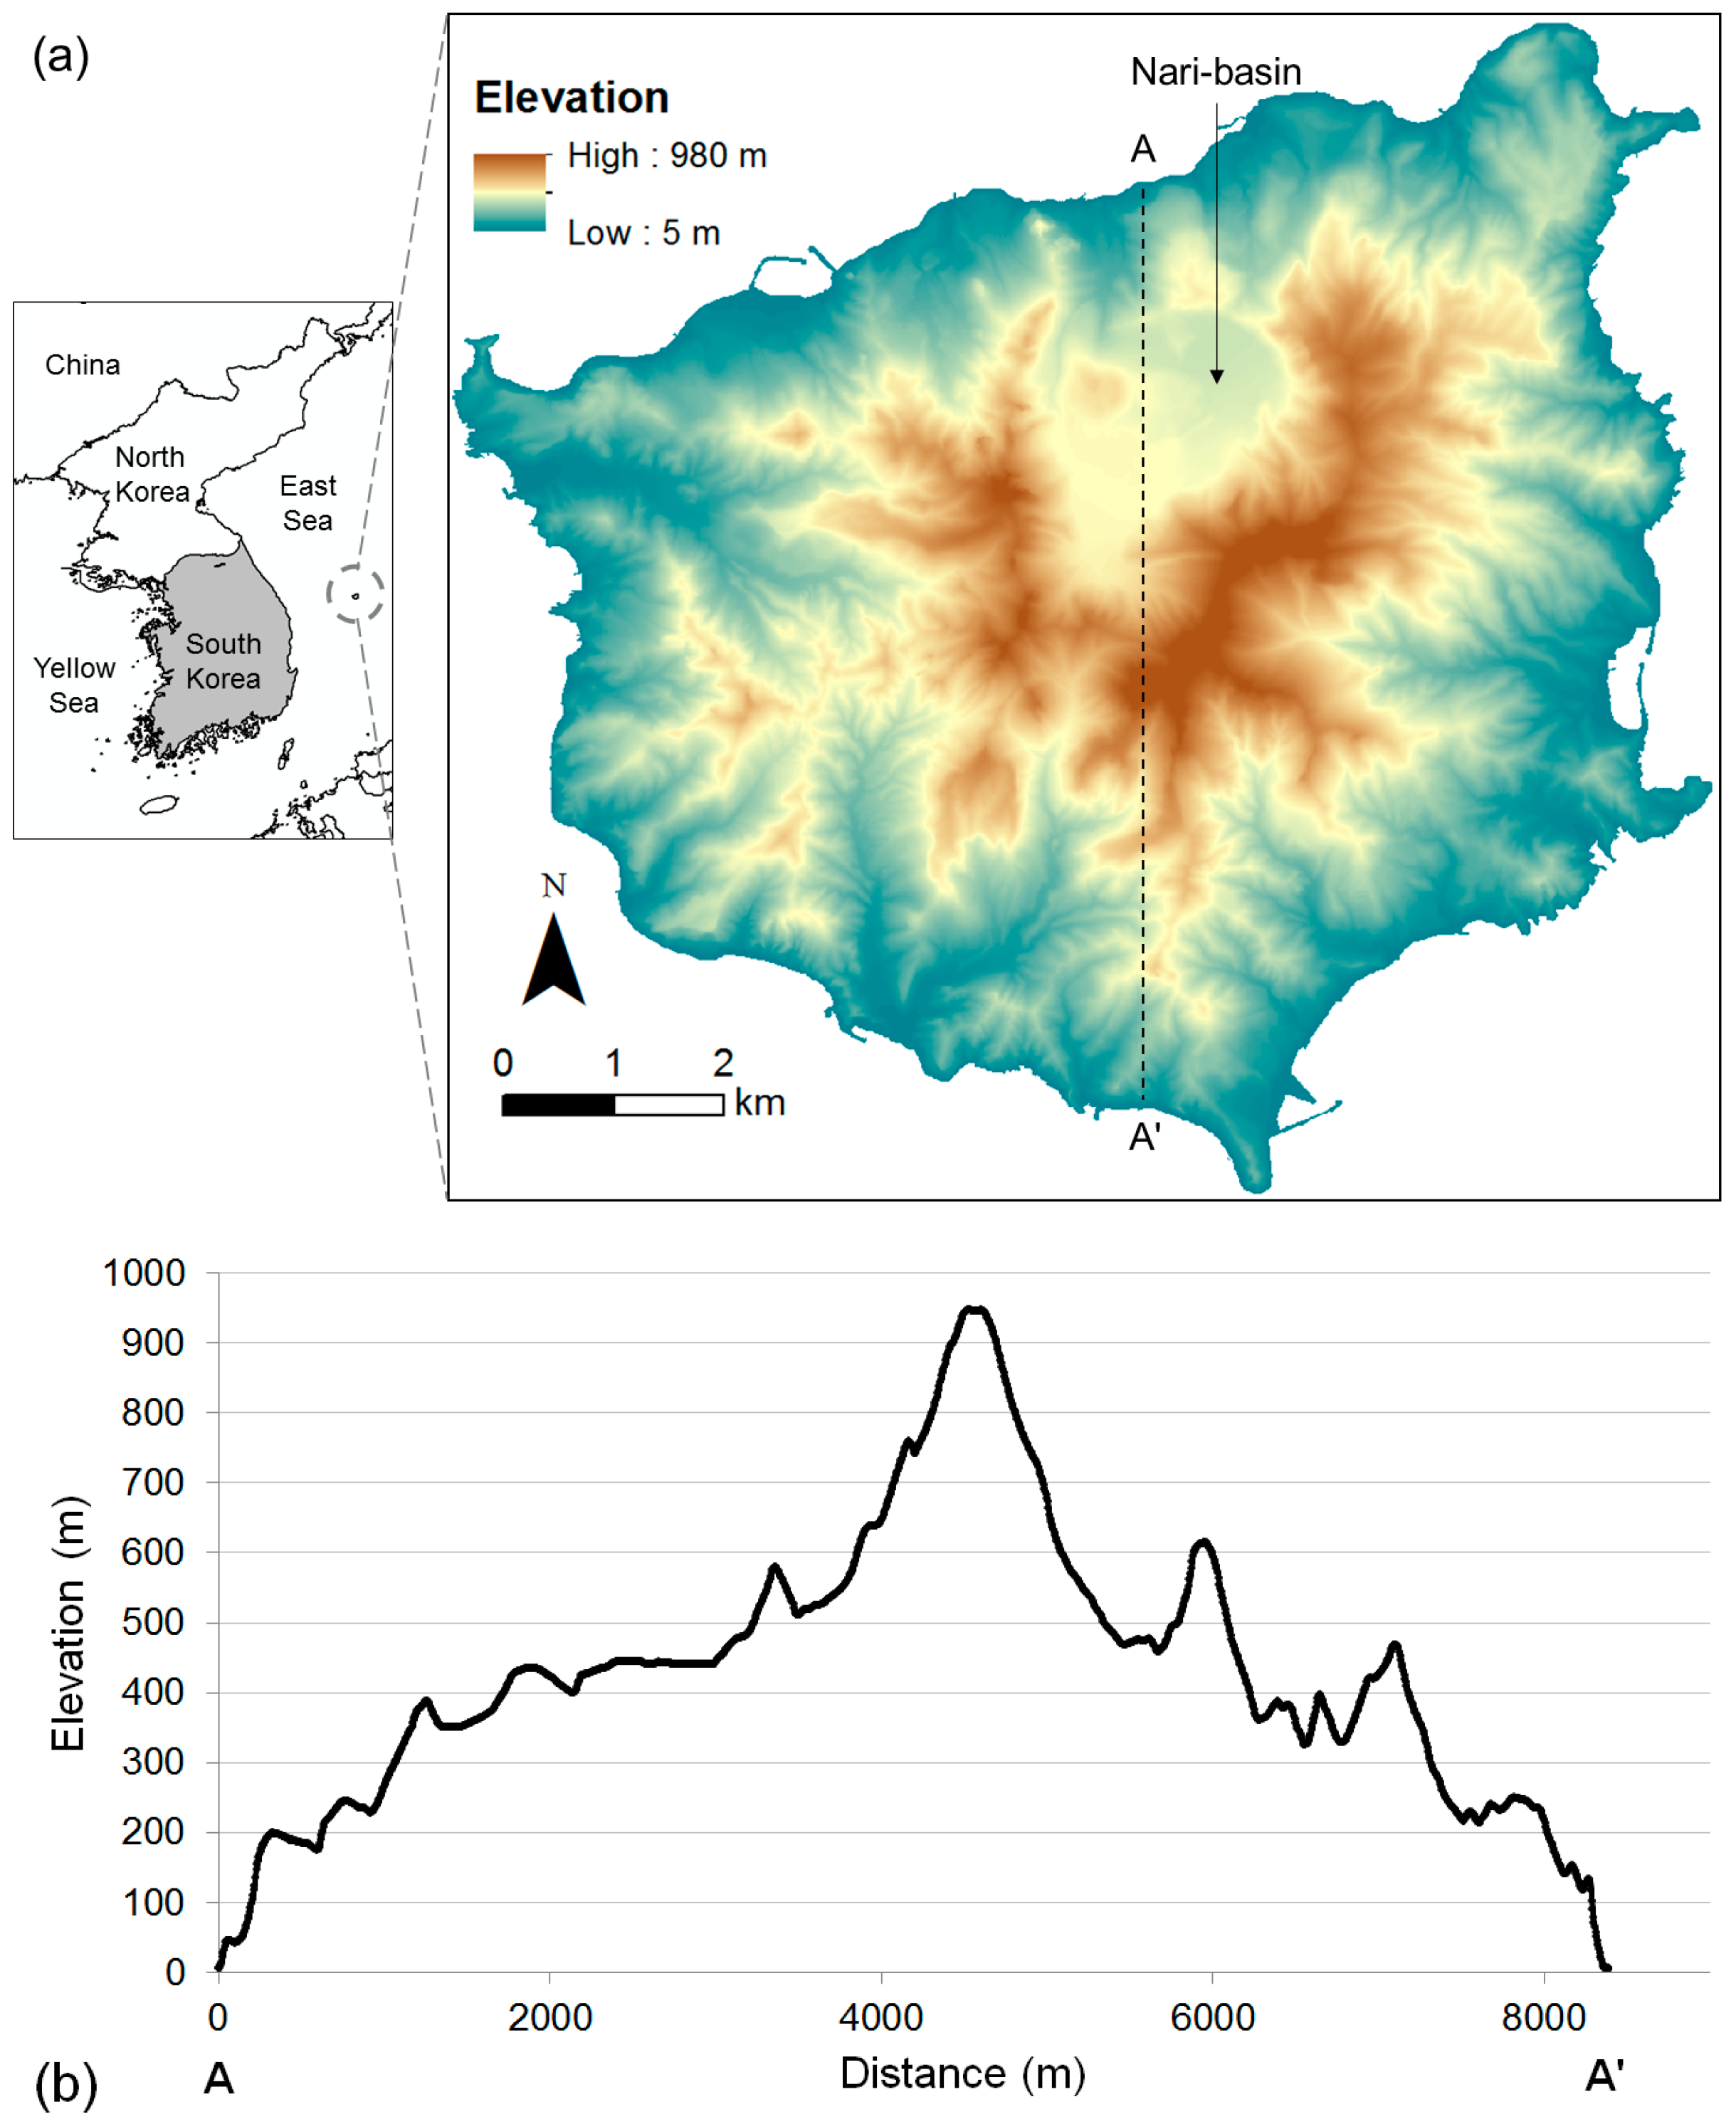
2.1. Study Area
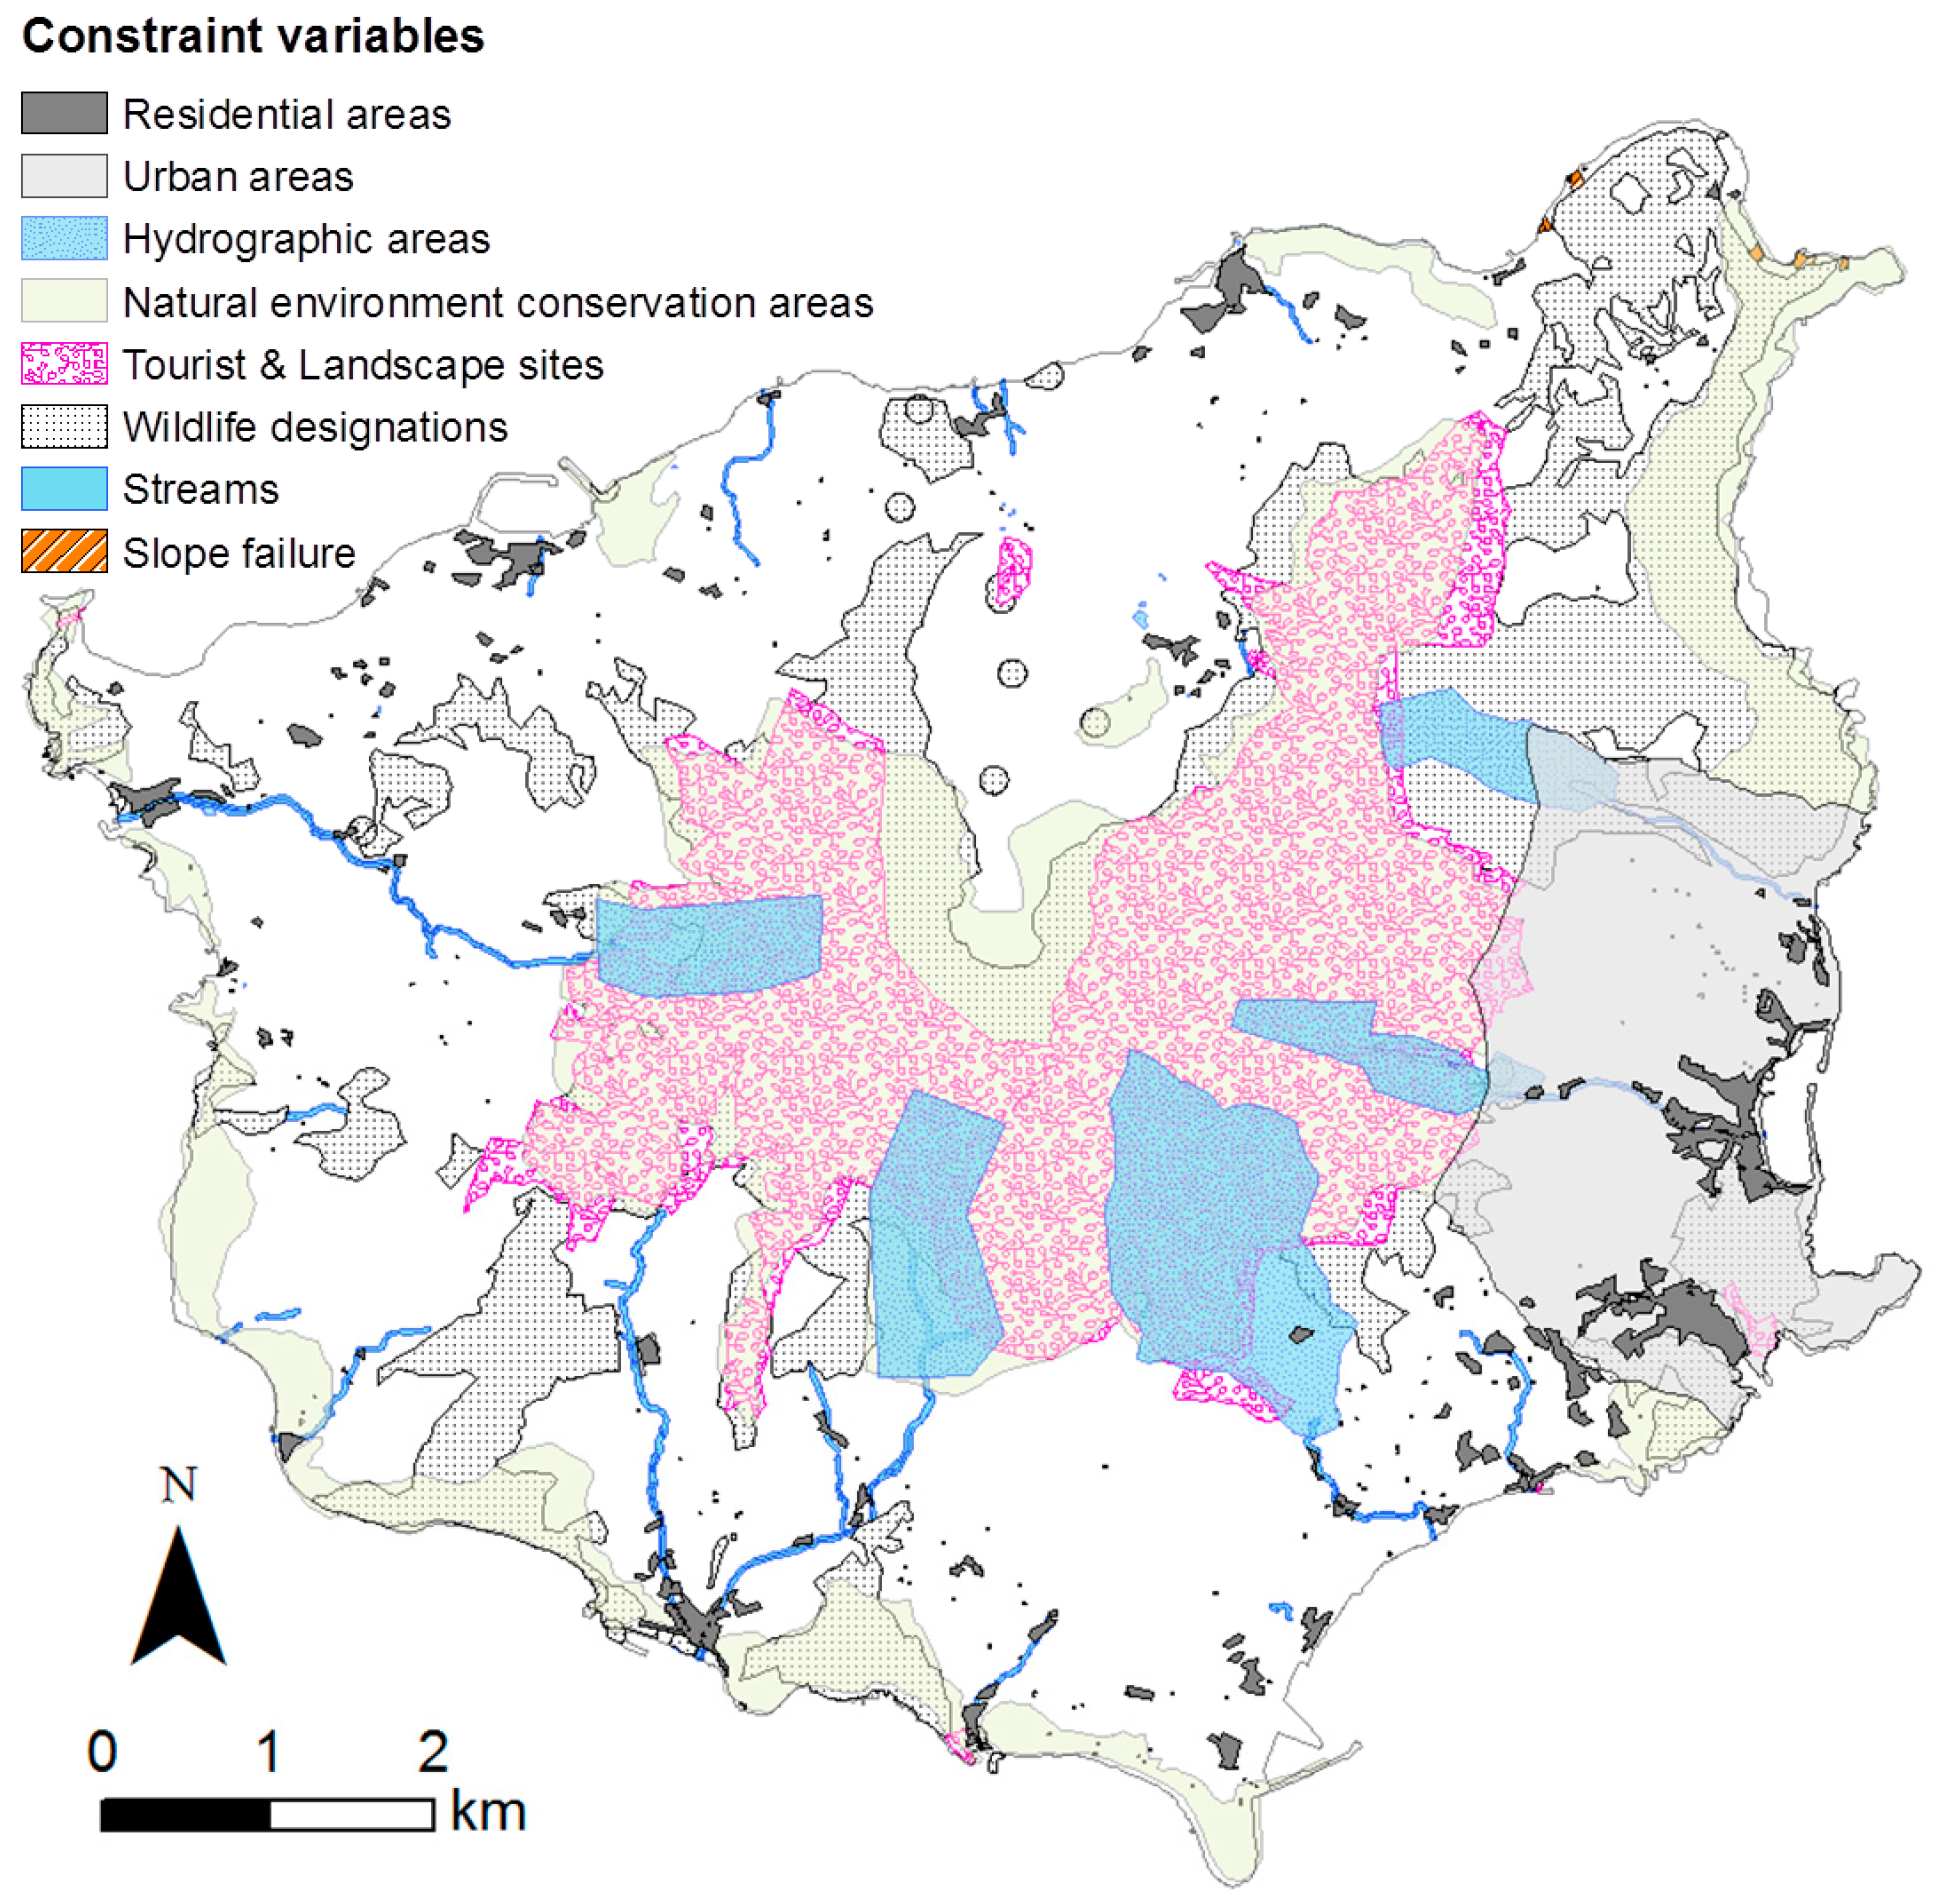
2.2. Identification of Constraint Variables
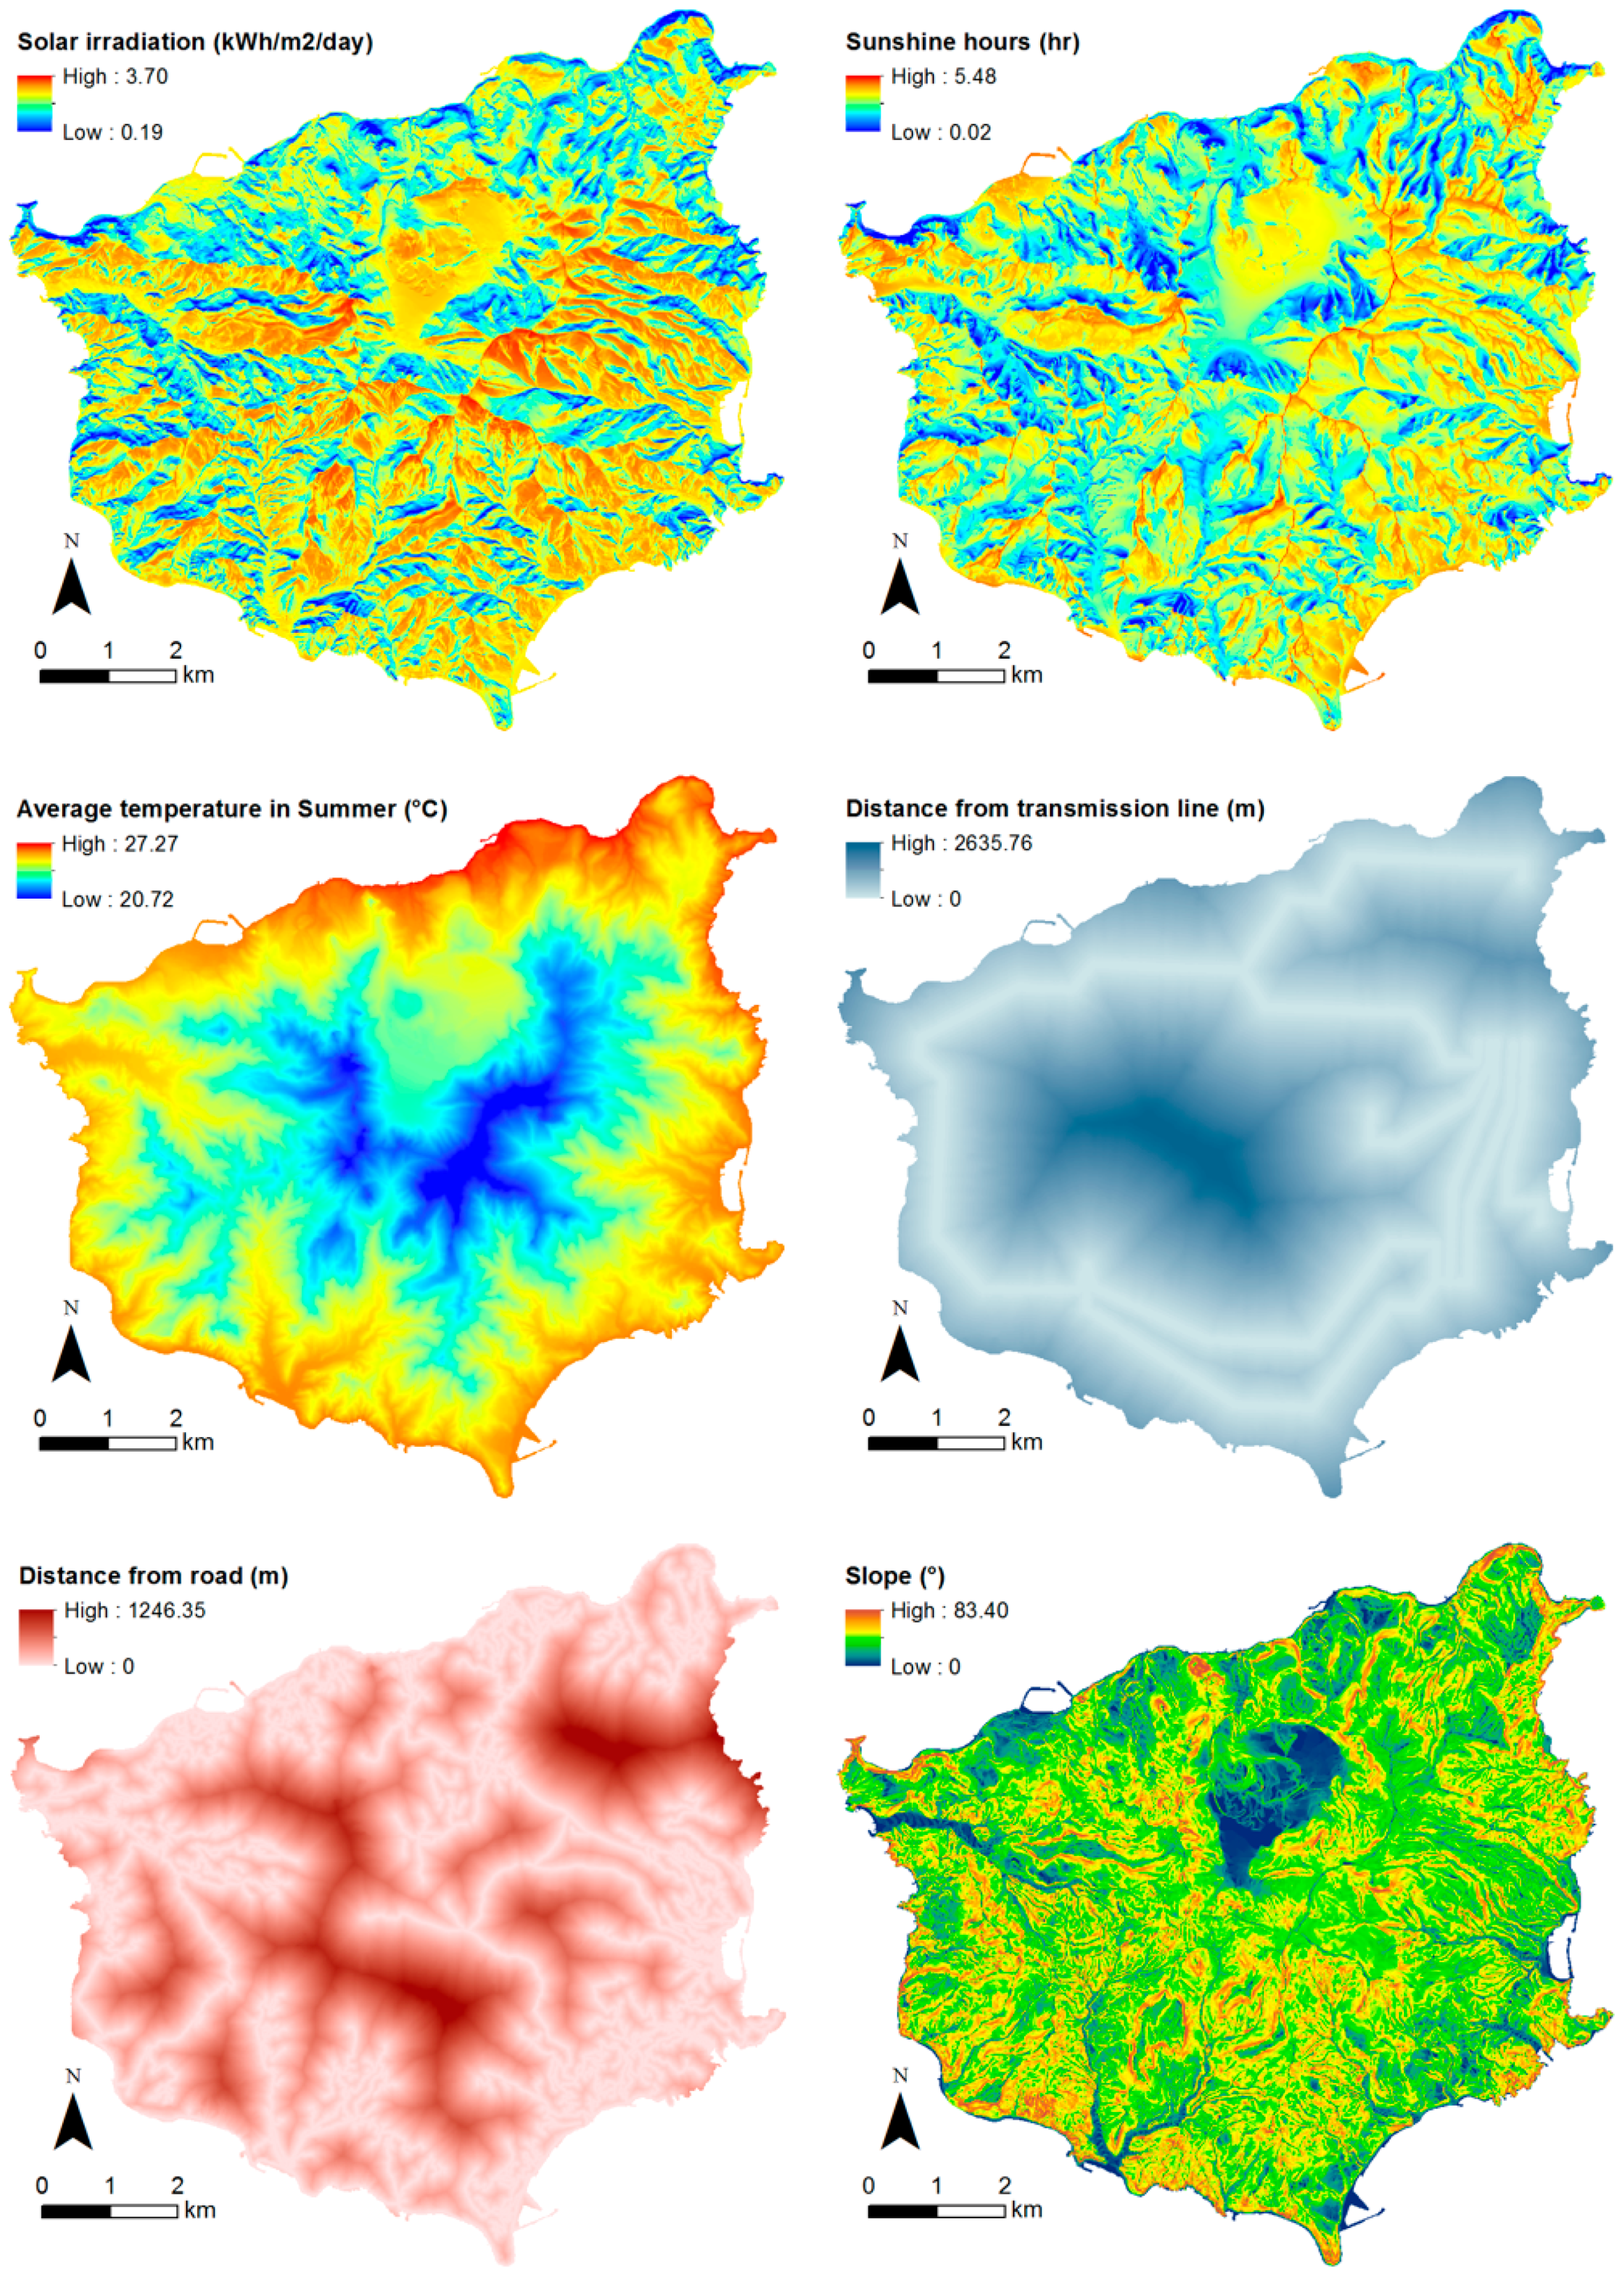
2.3. Identification of Factor Variables
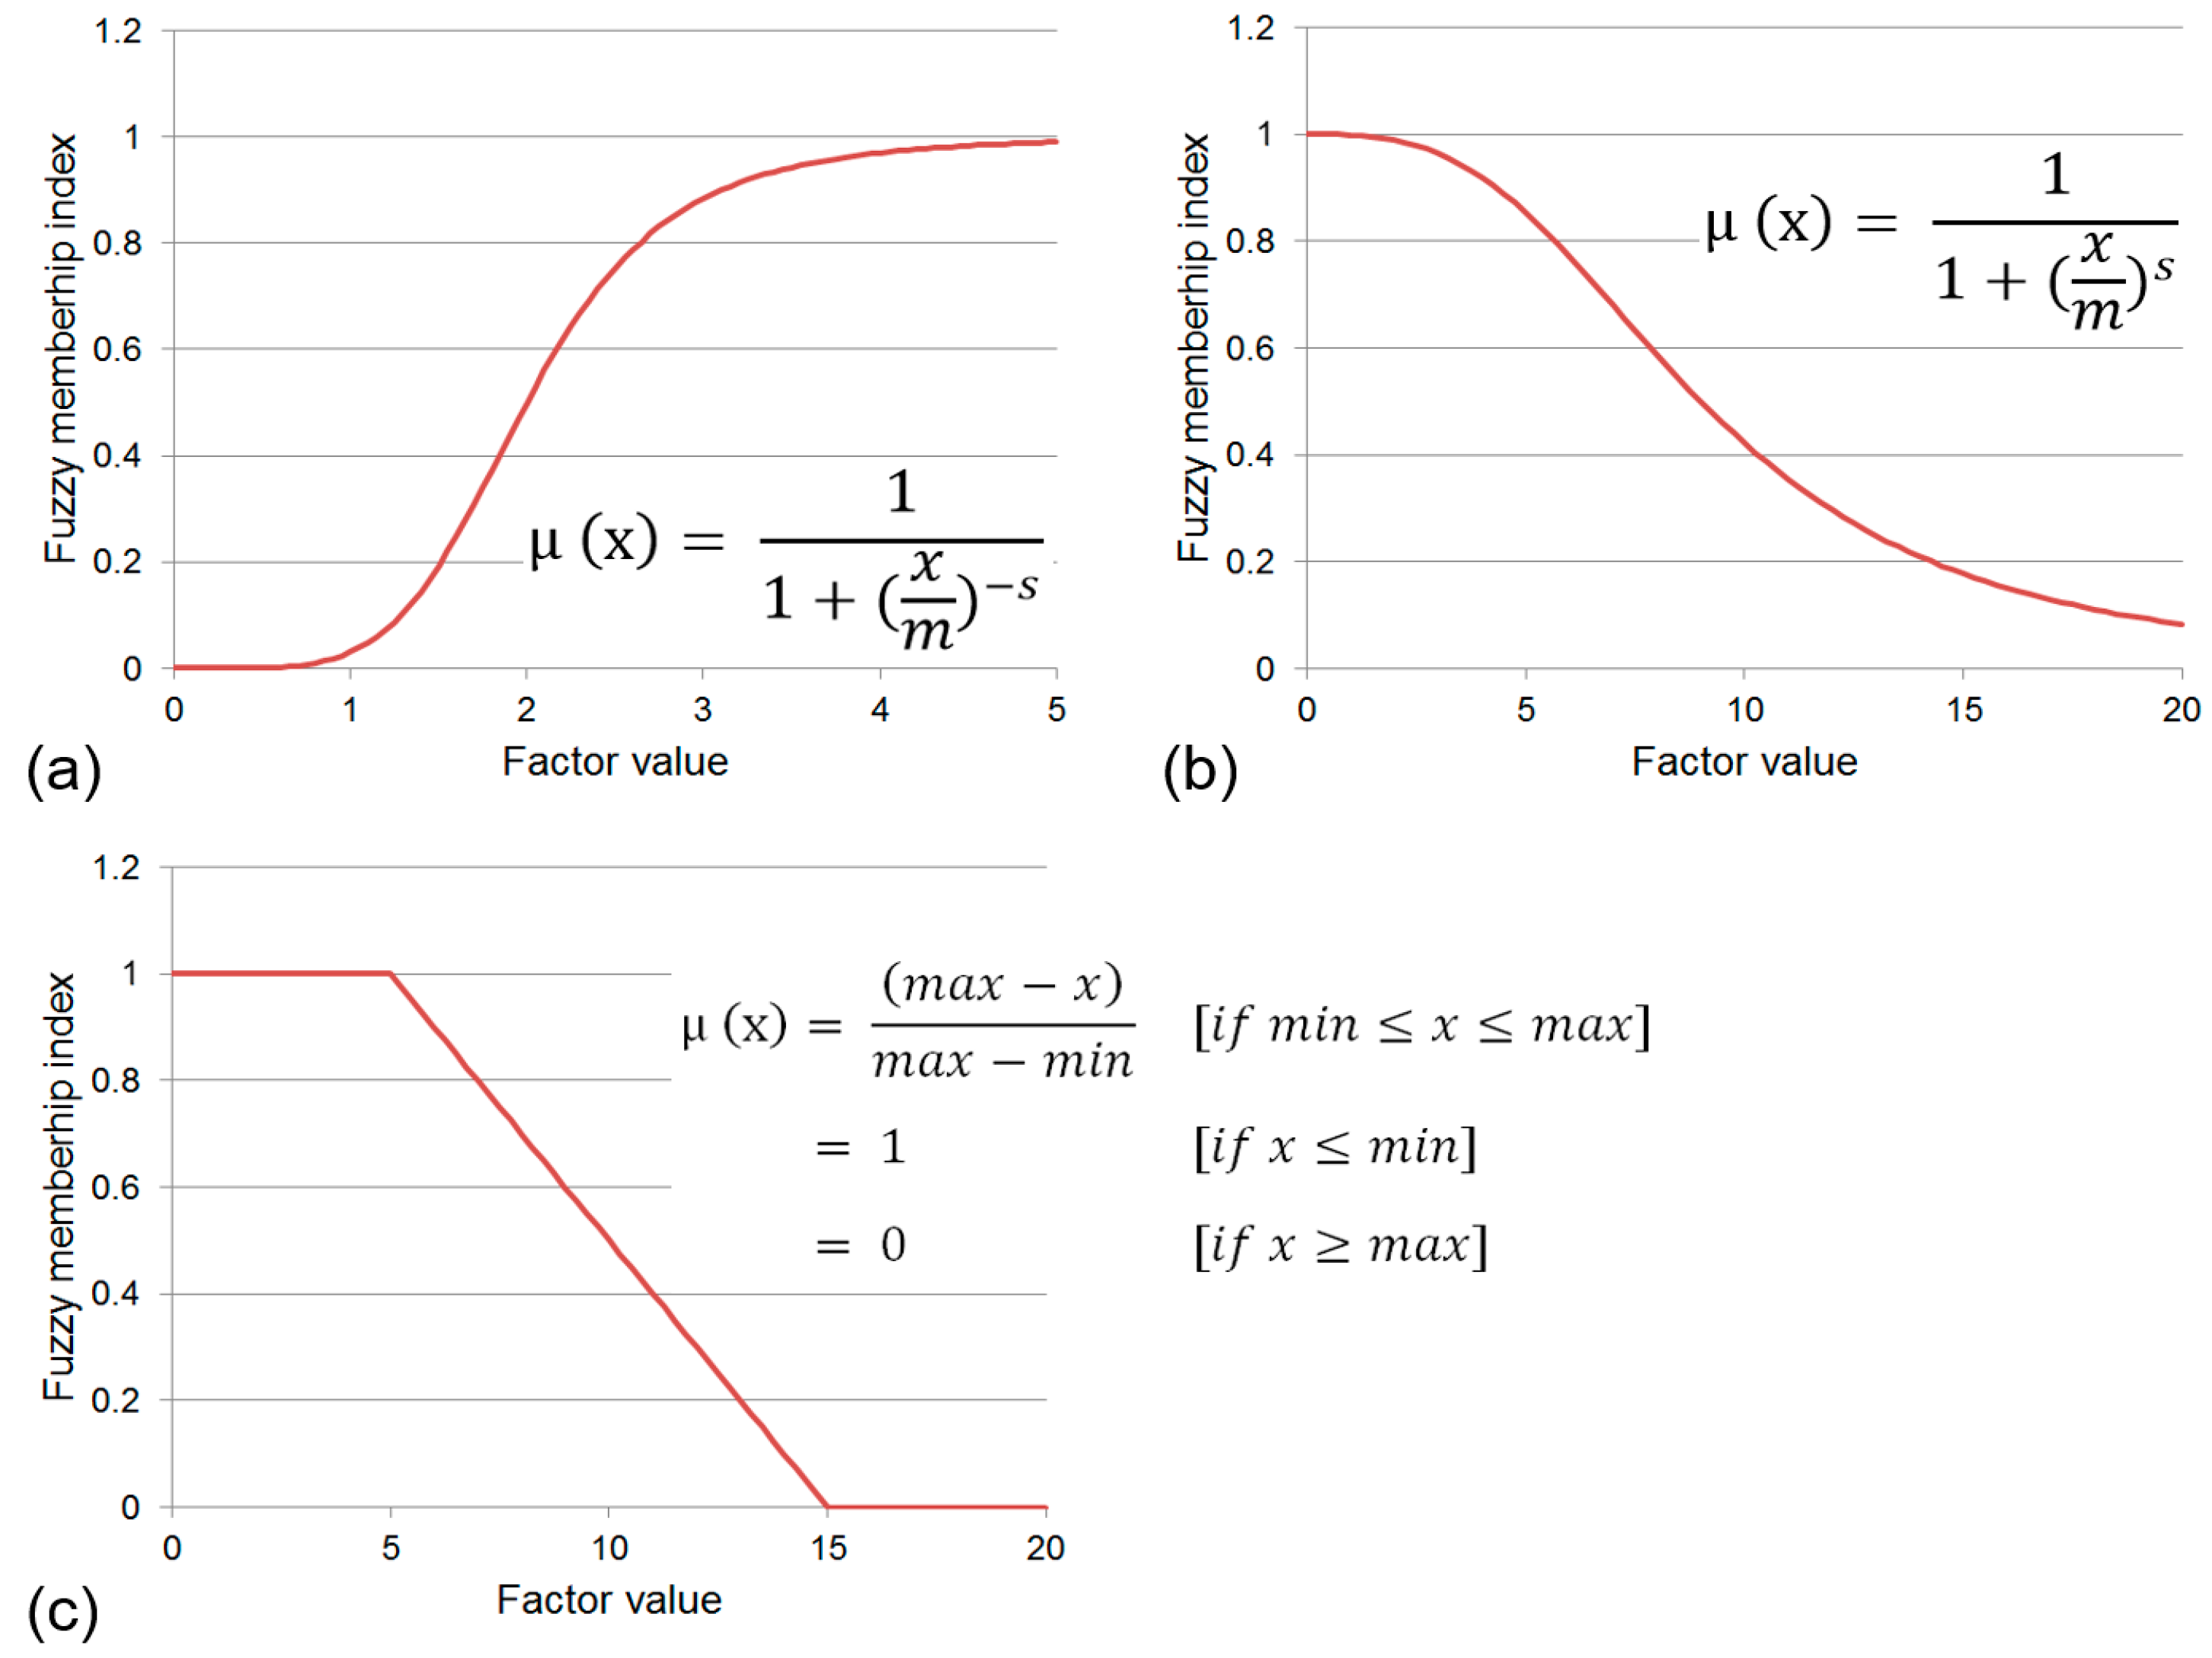
2.4. Application of Fuzzy Sets to Factor Variables
2.5. Application of the Analytic Hierarchy Process Method to Factor Variables
2.6. Identification of Suitability Index and Sensitivity Analysis
3. Results
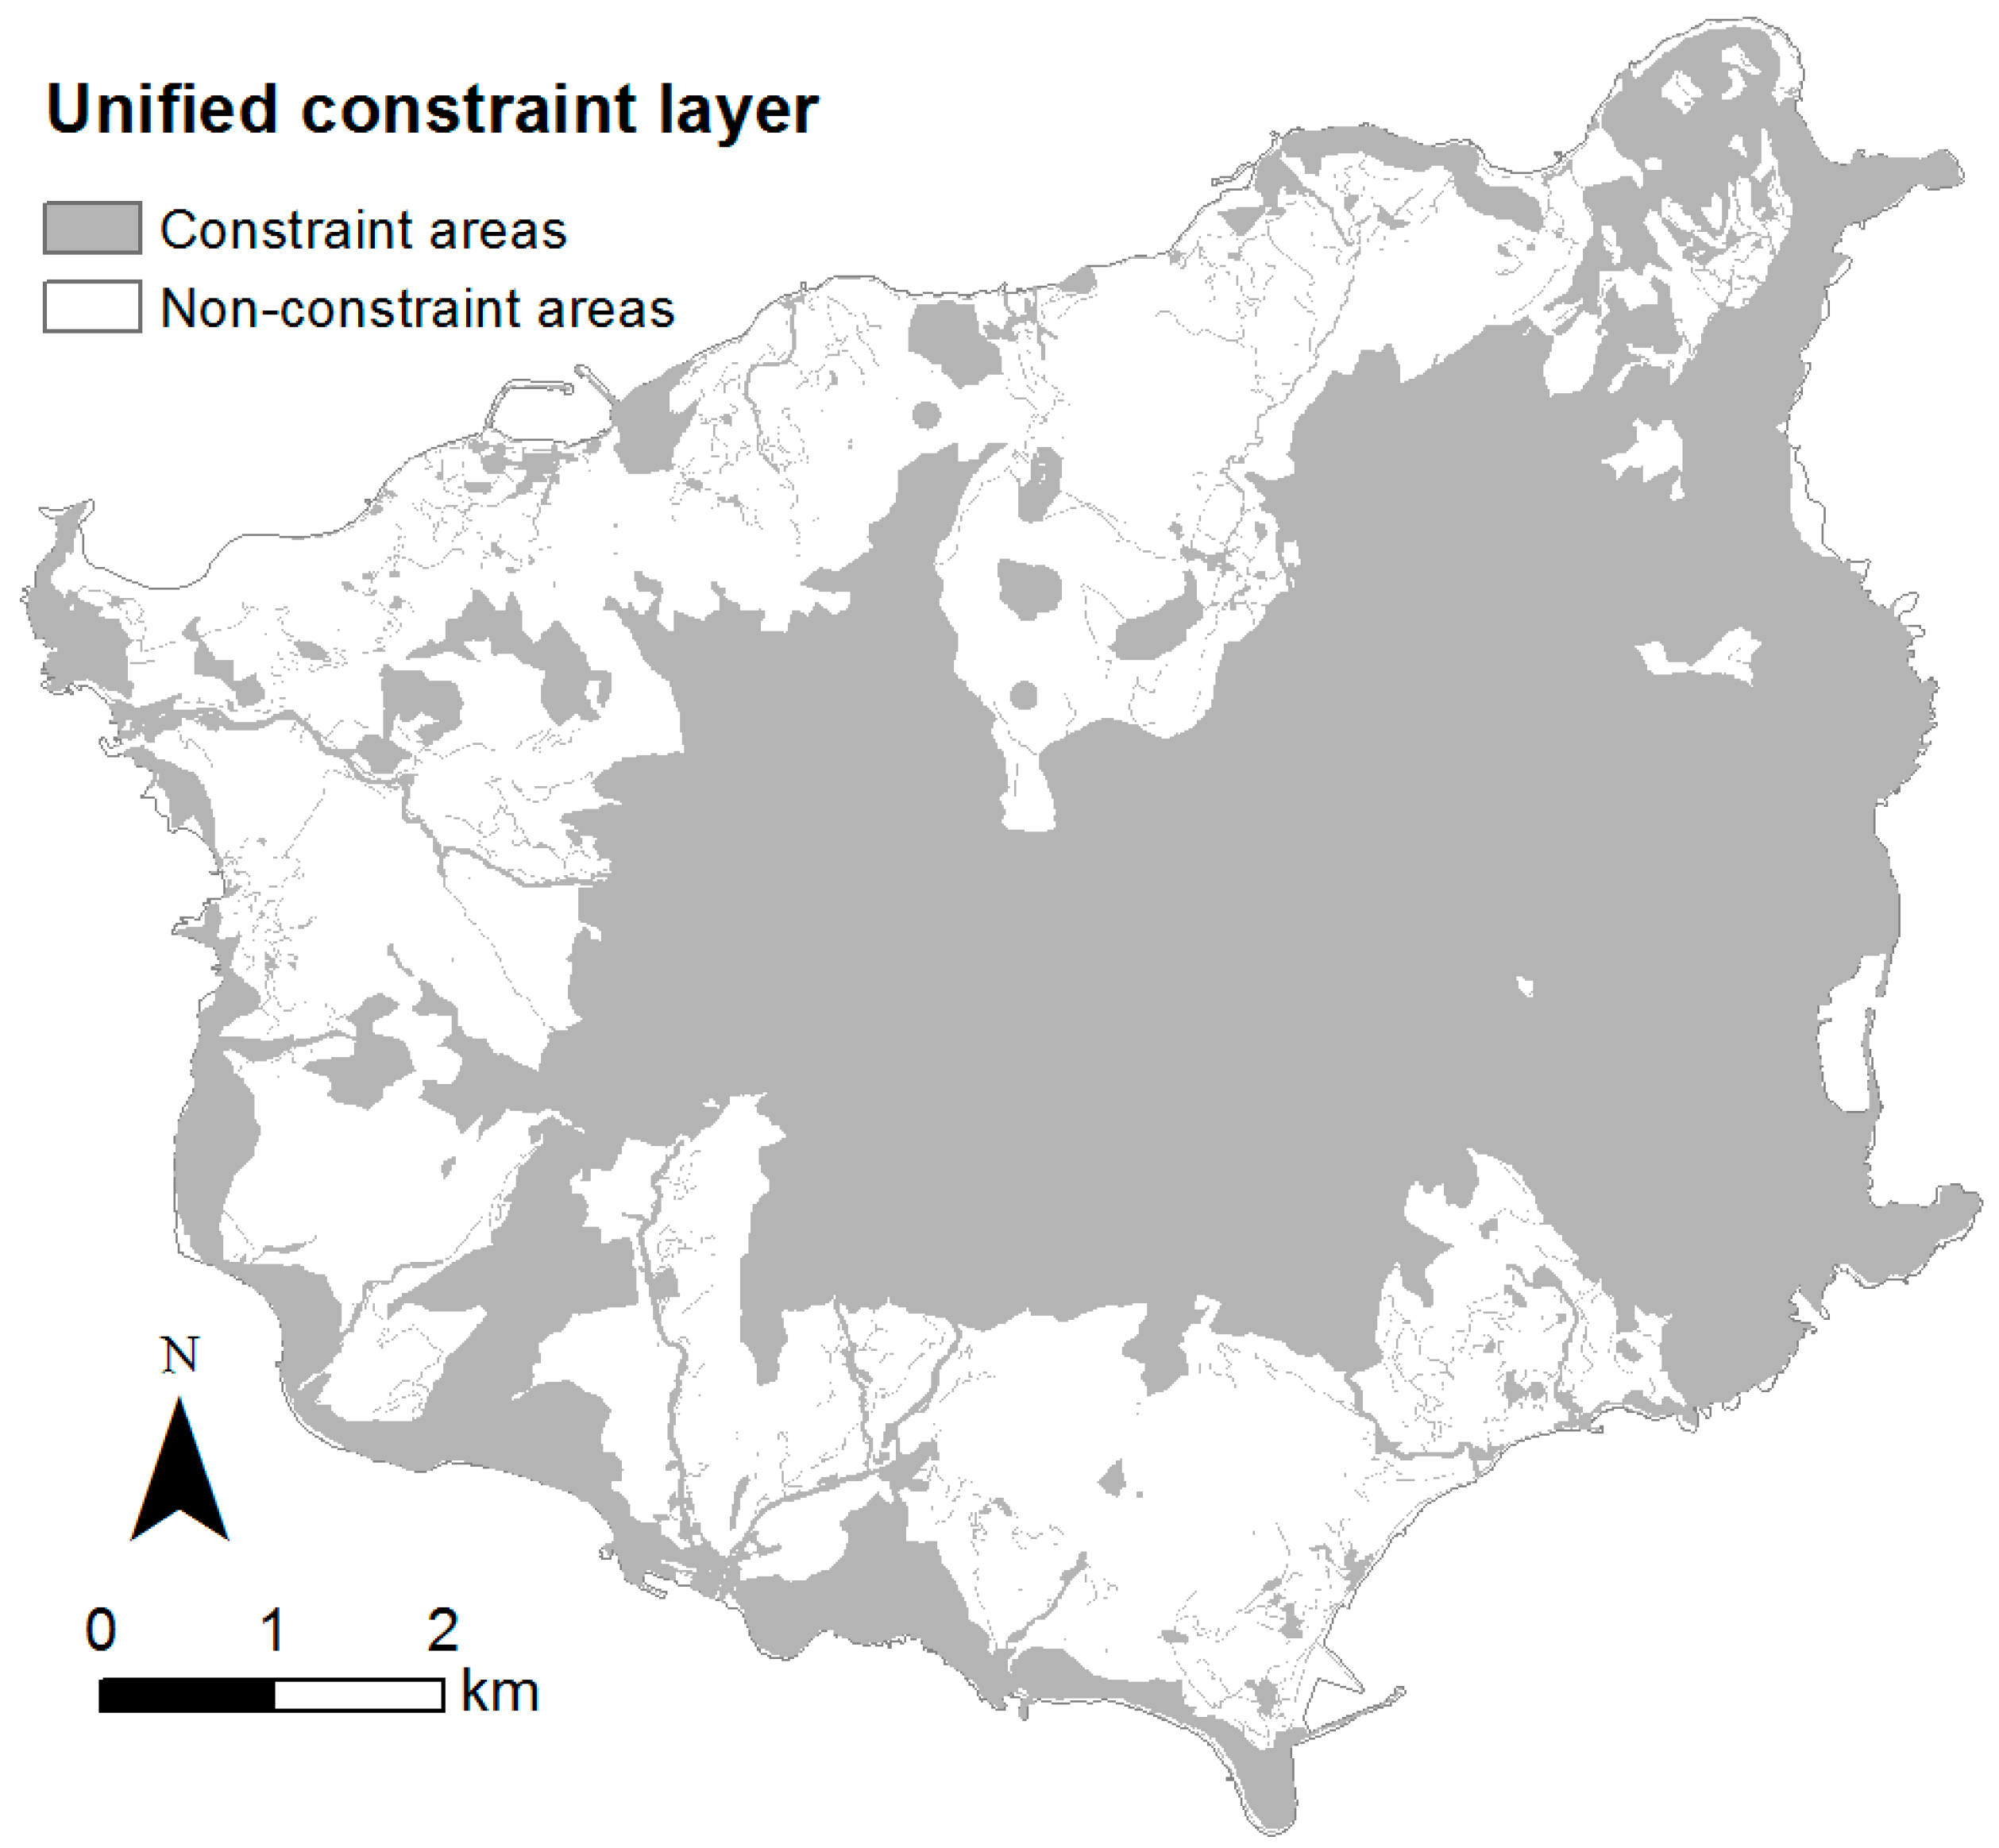
3.1. Generation of a Unified Constraint Layer
3.2. Generation of Factor Layers
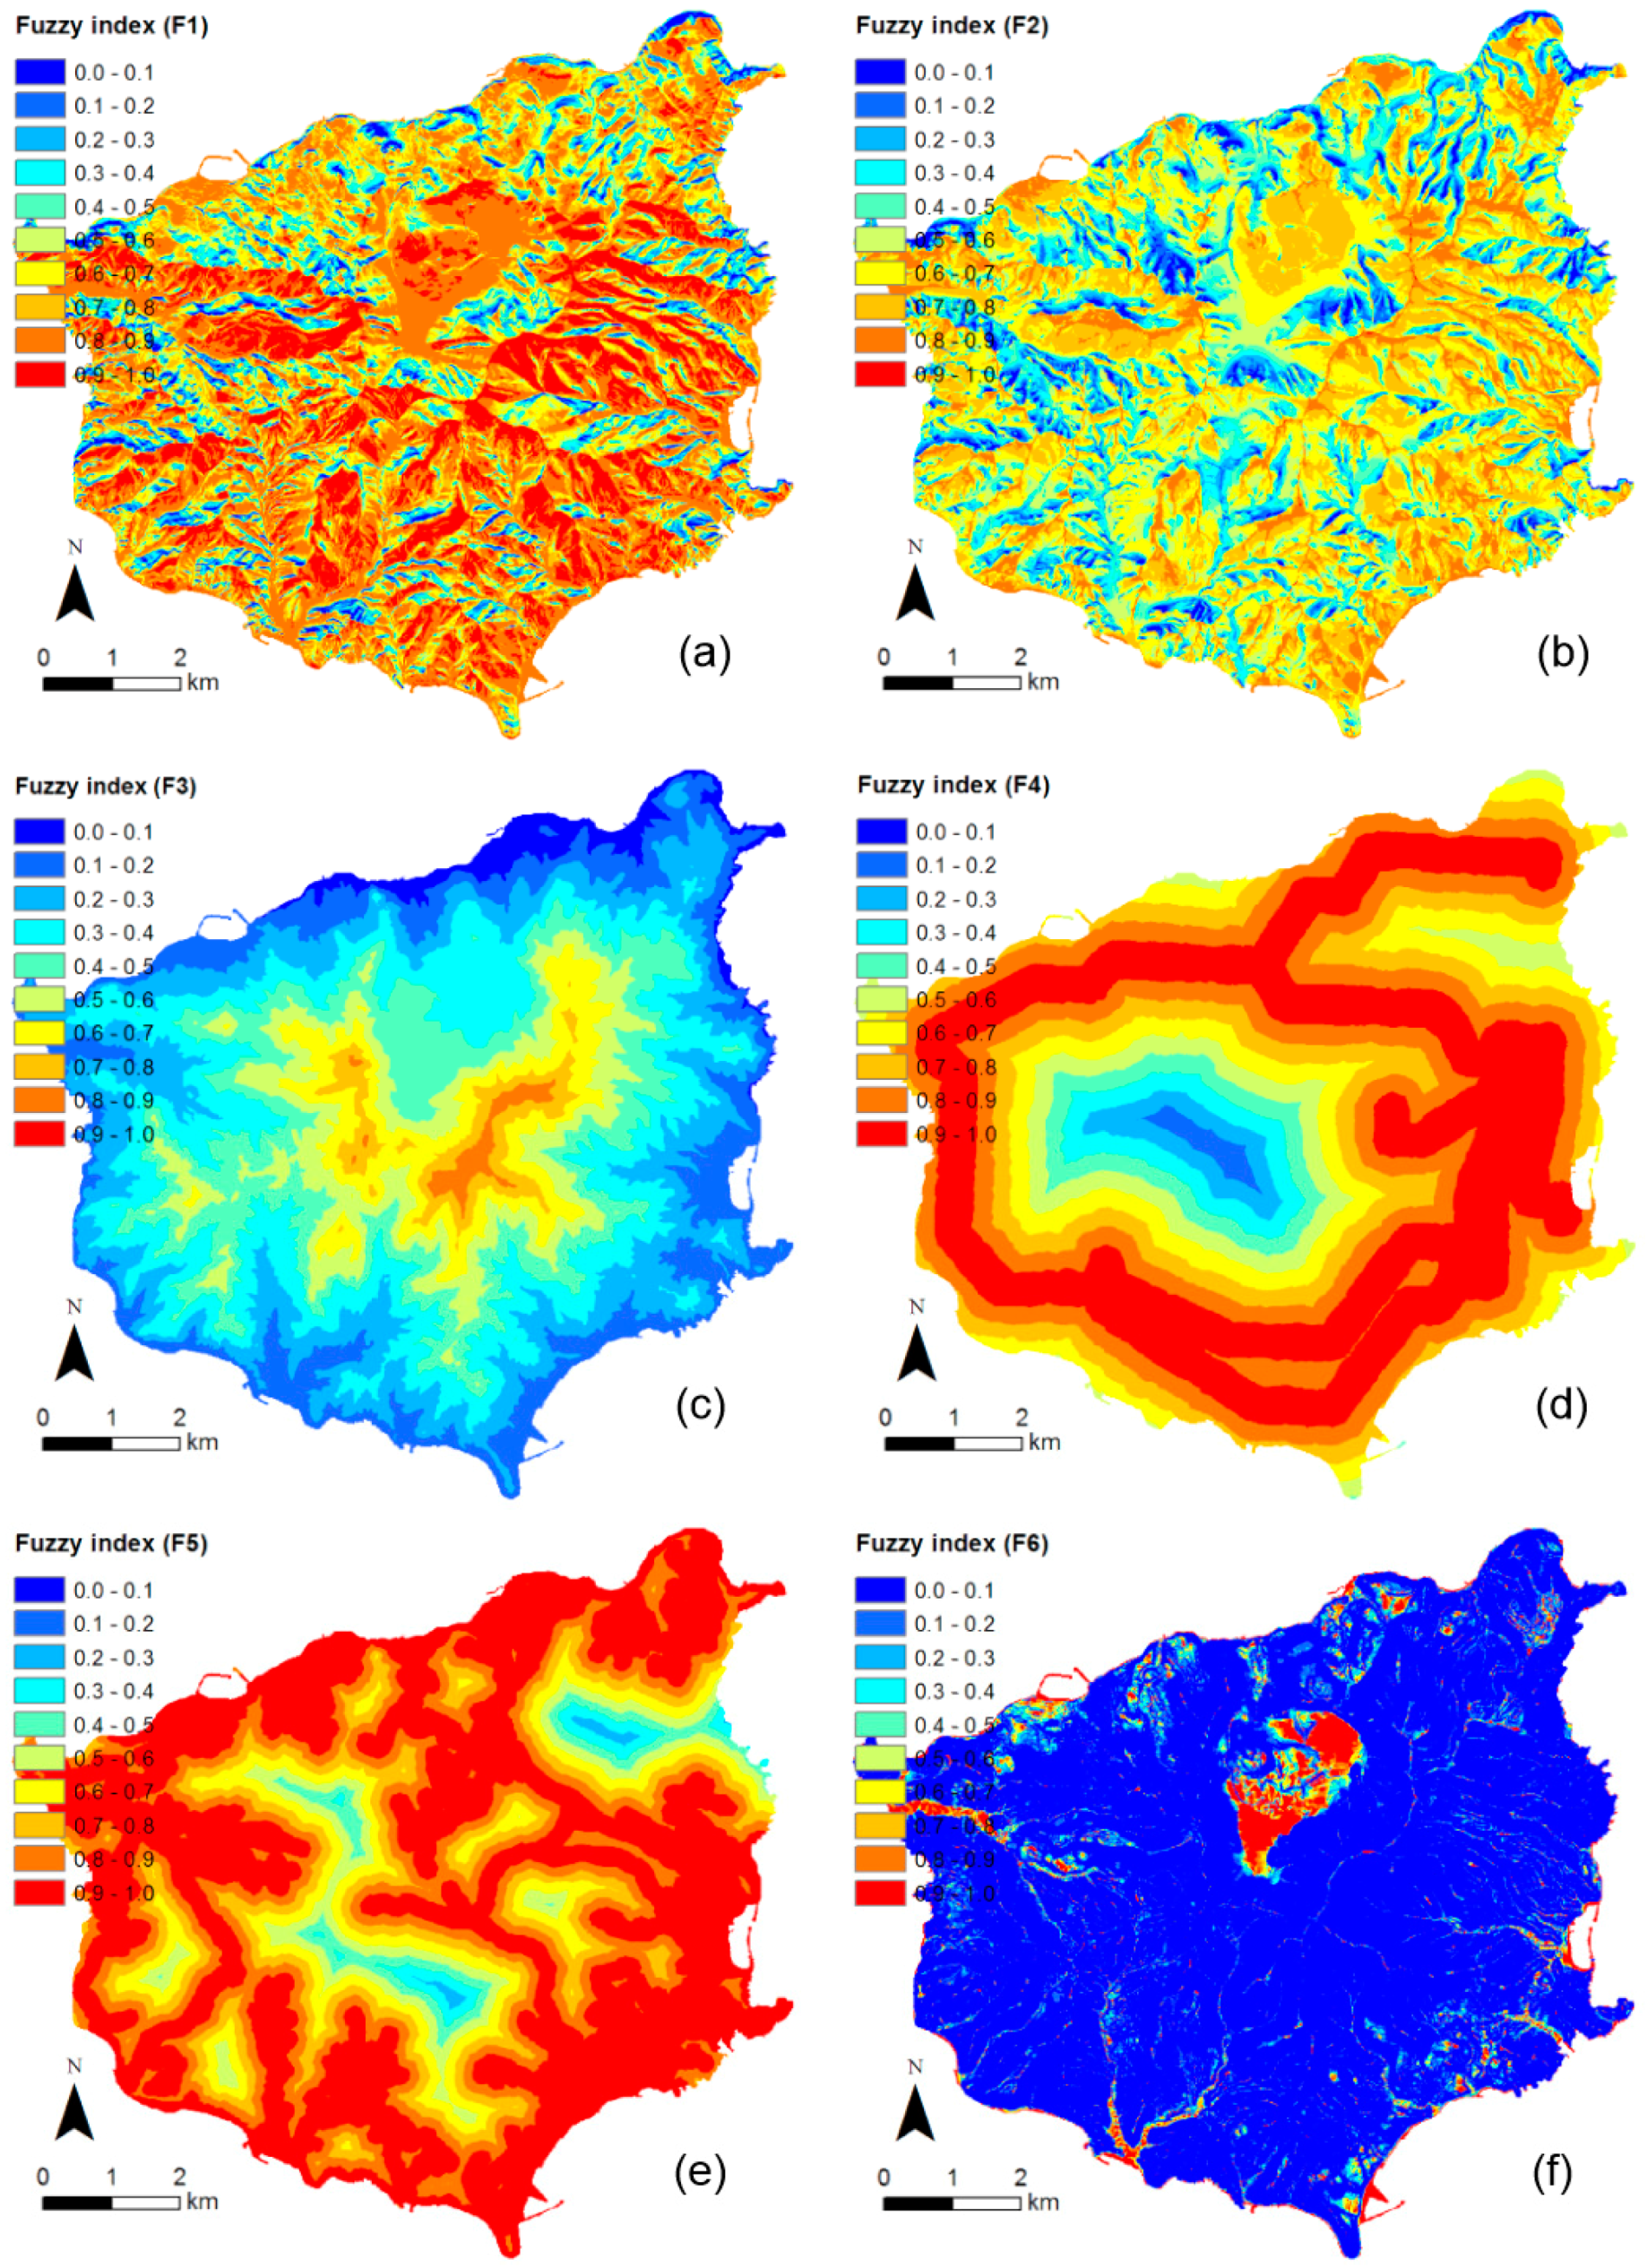
3.3. Generation of Fuzzy Index Layers for Factor Variables
3.4. Computation of Weightings of Each of the Factor Variables
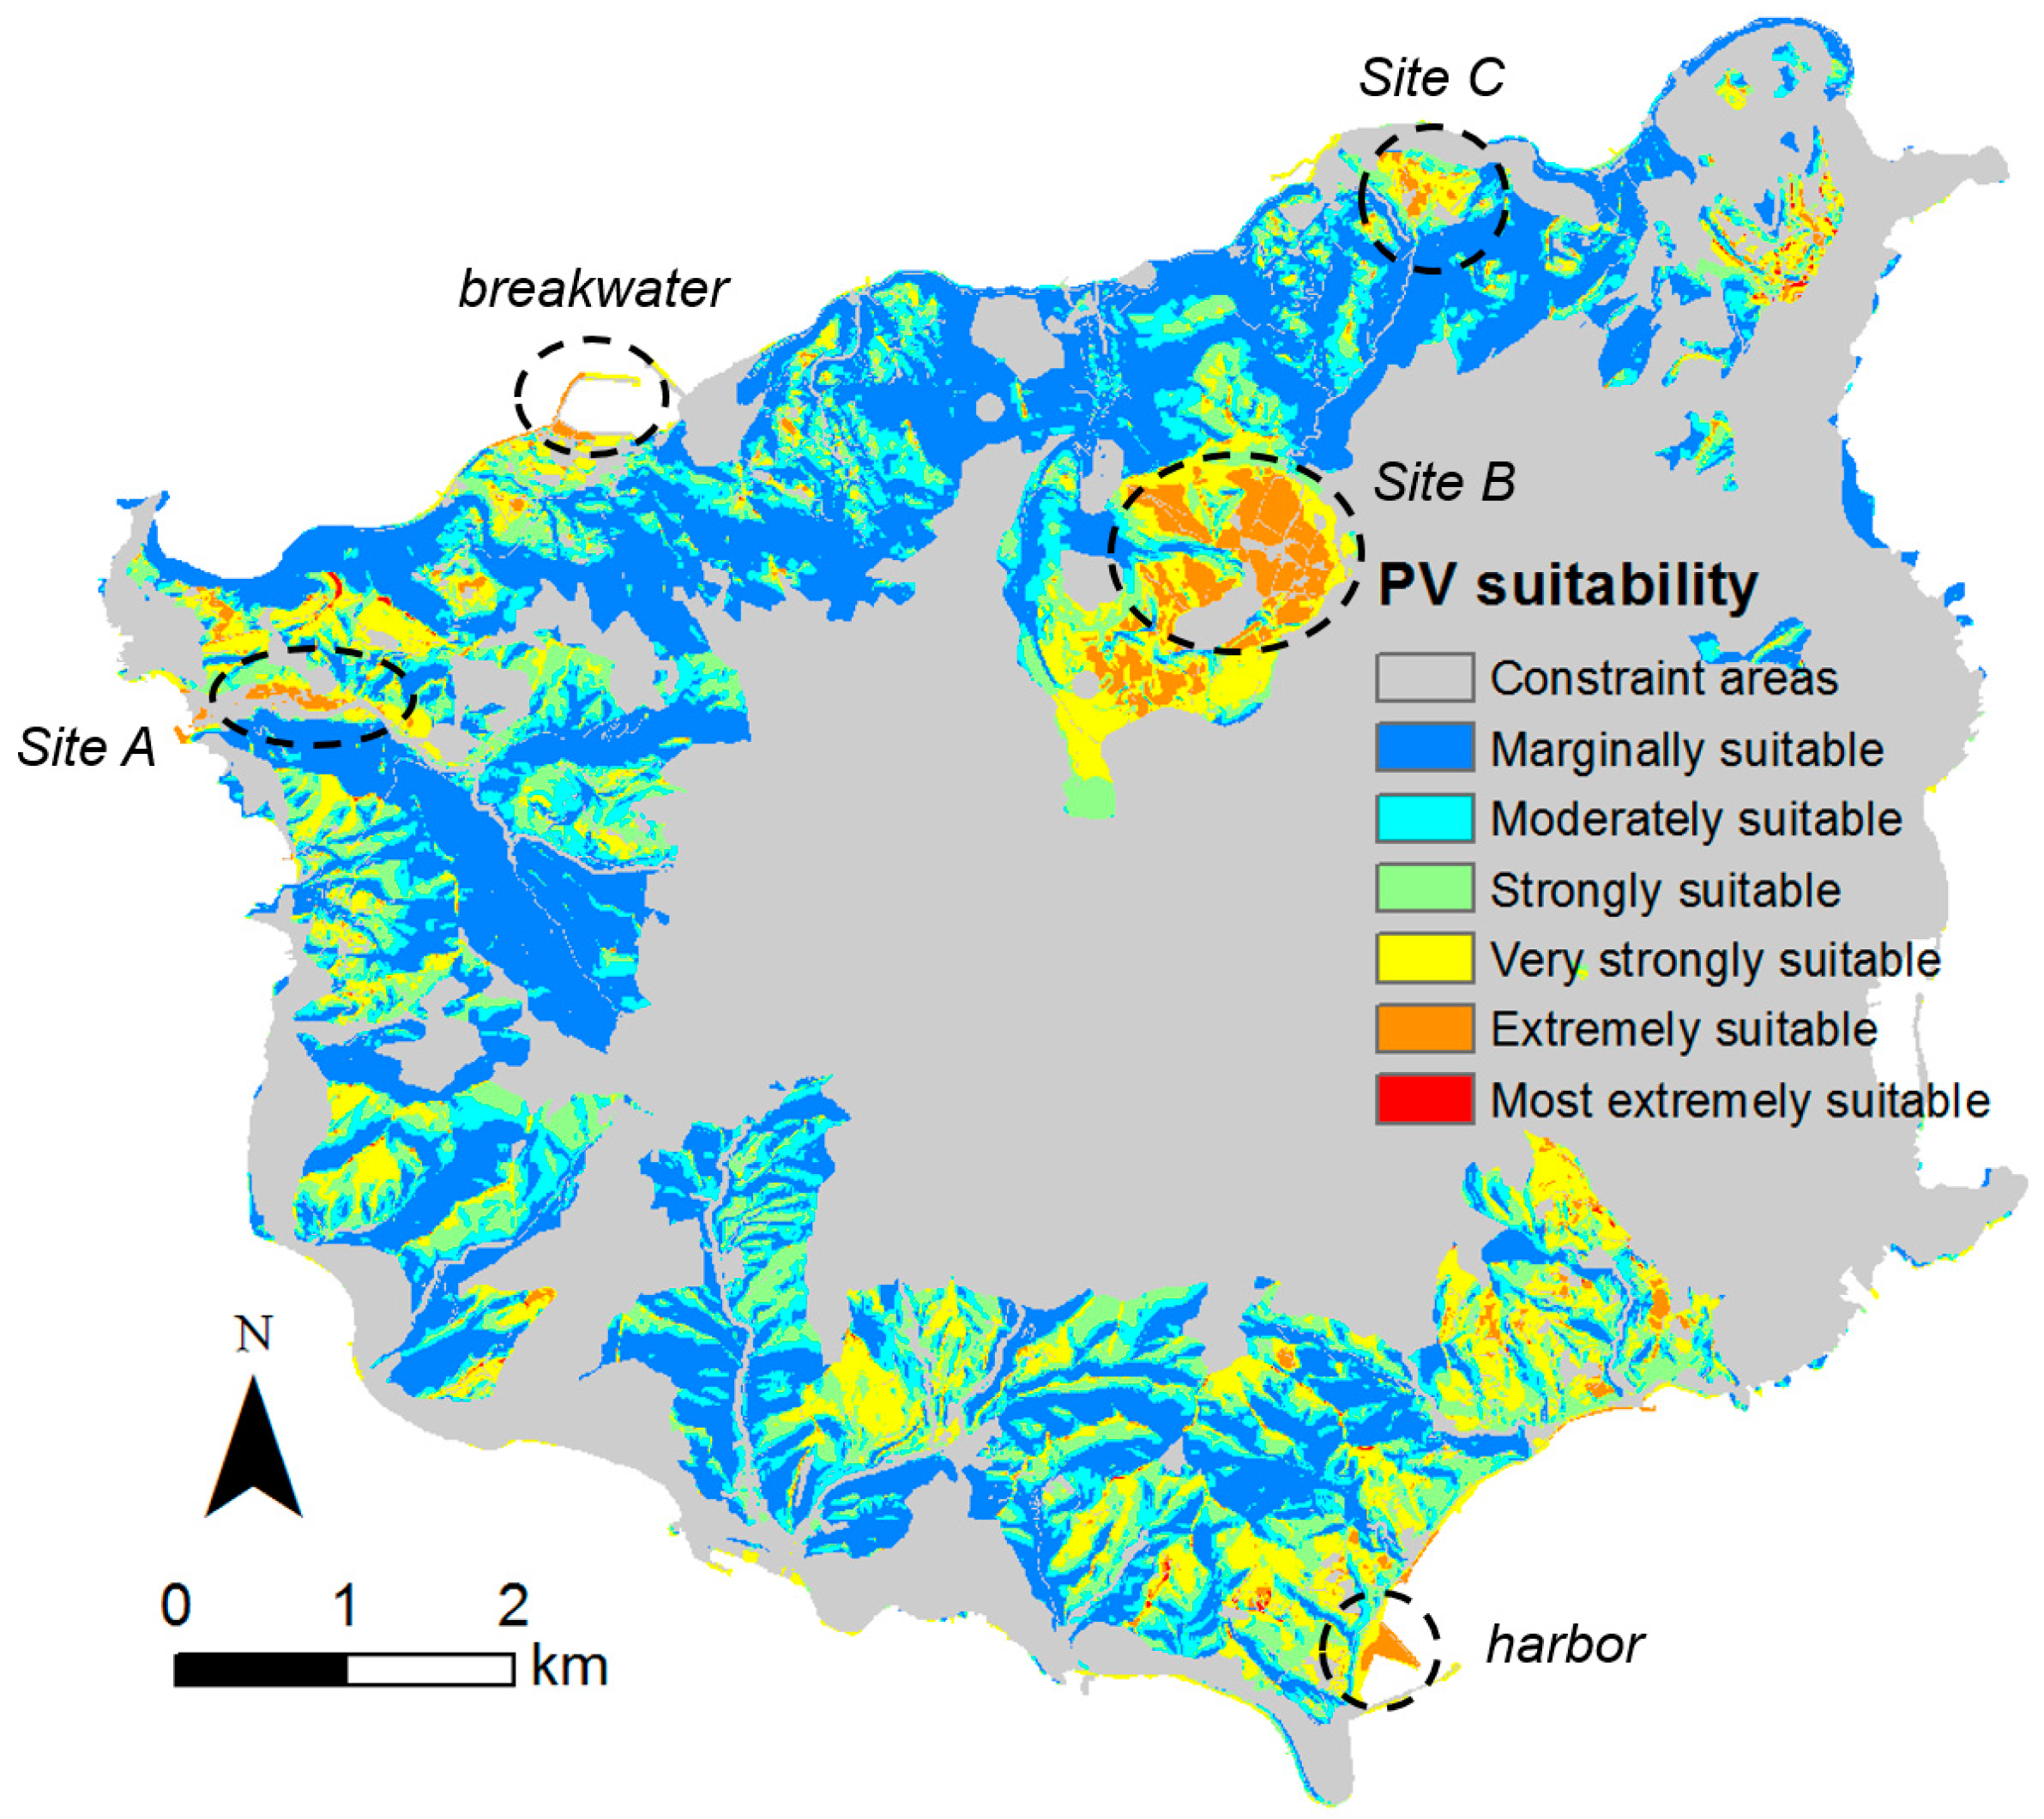
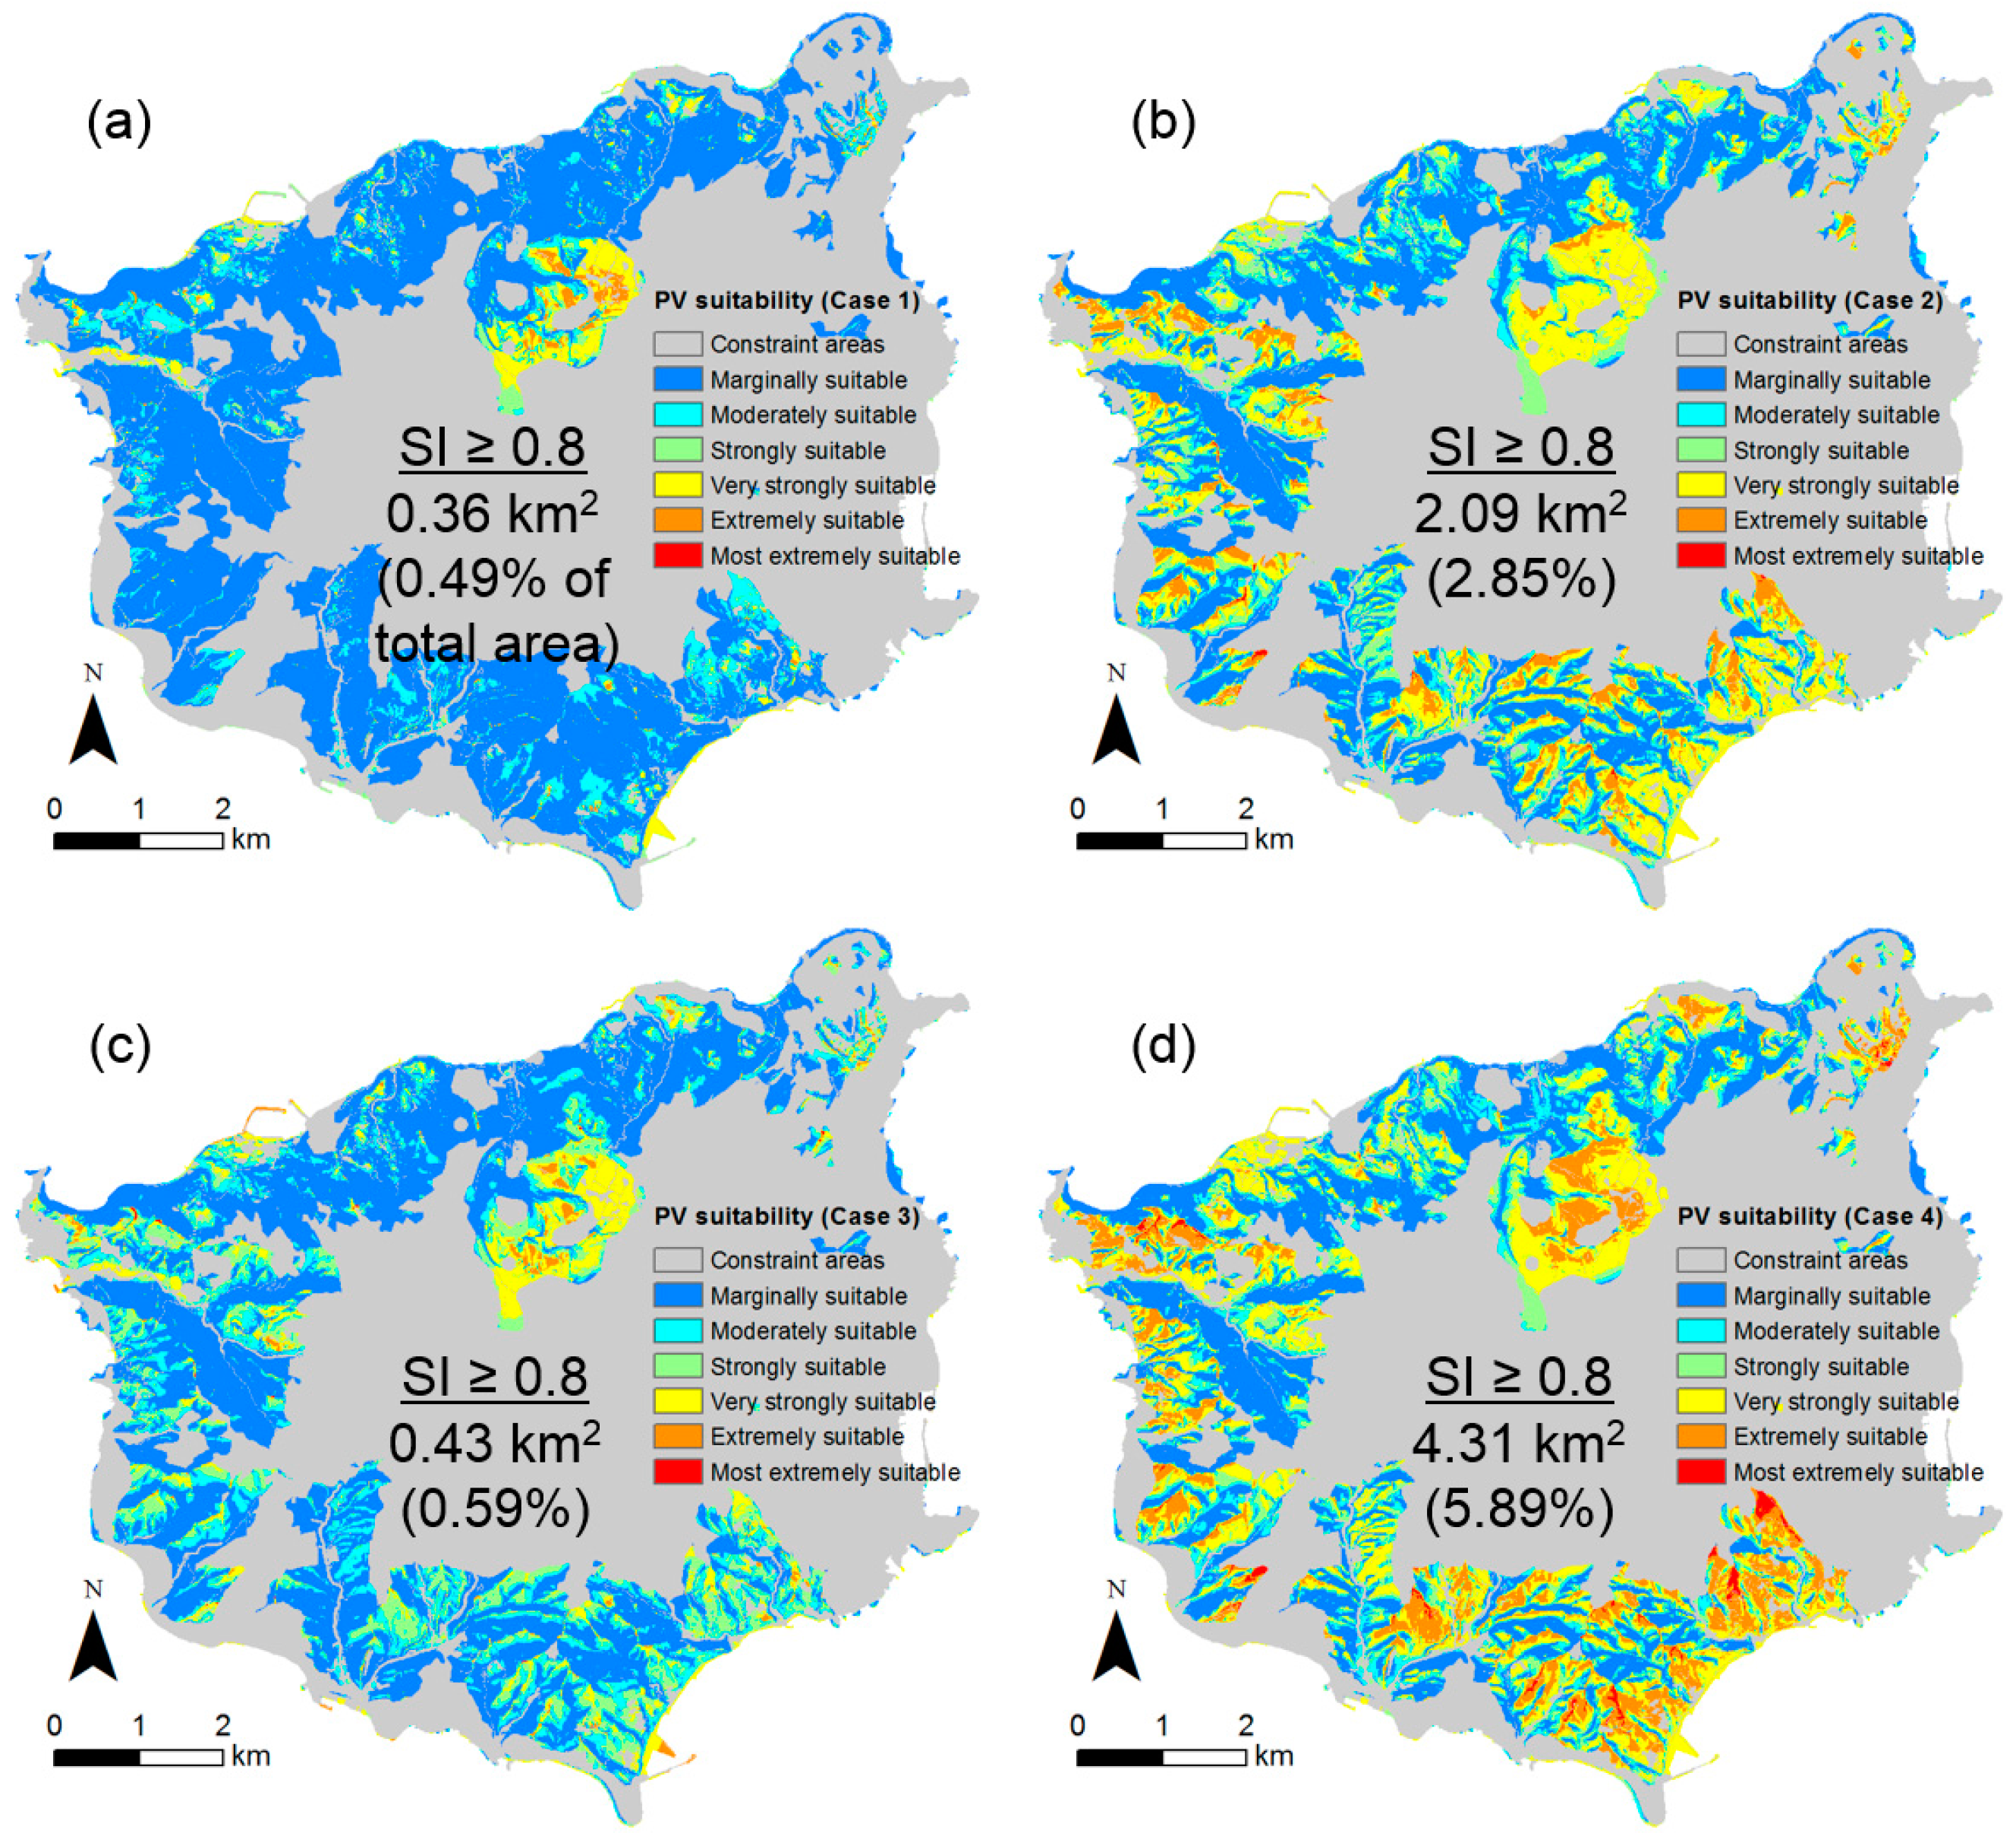
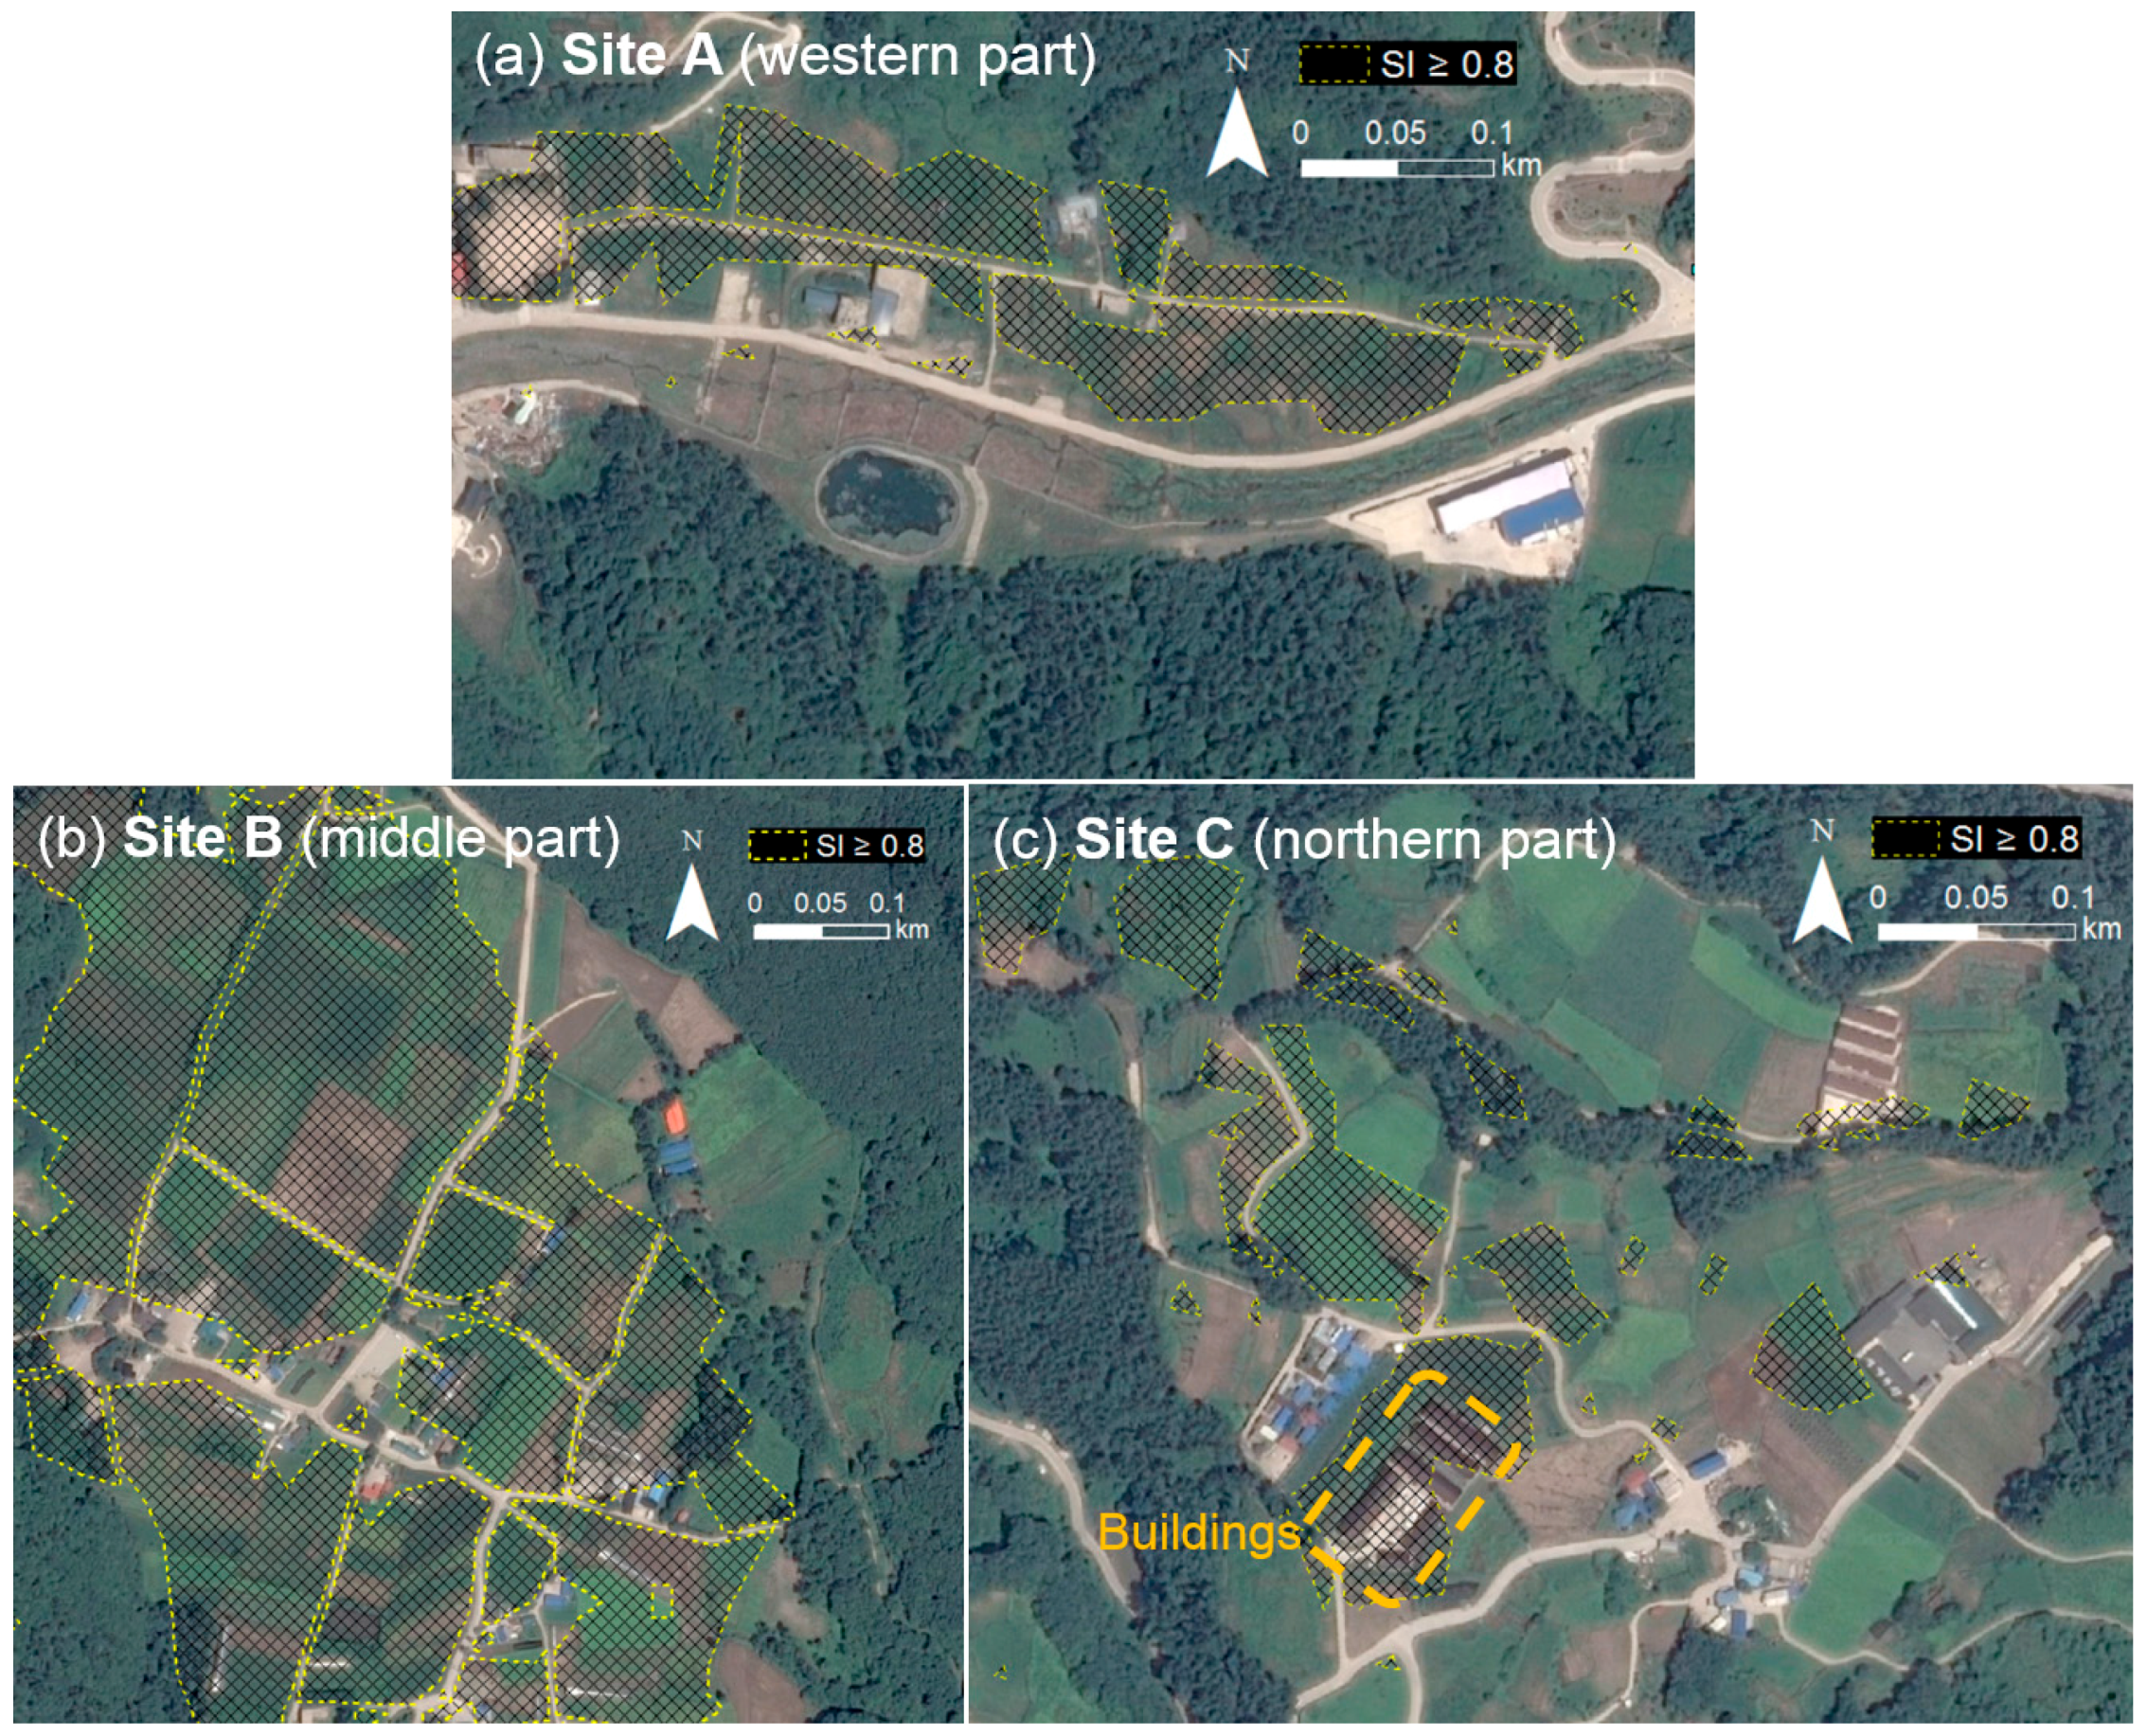
3.5. Generation of Suitability Layers Using a Fuzzy-Analytic Hierarchy Process Integrated Model and Its Sensitivity Analysis
4. Discussion
4.1. Validation of the Model
4.2. Location-Specific Slope Condition
5. Conclusions
Acknowledgments
Author Contributions
Conflicts of Interest
Abbreviations
| MCE | Multi-criteria evaluation |
| GIS | Geographic information system |
| PV | Photovoltaics |
| SI | Suitability index |
| BoS | Balance of system |
| MCDA | Multi-criteria decision analysis |
| AHP | Analytic hierarchy process |
| FLOWA | Fuzzy logic ordered weight averaging |
| DEM | Digital elevation model |
| FMF | Fuzzy membership functions |
| CR | Consistency ratio |
| RI | Random index |
| NTE | Nominal terrestrial environment |
| KMA | Korea meteorological administration |
Appendix A. Maps Used for Constraint Variables


Appendix B. Maps Used for Each Factor Variable
References
- Edenhofer, O.; Pichs-Madruga, R.; Sokona, Y.; Farahani, E.; Kadner, S.; Seyboth, K.; Adler, A.; Baum, I.; Brunner, S.; Eickemeier, P.; et al. Climate Change 2014: Mitigation of Climate Change; Intergovernmental Panel on Climate Change (IPCC): Cambridge, UK; New York, NY, USA, 2014. [Google Scholar]
- United Nations Climate Change Conference (COP 21). Available online: http://www.cop21.gouv.fr/en/195-countries-adopt-the-first-universal-climate-agreement (accessed on 7 January 2016).
- Uemura, Y.; Kai, T.; Natori, R.; Takahashi, T.; Hatate, Y.; Yoshida, M. Potential of renewable energy sources and its applications in Yakushima Island. Renew. Energy 2004, 29, 581–591. [Google Scholar] [CrossRef]
- Demiroren, A.; Yilmaz, U. Analysis of change in electric energy cost with using renewable energy sources in Gökceada, Turkey: An island example. Renew. Sustain. Energy Rev. 2010, 14, 323–333. [Google Scholar] [CrossRef]
- Liu, H.-Y.; Wu, S.-D. An assessment on the planning and construction of an island renewable energy system –A case study of Kinmen Island. Renew. Energy 2010, 35, 2723–2731. [Google Scholar] [CrossRef]
- Trappey, A.J.C.; Trappey, C.V.; Lin, G.Y.P.; Chang, Y.-S. The analysis of renewable energy policies for the Taiwan Penghu island administrative region. Renew. Sustain. Energy Rev. 2012, 16, 958–965. [Google Scholar] [CrossRef]
- Sakaguchi, T.; Tabata, T. 100% electric power potential of PV, wind power, and biomass energy in Awaji island Japan. Renew. Sustain. Energy Rev. 2015, 51, 1156–1165. [Google Scholar] [CrossRef]
- Mosey, G.; Heimiller, D.; Dahle, D.; Vimmerstedt, L.; Brady-Sabeff, L. Converting Limbo Lands to Energy-Generating Stations: Renewable Energy Technologies on Underused, Formerly Contaminated Sites; National Renewable Energy Laboratory: Golden, CO, USA, 2007.
- Song, J.; Choi, Y. Design of photovoltaic systems to power aerators for natural purification of acid mine drainage. Renew. Energy 2015, 83, 759–766. [Google Scholar] [CrossRef]
- Song, J.; Choi, Y. Analysis of the Potential for Use of Floating Photovoltaic Systems on Mine Pit Lakes: Case Study at the Ssangyong Open-Pit Limestone Mine in Korea. Energies 2016, 9, 102. [Google Scholar] [CrossRef]
- Brownson, J.R.S. Solar Energy Conversion Systems, 1st ed.; Elsevier-Academic Press: Oxford, UK, 2014; pp. 237–251. [Google Scholar]
- Dincer, I. Environmental impacts of energy. Energy Policy 1999, 27, 845–854. [Google Scholar] [CrossRef]
- Akella, A.K.; Saini, R.P.; Sharma, M.P. Social, economical and environmental impacts of renewable energy systems. Renew. Energy 2009, 34, 390–396. [Google Scholar] [CrossRef]
- DGI. Ulleung and Dokdo Island: Korea’s Sustainable Energy Island Project; Daegu Gyoengbuk Development Institute: Daegu, Korea, 2010. [Google Scholar]
- MKE. The Study on Comprehensive Plan for Constructing Ulleung Sustainable Energy Island; The Ministry of Knowledge Economy of Korea: Seoul, Korea, 2012.
- MKE. A Preliminary Study on a Demonstration of Green City; The Ministry of Knowledge Economy of Korea: Seoul, Korea, 2009.
- Environmental Protection Agency (EPA). Available online: https://www.epa.gov/re-powering (accessed on 15 August 2016).
- Carrión, J.A.; Estrella, A.E.; Dols, F.A.; Toro, M.Z.; Rodríguez, M.; Ridao, A.R. Environmental decision-support systems for evaluating the carrying capacity of land areas: Optimal site selection for grid-connected photovoltaic power plants. Renew. Sustain. Energy Rev. 2008, 12, 2358–2380. [Google Scholar] [CrossRef]
- Charabi, Y.; Gastli, A. PV site suitability analysis using GIS-based spatial fuzzy multi-criteria evaluation. Renew. Energy 2011, 36, 2554–2561. [Google Scholar] [CrossRef]
- Uyan, M. GIS-based solar farms site selection using analytic hierarchy process (AHP) in Karapinar region, Konya/Turkey. Renew. Sustain. Energy Rev. 2013, 28, 11–17. [Google Scholar] [CrossRef]
- Sánchez-Lozano, J.M.; Henggeler Antunes, C.; García-Cascales, M.S.; Dias, L.C. GIS-based photovoltaic solar farms site selection using ELECTRE-TRI: Evaluating the case for Torre Pacheco, Murcia, Southeast of Spain. Renew. Energy 2014, 66, 478–494. [Google Scholar] [CrossRef]
- Watson, J.J.W.; Hudson, M.D. Regional Scale wind farm and solar farm suitability assessment using GIS-assisted multi-criteria evaluation. Landsc. Urban Plan. 2015, 138, 20–31. [Google Scholar] [CrossRef]
- Pohekar, S.D.; Ramachandran, M. Application of multi-criteria decision making to sustainable energy planning—A review. Renew. Sustain. Energy Rev. 2004, 8, 365–381. [Google Scholar] [CrossRef]
- Wang, J.-J.; Jing, Y.-Y.; Zhang, C.-F.; Zhao, J.-H. Review on multi-criteria decision analysis aid in sustainable energy decision-making. Renew. Sustain. Energy Rev. 2009, 13, 2263–2278. [Google Scholar] [CrossRef]
- Sánchez-Lozano, J.M.; Teruel-Solano, J.; Soto-Elvira, P.L.; Socorro García-Cascales, M. Geographical Information Systems (GIS) and Multi-Criteria Decision Making (MCDM) methods for the evaluation of solar farms locations: Case study in south-eastern Spain. Renew. Sustain. Energy Rev. 2013, 24, 544–556. [Google Scholar] [CrossRef]
- Zadeh, L.A. Fuzzy sets. Inf. Control 1965, 8, 338–353. [Google Scholar] [CrossRef]
- Droj, G. Increasing Classification Quality by Using Fuzzy Logic. J. Appl. Eng. Sci. 2011, 1, 61–66. [Google Scholar]
- Carver, S.J. Integrating multi-criteria evaluation with geographical information systems. Int. J. Geogr. Inf. Syst. 1991, 5, 321–339. [Google Scholar] [CrossRef]
- Jankowiski, P. Integrating geographical information systems and multiple criteria decision-making methods. Int. J. Geogr. Inf. Syst. 1995, 9, 251–273. [Google Scholar] [CrossRef]
- Malczewski, J. GIS-based multicriteria decision analysis: A survey of the literature. Int. J. Geogr. Inf. Sci. 2006, 20, 703–726. [Google Scholar] [CrossRef]
- Local Information of Ulleung Island. Available online: http://www.ulleung.go.kr/English (accessed on 30 November 2015).
- Lee, S.; Suh, J.; Park, H.D. Smart Compass-Clinometer: A smartphone application for easy and rapid geological site investigation. Comput. Geosci. 2013, 61, 32–42. [Google Scholar] [CrossRef]
- Robinson, V.B. A Perspective on the Fundamentals of Fuzzy Sets and their Use in Geographic Information Systems. Trans. GIS 2003, 7, 3–30. [Google Scholar] [CrossRef]
- Saaty, T.L. A scaling methods for priorities in hierarchical structures. J. Math. Psychol. 1977, 15, 234–281. [Google Scholar] [CrossRef]
- Ishizaka, A.; Labib, A. Review of the main developments in the analytic hierarchy process. Expert Syst. Appl. 2011, 38, 14336–14345. [Google Scholar] [CrossRef] [Green Version]
- Skoplaki, E.; Palyvos, J.A. On the temperature dependence of photovoltaic module electrical performance: A review of efficiency/power correlations. Sol. Energy 2009, 83, 614–624. [Google Scholar] [CrossRef]
- Korea Meteorological Administration (KMA). Available online: http://www.kma.go.kr/weather/climate/solar_energy01.jsp?type=1&element=10&year=2010&x=26&y=7 (accessed on 30 November 2015).
- Korea Meteorological Administration (KMA). Available online: http://www.kma.go.kr/weather/climate/solar_energy01.jsp?type=1&element=9&year=2010&x=21&y=11 (accessed on 30 November 2015).
- Korea Law Information Systems. Available online: http://www.law.go.kr (accessed on 30 November 2015).
- Sengupta, M.; Habte, A.; Kurtz, S.; Dobos, A.; Wilbert, S.; Lorenz, E.; Stoffel, T.; Renné, D.; Gueymard, C.; Myers, D.; et al. Best Practices Handbook for the Collection and Use of Solar Resource Data for Solar Energy Applications; Technical Report NREL/TP-5D00-63112; National Renewable Energy Laboratory: Denver, CO, USA, 2015.
- Fu, P.; Rich, P. A geometric solar radiation model with applications in agriculture and forestry. Comput. Electron. Agric. 2002, 37, 25–35. [Google Scholar] [CrossRef]
- Gastli, A.; Charabi, Y.; Zekri, S. GIS-based assessment of combined CSP electric power and seawater desalination plant for Duqum—Oman. Renew. Sustain. Energy Rev. 2010, 14, 821–827. [Google Scholar] [CrossRef]
- Gastli, A.; Charabi, Y. Solar electricity prospects in Oman using GIS-based solar radiation maps. Renew. Sustain. Energy Rev. 2010, 14, 790–797. [Google Scholar] [CrossRef]
- Brito, M.C.; Gomes, N.; Santos, T.; Tenedório, J.A. Photovoltaic potential in a Lisbon suburb using LiDAR data. Sol. Energy 2012, 86, 283–288. [Google Scholar] [CrossRef]
- Bayrakci Boz, M.; Calvert, K.; Brownson, J.R.S. An automated model for rooftop PV systems assessment in ArcGIS using LIDAR. AIMS Energy 2015, 3, 401–420. [Google Scholar] [CrossRef]
- Bayrakci, M.; Choi, Y.; Brownson, J.R.S. Temperature Dependent Power Modeling of Photovoltaics. Energy Procedia 2014, 57, 745–754. [Google Scholar] [CrossRef]


| Variables | EPA [17] | Carrión et al. [18] | Charabi and Gastli [19] | Uyan [20] | Sánchez-Lozano et al. [21] | Watson and Hudson [22] | Raw Count | |
|---|---|---|---|---|---|---|---|---|
| Factor variables | Solar irradiation | X | X | X | - | X | X | 5 |
| Diffuse irradiation | - | X | - | - | - | - | 1 | |
| Equivalent sun hours | - | X | - | - | - | - | 1 | |
| Average temperature | - | X | - | - | X | - | 2 | |
| Road access | X | X | X | X | X | X | 6 | |
| Grid connection 1 | X | X | X | X | X | 5 | ||
| Slope | X | X | X | X | X | X | 6 | |
| Aspect (orientation) | - | X | - | - | X | X | 3 | |
| Minimum suitable areas | X | - | - | - | X | - | 2 | |
| Agrological capacity | - | - | - | - | X | - | 1 | |
| Constraint variables | Urban areas | X | X | X | X | X | X | 6 |
| Residential areas | X | X | X | X | X | 5 | ||
| Wildlife designations 2 | X | X | - | X | X | X | 5 | |
| Hydrographic areas 3 | X | X | X | X | X | - | 5 | |
| Touristic sites 4 | - | - | X | X | X | X | 4 | |
| Landscape designations 5 | X | X | - | - | X | X | 4 | |
| Traffic areas | - | X | X | X | - | - | 3 | |
| Sand/dusk risk | - | - | X | - | - | - | 1 | |
| Land subsidence | X | - | - | - | - | - | 1 | |
| Soil erosion | X | - | - | - | - | - | 1 | |
| No. | Constraint Variable | Threshold | Reference | Data Source |
|---|---|---|---|---|
| C1 | Residential areas | Itself | Regulation | NSIC |
| C2 | Land use plan (urban, natural environment conservation areas) | Itself | Regulation | EGIS |
| C3 | Tourist sites (historical areas, cultural heritage and archeological sites) | Itself | Regulation | EGIS |
| C4 | Landscape designations (visual impact, scenic sites) | Itself | Regulation | EGIS |
| C5 | Wildlife designations (birds protection zones, paleontological sites) | Itself | Regulation | EGIS |
| C6 | Hydrographic areas (lakes, protection areas of source water, rivers, streams, water courses) | 10 m buffer | Regulation | WAMIS |
| C7 | Slope failure zone (rock fall) | 10 m buffer | Local characteristics | Site investigation |
| C8 | Elevation | >492 m | National low | NSIC |
| No. | Factor Variable | Original File Extension | Data Source |
|---|---|---|---|
| F1 | Solar irradiation (kWh/m2/day) | Grid | Modeled using digital elevation model (DEM) and modified using KMA measured data (1 year for solar irradiation and average temperature, 20 years for sunshine hours) |
| F2 | Equivalent sunshine hours (h) | Grid | |
| F3 | Average temperature in summer (°C) | Point | |
| F4 | 3D path distance from nearest transmission line (m) | Polyline | Digitized and calculated from KEPCO data |
| F5 | 3D path distance from nearest road (m) | Polyline | Calculated from NSIC data |
| F6 | Slope (°) | Grid | Calculated using DEM |
| Intensity of Importance | Definition | Explanation |
|---|---|---|
| 1 | Equal importance | Two activities contribute equally to the objective |
| 3 | Moderate importance | Experience and judgment slightly favor one activity over another |
| 5 | Strong importance | Experience and judgment strongly favor one activity over another |
| 7 | Very strong or demonstrated importance | An activity is favored very strongly over another; its dominance demonstrated in practice |
| 9 | Extreme importance | The evidence favoring one activity over another is of the highest possible order of affirmation |
| 2, 4, 6, 8 | For compromise between the above values | Sometimes one needs to interpolate a compromise judgment numerically because there is no good word to describe it |
| Factor | Fuzzy Function | Spread | Midpt | Minimum value | Maximum value | Reference | Weight |
|---|---|---|---|---|---|---|---|
| F1 | Fuzzy Large | 5 | 2 | - | - | Min-Max value of Korea | 0.3889 |
| F2 | Fuzzy Large | 5 | 3.5 | - | - | Min-Max value of Korea | 0.2682 |
| F3 | Fuzzy Linear | - | - | 27.3 | 20 | Skoplaki and Palyvos [36] | 0.0838 |
| F4 | Fuzzy Linear | - | - | 3000 | 0 | Local characteristics | 0.1151 |
| F5 | Fuzzy Linear | - | - | 1600 | 5 | Local characteristics | 0.0641 |
| F6 | Fuzzy Small | 3 | 9 | - | - | Local law and regulation | 0.0799 |
| Factor Variable | Site A | Site B | Site C |
|---|---|---|---|
| Solar irradiation (kWh/m2/day) | 2.91 | 3.04 | 2.99 |
| Equivalent sunshine hours (h) | 4.57 | 4.33 | 4.90 |
| Average temperature in summer (°C) | 25.96 | 24.70 | 26.57 |
| 3D path distance from nearest transmission line (m) | 139.76 | 332.53 | 202.32 |
| 3D path distance from nearest road (m) | 18.15 | 57.88 | 34.31 |
| Slope (°) | 3.15 | 2.68 | 2.45 |
| Area (km2) | 0.04 | 0.61 | 0.03 |
© 2016 by the authors; licensee MDPI, Basel, Switzerland. This article is an open access article distributed under the terms and conditions of the Creative Commons Attribution (CC-BY) license (http://creativecommons.org/licenses/by/4.0/).
Share and Cite
Suh, J.; Brownson, J.R.S. Solar Farm Suitability Using Geographic Information System Fuzzy Sets and Analytic Hierarchy Processes: Case Study of Ulleung Island, Korea. Energies 2016, 9, 648. https://doi.org/10.3390/en9080648
Suh J, Brownson JRS. Solar Farm Suitability Using Geographic Information System Fuzzy Sets and Analytic Hierarchy Processes: Case Study of Ulleung Island, Korea. Energies. 2016; 9(8):648. https://doi.org/10.3390/en9080648
Chicago/Turabian StyleSuh, Jangwon, and Jeffrey R. S. Brownson. 2016. "Solar Farm Suitability Using Geographic Information System Fuzzy Sets and Analytic Hierarchy Processes: Case Study of Ulleung Island, Korea" Energies 9, no. 8: 648. https://doi.org/10.3390/en9080648
APA StyleSuh, J., & Brownson, J. R. S. (2016). Solar Farm Suitability Using Geographic Information System Fuzzy Sets and Analytic Hierarchy Processes: Case Study of Ulleung Island, Korea. Energies, 9(8), 648. https://doi.org/10.3390/en9080648