Article

DG Mix and Energy Storage Units for Optimal Planning of Self-Sufficient Micro Energy Grids

by
Aboelsood Zidan
1,3 and
Hossam A. Gabbar
1,2,*
1
Faculty of Energy Systems and Nuclear Science, University of Ontario Institute of Technology, 2000 Simcoe Street North, Oshawa, ON L1H 7K4, Canada
2
Faculty of Engineering and Applied Science, University of Ontario Institute of Technology, 2000 Simcoe Street North, Oshawa, ON L1H 7K4, Canada
3
Department of Electrical Engineering, Faculty of Engineering, Assiut University, Assiut 71515, Egypt
*
Author to whom correspondence should be addressed.
Energies 2016, 9(8), 616; https://doi.org/10.3390/en9080616
Submission received: 21 April 2016 / Revised: 12 July 2016 / Accepted: 26 July 2016 / Published: 4 August 2016

Abstract

:
Micro energy grids have many merits and promising applications under the smart grid vision. There are demanding procedures for their optimal planning and performance enhancement. One of the key features of a micro energy grid is its ability to separate and isolate itself from the main electrical network to continue feeding its own islanded portion. In this paper, an optimal sizing and operation strategy for micro energy grids equipped with renewable and non-renewable based distributed generation (DG) and storage are presented. The general optimization objective is to define the best DG mix and energy storage units for self-sufficient micro energy grids. A multi-objective genetic algorithm (GA) was applied to solve the planning problem at a minimum optimization goal of overall cost (including investment cost, operation and maintenance cost, and fuel cost) and carbon dioxide emission. The constraints include power and heat demands constraints, and DGs capacity limits. The candidate technologies include CHPs (combined heat and power) with different characteristics, boilers, thermal and electrical storages, and renewable generators (wind and photovoltaic). In order to assess different configuration options and components sizes, several case studies for a typical micro energy grid have been presented.

Graphical Abstract

1. Introduction

The classic energy systems have evolved through large central energy generation plants interconnected via grids of transmission lines and distribution networks that feed energy to customers. These systems are beginning to change rapidly due to [1]: (1) depletion of fossil fuels; (2) limited ability to construct large scale generation due to increased environmental regulation; (3) limited ability to site new transmission lines; (4) universal challenge to meet the world’s energy consumption growth that will require massive increases in energy generation capacities; (5) centralized energy systems are vulnerable to disturbances in the supply chain; (6) insecurities affecting energy transportation infrastructure; and (7) desire of investors to minimize risks through deploying small-scale generation (DG) and transmission systems. Therefore, an alternate energy generation system with higher efficiency of energy use is required [2].
DG units such as small natural gas-fueled generators, CHPs (combined heat and power), storage, renewable energy sources (wind, and photovoltaics (PV)) will have important role in future power systems. DG units provide consumers and society with a wide variety of benefits such as reducing system losses, enhancing voltage profile, shaving peak demand, relieving overloaded distribution lines, reducing greenhouse gas emissions, increasing overall energy efficiency, and deferring investments to upgrade existing power systems [3]. Thus, interest in DG units has been growing constantly, especially in the case of electricity supply. As the number of DG units increases, micro energy grids can be formed within a distribution system as regions with enough generation to meet all or most of its local demand.
Micro energy grid is considered as a small local grid at low voltage (LV) or medium voltage (MV) level which includes loads, control system, and a set of energy sources such as distributed generators and energy storage devices [4]. Each micro energy grid has two levels of interconnection, local and regional interconnection. Local interconnection is interconnection between different components of a micro energy grid including energy sources and loads. If available, regional interconnection is interconnection with other nearby micro energy grids and/or the main grid. Micro energy grid can operate in a grid-connected mode where it interacts with the main grid (i.e., either being supplied by the main grid or injecting some amount of power into the main grid), or in an islanding mode where it autonomously meets the energy and quality requirements of the customers in its area [5].
Micro energy grids can be integrated with wind turbines, photovoltaics, energy storage systems (i.e., for electricity and heat), boilers, and CHPs with different types and technologies (i.e., microturbines, fuel cells, etc.). CHPs generate heat and electricity simultaneously. All of these energy sources coordinate to satisfy the power and heat loads in the micro energy grid. Integration of many CHP and renewable energy sources is a key target for improving micro energy grids performance [6]. However, the fluctuated output from renewable energy sources and load variation may cause dynamic changing in the balance between generation and loading. Energy storage systems can smooth out the intermittent renewable power generation and flatten the load (by charging when the load is low and discharging during peak load times). Thus, their sizes can be selected depending on the load level and the renewable energy penetration. More importantly, when a micro energy grid is isolated, energy storage systems can provide voltage and frequency references for the micro energy grid alone or together with other sources [7]. Furthermore, flexible CHP production helps along the integration of fluctuating electricity production from renewable energy sources and supports the energy balancing and micro energy grid stabilization [8].
Islanded operation for micro energy grids represents a viable option for economic and technical reasons [9]. A micro energy grid operates as an island under emergency conditions (i.e., if a fault strikes the upstream grid) or as intentionally planned (i.e., for maintenance purposes or economic reasons). In some cases, islanded operation is the only mode of operation such as off-grid remote electrification systems. Islanded operation enhances system reliability and service continuity. For resilient micro energy grid and for reliable and economic operation, a self-sufficient supply should always be available in case that a micro energy grid is required to switch to the islanded mode [10].
A review of the literature shows that lots of work has been carried out on micro energy grids’ planning (i.e., generation mix selection, sizing, and sitting) and operational scheduling problems. Zhang et al. [2] proposed an optimal design of micro energy grids to minimize the overall operating cost and emissions. Their work did not consider the integration of renewable energy sources in micro energy grids. In Reference [4], a hierarchical framework has been proposed to schedule generators in a micro energy grid. However, thermal storage and emissions were not included. Conti et al. in [5] proposed an optimization algorithm for optimal dispatching of DGs and storage systems in an islanded micro energy grid. Although both overall operating cost and emission have been included, thermal energy demand has not been considered. Vafaei et al. [11] proposed a method to select and size different generation technologies and storage devices for a micro energy grid to minimize its operational costs. The optimization model was formulated as a mixed integer programming problem. Chen et al. in [12] proposed a cost-benefit analysis for optimal sizing of energy storage systems in a micro energy grid. Time series and feed-forward neural network techniques were used for forecasting the wind speed and solar radiations respectively. The planning problem was formulated as a mixed integer linear programming. The work in references [11,12] did not consider the thermal demand.
Khodaei et al. [13] used dynamic programming to design cost optimized micro energy grid architectures subject to reliability constraints. The method determines the optimal power line layout between local generators and load points, given their locations and the rights of way for possible interconnections. However, thermal energy demand and emissions were not included. Buavai et al. [14] proposed a two-stage multi-objective optimization process for micro energy grid planning. In the first stage, loss sensitivity factor was proposed to identify the micro energy grid area in a primary distribution system. In the second stage, a Pareto-based NSGA-II was proposed to find locations and sizes of a specified number of generators within micro energy grids. Objectives included were power loss, load voltage deviation, and annualized investment cost. In Reference [15], a design approach for the energy management and sizing of a micro energy grid with storage has been presented. The studied micro energy grid was composed of commercial buildings, factories, PV, and flywheel storage. Atia et al. [16] presented a novel model based on mixed integer linear programming for optimizing renewable energy and battery energy storage in a residential micro energy grid.
Zhang et al. in [17] proposed a bi-level program for the microgrid planning problem. The sizing problem was formulated on the upper level, while the unit commitment problem for the microgrid was described on the lower level. An islanded microgrid with wind turbines, photovoltaic array, diesel generators, and compressed air energy storage (CAES) was investigated. They did not, however, consider heat demand in their work. Sachs et al. [18] presented a multi-objective model based optimization approach for the optimal sizing of all components and the determination of the best power electronic layout for an islanded microgrid. The objectives for the layout optimization were the capital expenditure, the Levelized cost of energy and emissions. The objective for the optimization of the operation of the system included the diesel generator and battery cost. They did not, however, consider heat demand in their work.
Islanded (off-grid) micro energy grids enable a cost efficient and reliable energy supply to rural areas around the world. Accordingly, driven by the need to develop cleaner, more efficient, reliable, resilient, and responsive energy systems, the energy sector is currently moving towards the implementation of the micro energy grid concept. The review of the literature shows that most of the published work has studied micro energy grids’ planning in a grid-connected mode and based on the consideration of the electricity demand only. However, the planning studies for islanded micro energy grids with considering both of the electricity and head demands are limited in the literature. Therefore, to ensure a successful practical implementation of the micro energy grid concept, this work presents an extension to the work published in Reference [19] to propose an optimal planning for self-sufficient micro energy grids in islanded mode in a manner that will include:
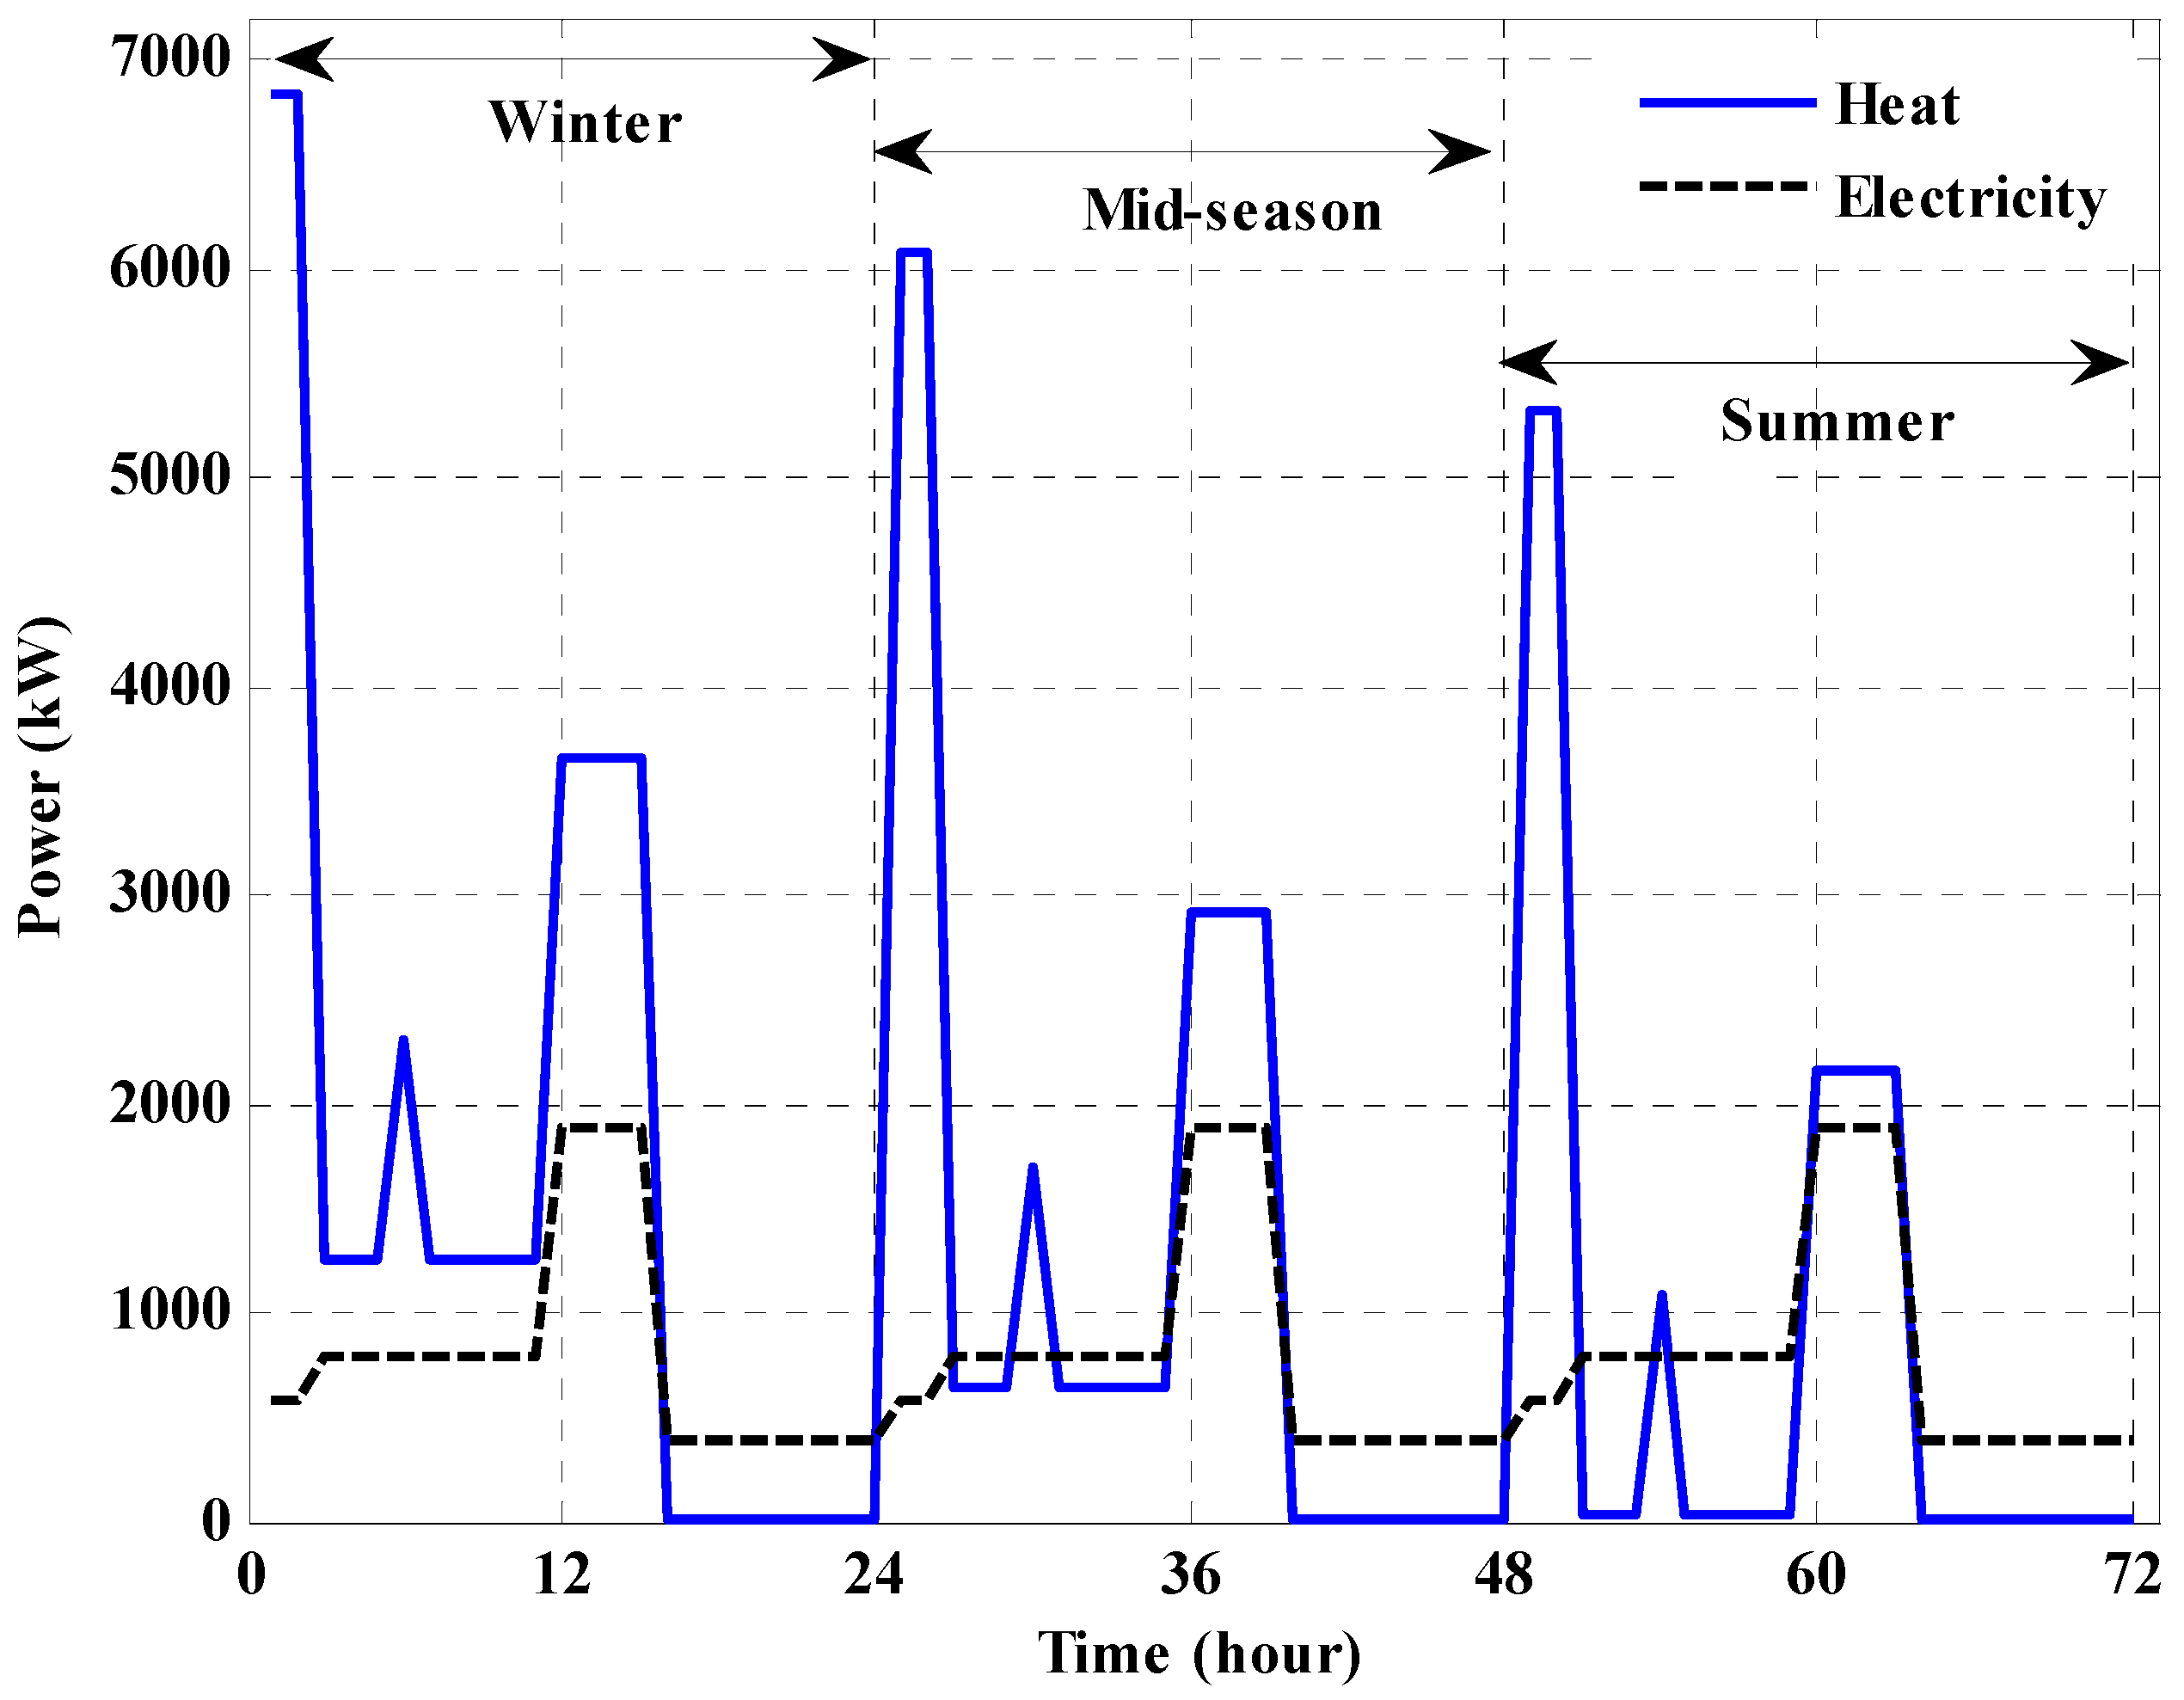
Electrical and heat demands with considering the hourly change during the day.
Economic objective (total capital, operational, and fuel costs) and environmental objective (CO2 emissions).
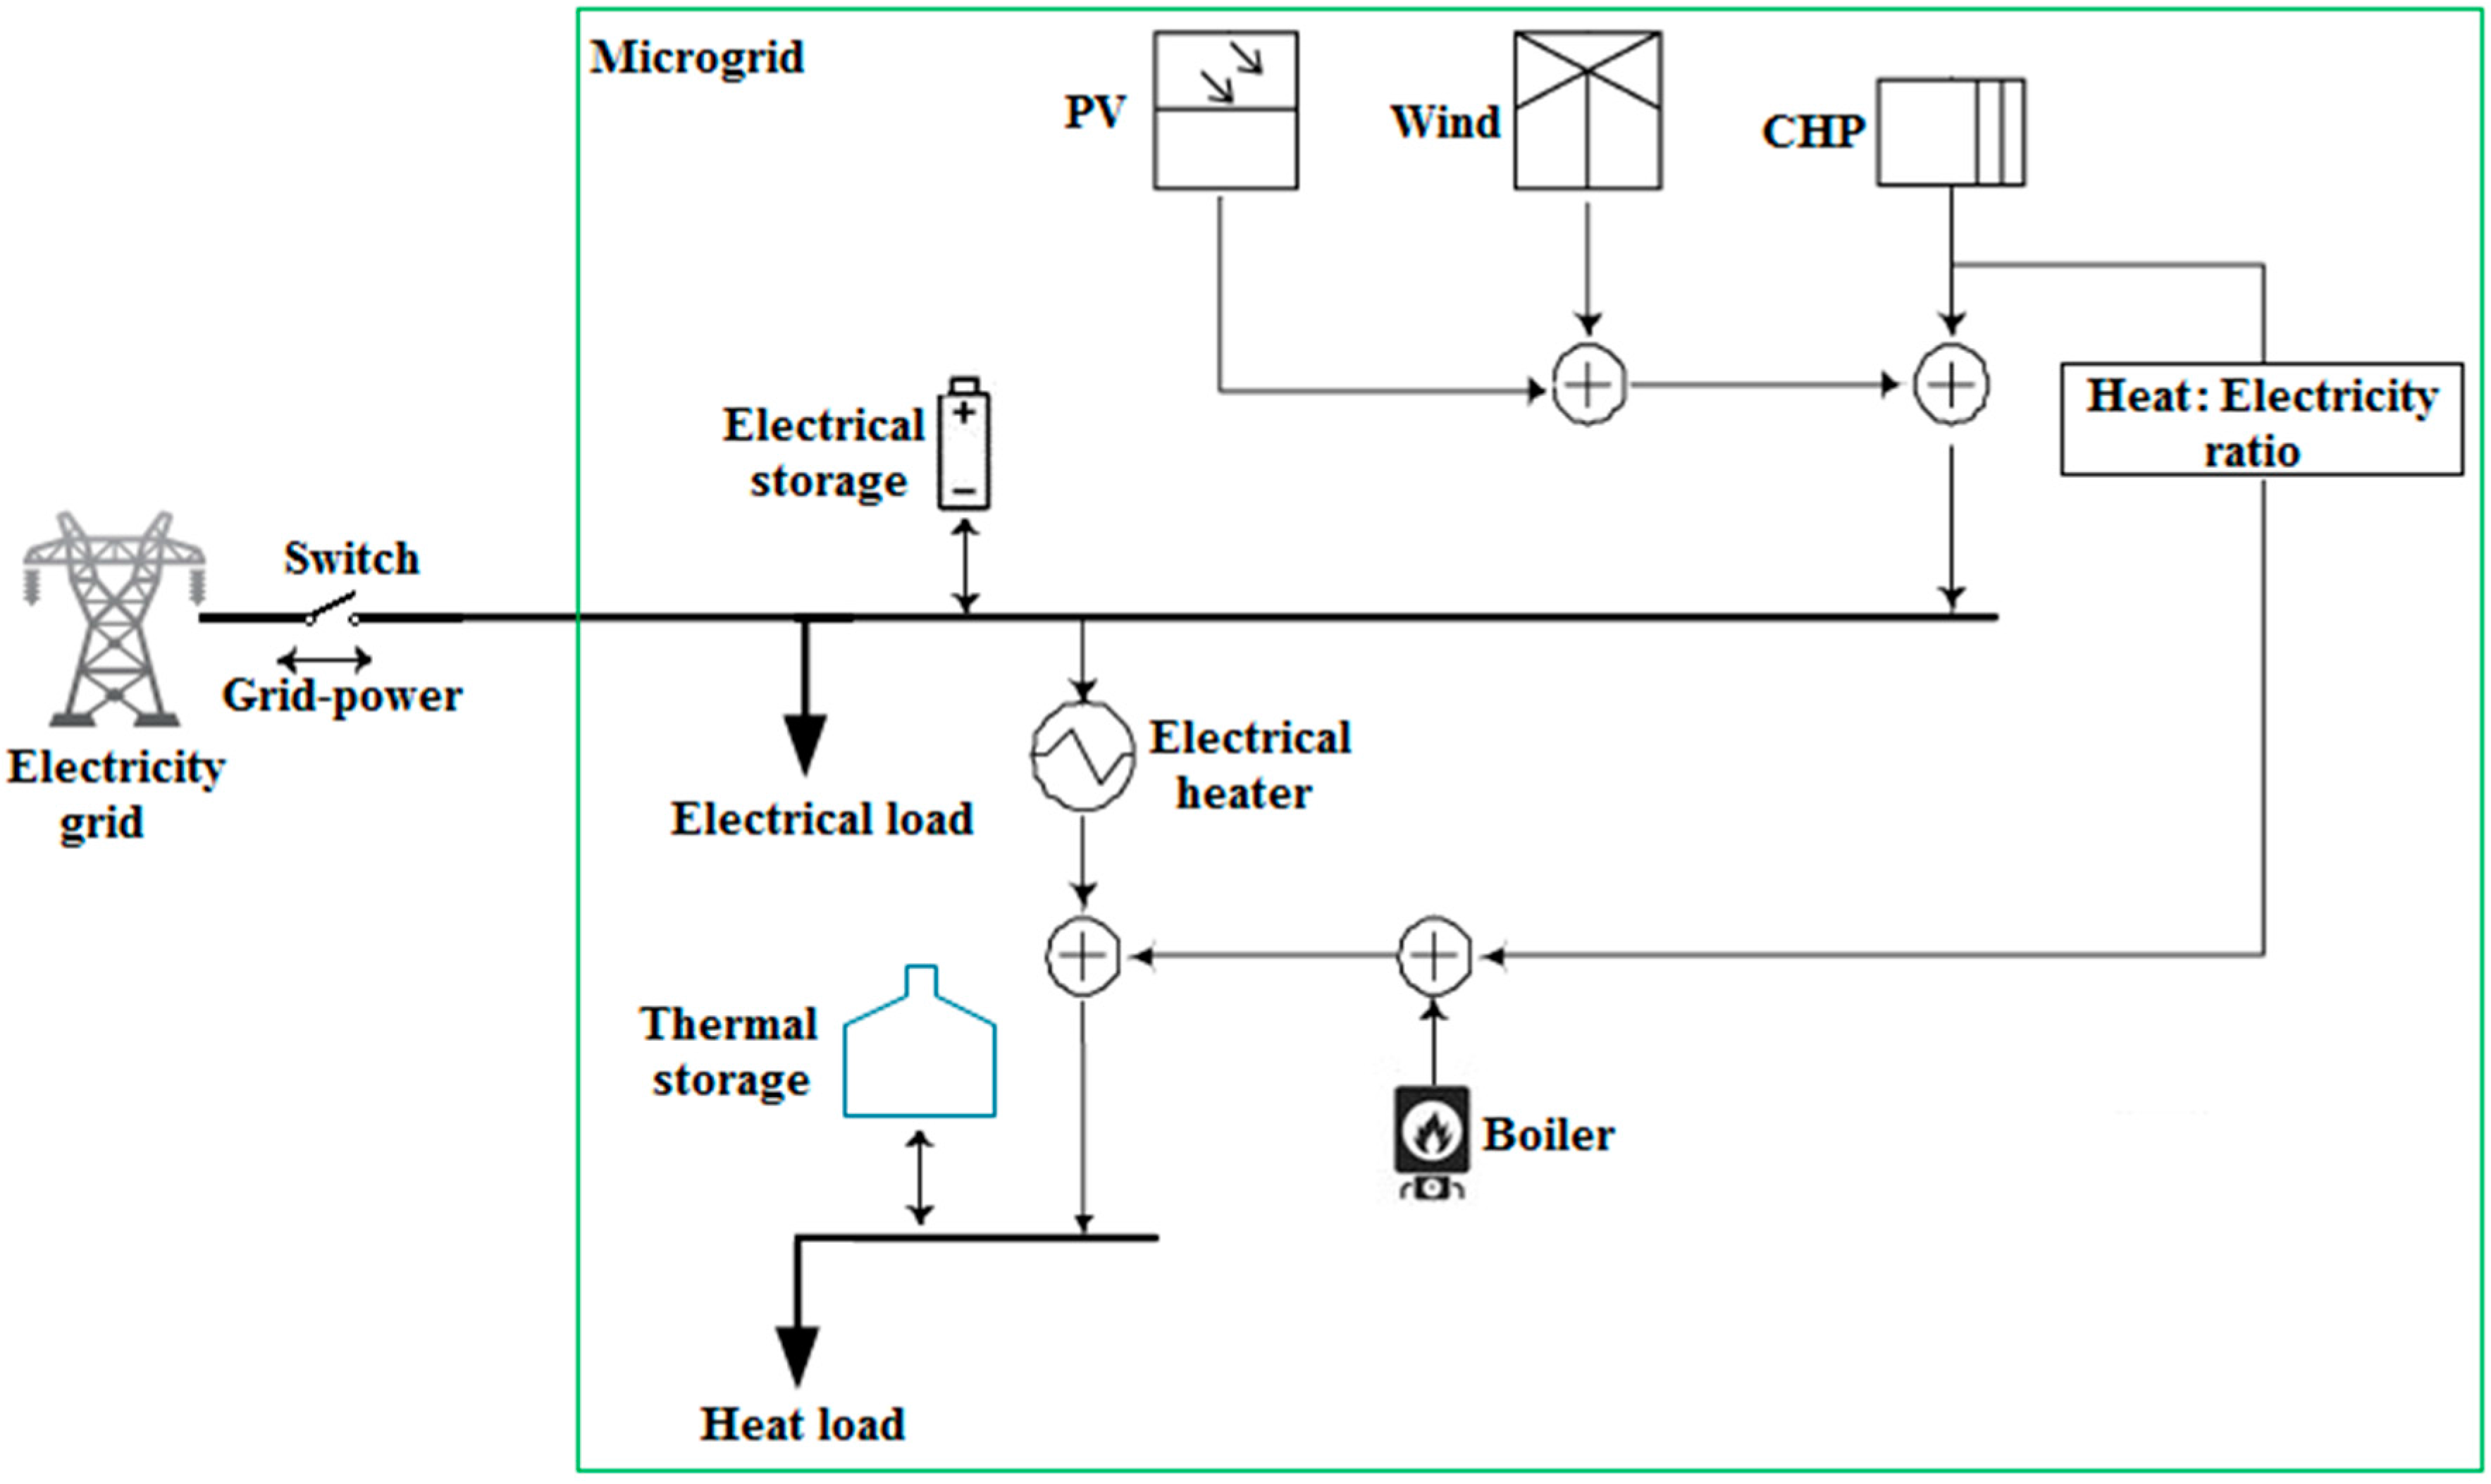
DG mix (natural gas turbines, natural gas fuel cells, and hydrogen gas fuel cells), renewable energy sources (wind and PV), natural gas boiler, electrical heater, and thermal/electrical storage.
The proposed work may act as a useful modeling and design tool to assess the opportunity of deploying alternative energy technologies. It provides information about which generation technologies are fuel-efficient and able to facilitate resilient micro energy grids with reliable and economic operation.
The remainder of this paper is organized as follows: Section 2 presents the problem description. Section 3 presents the models used for the system components. The problem formulation is explained in Section 4. Section 5 and Section 6 detail the test results, and Section 7 presents the conclusion.

2. Problem Description

Currently, utilities are accommodating higher penetration levels of renewable and DG units in distribution networks due to several technical and economic benefits. This increased integration of renewable and DG technologies allows for creating micro energy grids with sufficient generation capacities to feed their local loads [20]. Micro energy grids can operate in grid-connected and islanded modes. In the future, micro energy grids will play a key role as vital components for managing the power system resilience in extreme conditions. For instance, IEEE standard 1547.4 enumerates numerous benefits for islanded micro energy grid operation, such as [20]: (1) improving customers’ reliability; (2) relieving overload problems in power systems; (3) resolving some power quality issues; and (4) allowing for maintenance of the power system components without interrupting customers.
As a feasible option, the time span of islanded micro energy grids operation is expected to be long. Therefore, there is a need to consider the optimal planning of islanded micro energy grids to guarantee a seamless integration of the micro energy grid concept in electric distribution networks. As shown in Figure 1, during islanded mode, which is brought about by the isolator switch, the total energy produced depends on the local load level. Hence, sufficient capacity should always be available in a case that micro energy grid is required to switch to the islanded mode. Uncertainty of renewable resources output power and load variability can cause insufficiency of supply in micro energy grids. Energy storage systems can be applied to alleviate these impacts and increase system tolerance against deficiency of energy supply.
This paper presents an optimization procedure that enables the optimal planning of DG mix and storage systems in an islanded micro energy grid. As shown in Figure 1, micro energy grids are assumed to be supplied by CHPs and renewable energy sources. The optimization goal is to minimize the overall micro energy grid cost and the CO2 pollutants emission. The available power by the renewable generators (photovoltaic and wind) can be either directly injected into the micro energy grid or stored to be subsequently delivered.

3. Modeling of DG Units

A micro energy grid can include wind turbines (WT), photovoltaics (PV), thermal storage systems (TS), electrical storage systems (ES), boilers, and CHPs with different technologies (i.e., natural gas fuel cells (NGFCs), hydrogen gas fuel cells (H2FCs), and natural gas turbines (NGTs)). CHPs generate heat and power simultaneously. All of the energy sources coordinate to satisfy the power and heat demand in the micro energy grid.

3.1. Combined Heat and Power (CHP) Generators

CHPs produce electricity and useful heat from a common fuel source and represent a highly efficient method for generating electricity. CHPs can use many types of fuels such as natural gas, hydrogen, and landfill gas. The fuel is used to run an engine or a steam turbine, which in turn drives an alternator to produce electricity. This process also generates heat. CHPs are appealing to industrial and institutional hosts as CHPs reduce energy bills and carbon emissions and allow those industrial and institutional hosts to generate their power independently. CHPs have great flexibility as they are available in different scales. As they fed by natural gas, NGTs have the environmental advantage of low emissions compared to other oil-based generators. Similarly, FCs are environmentally friendly and produce high energy efficiencies under varying load rates. The costs and the pollutant gas emission of CHPs depend on their capacities and types. A generalized DG model can be represented by the following equations:
f f u e , i ( t ) = P i ( t ) u i   η i , P t T ,   0 P i ( t ) P r , i ,   i G
H i ( t ) = P i ( t )   η i , H   η i , P   t T ,   i G
E i ( t ) = K i   u i   f f u e , i ( t )   t T ,   i G
P l o s s , i ( t ) = P i ( t ) η i , P ( 1 η i , P η i , H )   t T ,   i G
where, G is the set of DGs; ffue,i is the consumed fuel by DG i at hour t; Pi is output power from DG i at hour t; T is set of hourly periods (i.e., 8760 for the entire year); ui is the energy density of the fuel consumed by DG i in kWh/kg; ηi,P power efficiency of DG i; Pr,i rated power for DG i; Hi is the generated heat power from DG i at hour t; ηi,H heat efficiency of DG i; Ei is the CO2 emissions from DG i at hour t; Ki is the carbon footprint for the energy produced by DG i in kg CO2/kWhr; Ploss,i is power losses for DG i at hour t.

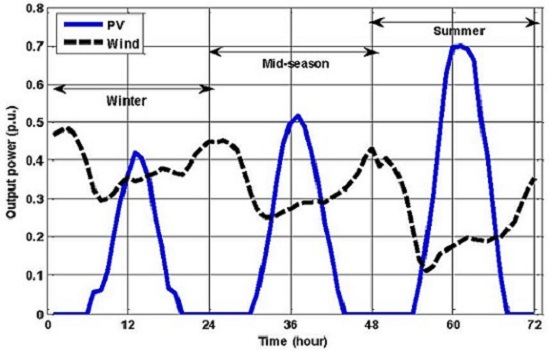
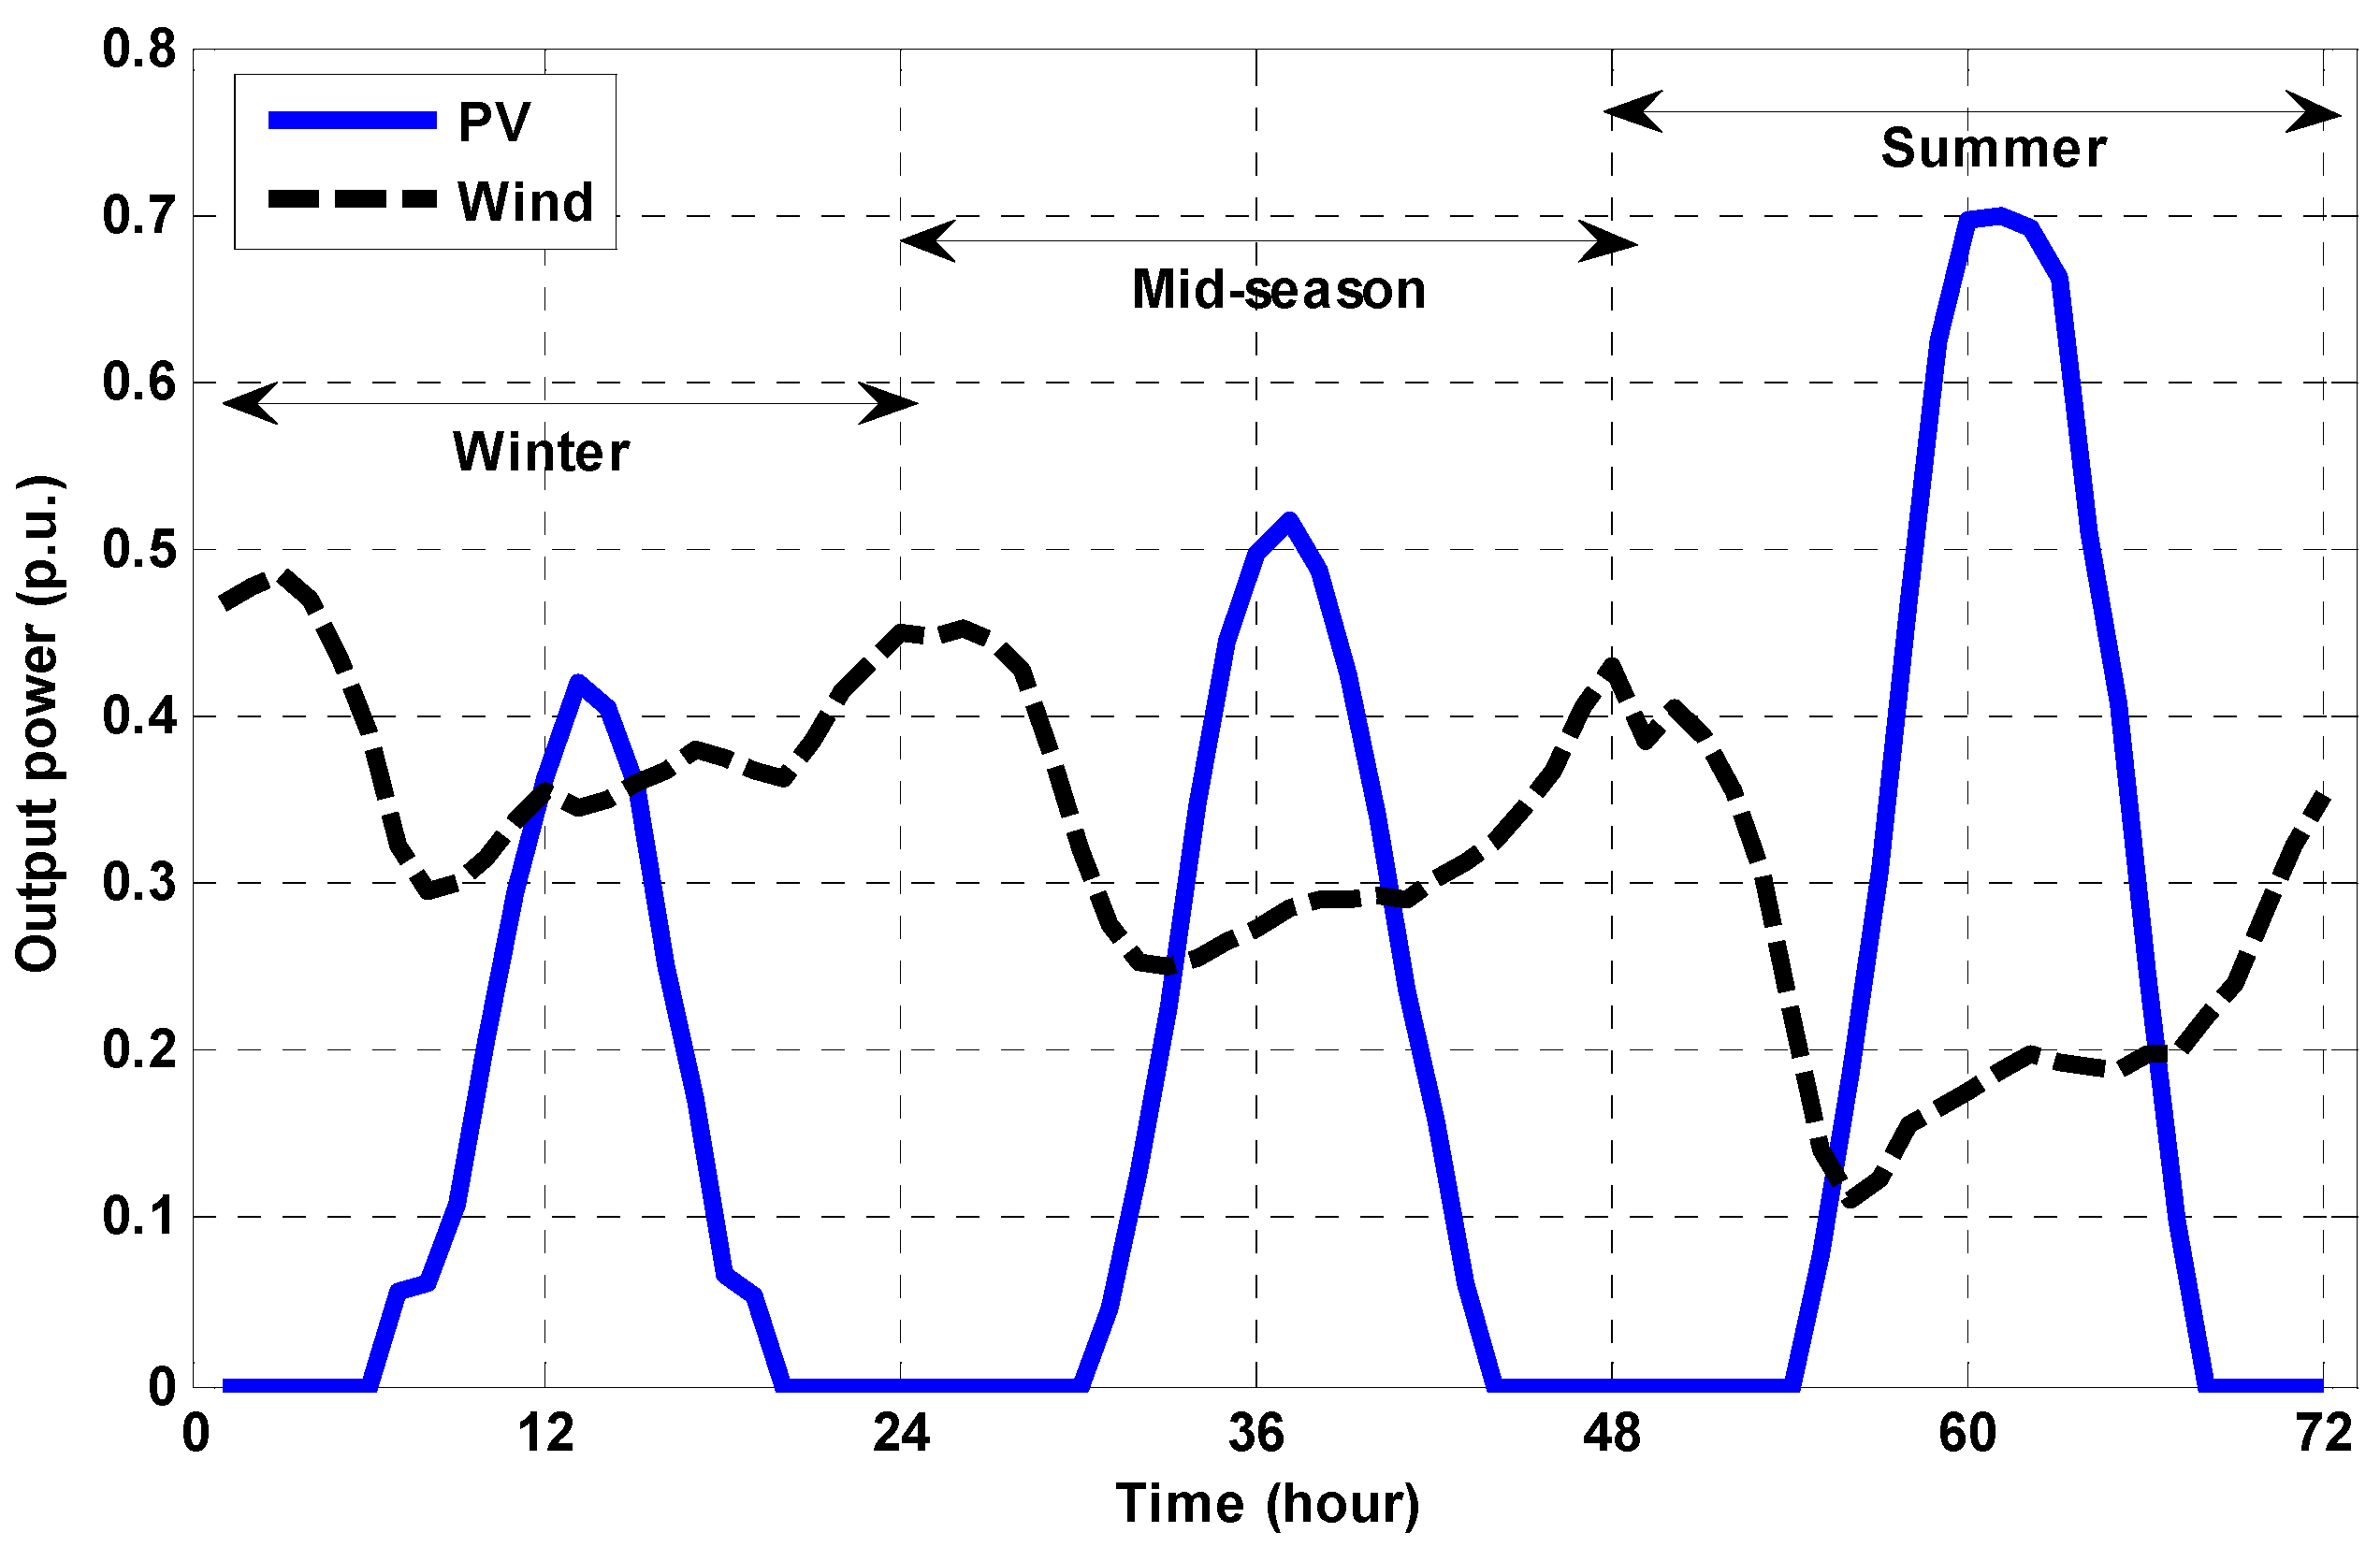
3.2. Renewable Energy Sources

Renewable energy refers to energy that is collected from natural resources which naturally replenished or renewed within a human lifespan. Examples are moving water, wind, and sunshine as they are not at risk of depletion from their use for energy production. A wide range of energy-producing technologies have been developed over time to take advantage of these natural resources. Renewable energy can be produced in the form of electricity, heat, and thermal energy for space/water conditioning, and transportation fuels. Wind and solar photovoltaic power are experiencing the highest growth rates. Renewable energy sources have intermittent output powers as they depend on climatic conditions (i.e., PV output power depends on the solar irradiance and a wind generator output power depends on the wind speed). The output power of PV and wind generators can be modeled by two main methods: (1) the deterministic model as it depends on giving the forecast output power over a certain period; and (2) the probabilistic model which represents the random nature of the PV and wind power sources by using chance-constrained programming or an expectancy model.
In this paper, PV and wind powers are predicted using a probabilistic-based model as follows [21,22]:
Based on seasons, the entire year is divided into three seasons (winter, mid-season, and summer), and each season is being represented by one day, which is subdivided into 24-h segments.
The mean and standard deviation for each time segment are calculated utilizing the historical wind speed and solar irradiance data (i.e., three years of historical wind speed and solar irradiance data have been used).
Appropriate probability density functions (PDF) can be used to represent the behavior of the wind speed and solar irradiance during each hour of the day. Based on actual historical wind speed and solar irradiance data, Weibull and Beta probability density functions were used to model wind speed and solar irradiance respectively because they provide the best fit.
The Weibull and Beta probability density functions (PDFs) are generated for each hour using the mean and standard deviation for each segment.
In order to integrate the output power of wind- and PV-based generators in the formulation, the continuous PDF of each is divided into a proper number of states. Then the probability of each wind speed and solar irradiance state are calculated.
The corresponding output power of the wind turbine and PV module for each state are calculated using the wind turbine power performance curve and PV module characteristics.
For each time interval, the probability of each state can be multiplied by its output power and all of the resulting products can be totaled, thus enabling a determination of the expected value of the output power during that hour.
P o u t h = s = 1 n s p r o p s × P o u t s
where Pouth: expected output power at hour h; props: probability of state s for hour h; ns: total number of states for hour h; and Pouts: output power at state s. Figure 2 shows the wind and PV power forecast for the three sample days per year based on the probabilistic model. For wind and PV generators, there are no fuel costs, and their operating and maintaining costs are considered in the model.

3.3. Energy Storage Systems

Renewable energy fluctuation and load variation cause dynamic changing in the balance between generation and load demand. Energy storage systems (ESSs) can smooth out the intermittent renewable power generation, flatten the load (by charging when load is low and discharging during peak load times), and exploit time-varying electricity prices for arbitrage. Thus, any local shortage in supplying the load could be met by discharging the ESSs. The size of ESSs can be selected depending on the load level and the renewable energy penetration. Furthermore, when a micro energy grid is isolated, EESs can provide voltage and frequency references for the micro energy grid alone or together with other sources [7]. For instance, during night time in solar generation systems and periods without wind power in wind generation systems, EESs can supply energy to consumers. Therefore, the rational use of ESSs is a vital factor to provide safe, reliable, and economical operation of micro energy grid systems.
ESSs work based on different principles and in different forms. For instance, battery storage and electrochemical capacitors provide the chemical energy storage; while pumped hydroelectric storage, flywheel storage, compressed air energy storage (CAES), and superconducting magnetic energy storage (SMES) provide the physical energy storage [23]. Batteries are the oldest and most mature electrical energy storage technology. From another side, thermal storage is a technology that stores excess thermal energy for later use for heating/cooling applications. Their corresponding parameters are always set on the basis of the manufacturer’s specifications. As shown in Equations (6) and (7), the energy stored cannot exceed the installed capacity of the energy storage unit at any time. Charge and discharge rates for an energy storage unit are the rates at which energy is added to or reduced from the energy storage unit. These rates depend on the characteristics of the energy storage equipment and they are limited by constraints (Equations (8)–(11)). As shown in Equations (12) and (13), the energy stored in an energy storage unit depends on the energy stored from the previous time period, the energy charged/discharged and the turn-around efficiency. In order to guarantee that no energy is accumulated from day to day, at the end of a day the energy storage state returns to its initial value at the beginning of that sample day (Equations (14) and (15)).
H S T S ( t ) H T S , r     t T
P S E S ( t ) P E S , r     t T
H T S , i n ( t ) C T S     t T
P E S , i n ( t ) C E S     t T
H T S , o u t ( t ) D T S     t T
P E S , o u t ( t ) D E S     t T
H S T S ( t ) = H S T S ( t 1 ) + H T S , i n   η T S H T S , o u t η T S   t T
P S E S ( t ) = P S E S ( t 1 ) + P E S , i n   η E S P E S , o u t η E S   t T
H S T S ( 24 ) = H S T S ( 0 )
P S E S ( 24 ) = P S E S ( 0 )
where, HSTS/PSES and HSTS,r/PSES,r are the heat/power stored and the rated installed capacity of the thermal/electrical storage respectively; HTS,in/HTS,out are the heat sent/received to/from the thermal storage; PES,in/PES,out are the power sent/received to/from the electrical storage; CTS/DTS are the maximum charging/discharging rates for the thermal storage; CES/DES are the maximum charging/discharging rates for the electrical storage; and ηTS/ηES is the turn-around efficiency of the thermal/electrical storage, respectively.

4. Problem Formulation

The optimization objective is to define the best DG mix and energy storage units for self-sufficient islanded micro energy grids. The objectives considered are to minimize the total net present cost and the carbon dioxide emission. The multi-objective planning problem can be defined as follows:

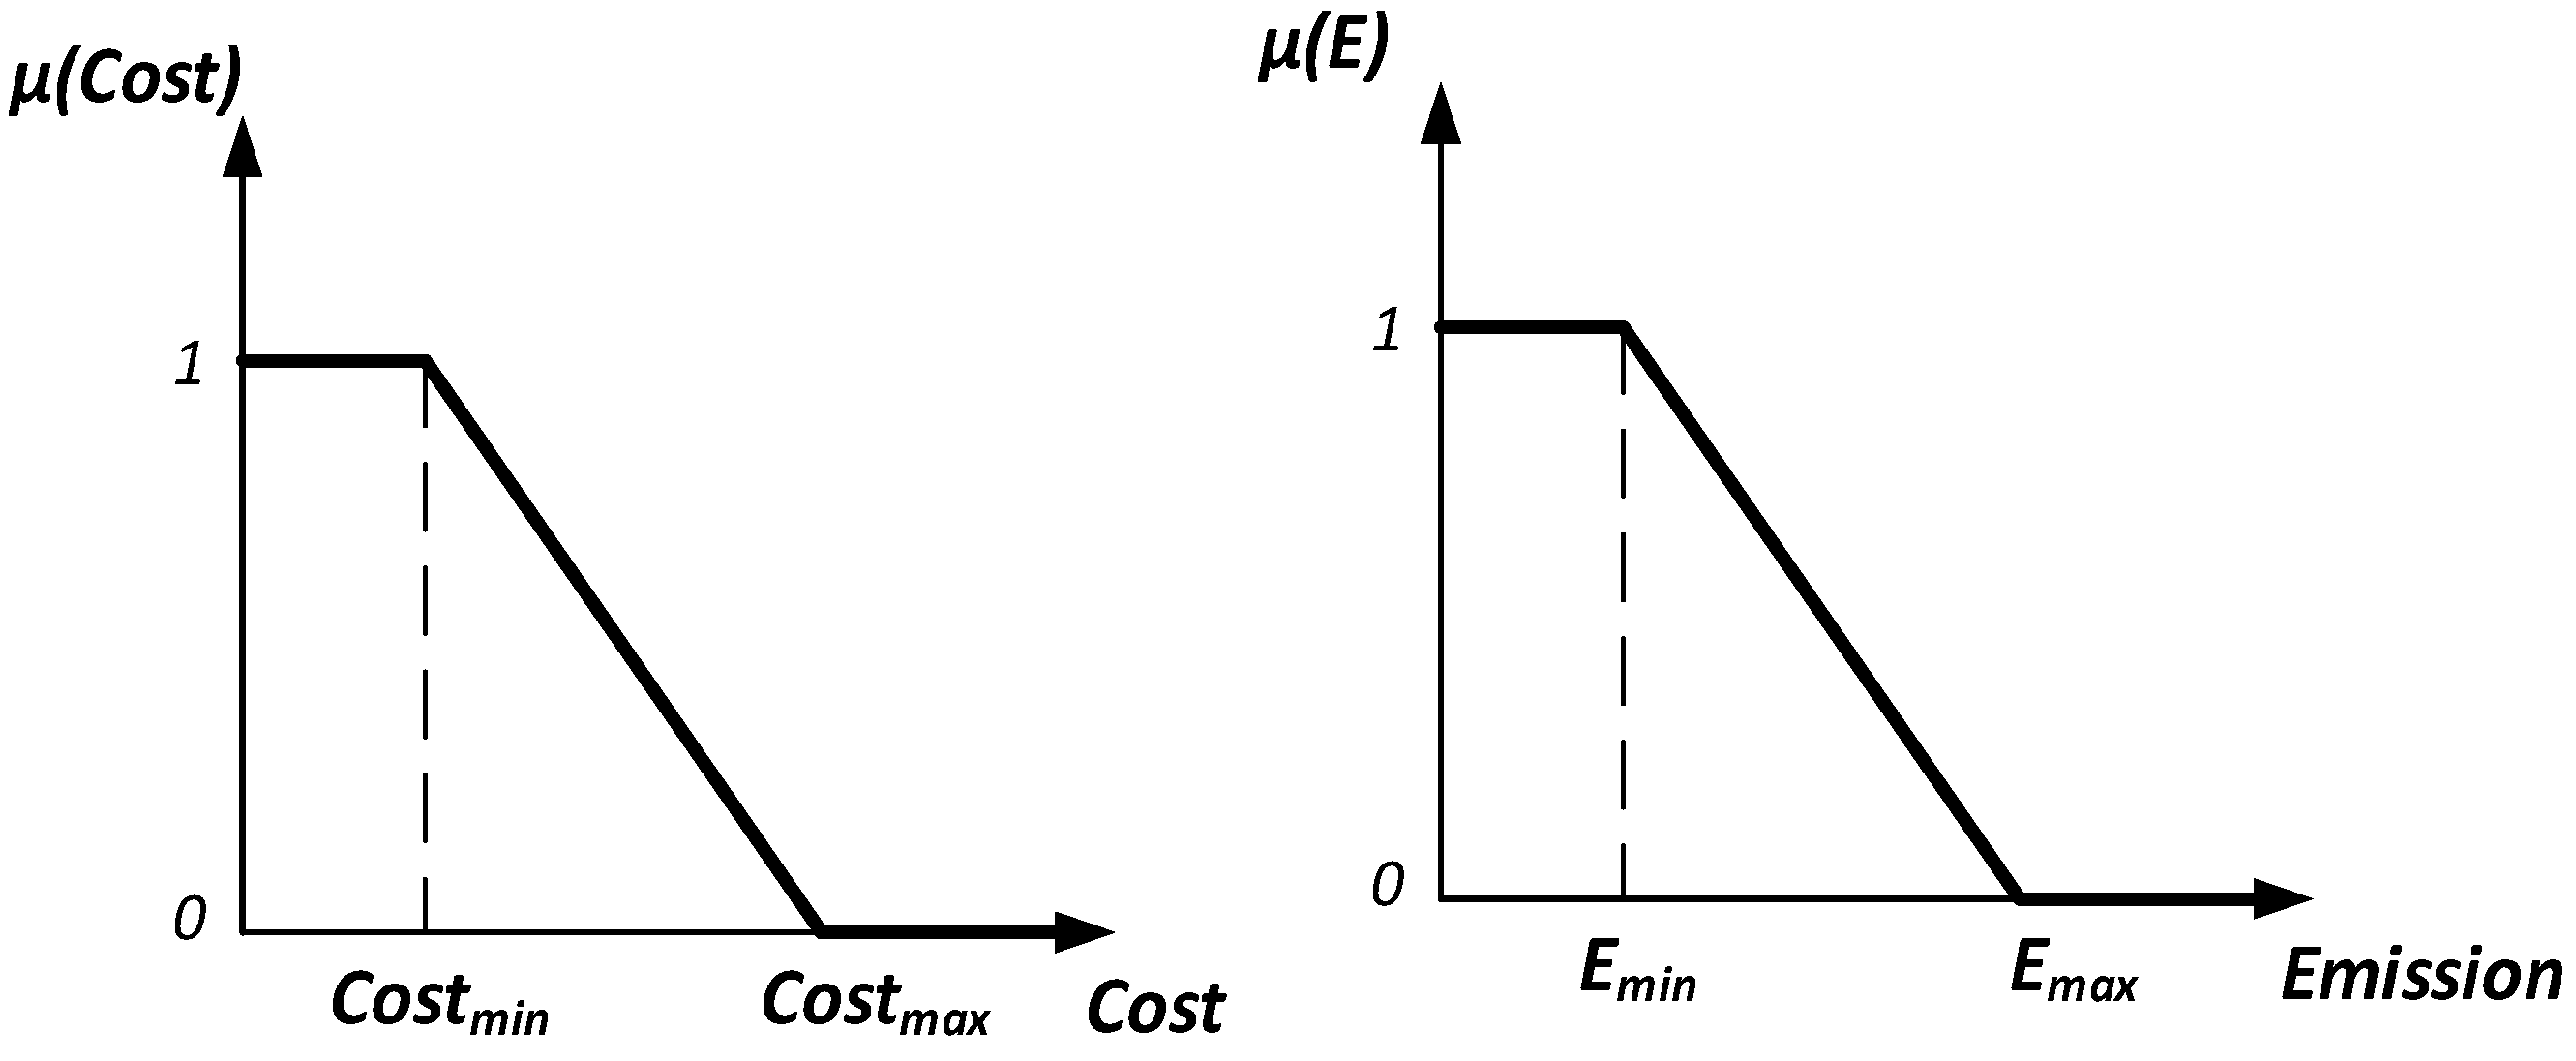
4.1. Objective (Fitness) Function

Cost objectives represent quantitative measures of economic criteria. Cost minimization is a strategic objective in energy planning problems as it includes the cost to install, operate, and maintain a generation technology. Capital cost includes all types of investment costs, such as purchasing equipment, installations, connections to the grid, and engineering services. Operation and maintenance costs include wages, energy systems operation services, maintenances, and the fuel cost to operate the energy supply technology. From another side, a safe environment is essential for society and people’s lives. Environmental impacts are any changes that an energy system may cause in the environment, such as in the quality of soil, water, air, biodiversity, and human health. Reducing the environmental impacts of energy generation (i.e., air pollutants) is a vital goal that has received increasing attention in recent years. Therefore, in this paper, the cost objective (OF1) and CO2 emissions objective (OF2) have been minimized simultaneously.
M i n i m i z e   ( O F 1   , O F 2 )
O F 1 = f c a p + t T ( C o p e ( t ) + C p u r ( t ) )
O F 2 = t T ( E D G ( t ) + E b o ( t ) )
f c a p = i G C c a p , i   P r , i    C R F i ( r , n i )   + C c a p , T S   H T S , r   C R F T S ( r , n T S ) + C c a p , E S   P E S , r   C R F E S ( r , n E S )
C R F i ( r , n i )   = r   ( 1 + r ) n i r   ( 1 + r ) n i 1   i G
C o p e ( t ) = i G ( C g a s , i f f u e , i ( t ) + C m , i P i ( t ) + C s u , i S U i ( t ) ) + C m , T S H T S , i n ( t ) + C m , E S P E S , i n ( t )   t T
C p u r ( t ) = H b o ( t )   [ C g a s , N G u N G   η b o + C m , b o ]   t T
E D G ( t ) = i G E i ( t )   t T
E b o ( t ) = K b o   H b o ( t )   t T
where, G is the set of DGs {NGT,H2FC,NGFC,WT,PV}; OF1(cost) and OF2(emission) are the objectives required to be minimized; fcap is the capital cost of DGs; Cope(t) is the operational cost at hour t; Cpur(t) is the energy purchase cost at hour t; EDG(t) is the total CO2 emissions from all DGs in the micro energy grid at hour t; Ebo(t) is the CO2 emissions from the boiler at hour t; Ccap,i is capital cost of installing DG i in $/kW; CRFi is the capital recovery factor of DG i; r is the interest rate; ni is the lifetime of DG i in years; CRFTS/CRFES is the capital recovery factor of thermal/electrical storage; nTS/nES is the lifetime of thermal/electrical storage in years; Cgas,i gas price required for DG number i in $/kg; Cm,i maintenance cost of DG number i; ffue,i(t,s) is the consumed fuel by DG i at hour t and state s; Pi(t) is output power from DG i at hour t; Cm,TS/Cm,ES maintenance cost of thermal/electrical storage; Csu,i start-up cost of DG number i; SUi(t,s) start-up status of DG number i at hour t and state s; Hbo(t) is heat supplied by the boiler at hour t; ηbo efficiency of boiler; Cm,bo maintenance cost of boiler; Kbo is the emission from the boiler in kg CO2/kWhr.

4.2. Constraints (Power and Heat Generation/Demand Balance Constraints)

i G   P i , ( t )   + P E S , o u t ( t ) P E S , i n ( t ) = P l d ( t ) + H e l e c   h e a t e r ( t )   η e l e c t .   h e a t e r + P l o s s e s ( t )   t T
P i , min P i ( t ) P i , max   i G ,   t T
i G   H i   ( t ) + H b o ( t )   + H e l e c   h e a t e r ( t ) + H T S , o u t ( t ) H T S , i n ( t ) H l d   ( t )   t T
where, Pld(t) and Hld(t) power and heat demand at hour t; Pi,min and Pi,max are lower and upper power generation of DG i, respectively; Helec heater(t) is heat supplied by the electrical heater at hour t; and ηelec heater efficiency of electrical heater.

4.3. Implementation of the Genetic Algorithm (GA)

In this work, genetic algorithm (GA) is utilized to solve the proposed problem. The detailed philosophy and technique of GA is described in Reference [19]. As shown in Equation (28), the chromosome length equals the total number of decision variables (optimal rating for each DG unit and thermal/electrical storage, and supplied heat from boiler and electrical heater).
X = [ P 1   P 2 P i P G   H b o   H e l e c   h e a t e r   H T S , r P E S , r ]     i G

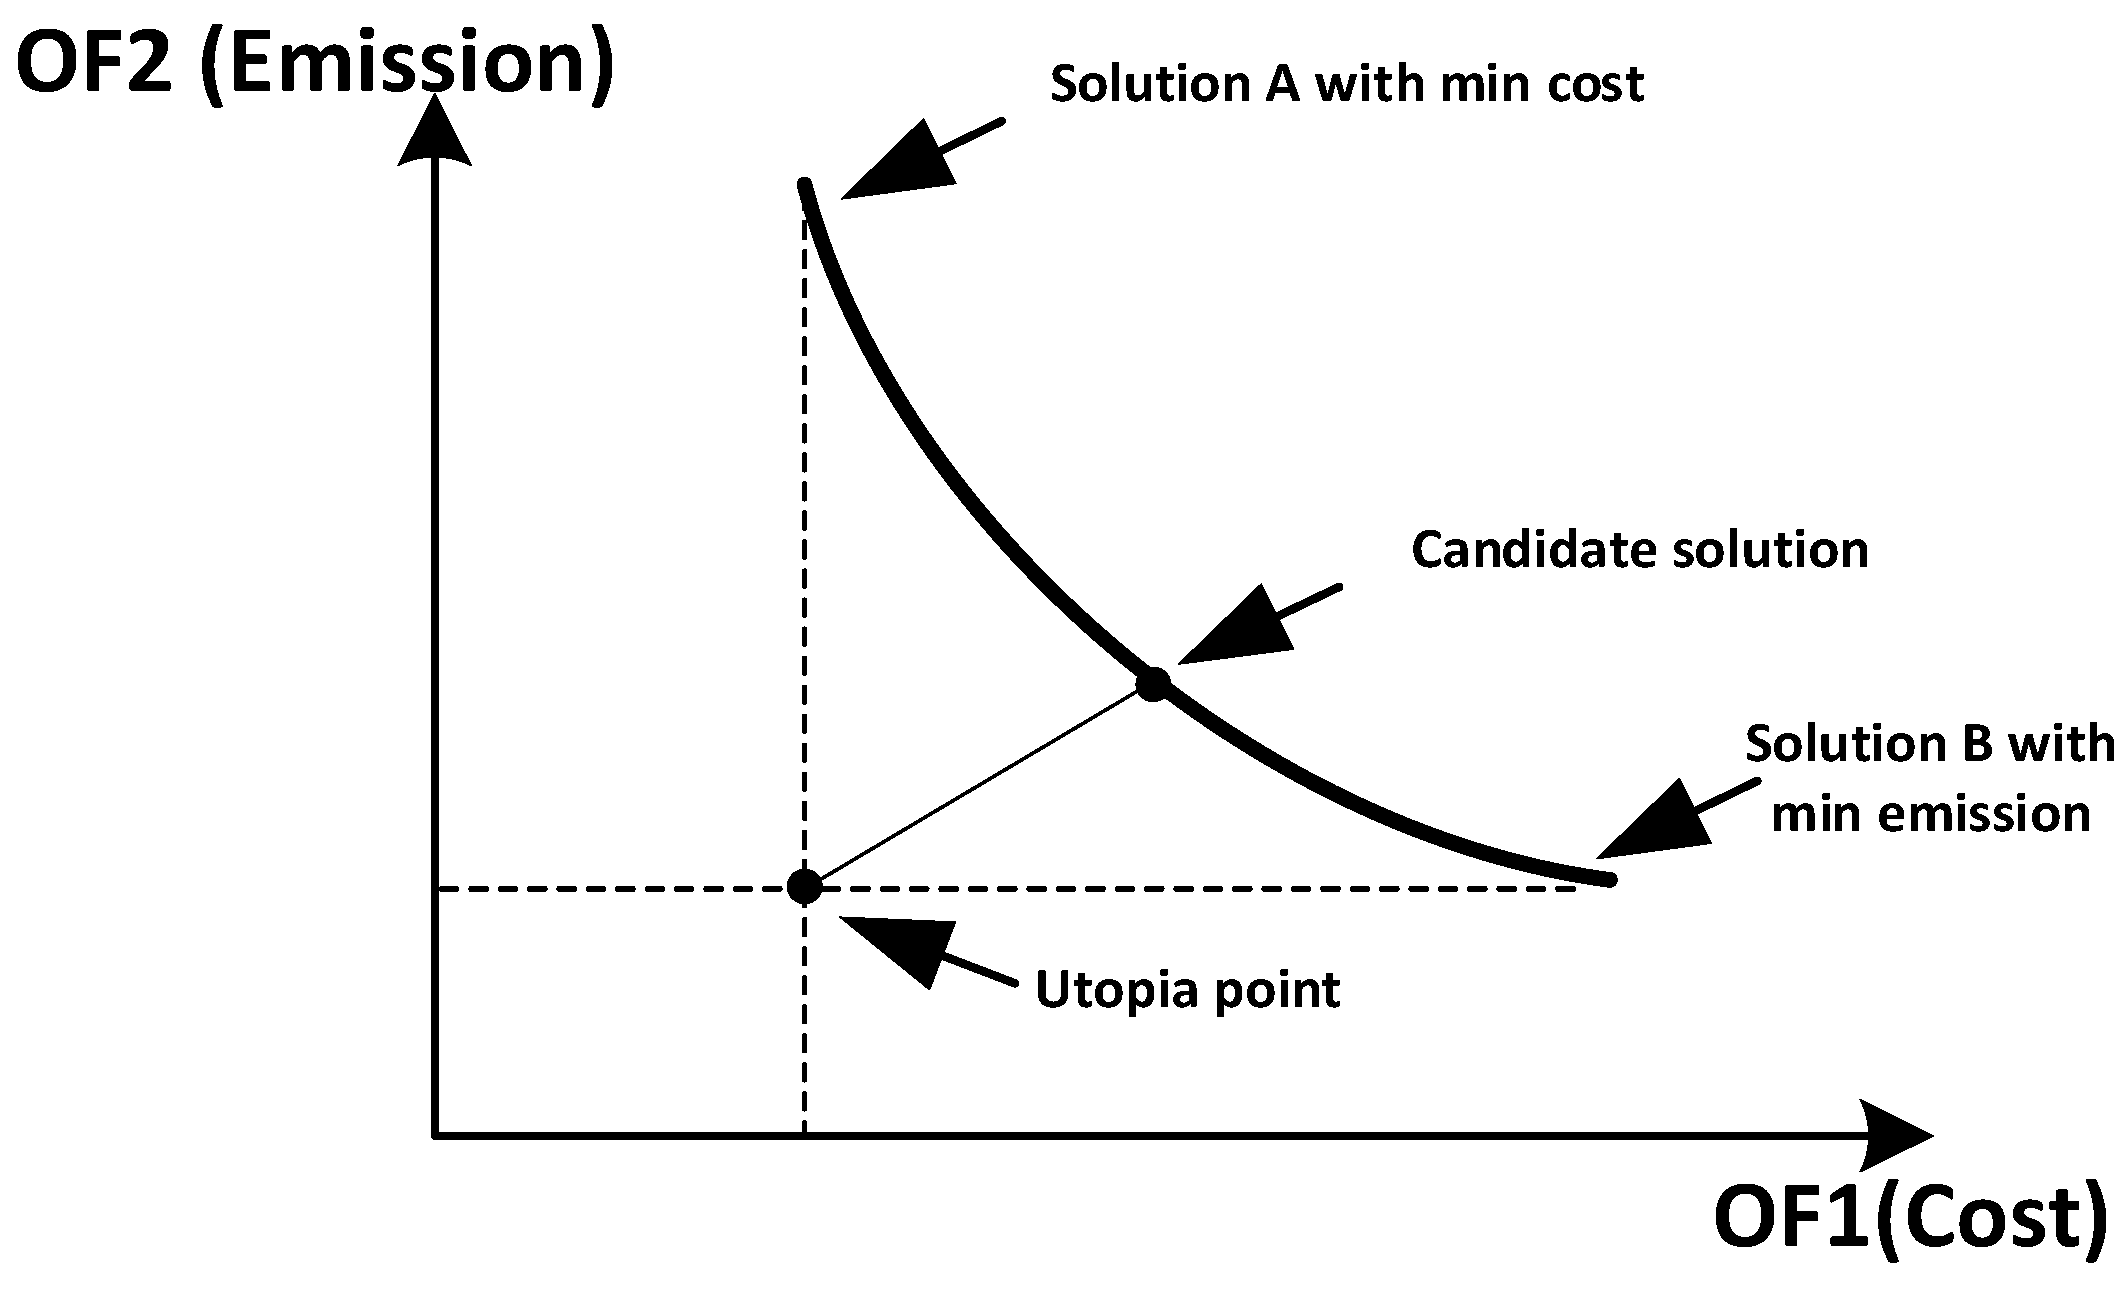
4.4. Solution of the Bi-Objective Planning Problem

In this case both of the contradicted cost and emission objectives are considered to obtain one compromised solution. A weighted sum method can be applied to convert the bi-objective aspect of a problem to a single objective with a single evaluated value by using weighting factors. However, weighting factors are highly dependent on the system. For instance, weighting factors depend on the importance of different objectives and on the scaling of objectives due to their differing values. In this work and as shown in Figure 3, the compromised solution has been determined through minimizing the distance between the candidate compromised solutions and an ideal solution called the utopia point [24]. The utopia point may be infeasible as it minimizes the two objectives simultaneously. Decision makers prefer to use the utopia point (reference point) to get a single compromised solution due to: (1) it gives a clear interpretation of minimizing the distance from the utopia point; and (2) it gives a general formulation and allows multiple parameters to be set to reflect preferences [25,26]. The optimal solutions of the individual objectives (i.e., OF1 (cost) and OF2 (emission)) are used to set the lower and upper bounds of the objectives. For instance, the optimal solution of OF1 sets the lower bound for the cost (Costmin) and the upper bound for the emission (Emax). On the other side, the optimal solution of OF2 sets the upper bound for the cost (Costmax) and the lower bound for the emission (Emin). Then, these bounds can be used to characterize membership functions of the two objectives. As shown in Figure 4, each membership function has a value ranging from 0 to 1 (i.e., 1 represents full desirability and 0 represents full undesirability). The membership functions of the OF1 (cost) and OF2 (emission) can be given as:
μ ( C o s t ) = { 1   C o s t C o s t min C o s t max     C o s t C o s t max     C o s t min   C o s t min < C o s t < C o s t max 0   C o s t C o s t max
μ ( E ) =   { 1   E E min E max     E E max     E min   E min < E < E max 0   E E max
Finally, the compromised solution for the planning problem can be determined by minimizing the distance of the candidate solutions to the ideal utopia point (Costmin, Emin). The Euclidean distance of the candidate solution (Cost, Emission) to the utopia point can be given as:
S = ( 1 μ ( C o s t ) ) 2 + ( 1 μ ( E ) ) 2

5. Case Study

The proposed optimal sizing and operation strategy method is applied to a general micro energy grid which involves different types of buildings. Micro energy grids can be applied for single consumer, community micro energy grid with multiple consumers, campus, remote off-grid systems, and military micro energy grids. A general micro energy grid can involve different types of buildings such as dwellings, schools and shops. The proposed models have been implemented for a case study including a school, a hotel, a restaurant, an office building, and one hundred residential buildings. The passing of a year can bring a marked change in the weather and the surrounding environment. Thus, based on seasons, the entire year is divided into three periods (120 winter days, 153 mid-season days and 92 summer days in total) and each season is being represented by one sample day, which is subdivided into 24-h segments. In this work, and based on the available data, the hourly average load, wind speed, and solar irradiance are considered and the variations within the hour are neglected. Hence, the cost (OF1) and emission (OF2) functions are multiplied by weighting factors of the sample days (i.e., the weighting factor of winter sample day is 120). Figure 5 shows the electricity and heat demand profiles for the three sample days per year [19].
For the sake of verification and comparison, Table 1 shows four configurations of an islanded micro energy grid that will be implemented in this work. Furthermore, the planning problem has been solved for two modes of operation:
(1)
Mode 1 “Following Electrical Load (FEL)” where DG units put the priority on electricity production to follow the required electrical demand. The deficient heat can be supplied by the thermal storage, boiler and/or electrical heater. The surplus heat can be stored in the thermal storage.
(2)
Mode 2 “Following Thermal Load (FTL)” where DG units put the priority on heat production to follow the required heat demand. The deficient electricity can be supplied by the electrical storage. The surplus electricity can be stored in the form of electricity in the electrical storage, or it can be converted to heat by the electrical heater to be stored in the thermal storage.
For the sake of verification and comparison, within each mode of operation the following three case studies will be implemented:
Case 1:
Planning problem for minimum cost (OF1 only is included).
(1)
Running cost only (i.e., operational cost and heat purchase from boiler)
(2)
Total running and capital costs
Case 2:
Planning problem for minimum emissions (OF2 only is included).
Case 3:
Planning problem for compromised solution with minimum possible cost and emissions (both OF1 and OF2 are included).
The numerical values for the parameters used to calculate various costs and emissions were reported in Reference [19]. Furthermore, the parameters used for the candidate electrical storage are [27] capital cost (Ccap,ES): 530 $/kWh; maintenance cost (Cm,ES): 0.008 $/kWh; turn-around efficiency (ηES): 75%; and lifetime period (nES): 5 years.

6. Results and Discussion

The outcomes of the planning problem for the islanded micro energy grid system are represented in the following two subsections.

6.1. Results for Mode 1: Following Electrical Load (FEL)

The outcomes of the planning problem for an islanded micro energy grid works in a following electrical load mode are shown in Table 2.

6.1.1. Base Case Results

In this case, the micro energy grid is assumed to be working in grid-connected mode as the electrical and heat loads are completely supplied by the main electrical grid and the boiler, respectively. The total annual cost of the micro energy grid is $7.74 × 10⁵. Furthermore the total amount of CO2 emissions is 6.93 × 10⁶ kg. As shown in Table 2, the base case provides the highest CO2 emissions compared to other cases.

6.1.2. Results of Configuration 1 (CHPs)

In this configuration, the micro energy grid is assumed to be working in islanded mode with CHPs. As shown in Table 2, case 1b represents the minimum cost solution, the system costs are reduced by 58.79%; on the other hand, the system emissions are reduced by 88.35%. Case 2 represents the minimum emissions solution with zero emissions, while the system costs are increased by 348.32% (almost three times and half higher than the base case). This increased cost is due to the high cost of H2FC DG unit installed in the micro energy grid. Case 3 provides the compromised solution, the system costs are reduced by 53.10%; on the other hand, the system emissions are reduced by 94.23%.

6.1.3. Results of Configuration 2 (CHPs and Energy Storage)

Thermal and electrical energy storage units are potential candidates to be used in a micro energy grid. In this configuration, the micro energy grid is assumed to be working in islanded mode with CHPs and energy storage. To follow the required electrical load demand, unrequired heat energy may be generated. Therefore, a thermal storage device can be added to store the surplus heat to be used when it is needed. As shown in Table 2, adding thermal storage (configuration 2) provides significant improvement in the micro energy grid performance. In all cases (1, 2, and 3) generated heat, cost, and emissions have been decreased compared to similar cases in configuration 1.

6.1.4. Results of Configuration 3 (CHPs and Renewable Energy)

In this configuration, the micro energy grid is assumed to be working in islanded mode with CHPs and renewable energy sources. As shown in Table 2, configurations 1 and 2 are superior to configuration 3 in reducing the cost objective. This is because of the CHP’s dispatchable nature that can provide higher output energy than the renewable ones. From another side, renewable energy is clean and has environmental friendly nature. Therefore, case 3 in configuration 3 has lower CO2 emissions compared to case 3 in configurations 1 and 2.

6.1.5. Results of Configuration 4 (CHPs, Energy Storage, and Renewable Energy)

In this configuration, the micro energy grid is assumed to be working in islanded mode with CHPs, energy storage, and renewable energy sources. The results in Table 2 (configuration 4) show that in all cases (1, 2, and 3) emissions have been decreased compared to similar cases in configuration 3. Additionally, case 3 in configuration 4 has lower costs compared to case 3 in configurations 3. This is because of adding thermal storage which reduces the generated heat losses and helps for integrating the fluctuating electricity production by renewable energy sources.
The results in Table 2 show that natural gas turbine (NGT) is superior to fuel cell (NGFC and H2FC) in reducing the cost objective due to its cheap capital, operation, and maintenance costs. From another side, H2FC is superior to natural gas turbine (NGT) and natural gas fuel cell (NGFC) in reducing the gas emissions due to its clean and environmental friendly nature. As a result, and as shown in Table 2, case 2 which includes the emission objective has zero emissions and dominates with H2FC penetration. Furthermore, because FEL mode follows the required electrical load demand, electricity storage was never selected by the optimisation model in all cases.

6.2. Results for Mode 2: Following Thermal Load (FTL)

The outcomes of the planning problem for an islanded micro energy grid works in a following thermal load mode are shown in Table 3.
The operational pattern in an islanded micro energy grid works in a following electrical load mode (FEL) is simple. To meet electricity demand the CHP units are dispatched, including any contribution from the renewable energy sources. Furthermore, any supplementary heat required can be provided by the boiler and/or the electrical heater. From another side, the operational pattern in an islanded micro energy grid works in a following thermal load mode (FTL) is more complicated than that of the FEL mode. This is because there is no electricity exchange with the main grid. Thus, the micro energy grid system is much more constrained in following thermal load and at the same time the electricity demand must be met exactly.
As shown in Table 3, in case 1, 2 and 3 the heat generation is always balanced with heat demand. This is because the micro energy grid works based on FTL mode. Therefore, to follow the required heat load demand, unrequired electricity may be generated. However, an electrical storage device can be added to store the surplus electricity to be used when it is needed. The results in Table 3 show that FTL mode provides better results regarding the running cost and emission objectives compared to FEL mode. Furthermore, because FTL mode follows the required heat load demand, thermal storage was never selected by the optimisation model in all cases.

6.3. Islanded-Mode versus Grid-Connected Mode for Micro Energy Grids

Operating autonomously from the main grid may have a profound influence on economics. Thus, it is of interest to consider the mode of operation of the micro energy grid to determine the optimal mix of DG units when the system is islanded and when it is grid-connected. Table 4 shows a comparison between the islanded-mode and the grid-connected mode of the micro energy grid under study in terms of minimum cost, minimum emissions, and compromised solution for configurations 1 and 2.
As shown in Table 4, the islanded mode is more effective than the grid-connected mode for the three selected solutions. For example, the total cost during the islanded mode is lower than the total cost during the grid-connected mode for both of the minimum cost and compromised solutions. Additionally, the total CO2 emissions during the islanded mode is lower than the total CO2 emissions during the grid-connected mode for the three selected solutions. Islanded mode is superior to grid-connected mode with higher efficiency, lower greenhouse gas emissions, and lower costs per unit of final energy consumed. Based on the results presented in this work and in reference [19], the main differences between the grid-connected mode and the islanded mode for a micro energy grid can be summarized as follows:
Exchange of electrical energy with the main grid is possible during the grid-connected mode. A micro energy grid may increase its generation to maximize the revenue from selling surplus electricity to the main grid. Therefore, unrequired heat may be generated. However, there is no electricity exchange with the main grid during the islanded mode. This makes the amount of generated electricity and heat during the islanded mode is low compared to the grid-connected mode.
Due to high values of unrequired heat during grid-connected mode, thermal storage may be required with higher capacities compared to its value during the islanded mode.
The running cost, total cost, and greenhouse gas emissions during the islanded mode are low compared to the grid-connected mode for most case studies.
The generated heat by the natural gas-fired boiler during the islanded mode is lower compared to its generated value during the grid-connected mode.

7. Conclusions

In this paper, a multi-objective optimization approach based on GA for self-sufficient micro energy grid optimal planning is proposed. The two objectives of the problem are to minimize (1) the total cost (capital, O&M costs); and (2) the total CO2 emissions from the boiler and DG units. Solutions have been presented for lower cost, lower gas emissions, and compromised solution. The results reveal the effectiveness of (1) the thermal load following mode compared to electrical load following mode; and (3) the islanded mode compared to grid-connected mode. The results showed that natural gas turbines are superior to fuel cells in reducing the cost objective. Additionally, hydrogen based fuel cells are superior to natural gas turbines and natural gas based fuel cells in reducing the gas emissions. The results showed that adding thermal storage to the micro energy grid has significant enhancement in the system performance. The proposed algorithm can be applied to any type of DG units to define the best DG mix and energy storage units for self-sufficient micro energy grids.

Author Contributions

The literature review and manuscript preparation, as well as the simulations, were carried out by Aboelsood Zidan. Final review of manuscript corrections, was done by Hossam A. Gabbar.

Conflicts of Interest

The authors declare no conflict of interest.

References

  1. Bouffard, F.; Kirschen, D.S. Centralised and distributed electricity systems. Energy Policy 2008, 36, 4504–4508. [Google Scholar] [CrossRef]
  2. Zhang, D.; Evangelisti, S.; Lettieri, P.; Papageorgiou, L.G. Optimal design of CHP-based microgrids: Multiobjective optimisation and life cycle assessment. Energy 2015, 85, 181–193. [Google Scholar] [CrossRef]
  3. Rao, R.S.; Ravindra, K.; Satish, K.; Narasimham, S.V.L. Power loss minimization in distribution system using network reconfiguration in the presence of distributed generation. IEEE Trans. Power Syst. 2013, 28, 317–325. [Google Scholar] [CrossRef]
  4. Wu, X.; Wang, X.; Qu, C. A hierarchical framework for generation scheduling of microgrids. IEEE Trans. Power Deliv. 2014, 29, 2448–2457. [Google Scholar] [CrossRef]
  5. Conti, S.; Nicolosi, R.; Rizzo, S.A.; Zeineldin, H.H. Optimal dispatching of distributed generators and storage systems for MV islanded microgrids. IEEE Trans. Power Deliv. 2012, 27, 1243–1251. [Google Scholar] [CrossRef]
  6. Lund, H.; Andersen, A.N.; Østergaard, P.A.; Mathiesen, B.V.; Connolly, D. From electricity smart grids to smart energy systems—A market operation based approach and understanding. Energy 2012, 42, 96–102. [Google Scholar] [CrossRef]
  7. Xiao, J.; Bai, L.; Li, F.; Liang, H.; Wang, C. Sizing of energy storage and diesel generators in an isolated microgrid using Discrete Fourier Transform (DFT). IEEE Trans. Sustain. Energy 2014, 5, 907–916. [Google Scholar] [CrossRef]
  8. Andersen, A.N.; Lund, H. New CHP partnerships offering balancing of fluctuating renewable electricity productions. J. Clean. Prod. 2007, 15, 288–293. [Google Scholar] [CrossRef]
  9. Bin, W.; Ming, S.; Baole, D. The existed problems and possible solutions of distributed generation microgrid operation. In Proceedings of the 2011 Asia-Pacific Power and Energy Engineering Conference, Wuhan, China, 25–28 March 2011; pp. 1–4.
  10. Khodaei, A. Microgrid optimal scheduling with multi-period islanding constraints. IEEE Trans. Power Syst. 2014, 29, 1383–1392. [Google Scholar] [CrossRef]
  11. Vafaei, M.; Kazerani, M. Optimal unit-sizing of a wind-hydrogen-diesel microgrid system for a remote community. In Proceedings of the IEEE Trondheim Power Tech, Trondheim, Norway, 19–23 June 2011; pp. 1–7.
  12. Chen, S.X.; Gooi, H.B.; Wang, M.Q. Sizing of energy storage for microgrids. IEEE Trans. Smart Grid 2012, 3, 142–151. [Google Scholar] [CrossRef]
  13. Khodaei, A.; Shahidehpour, M. Microgrid-based co-optimization of generation and transmission planning in power systems. IEEE Trans. Power Syst. 2013, 28, 1582–1590. [Google Scholar] [CrossRef]
  14. Buayai, K.; Ongsakul, W.; Mithulananthan, N. Multi-objective micro-grid planning by NSGA-II in primary distribution system. Eur. Trans. Electr. Power 2012, 22, 170–187. [Google Scholar] [CrossRef]
  15. Rigo-Mariani, R.; Sareni, B.; Roboam, X. Integrated optimal design of a smart microgrid with storage. IEEE Trans. Smart Grid 2015, PP, 1–9. [Google Scholar] [CrossRef]
  16. Atia, R.; Yamada, N. Sizing and analysis of renewable energy and battery systems in residential microgrids. IEEE Trans. Smart Grid 2016, 7, 1204–1213. [Google Scholar] [CrossRef]
  17. Zhang, J.; Li, K.J.; Wang, M.; Lee, W.J.; Gao, H.; Zhang, C.; Li, K. A bi-level program for the planning of an islanded microgrid including CAES. IEEE Trans. Ind. Appl. 2016, PP, 1–10. [Google Scholar] [CrossRef]
  18. Sachs, J.; Sawodny, O. Multi-objective three stage design optimization for island microgrids. Appli. Energy 2016, 165, 789–800. [Google Scholar] [CrossRef]
  19. Zidan, A.; Gabbar, H.A.; Eldessouky, A. Optimal planning of combined heat and power systems within microgrids. Energy 2015, 93, 235–244. [Google Scholar] [CrossRef]
  20. Abdelaziz, M.M.A.; Farag, H.E.; El-Saadany, E.F. Optimum reconfiguration of droop-controlled islanded microgrids. IEEE Trans. Power Syst. 2016, 31, 2144–2153. [Google Scholar] [CrossRef]
  21. Atwa, Y.M.; El-Saadany, E.F.; Salama, M.M.A.; Seethapathy, R. Optimal renewable resources mix for distribution system energy loss minimization. IEEE Trans. Power Syst. 2010, 25, 360–370. [Google Scholar] [CrossRef]
  22. Zidan, A.; El-Saadany, E.F. Incorporating load variation and variable wind generation in service restoration plans for distribution systems. Energy 2013, 57, 682–691. [Google Scholar] [CrossRef]
  23. Roberts, B. Capturing grid power. IEEE Power and Energy Mag. 2009, 7, 32–41. [Google Scholar] [CrossRef]
  24. Zidan, A.; El-Saadany, E.F. Incorporating customers’ reliability requirements and interruption characteristics in service restoration plans for distribution systems. Energy 2015, 87, 192–200. [Google Scholar] [CrossRef]
  25. Dzung, N.T. Application of multi-objective optimization by the utopian point method to determining the technological mode of gac oil extraction. Int. J. Chem. Eng. Appl. 2012, 3, 18–24. [Google Scholar] [CrossRef]
  26. Martínez, P.; Eliceche, A.M. Bi-objective minimization of environmental impact and cost in utility plants. Comput. Chem. Eng. 2011, 35, 1478–1487. [Google Scholar] [CrossRef]
  27. Hawkes, A.D.; Leach, M.A. Modelling high level system design and unit commitment for a microgrid. Appl. Energy 2009, 86, 1253–1265. [Google Scholar] [CrossRef]
Figure 1. Energy flow in a micro energy grid system.
Energies 09 00616 g001
Figure 2. Renewable power forecast based on the probabilistic model.
Energies 09 00616 g002
Figure 3. Pareto-front for a bi-objective problem.
Energies 09 00616 g003
Figure 4. Membership functions.
Energies 09 00616 g004
Figure 5. Heat and electricity demand for the case study micro energy grid.
Energies 09 00616 g005
Table 1. Sample configuration of an islanded micro energy grid system.
Configuration NumberCHPConnection with the Main GridEnergy StorageRenewable Energy
NGTH2FCNGFCThermalElectricalWindPV
1
2
3
4
Base
Table 2. Results of the studied cases for FEL (Following Electrical Load) mode of operation.
Config. NumberCaseCost ($)Total CO2 Emission (kg)DGs Generated EnergyGenerated Heat (MWh)Rated Size (kW)
RunningTotalElectricity (MWh)Heat (MWh)BoilerElectrical HeaterTSNGTH2FCNGFCWTPVTSES
DGsES
11a7.63 × 1043.23 × 1054.05 × 1059638.2012,503.602605.303228.8000000
b1.02 × 1053.19 × 1058.07 × 1059260.8012,014.1866.92227.902845.0000000
21.79 × 1063.47 × 10609768.7012,210.902735.8003296.700000
39.86 × 1043.63 × 1054.00 × 1059639.9012,499.802607.003187.042.500000
21a7.44 × 1043.19 × 1053.82 × 1059100.7011,806.302067.8905.83066.900003454.50
b7.45 × 1042.53 × 1053.83 × 1059021.0011,344.101988.1985.12201.200003454.50
21.71 × 1063.40 × 10609283.8011,604.702250.91238.903296.60004074.10
37.44 × 1043.32 × 1053.82×1059102.0011,806.502069.11234.83228.800003454.50
31a7.83 × 1043.56 × 1053.89 × 1059760.2011,998.602727.303193.200179000
b1.58 × 1053.26 × 1051.67 × 1068446.4010,948.42743.91413.502178.3002000
21.68 × 1063.63 × 106010,044.0011,332.203011.1003296.70067000
38.06 × 1044.75 × 1053.69 × 1059896.2011,395.502863.303176.60026225000
41a7.68 × 1043.87 × 1053.73 × 1059304.6011,522.202271.71151.43207.700106823855.30
b8.80 × 1043.37 × 1055.77 × 1058977.7011,471.0426.91944.81196.52988.0004383294.50
21.42 × 1063.81 × 106010,578.109452.603545.2702.103249.3023316771650.80
37.51 × 1043.31 × 1053.92 × 1059096.2011,787.720.82063.31231.83216.600303443.70
Base *7.74 × 1057.74 × 1056.93 × 10600011,474.70000000000
Note: * Purchased electricity from the main grid is 7032.90 MWh.
Table 3. Results of the studied cases for FTL (Following Thermal Load) mode of operation.
Config. NumberCaseCost ($)Total CO2 Emission (kg)DGs Generated EnergyGenerated Heat (MWh)Rated Size (kW)
RunningTotalElectricity (MWh)Heat (MWh)BoilerElectrical HeaterTSNGTH2FCNGFCWTPVTSES
DGsES
41a6.72 × 1044.58 × 1053.18 × 1059300.9372.89828.001646.703369.200243.000659.8
b6.93 × 1044.29 × 1053.11 × 1059557.1401.99620.301854.403254.300267.045.30314.4
21.38 × 1063.44 × 106011,244.51146.99174.602300.1003357.80510.8116.801532.6
36.87 × 1044.65 × 1053.17 × 1059188.4279.19784.401690.303356.400262.500681.2
Table 4. Comparison between results for grid-connected mode and islanded mode for configurations 1 and 2.
Config.ModeMinimum Cost SolutionMinimum Emission SolutionCompromised Solution
Total Cost (105 $)Total CO2 Emissions (105 kg)Total Cost (106 $)Total CO2 Emissions (105 kg)Total Cost (105 $)Total CO2 Emissions (105 kg)
1Gird-connected [19]4.0332.22.449.365.6111.8
Islanded3.198.073.4703.634.00
2Gird-connected [19]3.7526.42.137.924.999.99
Islanded2.533.833.4003.323.82

