Review

A Review of Classification Problems and Algorithms in Renewable Energy Applications

by
María Pérez-Ortiz
1,†,
Silvia Jiménez-Fernández
2,†,
Pedro A. Gutiérrez
3,†,
Enrique Alexandre
2,†,
César Hervás-Martínez
3,† and
Sancho Salcedo-Sanz
2,*
1
Department of Quantitative Methods, Universidad Loyola Andalucía, 14004 Córdoba, Spain
2
Department of Signal Processing and Communications, Universidad de Alcalá, 28805 Alcalá de Henares, Spain
3
Department of Computer Science and Numerical Analysis, Universidad de Córdoba, 14071 Córdoba, Spain
*
Author to whom correspondence should be addressed.
These authors contributed equally to this work.
Energies 2016, 9(8), 607; https://doi.org/10.3390/en9080607
Submission received: 17 May 2016 / Revised: 21 July 2016 / Accepted: 22 July 2016 / Published: 2 August 2016

Abstract

:
Classification problems and their corresponding solving approaches constitute one of the fields of machine learning. The application of classification schemes in Renewable Energy (RE) has gained significant attention in the last few years, contributing to the deployment, management and optimization of RE systems. The main objective of this paper is to review the most important classification algorithms applied to RE problems, including both classical and novel algorithms. The paper also provides a comprehensive literature review and discussion on different classification techniques in specific RE problems, including wind speed/power prediction, fault diagnosis in RE systems, power quality disturbance classification and other applications in alternative RE systems. In this way, the paper describes classification techniques and metrics applied to RE problems, thus being useful both for researchers dealing with this kind of problem and for practitioners of the field.

Graphical Abstract

1. Introduction

In the last decade, global energy demand has increased to non-previously seen levels, mainly due to the increase in population, fierce urbanization in developed countries and aggressive industrial development all around the world [1]. Conventional fossil-based energy sources have limited reservoirs and a deep environmental impact (contributing to global warming), and therefore, they cannot satisfy this global demand for energy in a sustainable way [2]. These issues related to fossil-based sources have led to a very important development of Renewable Energy (RE) sources in the last few years, mainly in renewable technologies, such as wind, solar, hydro or marine energies, among others. The main problem with RE resources is their dependency on environmental conditions in the majority of cases (namely wind speed, solar irradiance or wave height) and the fact that individual renewable sources cannot provide continuous power supply because of their uncertainty and intermittent nature.
A huge amount of research is being conducted to obtain a higher penetration of renewable resources into the electric system. The development of new and modern electric networks, including microgrids with renewable distributed generation, is, without a doubt, one of the main current research tracks in this topic, with a large amount of engineering sub-problems involved (such as microgrid topology design and operation optimization, microgrid control, optimal RE sources and islanding). The optimal design of better and more productive RE devices and facilities (new RE technologies, optimization of existing ones, such as wind turbines or solar panels, the optimal design of wind farms or marine wave energy converters) is another pillar of the ongoing research on RE systems. The third big line of research is related to RE systems, with an important connection to the two previously-mentioned lines. This line is devoted to the improvement of computational algorithms and strategies, to obtain or design better RE systems. This paper is precisely contextualized on this last line of research.
Currently, in the Big Data (BD) era that we are living in, data science algorithms are of great importance to improve the performance of different applications (especially for those areas where data are collected daily and where meaningful knowledge and valuable assistance can be extracted to improve current systems). In this regard, Machine Learning (ML) techniques have been demonstrated to be excellent tools to cope with difficult problems arising from new RE sources [3,4,5]. More specifically, ML addresses the question of how to build computer-based systems that automatically improve through experience. It is one of today’s most rapidly growing technical fields, lying at the intersection of computer science and statistics and at the core of artificial intelligence and data science. A huge amount of RE applications can be found in the literature, such as prediction problems (e.g., solar radiation or significant wave height estimation), optimization algorithms (wind farm or RE devices’ design), new control techniques or fault diagnosis in RE systems, all of them with the common objective of improving RE systems significantly. Figure 1 and Figure 2 show the general publication trend for some of the terms employed in this paper (source: Scopus). Figure 1 shows the difference between two areas related to energy (RE and Nuclear Energy (NE)) and two areas related to data science (ML and BD). Note that the selection of these terms is not intended to be exhaustive, but only to give an idea of the importance of machine learning and renewable energy in current research areas. It can be seen that different areas present a different relation with time, increasing or decreasing their popularity at a different pace. By comparing the trend of RE against NE, it is clear that there has been an increasing interest in the field of RE. Moreover, the graph shows that the general increase in the use of ML techniques (or the study of RE) is not only due to the increase in annual research: the predicted annual growth in scientific publications is around 2 . 5 % per year (estimated by the National Science Board within the Web of Science [6]). In this sense, ML is experiencing a very abrupt growing pace (e.g., the growth from 2014 to 2015 is approximately 15 % ). This figure also shows the attention that different subjects are receiving in the area of data science (such as BD, which is strongly connected to ML). On the other hand, Figure 2 shows the popularity of different methods that belong to the ML research area, some of them described in this paper. Again, it can be seen that some methods experience a large increase in popularity (such as Artificial Neural Networks (ANNs), and Support Vector Machines (SVMs)), while others remain stable (such as FR, a method mostly used at the beginning of ML, and the Self-Organizing Map (SOM), an unsupervised method used for visualization).
Given the amplitude of the topic, a comprehensive review of all ML approaches in RE applications is not possible. Some recent tutorials have been focused on important RE applications (e.g., wind prediction, solar radiation prediction) using ML approaches [7,8]. Sub-families of algorithms, such as evolutionary computation, neural computation or fuzzy logic approaches, have been also the objective of previous reviews [9,10], which are very useful for researchers or practitioners interested in each specific field. Following this latter trend, this paper is focused on an important specific branch of ML: classification problems and classification algorithms and how these problems arise in different RE applications. Classification problems and related approaches have been shown to be extremely important in the area of ML, with applications in very different fields, including RE problems. This paper reviews the main classification techniques applied to RE, including classical algorithms and novel approaches. The paper is completed with a comprehensive literature review and discussion of the most recent works on classification problems and techniques in RE applications.
The remainder of the paper is structured in the following way: Section 2 presents an introduction to classification problems within the ML framework. Section 3 presents the most important techniques and algorithms that have been applied to solve classification problems for RE applications. Section 4 analyzes the state-of-the-art in classification problems and classification approaches in the field of RE. Finally, Section 5 outlines some conclusions and final remarks.

2. Classification Problems: An Important Part of Machine Learning (ML)

Generally, the term data science refers to the extraction of knowledge from data. This involves a wide range of techniques and theories drawn from many research fields within mathematics, statistics and information technology, including statistical learning, data engineering, pattern recognition, uncertainty modeling, probability models, high performance computing, signal processing and ML, among others. Precisely, the growth and development of this last research area has made data science more relevant, increasing the necessity of data scientists and the development of novel methods in the scientific community, given the great breadth and diversity of knowledge and applications of this area.
Classification problems and methods have been considered a key part of ML, with a huge amount of applications published in the last few years. The concept of classification in ML has been traditionally treated in a broad sense (albeit incorrectly), very often including supervised, unsupervised and semi-supervised learning problems. Unsupervised learning is focused on the discovery and analysis of the structure of unlabeled data. This paradigm is especially useful to analyze whether there are differentiable groups or clusters present in the data (e.g., for segmentation). In the case of supervised learning, however, each data input object is preassigned a class label. The main task of supervised algorithms is to learn a model that ideally produces the same labeling for the provided data and generalizes well on unseen data (i.e., prediction). This is the main objective of classification algorithms. Semi-supervised learning is also a vivid research branch in ML nowadays (and more specifically in the area of weak supervised learning). Its main premise is that, as opposed to labeled data (which may be scarce depending on the application), unlabeled data are usually easily available (e.g., consider the case of fault monitoring) and could be of vital importance for computing more robust decision functions in some situations. Although classification is usually understood as supervised learning, semi-supervised and unsupervised scenarios can be considered as a way of obtaining better classifiers. In the semi-supervised setting, both labeled and non-labeled examples are used during the classifier’s construction to complement the information obtained by considering only labeled samples [11]. Unsupervised learning is sometimes applied as a way to obtain labels for training classifiers or to derive some parameters of the classification models [12,13]. Some unsupervised [14,15,16] and semi-supervised problems [17,18] have also arisen in the context of RE, but the analysis made in this paper is mainly contextualized on supervised classification techniques.
The general aim of supervised classification algorithms is to separate the classes of the problem (with a margin as wide as possible) using only training data. If the output variable has two possible values, the problem is referred to as binary classification. On the other hand, if there are more than two classes, the problem is named multiclass or multinomial classification. A classification problem can be formally defined as the task of estimating the label y of a K-dimensional input vector x , where x X R K (note that, for most ML algorithms, input variables have to be real-valued) and y Y = { C 1 , C 2 , , C Q } . This task is accomplished by using a classification rule or function g : X Y able to predict the label of new patterns. In the supervised setting, we are given a training set of N points, represented by D, from which g will be adjusted, D = { ( x i , y i ) , i = 1 , , N } .
Up to this point, the definition of the classification problem is nominal, given that no constraints have been imposed over the label space Y . However, a paradigm that deserves special attention is ordinal classification [19] (also known as ordinal regression), a setting that presents similarities to both classification and regression. The main notion behind this term is that the categories of the problem present a given order among them ( C 1 < C 2 < < C Q ). This learning paradigm is of special interest when the variable to predict is transformed from numeric to ordinal by discretizing the values (i.e., when the problem is transformed from regression to multiclass classification, but with ordered labels). This, although it might seem inaccurate at first thought, is a common procedure (also in RE [20,21]), as it simplifies the variable to predict and forces the classifier to focus on the desired information. In this paradigm, there are two main ideas that have to be taken into consideration: (1) there are different misclassification costs, associated with the ordering of the classes, which have to be included in the evaluation metrics; and (2) this order has to be taken into account also when defining ordinal classifiers to construct more robust models. Because of these, both the performance metrics and the classifiers used differ from the standard ones, but it has been shown that this approach improves the result to a great extent when dealing with ordered classes [19].
The area of classification comprises a wide range of algorithms and techniques that share a common objective, but from different perspectives. In this sense, classification methods can be organized according to very different criteria depending on: the type of learning (supervised, unsupervised and semi-supervised); the type of model (probabilistic, non-probabilistic, generative, discriminative); the type of reasoning (induction, transduction); the type of task (classification, segmentation, regression); the type of learning process (batch, online) and others. The task of ML is then a science, but also an art, where the data scientist studies first the data structure and the objective pursued, to approach the given problem in the best way possible. Usually, the steps involved in the process of data mining (and in this case, classification) are the following: (1) data acquisition (which involves understanding the problem at hand and identifying a priori knowledge to create the dataset); (2) preprocessing (operations such as selection, cleaning, reduction and transformation of data); (3) selection and application of an ML tool (where the knowledge of the user is crucial to select the most appropriate classifier); (4) evaluation, interpretation and presentation of the obtained results; and (5) dissemination and use of new knowledge. The main objective of this paper is to introduce the reader to the classification paradigm in ML, along with a range of applications and practical cases of use in RE, to demonstrate its usefulness for this purpose.

Performance Evaluation

Once the classifier has been trained, different metrics can be used to evaluate its performance in a given test set, which is represented by T, T = { ( x i , y i ) , i = 1 , , N } . Given a classification problem with Q classes and a classifier g to be evaluated over a set of N patterns, one of the most general ways to summarize the behavior of g is to obtain a Q × Q contingency table or confusion matrix ( M = M ( g ) ):
M = M ( g ) = { n q l ; q = 1 Q l = 1 Q n q l = N } ,
where n q l represents the number of patterns that are predicted by classifier g as class l when they really belong to class q. Table 1 shows the complete confusion matrix, where n q is the total number of patterns of class q and n l is the number of patterns predicted in class l.
Let us denote by { y 1 , y 2 , , y N } the set of labels of the dataset, and let { y 1 * , y 2 * , , y N * } be the labels predicted by g, where y i , y i * Y , and i { 1 , , N } . Many measures have been proposed to determine the performance of the classifier g:
  • The accuracy ( A c c ) is the percentage of correctly-classified patterns, and it can be defined using the confusion matrix:
    A c c = 1 N q = 1 Q n q q = 1 N i = 1 N y i * = y i ,
    where A c c values range from zero to one, n q q are the elements of the diagonal of the confusion matrix and · is a Boolean test, which is one if the inner condition is true and zero otherwise.
When we deal with classification problems that differ in their prior class probabilities (i.e., some classes represent uncommon events, also known as imbalanced classification problems), achieving a high accuracy usually means sacrificing the performance for one or several classes and methods based only on the accuracy tend to predict the majority class as the label for all patterns (what is known as a trivial classifier). Some of the metrics that try to avoid the pitfalls of accuracy in this kind of problems are the following:
  • The Receiver Operating Characteristic (ROC) curve [22], which measures the misclassification rate of one class and the accuracy of the other. The standard ROC perspective is limited to classification problems with two classes, with the ROC curve and the area under the ROC curve being used to enhance the quality of binary classifiers [23].
  • The Minimum Sensitivity ( M S ) [24], which corresponds to the lowest percentage of patterns correctly predicted as belonging to each class, with respect to the total number of examples in the corresponding class:
    M S = min S q = n q q n q ; q = 1 , . . . , Q ,
    where S q is the sensitivity of the q-th class and M S values range from zero to one.
If the problem evaluated is an ordinal classification problem, then one should take the order of the classes into account. This may require the use of specific prediction methods and evaluation metrics. Specifically, the most common metric for this setting is the following one:
  • The Mean Absolute Error ( M A E ) is the average absolute deviation of the predicted class from the true class (measuring the distance as the number of categories of the ordinal scale) [25]:
    M A E = 1 N q , l = 1 Q | q l | n q l = 1 N i = 1 N e ( x i ) ,
    where e ( x i ) = | O ( y i ) O ( y i * ) | is the distance between the true ( y i ) and the predicted ( y i * ) ranks and O ( C q ) = q is the position of a label in the ordinal rank. M A E values range from zero to Q 1 .
Other metrics for ordinal classification can be found in [26].

3. Main Algorithms Solving Classification Problems

This section analyzes a sample of ML classifiers, which have been selected given that (1) they are considered as the most representative of ML and (2) they are the most popular classifiers in RE applications. To see this, refer to Table 2 and Table 3, where we conducted an analysis of the classifiers and applications of the references considered in this paper.

3.1. Logistic Regression

Logistic Regression (LR) [27] is a widely-used statistical modeling technique in which the probability that a pattern x belongs to class C q is approximated by choosing one of the classes as the pivot (e.g., the last class, C Q ). In this way, the model is estimated by the following expressions:
ln p ( C q | x , β q ) p ( C Q | x , β Q ) = f q ( x , β q ) = β q T x , q { 1 , , Q 1 } ,
where β q = β q 0 , β q 1 , , β q K is the vector of the coefficients of the linear model for class C q , β q T is the transpose vector and f q ( x , β q ) is the linear LR model for class C q .
The decision rule is then obtained by classifying each instance into the class associated with the maximum value of p C q x , β q . The estimation of the coefficient vectors β q is usually carried out by means of an iterative procedure like the Newton-Raphson algorithm or the iteratively reweighted least squares [28,29].

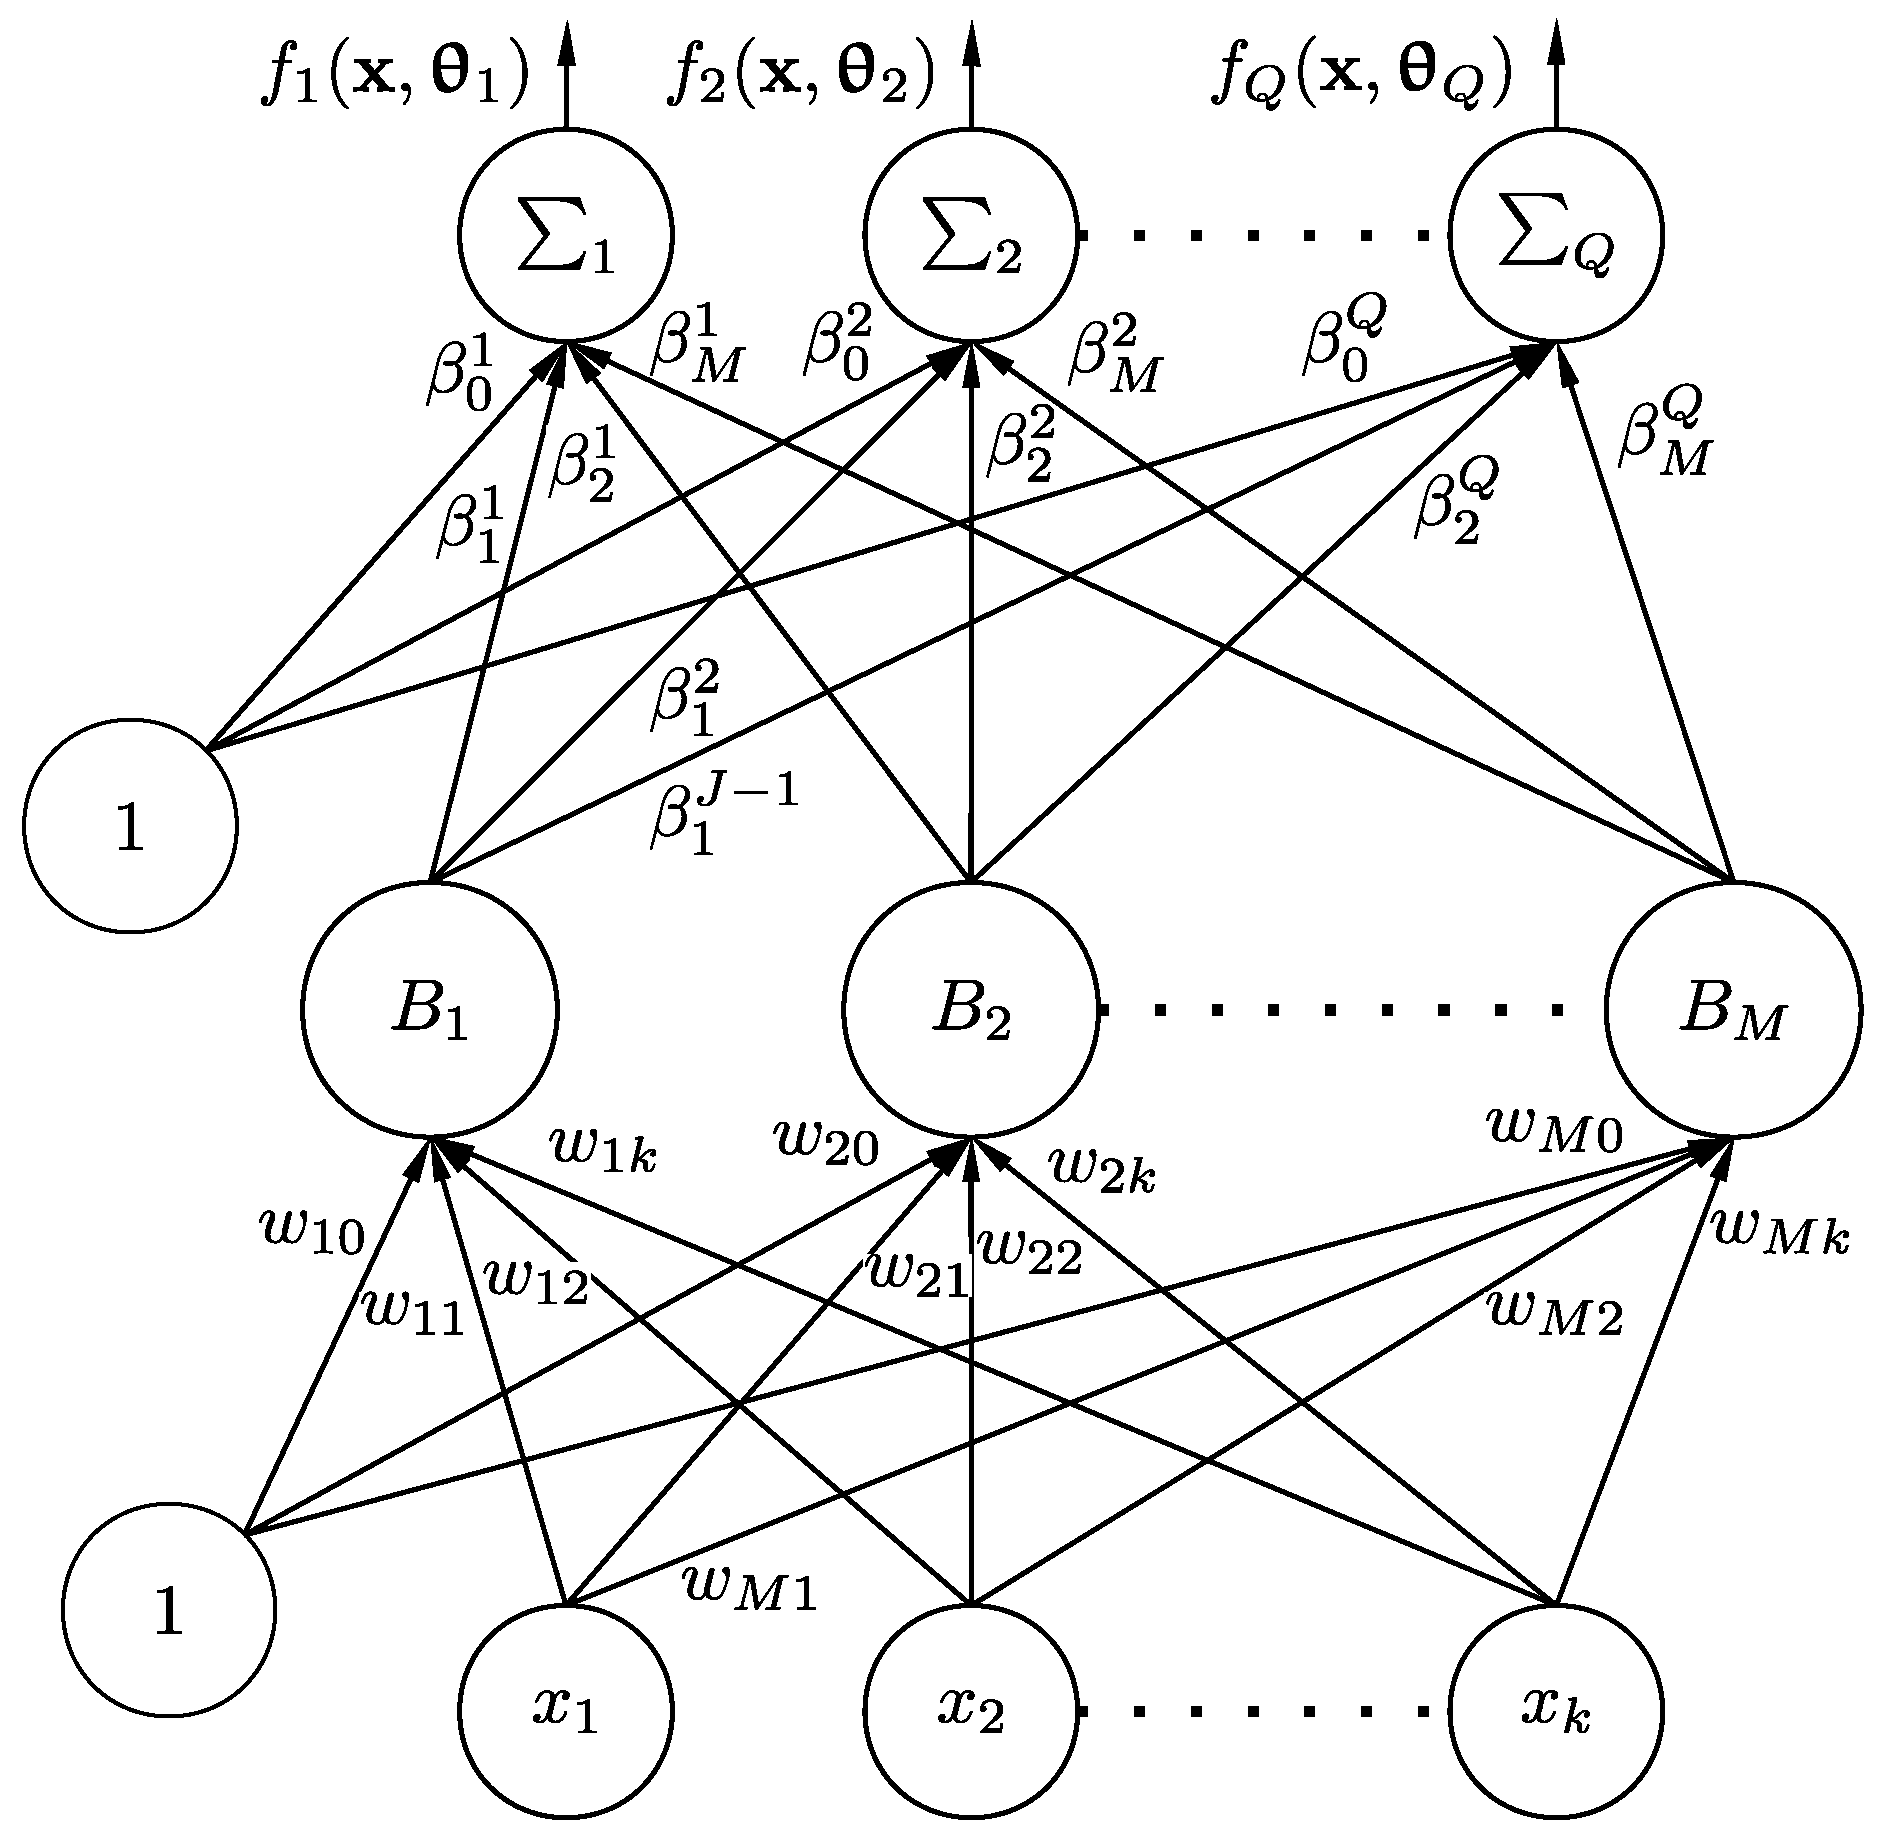
3.2. Artificial Neural Networks

With the purpose of mimicking biological neural systems, artificial neural networks (ANNs) are a modeling technique combined with an adaptive learning process. The well-known properties of ANNs have made them a common tool for successfully solving high-complexity problems from different areas.
Although they are biologically inspired, ANNs can be analyzed from a purely statistical point of view. In this way, one hidden-layer feed-forward ANNs can be regarded as generalized linear regression models, where, instead of directly using the input variables, we use a linear combination of non-linear projections of the input variables (basis functions), B j ( x , w j ) , in the following way:
f ( x , θ ) = β 0 + j = 1 M β j B j ( x , w j ) ,
where M is the number of non-linear combinations, θ = { β , w 1 , , w M } is the set of parameters associated with the model, β = { β 0 , , β M } are those parameters associated with the linear part of the model, B j ( x , w j ) are each of the basis functions, w j are the set of parameters associated with each basis function and x = { x 1 , , x K } the input variables associated with the problem. These kinds of models, which included ANNs, are called linear models of basis functions [76]. The architecture of a fully-connected ANN for classification can be checked in Figure 3.
Different kinds of ANNs can be obtained by considering different typologies for the basis functions. For example, one possibility is to use Radial Basis Functions (RBFs), which constitute RBF neural networks [77,78], based on functions located at specific points of the input space. Projection functions are the main alternative, such as sigmoidal unit basis functions, which are part of the most popular Multi-Layer Perceptron (MLP) [79], or product units, which results in product unit neural networks [80].
On the other hand, ANN learning consists of estimating the architecture (number of non-linear transformations, M, and number of connections between the different nodes of the network) and the values for parameters θ . Using a predefined architecture, supervised or unsupervised learning in ANNs is usually achieved by adjusting the connection weights iteratively. The most common option is a gradient descent-based optimization algorithm, such as back propagation. Much recent research has been done for obtaining neural network algorithms by combining different soft-computing paradigms [81,82,83,84]. Moreover, a recent ANN learning method, Extreme Learning Machines (ELMs), has received considerable attention [85], given its computational efficiency based on non-iterative tuning of the parameters. ELMs are single-layer feed-forward neural networks, where the hidden layer does not need to be tuned, given that the corresponding weights are randomly assigned.

3.3. Support Vector Machines

The Support Vector Machine paradigm (SVM) [86,87] is considered one of the most common learning methods for statistical pattern recognition, with applications in a wide range of engineering problems [88]. The basic idea is the separation of two classes through a hyperplane that is specified by its normal vector w and a bias term b. The optimal separating hyperplane is the one that maximizes the distance between the hyperplane and the nearest points of both classes (known as the margin). Kernel functions are usually used in conjunction with the SVM formulation to allow non-linear decision boundaries. In this sense, the nonlinearity of the classification solution is included via a kernel function k (associated with a non-linear mapping function Φ). This simplifies the model computation and enables more precise decision functions (since most real-world data are nonlinearly separable). The formulation is as follows:
w · Φ ( x ) + b = 0 ,
which yields the corresponding decision function:
f ( x ) = y * = sgn w · Φ ( x ) + b ,
where y * = + 1 if x belongs to the corresponding class and y * = 1 otherwise.
Beyond the application of kernel techniques, another generalization has been proposed, which replaces hard margins by soft margins [87], using the so-called slack-variables ξ i , in order to allow inseparability, relax the constraints and handle noisy data. Moreover, although the original support vector machine paradigm was proposed for binary classification problems, it has been reformulated to deal with multiclass problems [89] by dividing the data (one-against-one and one-against-all approaches).

3.4. Decision Trees

A Decision Tree (DT) is basically a classifier expressed as a recursive partition of the data space. Because of this, it is very easy to interpret, in such a way that a DT can be equivalently expressed as a set of rules. The DT consists of different nodes that form a rooted tree, i.e., a directed tree with a node called root that has no incoming edges. The rest of the nodes have exactly one incoming edge. When a node has outgoing edges, it is called an internal or test node. All other nodes are called leaves (also known as terminal nodes or decision nodes) [90]. Internal nodes divide incoming instances into two or more groups according to a certain discrete function of the input attributes values. For discrete attributes, internal nodes directly check the value of the attribute, while for continuous attributes, the condition of internal nodes refers to a range. Each leaf is usually assigned to one class representing the most appropriate target value. To classify a new instance, the DT has to be navigated from the root node down to one of the leaves.
DTs are usually trained by induction algorithms, where the problem of constructing them is expressed recursively [29]. A measure of the purity of the partition generated by each attribute (e.g., information gain) is used to do so. The iterative dichotomizer was the first of three DT inducers developed by Ross Quinlan, followed by C4.5 and C5.0 [91]. The CART (Classification And Regression Trees) [92] algorithm is also an alternative and popular inducer. One very common way to improve the performance of DTs is by combining multiple trees in what is called Random Forests (RF) [93]. In this algorithm, many DTs are grown using a random sample of the instances of the original set. Each node is split using the best among a subset of predictors randomly chosen at that node. The final decision rule of the forest is an aggregation of the decisions of its constituting trees (i.e., majority votes for classification or the average for regression) [94].

3.5. Fuzzy Rule-Based Classifiers

Rule-based expert systems are often applied to classification problems in various application fields. The use of fuzzy logic in classification systems introduces fuzzy sets, which helps to define overlapping class boundaries. In this way, FR systems have become one of the alternative frameworks for classifier design [95]. Although FR were designed based on linguistic and expert knowledge, the so-called data-driven approaches have become dominant in the fuzzy systems design area [95], providing results comparable to other alternative approaches (such as ANNs and SVMs), but with the advantage of greater transparency and interpretability of results [96]. In FR systems, typically, the features are associated with linguistic labels (e.g., low, normal, high). These values are represented as fuzzy sets on the feature axes.
Typical FR systems employ “if-then” rules and an inference mechanism, which, ideally, should correspond to the expert knowledge and decision making process for a given problem [97]. The following fuzzy “if-then” rules are used in classification problems:
Rule R j : If x 1 is A j 1 and x 2 is A j 2 , , and x K is A j K then predicted class is y j with C F = C F j ,
j { 1 , , R } ,
where R j is the j-th rule, A j 1 , , A j K are fuzzy sets in the unit interval, x 1 , , x k are the input variables (normalized in the unit hypercube [ 0 , 1 ] K ), R is the number of fuzzy rules in the classification system and C F j is the grade of certainty of the fuzzy rule. y j is usually specified as the class with the maximum sum of the compatibility grades of the training patterns for each class. The connective is modeled by the product operator, allowing for interaction between the propositions.
Several approaches have been proposed to automatically generate fuzzy “if-then” rules from numerical data without domain experts. For example, Genetic Algorithms (GA) have been widely used for simultaneously generating the rules and tuning the membership functions. On the other hand, the derivation of fuzzy classification rules from data has also been approached by neuro-fuzzy methods [98,99] and fuzzy clustering in combination with other methods, such as fuzzy relations [100] and GA optimization [101].

3.6. Miscellaneous Classifiers

Instance-based learning is another type of classifier where the learning task is done when trying to classify a new instance, rather than obtaining a model when the training set is processed [29]. These kinds of algorithms are also known as lazy algorithms, deferring the work for as long as possible. In general, instance-based learners compare each new instance to existing ones using a distance metric. For example, the nearest-neighbor classification method assigns the label of the closest neighbor to each new pattern during the test phase. Usually, it is advisable to examine more than one nearest neighbor, and the majority class of the closest k neighbors (or the distance-weighted average, if the class is numeric) is assigned to the new instance. This is termed as the k-nearest-neighbor method (k-NN) [29,76].
Additionally, Bayesian classifiers are based on the idea that the role of a (natural) class (or label) is to predict the values of features for members of that class, because examples are grouped into classes when they have common values for the features. In a Bayesian classifier, training is based on building a probabilistic model of the inputs variables, which is used during the test to predict the classification of a new example. The naive Bayes classifier [102] is the simplest model of this type, assuming that attributes are independent (given the class). Despite the disparaging name, naive Bayes works very well when tested on real-world datasets [29]. On the other hand, Bayesian networks (BN) [103] are probabilistic graphical models that represent a set of random variables and their conditional dependencies via a directed acyclic graph. They can represent better the complex relationships between input variables found in real problems.
Another important set of classification techniques is based on online learning methods [104]. In online learning, the classifier’s training is performed by using one pattern at a time (i.e., sequentially) and updated throughout time. This methodology is opposed to batch learning, in which all of the available data are presented to the classifier in the training phase. Online learning is especially useful in environments that depend on dynamic variables (e.g., climate ones), on features with a sequential nature or on huge amounts of data (where the aggregate use of the data is computationally unfeasible). As can be seen, the online learning usefulness comes from its adaptability to changeable environments and its easiness to be updated without a high computational cost.
Finally, one-class classifiers are also worth mentioning [105]. In machine learning, one-class classification refers to the learning paradigm where the objective is to identify objects of a specific class by learning from a training set containing only the objects of that class. Note that this is radically different from the traditional classification problem. An example is the classification of a specific operation as normal, in a scenario where there are few or no examples of catastrophic states, so that only the statistics of a normal operation are known. Many applications can be found in the scientific literature for one-class classification, e.g., in outlier/anomaly/novelty detection. Generally, for applying one-class classification, a few examples that do not belong to the class in question are needed, at least to optimize the parameters of the model.

3.7. Discussion and Recommendations

The future of ML has been uncertain for some time. This area experienced a great development in the first decades, but then became stagnant, until the discovery of deep learning ANNs in recent years [106]. Deep learning represents a new and promising avenue for ML in the sense that it allows one to create more complex models that resemble the human mind. This is especially important for more complex applications, such as speech recognition, image analysis and others, where data preprocessing has been always a key concept, which can be avoided using a deep model. Although deep learning is still at an early stage, the authors believe that the use of these models will spread to create more complex and accurate models with direct application to different fields of RE (there are some preliminary works, such as [107,108]).
As a final discussion, note that there are very different factors involved in the process of data science and ML. When approaching a RE application with ML, we advise the reader to consider the following aspects, usually considered by data scientists:
  • Data preprocessing: as stated before, the preprocessing step is considered as one of the most important phases in ML [109]. Preprocessing algorithms are usually used for: data cleaning, outlier detection, data imputation and transformation of features (e.g., from nominal to binary, given that many ML methods require all features to be real-valued).
  • Dimensionality of the data: low dimensional data could result in a set of features that are not relevant (or sufficient) for solving the problem at hand; hence, the importance of the process of data acquisition. High dimensional data, on the other hand, could contain irrelevant and/or correlated features, forming a space where distances between data points might not be useful (thus harming the classification). There is not a standard of what is usually considered high or low dimensional, since this usually depends on the number of patterns (it is not the same having 10 patterns in a 100-dimensional space as 10,000 patterns). Note that different methods could be emphasized for high-dimensional data, although the most common approach is to perform a feature selection analysis [110,111] or dimensionality reduction, to obtain the set of most representative features for the classification problem.
  • Number of patterns: the authors would also like to highlight the importance of BD and large-scale methods, as well as the use of distributed algorithms. BD algorithms are arising in ML given the immense amount of data collected daily, which makes its processing very difficult by using standard methods. Its usage is not only necessary in some cases, but also beneficial (e.g., in the case of distributed computing, different models could be created using spatial local information, and a more general model could be considered to be mixing the local models, as done in [112]). BD approaches usually involve a data partitioning step. The partitions are used to compute different learning models, which are then joined in the last step. Pattern or prototype selection algorithms are also a widely-used option for BD.
  • Data imbalance: apart from the above-mentioned learning strategies, prediction models for RE could largely benefit from the use of alternative classification-related techniques [30,111,113]. Imbalanced data are one of the current challenges of ML researchers for classification problems [114], as this poses a serious hindrance for the classification method. The issue in this case is that there is a class (or a set of classes) that is significantly unrepresented in the dataset (i.e., this class presents a much lower prior probability than the rest). A common consequence is that this class is ignored by the prediction model, which is unacceptable as this class is usually the one with the greatest importance (e.g., in anomaly detection or fault monitoring). The solutions in this case are multiple, and they are still being researched. However, two commonly-used ideas are to consider a cost-sensitive classifier [115] (to set a higher loss for minority patterns) or to use an over-sampling approach [116] (to create synthetic patterns from the available ones).
  • Interpretability: some applications require the extraction of tangible knowledge and emphasize less the model performance. In this case, decision trees or rule-based systems are preferred, where the user has to define the maximum number of rules or the size of the tree (two factors that are difficult to interpret). Linear models, such as LR, are also more easily interpretable and scale better with large data than nonlinear ones, although they result in some cases in a decrease of accuracy.
  • The final purpose of the algorithm: the way the model is going to be used in production can impose constraints about the kind of classification method to consider, e.g., training the model in real time (where light methods should be used), model refinement when a new datum arrives (online strategies), storage of the learned model (where the size of the model is the most important factor) or the use of an evaluation metric specified by the application (where different strategies can be used to further optimize classification models according to a predefined fitness function, such as bioinspired approaches [117]).
  • Experimental design and model selection: it is also crucial to perform a correct validation of the classifier learned, as well as to correctly optimize the different parameters of the learning process. Depending on the availability of data, different strategies can be considered to evaluate the performance of the classifier over unseen data [29] (e.g., a hold-out procedure, where a percentage of patterns is used as the test data, or a k-fold method, where the dataset is divided into k folds and k classifiers are learned, each one considering a different fold as the test set). When performing these data partitions, we emphasize the necessity of using stratified partitions, where the proportion of patterns of each class is maintained for all classes. Moreover, it is very important to consider a proper model selection process to ensure a fair comparison [76]. In this sense, when the classifier learning process involves different parameters (commonly known as hyper-parameters), the adjustment of these parameters should not be based on the test performance, given that this would result in over-fitting the test set. A proper way of performing model selection is by using a nested k-fold cross-validation over the training set. Once the lowest cross-validation error alternative is obtained, it is applied to the complete training set, and test results can be extracted.

4. A Comprehensive Review of Classification Problems and Algorithms in RE Applications

Different applications in RE can be tackled as classification problems and solved by using the previously-described techniques. Specifically, we have located five big lines in RE where classification problems mainly arise: wind speed/power prediction, fault diagnosis in RE-related systems, power disturbance analysis, appliance load monitoring and classification algorithms in RE alternative problems. The main references analyzed in this section have been categorized in Table 2 and Table 3, according to the application field, the problem tackled and the specific methodology considered.

4.1. Classification Problems and Algorithms in Wind Speed/Power Prediction

Wind speed prediction is one of the key problems in wind farm management. Because of wind’s nature (i.e., it is a continuous variable), the vast majority of approaches to wind speed prediction problems apply regression techniques. However, different versions of the problem can be tackled as classification tasks, in which classification algorithms are employed. In this subsection, we revise the most recent classification techniques in wind speed prediction.
DTs have been used in several works dealing with classification and wind speed prediction. For example, in [31], a classification scheme is applied for predicting wind gusts. A binary classification problem (gust/no gust) is defined, from the standard definition of a gust in terms of wind speed and its variation. The predictive variables are hour of the day, temperature, humidity, rainfall, pressure, wind speed and dew point. A number of classification algorithms are tested in data from measuring stations in New Zealand and Chile: LR, ANNs, simple logistic and two DTs (C4.5 and Classification and Regression Trees (CART)). The results reported in this work showed a classification accuracy over 87% for the best classification algorithm at each location. In [32], the performance of the bagging Reduced Error Prunning Tree (REPTree) classification approach is evaluated in a problem of wind speed prediction in Kirklareli (Turkey). For this purpose, different alternative classification approaches are also evaluated in comparison with REPTree, such as k-NN or RBF networks. The classification framework is obtained by discretizing the wind speed, and experiments using real data from the Kirklareli wind farm are conducted using the Weka ML software [29]. In [15], a framework to predict the wind power generation patterns using classification techniques is proposed. The proposed framework is formed by a number of steps: first, data pre-processing; second, class assignment using clustering techniques; and third, a final step of classification model construction to predict the wind power generation patterns. In this work, a second step based on an SOM network and a third classification step using a C4.5 classification tree are proposed. The results of the system are reported for Jeju island (Korea), again using Weka [29].
Alternative specific neural or kernel-based classifiers have been tested, such as in [33], where a classification algorithm based on a Bayesian neural network is proposed for long-term wind speed prediction. The long-term wind speed prediction problem is modeled as a classification problem with k classes, corresponding to different (discrete) wind speeds at a given study zone. Once the BN proposed is trained, it is able to provide the most probable class to which a new given sample belongs. Experiments in long-term wind speed classification problem on the Canary Islands (Spain) show the good performance of this approach. In [30], an SVM approach is applied to the classification of tornadoes. The problem is highly imbalanced, since only a small percentage of the measuring stations reported tornado data (less than 7%). In this work, a special feature selection technique with SVM-recursive feature elimination is proposed to determine the most important features or variables for tornado prediction out of 83 initial predictive variables. The SVM approach is compared to alternative classifiers, such as LR, RFs and rotation forests, showing better performance in terms of different accuracy measures.
Finally, different works evaluating several alternative classification algorithms have been recently published. For example, in [20], a classification framework for wind speed reconstruction and hindcast is proposed based on nominal and ordinal classifiers. The problem is formulated starting from a set of pressure patterns, which serve as predictive variables. The different classifiers are applied to estimate wind speed prediction from these pressure patterns. Experimental evaluation of the classifiers was carried out from real data for five wind farms in Spain, obtaining excellent reconstruction of the wind speed from pressure patterns. The system can be also used for long-term wind speed prediction. In [34], a censoring classification approach for medium-term wind speed prediction at wind turbines is proposed. The classification scheme can be applied to upper or lower censoring of the power curve separately, in such a way that it can forecast the class of censoring, with a given probability. Experiments in wind turbines of a German wind farm show the performance of the proposed system. In [16], classification techniques are also applied to obtain wind power patterns of wind turbines. Traditional clustering algorithms are used to discover clusters to group turbines depending on their characteristics in terms of power production. Different classification algorithms are then applied to estimate the discrete power production of the turbine, such as the Adaptive Neuro-Fuzzy Inference System (ANFIS), SVM, MLP or k-NN, reporting good performance.

4.2. Classification Problems and Algorithms in Fault Diagnosis in RE-Related Systems

Like other complex and heterogeneous systems, wind turbines are subject to the occurrence of faults that can affect both their performance and their security. Gearbox and bearing failure and various sensor faults often occur, such as sensor bias fault, sensor constant gains and others. Designing a reliable automated diagnosis system is thus of critical importance in order to be able to achieve fault detection and isolation at an early stage, reducing the maintenance costs.
In [35], the problem of predicting the status patterns of wind turbines is explored. An association rule mining algorithm is used to identify the most frequent status patterns for prediction. Since the dataset is highly imbalanced (the number of status patterns is much lower than those of normal situations), a combination of over-sampling and under-sampling techniques is used. Finally, a total of three different status parameters is identified. Regarding the number of input parameters, it is relatively high, with more than 100 parameters, obtained directly from the Supervisory Control and Data Acquisition (SCADA) system of a wind farm. To reduce its dimensionality, Principal Component Analysis (PCA) is used, obtaining six principal components that are used to build the prediction model. Using an RF algorithm, good prediction results are obtained, with around a 90% accuracy. In [36], a comparison of different classifiers in a problem of wind turbine behavior is carried out. The prediction problem is defined depending on the normal/abnormal functioning of the wind turbine, and also, a number of predictive variables is considered apart from wind speed: air density and the shading effect of the neighbor turbines, ambient temperature and wind direction. Several classifiers, such as the cluster center fuzzy logic, ANNs, k-NN and ANFIS, are compared using real data from wind farms.
SVMs are probably the most popular choice for fault diagnosis issues in RE systems. In [37], for instance, two different fault conditions are considered: input gear fault state and output gear fault state. The feature vector is obtained computing the diagonal spectrum from the vibration rotating machine data, and multiclass classification is performed using an SVM based on binary tree decomposition. To construct a suitable binary tree structure, an SOM neural network is used. The experimental data were obtained from a test wind turbine, and the accuracy was close to 99%. On the other hand, in [38], a larger number of classes is used. In this case, the data were obtained from simulations of wind turbines on a test-bed with two fault typologies: misalignment and imbalance. A total of 544 variables mainly obtained from the vibration spectrum recorded by accelerometers was used. An accuracy of 98% was obtained using a linear SVM with eight output classes (no fault, five different impairments and two different misalignments). In [14], a multi-class fuzzy SVM is proposed for this problem. Data are obtained from vibration signals and then processed using Empirical Mode Decomposition (EMD), a self-adaptive processing method suitable for non-stationary signals, which attempts to overcome some of the limitations of the wavelet transform (e.g., border distortion, interference terms, energy leakage and choice of wavelet basis). The fuzzy SVM is implemented using a one-against-all strategy, and the kernel fuzzy c-means clustering algorithm and the particle swarm optimization algorithm are applied to calculate fuzzy membership and to optimize the parameters of the kernel function. Three different faults are considered (shaft imbalance, shaft misalignment and shaft imbalance and misalignment), and the classification accuracy obtained is close to 97%.
A different approach can be found in [39], where the use of a Probabilistic Neural Network (PNN) is proposed. Data were obtained using a simulation model implemented using TurboSim, FAST of the National Renewable Energy Laboratory (USA) and Simulink of MATLAB. Three different imbalance conditions were simulated: furl imbalance, nacelle-yaw imbalance and aerodynamic asymmetry. Then, the simulation results in the time domain were decomposed into the intrinsic mode frequency using the EMD method, obtaining 17 different features for the prediction. This number was further reduced to only 10 using PCA. The resulting PNN had 10 inputs, two outputs (healthy and imbalance fault condition) and 48,000 hidden nodes (equal to the number of training data samples). The proposed method obtained a mean absolute percentage of error of 2%, the classification accuracy being 98.04%.
In [40], three different techniques—RF, dynamic BN and memetic algorithms—are combined to develop a systemic solution to reliability-centered maintenance. Data comprise 12 months of historical SCADA and alarm logs taken from a fleet of over 100 onshore gearboxes, which had been operating for approximately three years. The system proved its ability to detect faults within the turbines, assess the different maintenance actions with the objective of maximizing availability and schedule the maintenance and updating of turbine survivability in response to the maintenance action.
A different problem, although related to wind turbines, is tackled in [41]: hybrid dynamic systems. These systems include discretely-controlled continuous systems, which are used, for example, in wind turbines converters. The proposed approximation to the problem is based on the idea of monitoring the dynamical behavior of the system, which is described in a feature space sensitive to normal operating conditions in the corresponding control mode. These operating conditions are represented by restricted zones in the feature space, called classes. The occurrence of a fault entails a drift in the system operating conditions, which manifests as a progressive change in the class parameters in each control mode over time. A total of 18 different fault scenarios are considered, nine corresponding to pitch actuator faults and nine to pitch sensor faults. As a classifier, the paper proposes using the Auto-adaptive Dynamical Clustering algorithm (AuDyC) working in two phases, first detecting and then confirming the failure, by means of two different metrics (Euclidean and Mahalanobis). The results show that the system is able to detect in a short time the different fault scenarios proposed. Continuing with the same idea, in [42], the system is improved using a dynamic feature space definition, which helps to reduce the time required to detect the faults.
Besides fault detection in wind turbines, there are other RE-related applications where classification algorithms are being used. In the field of smart grids, [43] explores the use of Hidden Markov Models (HMMs) and matching pursuit decomposition for the detection, identification and location of power system faults. The proposed system uses voltage and frequency signals measured by a frequency disturbance recorder. The frequency signal feature extraction is achieved by using a matching pursuit decomposition with Gaussian atom dictionary. Then, a hybrid clustering algorithm is used to map the feature vectors into different symbols. Finally, the signal feature transitional properties are modeled with HMMs using the obtained symbols under various normal and faulty operation scenarios, and the HMMs are used to detect and identify the fault. Four types of faults are considered: generator ground fault, transmission line outage, generator outage and load loss. The proposed algorithm obtains a fault detection rate close to 97% when the Signal to Noise Ratio (SNR) is 70 dB, dropping to almost 88% if the SNR is 10 dB.

4.3. Classification Problems and Algorithms in Power Quality Disturbance Detection and Analysis

Ideally, electrical power systems should provide undistorted sinusoidal-shaped voltage and current at rated frequency to the users, which is known as Power Quality (PQ). Unexpected worsening of PQ (power quality disturbances) in a system can damage or shut down important electrical equipment necessary to ensure the correct performance of the system. Sudden variations of the PQ are usual in the power network, since it is a highly competitive environment, with the continuous change of power supply. The inclusion of RE in the network and emerging modern smart transmission systems have been reported as the main sources of disturbances in PQ. The work in [44,45] presents two extensive studies, recently published, on power quality disturbance approaches, signal processing techniques and different algorithms to detect these disturbances. This analysis can be tackled as a classification problem, with different objectives depending on the type of disturbance to be studied, which are usually: voltage or current signal disturbances (sag, swell, notch, interruption, etc.), frequency deviations and harmonics components of the signal. The type, input variables and structure of the classifiers depend on the specific application and study, but, in the majority of cases, wavelets or Fourier-based transforms are used to obtain the predictive variables feeding the different classification systems.
One of the first works on PQ disturbances analysis within a classification framework is [46], where an ad-hoc rule-based classifier is used to solve a problem of binary classification between disturbance and non-disturbance in the power signal, for different types of events, such as sag, interruption, impulse, etc. The input variables were obtained by means of a wavelet-packet-based HMM. The results reported in the work showed a very high classification accuracy of the system, close to 99% in all cases.
On the other hand, the first ML classification approach designed to face PQ disturbances analysis was based on ANNs. In [47], a PNN model is proposed for this problem. A wavelet transform is used to obtain the predictive variables to feed the PNN. Then, the network is able to classify these extracted features to identify the disturbance type (six types of voltage disturbances are considered in this work), depending on the transient duration and the energy features of the signal. Results in simulated signals using the Power System Blockset Toolbox in MATLAB show the goodness of the proposed approach. In [48], different ML classification algorithms were tested when the problem of identifying the devices present in an electrical installation was analyzed. Specifically, different classes of ANNs and SVMs were tested for signature identification of electrical devices based on the current harmonics generated in the system. An MLP neural network, an RBF network and an SVM with different kernels (linear, polynomial and Gaussian) were tested in this classification problem, obtaining performances in accuracy (depending on the type of device that generated the harmonics) between 70% and 98%. In [49], an MLP with three hidden layers is used as the classifier to detect anomalies in the voltage, frequency and harmonic components of electric signals. The input (predictive) variables have been extracted from an electrical pattern simulation and include the application of wavelets in order to obtain different levels of signal analysis. The results obtained showed a percentage of correct classification of 98% when detecting general PQ disturbances, 91% in voltage disturbance, over 99% in harmonics detection and close to 95% in frequency disturbances. In [50], the PQ of different signals is analyzed by using the S-transform and a PNN. Eighteen types of features are extracted from the S-matrix, and a classification problem with eight classes, corresponding to eight different power signal disturbances, is solved. Comparison to a back-propagation MLP and an RBF network is carried out. In [51], a hybrid methodology is proposed to detect and classify PQ disturbances. It is formed by the combination of two modules: an adaptive linear network (Adaline) for harmonic and inter-harmonic estimation and a feed-forward ANN for classification of disturbances. The proposed system is able to detect and classify disturbances, such as outages, sags, swells, spikes, notching, flickers, harmonics and inter-harmonics, plus all of their possible combinations. In this case, the predictive variables for solving the classification problem are obtained from the horizontal and vertical histograms of a specific voltage waveform, resulting in a total of 22 predictive inputs. Good classification performances, over 95%, are obtained when detecting single PQ disturbances and around 80% for the case of combined disturbances.
SVMs have been perhaps the most used classifiers in PQ disturbance analysis. In [118], SVMs and an RBF network are applied to solve this classification problem. Different types of disturbances, such as sags, voltage fluctuations and transients, are considered. Feature extraction is considered to obtain the predictive variables of the system by means of the space phasor technique. Results reported in different simulations showed that the SVM classifier performs slightly better than the RBF network in this specific problem. In [119], a multi-class SVM is applied to a similar problem of PQ disturbance detection. In this case, the predictive variables are obtained from the subtraction of the estimated fundamental component from the acquired signal. In [5], an SVM is applied to predictive variables obtained using the S-transform and the wavelet transform. The results reported indicate that in the case of using the S-transform, features based on magnitude, frequency and phase of the disturbance signal are enough to classify the steady-state power signal disturbance events with good accuracy. On the contrary, considering the wavelet transform, it is difficult to obtain a reduced set of variables that provide a good classification accuracy. In [120], an approach for automatic classification of power quality events based on the wavelet transform and SVM is proposed. The problem is tackled as a multi-class classification problem with seven classes (corresponding to the seven different power quality disturbances to be detected) that obtains the predictive variables from the wavelet transform. In [121], an SVM classifier with different kernels is proposed for PQ detection. This work uses the time-time transform to obtain the predictive variables that represent the power signals. The authors claim that TT-transform works better in considering noise in power signals than the frequently-used wavelet transform. An immune optimization system is also used in this work in order to refine the centers of the SVM clusters, improving the classification accuracy of the proposed system. In [122], the discrimination between internal faults in a power transformer and the other disturbances (different types of inrush currents and over-excitation conditions) is tackled. The problem is modeled with a binary classification approach, where the predictive variables are obtained by means of the wavelet transform. The power signal modeling is carried out using the PSCAD/EMTDC software package. An SVM is also proposed in this case, obtaining results in accuracy, classifying between internal faults and disturbance, over 95% in all cases simulated. In [123], another SVM approach is presented for a problem of disturbances classification in power signals and combined with a previous step of feature selection using wavelet transforms. Six classes are considered in this classification problem, and the SVM performance is tested on different simulated signals, including different disturbances. Finally, in [52], an SVM classifier is applied to PQ detection in electric signals. Simulation of different electric disturbances is used, and wavelet transform and signal coefficients (mean, median and standard deviation and variance) are employed as input (predictive) variables. The classification problem tackled in this case is a multi-class problem (where the different classes are the different signal disturbances considered). The multi-class classification problem is solved with several binary SVMs classifiers by using one-versus-all and one-versus-one structures. Generally, the results are reported, promising to detect specific power signal disturbances, such as sag, swell or harmonics.
DTs are another classification technique applied to PQ disturbance detection problems. In [53], a DT is applied to a PQ disturbance detection in power signals. The input variables of the system are obtained by applying the S-transform to the original power signal. A total of 13 classes was considered in the paper, each one corresponding to a different power disturbance event. The DT is able to obtain direct classification rules, interpretable in terms of the input variables considered. The quality of the results reported improves that of alternative classifiers, such as ANNs, neuro-fuzzy systems and SVMs. In [54], a problem of PQ disturbances classification is tackled, considering different types of disturbance, including sag, swell, notch and harmonics. The predictive variables are obtained using an S-transform (with a total of seven classes considered in the classification problem), and the paper proposes a feature selection method using GA. Two different classifiers are proposed and evaluated in this work, DT and SVM. Three different case studies are analyzed, considering setup prototypes for wind energy and photovoltaic systems. The proposed system obtains a classification accuracy over 95% in all cases, both with the DT and SVM approaches. In [55], a special class of DT, the so-called neural balance tree, is applied to a problem of automatic classification of PQ events. The input variables are obtained through non-stationary signal processing, using the Hilbert–Huang transform, EMD and the Hilbert transform. A comparison with the performance of the system when the S-transform is used to obtain the predictive variables is carried out. Excellent classification accuracy is reported in detecting different PQ events, close to 97%.
Fuzzy techniques have been also applied to different problems of classification of PQ disturbances. In [56], a fuzzy DT is applied to the classification of PQ disturbances. Several predictive variables are obtained using the S-transform, and then, a clustering algorithm based on a bacterial foraging optimization algorithm is applied. The results in terms of accuracy indicate that the use of the clustering approach improves the performance of the fuzzy DT on its own. In [57], a fuzzy expert system is applied for a classification problem of PQ events. Different novel predictive variables are introduced based on a wavelet transform of the power signal. The fuzzy expert system is compared to the performance of a feed-forward ANN, obtaining better results in terms of classification accuracy. In [58], four different fuzzy classification methods are applied to a problem of PQ event classification from wavelet-based predictive variables. Specifically, the work compares the fuzzy product aggregation reasoning rule, the fuzzy explicit classification algorithm, the fuzzy maximum likelihood approach and the fuzzy k-NN algorithm. Six major categories of PQ disturbances are considered: voltage sag, voltage swell, momentary interruption, notch, oscillatory transient and spikes. Experiments with and without noise present in the system are carried out, obtaining classification performances from 90% to 97%, the fuzzy product aggregation reasoning rule being the best classifier. Finally, in [59], a genetic fuzzy system for classification is proposed for PQ disturbance classification. The system is based on twelve fuzzy decision rules, whose membership functions are optimized with a particle swarm optimization algorithm. The predictive variables are extracted from parameters derived from the Fourier and wavelet transforms of the signal. Several experiments to detect nine types of disturbance in the signal are carried out, considering cases of noise and without noise, with classification performances over 90% in all cases.

4.4. Classification Problems and Algorithms in Appliance Load Monitoring Applications

Since the seminal work by George W. Hart [124], Ion-intrusive Appliance Load Monitoring (NIALM) has attracted much attention, with different techniques and solutions being presented, although reliable load disaggregation is still a challenging task. Two interesting reviews of different features and algorithms can be found on [125,126]. The final goal of NIALM applications is to deduce which appliances are used in a house, as well as their individual energy consumption, from the analysis of the changes in the voltage and current going into it.
In [48], ANNs are proposed for the classification of up to 10 different devices. The results obtained demonstrated an accuracy between 70% and 100% depending on the device.
The k-nearest neighbor algorithm was proposed in [60] to classify among eight different appliances with a total of 34 possible distinct state transitions. The 1-NN algorithm was compared to different classifiers (Gaussian naive Bayes, DTs and multiclass AdaBoost), and it obtained the best results of all with an accuracy of 79% over the validation set. In a later study [61], these results were completed, increasing the number of appliances up to 17, with similar results.
In [62,63], a thorough study is presented, with several algorithms tested and different scenarios. A total of 27 typical appliances and 32 operating modes are considered, and the best results are obtained with a maximum likelihood estimator, with an accuracy close to 90%. This paper also proposes the combination of different algorithms using a committee decision mechanism, which yields almost a 10% accuracy improvement over any individual disaggregation algorithm.
SVMs have also been used for the NIALM problem. For example, Jiang et al. [64] used a multiclass SVM to classify among 11 different loads with mean accuracy over 95%.

4.5. Classification Problems and Algorithms in Alternative RE Applications

In this section, we include different classification approaches to problems related to solar energy and wave energy prediction. In the case of solar energy, the vast majority of classification problems use data from satellite images or meteorological data and are focused on analyzing the presence of clouds or their types. There are two reviews that cover different aspects of solar radiation prediction and its instrumentation [65], as well as the main ML approaches to solar radiation problems [66]. None of them are specifically focused on classification approaches, but on regression. Regarding wave energy, this field is novel, and the number of ML approaches is still minor; thus, only a reduced number of works dealing with classification approaches will be revised in this area.
Different types of ANN have been applied to solve classification problems in solar energy. In [67], a temporally-adaptive classification system for multi-spectral images is proposed based on a Bayesian framework and PNNs. A spatial-temporal adaptation mechanism is proposed to take the environmental variations into account. The experimental results of the paper are presented using data from the Geostationary Operational Environmental Satellite 8 (GOES-8) imagery data, considering five specific classes: high-level cloud, middle-level cloud, low-level cloud, land and water. Different classification performances are obtained, varying from over 98% accuracy detecting land and water clouds, to 94% detecting high-levels clouds and down to 80% in middle-level clouds. In [68], an operational cloud classification system is presented also based on data from the GOES-8 satellite. The system implements two PNNs, one for each satellite channel. This novel implementation based on neural classifiers is able to combine the information in the visible and the IR channels, providing a good cloud classification in daytime. The cloud images obtained from the GOES-8 satellite are classified into the same previously-mentioned five classes (land, water, low-level, middle-level and high-level clouds). Results reported show a mean accuracy rate during daytime operation in the 84% to 95% range, whereas the overall mean correct classification over a period of 8 h of continuous temporal updating is 90%. In [69], the performance of six artificial neural classifiers (MLPs, PNNs, modular ANNs, Jordan–Elman network, SOM and co-active neuro-fuzzy inference systems) are analyzed and compared to two alternative approaches, PCA and SVMs. Cloud sample data were manually collected by meteorologists in summer 2007 from three channels of the FY-2C geostationary satellite. Different classes were considered, including sea clouds, thick cirrus, cumulonimbus and land clouds, obtaining excellent performance (over a 95% correct detection in all cases considering the best model of neural network).
The SVM paradigm for classification has been also often applied in solar energy problems. In [70], a specific multi-category SVM is applied to cloud detection and classification from Moderate Resolution Imaging Spectroradiometer (MODIS) observations. Three classes are considered in this work (clear sky, water cloud and ice cloud), and the results reported show the good performance of the SVM in terms of accuracy when compared to the previously-used MODIS algorithm. In [17], a method to combine labeled and unlabeled pixels from satellite images is proposed to increase classification reliability and accuracy. A semi-supervised SVM classifier is then applied, based on the combination of clustering and the so-called mean map kernel. The performance of this approach is illustrated in a cloud screening application using data from the Medium Resolution Imaging Spectrometer instrument onboard the European Space Agency ENVISAT satellite. In [71], a fault diagnosis monitoring system for solar plants is proposed, based on an SVM classifier. The system is able to locate faults in strings of panels at the solar plant, depending on the hour of the day and the illuminance of the panels. In [4], a classification model based on weather types is proposed in a photovoltaic power prediction problem. The classification based on different weather types is improved by means of an SVM, used to complete the missing values from the weather type of historical data. Good classification results are reported in a problem of photovoltaic power prediction in a plant in Inner Mongolia (China). In [72], a framework using a classification based on the type of clouds and applied to all-sky images in order to improve solar irradiance prediction is proposed. This classification step is carried out by means of an SVM approach, whose output is processed by a regression algorithm to obtain the final prediction of the irradiance. Six classes of clouds are considered in this work (cirrus, cirrostratus, scattered cumulus or altocumulus, cumulus or cumulonimbus, stratus and clear sky), and the experimental results show that the inclusion of the cloud classification step previous to the irradiance prediction can improve the final performance of the prediction system up to 15% with respect to the regressor on its own.
Fuzzy classification techniques have also been applied to the solar energy problem, such as in [73], where a fuzzy rule-based cloud classification approach was proposed for a problem of cloud cover classification from satellite images. METEOSAT-5 images were categorized into three classes: cloudy, partially cloudy and clear sky. Five features, taking into account the temporal and spatial properties of visible and infrared images, were considered. Accuracy values over 97% were reported with this technique in experiments over the Indian subcontinent, both in cloud detection over land and sea cases. On the other hand, in [74], a hierarchical approach for classification based on fuzzy rules was proposed. The main parameters of the proposed method were optimized by means of a GA, conforming a genetic fuzzy system. A classification problem involving real data collected from a photovoltaic installation was tackled, in order to linguistically describe how the temperature of the PV panel and the irradiance are related to the a given class (low, medium or high production). The results show classification accuracy given by the algorithm over 97%.
We finalize this section by reporting two recent studies on classification approaches for wave energy, since, as previously mentioned, the number of works dealing with classification techniques in this renewable resource is scarce. In [75], an analysis of different circulation patterns that lead to extreme waves is carried out. A classification approach based on FR that uses data from ERA-Interim reanalysis is presented, and results from the coast of Natal (South Africa) are reported. In [3], different classifiers are tested in a problem of significant wave height and wave energy flux estimation. Ordinal and nominal classifiers using data from buoys sited in the Gulf of Alaska and in the East Boast of the USA are presented and their performance assessed.

4.6. A Final Note on Classification Problems in RE

Classification is one of the most important areas in ML, mainly because a huge variety of problems can be stated as different or specific classification tasks. RE is not an exception, and this paper shows how there is a large amount of applications and problems in different aspects of RE systems, which can be solved successfully with classification algorithms. The improvement of techniques for classification is, without a doubt, the most important research line in the area, which will produce very promising results in RE applications in the near future. In this sense, some problems that are currently tackled as regression problems, exploiting the continuity of the data, could be tackled in the future as special cases of classification (such as ordinal classification discussed in Section 2).
As the reader may have noted, specific applications in smart-grids and microgrids have not been often defined as classification problems. We are fully convinced that many problems that will arise in the future intelligent electrical network will be stated as classification problems and tackled with some of the algorithms described in this review (or improvements of them). In this sense, information on generation and consumption patterns for different consumer profiles would be crucial, in order to obtain reliable data to state the problems as supervised classification tasks. Note that some of the applications described in this paper can be used to automatically obtain or process this information, so it seems that many of the problems and techniques discussed in this paper could help redefine new scenarios in RE, larger than the current specific applications, and probably related to the new way of understanding the electrical network, as a fully-distributed and decentralized system.

5. Conclusions

In this paper, we have reviewed the most important existing classification algorithms and how these approaches have been applied to different Renewable Energy (RE) types. The use of machine learning (and more specifically, classification techniques) has been crucial for the area of RE systems in the last few years and will have a greater impact in the coming ones. The most common work flow for the use of predictive analysis is the following: data preprocessing and cleaning, model construction and model/result interpretation or evaluation. This paper focuses on the model construction step, providing an extensive descriptive analysis of the most classical and modern trends in classification techniques (and other related learning paradigms). These methods are emphasized for different cases, depending on their characteristics and data requirements, facilitating their use by practitioners in the field. Generally, the classification methods that deserve special mention are support vector machines and artificial neural networks, because of their ability to handle non-linear and noisy data (despite their difficult interpretability). The range of RE problems that can benefit from these learning techniques is wide: e.g., those related to wind farm management (wind speed prediction or turbine diagnosis), power quality disturbance detection in the power grid, fault diagnosis, solar energy facility management or marine energy. In this sense, this paper also includes a comprehensive review of the most important applications in RE systems that have been formulated as classification problems.

Acknowledgments

This work has been partially supported by the projects TIN2014-54583-C2-1-R and TIN2014-54583-C2-2-R of the Spanish Ministerial Commission of Science and Technology (MICYT), FEDER funds, the P11-TIC-7508 project of the “Junta de Andalucía” and by Comunidad Autónoma de Madrid, under Project Number S2013ICE-2933_02.

Author Contributions

María Pérez-Ortiz, Pedro A. Gutiérrez and César Hervás-Martínez wrote the description of the classification algorithms. Silvia Jiménez-Fernández contributed with the review and writing of the wind speed/power applications. Enrique Alexandre contributed with the review and writing of the fault diagnosis applications and Sancho Salcedo-Sanz with the review and writing of the power quality disturbance detection and analysis applications.

Conflicts of Interest

The authors declare no conflict of interest.

Abbreviations

The following abbreviations are used in this manuscript:
ANFISAdaptive Neuro-Fuzzy Inference System
ANNArtificial Neural Network
AuDyCAuto-adaptive Dynamical Clustering algorithm
BNBayesian Networks
CARTClassification and Regression Trees
DTDecision Tree
ELMExtreme Learning Machine
EMDEmpirical Mode Decomposition
FRFuzzy Rule
GAGenetic Algorithm
GFSGenetic Fuzzy System
HMMHidden Markov Model
k-NNk Nearest Neighbors
LRLogistic Regression
MAEMean Absolute Error
MLMachine Learning
MLPMultilayer Perceptron
MODISModerate Resolution Imaging Spectroradiometer
MSMinimum Sensitivity
PCAPrincipal Component Analysis
PNNProbabilistic Neural Network
PQPower Quality
RBFRadial Basis Function
RERenewable Energy
RFRandom Forest
ROCReceiver Operating Characteristic
SCADASupervisory Control and Data Acquisition
SNRSignal to Noise Ratio
SOMSelf-Organizing Map
SVMSupport Vector Machine
WPPTWind Power Prediction Tool

References

  1. Suganthi, L.; Samuel, A.A. Energy models for demand forecasting—A review. Renew. Sustain. Energy Rev. 2012, 16, 1223–1240. [Google Scholar] [CrossRef]
  2. Rowland, C.S.; Mjelde, J.W. Politics and petroleum: Unintended implications of global oil demand reduction policies. Energy Res. Soc. Sci. 2016, 11, 209–224. [Google Scholar] [CrossRef]
  3. Fernández, J.C.; Salcedo-Sanz, S.; Gutiérrez, P.A.; Alexandre, E.; Hervás-Martínez, C. Significant wave height and energy flux range forecast with machine learning classifiers. Eng. Appl. Artif. Intell. 2015, 43, 44–53. [Google Scholar] [CrossRef]
  4. Wang, F.; Zhen, Z.; Mi, Z.; Sun, H.; Su, S.; Yang, G. Solar irradiance feature extraction and support vector machines based weather status pattern recognition model for short-term photovoltaic power forecasting. Energy Build. 2015, 86, 427–438. [Google Scholar] [CrossRef]
  5. Panigrahi, B.K.; Dash, P.K.; Reddy, J.B.V. Hybrid signal processing and machine intelligence techniques for detection, quantification and classification of power quality disturbances. Eng. Appl. Artif. Intell. 2009, 22, 442–454. [Google Scholar] [CrossRef]
  6. National Science Board. Available online: http://www.nsf.gov/statistics/seind10/ (accessed on 29 July 2016).
  7. Cheng, M.; Zhu, Y. The state of the art of wind energy conversion systems and technologies: A review. Energy Convers. Manag. 2014, 88, 332–347. [Google Scholar] [CrossRef]
  8. Al-Mostafa, Z.A.; Maghrabi, A.H.; Al-Shehri, S.M. Sunshine-based global radiation models: A review and case study. Energy Convers. Manag. 2014, 84, 209–216. [Google Scholar] [CrossRef]
  9. Laghari, J.A.; Mokhlis, H.; Karimi, M.; Bakar, A.H.A. Hasmaini Mohamad, Computational Intelligence based techniques for islanding detection of distributed generation in distribution network: A review. Energy Convers. Manag. 2014, 88, 139–152. [Google Scholar] [CrossRef]
  10. Behera, S.; Sahoo, S.; Pati, B.B. A review on optimization algorithms and application to wind energy integration to grid. Renew. Sustain. Energy Rev. 2015, 48, 214–227. [Google Scholar] [CrossRef]
  11. Gieseke, F.; Airola, A.; Pahikkala, T.; Kramer, O. Fast and Simple Gradient-Based Optimization for Semi-Supervised Support Vector Machines. Neurocomputing 2014, 123, 23–32. [Google Scholar] [CrossRef]
  12. Lee, J.-S.; Du, L.-J. Unsupervised classification using polarimetric decomposition and the complex Wishart classifier. IEEE Trans. Geosci. Remote Sens. 1999, 37, 2249–2258. [Google Scholar]
  13. Pahikkala, T.; Airola, A.; Gieseke, F.; Kramer, O. Unsupervised Multi-Class Regularized Least-Squares Classification. In Proceedings of the 12th IEEE International Conference on Data Mining (ICDM), Brussels, Belgium, 10–13 December 2012; pp. 585–594.
  14. Hang, J.; Zhang, J.; Cheng, M. Application of multi-class fuzzy support vector machine classifier for fault diagnosis of wind turbine. Fuzzy Sets Syst. 2016, 297, 128–140. [Google Scholar] [CrossRef]
  15. Kim, K.I.; Jin, C.H.; Lee, Y.K.; Kim, K.D.; Ryu, K.H. Forecasting wind power generation patterns based on SOM clustering. In Proceedings of the 3rd International Conference on Awareness Science and Technology (iCAST), Dalian, China, 27–30 September 2011; pp. 508–511.
  16. Lee, H.G.; Piao, M.; Shin, Y.H. Wind Power Pattern Forecasting Based on Projected Clustering and Classification Methods. ETRI J. 2015, 37, 283–294. [Google Scholar] [CrossRef]
  17. Gomez-Chova, L.; Camps-Valls, G.; Bruzzone, L.; Calpe-Maravilla, J. Mean Map Kernel Methods for Semisupervised Cloud Classification. IEEE Trans. Geosci. Remote Sens. 2010, 48, 207–220. [Google Scholar] [CrossRef]
  18. Naganathan, H.; Chong, W.K.; Chen, X.W. Semi-supervised Energy Modeling (SSEM) for Building Clusters Using Machine Learning Techniques. Procedia Eng. 2015, 118, 1189–1194. [Google Scholar] [CrossRef]
  19. Gutiérrez, P.A.; Pérez-Ortiz, M.; Sánchez-Monedero, J.; Fernández-Navarro, F.; Hervás-Martínez, C. Ordinal regression methods: Survey and experimental study. IEEE Trans. Knowl. Data Eng. 2015, 28, 127–146. [Google Scholar] [CrossRef]
  20. Gutiérrez, P.A.; Salcedo-Sanz, S.; Hervás-Martínez, C.; Carro-Calvo, L.; Sánchez-Monedero, J.; Prieto, L. Ordinal and nominal classification of wind speed from synoptic pressure patterns. Eng. Appl. Artif. Intell. 2013, 26, 1008–1015. [Google Scholar] [CrossRef]
  21. Sánchez-Monedero, J.; Salcedo-Sanz, S.; Gutiérrez, P.A.; Casanova-Mateo, C.; Hervás-Martínez, C. Simultaneous modeling of rainfall occurrence and amount using a hierarchical nominal–ordinal support vector classifier. Eng. Appl. Artif. Intell. 2014, 34, 199–207. [Google Scholar] [CrossRef]
  22. Provost, F.J.; Fawcett, T. Analysis and visualization of classifier performance: Comparison under imprecise class and cost distributions. In Proceedings of the Third International Conference on Knowledge Discovery and Data Mining, Newport Beach, CA, USA, 14–17 August 1997; Volume 97, pp. 43–48.
  23. Zolghadri, M.J.; Mansoori, E.G. Weighting fuzzy classification rules using receiver operating characteristics (ROC) analysis. Inf. Sci. 2007, 177, 2296–2307. [Google Scholar] [CrossRef]
  24. Caballero, J.F.; Martinez, F.; Hervas, C.; Gutierrez, P. Sensitivity Versus Accuracy in Multiclass Problems Using Memetic Pareto Evolutionary Neural Networks. IEEE Trans. Neural Netw. 2010, 21, 750–770. [Google Scholar] [CrossRef] [PubMed]
  25. Baccianella, S.; Esuli, A.; Sebastiani, F. Evaluation Measures for Ordinal Regression. In Proceedings of the Ninth International Conference on Intelligent Systems Design and Applications (ISDA ’09), Pisa, Italy, 30 November–2 December 2009; pp. 283–287.
  26. Cruz-Ramírez, M.; Hervás-Martínez, C.; Sánchez-Monedero, J.; Gutiérrez, P.A. Metrics to guide a multi-objective evolutionary algorithm for ordinal classification. Neurocomputing 2014, 135, 21–31. [Google Scholar] [CrossRef]
  27. Hosmer, D.W., Jr.; Lemeshow, S.; Sturdivant, R.X. Applied Logistic Regression; John Wiley & Sons: Malden, MA, USA, 2004. [Google Scholar]
  28. Hastie, T.; Tibshirani, R.; Friedman, J. The Elements of Statistical Learning; Springer Series in Statistics; Springer: New York, NY, USA, 2009. [Google Scholar]
  29. Witten, I.H.; Frank, E. Data Mining: Practical Machine Learning Tools and Techniques, 2nd ed.; Morgan Kaufmann: Burlington, MA, USA, 2005. [Google Scholar]
  30. Trafalis, T.B.; Adrianto, I.; Richman, M.B.; Lakshmivarahan, S. Machine-Learning classifiers for imbalanced tornado data. Comput. Manag. Sci. 2013, 11, 403–418. [Google Scholar] [CrossRef]
  31. Sallis, P.J.; Claster, W.; Hernández, S. A machine-learning algorithm for wind gust prediction. Comput. Geosci. 2011, 37, 1337–1344. [Google Scholar] [CrossRef]
  32. Zontul, M.; Aydın, F.; Doğan, G.; Şener, S.; Kaynar, O. Wind Speed Forecasting Using REPTree and Bagging Methods in Kirklareli-Turkey. J. Theor. Appl. Inf. Technol. 2013, 56, 17–29. [Google Scholar]
  33. Carta, J.A.; Velázquez, S.; Matías, J.M. Use of Bayesian networks classifiers for long-term mean wind turbine energy output estimation at a potential wind energy conversion site. Energy Convers. Manag. 2011, 52, 1137–1149. [Google Scholar] [CrossRef]
  34. Croonenbroeck, C.; Dahl, C.M. Accurate medium-term wind power forecasting in a censored classification framework. Energy 2014, 73, 221–232. [Google Scholar] [CrossRef]
  35. Kusiak, A.; Verma, A. Prediction of Status Patterns of Wind Turbines: A Data-Mining Approach. J. Sol. Energy Eng. 2011, 133, 011008. [Google Scholar] [CrossRef]
  36. Schlechtingen, M.; Santos, I.; Achiche, S. Using Data-Mining Approaches for Wind Turbine Power Curve Monitoring: A Comparative Study. IEEE Trans. Sustain. Energy 2013, 4, 671–679. [Google Scholar] [CrossRef]
  37. Liu, W.; Wang, Z.; Han, J.; Wang, G. Wind turbine fault diagnosis method based on diagonal spectrum and clustering binary tree SVM. Renew. Energy 2013, 50, 1–6. [Google Scholar]
  38. Santos, P.; Villa, L.F.; Reñones, A.; Bustillo, A.; Maudes, J. An SVM-Based Solution for Fault Detection in Wind Turbines. Sensors 2015, 15, 5627–5648. [Google Scholar] [CrossRef] [PubMed]
  39. Malik, H.; Mishra, S. Application of Probabilistic Neural Network in Fault Diagnosis of Wind Turbine Using FAST, TurbSim and Simulink. Procedia Comput. Sci. 2015, 58, 186–193. [Google Scholar] [CrossRef]
  40. Pattison, D.; Garcia, M.S.; Xie, W.; Quail, F.; Revie, M.; Whitfield, R.I.; Irvine, I. Intelligent integrated maintenance for wind power generation. Wind Energy 2016, 19, 547–562. [Google Scholar] [CrossRef]
  41. Toubakh, H.; Sayed-Mouchaweh, M. Hybrid dynamic data-driven approach for drift-like fault detection in wind turbines. Evol. Syst. 2015, 6, 115–129. [Google Scholar] [CrossRef]
  42. Toubakh, H.; Sayed-Mouchaweh, M. Hybrid dynamic classifier for drift-like fault diagnosis in a class of hybrid dynamic systems: Application to wind turbine converters. Neurocomputing 2016, 171, 1496–1516. [Google Scholar] [CrossRef]
  43. Jiang, H.; Zhang, J.; Gao, W.; Wu, Z. Fault Detection, Identification, and Location in Smart Grid Based on Data-Driven Computational Methods. IEEE Trans. Smart Grid 2014, 5, 2947–2956. [Google Scholar] [CrossRef]
  44. Mahela, O.P.; Shaik, A.G.; Gupta, N. A critical review of detection and classification of power quality events. Renew. Sustain. Energy Rev. 2015, 41, 495–505. [Google Scholar] [CrossRef]
  45. Khokhar, S.; Zin, A.A.B.M.; Mokhtar, A.S.B.; Pesaran, M. A comprehensive overview on signal processing and artificial intelligence techniques applications in classification of power quality disturbances. Renew. Sustain. Energy Rev. 2015, 51, 1650–1663. [Google Scholar] [CrossRef]
  46. Chung, J.; Powers, E.; Grady, W.; Bhatt, S. Power disturbance classifier using a rule-based method and wavelet packet-based hidden Markov model. IEEE Trans. Power Deliv. 2002, 17, 233–241. [Google Scholar] [CrossRef]
  47. Gaing, Z.-L. Wavelet-based neural network for power disturbance recognition and classification. IEEE Trans. Power Deliv. 2004, 19, 1560–1568. [Google Scholar] [CrossRef]
  48. Srinivasan, D.; Ng, W.; Liew, A. Neural-Network-Based signature recognition for harmonic source identification. IEEE Trans. Power Deliv. 2006, 21, 398–405. [Google Scholar] [CrossRef]
  49. Monedero, I.; Leon, C.; Ropero, J.; Garcia, A.; Elena, J.; Montano, J. Classification of Electrical Disturbances in Real Time Using Neural Networks. IEEE Trans. Power Deliv. 2007, 22, 1288–1296. [Google Scholar] [CrossRef]
  50. Huang, N.; Xu, D.; Liu, X.; Lin, L. Power quality disturbances classification based on S-transform and probabilistic neural network. Neurocomputing 2012, 98, 12–23. [Google Scholar] [CrossRef]
  51. Valtierra-Rodriguez, M.; Romero-Troncoso, R.D.; Osornio-Rios, R.; Garcia-Perez, A. Detection and Classification of Single and Combined Power Quality Disturbances Using Neural Networks. IEEE Trans. Ind. Electron. 2014, 61, 2473–2482. [Google Scholar] [CrossRef]
  52. De Yong, D.; Bhowmik, S.; Magnago, F. An effective Power Quality classifier using Wavelet Transform and Support Vector Machines. Expert Syst. Appl. 2015, 42, 6075–6081. [Google Scholar] [CrossRef]
  53. Biswal, M.; Dash, P.K. Detection and characterization of multiple power quality disturbances with a fast S-transform and decision tree based classifier. Digit. Signal Process. 2013, 23, 1071–1083. [Google Scholar] [CrossRef]
  54. Ray, P.K.; Mohanty, S.R.; Kishor, N.; Catalao, J.P.S. Optimal Feature and Decision Tree-Based Classification of Power Quality Disturbances in Distributed Generation Systems. IEEE Trans. Sustain. Energy 2014, 5, 200–208. [Google Scholar] [CrossRef]
  55. Biswal, B.; Biswal, M.; Mishra, S.; Jalaja, R. Automatic Classification of Power Quality Events Using Balanced Neural Tree. IEEE Trans. Ind. Electron. 2014, 61, 521–530. [Google Scholar] [CrossRef]
  56. Biswal, B.; Behera, H.S.; Bisoi, R.; Dash, P.K. Classification of power quality data using decision tree and chemotactic differential evolution based fuzzy clustering. Swarm Evolut. Comput. 2012, 4, 12–24. [Google Scholar] [CrossRef]
  57. Liao, Y.; Lee, J.-B. A fuzzy-expert system for classifying power quality disturbances. Int. J. Electr. Power Energy Syst. 2004, 26, 199–205. [Google Scholar] [CrossRef]
  58. Meher, S.K.; Pradhan, A.K. Fuzzy classifiers for power quality events analysis. Electr. Power Syst. Res. 2010, 80, 71–76. [Google Scholar] [CrossRef]
  59. Hooshmand, R.; Enshaee, A. Detection and classification of single and combined power quality disturbances using fuzzy systems oriented by particle swarm optimization algorithm. Electr. Power Syst. Res. 2010, 80, 1552–1561. [Google Scholar] [CrossRef]
  60. Berges, M.; Goldman, E.; Matthews, H.S.; Soibelman, L. Learning systems for electric consumption of buildings. In Proceedings of the ASCE International Workshop on Computing in Civil Engineering, Austin, TX, USA, 24–27 July 2009.
  61. Berges, M.; Goldman, E.; Matthews, H.S.; Soibelman, L. Enhancing electricity audits in residential buildings with nonintrusive load monitoring. J. Ind. Ecol. 2010, 14, 844–858. [Google Scholar] [CrossRef]
  62. Liang, J.; Ng, S.K.K.; Kendall, G.; Cheng, J.W.M. Load signature study—Part I: Basic concept, structure and methodology. IEEE Trans. Power Deliv. 2010, 25, 551–560. [Google Scholar] [CrossRef]
  63. Liang, J.; Ng, S.K.K.; Kendall, G.; Cheng, J.W.M. Load signature study—Part II: Disaggregation farmework, simulation and applications. IEEE Trans. Power Deliv. 2010, 25, 561–569. [Google Scholar] [CrossRef]
  64. Jiang, L.; Luo, S.; Li, J. An approach of household power appliance monitoring based on machine learning. In Proceedings of the Fifth International Conference OnIntelligent Computation Technology and Automation (ICICTA), Zhangjiajie, China, 12–14 January 2012; pp. 577–580.
  65. Tapakis, R.; Charalambides, A.G. Equipment and methodologies for cloud detection and classification: A review. Sol. Energy 2013, 95, 392–430. [Google Scholar] [CrossRef]
  66. Mellit, A.; Kalogirou, S.A. Artificial intelligence techniques for photovoltaic applications: A review. Prog. Energy Combust. Sci. 2008, 34, 574–632. [Google Scholar] [CrossRef]
  67. Wang, J.; Azimi-Sadjadi, M.R.; Reinke, D. A temporally adaptive classifier for multispectral imagery. IEEE Trans. Neural Netw. 2004, 15, 159–165. [Google Scholar] [CrossRef] [PubMed]
  68. Saitwal, K.; Azimi-Sadjadi, M.; Reinke, D. A multichannel temporally adaptive system for continuous cloud classification from satellite imagery. IEEE Trans. Geosci. Remote Sens. 2003, 41, 1098–1104. [Google Scholar] [CrossRef]
  69. Liu, Y.; Xia, J.; Shi, C.-X.; Hong, Y. An Improved Cloud Classification Algorithm for China’s FY-2c Multi-Channel Images Using Artificial Neural Network. Sensors 2009, 9, 5558–5579. [Google Scholar] [CrossRef] [PubMed]
  70. Lee, Y.; Wahba, G.; Ackerman, S.A. Cloud Classification of Satellite Radiance Data by Multicategory Support Vector Machines. J. Atmos. Ocean. Technol. 2004, 21, 159–169. [Google Scholar] [CrossRef]
  71. Chang, H.-C.; Lin, S.-C.; Kuo, C.-C.; Yu, H.-P.; Chang, H.-C.; Lin, S.-C.; Kuo, C.-C.; Yu, H.-P. Cloud Monitoring for Solar Plants with Support Vector Machine Based Fault Detection System, Cloud Monitoring for Solar Plants with Support Vector Machine Based Fault Detection System. Math. Probl. Eng. 2014, 2014, e564517. [Google Scholar] [CrossRef]
  72. Cheng, H.-Y.; Yu, C.-C. Multi-Model solar irradiance prediction based on automatic cloud classification. Energy 2015, 91, 579–587. [Google Scholar] [CrossRef]
  73. Ghosh, A.; Pal, N.R.; Das, J. A fuzzy rule based approach to cloud cover estimation. Remote Sens. Environ. 2006, 100, 531–549. [Google Scholar] [CrossRef]
  74. D’Andrea, E.; Lazzerini, B. A hierarchical approach to multi-class fuzzy classifiers. Expert Syst. Appl. 2013, 40, 3828–3840. [Google Scholar] [CrossRef]
  75. Pringle, J.; Stretch, D.D.; Bárdossy, A. Automated classification of the atmospheric circulation patterns that drive regional wave climates. Nat. Hazards Earth Syst. Sci. 2014, 14, 2145–2155. [Google Scholar] [CrossRef]
  76. Bishop, C. Pattern Recognition and Machine Learning, 1st ed.; Springer: New York, NY, USA, 2010. [Google Scholar]
  77. Bishop, C. Improving the Generalization Properties of Radial Basis Function Neural Networks. Neural Comput. 1991, 3, 579–588. [Google Scholar] [CrossRef]
  78. Lee, S.-J.; Hou, C.-L. An ART-based construction of RBF networks. IEEE Trans. Neural Netw. 2002, 13, 1308–1321. [Google Scholar] [PubMed]
  79. Cybenko, G. Approximation by superpositions of a sigmoidal function, Mathematics of control. Signals Syst. 1989, 2, 303–314. [Google Scholar] [CrossRef]
  80. Durbin, R.; Rumelhart, D.E. Product Units: A Computationally Powerful and Biologically Plausible Extension to Backpropagation Networks. Neural Comput. 1989, 1, 133–142. [Google Scholar] [CrossRef]
  81. Buchtala, O.; Klimek, M.; Sick, B. Evolutionary optimization of radial basis function classifiers for data mining applications. IEEE Trans. Syst. Man Cybern. 2005, 35, 928–947. [Google Scholar] [CrossRef]
  82. Yao, X. Evolving artificial neural networks. Proc. IEEE 1999, 87, 1423–1447. [Google Scholar]
  83. Gutiérrez, P.A.; López-Granados, F.; Peña-Barragán, J.M.; Jurado-Expósito, M.; Gómez-Casero, M.T.; Hervás-Martínez, C. Mapping sunflower yield as affected by Ridolfia segetum patches and elevation by applying evolutionary product unit neural networks to remote sensed data. Comput. Electron. Agric. 2008, 60, 122–132. [Google Scholar] [CrossRef]
  84. Hervás-Martínez, C.; Salcedo-Sanz, S.; Gutiérrez, P.A.; Ortiz-García, E.G.; Prieto, L. Evolutionary product unit neural networks for short-term wind speed forecasting in wind farms. Neural Comput. Appl. 2012, 21, 993–1005. [Google Scholar] [CrossRef]
  85. Huang, G.-B.; Zhou, H.; Ding, X.; Zhang, R. Extreme Learning Machine for Regression and Multiclass Classification. IEEE Trans. Syst. Man Cybern. 2012, 42, 513–529. [Google Scholar] [CrossRef] [PubMed]
  86. Boser, B.E.; Guyon, I.M.; Vapnik, V.N. A Training Algorithm for Optimal Margin Classifiers. In Proceedings of the Fifth Annual Workshop on Computational Learning Theory (COLT ’92), Pittsburgh, PA, USA, 27–29 July 1992; Association for Computing Machinery: New York, NY, USA, 1992; pp. 144–152. [Google Scholar]
  87. Cortes, C.; Vapnik, V. Support-vector networks. Mach. Learn. 1995, 20, 273–297. [Google Scholar] [CrossRef]
  88. Salcedo-Sanz, S.; Rojo-Álvarez, J.L.; Martínez-Ramón, M.; Camps-Valls, G. Support vector machines in engineering: An overview. In Wiley Interdisciplinary Reviews: Data Mining and Knowledge Discovery; John Wiley & Sons: Hoboken, NJ, USA, 2014; Volume 4, pp. 234–267. [Google Scholar]
  89. Hsu, C.-W.; Lin, C.-J. A comparison of methods for multiclass support vector machines. IEEE Trans. Neural Netw. 2002, 13, 415–425. [Google Scholar] [PubMed]
  90. Rokach, L.; Maimon, O. Top-Down Induction of Decision Trees Classifiers—A Survey. IEEE Trans. Syst. Man Cybern. 2005, 35, 476–487. [Google Scholar] [CrossRef]
  91. Quinlan, J.R. C4.5: Programs for Machine Learning; Elsevier: Amsterdam, The Netherlands, 2014. [Google Scholar]
  92. Breiman, L.; Friedman, J.; Stone, C.J.; Olshen, R.A. Classification and Regression Trees; Taylor & Francis: London, UK, 1984. [Google Scholar]
  93. Breiman, L. Random Forests. Mach. Learn. 2001, 45, 5–32. [Google Scholar] [CrossRef]
  94. Liaw, A.; Wiener, M. Classification and regression by randomForest. R News 2002, 2, 18–22. [Google Scholar]
  95. Angelov, P.; Zhou, X. Evolving Fuzzy-Rule-Based Classifiers from Data Streams. IEEE Trans. Fuzzy Syst. 2008, 16, 1462–1475. [Google Scholar] [CrossRef]
  96. Hoppner, F.; Klawonn, F. Obtaining interpretable fuzzy models from fuzzy clustering and fuzzy regression. In Proceedings of the Fourth International Conference on Knowledge-Based Intelligent Information Engineering Systems & Allied Technologies, Brighton, UK, 30 August–1 September 2000; Volume 1, pp. 162–165.
  97. Kuncheva, L. How good are fuzzy If-Then classifiers? IEEE Trans. Syst. Man Cybern. 2000, 30, 501–509. [Google Scholar] [CrossRef] [PubMed]
  98. Nauck, D.; Kruse, R. Obtaining interpretable fuzzy classification rules from medical data. Artif. Intell. Med. 1999, 16, 149–169. [Google Scholar] [CrossRef]
  99. Mitra, S.; Hayashi, Y. Neuro-Fuzzy rule generation: Survey in soft computing framework. IEEE Trans. Neural Netw. 2000, 11, 748–768. [Google Scholar] [CrossRef] [PubMed]
  100. Setnes, M.; Babuška, R. Fuzzy relational classifier trained by fuzzy clustering. IEEE Transa. Syst. Man Cybern. 1999, 29, 619–625. [Google Scholar] [CrossRef] [PubMed]
  101. Setnes, M.; Roubos, H. GA-fuzzy modeling and classification: Complexity and performance. IEEE Trans. Fuzzy Syst. 2000, 8, 509–522. [Google Scholar] [CrossRef]
  102. John, G.H.; Langley, P. Estimating Continuous Distributions in Bayesian Classifiers. In Proceedings of the Eleventh Conference on Uncertainty in Artificial Intelligence (UAI ’95), Montreal, QC, Canada, 18–20 August 1995; Morgan Kaufmann Publishers Inc.: San Francisco, CA, USA, 1995; pp. 338–345. [Google Scholar]
  103. Ben-Gal, I. Bayesian Networks. In Encyclopedia of Statistics in Quality and Reliability; John Wiley & Sons, Ltd.: Malden, MA, USA, 2008. [Google Scholar]
  104. Anderson, T. The Theory and Practice of Online Learning; Athabasca University Press: Athabasca, AB, Canada, 2008. [Google Scholar]
  105. Manevitz, L.M.; Yousef, M. One-Class svms for document classification. J. Mach. Learn. Res. 2012, 2, 139–154. [Google Scholar]
  106. Lecun, Y.; Bengio, Y.; Hinton, G.E. Deep Learning. Nature 2015, 521, 436–444. [Google Scholar] [CrossRef] [PubMed]
  107. Tao, Y.; Hongkun, C.; Chuang, Q. Wind power prediction and pattern feature based on deep learning method. In Proceedings of the IEEE PES Asia-Pacific Power and Energy Engineering Conference (APPEEC), Hong Kong, China, 7–10 December 2014; IEEE: New York, NY, USA, 2014. [Google Scholar]
  108. Dalto, M.; Matusko, J.; Vasak, M. Deep neural networks for ultra-short-term wind forecasting. In Proceedings of the IEEE International Conference onIndustrial Technology (ICIT), Seville, Spain, 17–19 March 2015; IEEE: New York, NY, USA, 2015; pp. 1657–1663. [Google Scholar]
  109. Pyle, D. Data Preparation for Data Mining, 1st ed.; Morgan Kaufmann Publishers Inc.: New York, NY, USA, 1999. [Google Scholar]
  110. Guyon, I.; Elisseeff, A. An Introduction to Variable and Feature Selection. J. Mach. Learn. Res. 2003, 3, 1157–1182. [Google Scholar]
  111. Neugebauer, J.; Kramer, O.; Sonnenschein, M. Classification Cascades of Overlapping Feature Ensembles for Energy Time Series Data. In Third Workshop on Data Analytics for Renewable Energy Integration; Springer: Berlin, Germany, 2015; pp. 76–93. [Google Scholar]
  112. Guarrancino, M.R.; Irpino, A.; Radziukyniene, N.; Verde, R. Supervised classification of distributed data streams for smart grids. Energy Syst. 2012, 3, 95–108. [Google Scholar] [CrossRef]
  113. Neugebauer, J.; Kramer, O.; Sonnenschein, M. Improving Cascade Classifier Precision by Instance Selection and Outlier Generation. In Proceedings of the 8th International Conference on Agents and Artificial Intelligence, Rome, Italy, 24–26 February 2016; Volume 2, pp. 96–104.
  114. Sun, Y.; Wong, A.K.C.; Kamel, M.S. Classification of imbalanced data: A review. Int. J. Pattern Recognit. Artif. Intell. 2009, 23, 687–719. [Google Scholar] [CrossRef]
  115. Sun, Y.; Kamel, M.S.; Wong, A.K.C.; Wang, Y. Cost-Sensitive boosting for classification of imbalanced data. Pattern Recognit. 2007, 40, 3358–3378. [Google Scholar] [CrossRef]
  116. Chawla, N.V.; Bowyer, K.W.; Hall, L.O.; Kegelmeyer, W.P. SMOTE: Synthetic Minority Over-Sampling Technique. J. Artif. Int. Res. 2002, 16, 321–357. [Google Scholar]
  117. Binitha, S.; Sathya, S.S. A survey of bio inspired optimization algorithms. Int. J. Soft Comput. Eng. 2012, 2, 137–151. [Google Scholar]
  118. Janik, P.; Lobos, T. Automated classification of power-quality disturbances using SVM and RBF networks. IEEE Trans. Power Deliv. 2006, 21, 1663–1669. [Google Scholar] [CrossRef]
  119. Cerqueira, A.S.; Ferreira, D.D.; Ribeiro, M.V.; Duque, C.A. Power quality events recognition using a SVM-based method. Electr. Power Syst. Res. 2008, 78, 1546–1552. [Google Scholar] [CrossRef]
  120. Erişti, H.; Demir, Y. A new algorithm for automatic classification of power quality events based on wavelet transform and SVM. Expert Syst. Appl. 2010, 37, 4094–4102. [Google Scholar]
  121. Biswal, B.; Biswal, M.K.; Dash, P.K.; Mishra, S. Power quality event characterization using support vector machine and optimization using advanced immune algorithm. Neurocomputing 2013, 103, 75–86. [Google Scholar] [CrossRef]
  122. Shah, A.M.; Bhalja, B.R. Discrimination between Internal Faults and Other Disturbances in Transformer Using the Support Vector Machine-Based Protection Scheme. IEEE Trans. Power Deliv. 2013, 28, 1508–1515. [Google Scholar] [CrossRef]
  123. Arikan, C.; Ozdemir, M. Classification of Power Quality Disturbances at Power System Frequency and out of Power System Frequency Using Support Vector Machines. Prz. Elektrotech. 2013, 89, 284–291. [Google Scholar]
  124. Hart, G.W. Nonintrusive appliance load monitoring. Proc. IEEE 1992, 80, 1870–1891. [Google Scholar] [CrossRef]
  125. Zeifman, M.; Roth, K. Nonintrusive appliance load monitoring: Review and outlook. IEEE Trans. Consum. Electron. 2011, 57, 76–84. [Google Scholar] [CrossRef]
  126. Yu, L.; Li, H.; Feng, X.; Duan, J. Nonintrusive appliance load monitoring for smart homes: Recent advances and future issues. IEEE Instrum. Meas. Mag. 2016, 19, 56–62. [Google Scholar] [CrossRef]
Figure 1. Publication trends for different areas of research. Each point in the figure represents the number of research publications per year that include the term in the article title, abstract or keywords (source: Scopus).
Energies 09 00607 g001
Figure 2. Publication trends for different methods in ML. Each point in the figure represents the number of research publications per year that include the term in the article title, abstract or keywords (source: Scopus).
Energies 09 00607 g002
Figure 3. Architecture of an ANN for classification problems with M basis functions and Q classes.
Energies 09 00607 g003
Table 1. Confusion matrix to evaluate the output of a classifier g using a dataset categorized into Q classes.
Predicted Class
1lQ
1 n 11 n 1 l n 1 Q n 1
Real Classq n q 1 n q l n q Q n q
Q n Q 1 n Q l n Q Q n Q
n 1 n l n Q N
Table 2. Summary of the main references analyzed, grouped by application field, problem type and methodologies considered (I).
ReferenceYearApplication FieldProblemSpecific Methodology Used
[3]2015Sea waveOrdinal classificationSVM, ANN, LR
[4]2015SolarClassificationSVM
[5]2009Power disturbanceClassificationSVM, wavelets
[10]2015WindOptimizationBio-inspired, meta-heuristics
[14]2015WindClassificationFuzzy SVM
[15]2011WindClassificationDT, SOM
[16]2015WindClassificationSVM, k-NN, fuzzy, ANN
[17]2010SolarClassificationSemi-supervised SVM
[20]2013WindOrdinal classificationSVM, DT, LR, HMM
[30]2014WindClassificationSVM, LR, RF, rotation forest
[31]2011WindClassificationANN, LR, DT, RF
[32]2013WindClassificationk-NN, RBF, DT
[33]2011WindClassification, regressionBN
[34]2014WindClassification, regressionHeuristic methodology: WPPT
[35]2011WindClassificationBagging, ripper, rotation forest, RF, k-NN
[36]2013WindClassificationANFIS, ANN
[37]2012WindClassificationSVM
[38]2015WindClassificationANN, SVM
[39]2015WindClassificationPNN
[40]2015WindClassificationDT, BN, RF
[41]2015WindClassification, clusteringAuDyC
[42]2016WindClassification, clusteringAuDyC
[43]2010Power disturbanceClassificationHMM, SVM, ANN
[44]2015Power disturbanceClassificationSVM, NN, fuzzy, neuro-fuzzy, wavelets, GA
[45]2015Power disturbanceClassificationSVM, k-NN, ANN, fuzzy, wavelets
[46]2002Power disturbanceClassificationRule-based classifiers, wavelets, HMM
[47]2004Power disturbanceClassificationPNN
[48]2006Power disturbanceClassificationANN, RBF, SVM
[49]2007Power disturbanceClassificationANN, wavelets
[50]2012Power disturbanceClassificationPNN
[51]2014Power disturbanceClassificationANN
Table 3. Summary of the main references analyzed, grouped by application field, problem type and methodologies considered (II).
Ref.YearApplication FieldProblemSpecific Methodology Used
[52]2015Power disturbanceClassificationSVM
[53]2013Power disturbanceClassificationDT, ANN, neuro-fuzzy, SVM
[54]2014Power disturbanceClassificationDT, SVM
[55]2014Power disturbanceClassificationDT
[56]2012Power disturbanceClassificationDT, DE
[57]2004Power disturbanceClassificationFuzzy expert, ANN
[58]2010Power disturbanceClassificationFuzzy classifiers
[59]2010Power disturbanceClassificationGFS
[48]2006Appliance load monitoringClassificationANN
[60]2009Appliance load monitoringClassificationk-NN, DTs, naive Bayes
[61]2010Appliance load monitoringClassificationk-NN, DTs, naive Bayes
[62,63]2010Appliance load monitoringClassificationLR, ANN
[64]2012Appliance load monitoringClassificationSVM
[65]2013SolarClassification, regressionSVM, ANN, ANFIS, wavelet, GA
[66]2008SolarClassification, regressionANN, fuzzy systems, meta-heuristics
[67]2004SolarClassificationPNN
[68]2006SolarClassificationPNN
[69]2009SolarClassificationPNN, SOM, SVM
[70]2004SolarClassificationSVM
[71]2014SolarClassificationSVM
[72]2015SolarClassificationSVM
[73]2006SolarClassificationFuzzy rules
[74]2013SolarClassificationFuzzy classifiers
[75]2014SolarClassificationFuzzy rules

