Article

Coordination Control of a Novel Wind Farm Configuration Including a Hydrogen Storage System and a Gas Turbine

1
Department of Energy Technology, Aalborg University, Aalborg East DK-9220, Denmark
2
State Key Laboratory of Power Transmission Equipment & System Security and New Technology, School of Electrical Engineering, Chongqing University, Chongqing 400044, China
*
Author to whom correspondence should be addressed.
Energies 2016, 9(7), 535; https://doi.org/10.3390/en9070535
Submission received: 16 April 2016 / Revised: 13 June 2016 / Accepted: 29 June 2016 / Published: 13 July 2016

Abstract

:
This paper proposes a novel configuration that combines wind turbines, an electrolyzer, and a gas turbine with the corresponding generator. A control strategy for this configuration is also proposed. The purpose of this configuration and its control strategy is to make the wind farm work like a conventional power plant from a grid’s point of view. The final proposed configuration works properly with the proposed control strategy, the three times per revolution (3p) oscillation frequency is removed and the output power fluctuations caused by wind fluctuation are compensated. The final power output of the proposed configuration is constant like that of a conventional power plant, and it can change according to the different requirements of the transmission system operator.

1. Introduction

With the development of the world economy, demands for energy continue to rise, but fossil energy resources are decreasing. This conflict between energy demand and resource availability has led people to seek possible solutions and wind power generation plays an important role in solving the problem. Despite having been introduced a long time ago, wind power generation still has a lot of drawbacks. One of these drawbacks consists in the uncertainty of the power production caused by the fluctuation of the wind. The implementation of energy storage systems for wind farms has solved this problem to some degree. In [1], research on a flywheel energy storage system for a wind farm was reported. Reference [2] described work on a battery-based energy storage system. Some wind farms use compressed air energy storage (CAES) as energy storage system. The CAES compresses air using the excess power production and releases the energy when necessary. The CAES process is analyzed in [3]. Reference [4] studied the dynamic performance of a CAES plant. When a wind farm is combined with an energy storage system, how to make the storage system cooperate effectively with the wind farm becomes a very important task. Control strategies to make the energy storage system and wind farm operate in a coordinated way are proposed in [5,6]. The appropriate size of the energy storage system for a wind farm is discussed in [7,8,9].
Wind power generation is not stable due to the fluctuation of the wind speed. The wind shear effect and tower shadow effect also contribute to the oscillation of power production by wind turbines [10]. The power production fluctuation could further cause voltage fluctuations at the point of common connection (PCC) [11], and one of the possible ways to mitigate voltage fluctuations is proposed in [12].
Hydrogen storage systems have recently drawn considerable attention and show a bright future due to their low emissions [13]. Nowadays the most widely used method applied in industry to produce hydrogen is to electrolyze water. The chemical products of the water electrolysis process are hydrogen and oxygen. Among the different kinds of electrolyzers, the proton exchange membrane (PEM) electrolyzer is seen as the best choice for industry because of its high efficiency and no use of heavy metal ions [14]. A study that combines a photovoltaic system with a PEM electrolyzer was reported in [14]. Usually, the PEM electrolyzer model is simplified to Faraday’s law of electrolysis when the research is in the electrical area. Reference [14] proposed a detailed PEM electrolyzer model. A PEM model that can be used for electrical analysis is also proposed in [15]. Reference [16] proposed a combination of a wind farm and a hydrogen generation system interconnected with a high-voltage DC system. A combination of wind farm, electrolyzer and fuel cell is presented in [17].
Gas turbines have been used for a long time to generate electricity. A gas turbine generation system can respond very fast compared with a conventional power plant, thus, gas turbine driven generators are usually used for peak demand regulation in power systems. Reference [18] reported research on testing gas turbines. Reference [19] proposed a twin-shaft gas turbine model. Reference [20] proposed a technical assessment of a compressed air energy storage system, which combined wind farms with a gas turbine. Most gas turbines applied in industry nowadays use oil as fuel, but some gas turbines can use gas as fuel [21]. Hydrogen gas turbines are drawing more and more attention recently due to their high heat value and the low emissions of hydrogen, and some hydrogen gas turbine prototypes have been developed.
However, with the configurations developed until now, wind farms still cannot work like a conventional power plant. First of all, the output power of the wind farm fluctuates due to the fluctuation of the wind. Secondly, for an induction generator, during the start-up process, a certain current is required for excitation, thus, black starting may not be possible for some wind farms.
This paper proposes a configuration that combines a wind farm with a PEM electrolyzer and a hydrogen gas turbine. A control strategy to coordinate the wind farm, PEM electrolyzer and the gas turbine is also proposed in this paper, so that from the point of view of the grid, the combined system proposed by this paper could function like a conventional power plant.
The objective for this paper is to develop the new configuration and its control strategy mentioned above, so that a wind farm can work like a conventional power plant from the grid’s point of view. This paper is arranged as follows: in Section 2, the proposed configuration is described and the modeling is presented. Based on the model, Section 3 proposes a control strategy and coordination method. Section 4 discusses the behavior of the configuration and the control strategy under two different conditions. Finally, the conclusion and the future work are presented in Section 5.

2. Proposed Configuration and Modeling

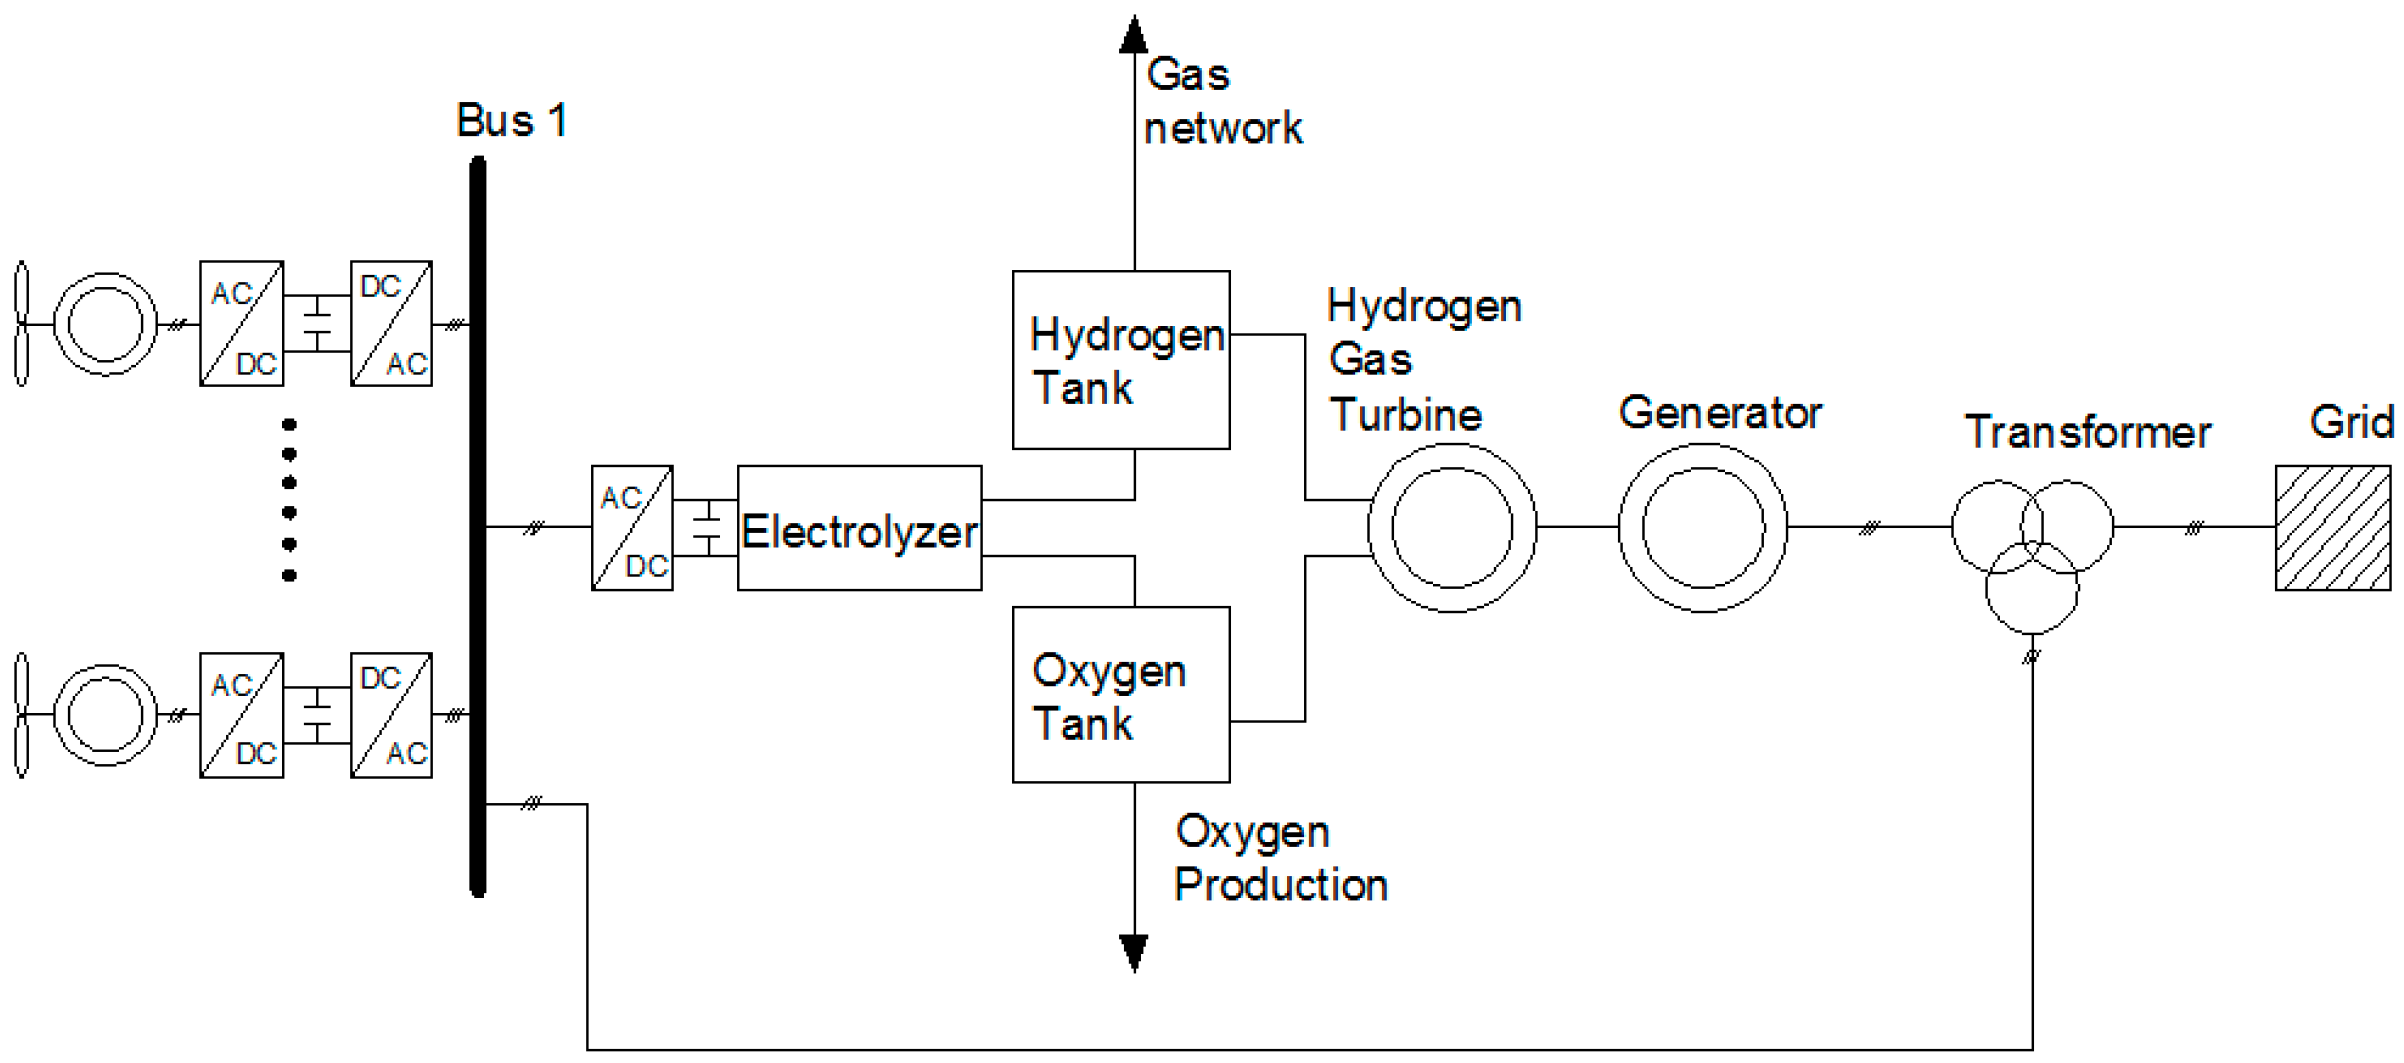
2.1. Description of he Proposed Configuration

The system applied in this paper is shown in Figure 1. The system is made up of a wind farm, an electrolyzer and corresponding tanks, a gas turbine and corresponding generator and a transformer.
The wind turbines are connected to the Bus 1 and then connected directly to the grid through a transformer. The wind farm is responsible for capturing the wind power and converting it into electrical energy. The output power of the wind farm fluctuates due to the wind speed variation, wind shear and tower shadow effects. The electrolyzer is also connected to the Bus 1 through a rectifier. A band pass (BP) filter is designed to pick out the 3p oscillating power signal that caused by wind shear and tower shadow effect, and then send it to the rectifier as a power reference. The rectifier converts the oscillating AC power into DC power. In this way, according to the law of conservation of energy, once the oscillating component is picked out, the output power that is sent into grid directly from wind farm is smoothed. The PEM electrolyzer converts the oscillating power into hydrogen and oxygen, and stores them in the tanks for later use.
The fluctuation of the output power caused by the fluctuation of the wind is then compensated by the gas turbine driven generator or by the PEM electrolyzer according to the needs of the transmission system operator (TSO). It should be mentioned that the hydrogen tank is connected to a gas network, and the oxygen tank could be directly connected to an industrial oxygen product chain, so the wind farm could also supply certain gases to a gas supply network when the wind energy production exceeds the requirements of the system. This process could be Sabatier reaction, which is not a concern of this paper, thus, the detailed model of this reaction and related devices are not included in this work.

2.2. Modeling of the Wind Farm

The wind farm model in this paper consists of a wind source model and a wind turbine model. The performance of the wind farm is highly dependent on the features of the available wind. This is because the inertia of the wind turbine is relatively small compared with conventional turbines, so the performance of the wind turbine is highly dependent on the wind variation, especially when the dynamic performance is the main concern of the study. Thus, a precise wind model is necessary for the objectives of this paper. The simulation of wind stream modeling is very slow, and unnecessarily complicated for the main purpose of this paper, thus, a wind model is built with its energy and fluctuations characteristics.
The wind model is built according to 3p torque oscillations due to wind shear and tower shadow, as described in [10]. The wind feeding into the wind turbine model has three components: changing wind speed at hub height ( v e q 0 ), the wind speed component influenced by tower shadow ( v e q t s ), and the wind speed component influenced by wind shear component ( v e q w s ). All three of these components together form the wind speed model, which is described by Equations (1) to (5):
v e q = v e q 0 + v e q w s + v e q t s
v e q 0 = v H
v e q w s = v H [ α ( α 1 ) 8 ( R H ) 2 + α ( α 1 ) ( α 2 ) 60 ( R H ) 3 cos 3 β ]
v e q t s = m v H 3 R 2 b = 1 3 [ a 2 sin 2 β b ln ( R 2 sin 2 β b x 2 + 1 ) 2 a 2 R 2 R 2 sin 2 β b + x 2 ]
m = 1 + α ( α 1 ) 8 ( R H ) 2
in which v H is the wind speed at hub height (m/s), α is the empirical wind shear exponent, H is the elevation of rotor hub (m), β is the azimuthal angle of any blade of the wind turbine (degrees), β b is the azimuthal angle of individual blades of the wind turbine (degrees), a is the tower radius (m), R is the distance from the blade tip to the hub center and x is the distance from the blade origin to the tower midline (m).
Besides the wind speed model, the wind farm modeling also consists of the wind turbine model, the mechanical model, drive train model, generator model, PWM voltage source converters, transformer, control system and supervisory system.
The wind turbine model in this paper is built in consideration of energy transfer. Because the energy generated by a wind turbine depends on the wind speed, the wind turbine model should have the ability to represent the relation between wind speed and the energy generated by the wind turbine. To simplify the model, the wind turbine structures which have no contribution to the energy transfer concern, such as tower, shield, and heat dissipation structure, are neglected. The detailed pulse width modulation (PWM) converter in this wind turbine is also neglected because the PWM model needs a very small simulation step, which need a very long time to perform the simulation. An average model based on the law of energy conservation is built to replace the detailed PWM model. The inertia of the wind turbine should also be taken into consideration when the dynamic performance is the main concern of this paper. The inertia of the wind turbine is influenced by the rotational speed of the wind turbine, which is shown by Equation (6):
T m T e J = d ω w d t
in which T m is the mechanical torque supplied by turbine, T e is the electromagnetic torque of the generator, J is the inertia of the turbine and the inertia of generator and ω w is the rotational speed of the wind turbine.
The energy captured by the wind turbine can be expressed as:
P = 1 2 ρ A v 3 C p
where P is the power captured by the wind turbine, ρ is the density of the air, A is the area swept by the blades, v is the wind speed, and C p is the efficiency of the power coefficient.
The power production of the wind turbine model can be calculated by Equation (7) if the energy losses are neglected. The conversion of wind energy into mechanical energy, which involves the aerodynamic action of the blade, is modeled as a black box since the main concern of this paper is the overall power conversion. The details of the wind turbine model can be found in [22,23,24], and are not presented here in consideration of the length of the paper.
The control system of the wind turbine is built based on the maximum power point tracking (MPPT) control method. For variable-speed wind turbines with back-to-back converter, the electromagnetic torque of the generator could be controlled, so that the wind turbine has the ability to track the optimal tip speed ratio which can maximize the power coefficient C p . This means the energy conversion is maximized. All the wind turbine models in this paper are applied with the MPPT control method.

2.3. Modeling of Electrolyzer

Usually, when an electrolyzer is involved in electrical studies, the model of electrolyzer is represented by Faraday's law of electrolysis, which is expressed by Equation (8):
M = K I t = K Q
in which M is the mass of the production, K is electrochemical equivalent, t is the time used during the process and Q is the quantity of electricity.
The PEM electrolyzer in this paper is built in a detailed way to describe its dynamic characteristics, because the energy transfer is of special concern. The electrolyzer proposed in [14,25,26] is applied in this paper. The models include a positive pole model, negative pole model, proton exchange membrane, voltage model and storage model. Some parameters of the electrolyzer cells are from reference [27].
The negative pole model calculates the production of hydrogen according to the current through the electrolyzer. The corresponding half-reaction equation is:
4 H + + 4 e 2 H 2
The dynamic equation of the negative pole is:
{ N H 2 = ( F H 2 c l F H 2 c o + H 2 g )   d t N H 2 O c = ( F H 2 O c i F H 2 O c o + F H 2 O e o d + F H 2 O d ) d t
in which N H 2 is the quantity of hydrogen, F H 2 c l is the hydrogen input mole velocity at the negative pole, which is zero due to the absence of hydrogen input, F H 2 c o   is the hydrogen output mole velocity at the negative pole, H 2 g is the hydrogen production in mole velocity, N H 2 O c is the quantity of water at the negative pole, F H 2 O c i is the input mole velocity of water at the negative pole, F H 2 O c o is the output mole velocity of water at the negative pole, F H 2 O e o d is the electro-endosmosis velocity of water, and F H 2 O d is the diffusion velocity of water.
According to the Faraday’s laws of electrolysis, the production of hydrogen is:
H 2 g = n I 2 F η
where n is the number of electrolyzer capsules that are connected in series, I is the current flow through the series electrolyzer, F is Faraday’s constant and η is the efficiency of the electrolyzer, which is usually greater than 99%.
Then the pressure of hydrogen, steam, and total pressure of the negative pole are calculated to describe the flow at the negative pole. The mole velocity of hydrogen is calculated as an output from the negative pole to the hydrogen tank. The water vapor pressure which further influences the water flow and the membrane exchange is also calculated. Due to length limitations of this paper, the corresponding detailed equation and model will not be presented here. The model of positive pole is similar to that of the negative pole, and will not be presented here for sake of brevity.
The proton exchange membrane model is mainly used to study the water transmission phenomenon. The water transmission caused by the electro-endosmosis phenomenon can be described as:
{ F H 2 O e o d = n d i F M H 2 O A n n d = 0.0029 λ m 2 + 0.005 λ m 3.4 * 10 19 λ m = λ a 2 + λ c 2
in which M H 2 O is the molar mass of water, A is the area of the electrolytic cell, n d is the electric traction coefficient and λ a and λ c are the water contents for the positive pole and negative pole. They can be calculated as:
{ λ = 0.43 + 17.81 a 39.85 a 2 + 36 a 3 0 < a 1 λ = 14 + 1.4 ( a 1 ) 1 < a 3
in which:
a = P P 0
where P is the pressure of vapour, and P 0 is the pressure of standard pure vapour which is calculated by the following Goff-Grattch Equation (15):
log 10 e w = 7.90298 ( T s t T 1 ) + 5.02808 log 10 ( T s t T )   1.3816 × 10 7 ( 10 11.344 ( 1 T s t T ) 1 ) + 8.1328 × 10 3 ( 10 3.49149 ( T s t T 1 ) 1 ) + log 10 1013.25
The water transmission caused by diffusion could be described by Fick’s law of diffusion, which is shown as Equation (16):
F H 2 O d = D w C w c C w a t m M H 2 O A n
In Equation (16), t m is the thickness of the membrane, D w could be calculated by the Equations (17) and (18). C w c and C w a are the water concentrations on the membrane surface.
D w = D λ × e 2416 × ( 1 303 1 T e l )
{ D λ = 10 10 λ m < 2 D λ = 10 10 × ( 1 + 2 × ( λ m 2 ) ) 2 λ m < 3 D λ = 10 10 × ( 3 1.67 × ( λ m 3 ) ) 3 λ m < 4.5 D λ = 1.25 × 10 10 λ m 4.5
The voltage applied on the PEM electrolyzer module consists of three parts: the open circuit voltage, the activation polarization voltage and the ohm polarization voltage [14]. The detailed equations will not be presented here due to the length limitations of this paper.
The relation between the current and the total voltage is not linear. The current for the PEM electrolyzer is defined according to the power that needs to be consumed by the PEM electrolyzer. The current voltage relation for the PEM electrolyzer is not linear, so its product, which is the power, will be very complicated to define by equations in Simulink, so in consideration of simulation efficiency, the current for the PEM electrolyzer is determined by a predefined table. This is achieved by running the PEM electrolyzer with different currents, and then getting the voltage and the power of the PEM electrolyzer to form a table, then pegging the current using the power as a reference.

2.4. Modeling of the Gas Turbine and the Corresponding Generator

The gas turbine uses hydrogen from the tank as fuel. The hydrogen is burnt in the gas turbine chamber to produce heat, and further to produce torque. From the point of view of energy conversion, the gas turbine and its corresponding generator convert chemical energy into electrical energy. Therefore, the amount of hydrogen required depends on the power that needs to be compensated. i.e., the output electric power reference is converted into a quantity of hydrogen requirement then fed into the gas turbine. This process takes energy losses during the power conversion into consideration.
The gas turbine is used to compensate the insufficient output power of the wind farm, so the gas turbine responses should take inertia into consideration because the dynamic performance is the main concern of this paper. When the gas turbine is combined with the generator, the drive train model needs to be taken into consideration due to the influence the model has on the inertia, while other structures like the shield, blade and heat dispassion system of the gas turbine are neglected.
The gas turbine takes the hydrogen from the tank and transforms the chemical energy into torque. This process could be expressed by the following equation:
T t = P ω = n × Δ H ω
in which T t is the torque produced by gas turbine, n is the quantity of hydrogen (in moles), Δ H is the heat value of hydrogen and ω is the rotation speed of the gas turbine
The torque obtained by the gas turbine is used to drive a generator through a train model. The drive train model, takes the inertia of both the generator and gas turbine into consideration due to the fact their inertia are considerable. The connecting shaft is modeled as a spring and a damper [28]. The equations that describe the model is shown as the following equation:
J t d ω t d t = T t K s θ D s ( ω t ω g )
J g d ω g d t = K s θ D s ( ω t ω g ) T e
d θ dt = ω t ω g
in which T t is the torque of the gas turbine, T e is the electrical torque of the generator, J t is the inertia of the gas turbine (kg∙m2), J g is the inertia of the generator (kg∙m2), K s is stiffness coefficient of the shaft (kg∙m2∙s−2), D s is damping coefficient of the shaft (kg∙m2∙s−1), ω t is the angular speed of the gas turbine (rad/s), ω g is the angular speed of the generator (rad/s) and θ is the angular displacement between the two ends of the shaft (rad).
The Matlab/Simulink software library provides the generator model. The generator model with detailed description of nominal power, line-to-line voltage, inertia, frequency, internal impedance and pole pairs is applied according to [19,20]. The capacity of the gas turbine driven generator is decided according to [7,8,9] and the concern of the simulation performance. The switches and protection of the generator are neglected due to the fact the main concern of this paper is the energy conversion.

3. Proposed Coordination Control Method

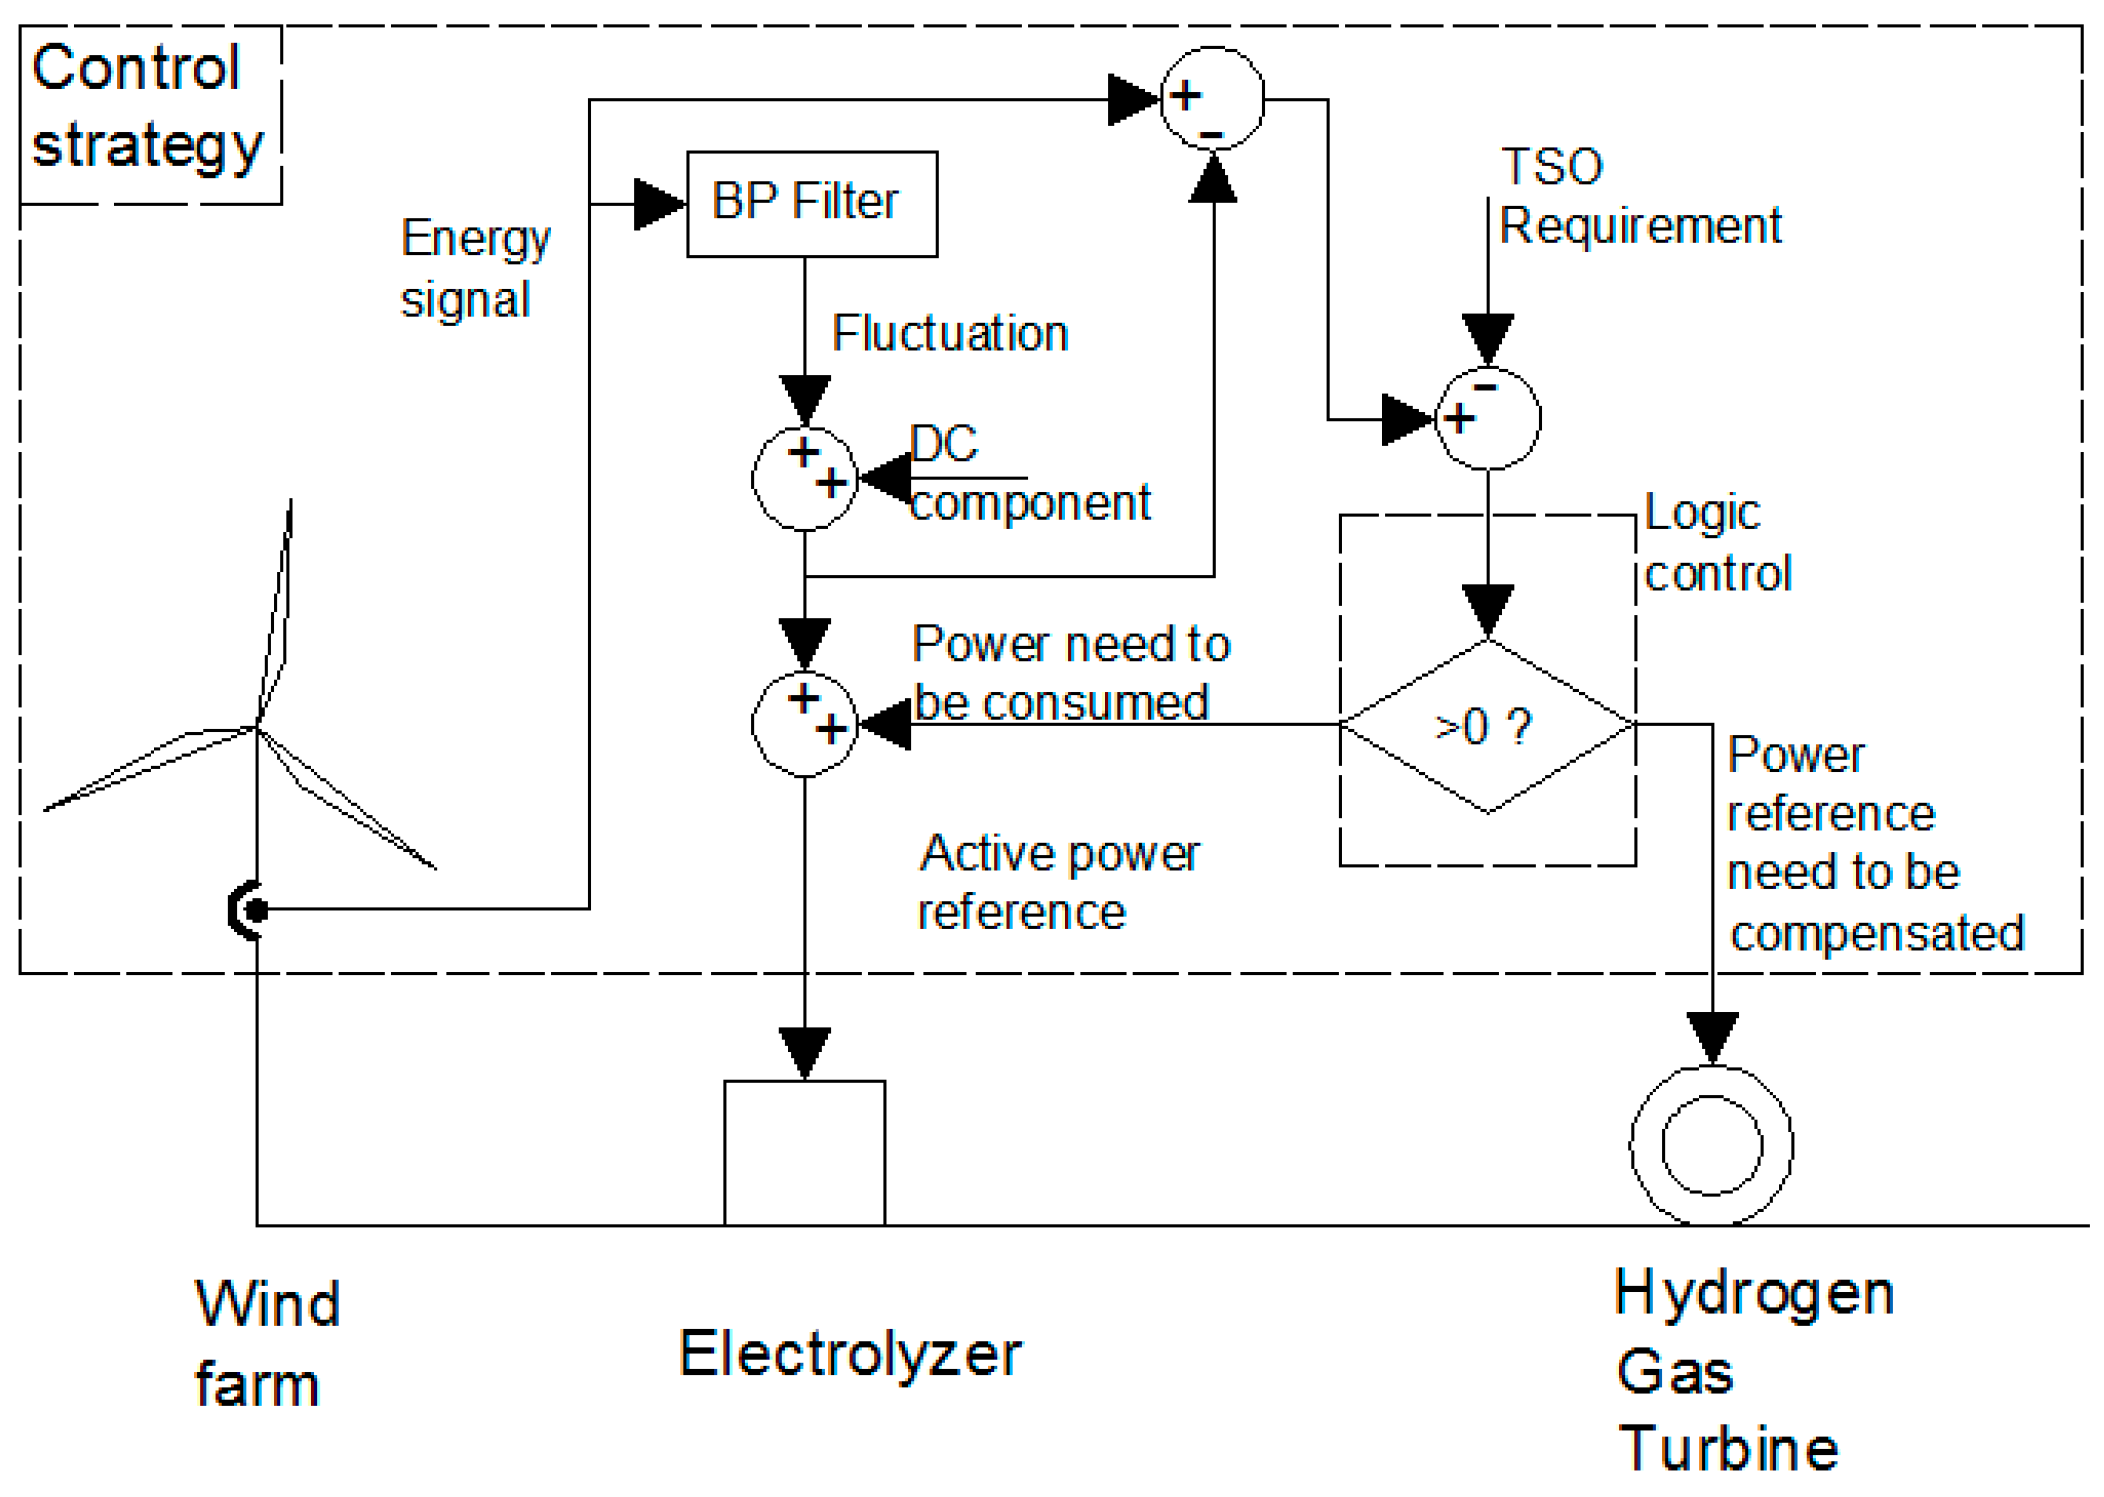
3.1. Control Method for the Whole System

The control strategy in this paper is to coordinate the wind farm, PEM electrolyzer and the gas turbine driven generator, so that the output characteristics of the whole system are constant like those of a conventional power plant and can follow the order given by TSO.
The output power of the wind farm has 3p oscillation frequency. The output power drop caused by the 3p oscillation frequency is not concerned with the power compensation, thus, to compare the wind farm output power with the TSO order, the 3p oscillation of the wind farm output should be eliminated first. The 3p oscillation component in this output power is picked out and sent to the PEM electrolyzer by a rectifier. This is realized by sending the output power signal into the BP filter, where the 3p fluctuating component is picked out and sent into the rectifier connected to the PEM electrolyzer as an active power reference, and the rectifier converts the fluctuating power into DC electrical energy for the PEM electrolyzer, so that according to the law of conservation of energy, once the fluctuating component is picked out, the remaining power is mitigated. Then, this mitigated power is measured and used for the further power coordination control. It should be pointed out that the PEM electrolyzer can only consume electrical power, so a DC component is added to the oscillating active power reference signal in order to process the signal below zero, so that the entire fluctuating signal is shifted up to above zero.
The control strategy of the system is shown in Figure 2. The power generated by the wind farm is measured and sent into the BP filter. The output of the BP filter is the fluctuation component. A DC component is added to this fluctuation component. The fluctuation and the DC component are both extracted from the power generated by the wind farm, and sent into PEM electrolyzer together with the excess power. After the fluctuation is taken out, the remaining power is mitigated. The power after the mitigation is compared with the TSO requirement. Then, according to the logic control, the signal is fed into the PEM electrolyzer as excess power reference, or the gas turbine as the power reference which needs to be compensated. The final power reference that is sent to the PEM electrolyzer is the fluctuation plus the DC component plus the excess power. Same as above the power reference that is sent to the gas turbine as power compensation reference is from the logic control. The electrolyzer transforms the electrical energy into hydrogen and oxygen for storage, and then the gas turbine takes the hydrogen and oxygen according to the requirement to drive a generator. The final energy output of the system is the rest of the wind farm energy output, which is the original wind farm energy output minus the fluctuation component and the DC component, plus the energy compensated by the gas turbine.

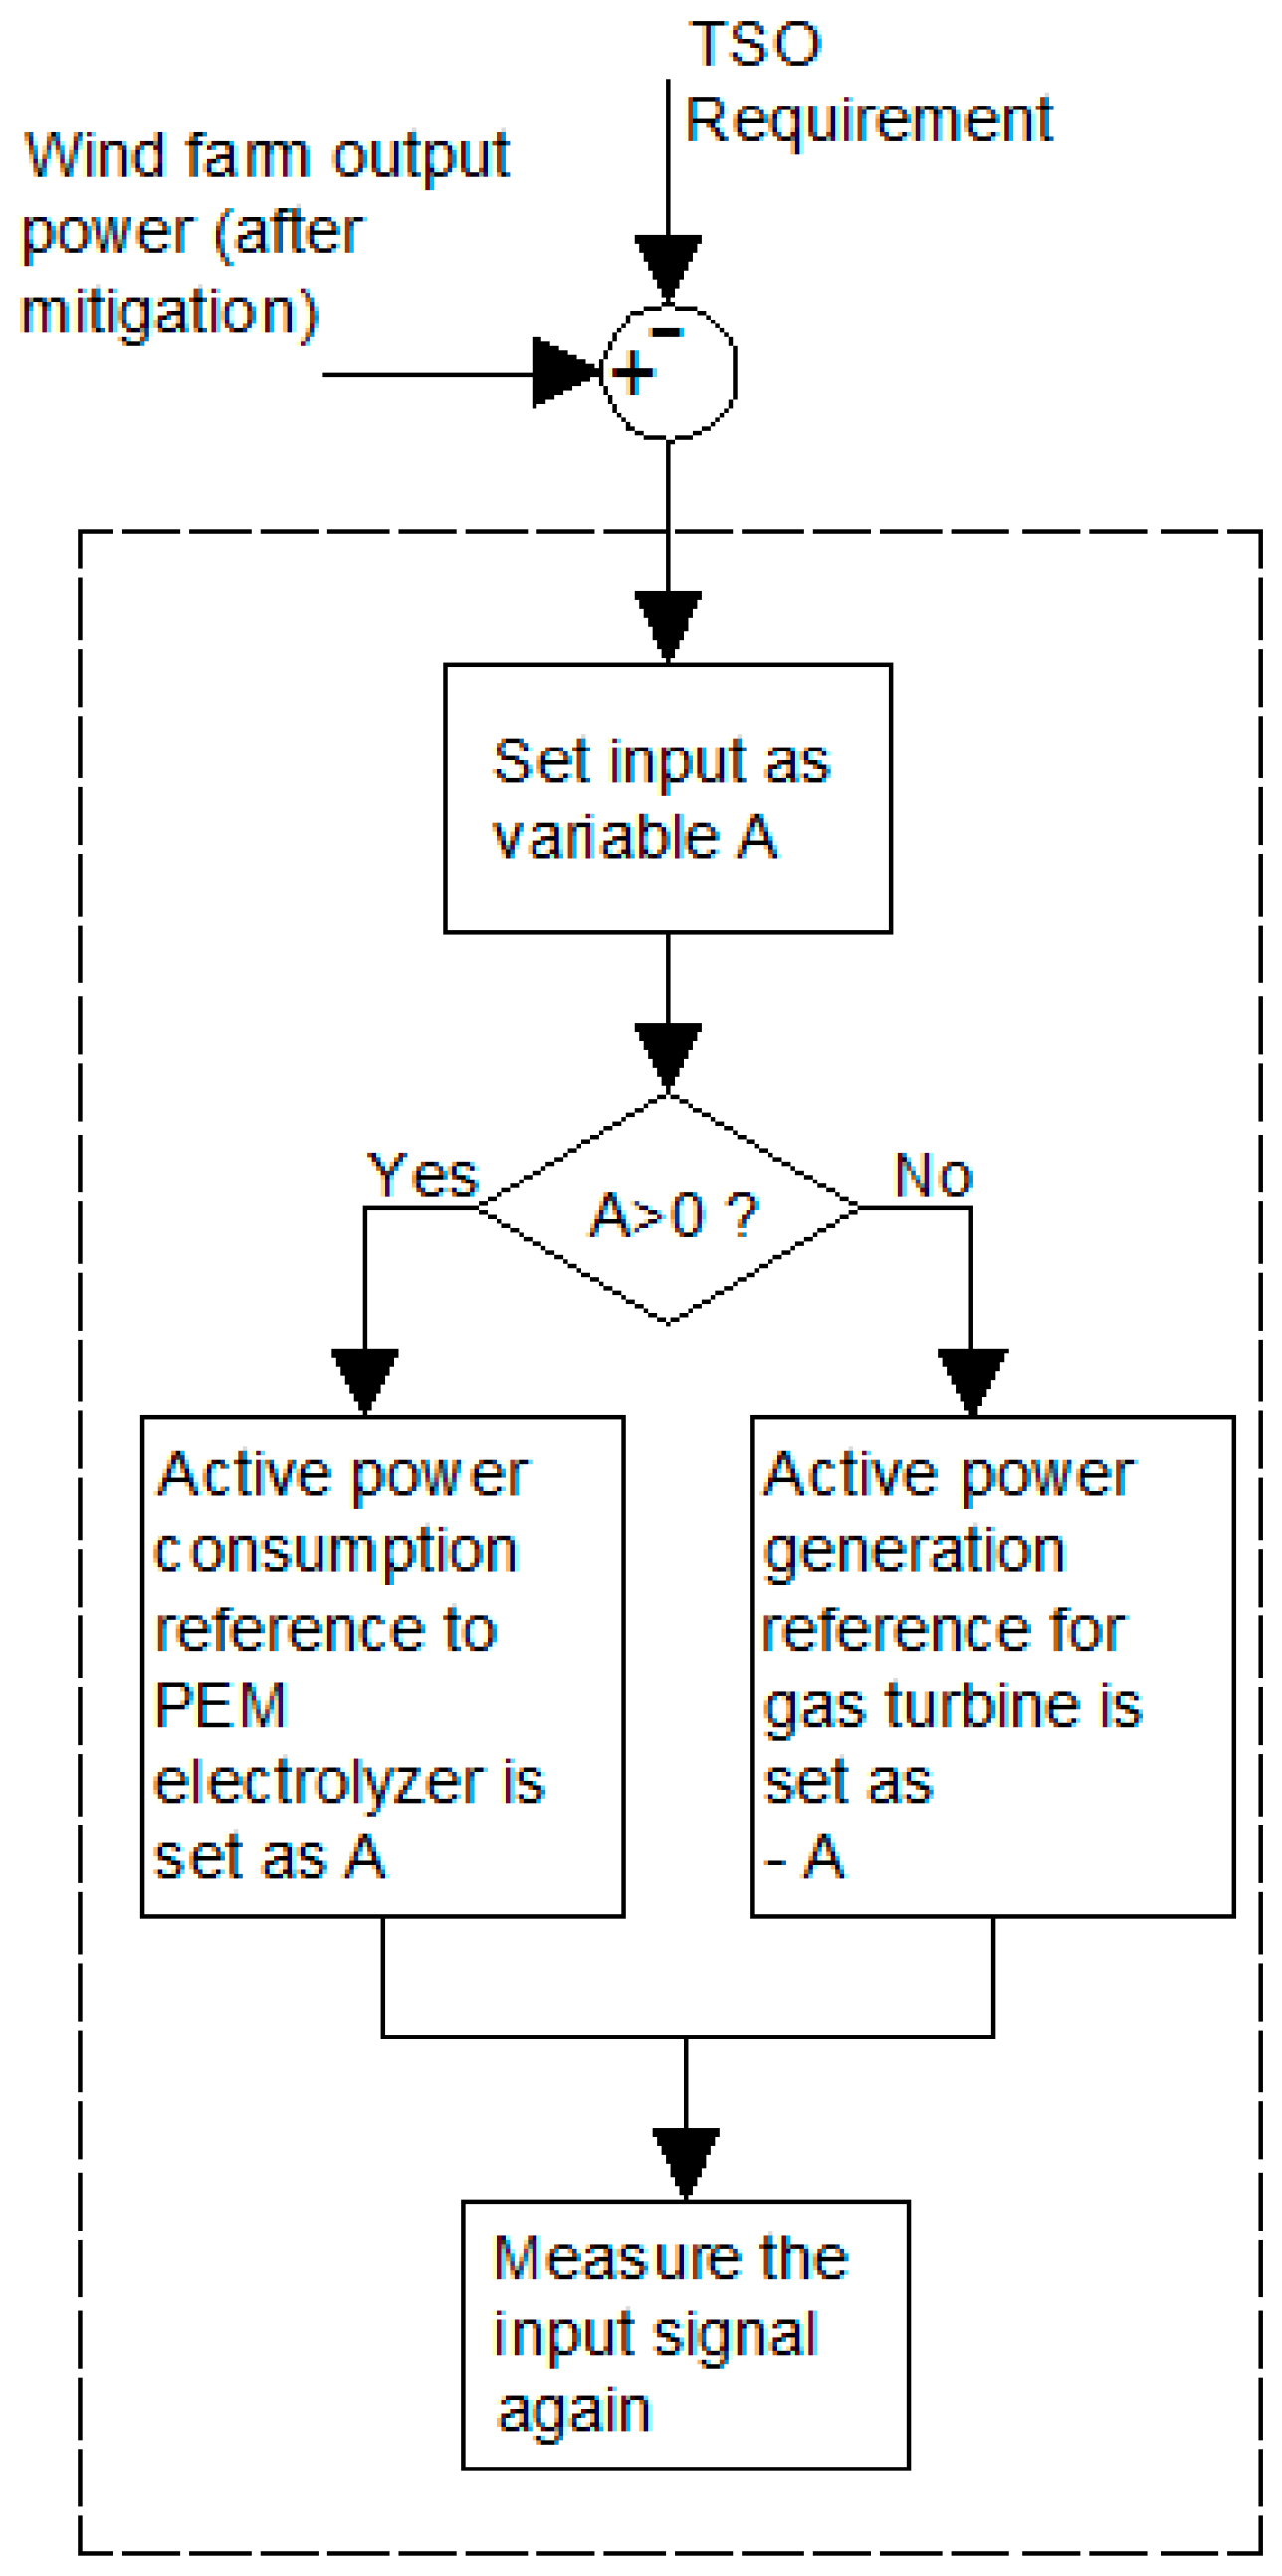
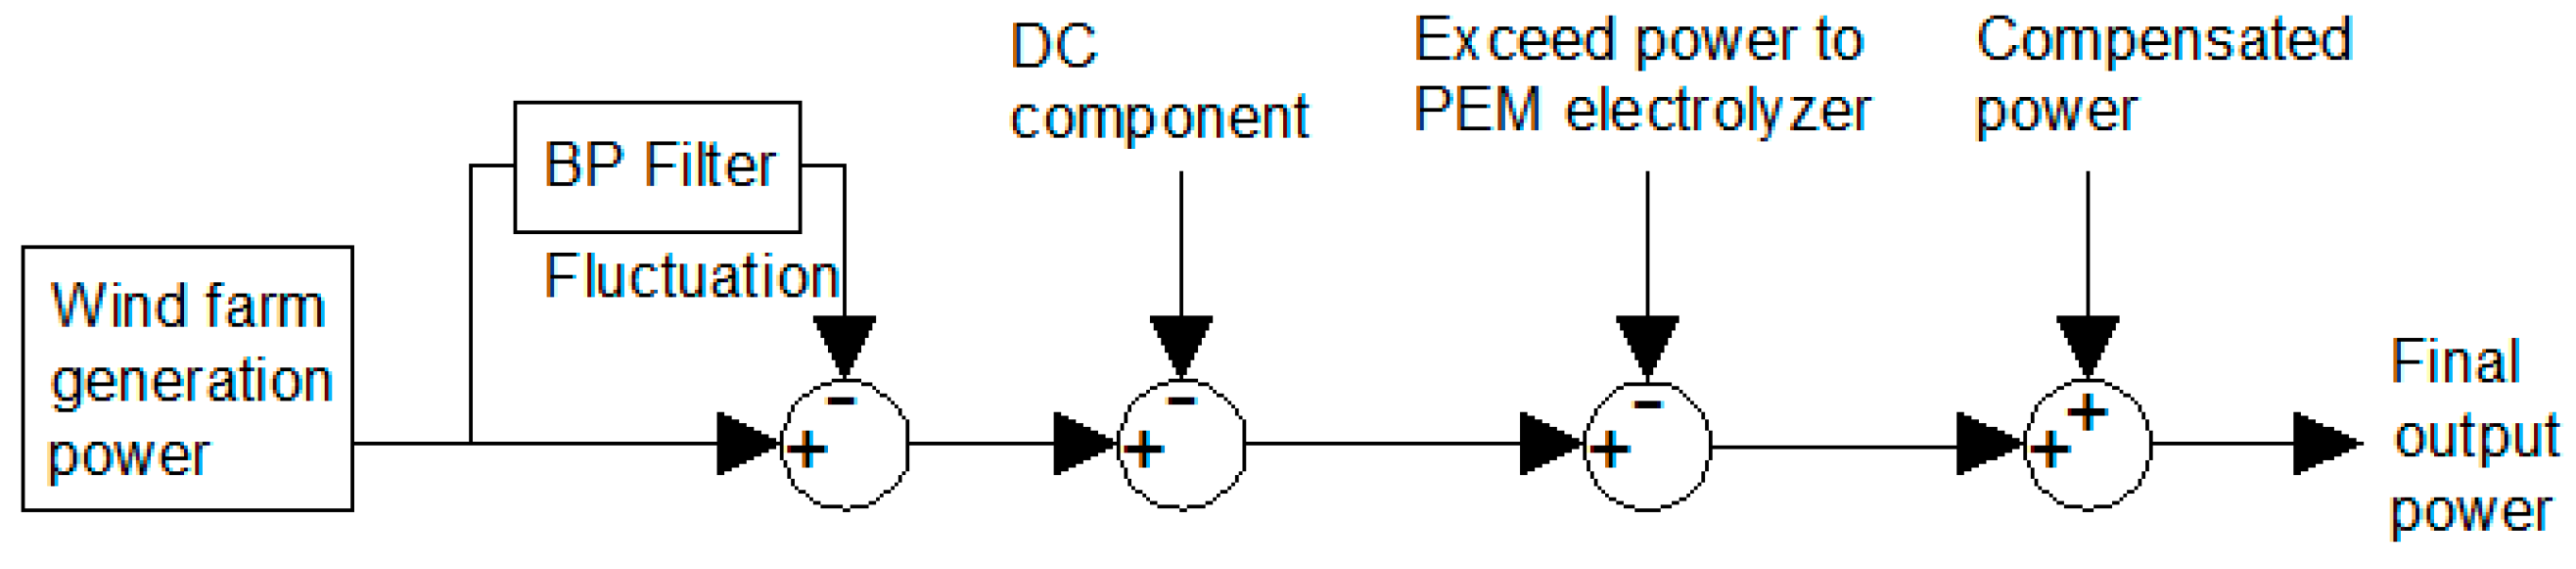
3.2. Coordination Logic Control and Energy Allocation

The diagram of the power coordination logic control is shown in Figure 3. The system compares the output power of the wind farm with the power order given by the TSO. If the power output of the wind farm is greater than the power required from TSO, the exceeding power will be sent into PEM electrolyzer to be consumed. If the power requirement from the TSO is greater than the power output of the wind farm, the insufficient power is compensated by the gas turbine driven generator. The power requirement is converted into an amount of hydrogen and sent to the gas turbine. The hydrogen consumption of the gas turbine is from the storage tank. It should be noticed here that the output power of the wind farm is after the power smoothing process by the BP filter, so that the fluctuation of the output power of the wind farm is only due to the fluctuation of the wind, the oscillation caused by the wind shear and tower shadow effect is removed.
Figure 4 illustrates the energy flow of the system. The power generated by the wind farm is measured, then the fluctuation is extracted from it. A DC component together with the excess power is also extracted from the power generated by the wind farm and sent to the PEM electrolyzer. The power shortfall is compensated by the gas turbine.
The case of the black starting control strategy is one of the extreme control strategies of the system, which is important and should be addressed. When the whole system is in the black starting process, the gas turbine will generate a certain amount of electricity for the wind farm to start. In this case, the connection between the whole system to the grid is cut off, and all the electricity that is generated by the gas turbine is fed to the wind turbines to start them. The hydrogen for the gas turbines could come from the tank or a gas network, depending on the storage of the hydrogen in the tank. After the turbines are started, the wind farm starts to feed energy into the grid, and then the whole system starts to works under normal conditions with the previously proposed strategy.
If the switch between the whole system and the grid is disconnected due to a fault, to prevent the acceleration of the turbines, the gas turbine will be stopped and all the wind power produced by wind turbines is sent into the electrolyzer to be converted into hydrogen for storage.
When the gas turbine is started to compensate the power output, the hydrogen stored in the tank is fed to the gas turbine. If the hydrogen storage cannot meet the requirements anymore, the gas will be taken from a gas network. When the excess wind power is converted into hydrogen for storage, the quantity of the hydrogen in the tank is measured. Once the hydrogen quantity is greater than the chosen limit the excess hydrogen will be sent to the gas network. It is also possible for the whole system to respond to the requirements of the gas network. In this case, the wind power will be converted into hydrogen to respond to the gas network demands as the first priority. It should be noticed here that the power production from the wind farm should be sent to the grid after the mitigation process as the first priority due to the concerns about efficiency.

3.3. Filter Design

A filter is applied in this paper to pick out the fluctuating component of the power signal and then send the signal to the rectifier connected to the electrolyzer as a reference, so that according to the law of energy conservation, the fluctuating power in the Bus 1 could be extracted. A DC component is also added to the signal that is picked out by the filter. This is because the electrolyzer can only consume the power, thus, the negative signal cannot be processed by the electrolyzer. The bandpass (BP) filter for the 3p frequency proposed in [12] is applied in this paper. The BP filter is designed to bypass the 3p frequency while blocking all the other frequencies. The transfer function of the BP filter could be described using Equation (23):
F ( s ) = K s s 2 + ω c Q s + ω c 2
in which ω c is the center frequency, K is the gain and Q is the quality factor.
For the wind turbine model used in this paper, the rotational speed is between 7.5 rpm and 15.5 rpm corresponding to a wind speed of 4 m/s to 25 m/s. For the wind turbines that are working in this speed range, the center rotation speed is 3.64 rad/s, this means, ω c = 3.64   r a d / s for the case in this paper. The gain is designed as F ( j ω ) = K Q ω c = 1 to pass all the 3p frequency [12]. The parameters are designed as Q = 80, K = 0.0455. The Bode diagram of this filter is shown in Figure 5.

4. Case Study

4.1. Operation Mode With Constant Energy Requirement

The whole wind farm is made up by six wind turbines. The capacity of the each wind turbine is 1.5 MW. The average wind speed for all the wind turbines is set at 8 m/s. The wind speed curve is shown in Figure 6.
The wind speed-output power curve of the wind turbine model applied in this paper is shown in Figure 7. The wind turbine cannot be started when the wind speed is below 4 m/s. When the wind speed is greater than 15 m/s, the wind turbine is shut down for protection.
The output power of the wind farm is shown in Figure 8. The output power is measured at the output port of the wind turbines. It can be seen that the output power is unstable due to the fluctuation of the wind. Wind shear and tower shadow effect also contribute to this output power, so that the output power has 3p oscillation component based on the fluctuation caused by the fluctuation of the wind.
The output power of the wind turbines is very unstable due to the reason above. This output power is first mitigated by sending the fluctuating active power to the PEM electrolyzer. This output power is measured, and the signal is sent into the BP filter designed previously. The fluctuation signal is picked out and then sent into the converter that is connected with the PEM electrolyzer. A DC component is also added into this signal so that the entire signal is shifted above zero. The fluctuation component which is picked out and sent to PEM electrolyzer together with a DC component is shown in Figure 9.
According to the law of conservation of energy, once the power with fluctuation is extracted, the power remaining is smoothed. The power after the mitigation is shown in Figure 10 by the black curve. It can be seen that the output power is significantly smoothed, and the influence caused by the 3p oscillation component is removed, but the output power is still unstable due to the fluctuation of the wind. The order from the TSO is shown in Figure 10 by the red curve. It can be seen that the power production sometimes is greater than the TSO order and sometimes less than the TSO order.
The excess power which is sent to the PEM electrolyzer is shown in Figure 11. It can be seen that the reference power only exists when the wind power is greater than 5 MW which is the requirement from the TSO. This part of the power is sent to the PEM electrolyzer together with the fluctuation mentioned previously. The PEM electrolyzer consumes these two parts of the energy and produces hydrogen and oxygen. The reaction of the PEM electrolyzer, which is the corresponding hydrogen production rate, is shown in Figure 12.
The power shortage which needs to be compensated by the gas turbine is shown in Figure 13. It can be seen from Figure 13 this part of the reference power only exists when the power production is less than the TSO requirement. The required power is converted into the hydrogen requirement and then sent to gas turbine as a quantity of fuel signal. The power generated by the gas turbine is shown in Figure 14. It can be seen that the power generated by the gas turbine follows the given power reference.
After the power compensation, the final output power of the whole system is shown in Figure 15. It can be seen that the final output power is constant and follows the TSO order as 5 MW. It can be seen that with the proposed configuration using the proposed control strategy, all the equipment in the whole system can cooperate to make the whole system respond like a conventional power plant.

4.2. Operation Mode With Changing Energy Requirement

This case is simulated with a changing TSO energy requirement. The requirement of TSO is shown in Figure 16. The initial requirement of the TSO is 4 MW, then this requirement changes to 6 MW after 150 s, and changes again to 5 MW at the 400th s. The response of the whole system is shown in Figure 17. It can be seen that the system response is meeting the requirement. The detailed system response as far as the change of the power is concerned is very similar to the case when the TSO order is constant, thus, a detailed response is not presented in this case.
It should be mentioned here that the order from the TSO is transformed into a gas quantity to supply the gas turbine, thus, when the generation of the gas turbine should be increased, the quantity of hydrogen supplied should be increased. The quantity of hydrogen is an integration of the hydrogen flow, which cannot be changed suddenly, so the gas supply cannot be increased immediately, so the step up order of the TSO is sent to the gas supply calculation, and the gas supply response to this TSO order has a TSO order changing rate limitation function.

5. Conclusions and Future Work

This paper proposes a wind farm and support equipment configuration and its corresponding control strategy. The proposed configuration combines together wind turbines, a PEM electrolyzer, a gas turbine and its corresponding generator; with the proposed control strategy, the whole system can make the wind farm work like a conventional power plant. The power output characteristics of the proposed configuration are the same as those of a conventional power plant, which is constant, in steady state condition, and can follow the TSO order. The common problems of wind farms, like output power fluctuation due to the instability of the wind, the influence caused by wind shear effect and tower shadow effect can be solved by this configuration.
As future work, the sizes of the wind farm, the PEM electrolyzer and the capacity of the gas turbine should be optimized. The possibility to collect the waste heat and carry it to a heating network together with a heat pump (to feed a district heating and cooling system) could be developed. What is more, a sensitivity analysis should be conducted in the future work.

Acknowledgments

This work is supported by the Visiting Scholarship of State Key Laboratory of Power Transmission Equipment & System Security and New Technology (Chongqing University) (2007DA10512716402), and the Danish ForskEL project Harmonized Integration of Gas, District Heating and Electric Systems (HIGHE, 2014-1-12220).

Author Contributions

Shihua Xuan proposed the idea of the configuration, built the simulation and wrote the paper. Weihao Hu supervised the whole research work and gave a lot of suggestions during the simulation and verified the simulation results. Academic support and guidance were given by Jun Yao. Zhe Chen verified the feasibility of the study and gave a lot of academic advices during the construction and revision of this paper.

Conflicts of Interest

The authors declare no conflict of interest.

References

  1. Taj, T.A.; Hasanien, H.M.; Alolah, A.I.; Muyeen, S.M. Dynamic performance enhancement of a grid-connected wind farm using doubly fed induction machine-based flywheel energy storage system. In Proceedings of the 6th International Renewable Energy Congress (IREC), Sousse, Tunisia, 24–26 March 2015.
  2. He, H.P.; Pan, W.X.; Li, B.; Ma, H.M. One power control strategy of wind farm based on the battery energy storage. In Proceedings of the International Conference on Sustainable Power Generation and Supply (SUPERGEN 2012), Hangzhou, China, 8–9 September 2012.
  3. Yu, Q.H.; Cai, M.L. The process of compressed air energy storage (CAES) analysis. In Proceedings of the 2013 International Conference on Materials for Renewable Energy and Environment (ICMREE), Chengdu, China, 19–23 August 2014.
  4. Martínez, M.; Molina, M.G.; Mercado, P.E. Dynamic performance of compressed air energy storage (CAES) plant for applications in power systems. In Proceedings of the 2010 IEEE/PES Transmission and Distribution Conference and Exposition: Latin America (T&D-LA), Sao Paulo, Brazil, 8–10 November 2010.
  5. Ding, H.J.; Hu, Z.C.; Song, Y.H.; Wu, J.C.; Fan, X.X. Coordinated operational strategy of energy storage system and wind farm. In Proceedings of the IEEE Power & Energy Society Innovative Smart Grid Technologies Conference (PES ISGT) Europe 2013, Lyngby, Denmark, 6–9 October 2013.
  6. Monjean, P.; Sprooten, J.; Robyns, B. Inuence of technical-economic energy context for the management of wind farms and storage systems in a constrained network. In Proceedings of the 2010 IEEE International Symposium on Industrial Electronics, Bari, Italy, 4–7 July 2010.
  7. Liang, L.; Li, J.L.; Hui, D. An optimal energy storage capacity calculation method for 100MW wind farm. In Proceedings of the 2010 International Conference on Power System Technology (POWERCON), Hangzhou, China, 24–28 October 2010.
  8. Chen, W.Z.; Li, Q.B.; Shi, L.; Luo, Y.; Zhan, D.D.; Shi, N.; Liu, K. Energy storage sizing for dispatchability of wind farm. In Proceedings of the 2012 11th International Conference on Environment and Electrical Engineering (EEEIC), Venice, Italy, 18–25 May 2012.
  9. Jiang, Z.; Feng, J.; Sun, Y.; Sun, B.H.; Wu, N.H. Wind farm energy storage capacity optimization based on PSO. In Proceedings of the 2013 Ninth International Conference on Natural Computation (ICNC), Shenyang, China, 23–25 July 2013.
  10. Dolan, D.L.; Lehn, P.W. Simulation Model of wind turbine 3p torque oscillations due to wind shear and tower shadow. In Proceedings of the 2006 IEEE Power & Energy (PES) Power Systems Conference and Exposition, Atlanta, GA, USA, 29 October–1 November 2006.
  11. Abulanwar, S.; Hu, W.H.; Chen, Z.; Iov, F. Adaptive voltage control strategy for variable speed wind turbine connected to a weak network. IET Renew. Power Gener. 2016, 6, 238–249. [Google Scholar] [CrossRef]
  12. Hu, W.C.; Chen, Z.; Wang, Y.; Wang, Z.A. Flicker mitigation by active power control of variable-speed wind turbines with full-scale back-to-back power converters. IEEE Trans. Energy Convers. 2009, 24, 640–649. [Google Scholar]
  13. Koiwa, K.; Takahashi, R.; Tamura, J.J. A study of hydrogen production in stand-alone wind farm. In Proceedings of the 2012 International Conference on Renewable Energy Research and Applications (ICRERA), Nagasaki, Japan, 11–14 November 2012.
  14. Zhang, C.Z. Modeling and Simulation for Solar-Hydrogen system. Master’s Thesis, Southwest Jiaotong University, Sichuan, China, December 2009. [Google Scholar]
  15. Beainy, A.; Karami, N.; Moubayed, N. Simulink model for a PEM electrolyzer based on an equivalent electrical circuit. In Proceedings of the 2014 International Conference on Renewable Energies for Developing Countries (REDEC), Beirut, Lebanon, 24–27 November 2014.
  16. Muyeen, S.M.; Takahashi, R.; Murata, T.; Tamura, J. Integration of hydrogen generator into wind farm interconnected HVDC system. In Proceedings of the 2009 IEEE Bucharest PowerTech, Bucharest, Romania, 28 June–2 July 2009.
  17. Melo, D.F.R.; Ren, L.; Chien, C. Synergistic control between hydrogen storage system and offshore wind farm for grid operation. IEEE Trans. Sustain. Energy 2013, 5, 18–27. [Google Scholar] [CrossRef]
  18. Hannett, L.N.; Khan, A.H. Combustion turbine dynamic model validation from tests. IEEE Trans. Power Syst. 1993, 8, 152–158. [Google Scholar] [CrossRef]
  19. Hannett, L.N.; Jee, G.; Fardanesh, B. A governor/turbine model for a twin-shaft combustion turbine. IEEE Trans. Power Syst. 1995, 10, 133–140. [Google Scholar] [CrossRef]
  20. Troy, V. Nguyen integration of compressed air energy storage with wind turbine to provide energy source for combustion turbine generator. In Proceedings of the 2014 5th IEEE PES Innovative Smart Grid Technologies Europe (ISGT Europe), Istanbul, Turkey, 12–15 October 2014.
  21. Flick, C. Rating, capabilities, and operation of combustion gas turbine driven generators. In Proceedings of the IEEE Power & Energy (PES) Winter Meeting, New York, NY, USA, 28 January–2 February 1973.
  22. Lydia, M.; Selvakumar, A.I.; Kumar, S.S.; Kumar, G.E.P. Advanced algorithms for wind turbine power curve modeling. IEEE Trans. Sustain. Energy 2013, 4, 827–835. [Google Scholar] [CrossRef]
  23. Yang, X.; Cui, Y.; Zhang, H.; Tang, N. Research on modeling of wind turbine based on LS-SVM. In Proceedings of the 2009 International Conference on Sustainable Power Generation and Supply, Nanjing, China, 6–7 April 2009.
  24. Li, M.Y.; Liu, X.J.; Mi, Z.J.; Qian, J. The contrastive study on the modeling of wind turbine power. In Proceedings of the 2010 International Conference on Computer Application and System Modeling (ICCASM 2010), Taiyuan, China, 22–24 October 2010.
  25. Abdol, A.H.; Tijani, A.S.; Shukri, F.H.; Hanapi, S.; Sainan, K.I. Mathematical modelling and simulation analysis of PEM electrolyzer system for hydrogen production. In Proceedings of the 2014 3rd IET International Conference on Clean Energy and Technology (CEAT), Kuching, Malaysia, 24–26 November 2014.
  26. Kolhe, M.; Atlam, O. Empirical electrical modeling for a proton exchange membrane electrolyzer. In Proceedings of the 2011 International Conference on Applied Superconductivity and Electromagnetic Devices (ASEMD), Sydney, Australia, 14–16 December 2011.
  27. Tlili, N.; Neily, B.; Salem, F.B. Modeling and simulation of hybrid system coupling a photovoltaic generator, a PEM fuel cell and an electrolyzer (Part II). In Proceedings of the 2014 11th International Multi-Conference on Systems, Signals & Devices (SSD), Barcelona, Spain, 11–14 February 2014.
  28. Hu, W.H.; Zhang, Y.Q.; Chen, Z.; Hu, Y.T. Flicker mitigation by speed control of permanent magnet synchronous generator variable-speed wind turbine. Energies 2013, 6, 3807–3821. [Google Scholar] [CrossRef]
Figure 1. The system configuration.
Energies 09 00535 g001
Figure 2. Control strategy diagram.
Energies 09 00535 g002
Figure 3. Coordination logic control strategy diagram.
Energies 09 00535 g003
Figure 4. Energy flow diagram.
Energies 09 00535 g004
Figure 5. The Bode diagram of the filter.
Energies 09 00535 g005
Figure 6. The wind speed.
Energies 09 00535 g006
Figure 7. Wind speed-output power curve of the wind turbine model applied in this paper.
Energies 09 00535 g007
Figure 8. The initial output power of the wind farm.
Energies 09 00535 g008
Figure 9. The fluctuation component.
Energies 09 00535 g009
Figure 10. The output power after mitigation and TSO order.
Energies 09 00535 g010
Figure 11. The excess power sent to the PEM electrolyzer.
Energies 09 00535 g011
Figure 12. The hydrogen production rate.
Energies 09 00535 g012
Figure 13. The insufficient power reference to the gas turbine.
Energies 09 00535 g013
Figure 14. The power generated by the gas turbine.
Energies 09 00535 g014
Figure 15. The final output power of the system.
Energies 09 00535 g015
Figure 16. The TSO order.
Energies 09 00535 g016
Figure 17. The response of the system with changing TSO order.
Energies 09 00535 g017

