Article

Market Equilibrium and Impact of Market Mechanism Parameters on the Electricity Price in Yunnan’s Electricity Market

1
Institute of Hydropower System & Hydroinformatics, Dalian University of Technology, Dalian 116024, China
2
Yunnan Power Exchange, Kunming 650000, China
*
Author to whom correspondence should be addressed.
Energies 2016, 9(6), 463; https://doi.org/10.3390/en9060463
Submission received: 28 March 2016 / Revised: 10 June 2016 / Accepted: 10 June 2016 / Published: 17 June 2016
(This article belongs to the Special Issue Forecasting Models of Electricity Prices)

Abstract

:
In this paper, a two-dimensional Cournot model is proposed to study generation companies’ (GENCO’s) strategic quantity-setting behaviors in the newly established Yunnan’s electricity market. A hybrid pricing mechanism is introduced to Yunnan’s electricity market with the aim to stimulate electricity demand. Market equilibrium is obtained by iteratively solving each GENCO’s profit maximization problem and finding their optimal bidding outputs. As the market mechanism is a key element of the electricity market, impacts of different market mechanism parameters on electricity price and power generation in market equilibrium state should be fully assessed. Therefore, based on the proposed model, we precisely explore the impacts on market equilibrium of varying parameters such as the number of GENCOs, the quantity of ex-ante obligatory-use electricity contracts (EOECs) and the elasticity of demand. Numerical analysis results of Yunnan’s electricity market show that these parameters have notable but different effects on electricity price. A larger number of GENCOs or less EOEC contracted with GENCOs will have positive effects on reducing the price. With the increase of demand elasticity, the price falls first and then rises. Comparison of different mechanisms and relationship between different parameters are also analyzed. These results should be of practical interest to market participants or market designers in Yunnan’s or other similar markets.

Graphical Abstract

1. Introduction

Electricity market reforms have ocurred for decades in many regions and countries, and lots of the envisaged goals have been achieved so far. In 2015, China took steps to further reform its electric power industry [1] by introducing electricity markets in several electricity market pilot provinces, and Yunnan is one of them. The combination of insufficient demand and surplus clean energy capacity is the great driver for Yunnan to further reform its power sector [2,3]. In this context, Yunnan’s electricity market was opened on 1 January 2015.
The two main purposes of Yunnan’s electricity market at its early stage are: firstly to guarantee the stability and security operation of the power grid; secondly to stimulate demand in the province and make more clean energy be consumed at a lower electricity price [4]. To guarantee the stability and secure operation of the power grid [5,6], power generation contracts in Yunnan are classified into two parts: ex-ante obligatory-use electricity contracts (EOECs) which are bilateral contracts between generation companies (GENCOs) and the Yunnan Power Grid (YNPG), and generation contracts in the market. YNPG can regulate EOECs to cope with the imbalance and other problems of the power grid. Besides EOECs, generation contracts are made in the monthly electricity market. In order to promote clean energy consumption, a hybrid pricing mechanism is adopted by the Yunnan Power Exchange (YNPX). GENCOs can offer a two-part bid in a monthly market to compete for generation contracts (see Section 2.2 for more details). The adopted hybrid pricing mechanism is expected to be an effective mechanism to reduce the electricity price [7]. However, the newly established Yunnan electricity market is more akin to an oligopoly than perfect market competition. In every market environment, each GENCO’s goal is to maximize its own profit rather than achieve the market designer’s goal of stimulating the demand or reducing the price, so it is obvious that a GENCO could withdraw its generation output from the market so as to force the market clearing price to rise. This will be a profitable strategy if the increased revenue on the remaining power generation exceeds the lost profit on the foregone power generation. Thus, the strategic bidding behaviors of GENCOs have a great influence on the electricity price and generation output in the market. Meanwhile, the impact of market mechanism parameters such as the number of GENCOs, the quantity of EOECs and the elasticity of demand on the electricity price and generation in the market equilibrium state should be properly quantified and fully assessed.
Massive amounts of work have been done in the field of developing optimal bidding strategies for GENCOs and calculating market equilibrium states. Different types of models in different markets with different mechanisms are available in the literature. David [8] formally addressed the strategic bidding issue for competitive power suppliers first; a conceptual optimal bidding model and a dynamic programming method for England-Wales type electricity markets were developed [8]. In a pool-based market, Conejo et al. modeled the bidding strategy problem as a stochastic mixed-integer linear programming model [9] and Song et al. used a Markov decision process model to optimize the supplier’s decision over a planning horizon [10]. Krause et al. performed a Nash equilibrium analysis by defining a pool market as a repeatedly played matrix game [11], and Kang et al. proposed a bidding model by using a two-player static game theory [12]. Zhang et al. developed optimal bidding strategies for wind power producers by three different strategies [13]. Contreras et al. developed a cobweb bidding model for competitive electricity markets [14]. Song et al. introduced a conjectural variation-based bidding strategy [15], and Song et al. and Day et al. presented conjectured supply function (CSF) models to obtain optimal bidding strategies [16,17]. Agent-based modeling methods are also used in the field of studying optimal bidding strategy [18,19]. In a bilateral market, Song et al. used a Nash equilibrium bidding strategy [20] and Hobbs introduced linear complementarity models into Nash-Cournot competition to generate optimal bidding strategies [21]. In a hybrid market, Bathurst et al. presented a strategy for bidding a few hours before the operation time for the wind producers [22]. Fujii et al. applied a multi-agent model to numerically analyze the price formation process of an open electricity market [23]. More methods for modeling GENCO bidding strategies are reviewed by references [24,25,26,27].
In this paper, a two-dimensional Cournot model considering generation capacity constraint is introduced to determine the optimal bidding strategies for GENCOs who choose to offer a two-part bid in the market. The Cournot model is used to describe quantity-setting behavior when GENCOs make strategic decisions. Market equilibrium is obtained by iteratively solving each GENCO’s profit maximization problem and finding their optimal bidding outputs. Next, to assess the impacts of such market mechanism parameters as the number of GENCOs, the quantity of EOEC and the elasticity of demand on the market equilibrium and the electricity price, the unconstraint Cournot model is adopted. The rationale for choosing this model is twofold. First, although generation capacities of GENCOs are different, generation capacity caps of GENCOs are set by YNPG according to the inflow predictions of different reservoir, the operation of cascade hydropower stations and the power demand prediction. After EOECs are contracted with YNPG, the bidding spaces for GENCOs are almost the same in a surplus generation environment, so it is reasonable to take the generation capacity constraint out of consideration when assessing the impact of different parameters. Second, the impact of different market mechanism parameters can be assessed by calculating the two-dimensional Nash equilibrium of the unconstraint model to make the numerical analysis results accessible and easy to understand, so the different impacts of various parameters on the market outcomes can be compared. Ultimately, the objective is to find out how the varying parameters influence the market equilibrium and the electricity price and compare market outcomes in markets with different mechanisms.
The rest of this paper is organized as follows: the market assumptions and hybrid pricing mechanism adopted by Yunnan’s electricity market are introduced in Section 2, followed by the two-dimensional game model, the market equilibrium state and the solution methodology. In Section 3, impacts of different market mechanism parameters on electricity price are assessed. At the end, concluding remarks are presented in Section 4.

2. Bidding Strategy and Market Equilibrium

2.1. Market Assumptions

Based on the actual situation of Yunnan’s electricity market, in this paper, the inverse demand curve of energy is described as a monotone decreasing linear function. The Cournot model is used to describe quantity-setting behavior when GENCOs make strategic decisions. As the installed generation capacity in Yunnan consists of hydro power (74%), thermal power (17%) and other renewable resources (9%), it is assumed that GENCOs in the market are hydro and thermal power sellers based on the actual situation of Yunnan’s electricity market. The generation cost of each GENCO can be described as a quadratic function. Moreover, the newly established Yunnan’s electricity market is in an environment of severe surplus capacity and generation, so the generation capacity constraints of each GENCO are not taken into consideration when assessing the impact of market mechanism parameters on electricity price in this paper as mentioned in the previous section.
Yunnan’s electricity market is a medium-term (monthly) market, and there is currently no balancing real-time market, ancillary service market or reserve market, so the stability and secure operation of the power grid are guaranteed by EOECs, which are dispatched by YNPG based on non-market-oriented deviation control principle. Time coupling issues among different months of hydropower are fully considered by YNPG when contracting EOEC and setting generation capacity caps for GENCOs in each month, so individual GENCO’s bidding problem can be formulated for each month to maximize his profit. Because of the great significances of EOECs, EOECs of GENCOs were contracted and published before they offer their bids in the market. Power demand in Yunnan is first met with EOECs of all GENCOs, and the remaining demand (regarded as market demand) is then met with generation contracts in the market. Generally in the market, demand is cleared depending on the hybrid pricing mechanism and GENCOs’ bidding behaviors in each submarket (see Section 2.2 for more details). Solving the problem with twelve-month data individually will give an annual bidding strategy.

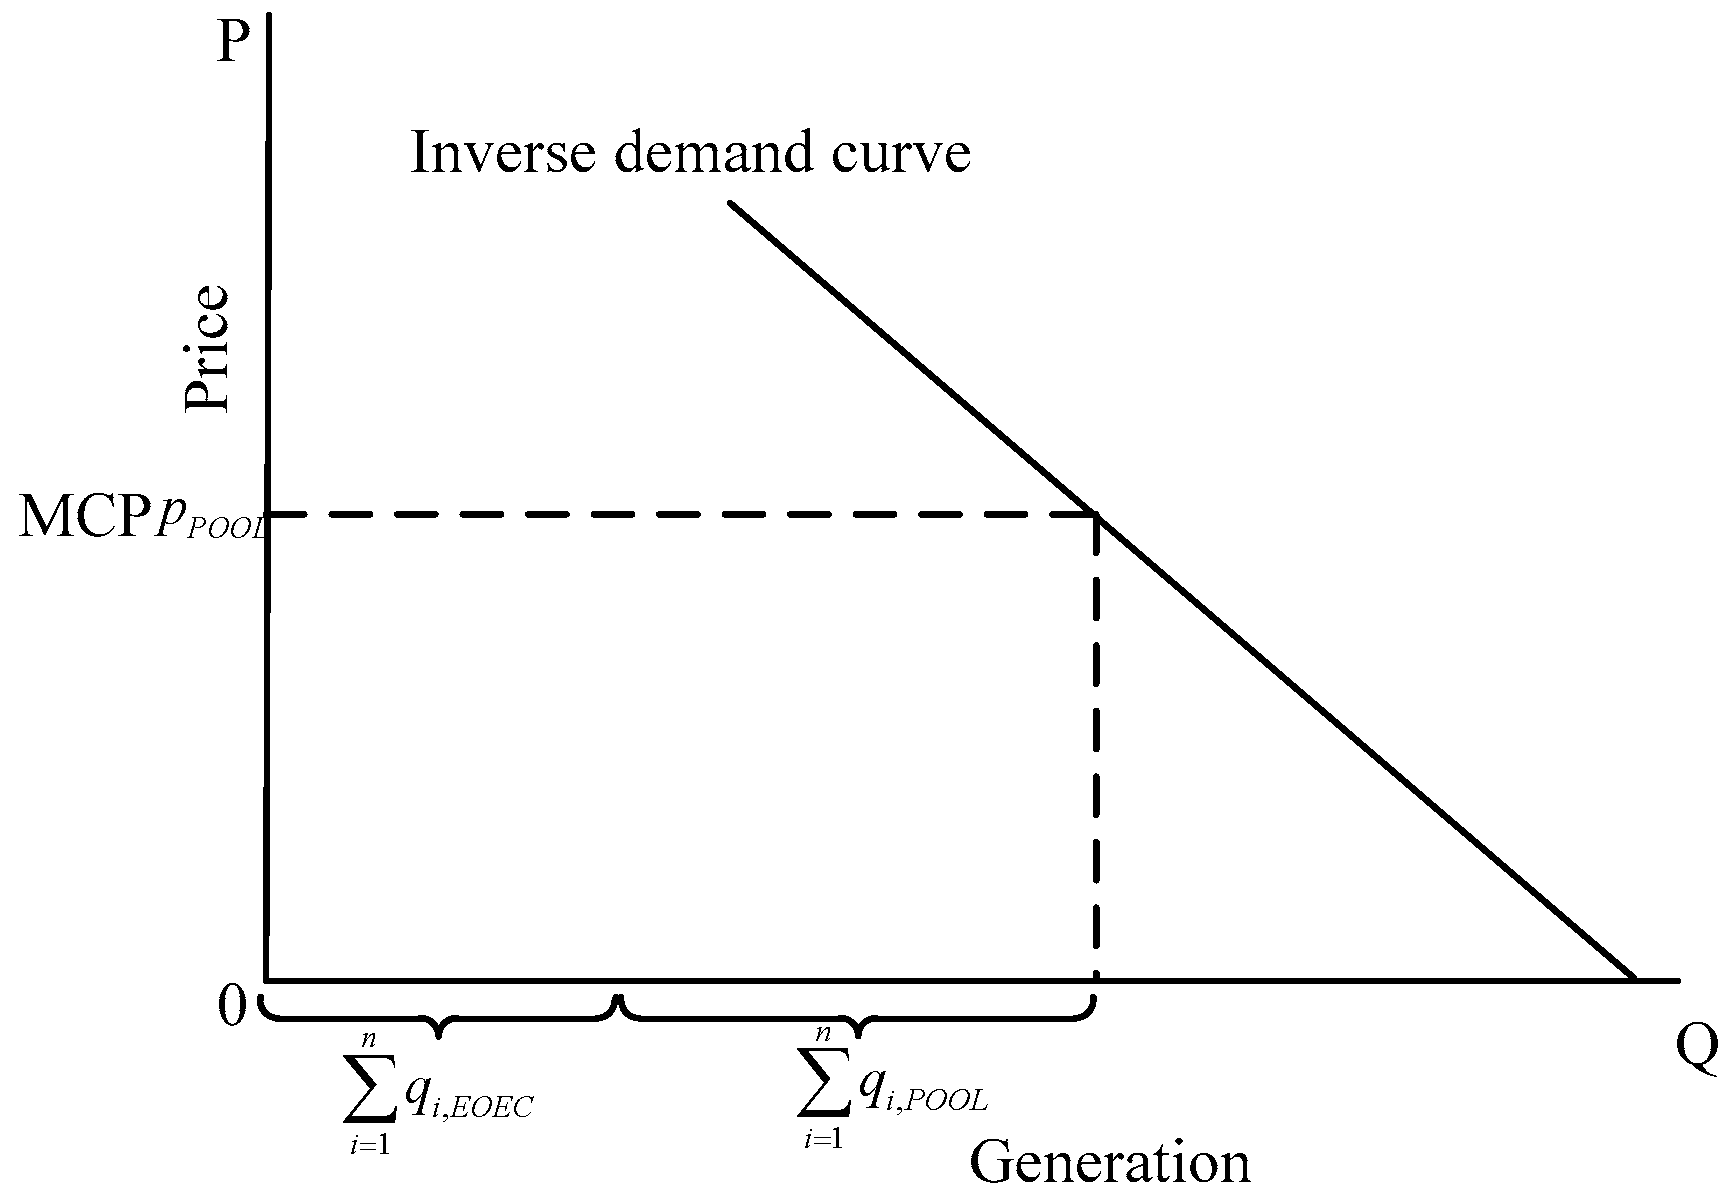
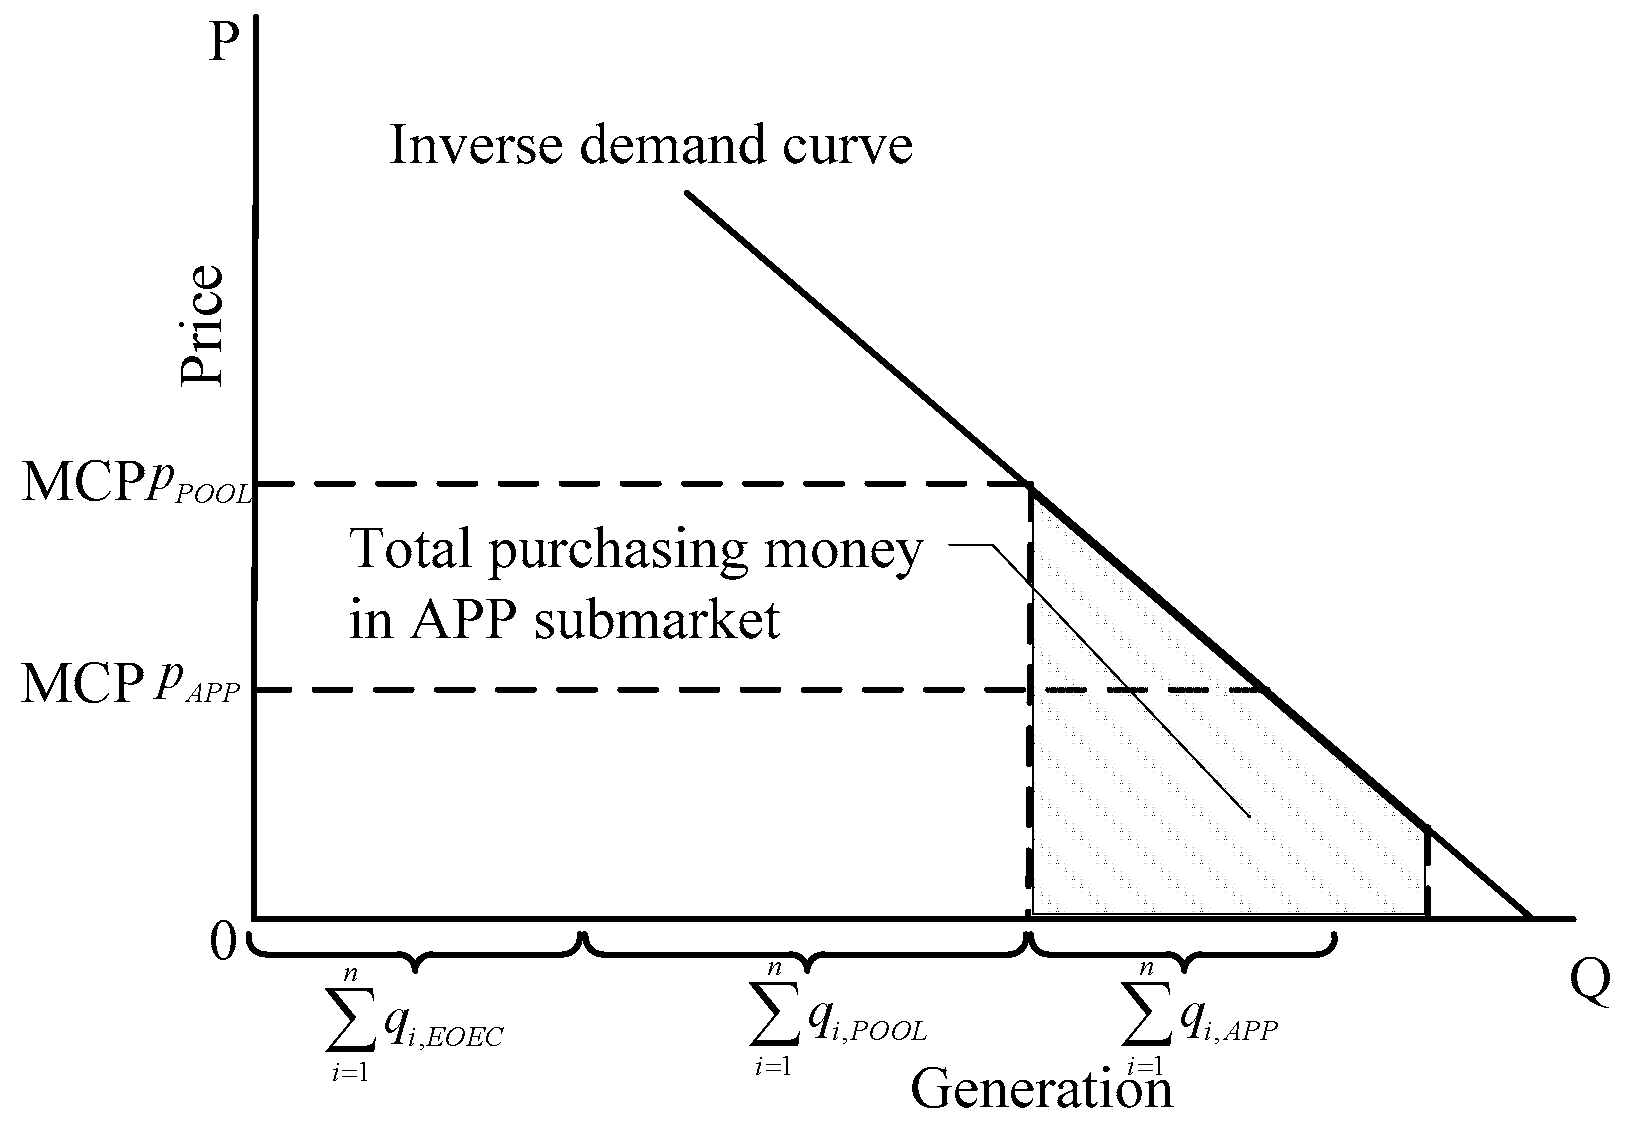
2.2. Hybrid Pricing Mechanism

To make the hybrid pricing mechanism more understandable, the market is regarded as two different submarkets with different pricing mechanisms. In the first submarket, a pool-based clearing and pricing mechanism is used, so we call it the POOL submarket. In the POOL submarket, all GENCOs wishing to sell generation in it must offer their sealed bids to YNPX. Energy is cleared depending on each GENCO’s strategic bidding behavior. The pricing mechanism in POOL submarket is uniform pricing, the uniform market clearing price is determined by the intersection of total supply (power generation of EOECs and bidding outputs of GENCOs) and inverse demand curve. This submarket is almost the same as a well-known pool-based market. The pricing mechanism is illustrated in Figure 1. Energy cleared Q P O O L and MCP in this submarket p P O O L are as follows:
Q P O O L = i = 1 n q i , P O O L
p P O O L = f ( q ) | q = i = 1 n q i , E O E C + Q P O O L
where Q P O O L represents energy cleared in POOL submarket; p P O O L represents MCP in POOL submarket; f ( q ) represents function of inverse demand curve; q i , E O E C represents EOEC of GENCO i ; q i , p o o l represents bidding outputs of GENCO i .
Then, in the second submarket, an average purchase price (APP) clearing and pricing mechanism is used, so we call it the APP submarket. In this submarket, all GENCOs wishing to sell generation in it also need to offer their sealed bids to YNPX. Uncleared demand in the pool submarket is cleared depending on each GENCO’s strategic bidding behavior in APP submarket. However, the pricing mechanism in the APP submarket is different from the one in the POOL submarket. In this submarket, the pricing mechanism is uniform pricing, but the uniform market clearing price is not determined by the intersection of total supply and inverse demand curve. For demand side, the APP submarket is regarded as a market to stimulate the demand by reducing the price. Thus, in terms of supply side, it means that if a GENCO wants to sell more, it must sell at a cheaper price. Therefore, the uniform market clearing price is determined as the average purchasing price of all buyers in this submarket, which is lower than the price in POOL submarket as illustrated in Figure 2.
Energy cleared Q A P P and MCP in APP submarket p A P P are as follows:
Q A P P = i = 1 n q i , A P P
p A P P = i = 1 n q i , E O E C + Q P O O L i = 1 n q i , E O E C + Q P O O L + Q A P P f ( q ) d q Q A P P
where Q A P P represents energy cleared in the APP submarket; p A P P represents MCP in APP submarket; q i , A P P represents bidding output of GENCO i in the APP submarket.

2.3. Two-Dimensional Cournot Model

The problem faced by each GENCO is the maximization of its profit where comprises the difference between revenue and generation cost. The cost of generating is calculated as:
C i ( q i ) = 1 2 a i q i 2 + b i q i + c i
Each GENCO’s EOEC is contracted with YNPX before the bidding process, and the selling price for each GENCO is its on-grid price determined by National Development and Reform Committee (NDRC). So, GENCO i’s revenue from EOEC can be regarded as fixed value and calculated as:
r i , E O E C = q i , E O E C × K i
where r i , E O E C represents GENCO i’s revenue from EOEC; q i , E O E C represents the EOEC of GENCO i contracted and published by YNPX before the bidding process; K i represents the on-grid price decided by NDRC for GENCO i.
Since each GENCO chooses to offer a two-part bid, the revenue components of each GENCO consist of selling energy in the POOL and APP submarkets. Suppose that the linear inverse demand curve is described as:
p = β α Q
where α > 0 and β > 0 represent the slope and the intercept of the inverse demand curve respectively.
The revenues from POOL and APP submarket can be then calculated as:
r i , P O O L = q i , P O O L × p P O O L = q i , P O O L × f ( q ) | q = i = 1 n q i , E O E C + i = 1 n q i , P O O L
r i , A P P = q i , A P P × p A P P = q i , A P P × i = 1 n q i , P O O L + i = 1 n q i , P O O L i = 1 n q i , E O E C + i = 1 n q i , P O O L + i = 1 n q i , A P P f ( q ) d q i = 1 n q i , A P P
where r i , P O O L represents the GENCO i ’s revenue from POOL submarket; r i , A P P represents the GENCO i ’s revenue from APP submarket.
The GENCO’s payoff (profit) function π i is determined by revenue minus cost, namely:
π i = r i , E O E C + r i , P O O L + r i , A P P C i ( q ) = q i , E O E C × K i + q i , P O O L × f ( q ) | q = i = 1 n q i , E O E C + i = 1 n q i , P O O L + q i , A P P × i = 1 n q i , E O E C + i = 1 n q i , P O O L i = 1 n q i , E O E C + i = 1 n q i , P O O L + i = 1 n q i , A P P f ( q ) d q i = 1 n q i , A P P C i ( q i , E O E C + q i , P O O L + q i , A P P )
Thus, the profit maximization problem for GENCOs can be modeled as a mathematical problem with the objective as:
max : π i ( i N )
S u b j e c t   t o : q i , E O E C + q i , P O O L + q i , A P P q i , max   ( i N )
where q i , max represents the generation capacity cap of GENCO i , and N represents the number of GENCOs.

2.4. Market Equilibrium and Solution Methodology
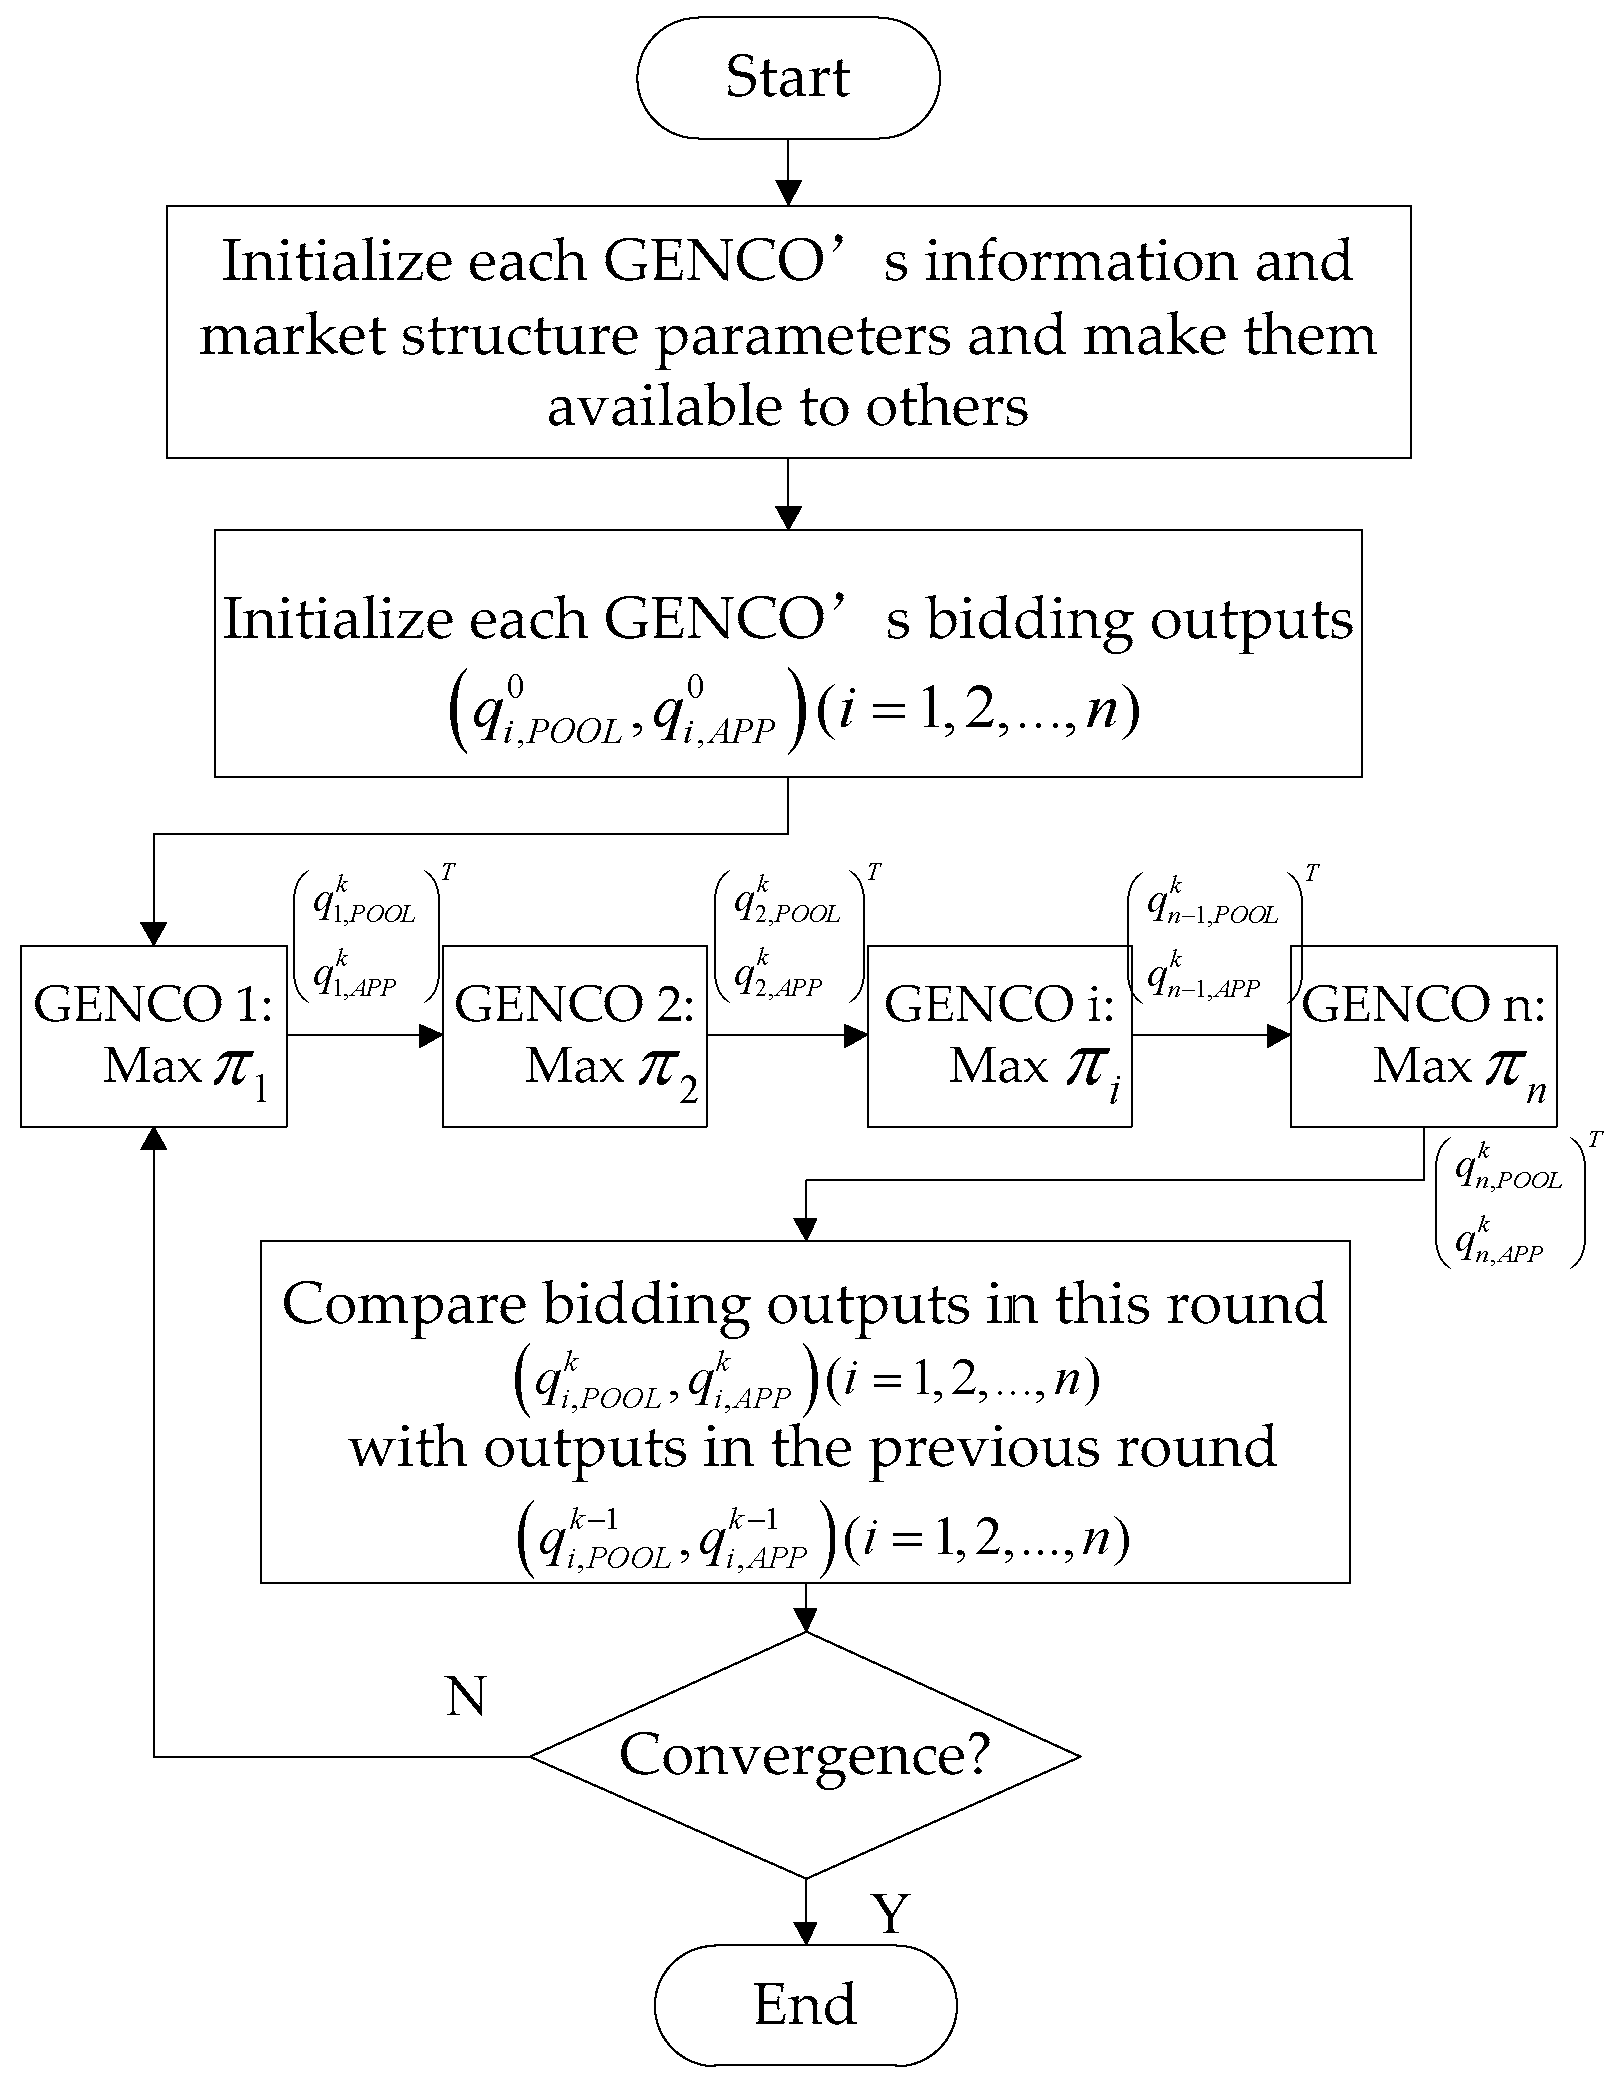
As we can see from Equations (10) and (11), each GENCO’s profit in Yunnan’s electricity market depends not only on its own strategic bidding behavior, but also on those of its competitors. Moreover, GENCOs’ bidding outputs in the POOL submarket affect their and others’ profits not only in the POOL submarket, but also in the APP submarket. As each GENCO offers a two-part bid ( q i , P O O L , q i , A P P ) and each GENCO’s payoff function is commonly known to all players, the optimal bidding strategy problem can be modeled as a two-dimensional non-cooperative game with complete information [28]. To compute the market equilibrium, we can state the problem as an n-player game: There are n GENCOs (players) in the game, each simultaneously playing with their own two-part bidding strategies. Each GENCO knows the profit (payoff) functions of its competitors and tries to maximize its own profit by taking its competitors’ strategic bidding behaviors into consideration. Optimal two-part bidding strategies of GENCOs and the market equilibrium can be reached by an iterative algorithm [29]. All players play the game by submitting their optimal two-part bidding strategies iteratively until no players can improve his profit by unilaterally changing his own bidding strategy. Thus, every GENCO will finally choose its two-part strategy exactly as the two-dimensional equilibrium strategy combination. A flowchart of the iterative algorithm is shown in Figure 3, and the specific steps are described below:
(1)
Initialize the GENCOs’ bidding outputs in each submarket ( q i , P O O L 0 , q i , A P P 0 ) ( i N ) , market structure parameters, generation capacity caps and generation cost coefficients of each GENCO. Note that each GENCO’s information is available to others.
(2)
For the first GENCO in the market, regard other GENCOs’ bidding output as fixed values and solve the optimization problem in Equation (11) to obtain the optimal bidding output in this round, and pass this information to the second GENCO. The second GENCO regards other GENCOs’ bidding output as fixed values and solves the optimization problem in Equation (11) to obtain the optimal bidding output. Go on with the process until all GENCOs obtain new bidding outputs which provide iteration.
(3)
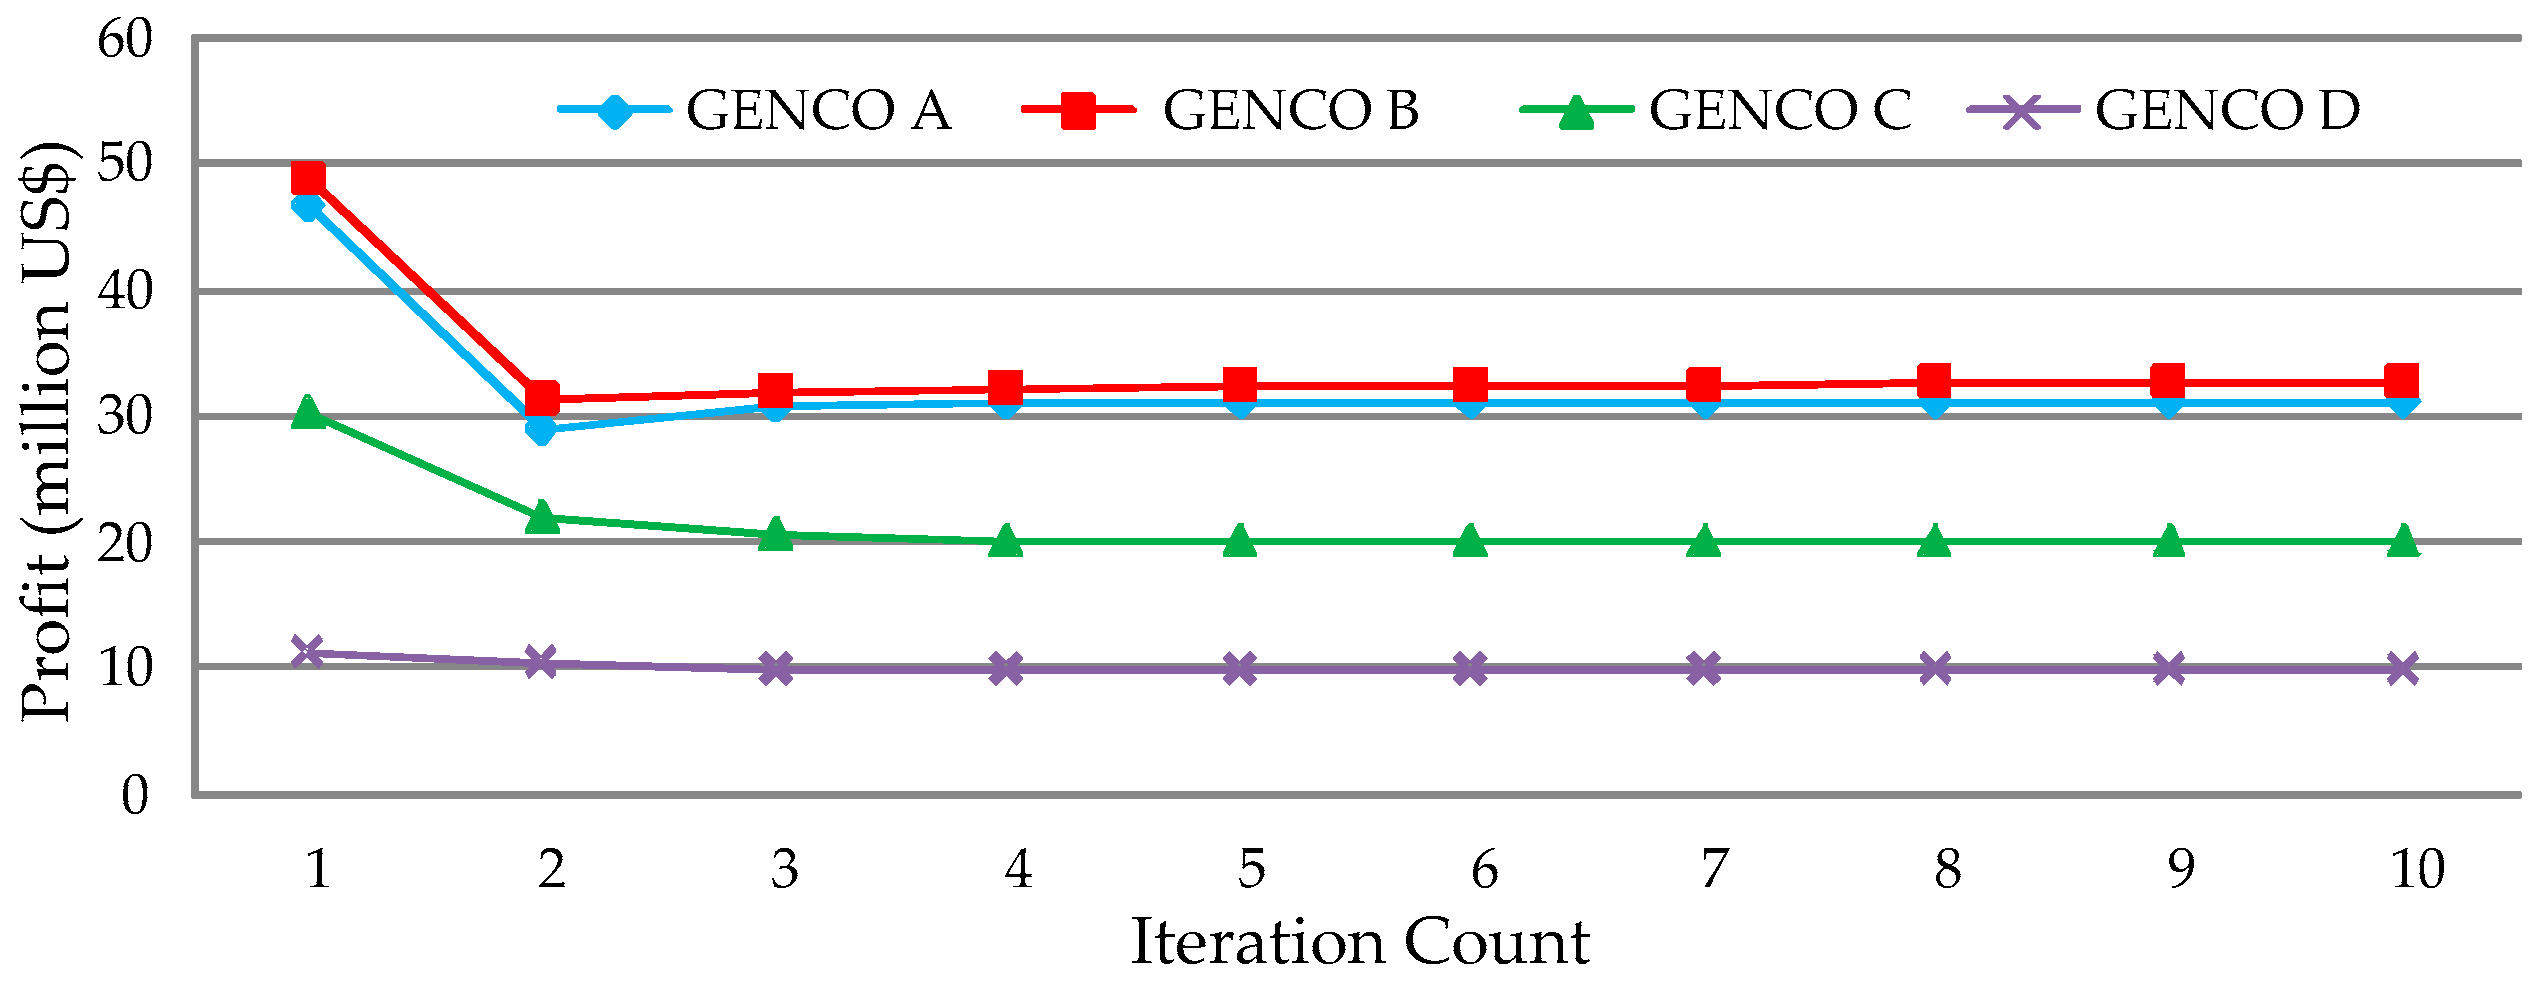
Compare each GENCO’s bidding output in this round ( q i , P O O L k , q i , A P P k ) with those in the previous round ( q i , P O O L k 1 , q i , A P P k 1 ) . If no GENCO’s bidding output is updated, it means that no one could unilaterally improve his profit, the algorithm is convergent and the market equilibrium is obtained. Otherwise, the iteration process goes to Equation (2) for a new round.
As discussed in reference [29], not all initial bidding outputs will lead to the convergence by using this method to solve the problem. In this paper, GENCOs’ sets of rationalizable strategies are any outputs combination between outputs of EOECs and outputs of generation capacity caps. From simulation we find that any initial output combination in sets of rationalizable strategies will lead to the convergence and the same equilibrium state of the market. Nevertheless, the proper initialization for solving the model and order for solving the GENCOs should be further studied.

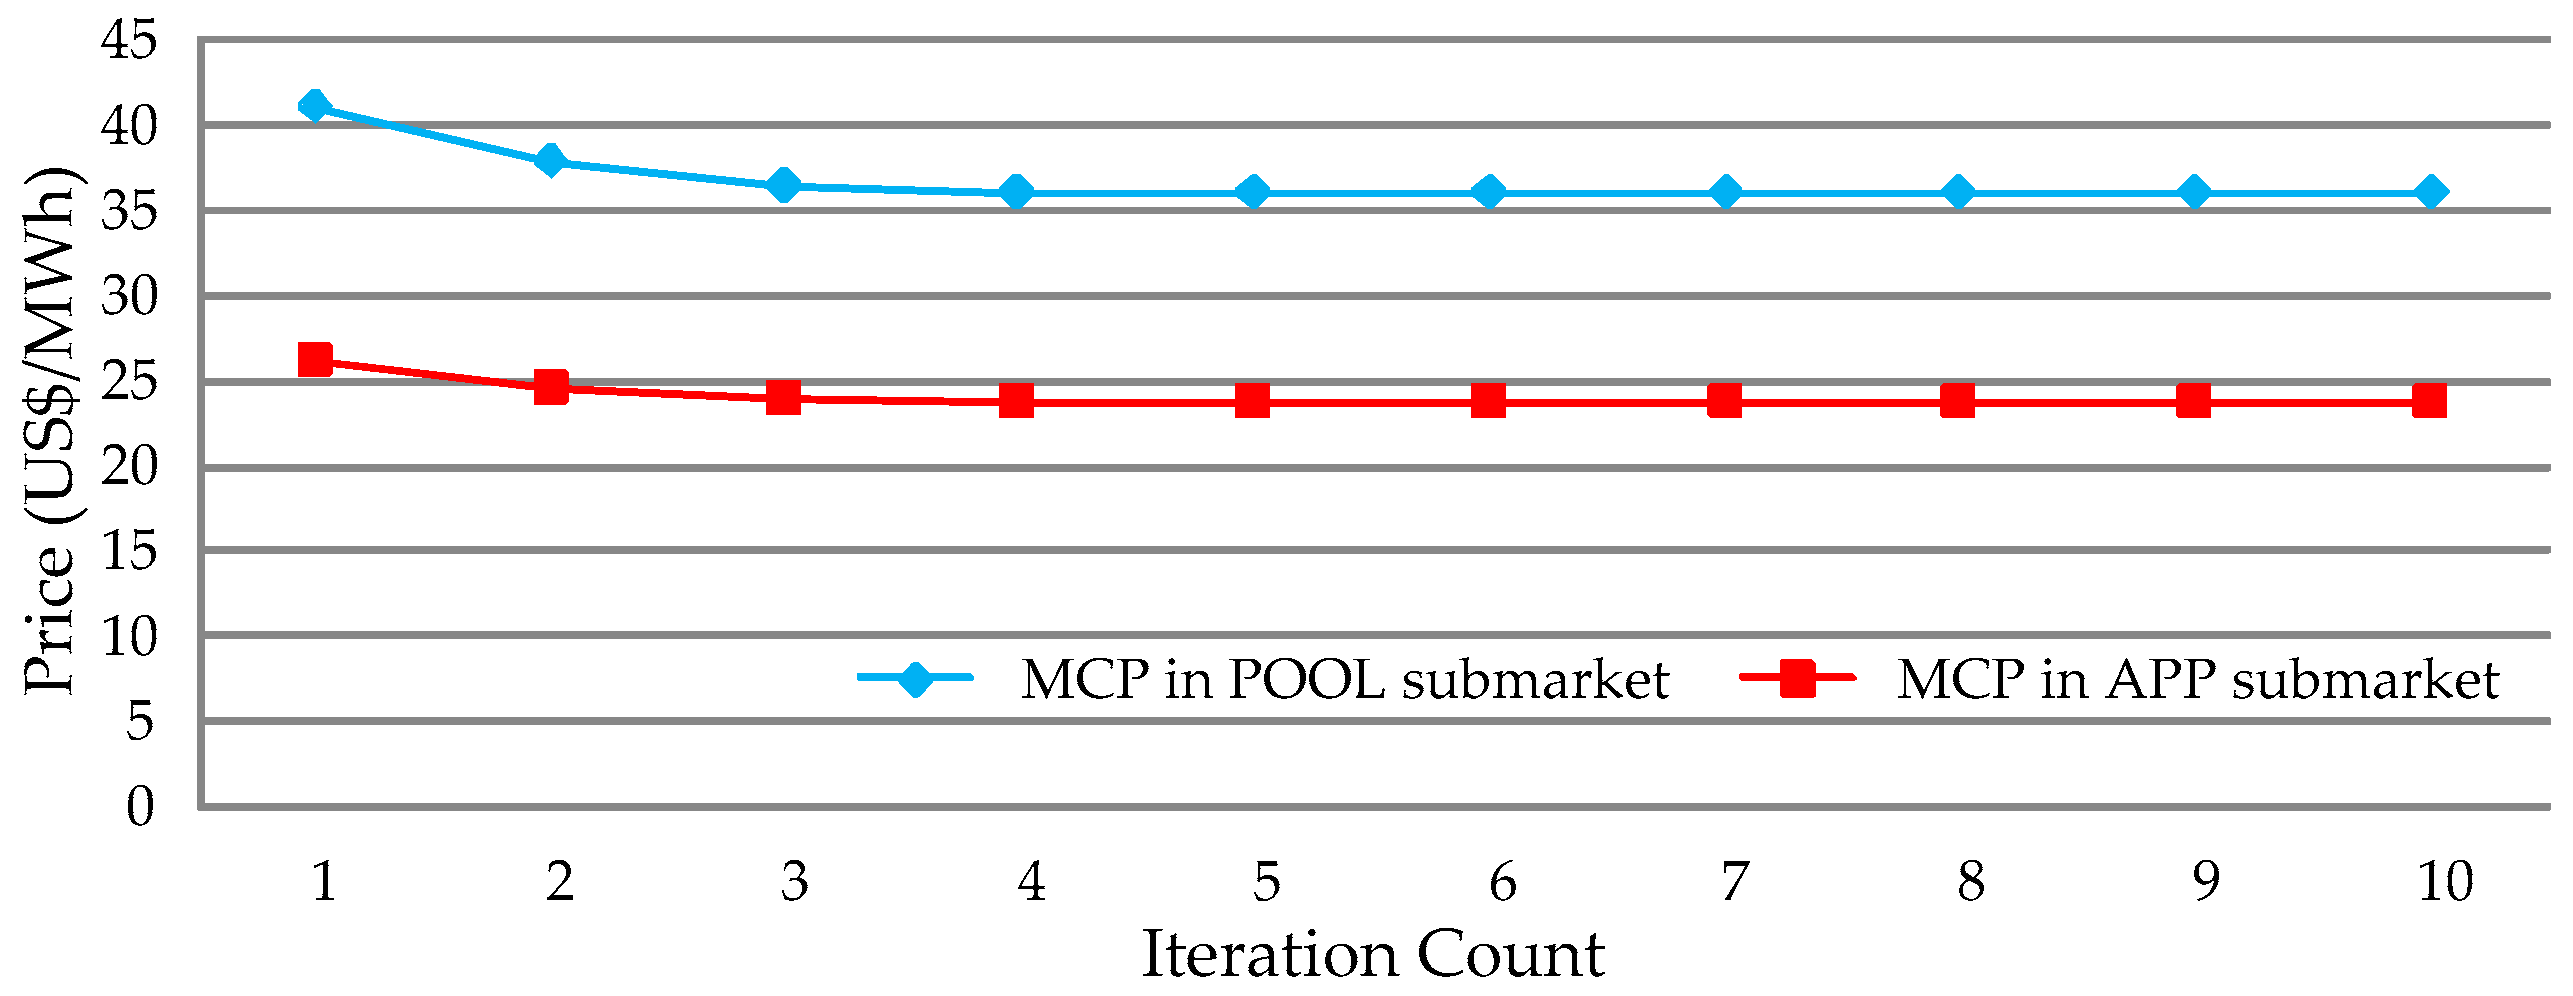
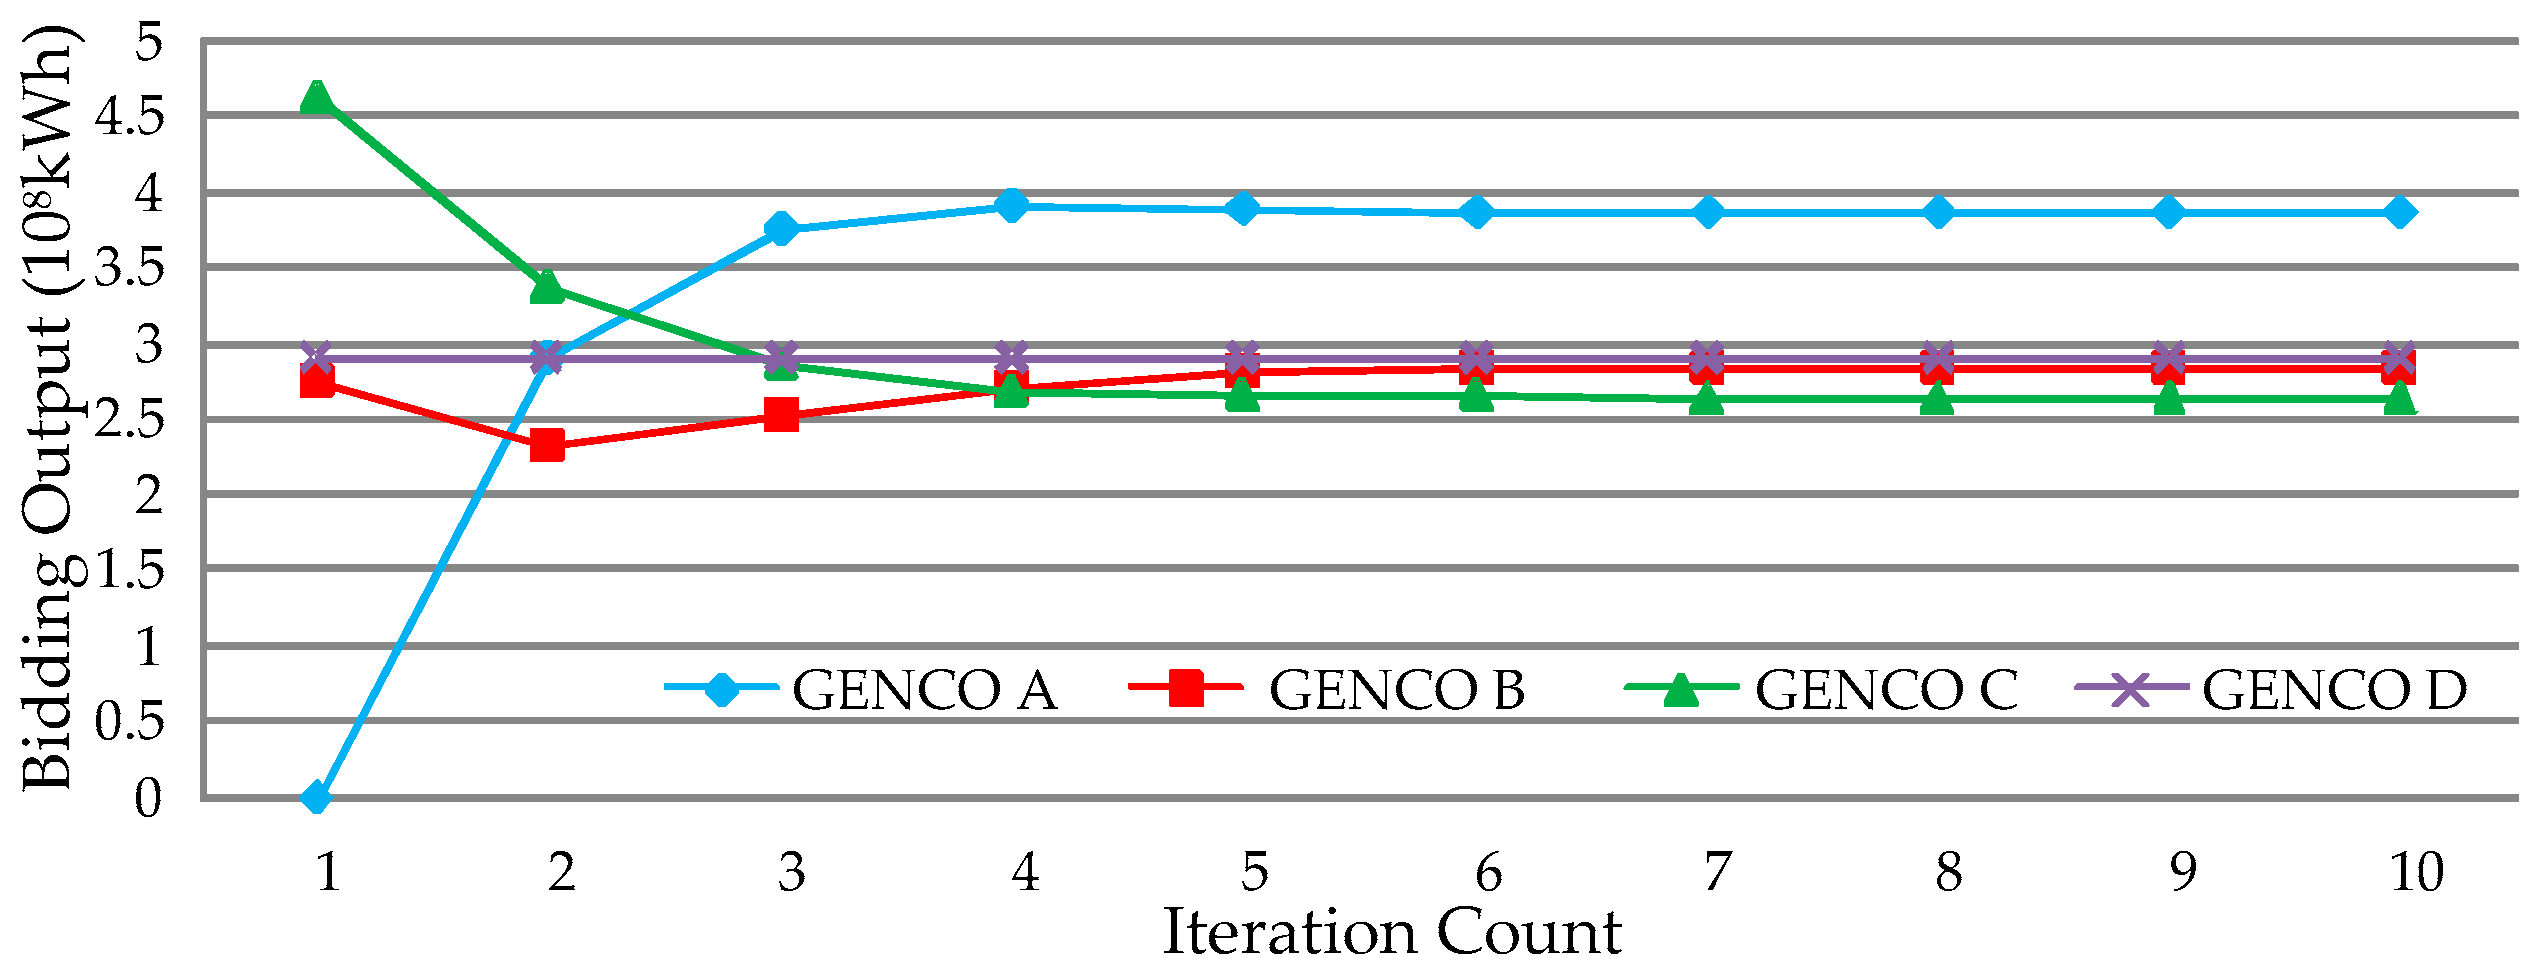
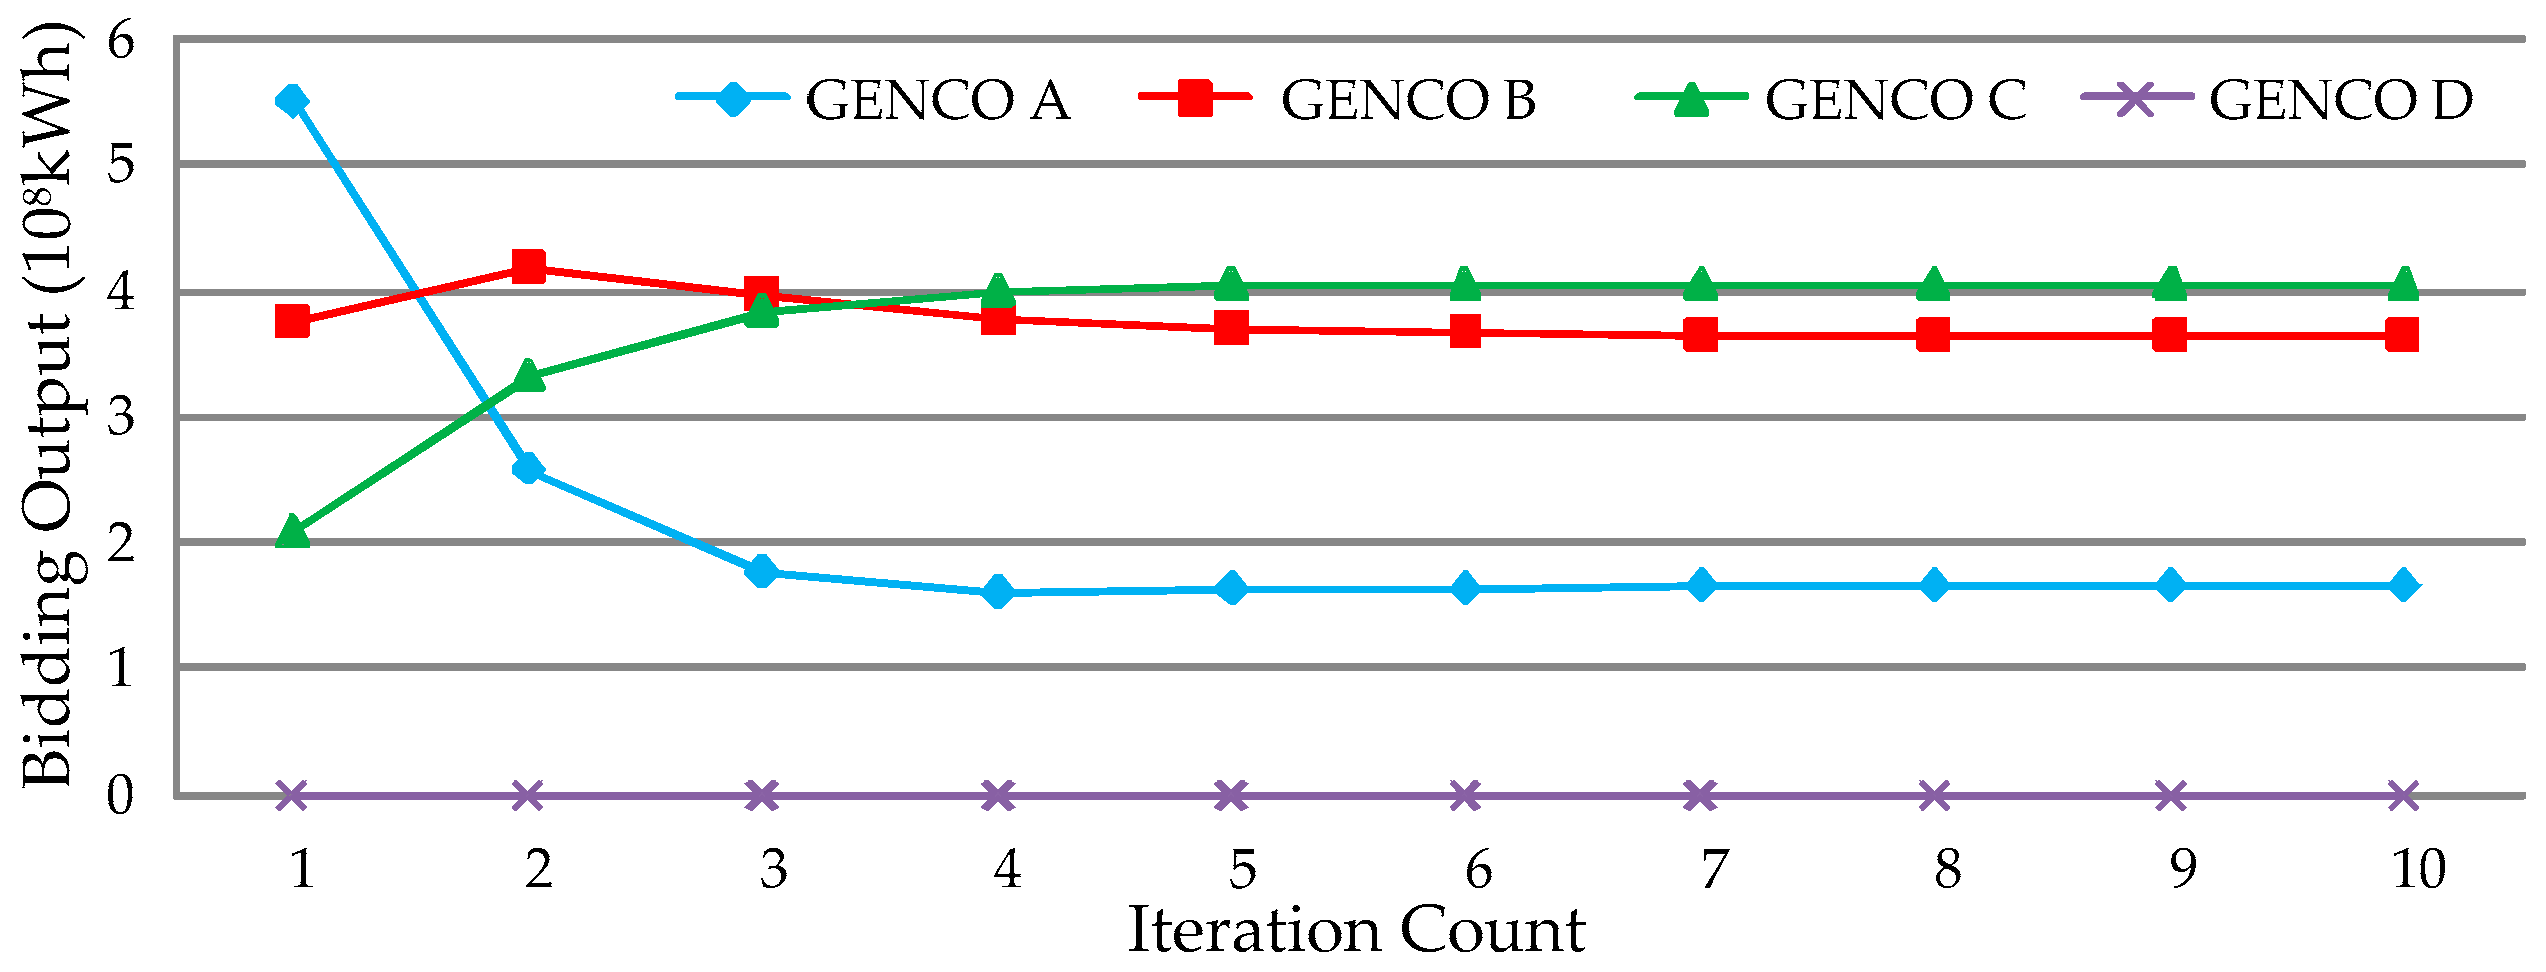
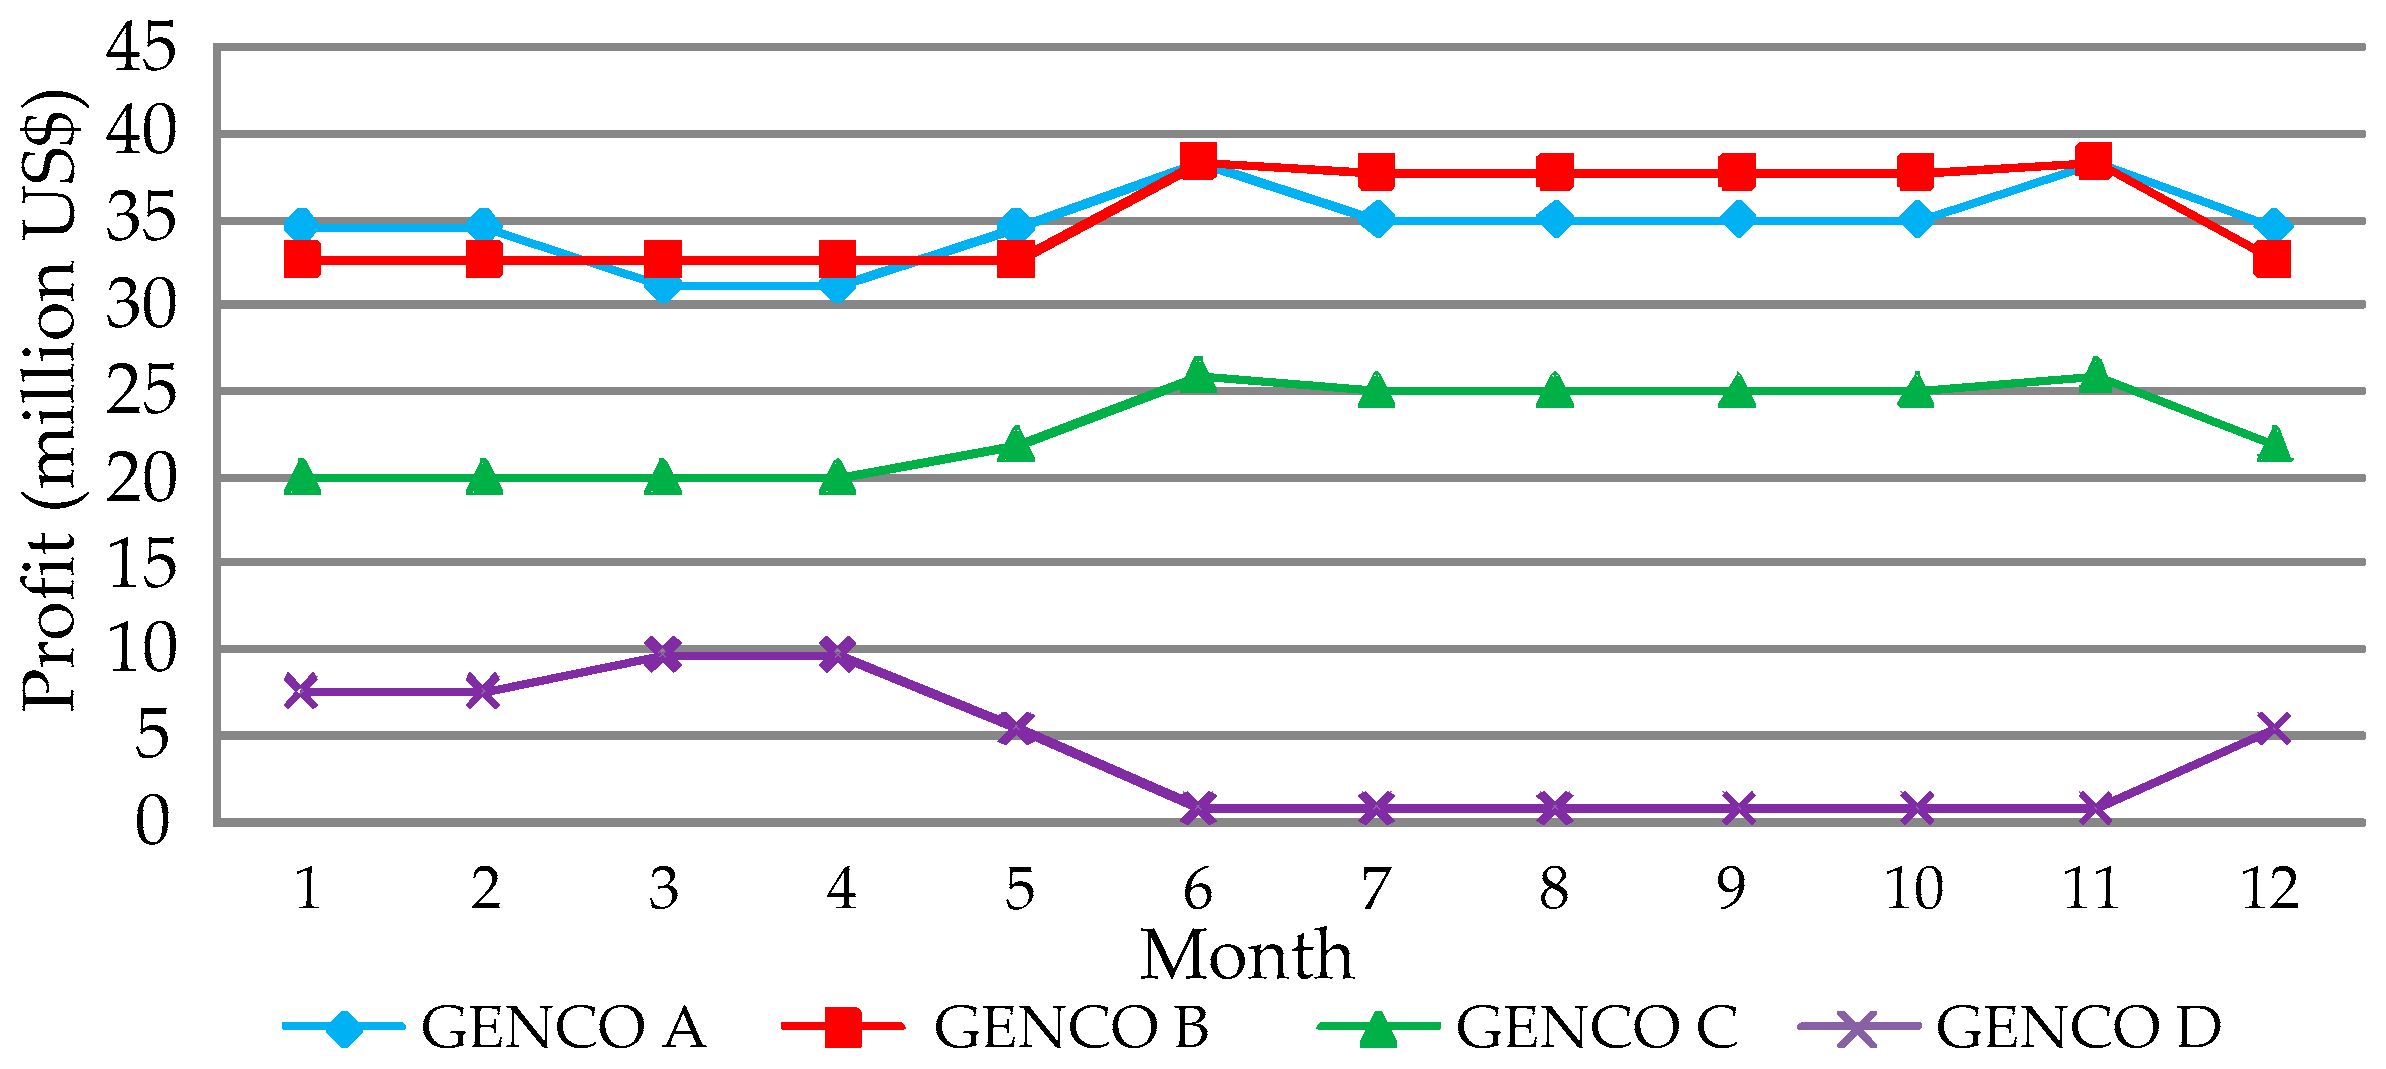
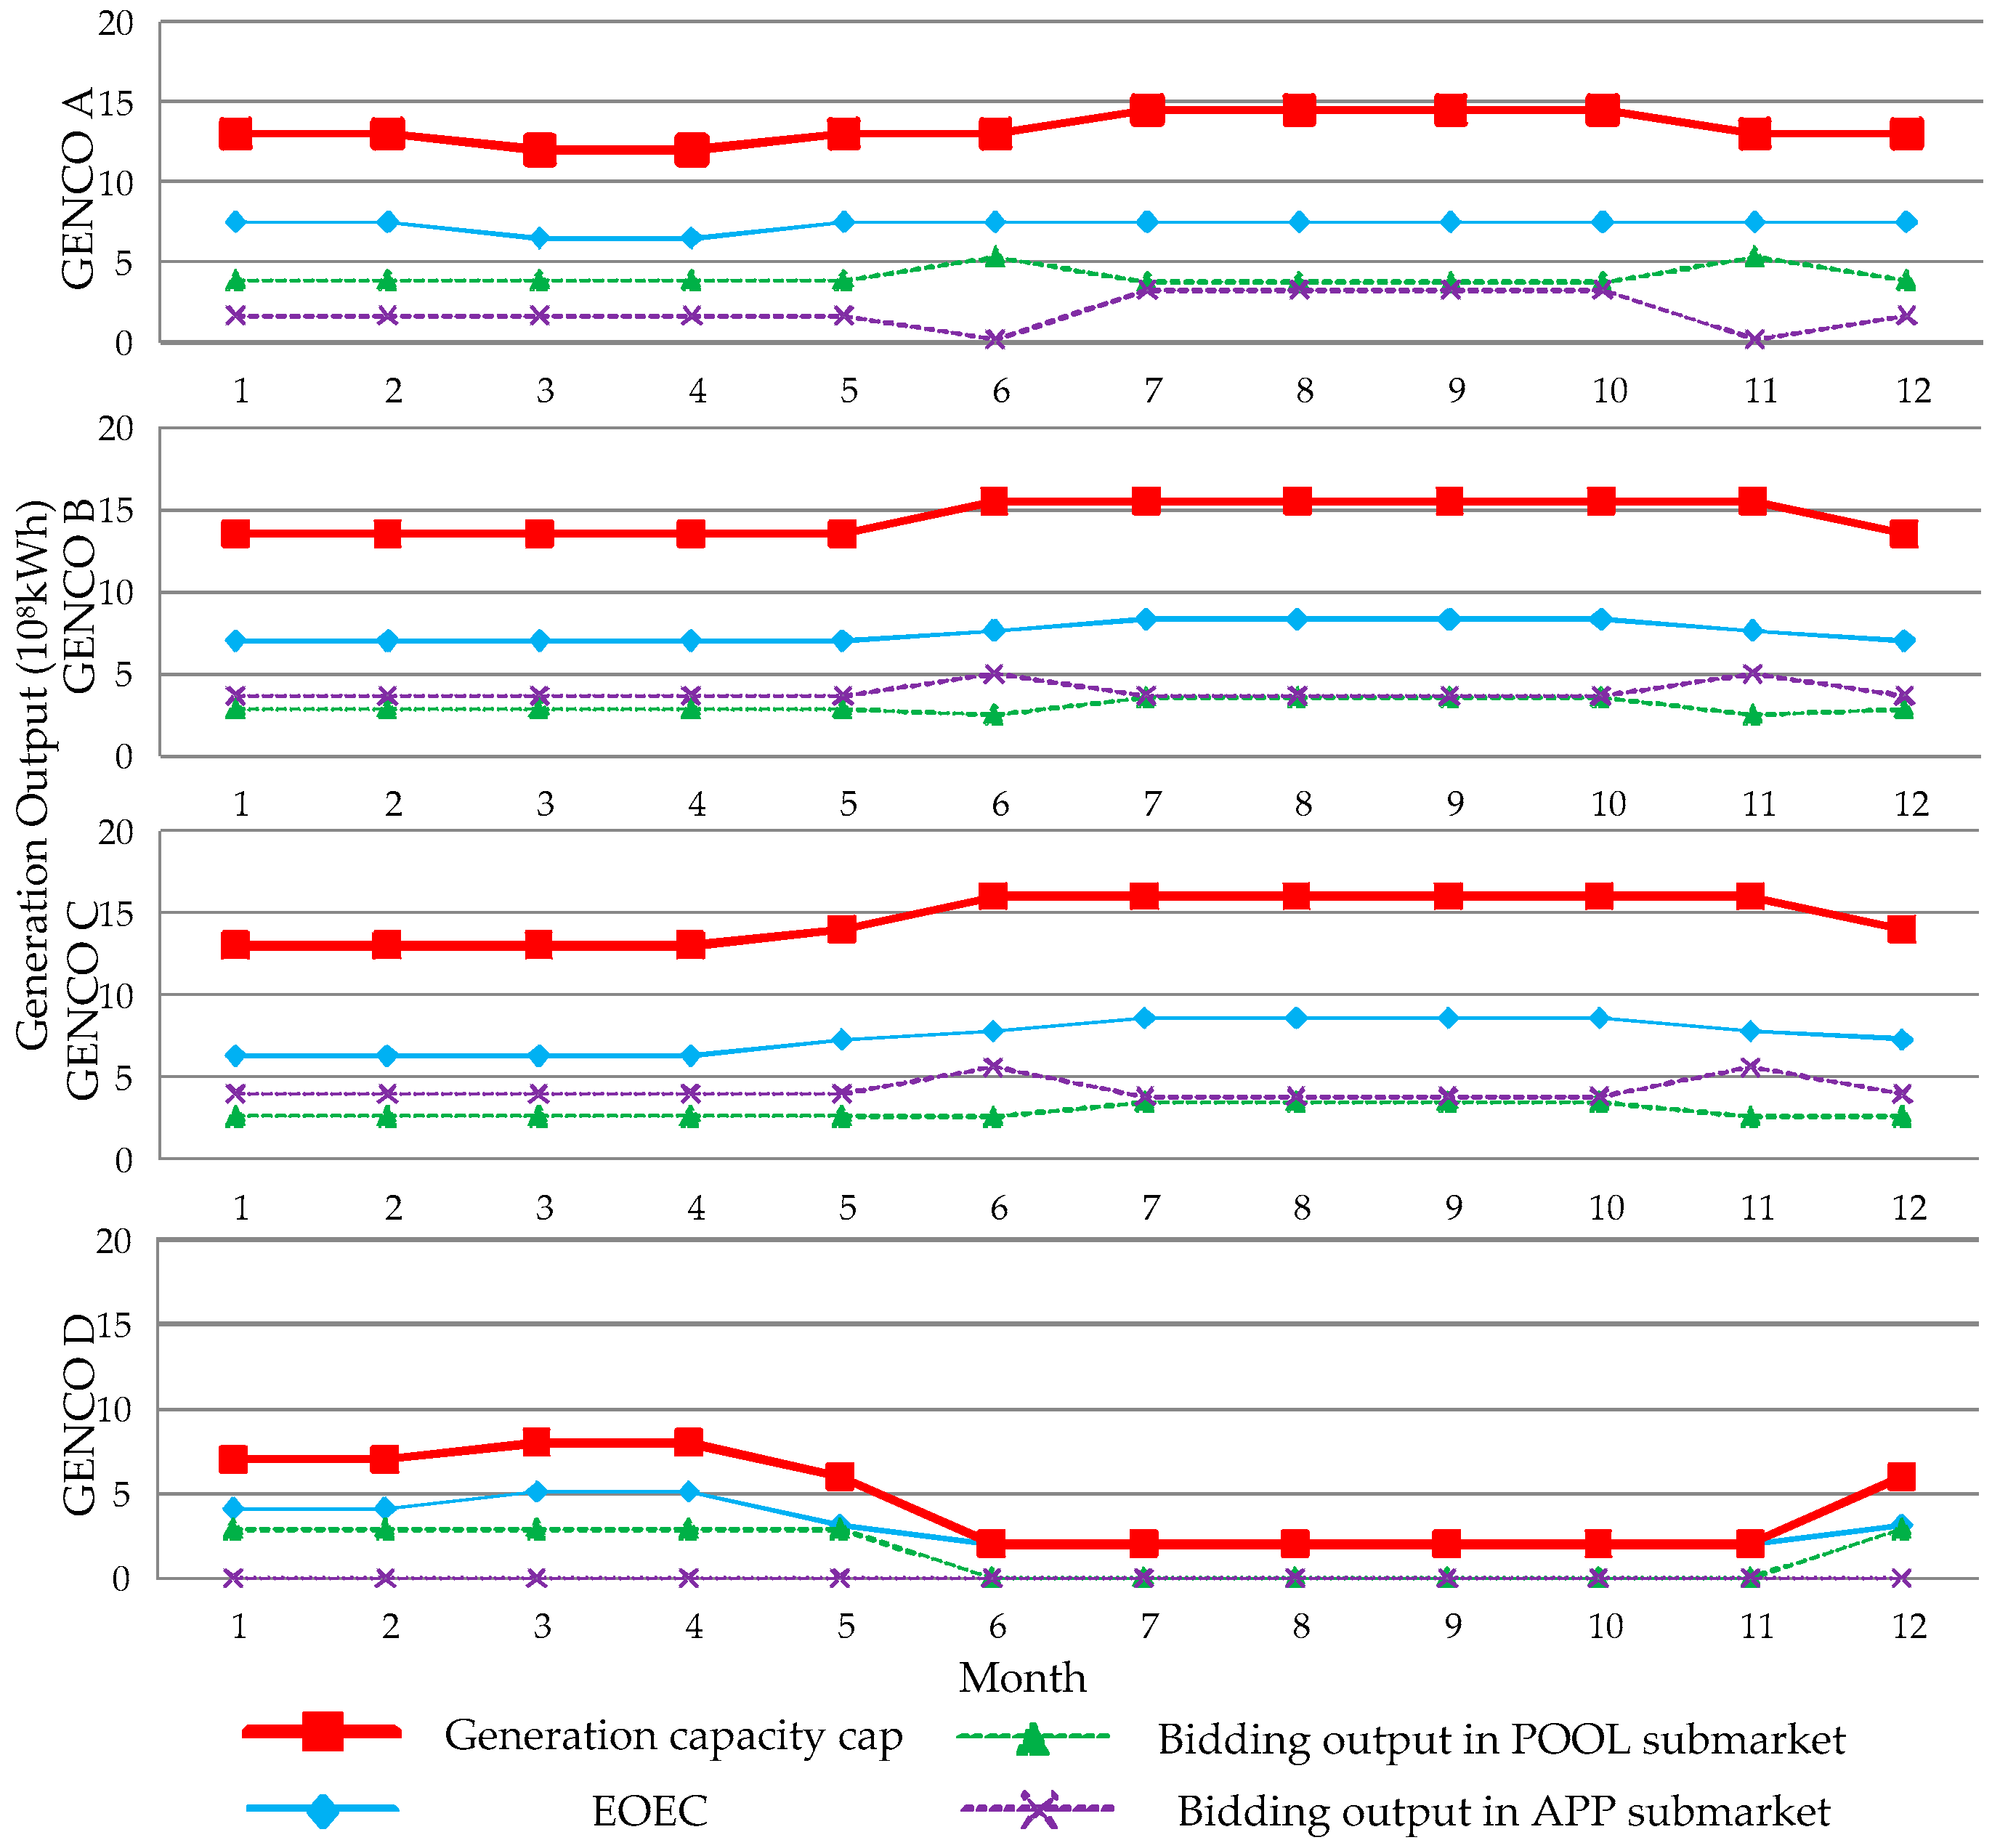
2.5. Numerical Results

An example with four GENCOs is shown to illustrate the equilibrium results. We first run the model for a single month to show its effectiveness, and then calculate the equilibrium results for an entire year. The generation cost coefficients, on-grid prices, EOECs and generation capacity caps in a single month are listed in Table 1. The slope and the intercept of the inverse demand curve are 0.865 and 0.017 respectively. The inverse demand curve p = 0.865 0.017 Q is thus used to demonstrate the proposed method.
Figure 4, Figure 5, Figure 6 and Figure 7 show the evolution of MCPs, profits, bidding outputs in POOL submarket and bidding outputs in APP submarket of each GENCO respectively. We can see that the equilibrium state is achieved after 9 counts of iteration, because the bidding outputs in both submarkets of GENCOs no longer change. Table 2 shows the equilibrium outputs, market clearing prices and profits of GENCOs.
We now calculate the equilibrium results in an entire year. As discussed in Section 2.1, time coupling issues of hydropower are considered by YNPG through EOEC contracts and generation capacity caps of GENCOs according to hydropower situations in different months. So this information is important for GENCOs to make bidding strategies. Table 3 shows EOECs and generation capacity caps in different months in an entire year.
Figure 8 plots the MCPs in POOL and APP submarkets in an entire year. Figure 9 illustrates the equilibrium profits in an entire year of GENCOs, and Figure 10 shows generation capacity caps, EOECs, bidding outputs in POOL submarket and bidding outputs in APP submarket of all four GENCOs.
From Figure 7 and Figure 8 we can see that hydro power plants earn more revenues in the flood season (from June to October) than the dry season (from December to April), but thermal power plants earn more revenue in the dry season. This is mainly because the generation caps for the different types of power plants in different months are different. In the flood season, demand in Yunnan can almost be entirely supplied with hydro power, so the cap for thermal power plant is relatively low in order to build a clean and green power system environment. In the dry season, the generation capacities of hydro power plants are insufficient, so the cap for thermal power plant is high enough in order to meet the demand and maintain the stability and safety of the power grid.

3. Impacts of Different Market Mechanism Parameters on Electricity Price

The previous section shows that it is feasible for GENCOs to maximize their profits by strategic bidding behaviors, so there is no reason for GENCOs to bid at relatively low prices to stimulate the demand at the cost of reducing their own profits. From the perspective of market designers, it is interesting to assess the impact of varying three market mechanism parameters in the proposed model on the electricity price and power generation in the market equilibrium state as GENCOs play strategically. We now briefly discuss the following three parameters:
Number of GENCOs: it is well known that in a perfect competitive electricity market, the number of GENCOs has no influence on the electricity price in the market. However, in an oligopolistic electricity market, each GENCO will offer a strategic bid to maximize its profit, so the number of GENCOs in the market will have an impact on the electricity price and power generation in the equilibrium state. In this paper, we measure the impact of the number of GENCOs on electricity price and power generation in the market with a hybrid pricing mechanism with contrast to perfect competition and well-known pool-based market.
EOECs: EOECs are bilateral contracts between GENCOs and YNPX, and they have great significances for market buyers, market sellers and the power grid. For market buyers and sellers, they guarantee minimum market shares for market buyers or sellers in order to maintain their market positions at early stage of Yunnan’s electricity market. For power grid, because there is no real-time balancing market, ancillary service market or reserve market, the stability and security operation of the power grid are guaranteed by the regulated EOECs, which are dispatched by YNPG. So, how the existing EOEC will impact the electricity price and equilibrium generation should be assessed.
Demand elasticity: demand is usually regarded as inelastic in electricity market analysis. While the newly established Yunnan’s electricity market is a monthly market, in a relatively long time span, electricity consumers can alter their production plans according to different market situations, so it is necessary to take the impact of demand elasticity into consideration. The impact of varying demand elasticity on electricity price and equilibrium generation will be analyzed and contrasted with those in perfect competition market and well-known pool-based market.

3.1. Market Equilibrium State in Different Market Mechanisms

In order to assess the impact of varying market mechanism parameters on electricity price and power generation, the analytical solutions of electricity price and power generation in a perfect competition market and a pool-based market are used for comparison. In this section, we assume generation cost parameters of all GENCOs have the same value. We first calculate the electricity price and power generation in a perfect competition market. In a perfect competition environment, the problem of maximizing profit for GENCOs is the same as Equations (10) and (11). However, no EOEC are contracted with GENCOs, and GENCOs’ behaviors cannot affect the market, so they are in a market as price takers instead of price makers. Thus, the electricity price and power generation in the market can be obtained as each GENCO bid according to the price in the market:
p c c = p P O O L i = 1 n q i , P O O L + p A P P i = 1 n q i , A P P i = 1 n q i , P O O L + i = 1 n q i , A P P = β a 0 + n α b i n α + a 0
Q c c = n ( β b 0 ) n α + a 0
where p c c and Q c c are electricity price and generation in the perfect competition market. According to the economics theory, the price and generation in the perfect competition market can be regarded as benchmarks for comparison.
In a well-known pool-based market, the clearing and pricing mechanism are just as the POOL submarket mentioned before, so the problems faced by GENCOs are:
max : π i = K i q i , E O E C + p p o o l q i , p o o l C ( q i , E O E C + q i , p o o l ) ( i N )
where q i , p o o l represents the bidding output of GENCO i in a pool-based market.
The equilibrium state of the pool-based market mechanism is fully studied, so we just give out the optimal bidding strategy, electricity price and generation in the market, which are given by Equations (16)–(18), respectively:
q i , p o o l * = ( β α i = 1 n q i , E O E C a 0 q i , E O E C b 0 ) ( n + 1 ) α ( i N )
p p o o l c = p p o o l i = 1 n q i , p o o l * + i = 1 n K i q i , E O E C i = 1 n q i , p o o l * + i = 1 n q i , E O E C
Q p o o l c = i = 1 n q i , p o o l * + i = 1 n q i , E O E C = n β + α i = 1 n q i , E O E C n b 0 ( n + 1 ) α + a 0
where q i , p o o l * represents the optimal bidding output of GENCO i in the pool-based market, p p o o l c and Q p o o l c represent the electricity price and power generation in the equilibrium state of a pool-based market.
In Yunnan’s electricity market with a hybrid pricing mechanism, the market equilibrium state can be obtained by calculating the two-dimensional Nash equilibrium of the model. We first calculate the first-order partial derivative of the profit function versus q i , P O O L and q i , A P P of the profit function to obtain the response function of GENCO i to other GENCOs:
( q i , P O O L q i , A P P ) = ( π i / q i , P O O L π i / q i , A P P )
The optimal two-part bidding strategy for GENCO i is obtained when its response function equals to zero. Thus, the two-dimensional Nash equilibrium is obtained when each GENCO’s optimal two-part bidding strategy is chosen, corresponding to the solution of Equation (20):
[ ( π 1 q 1 , P O O L , π 1 q 1 , A P P ) ( π 2 q 2 , P O O L , π 2 q 2 , A P P ) ( π n q n , P O O L , π n q n , A P P ) ] = [ 0 0 0 ]
Substituting Equations (5), (7) and (10) into (20) yields the two-dimensional Nash equilibrium and the two-part bidding strategy for each GENCO is shown in Equation (21):
( q i , P O O L q i , A P P ) * = ( ( n 1 ) ( β α i = 1 n q i , E O E C a 0 q i , E O E C b 0 ) ( n 2 + 1 ) α + ( n + 1 ) a 0 ( n 1 ) ( β α i = 1 n q i , E O E C a 0 q i , E O E C b 0 ) ( n 2 + 1 ) α + ( n + 1 ) a 0 ) ( i N )
where the symbol * denotes the value in the equilibrium state.
Therefore, the average electricity price and power generation in Yunnan’s electricity market are calculated as:
p h y b r i d c = p P O O L i = 1 n q i , P O O L * + p A P P i = 1 n q i , A P P * + i = 1 n K i q i , E O E C i = 1 n q i , P O O L * + i = 1 n q i , A P P * + i = 1 n q i , E O E C
Q h y b r i d c = i = 1 n q i , P O O L * + i = 1 n q i , A P P * + i = 1 n q i , E O E C = ( n 2 + n ) ( β b 0 ) ( n 1 ) α i = 1 n q i , E O E C ( n 2 + 1 ) α + ( n + 1 ) a 0
where p h y b r i d c and Q h y b r i d c represent the electricity price and power generation in the equilibrium state of the market with a hybrid mechanism.
In order to assess the impact of different market mechanism parameters on electricity price, market power is used in following sections as an index. In an oligopolistic electricity market, oligopolistic GENCOs always have market power to some extent, so the electricity price is higher than in a perfect competition market. Market power can be expressed as the ratio of price in oligopolistic market to perfect competition market, which can be expressed as η p o o l = p p o o l c p c c and η h y b r i d = p h y b r i d c p c c .

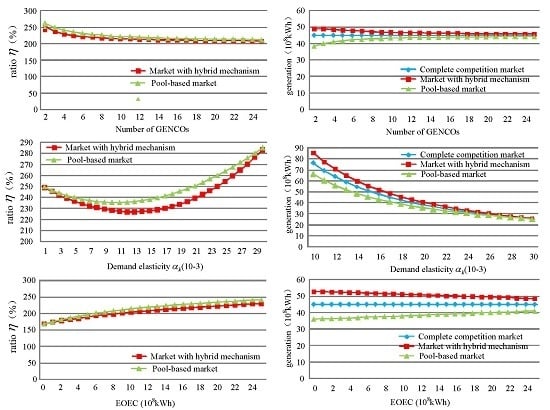
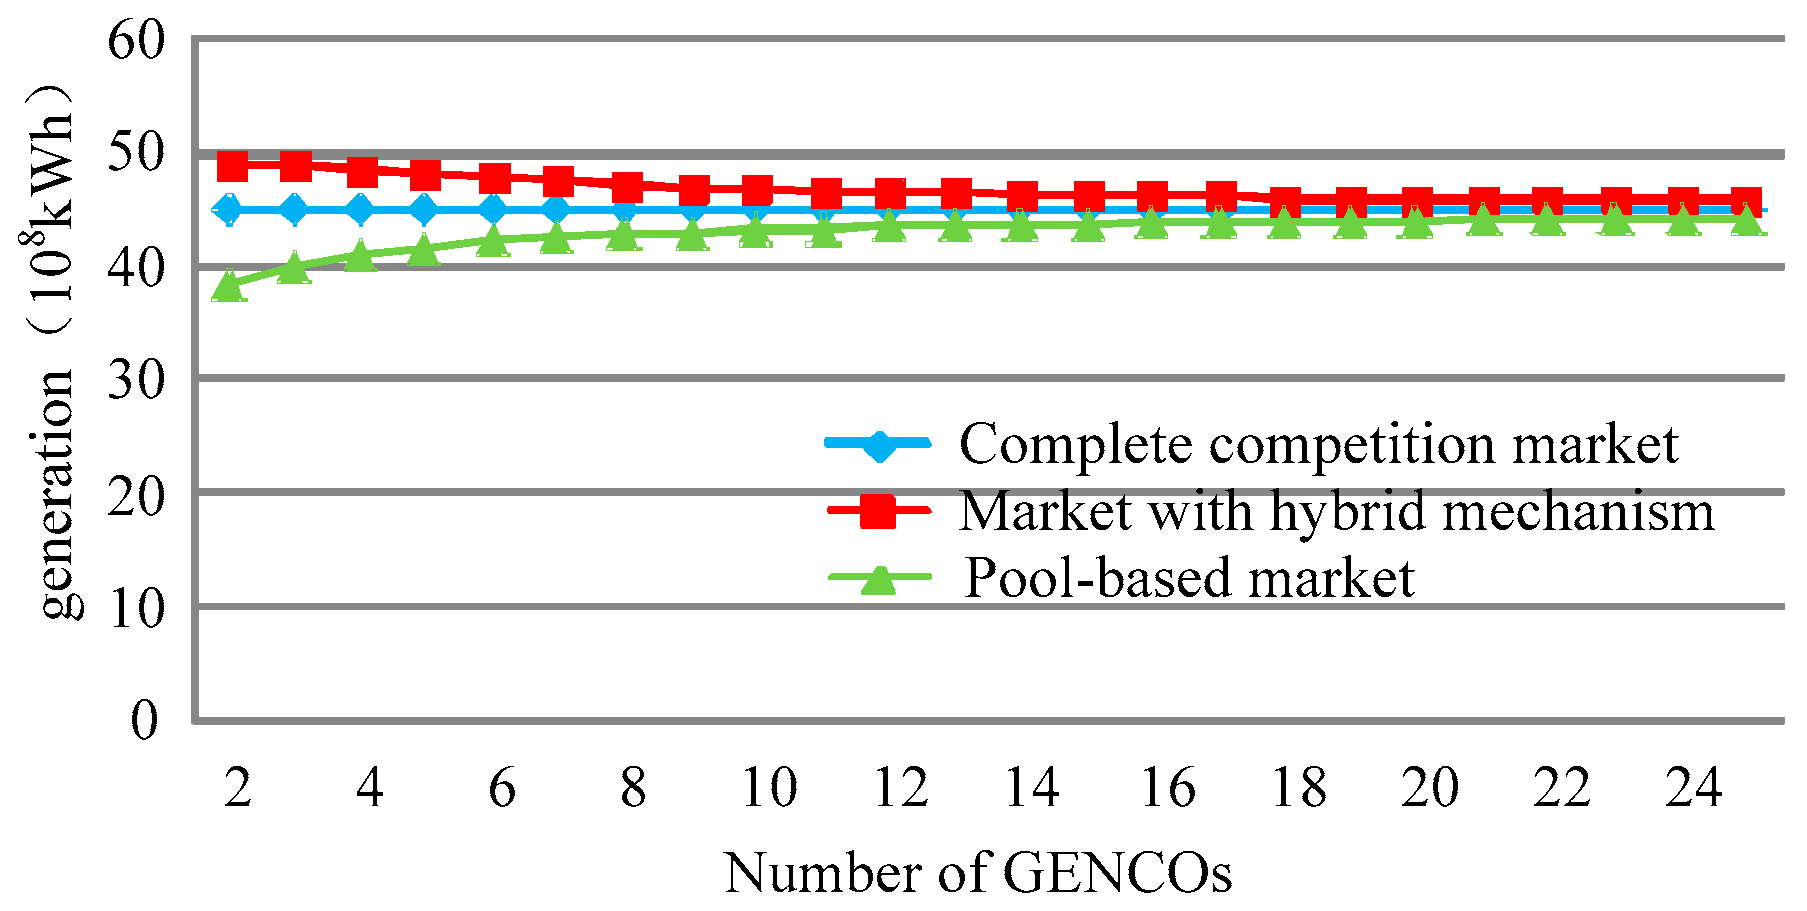
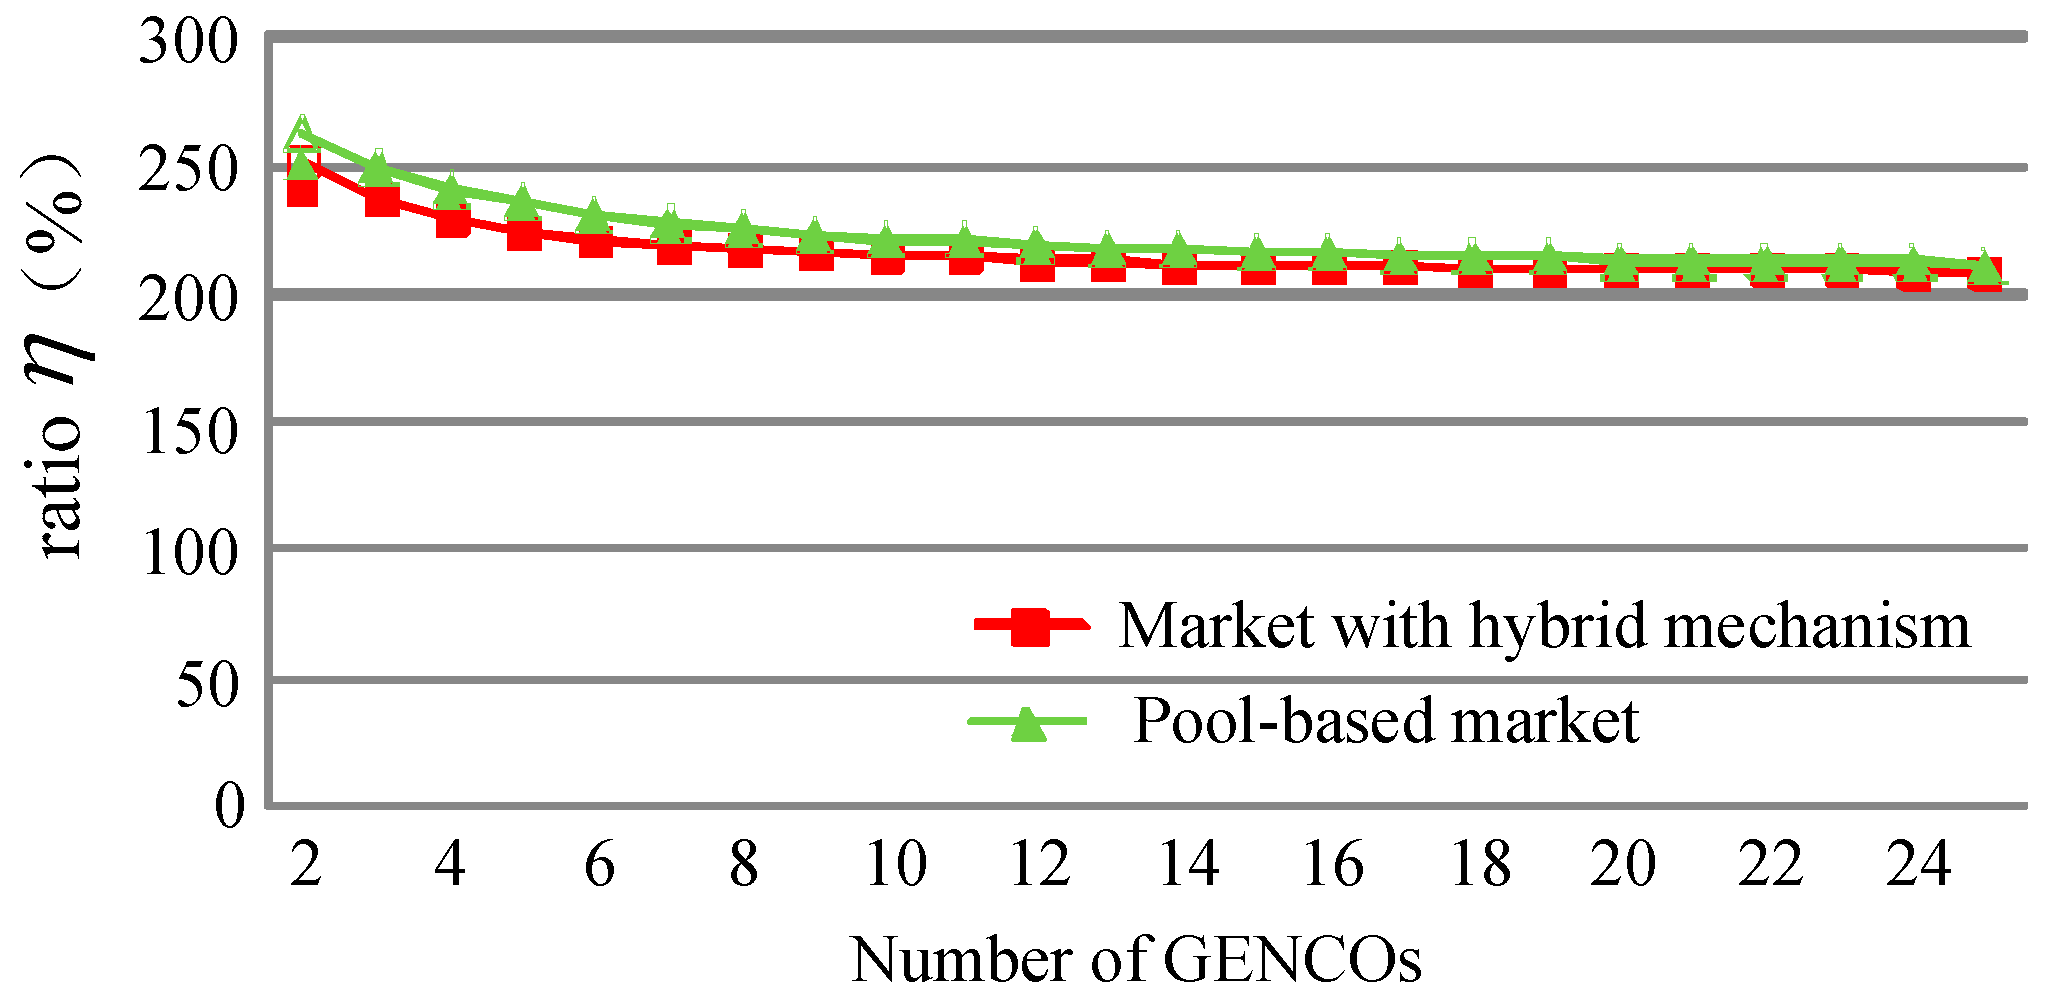
3.2. Impact of the Number of GENCOs

Figure 11 demonstrates that the electricity price in a market with hybrid mechanism is always lower than in a pool-based market. With the number of GENCOs increases, the price gradually falls in both markets. As the number of GENCOs participating in the market continues to increase, the market is closer to perfect competition, so the difference between electricity prices in different markets are getting closer. Still, as long as EOECs are contracted, the electricity price will remain higher than in perfect competition. The reason for this phenomenon will be discussed in Section 3.3.
Moreover, from Figure 12 we can see that when there are few GENCOs in the market, the market power is serious. GENCOs will increase their bidding outputs in the market with hybrid pricing mechanism and reduce their bidding outputs in the pool-based market in order to maximize their profits. Obviously, among different mechanisms, the hybrid pricing mechanism results in more generation than a perfect competition mechanism, and the well-known pool-based market results in less generation. Still, with more and more GENCOs participating in the market, there is less market power in each market, and the gaps in generation between different markets are reduced. The market power and gaps in generation will disappear until the number of GENCOs is so large to turn the market into a perfect competition situation.

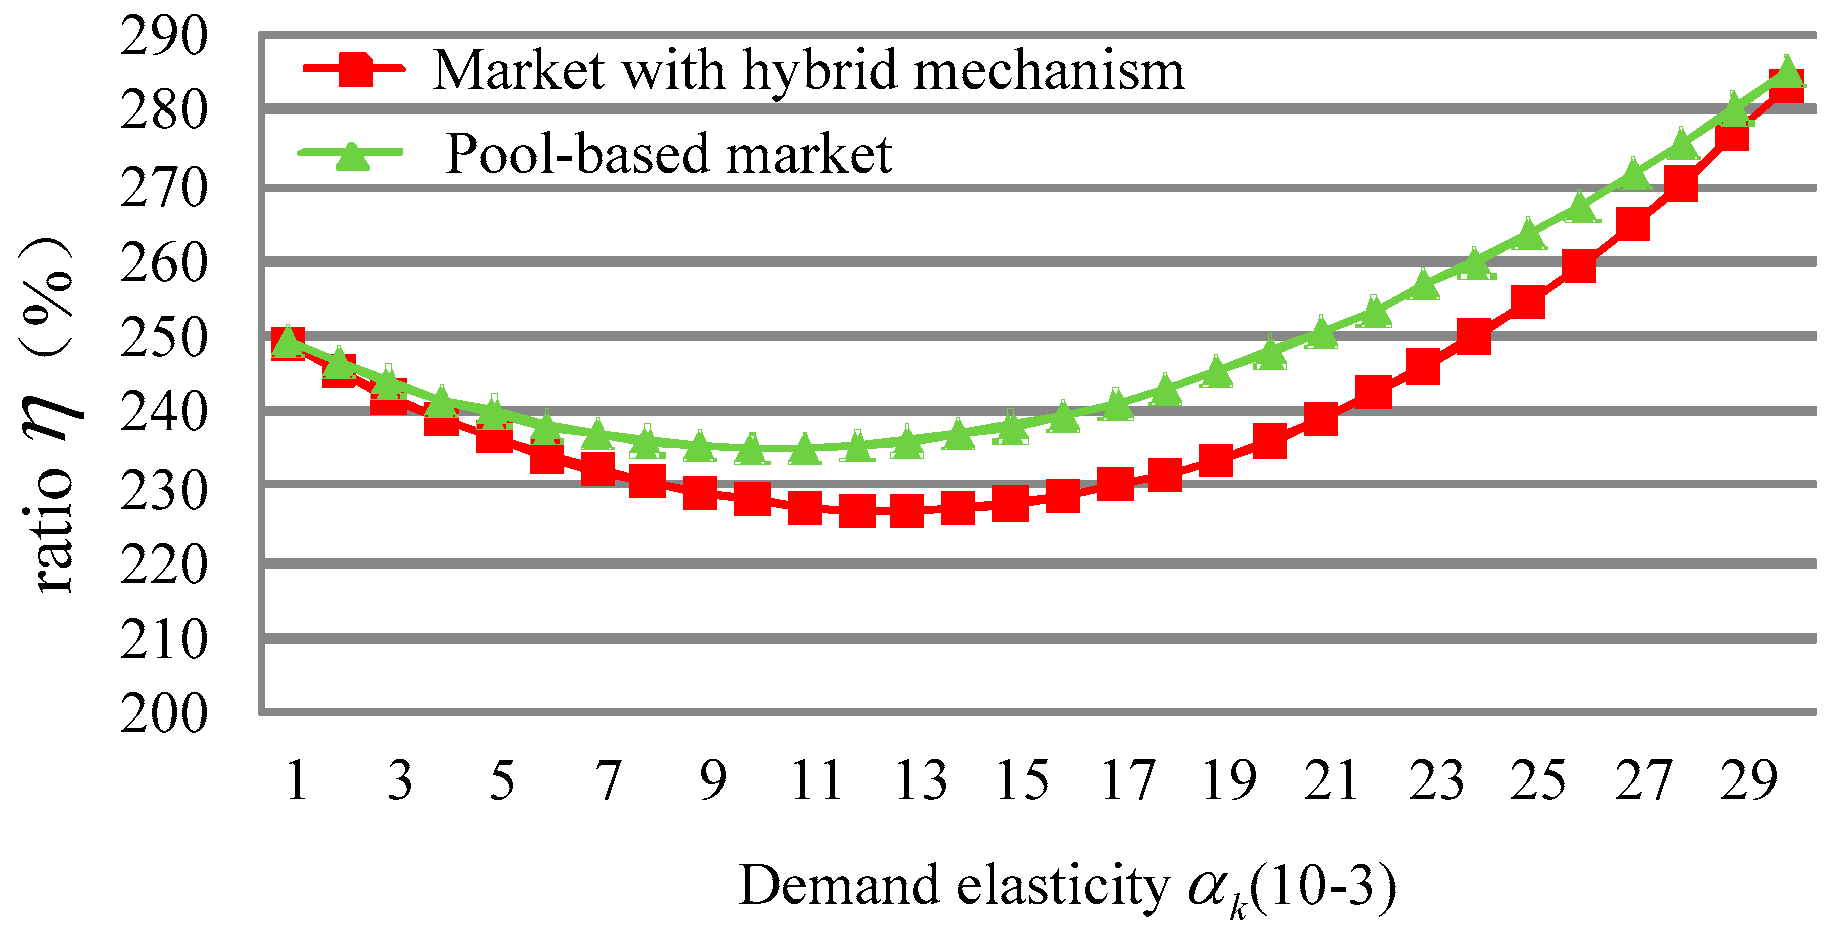
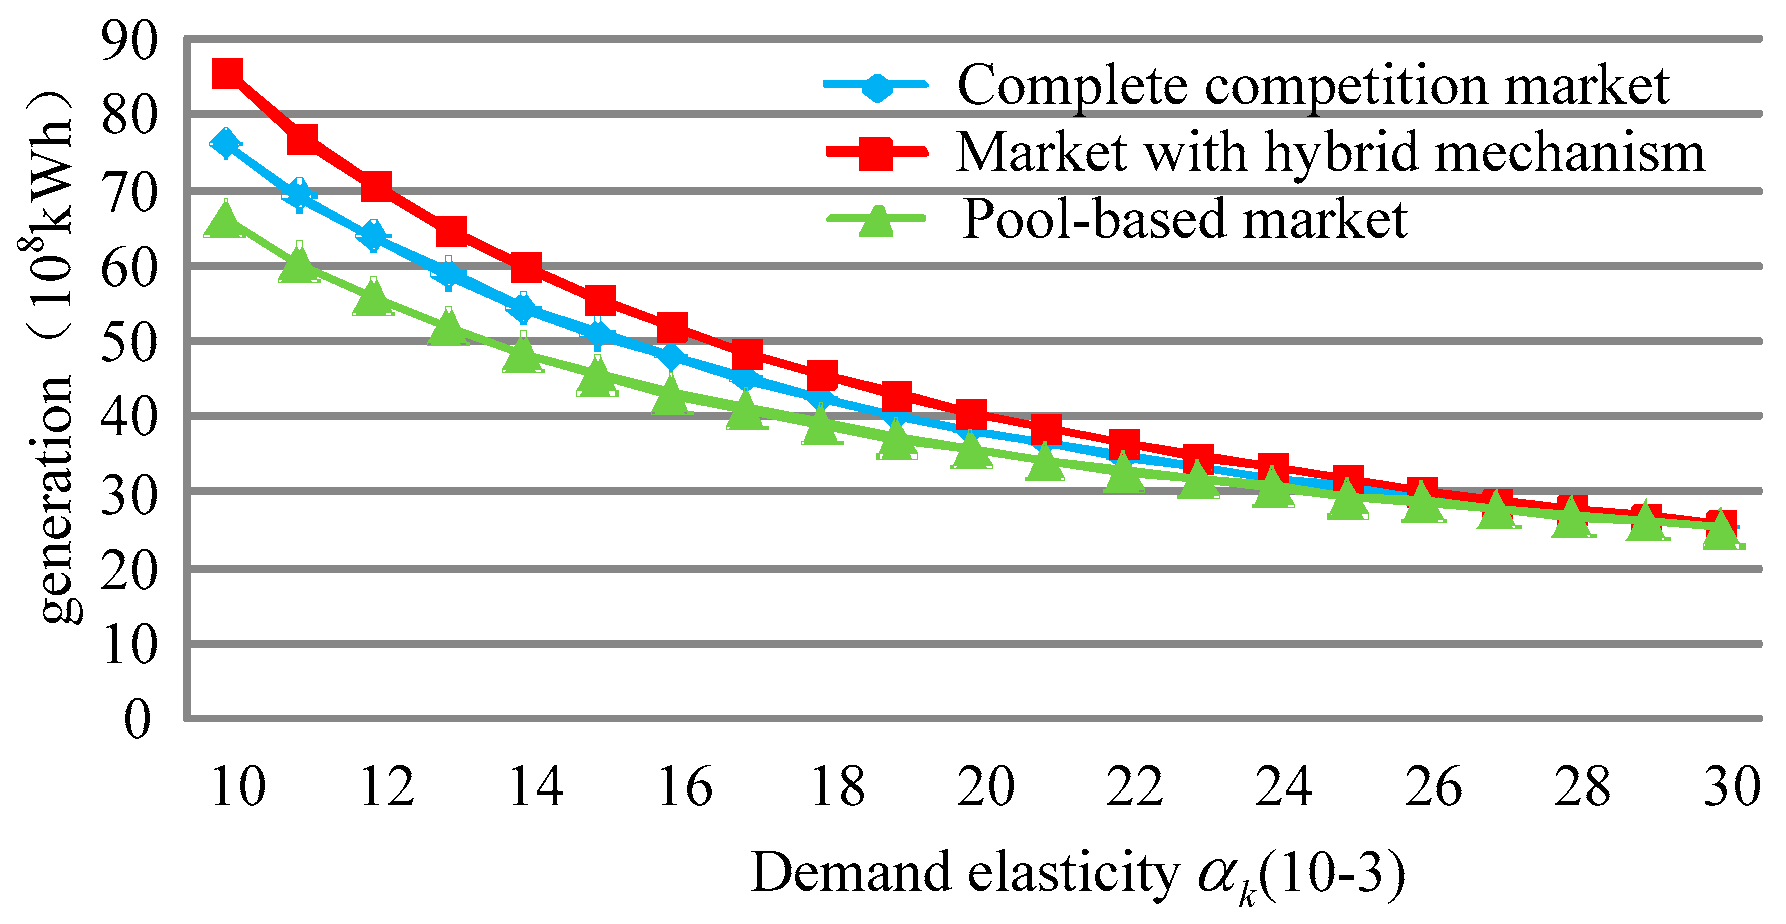
3.3. Impact of Demand Elasticity
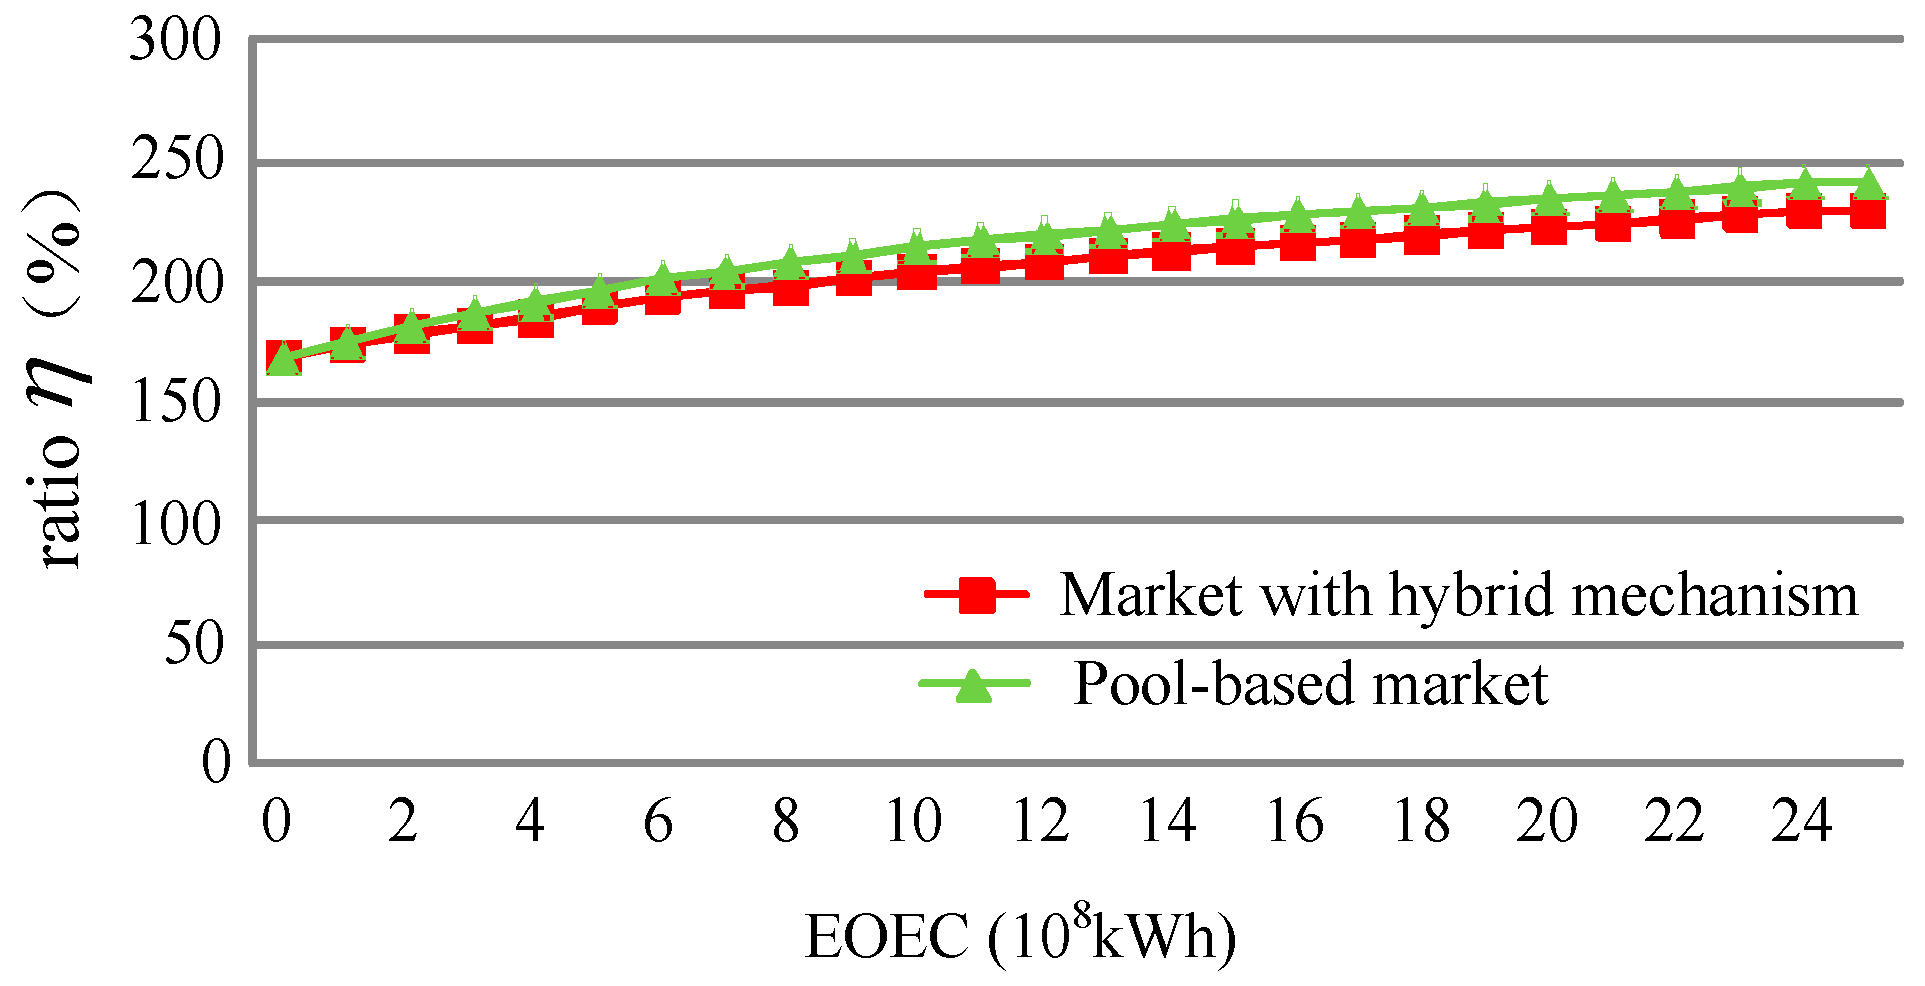
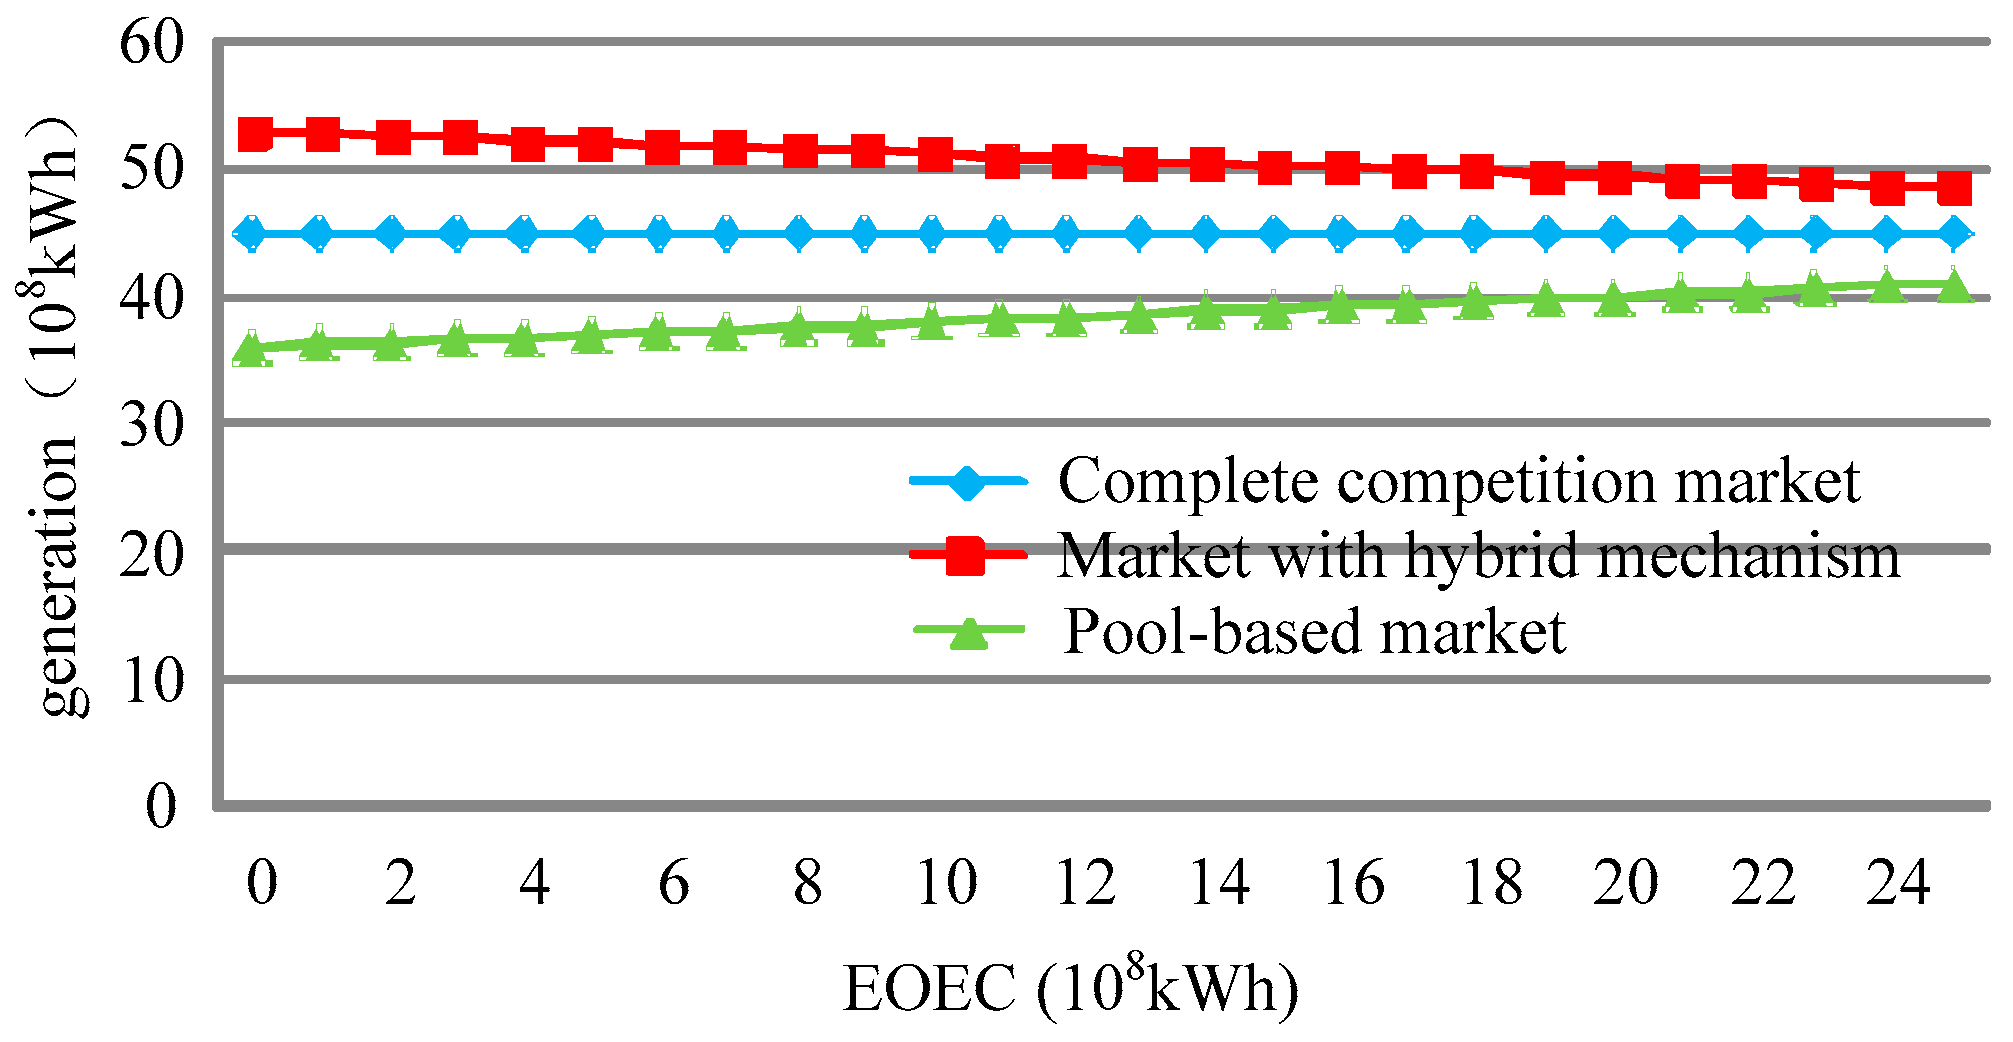
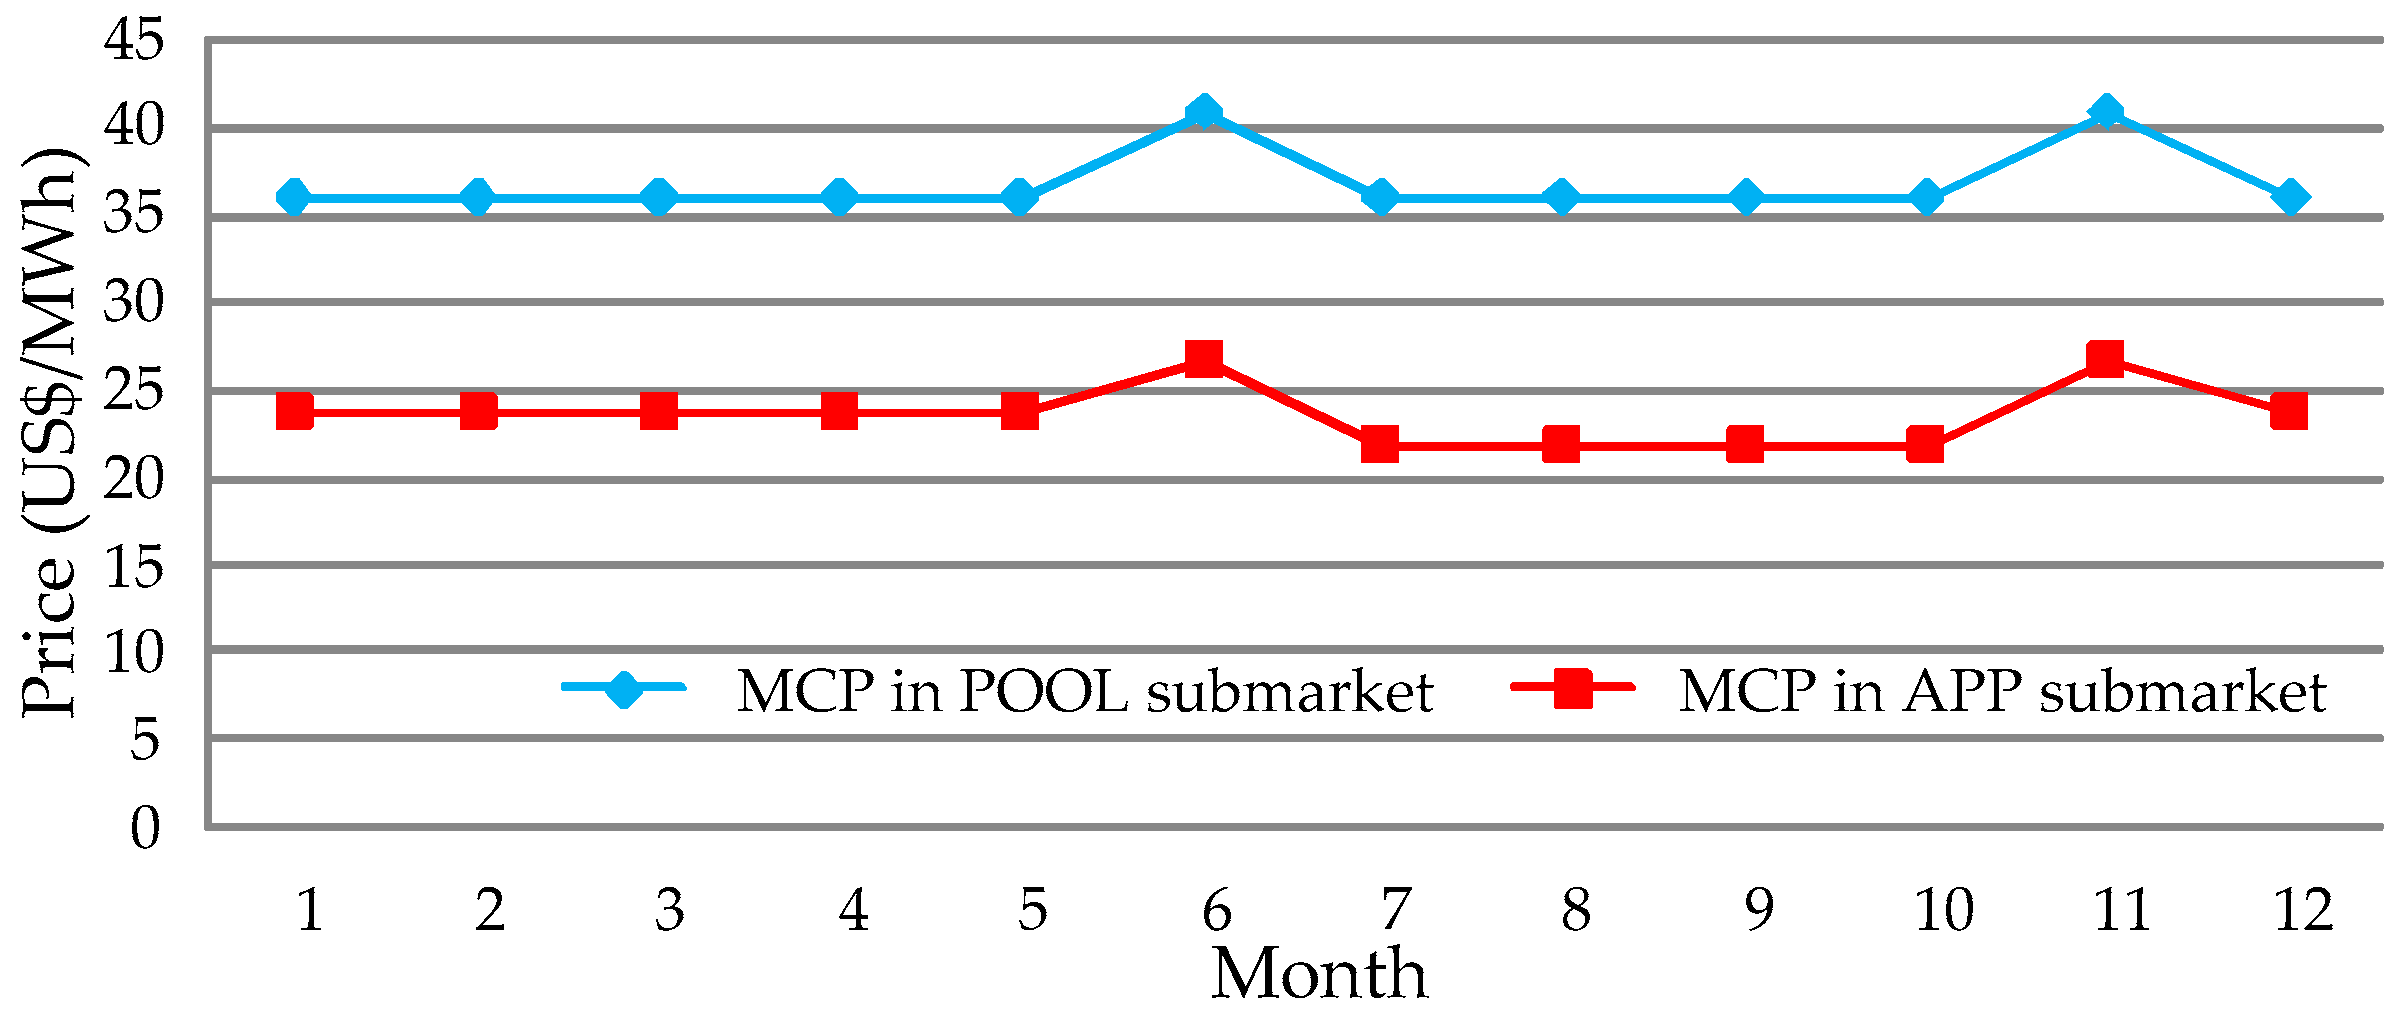
Figure 13 shows the numerical results of impacts on electricity price when demand elasticity varies in markets with different mechanisms. It is obvious that the electricity price in a well-known pool-based market is always higher than in a market with hybrid pricing mechanism. As we can see, electricity prices in both markets reduce as the demand elasticity increases at first, and then rise as the demand elasticity continues to increase. Figure 14 illustrates the trends in power generation as demand elasticity varies in markets with different mechanisms. The straightforward conclusion is that GENCOs in the market with the hybrid pricing mechanism will generate more electricity than in a perfect competition market. Moreover, the gaps of power generation between different markets narrow as demand elasticity increases.
However, the results also reveal that when the demand elasticity increases to a certain extent or a certain value, the gaps in price and power generation disappear. So far, it is still unclear whether the price in a pool-based market will be lower than in a market with hybrid pricing mechanism, or whether the power generation in a pool-based market will be more than in a market with hybrid pricing mechanism. To explain this question, the feature of EOECs is first analyzed. As introduced before, EOECs are bilateral contracts between GENCOs and the power grid on the supply side. On the demand side, the electricity contracted in EOECs must correspond to actual consumption. So the demand elasticity cannot increase indefinitely, in market with any mechanism, the electricity contracted by EOEC must be met on the demand side, that is:
Q p o o l c = n β + α i = 1 n q i , E O E C n b 0 ( n + 1 ) α + a 0 i = 1 n q i , E O E C
Q h y b r i d c = ( n 2 + n ) ( β b 0 ) ( n 1 ) α i = 1 n q i , E O E C ( n 2 + 1 ) α + ( n + 1 ) a 0 i = 1 n q i , E O E C
Calculating the expressions in Formulas (24) and (25) leads to:
α p o o l n β n b 0 a 0 i = 1 n q i , E O E C n i = 1 n q i , E O E C
α h y b r i d n β n b 0 a 0 i = 1 n q i , E O E C n i = 1 n q i , E O E C
where α p o o l and α h y b r i d represent possible values of the demand elasticity in a pool-based market and a market with hybrid pricing mechanism. Thus, in a market with EOECs contracted, the demand elasticity cannot increase indefinitely, and the upper limit of demand elasticity is a function of the total electricity contracted between GENCOs and the power grid.

3.4. Impact of EOEC

Figure 15 shows the impact of EOEC on the electricity price in markets with different mechanisms. When no EOEC is contracted, electricity prices in both markets are the same. Still, when there are EOECs contracted in the market, the electricity price in a pool-based market is higher than in a market with hybrid pricing mechanism. With the quantity of EOEC increasing, prices in both markets rise and the gap between the two prices widens. EOEC, as introduced before, is a kind of bilateral contract between GENCOs and the power grid. However, compared the numerical results with data in reference [30], an interesting phenomenon can be found out. In reference [30], bilateral contracts are regarded as a method of mitigating the market power. While in this paper, the electricity price rises as more EOECs contracted, resulting in more serious market power in the market. That is mainly because the price of bilateral contracts is relatively low in reference [30], while the price of EOECs is the on-grid price of each GENCO decided by NDRC, which is much higher than market clearing price in the market [31], so more contracted EOECs means GENCOs can generate at a higher price, which increases the market power of GENCOs in the market. The question raised in Section 3.2, asking why the electricity price in markets with EOEC contracted will always be higher than in a perfect competition market can also be explained.
We can tell from Figure 16 that no matter how many EOECs are contracted, GENCOs in a market with hybrid pricing mechanism generate the most electricity, and GENCOs in a pool-based market generate the least electricity.
With more EOECs contracted in the market, the difference between different markets in power generation becomes smaller. When all possible generation in a market with certain demand elasticity are all contracted as EOECs, power generation in markets with different mechanisms will be the same. As discussed in Section 3.3, in a market with certain demand elasticity, there is an upper limit of EOECs, expressed by the formula transformation of Equations (26) and (27):
i = 1 n q i , b a s e n β n b 0 n α p o o l + a 0
i = 1 n q i , b a s e n β n b 0 n α h y b r i d + a 0

4. Conclusions

According to the hybrid pricing mechanism adopted by the newly established Yunnan’s electricity market, a two-dimensional Cournot model is proposed to study the strategic bidding behaviors of GENCOs, since it is not a perfect competitive market. The market equilibrium is obtained by iteratively solving each GENCO’s profit maximization problem and finding their optimal bidding outputs. Numerical results demonstrate the feasibility of the proposed model. Moreover, impacts of the number of GENCOs, the demand elasticity and the quantity of EOEC on the electricity price and the power generation in market equilibrium are fully assessed. The analysis results show that all these market mechanism parameters have notable effects on the electricity price and the power generation. We may safely learn the following from the analysis results:
(1)
The electricity price in a market with hybrid pricing mechanism is always lower than those in the other two markets; and the power generated in a market with hybrid pricing mechanism is higher than those in the other two markets.
(2)
A larger number of GENCOs or fewer EOECs contracted with GENCOs will have positive effects on reducing the price. While, with the increase of demand elasticity, the price falls first and then rises because the existence of EOEC contracts.
(3)
There is a restrictive relation between demand elasticity and EOECs in markets.
These numerical results of bidding strategies and analysis results of impacts of market mechanism parameters should be of practical interest to market participants in developing bidding strategies or to market designers in setting market mechanism parameters in Yunnan’ electricity market or other similar markets. The proposed model could be used for further study, which may be another subject.

Acknowledgments

This study is supported by the National Natural Science Foundation of China (No. 91547201), the Major International Joint Research Project from the National Nature Science Foundation of China (51210014) and The Fundamental Research Funds for the Central Universities (DUT16QY14).

Author Contributions

Chuntian Cheng and Fu Chen developed and solved the proposed model and carried out this analysis. Fu Chen and Gang Li wrote the manuscript and contributed to the revisions. Qiyu Tu provided the policy documents and the data used in this paper.

Conflicts of Interest

The authors declare no conflict of interest.

References

  1. The Central People’s Government of PRC. Relative Policies on Deepening the Reform of Power Industry. Available online: http://www.ne21.com/news/show-64828.html (accessed on 24 March 2015).
  2. Cheng, C.; Liu, B.; Chau, K.; Li, G.; Liao, S. China’s small hydropower and its dispatching management. Renew. Sustain. Energy Rev. 2015, 42, 43–55. [Google Scholar] [CrossRef]
  3. Hennig, T.; Wang, W.; Feng, Y.; Ou, X.; He, D. Review of Yunnan’s hydropower development. Comparing small and large hydropower projects regarding their environmental implications and socio-economic consequences. Renew. Sustain. Energy Rev. 2013, 27, 585–595. [Google Scholar] [CrossRef]
  4. Yunnan Provincial Industry & Information Technology Commission. Working Program of Yunnan’s 2015 Electricity Market. Available online: http://www.ynetc.gov.cn/Item/11399.aspx (accessed on 29 December 2014).
  5. Woo, C.; Lloyd, D.; Tishler, A. Electricity market reform failures: UK, Norway, Alberta and California. Energy Policy 2003, 31, 1103–1115. [Google Scholar] [CrossRef]
  6. Woo, C.K. What went wrong in California’s electricity market? Energy 2001, 26, 747–758. [Google Scholar] [CrossRef]
  7. Yunnan Provincial Industry & Information Technology Commission. Detailed Rules of Yunnan’s 2015 Electricity Market. Available online: http://www.ynetc.gov.cn/Item/11399.aspx (accessed on 29 December 2014).
  8. David, A.K. Competitive Bidding in Electricity Supply. IEE Proc. C 1993, 140, 421–426. [Google Scholar] [CrossRef]
  9. Conejo, A.J.; Nogales, F.J.; Arroyo, J.M. Price-taker bidding strategy under price uncertainty. IEEE Trans. Power Syst. 2002, 17, 1081–1088. [Google Scholar] [CrossRef]
  10. Song, H.L.; Liu, C.C.; Lawarree, J.; Dahlgren, R.W. Optimal electricity supply bidding by Markov decision process. IEEE Trans. Power Syst. 2000, 15, 618–624. [Google Scholar] [CrossRef]
  11. Krause, T.; Beck, E.V.; Cherkaoui, R.; Germond, A.; Andersson, G.; Ernst, D. A comparison of Nash equilibria analysis and agent-based modelling for power markets. Int. J. Electr. Power 2006, 28, 599–607. [Google Scholar] [CrossRef]
  12. Kang, D.; Kim, B.H.; Hur, D. Supplier bidding strategy based on non-cooperative game theory concepts in single auction power pools. Electr. Power Syst. Res. 2007, 77, 630–636. [Google Scholar] [CrossRef]
  13. Zhang, H.; Gao, F.; Wu, J.; Liu, K.; Liu, X. Optimal Bidding Strategies for Wind Power Producers in the Day-ahead Electricity Market. Energies 2012, 5, 4804–4823. [Google Scholar] [CrossRef]
  14. Contreras, J.; Candiles, O.; de la Fuente, J.I.; Gomez, T. A cobweb bidding model for competitive electricity markets. IEEE Trans. Power Syst. 2002, 17, 148–153. [Google Scholar] [CrossRef]
  15. Song, Y.; Ni, Y.; Wen, F.; Hou, Z.; Wu, F.F. Conjectural variation based bidding strategy in spot markets: fundamentals and comparison with classical game theoretical bidding strategies. Electr. Power Syst. Res. 2003, 67, 45–51. [Google Scholar] [CrossRef]
  16. Song, Y.Q.; Ni, Y.X.; Wen, F.S.; Wu, F.F. Analysis of strategic interactions among generation companies using conjectured supply function equilibrium model. In Proceedings of the 2003 IEEE Power Engineering Society General Meeting, Toronto, ON, Canada, 13–17 July 2003; pp. 849–853.
  17. Day, C.J.; Hobbs, B.F.; Pang, J.S. Oligopolistic competition in power networks: A conjectured supply function approach. IEEE Trans. Power Syst. 2002, 17, 597–607. [Google Scholar] [CrossRef]
  18. Rahimiyan, M.; Rajabi Mashhadi, H. Supplier’s optimal bidding strategy in electricity pay-as-bid auction: Comparison of the Q-learning and a model-based approach. Electr. Power Syst. Res. 2008, 78, 165–175. [Google Scholar] [CrossRef]
  19. Gountis, V.P.; Bakirtzis, A.G. Bidding Strategies for Electricity Producers in a Competitive Electricity Marketplace. IEEE Trans. Power Syst. 2004, 19, 356–365. [Google Scholar] [CrossRef]
  20. Song, H.L.; Liu, C.C.; Lawarree, J. Nash equilibrium bidding strategies in a bilateral electricity market. IEEE Trans. Power Syst. 2002, 17, 73–79. [Google Scholar] [CrossRef]
  21. Hobbs, B.F. Linear complementarity models of Nash-Cournot competition in bilateral and POOLCO power markets. IEEE Trans. Power Syst. 2001, 16, 194–202. [Google Scholar] [CrossRef]
  22. Bathurst, G.N.; Weatherill, J.; Strbac, G. Trading wind generation in short term energy markets. IEEE Trans. Power Syst. 2002, 17, 782–789. [Google Scholar] [CrossRef]
  23. Fujii, Y.; Okamura, T.; Inagaki, K.; Yamaji, K. Basic analysis of the pricing processes in modeled electricity markets with multi-agent simulation. In Proceedings of the 2004 IEEE International Conference on Electric Utility Deregulation, Restructuring and Power Technologies, Hong Kong, China, 5–8 April 2004.
  24. Steeger, G.; Barroso, L.A.; Rebennack, S. Optimal Bidding Strategies for Hydro-Electric Producers: A Literature Survey. IEEE Trans. Power Syst. 2014, 29, 1758–1766. [Google Scholar] [CrossRef]
  25. Li, G.; Shi, J.; Qu, X. Modeling methods for GenCo bidding strategy optimization in the liberalized electricity spot market—A state-of-the-art review. Energy 2011, 36, 4686–4700. [Google Scholar] [CrossRef]
  26. David, A.K.; Wen, F.S. Strategic bidding in competitive electricity markets: A literature survey. In Proceedings of the 2000 IEEE Power Engineering Society Summer Meeting, Seattle, WA, USA, 16–20 July 2000.
  27. Díaz, C.A.; Villar, J.; Campos, F.A.; Reneses, J. Electricity market equilibrium based on conjectural variations. Electr. Power Syst. Res. 2010, 80, 1572–1579. [Google Scholar] [CrossRef]
  28. Tan, D.; Hu, P. Model of multidimensional game between two Oligarchs and its analysis on output strategies. J. Ind. Eng. Eng. Manag. 2004, 1, 123–125. [Google Scholar]
  29. Zhang, H.; Gao, F.; Wu, J.; Liu, K.; Zhai, Q. A stochastic Cournot bidding model for wind power producers. In Proceedings of the 2011 IEEE International Conference on Automation and Logistics (ICAL), Chongqing, China, 15–16 August 2011.
  30. Kelman, R.; Barroso, L.; Pereira, M. Market power assessment and mitigation in hydrothermal systems. IEEE Trans. Power Syst. 2001, 16, 354–359. [Google Scholar] [CrossRef]
  31. Zeng, M.; Yang, Y.; Wang, L.; Sun, J. The power industry reform in China 2015: Policies, evaluations and solutions. Renew. Sustain. Energy Rev. 2016, 57, 94–110. [Google Scholar] [CrossRef]
Figure 1. Pricing mechanism of POOL submarket.
Energies 09 00463 g001
Figure 2. Pricing mechanism of the APP submarket.
Energies 09 00463 g002
Figure 3. Flowchart of the iterative algorithm.
Energies 09 00463 g003
Figure 4. Evolution of MCPs in POOL and APP submarkets.
Energies 09 00463 g004
Figure 5. Evolution of the profit of GENCOs.
Energies 09 00463 g005
Figure 6. Evolution of bidding outputs in POOL submarket of GENCOs.
Energies 09 00463 g006
Figure 7. Evolution of bidding outputs in APP submarket of GENCOs.
Energies 09 00463 g007
Figure 8. MCPs in POOL and APP submarkets in an entire year.
Energies 09 00463 g008
Figure 9. Profits of GENCOs in an entire year.
Energies 09 00463 g009
Figure 10. Bidding outputs in POOL and APP submarket of GENCOs in an entire year.
Energies 09 00463 g010
Figure 11. Impact of the number of GENCOs on electricity price.
Energies 09 00463 g011
Figure 12. Impact of the number of GENCOs on generation.
Energies 09 00463 g012
Figure 13. Impact of demand elasticity on electricity price.
Energies 09 00463 g013
Figure 14. Impact of demand elasticity on generation.
Energies 09 00463 g014
Figure 15. Impact of EOECs on electricity price.
Energies 09 00463 g015
Figure 16. Impact of EOECs on generation.
Energies 09 00463 g016
Table 1. Information of power generators.
GENCOTypeaibiciKi (US$/MWh)EOEC (108 kWh)Capacity Caps (108 kWh)
AHydro00.1048.926.512
BHydro00.08043.387.013.5
CHydro00.11036.156.313
DThermal0.00120.180.0849.855.18
Table 2. Equilibrium outputs, market clearing prices and profits of GENCOs.
GENCOBid in POOL (108 kWh)Bid in APP (108 kWh)MCP in POOL (US$/MWh)MCP in APP (US$/MWh)Profit (Million US$)
A3.8611.63935.8523.6931.09
B2.8473.65332.63
C2.644.0619.88
D2.909.68
Table 3. EOEC and generation capacity caps of GENCOs.
MonthGENCO AGENCO BGENCO CGENCO D
EOECCapsEOECCapsEOECCapsEOECCaps
17.5137.013.56.3134.17
27.5137.013.56.3134.17
36.5127.013.56.3135.18
46.5127.013.56.3135.18
57.5137.013.57.3143.16
67.5138.015.58.31622
77.514.58.315.58.61622
87.514.58.315.58.61622
97.514.58.315.58.61622
107.514.58.315.58.61622
117.5138.015.58.31622
127.5137.013.57.3143.16

