Article

Thermo-Structural Response Caused by Structure Gap and Gap Design for Solid Rocket Motor Nozzles

1
Science and Technology on Combustion Internal Flow and Thermal-structure Laboratory, Northwestern Polytechnical University, Xi’an 710072, Shaanxi, China
2
School of Astronautics, Northwestern Polytechnical University, Xi’an 710072, Shaanxi, China
3
Aviation Equipment Research Institute, AVIC Qing-an Group Co., Ltd., Xi’an 710077, Shaanxi, China
4
Xi’an Modern Control Technology Research Institute, Xi’an 710065, Shaanxi, China
*
Author to whom correspondence should be addressed.
These authors contributed equally to this work.
Energies 2016, 9(6), 430; https://doi.org/10.3390/en9060430
Submission received: 27 November 2015 / Revised: 4 May 2016 / Accepted: 26 May 2016 / Published: 2 June 2016

Abstract

:
The thermo-structural response of solid rocket motor nozzles is widely investigated in the design of modern rockets, and many factors related to the material properties have been considered. However, little work has been done to evaluate the effects of structure gaps on the generation of flame leaks. In this paper, a numerical simulation was performed by the finite element method to study the thermo-structural response of a typical nozzle with consideration of the structure gap. Initial boundary conditions for thermo-structural simulation were defined by a quasi-1D model, and then coupled simulations of different gap size matching modes were conducted. It was found that frictional interface treatment could efficiently reduce the stress level. Based on the defined flame leak criteria, gap size optimization was carried out, and the best gap matching mode was determined for designing the nozzle. Testing experiment indicated that the simulation results from the proposed method agreed well with the experimental results. It is believed that the simulation method is effective for investigating thermo-structural responses, as well as designing proper gaps for solid rocket motor nozzles.

1. Introduction

The solid rocket motor (SRM) nozzle always acts as an energy transformation device where the chemical energy of propellant turns into the kinetic energy of gas with extremely high temperature and pressure [1,2,3]. Normally, the temperatures can be 3000 K or higher and the pressure may reach about 10 MPa or higher for some special motor devices, especially those equipped with modern propellants that have better performance [4,5]. What is more, the temperatures and pressures of the gas are becoming higher and higher due to the increasing performance demands of SRMs. Overall, the nozzle is always working under extremely harsh circumstances [6]. Hence, the structure integrity is of great importance for the normal operation of the nozzle. In view of this, many researchers around the world have focused on several aspects of this subject.
Kumar et al. [7] investigated the thermo-structural response of a nozzle made of composite under thermal and mechanical loads, and the results showed that thermal stress played a more important role than mechanical loads. Morozov et al. [8] used ADINA to analyze the thermo-structural response of a composite nozzle, but ignored the material ablation. Mehta et al. [9] employed a graphite throat nozzle with temperature-dependent thermo-physical properties for the solid rocket motor, and developed a finite element formulation to analyze the axisymmetric, transient, anisotropic heat conduction problem and simulate the thermal stress with two degrees of freedom. Kuo et al. [10] established a full model to predict the recession process of a carbon/carbon nozzle. The analysis accounts for both diffusion and cheniical kinetics effects on the recession process. Bianchi et al. [11] took homogeneous phase reactions and material nonlinearity into account and analyzed the coupled case of ablation and heat flow. Zhang [12] studied the radiation heat transfer in solid rocket motor with consideration of ablation of the C/C material, and predicted the safety performance of the rocket nozzle in the startup stage. Garelli [13] analyzed the aero-elastic process during the starting phase of rocket engine via a coupling fluid/structure code, and provided better understanding of the behavior of the structure as the shock waves propagated inside the engine nozzle. Jiang et al. [14] proposed a finite element method that was easy to combine with thermo-structural program, and obtained a more reliable temperature distribution of the nozzle relative to that of ground tests. He [15] studied the thermo-structural response and the tendency of ablation both theoretically and experimentally, and found that the theoretical temperature distribution agreed very well with the test results. Yuan et al. [16] built a unified calculation system that considered grain geometric shape, internal flow field, heat transfer and ablation together to analyze a single-chamber, dual-thrust solid rocket motor, and demonstrated the great reliability of the system in a test case. Deng et al. [17] discussed the nozzle response under different heat convection coefficients, and the results showed that the introduction of heat convection coefficient could more closely simulate the situation of the solid rocket motor. Hu et al. [18,19,20] investigated the flow separation phenomenon and the thermo-structural response of a liquid rocket motor both theoretically and experimentally, and the simulation results showed reasonable agreement with the test ones.
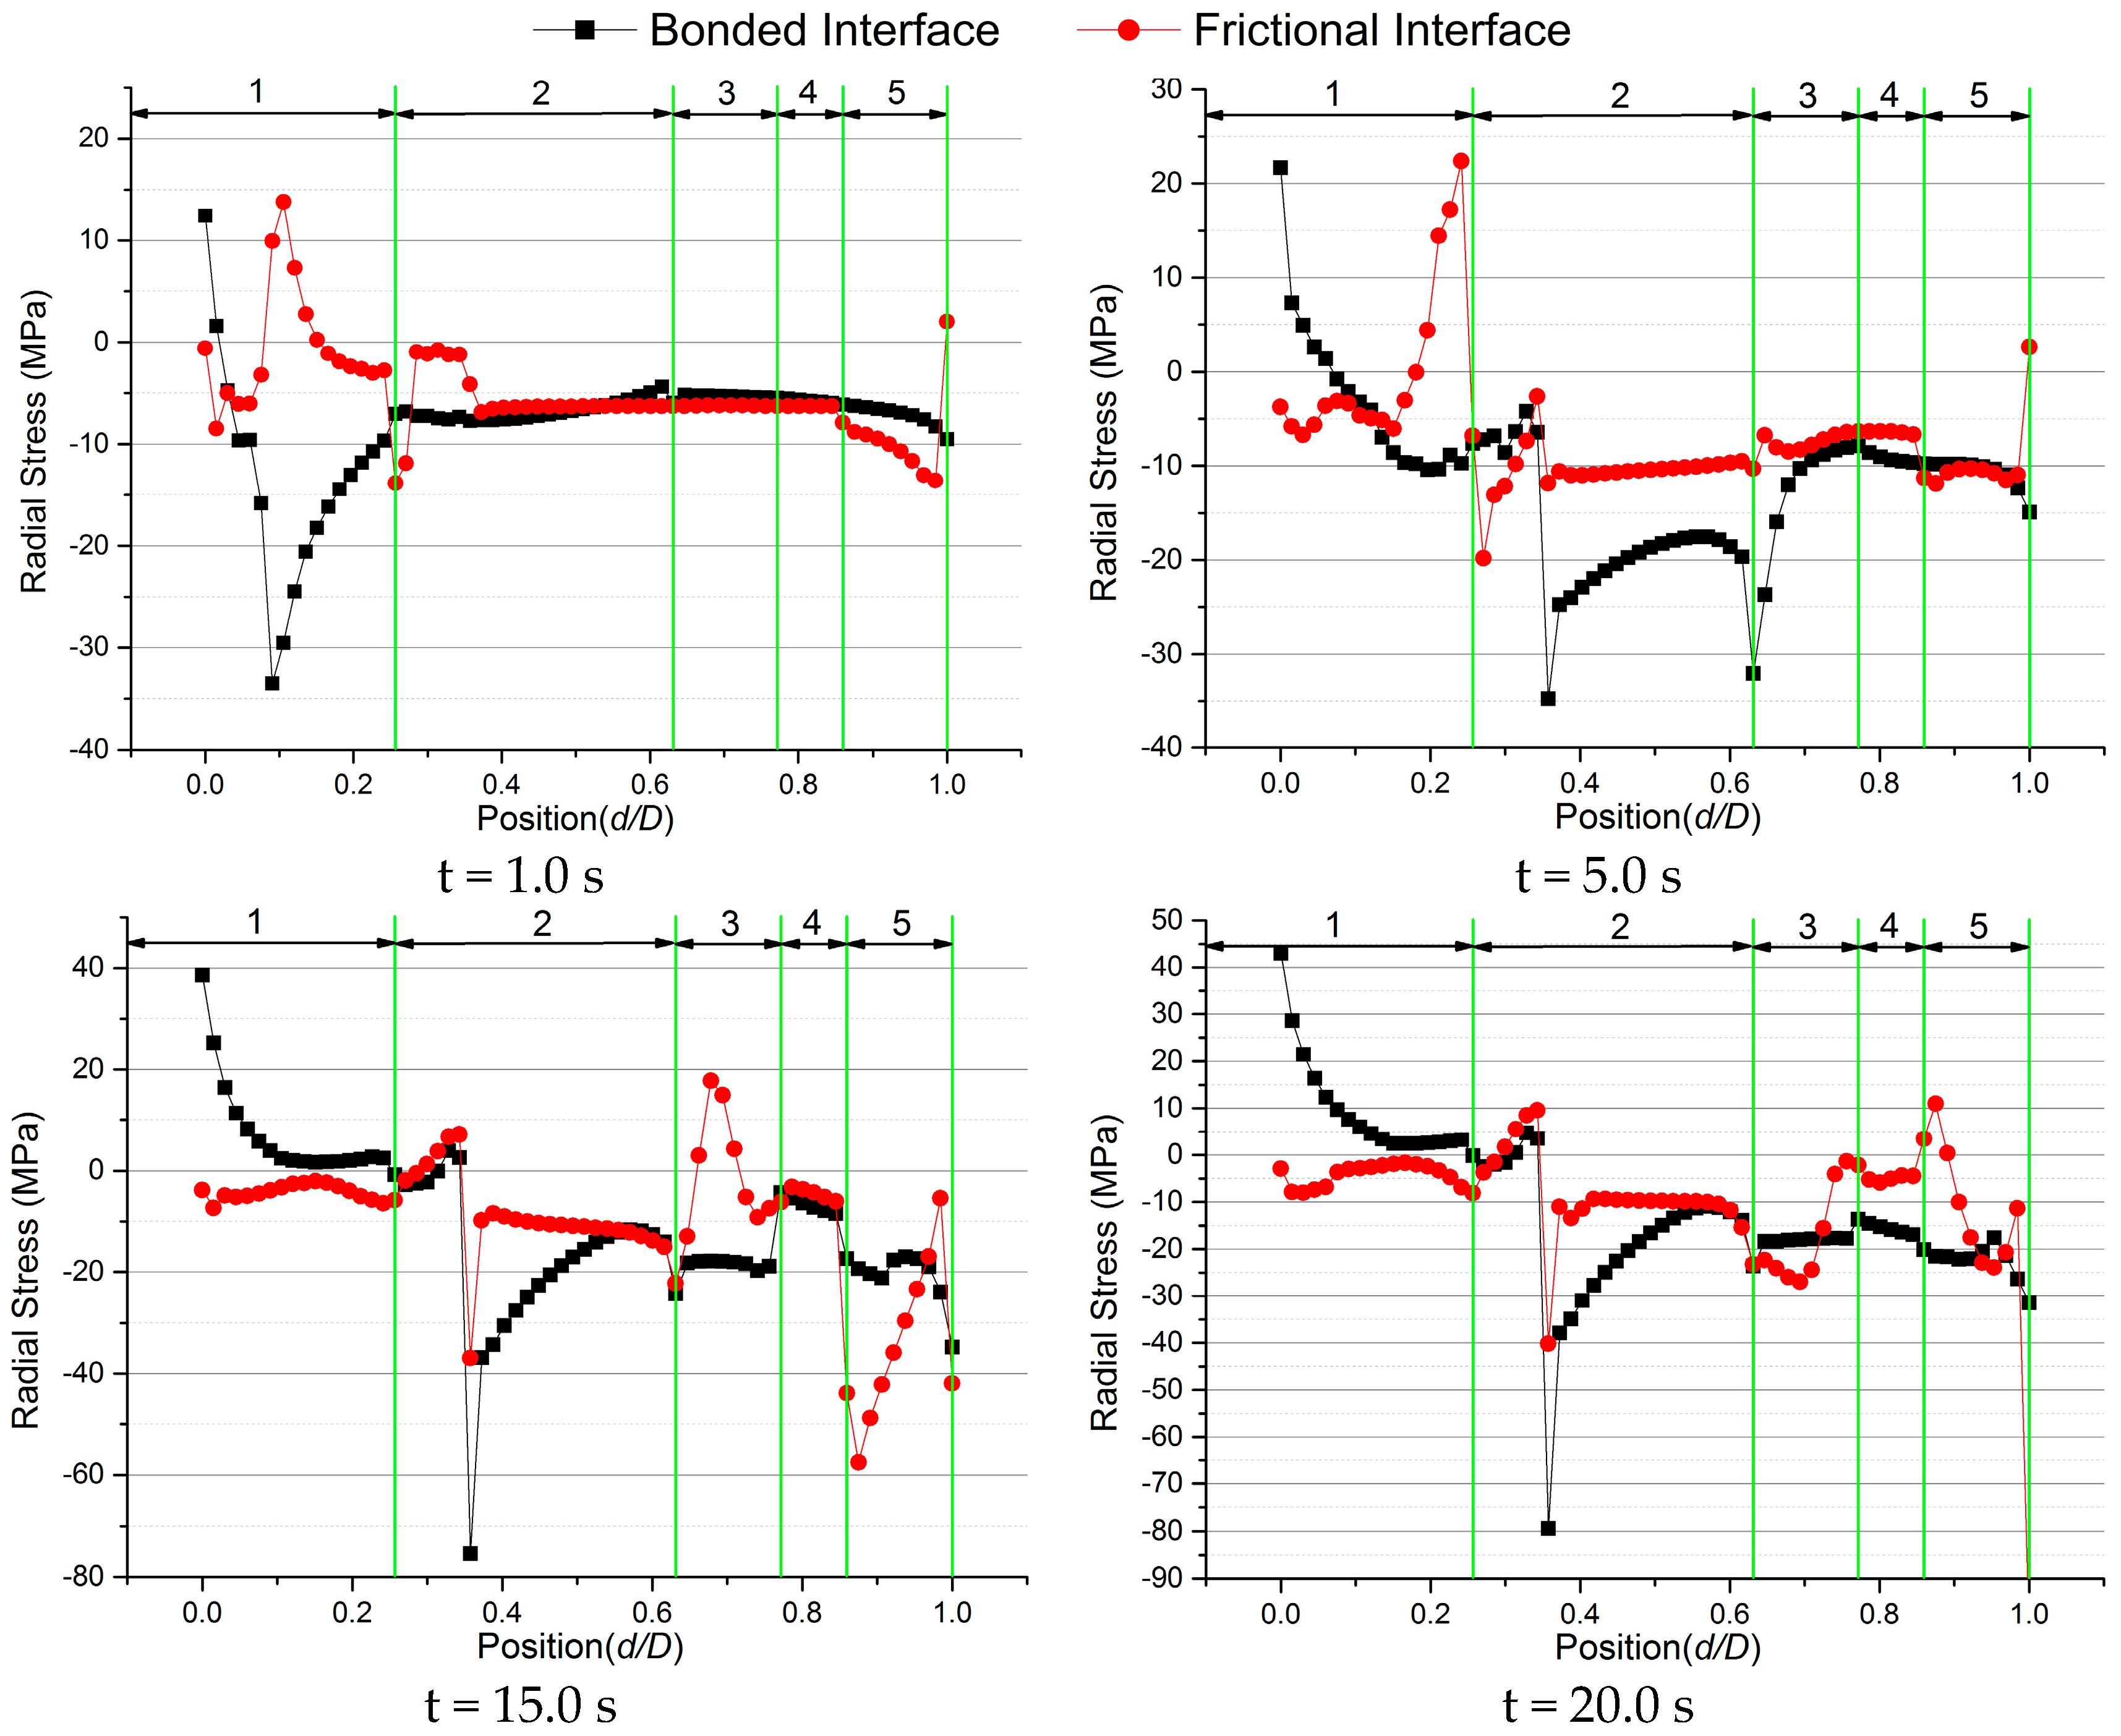
In the research above, most researchers have taken into account some primary influencing factors, such as the rules of material property variation with temperature, the nonlinear behavior of the material under high temperatures and pressures, the ablation of material and so on, but ignored some details when the thermo-structural response of the nozzle is investigated. For example, interfaces between materials are generally treated as bonded in the thermo-structural field, but in fact relative motion may occur between different parts of the nozzle. That is to say, the bonded status assumption may not always match the physical truth.
Similar to the debonding phenomenon of propellants [21,22,23,24,25], some types of nozzles are assembled by splicing each part together using an epoxy polyamide adhesive [1], GD414 [26] and so on, and these kinds of glue may fail under some specific temperature and pressure conditions. For example, GD414 will fail when the temperature reaches about 473.15 K or the shear stress reaches about 3.5 MPa [27]. This kind of failure can lead to interfacial debonding so that the interface between the adjacent parts will transfer from bonded status to frictional status. In addition, there are also some types of nozzles that are not assembled with glue but by fit tolerance clearance [
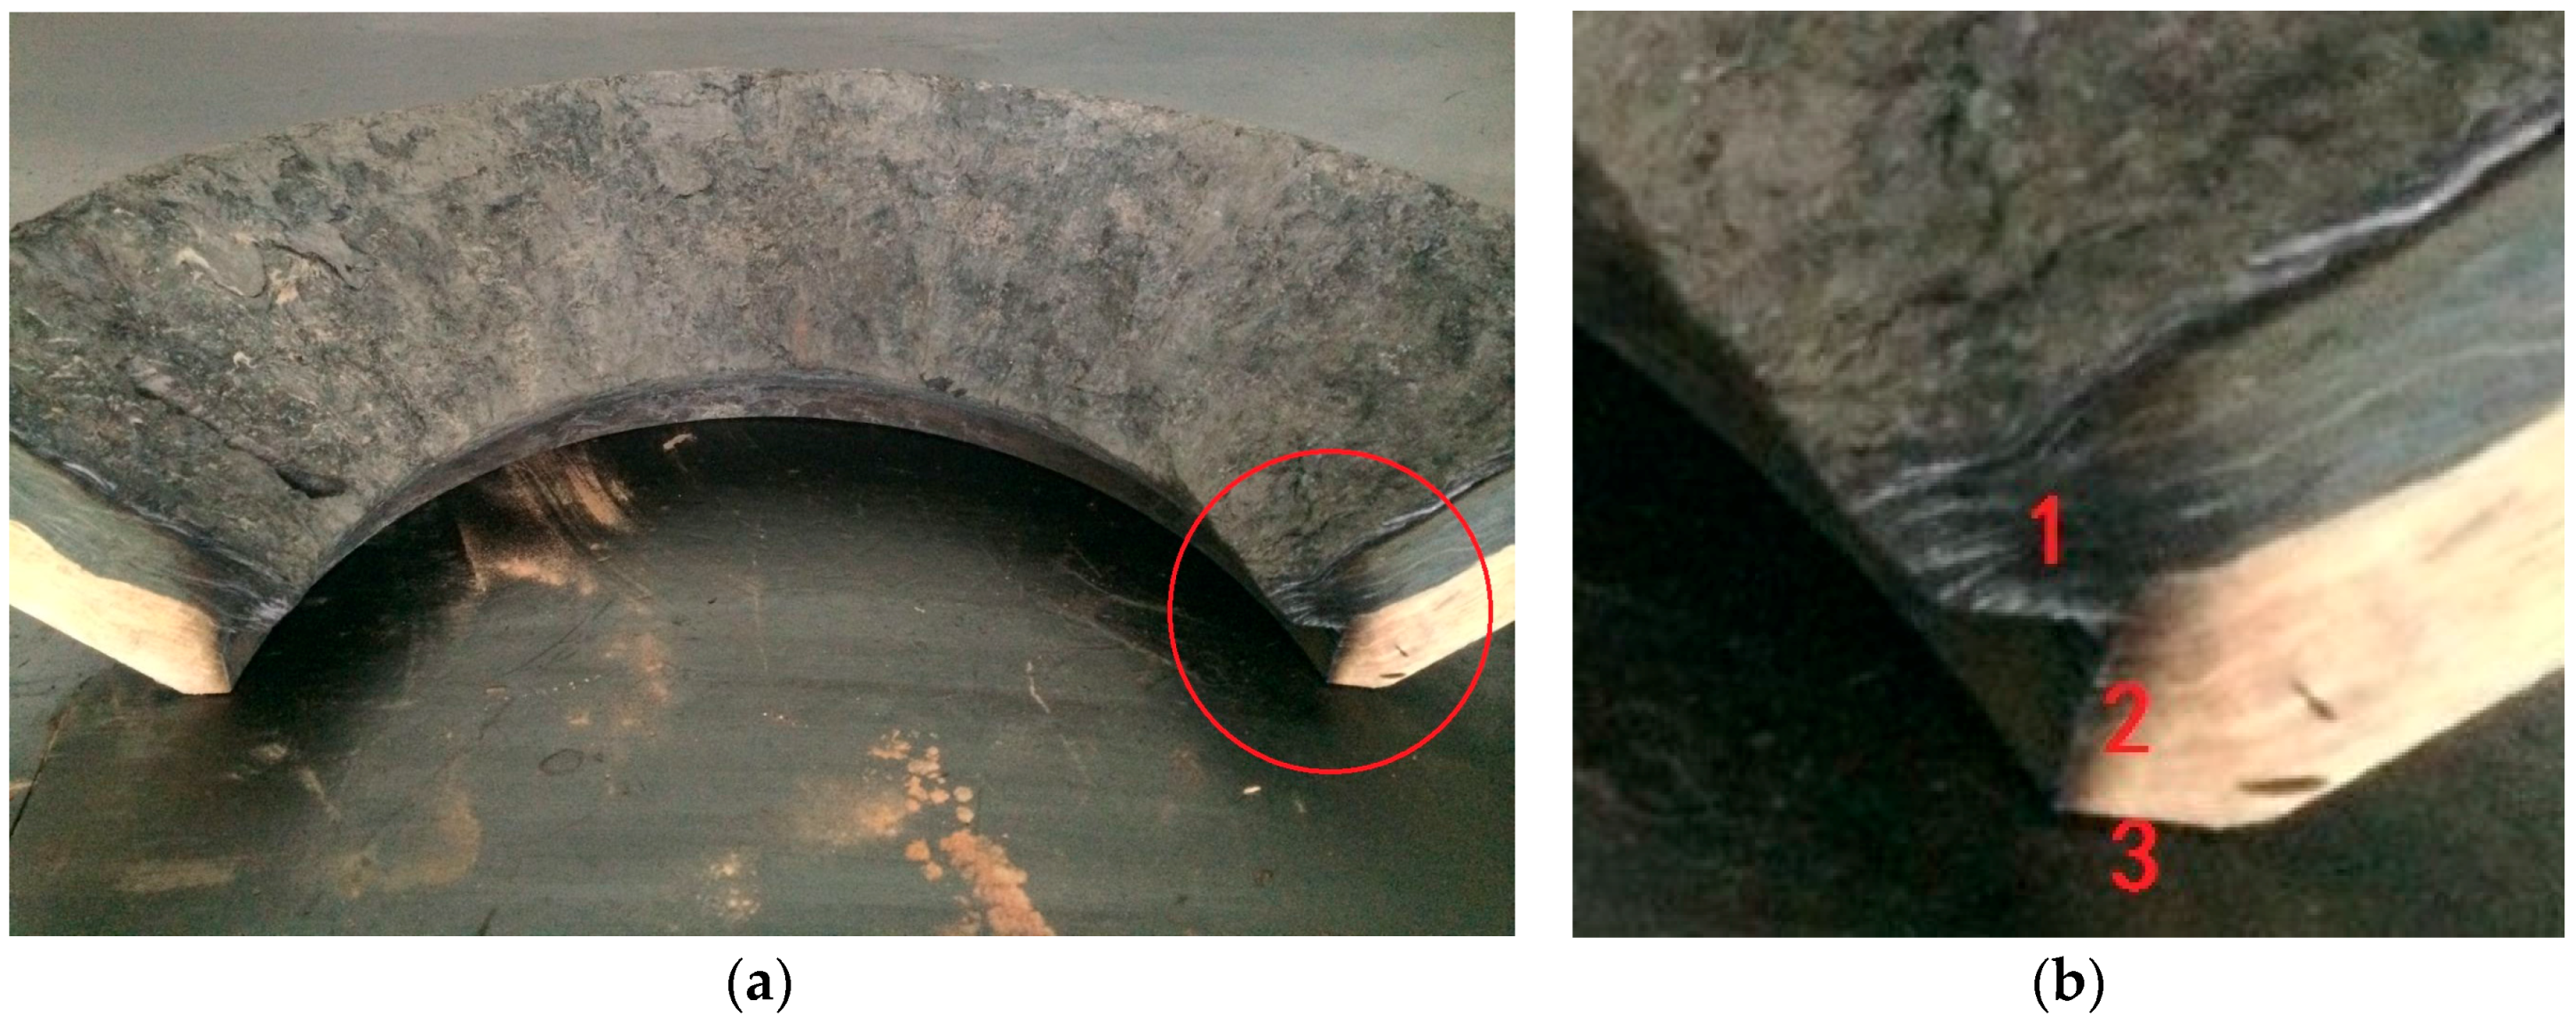
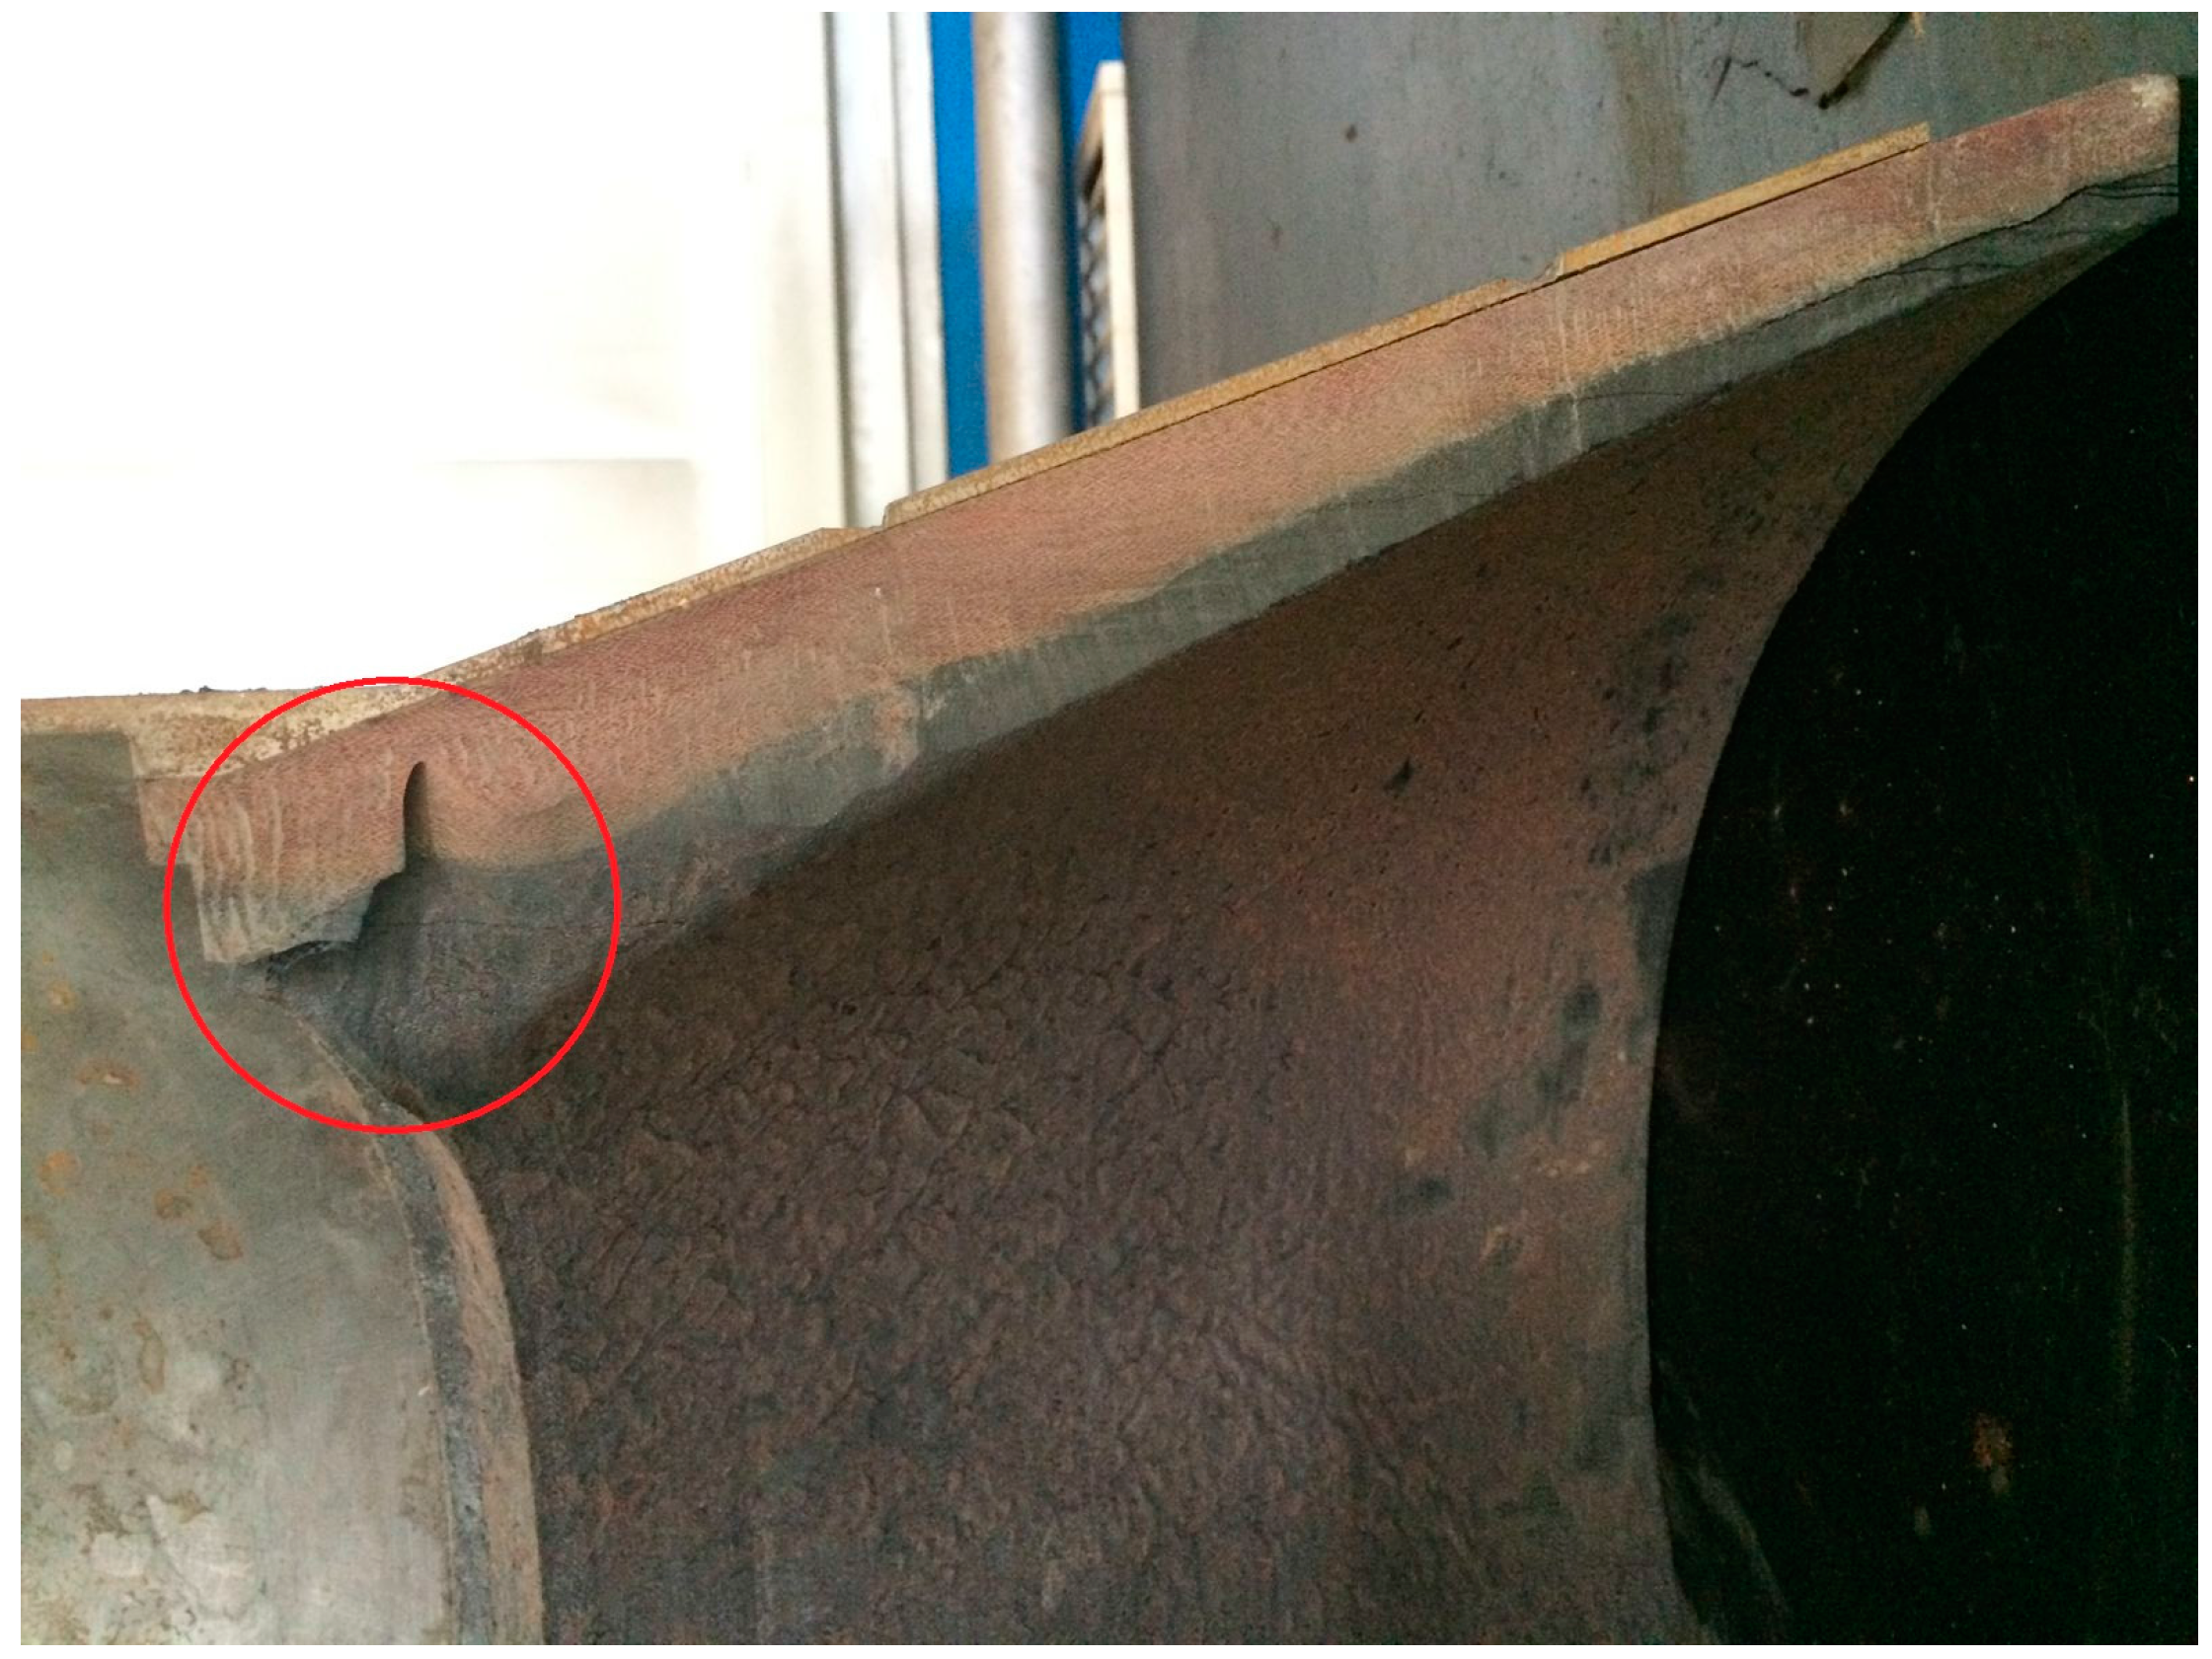
28]. These nozzles require a space consideration during the design period. When the motor starts to work, the inner pressure pushes the parts of the nozzle tightly and all parts will expand due to temperature rise, thus enhancing the bonding strength. It is noticed that the lack of bonding strength or improper clearance fit can lead to oversized gaps between the adjacent parts, which may produce a thoroughfare from the inner flow field to the outermost support structure. As a result, the outermost support structure cannot bear very high temperatures and will fail. This phenomenon is usually known as fire-puncture. To the best of the authors’ knowledge, few researchers have taken the interfacial failure and the contact status into consideration in the thermo-structural field.
Chen [29] discussed the causes and the effects of structure gap, and provided a suggested gap size for nozzle design. Taking a nozzle insert as example, Tian et al. [30,31] discussed the effects of structure gap by the point-point contact method, and simulated the stress field distribution by coupling heat and pressure to get the variation tendencies of gap size and contact stress. Based on these results, some designed gap sizes were given for correction, which provided a reference for future nozzle design. Sun et al. [32] simulated the fully-coupled thermo-structural response of a nozzle with adhesive failure, and the results showed that treating the interface as contact status could reduce the stress intensity. Goyal et al. [33] simplified the traditional 3D method, and found that a 2D model could achieve acceptable results. This method can be applied to the simulation of several parts of the nozzle and the nozzle insert, as well as the thermo-structural simulation with consideration of elasticity modulus reduction caused by ablation. Wang [34] took an SRM nozzle as example to simulate the transient heat and stress fields, and showed that the connecting and bonding status should be carefully considered in structure design due to the significant effects of thermal expansion coefficients. Zheng [35] established a simulation method for the nozzle insert of C/C composite material, with an overall consideration of contact thermal resistance, ablation moving boundary, interface debonding and so on. Based on the method, interface debonding was considered as the key factor that led to nozzle failure. Zheng et al. [36,37] proposed an integrative computation method in Fluent for an SRM nozzle based on fluid-structure interaction, and realized the automatic identification of contact boundaries. Teng et al. [38] analyzed the transient temperature field of an axisymmetric nozzle with consideration of thermo-structural, geometry characteristics, material characteristics and boundary symmetry, and employed a special GAP element in MSC.NASTRAN to simulate the contact status of different materials, which provided useful basis for nozzle thermal-structural design. Li [39] regarded the interface between the nozzle insert and the back surface as a contact one because the interface would fail due to the high temperature and shear stress. Liu [40] confirmed the friction coefficient between C/C material and asbestos phenolic material, and provided an accurate friction coefficient for the contact simulation of thermo-structural response.
To sum up, a large amount of work has been done for investigating the thermo-structural response concerning the contact status. However, little attention has been paid to the gap design, especially the specific size of each gap. This paper mainly focuses on the contact simulation, and meanwhile a gap size optimization is included. Furthermore, some experimental results are given to evaluate the design of the nozzle. Finally, some conclusions are drawn in the end.

2. Computational Model

2.1. Geometry Structure

This paper takes a typical nozzle as example to conduct a thermo-structural analysis based on the contact status and the structure gap. Figure 1 shows the nozzle sketch. The nozzle usually has three layers, including ablation layer, heat insulating layer and support layer. The ablation layer, i.e., the convergent and divergent regions, is made of carbon-phenolic-resin, the heat insulating layer is of silica-phenolic-resin, and the support layer is of structural steel. The throat insert is made of carbon/carbon composite material. Table 1 gives the nozzle dimensions.

2.2. Material Model

Great efforts have been made to choose proper materials for the nozzle. Here, all properties of the material models are temperature-dependent. The specific properties are shown in Table 2, Table 3 and Table 4, where X represents the radial direction, Y represents the axial direction and Z represents the circumferential direction. By the way, several variables and their nomenclatures are used for saving space. The specific variables are as follows:
ρDensity (kg/m3)
TTemperature (K/°C)
EYoung’s modulus (GPa)
vPoisson's ratio
GShear modulus (GPa)
αCoefficient of thermal expansion (K−1)
KThermal conductivity (W/(m·K))
CSpecific heat (J/(kg·K))

2.3. Finite Element Model

It is noticed that the attached nozzle model is axially symmetrical. Normally, the axisymmetric finite element model can not only reduce the number of meshes, but also eliminate to a large extent the errors caused by mesh dissymmetry. Therefore, a 2D axisymmetric model is used in this paper for both the thermo-structural simulation and the flow simulation.

2.3.1. Meshing

A properly sized mesh can generate more accurate results for both the thermo-structural simulation and the flow simulation. Figure 2 shows the mesh generation result of the thermo-structural simulation.

2.3.2. ANSYS Parameter Design Language in ANSYS Workbench

According to previous work [42,43], reliable results can be obtained with ANSYS. In this work, the simulation is conducted on ANSYS Workbench that does not have a function of directly coupled thermo-structural simulation by now, so that necessary ANSYS Parameter Design Language (APDL) codes have been developed by the authors ourselves. The thermo-structural response is simulated in the Mechanics of Transient Structure, which can only simulate the structure response. Firstly, an element-choosing procedure is conducted by the ET command for all the parts of the nozzle. Secondly, KEYOPT and RMODIF commands are executed for the contact definition in order to simulate the heat transfer. Considering the radiation, MP command is used to define the emission of the materials. Finally, the thermal boundary conditions are defined and applied by *DIM, *TREAD and SF commands.

2.3.3. Boundary Conditions

For the thermo-structural simulation, both thermal and structural boundary conditions are required. The specific settings for this simulation are as below.
  • Thermal Boundary Conditions
There exist two kinds of thermal boundary conditions for this simulation, i.e., the free convection heat transfer between the outermost structural steel and the air, and the forced convection from the inner flow. Many studies [44,45] simplified that it was adiabatic between the outmost and the atmosphere. Deng [17] accepted the probable coefficient scope of 1–10 W/(m2·K) and discussed the effects of the coefficient variation on the simulation. As a result, an average value of 5 W/(m2·K) from Deng’s research is adopted in this paper. Meanwhile, this value is also an empirical free convection coefficient for one kind of default setting called Simplified Case in ANSYS Workbench.
For the forced convection, the coefficient can be calculated by the Bartz formulation [46]. When the hot gas enters the nozzle, the velocity is accelerated so fast that the turbulence effect is increased sharply, which enhances the convection heat transfer between the flow and the wall. For this special flow form, Bartz proposed an experimental formulation to predict the coefficient, and the predicted results show reasonable agreement with the experimental data except for a small section before the throat:
h = C d t 0.2 c p μ 0.2 P r 0.6 ( m ˙ A t ) 0.8 ( d t r c ) 0.1 ( A t A ) 0.9 σ
σ = 1 [ T w 2 T 0 ( 1 + k 1 2 M a 2 ) + 1 2 ] 0.65 ( 1 + k 1 2 M a 2 ) 0.15
where h is the forced convection coefficient; C = 0.026 for subsonic flow and C = 0.023 for supersonic flow; dt is the diameter of the throat; cp is the constant-volume specific heat of the gas; μ is the coefficient of viscosity of the gas; Pr is the Prandtl number; m ˙ is the mass flow rate; At is the area of the throat; rc is the curvature radius; A is the area of the local cross profile; σ is a modified parameter considering the vibration of the boundary layer; Tw is the temperature of the wall; T0 is the temperature of the total temperature of the gas; k is the ratio of specific heat; and Ma is the local Mach number.
To calculate heat transfer from the inner flow to the wall, the recovery temperature Tr of the gas should be provided as the temperature of the gas that directly contacts the nozzle and the value may be a little bigger than the total temperature. The recovery temperature can be calculated as given equation:
T r = T [ 1 + P r 1 / 3 k 1 2 M a 2 ]
where T and Ma are the gas static temperature and Mach number of the local cross profile.
For the Prandtl number Pr and coefficient of viscosity of the gas μ, they can be calculated using the equations below [46]:
P r = 4 k 9 k 5
μ = 11.83 × 10 8 × M ¯ 0.5 × T 0.6
where M ¯ is the average molecular weight of the gas and k = 1.2 for hot gas in SRM.
  • Structure Boundary Conditions
In general, structure boundary conditions include fixed constraints, displacement, pressure and so on. For a nozzle at work, the fixed and displacement constrains are the main boundary conditions, and the inner flow pressure cannot be ignored either. The nozzle is often stuck to the chamber by bolts. Meanwhile, some devices are often installed on the outside of the nozzle in order to save space. To simplify the simulation procedure, firstly, it is assumed that the outmost structural steel can move along the axial direction but not the radial direction; secondly, the radial direction outlines at the head of the nozzle are constrained to move along the radial direction but not the axial direction; thirdly, the outlines at the axis movement are constrained to move along the axial direction but not the radial direction; lastly, the radial direction outlines at the end of the nozzle are also constrained to move along the radial direction but not the axial direction.

2.3.4. Initial Gap Definition

In this section, the initial gap size is defined by experience [29]. For the non-metal and metal fitting surface, the optimum gap size interval may be 0.1 to 0.2 mm, and the maximum shall be not larger than 0.25 mm. For the nonmetal and non-metal fitting surface, the designed gap size can be smaller. Larger gap size may bring about bad splicing results and cause damage to the structure such as the flame leaks mentioned in the Introduction section. For the chosen nozzle, two possible passageways are illustrated in Figure 3. In order to be in accordance with the experiment introduced in the Experimental Results section, the simulation will only focus on the left passageway, and the initial gap sizes are defined in Table 5.

2.3.5. Assumptions

Some reasonable assumptions are made as follows to simplify the mathematical model and accelerate the convergent course:
  • The complicated phenomena of erosion and pyrolysis behavior of the erosion and heat insulation materials are neglected;
  • The connecting part of the nozzle and the chamber has no heat exchange, and other parts experience free convection;
  • The contact thermal resistance is assumed to be a constant of 10−3 m2·K/W [35], which ignores the variation of thermal resistance caused by environmental changes such as contact status, temperature and so on;
  • The contact thermal resistance is totally ignored for the bonding simulation;
  • During the frictional contact movement, energy dissipation caused by friction is totally transformed into heat, and the contact and the target respectively absorbs 50% of the heat;
  • There exists radiation heat transfer between the contact and the target. The Stefan-Boltzmann constant is 5.67 × 10⁻⁸ W/(m2·K4) and the heat emissivity for each material is 0.9, which is the same as that for C/C composite material [47]. Because the radiation from the hot gas to the nozzle wall is very low relative to the forced heat convection [31], the internal and external radiation heat transfer are neglected.

3. Flow Field Estimation

3.1. Flow Results Based on Quasi-1D Model

Theoretically, the flow in a nozzle can be generated in milliseconds. In comparison with the whole working time, this period of time can be ignored. In particular, this paper emphasizes the thermo-structural response regarding contact status, so that the generation of the flow is not very important. As a result, a Quasi-1D model is established to acquire the fluid properties along the nozzle axis and provide boundary conditions for the nonlinear structure simulation.
For one dimension isentropic flow, the relationship of temperature, pressure and Mach number at any section along the nozzle axis can be given by:
T 0 T = 1 + k 1 2 M a 2
P 0 P = ( 1 + k 1 2 M a 2 ) k k 1
A A t = 1 M a [ ( k 1 ) M a 2 + 2 k + 1 ] k + 1 2 ( k 1 )
where T0 is the chamber temperature, P0 is the chamber pressure, At is the nozzle throat area, A is the local area along the nozzle axis, and k is the specific heat ratio of the gas. For the chosen nozzle, the chamber temperature T0 is 3500 K, and the chamber pressure P0 is 8 MPa. At can be obtained from Table 1. A can be figured out during modeling of the nozzle sketch and k is determined by the gas property. Figure 4 gives the temperature and Mach number curves obtained from the quasi-1D model. And x is the current location along the axis of the nozzle.

3.2. Forced Convection Coefficient Processing

For thermo-structural simulation, the convection coefficient along the wall and the recovery temperature should be provided [29]. Based on Equations (1)–(3), the coefficient and recovery temperature can be calculated as shown in Figure 5. As can be seen, the maximum value of forced convection coefficient is about 18,000 W/(m2·K) and the minimum is about 1800 W/(m2·K). At the entrance of the nozzle, due to the turbulent layer effect, the recovery temperature Tr is a little higher than the total temperature T0. This phenomenon will disappear soon. It is noticed that the variation curve of forced convection coefficient presents a peak at the throat, which represents a tough ordeal for thermal protection design.

4. Coupled Nonlinear Contact Simulation

Thermo-structural simulation can not only verify the nozzle structure integrity, but also ascertain the weakest parts or points with stress concentration. In this paper, the finite element method is employed to simulate the temperature field in the thermo-structural modules, and the 2-D 8-Node Coupled-Field Solid element (Plane223) is chosen. For other additional information readers can refer to the ANSYS Mechanical APDL Theory [48]. The calculation contains only one simulation with all necessary freedom elements, and the coupled analysis is carried out on all element matrixes or load vectors of the physical variables. The governing equations are as below, and the meaning of each symbol can be found in [48]:
[ [ M ] [ 0 ] [ 0 ] [ 0 ] ] { { u ¨ } { T ¨ } } + [ [ C ] [ 0 ] [ C t u ] [ C t ] ] { { u ˙ } { T ˙ } } + [ [ K ] [ K u t ] [ 0 ] [ K t ] ] { { u } { T } } = { { F } { Q } }
In this section, the left passageway of flame leak in Figure 3 (1→2→3→4→5) is analyzed and the contact status takes the initial gap sizes into account. All the other interfaces are treated as bonded ones. Further, two types of simulations are delivered.

4.1. Discussion on Erosion and Pyrolysis Behavior

As phenolic resin based materials, when heated, carbon-phenolic and silica-phenolic start to decompose at about 300 °C. Along with decomposition, vaporized SiO2, CO2 and other kinds of gases will also be generated. When the temperature reaches about 800 °C and higher, the porosity factor will be constant, indicating the end of thermal decomposition [29].
Besides, carbon residue will form a carbon layer with porous media characteristics. The decomposition gas would also flow among the small holes and enter into the gaps (1→2→3→4→5 or 6→7→8→9→10). Except for thermal expansion stress and extrusion stress between different parts, the decomposition gas can lead to pressure load and cause stress responses on all the sides of gaps labeled 1→10.
For silica/phenolic composites, Shi [49] investigated the ablation mechanism and thermo-mechanical behavior of silica/phenolic composites. By comparing the temperature distribution and pore pressure distribution of the material, a relationship between temperature and pore pressure can be obtained as shown in Figure 6. As stated in [49], the maximum gas pressure is located at the starting position of decomposition. This matches well with the phenomenon shown in Figure 6 that the maximum pore pressure is about 6.3 MPa when temperature reaches about 800 K.
Zhao [50] did research on ablation behavior of carbon/phenolic composites, and a similar relationship between temperature and pore pressure of carbon/phenolic can be obtained as shown in Figure 7. Like to silica/phenolic composites, the maximum pore pressure also arises at the starting position of decomposition of about 1.2 MPa at about 400 K.
For simulation concerning the contact status, such pressure could not be ignored since it will affect the contact behavior. As a result, to take the erosion and pyrolysis behavior into account as far as possible, such pressures will be imposed on the surfaces around the nozzle insert and back surface labeled 1→10. To simplify the pressure imposing process, maximum values of 6.3 MPa for silica/phenolic interfaces and 1.2 MPa for carbon/phenolic interfaces are directly applied to conduct the coupled nonlinear contact simulation.

4.2. Comparison of Simulation Results

4.2.1. Temperature Comparison

Figure 8 shows the temperature distribution graphs of the two types of interface treating methods. From these temperature distribution graphs, it can hardly figure out how contact status affects the heat transfer process.
In order to analyze the results more clearly, another post-process method is used. Firstly, a new coordinate system is built. The point on the path 1→2→3→4→5 with the smallest y value is defined as the origin of the coordinate, and the coordinate axis value increases along the path 1→2→3→4→5. Meanwhile, d is defined as the current location along the coordinate axis (path 1→2→3→4→5) and D is the total length of the path.
Figure 9 shows the temperature distribution curves of the passageway divided by time for the two types of interfaces. From the graphs, as time goes on, the difference between them becomes more and more obvious, and the temperatures of the bonded interface are higher than those of the frictional interface. This means that the thermal contact resistance has a significant effect on preventing heat transfer from the inner to the outer, which can effectively protect the heat insulation layer and support layer. Moreover, with regard to the small part closest to the inner hot gas, the temperature of the frictional interface is higher than that of the bonded interface. At the beginning of heat transfer, the thermal contact resistance plays an important role, and this small part would firstly absorb energy from the inner hot gas. Since the heat flow rate is the largest, the insert has the highest temperature rise, but the thermal contact resistance cuts off heat transfer from the insert to the convergent part. When the contact time reaches a certain point, this effect can be weakened.

4.2.2. Stress Comparison

Figure 10 shows the Von Mises stress distribution condition. The distribution character shows similar rules. There is also an apparent difference between the bonded and frictional results. The Von Mises stress level of the bonded interface is higher than that of the frictional one, especially at the interfaces around the nozzle insert and back surface. It can be inferred that the contact treatment is conductive to stress release.
Figure 11 gives the Von Mises stress variation curves for the passageway. It can be easily found that frictional treatment can reduce the stress level at almost each point. At each time point, Von Mises stress of path 1 is basically at the same level. For path 2, the stress release effect of frictional treatment is the most efficient. For paths 3 to 5, the release effect is moderate.
Figure 12 illustrates the axial stress variation curves of the passageway. As can be seen, there also exists considerable stress release effect, and the change tendencies are nearly the same for both interface treating methods. For most time and most section of the interface, the axial stress presents to be compressive stress.
Figure 13 shows the radial stress variation curves of the passageway. The stress release effect is not as obvious as that of the axial stress, but the stress level indeed decreases, especially for path 2. The radial stress is also compressive stress for most time and most section of the interface.
Table 6 shows the average release percentages of the three kinds of stress at different time points and different paths. From the table, it can be easily figured out that for axial stress and radial stress, the average release effect is not obvious as for the Von Mises stress. Examining the original data for Figure 11, Figure 12 and Figure 13 directly, for most nodes along the paths, the release effect is positive, but for a small number of nodes, the value is negative and the absolute value is much larger. This is the main reason why the release effect shown in Table 6 is not as obvious as shown in Figure 11, Figure 12 and Figure 13. All results show acceptable agreement with [39], namely the simulation considering contact can produce more accurate results.
To demonstrate the feasibility of the SRM nozzle design, it is necessary to carry out a structure integrity check for the two different types of interface treatment. It is found that treating the interfaces as bonded conditions would give too much unnecessary margin when choosing materials and designing shape. As a result, the contact nonlinear algorithm should be used when simulating the thermo-structural response of a nozzle.

5. Gap Size Optimization

Too large a gap size may lead to unexpected damage such as flame leaks [29,30]. In addition, the nozzle insert may deform under the combined loads of inner pressure, force from the neighborhood and its own thermal expansion. If the deformation is too large for other parts to hold the insert, it may fall off the nozzle. In the simulation work, this phenomenon can be demonstrated by the non-convergence of numerical calculations. To avoid flame leaks and prevent inserts from bursting out, a proper gap size should be determined for the given nozzle. In this study, the insert and the back surface are treated as bonded interfaces so that it is impossible for the insert to burst out. Hence, flame leaks will be the only factor to be discussed in this section.

5.1. Gap Size Definitions

The initial gap size has been given above. To investigate the effects of other sizes on the nozzle, more gap sizes should be defined. Based on Chen [29], it is assumed that all gap sizes are smaller than 0.25 mm. What is more, the carbon-phenolic-resin will be carbonized under too high temperatures [51]. Consequently, the hot gas from the flow into the structure gap must be appropriately dealt with. In view of this, the gap that directly contacts with the gas should be smaller than the inner ones so as to protect the heat insulation layer as far as possible.
This section mainly focuses on the left passageway 1→2→3→4→5. Nine gap size matching modes can be set up as shown in Table 7, and the same simulation will be carried out on them.

5.2. Fire-Puncture Confirmation and Gap Optimization

Firstly, flame leak criteria should be set up. If there is a period of time during which the contact number along the passageway is zero, namely no nodes from both sides are in contact with each other, then the inner gas can flow into the gaps. If the gaps are not closed before the gas reaches the support layer of structural steel, flame leaks will occur. If the time period for which the gaps are not closed is short, the risk of flame leak can be reduced.
Figure 14 gives nine graphs corresponding to the gap size modes defined in Table 7. Based on the criteria, there is no flame leak risk for Modes A to C but a little risk for Modes D and E. For Modes G to I, the risk is much larger. Furthermore, it can be concluded that the gap size of interface 1 plays a vital in avoiding flame leaks. This suggests the important tip that workers should control the craft very strictly during manufacture of the nozzle so as to avoid unwanted damage to the nozzle.
Finally, considering the stress level and flame leak confirmation, the best gap size matching for the chosen possible passageway can be determined as shown in Table 8.

6. Experimental Results

In this section, the nozzle was designed based on the simulation considering gap size, and a test experiment was performed to verify the effectiveness of the design. The experiment is successful and the structure integrity of the nozzle is good. Here, the designers chose Mode E for path 1→2→3→4→5.
Figure 15 shows the convergent region after the experiment. Under such high temperatures and pressures, the convergent region exhibits a tough appearance due to severe ablation and carbonization as shown in Figure 15a. The highlighted region of (a) is enlarged in Figure 16b. From this figure, a flame leak phenomenon occurs in paths 1 and 2, but no flame leak can be observed in path 3. For path 1, the flame leak is very obvious and the carbonization is as serious as that of the surface that directly contacts with the hot gas. It can be inferred that the hot gas transfers from the inner flow along path 1 and is prevented by path 2 before it reaches path 3. This means that path 2 is closed at one time point. This experimental result agrees well with the simulation result, namely there is a short period when the path is not closed (shown in Figure 14-Mode E).
Figure 16 shows the divergent region after the experiment. In comparison with the convergent region, less ablation and carbonization can be observed. Especially, a hole as highlighted in the red circle goes deep into the second layer at the gap with the insert, which illustrates a flame leak. This implies that the gap size of 0.2 mm chosen by designers may not be suitable. As a result, not only path 1→2→3→4→5, but also path 6→7→8→9→10 needs to be optimized.

7. Conclusions

In summary, an axisymmetric model of a nozzle was established to analyze its quasi-1D flow and its thermo-structural response, and its effects on temperature field and stress field were investigated by using a non-linear algorithm when the interfaces between different materials were treated as bonded status and frictional status. Further, a test experiment was performed to verify the numerical results. Some conclusions can be drawn as follows:
  • When interfaces are treated as being in frictional status, the temperature rise can be decreased, which protects the heat insulation layer and the support layer from excessive temperatures. From the perspective of stress analysis, the frictional treatment can release the stress, especially the axial stress;
  • During shape design and thermal protection structure optimization of a nozzle, interfaces should be treated as contact ones to reduce the design margin;
  • Based on the defined flame leak criteria and the simulation results, the best gap matching mode can be determined for the nozzle;
  • Experimental results provide great support for verifying the effectiveness of the proposed method.
This article establishes a simplified and fast simulation procedure for verifying nozzle designs. This procedure considers a pore pressure imposed on the contact interfaces. For more detailed and accurate analysis, the fundamental phenomena of erosion and pyrolysis of the insulating materials should be included. Besides, experiments should be carried out to investigate in detail the material properties related to the simulation.
For nozzle design with gaps between different materials, another important factor that should be included is the matching of their thermal expansion coefficients. Inappropriate thermal expansion coefficient matching may result in excessive stress and destroy the material. Moreover, not every best gap matching mode obtained by simulation is available considering the manufacture options. As a result, some splicing materials can be used at the very part that directly contacts with the hot gas. In view of this, the simulation should take the property of the glue into account to simulate the debonding process.

Acknowledgments

This research was supported in part by the National Natural Science Foundation of China (No. 51005179).

Author Contributions

Lin Sun, Futing Bao and Weihua Hui discussed and aroused the idea; Lin Sun and Ning Zhang performed the simulation and drafted the manuscript; Lin Sun finalized the manuscript. Shaozeng Wang, Nan Zhang and Heng Deng did the experiment and supplied the experiment results.

Conflicts of Interest

The authors declare no conflict of interest.

Nomenclatures

LLength of the nozzle (mm)
dtDiameter of throat (mm)
xCurrent location along the axis of the nozzle (mm)
ρDensity (kg/m3)
TTemperature (K)
EYoung’s modulus (GPa)
vPoisson's ratio
GShear modulus (GPa)
αCoefficient of thermal expansion (K−1)
KThermal conductivity (W/(m·K))
CSpecific heat (J/(kg·K))
hForced convection coefficient (W/(m2·K))
cpConstant-pressure specific heat of the gas (J/(kg·K))
μThe coefficient of viscosity of the gas (m2/s)
PrPrandtl number
m ˙ Mass flow rate (kg/s)
AtArea of the throat (m2)
rcCurvature radius (mm)
AArea of the local cross profile (m2)
MaThe local Mach number
RContact thermal resistance (m·K/(W))
σStefan-Boltzmann constant (W/m2·K4)
T0Temperature of the chamber
P0Pressure of the chamber
kSpecific heat ratio of the gas
dCurrent location along path 1→2→3→4→5 (mm)
DThe total length of the path 1→2→3→4→5 (mm)

References

  1. Li, Y.M.; Zhang, Z.Q. Principle of Solid Rocket Motor; Beijing University of Aeronautics and Astronautics Press: Beijing, China, 1991. [Google Scholar]
  2. Wang, Z.; Hu, Y.Q. Solid Rocket Motor; China Astronautic Publishing House: Beijing, China, 1993. [Google Scholar]
  3. Tang, J.L.; Liu, P.J. Principle of Solid Rocket Motor; National Defense Industry Press: Beijing, China, 2013. [Google Scholar]
  4. Greatrix, D. Numerical evaluation of the use of aluminum particles for enhancing solid rocket motor combustion stability. Energies 2015, 8, 1195–1215. [Google Scholar] [CrossRef]
  5. Greatrix, D.R. Scale effects on solid rocket combustion instability behaviour. Energies 2011, 4, 90–107. [Google Scholar] [CrossRef]
  6. Zheng, Y. Heat Transfer Theory of Solid Rocket Motor; Beijing University of Aeronautics and Astronautics Press: Beijing, China, 2006. [Google Scholar]
  7. Kumar, R.R.; Vinod, G.; Renjith, S.; Rajeev, G.; Jana, M.K.; Harikrishnan, R. Thermo-structural analysis of composite structures. Mater. Sci. Eng. A 2005, 412, 66–70. [Google Scholar] [CrossRef]
  8. Morozov, E.V.; de la Beaujardiere, J.F.P.P. Numerical simulation of the dynamic thermostructural response of a composite rocket nozzle throat. Compos. Struct. 2009, 91, 412–420. [Google Scholar] [CrossRef]
  9. Mehta, S.; Narayana, L. Thermal stress analysis of a solid rocket motor nozzle throat inserts using finite element method. India J. Eng. Mater. Sci. 1998, 5, 271–277. [Google Scholar]
  10. Kuo, K.K.; Keswani, S.T. A comprehensive theoretical model for cabon-carbon composite nozzle recession. Combust. Sci. Technol. 1985, 42, 145–164. [Google Scholar] [CrossRef]
  11. Daniele, B.; Francesco, N.; Emanuele, M. Coupled analysis of flow and surface ablation in carbon-carbon rocket nozzle. J. Spacecr. Rocket. 2009, 46, 492–500. [Google Scholar]
  12. Zhang, X. Coupled simulation of heat transfer and temperature of the composite rocket nozzle wall. Aerosp. Sci. Technol. 2011, 15, 402–408. [Google Scholar] [CrossRef]
  13. Garelli, L.; Paz, R.R.; Storti, M.A. Fluid–structure interaction study of the start-up of a rocket engine nozzle. Comput. Fluids 2010, 39, 1208–1218. [Google Scholar] [CrossRef]
  14. Jiang, G.Q.; Wang, S.H. A temperature field analysis method based on weighted residual finite element method. J. Propuls. Technol. 1985, 6, 36–42. [Google Scholar]
  15. He, H.Q.; Wang, S.M.; Niu, S.G. Measurement of ablation and temperature field for solid rocket motor. J. Solid Rocket Technol. 1993, 3, 31–36. [Google Scholar]
  16. Yuan, J.Y.; Zhang, Z.P.; Zhao, J.; Wang, H.G.; Liu, X.W. Safety limits design system of heat protection for combustion chamber and nozzle of solid rocket motor. J. Solid Rocket Technol. 2002, 25, 17–20. [Google Scholar]
  17. Deng, B.; Shen, Z.B.; Duan, J.B.; Li, D. Thermo-mechanical coupling analysis of SRM considering effects of convective heat transfer. J. Solid Rocket Technoll. 2012, 35, 42–46. [Google Scholar]
  18. Hu, H.F.; Bao, F.T.; Cai, Q.; Liu, Y. Analysis of thermo-structure for altitude liquid rocket engine in ground test. J. Aerosp. Power 2011, 26, 442–447. [Google Scholar]
  19. Hu, H.F.; Bao, F.T.; Wang, Y.J.; Cai, Q.; Liu, Y. Nozzle flow separation fluid-thermo-structural load transfer coupled analysis and test research. J. Astronaut. 2011, 32, 1534–1541. [Google Scholar]
  20. Hu, H.F. Research on the Key Technologies of the Integrated Design and Analysis for Thrust Chambers. Ph.D. Thesis, Northwestern Polytechnical University, Xi’an, China, 2012. [Google Scholar]
  21. Liu, W.; Huang, B.; Liu, J.; Luo, T.Y.; Xu, Z.Q. The stress-strain simulation analysis of solid propellant head artificial debond layer. Equip. Environ. Eng. 2015, 12, 30–34. [Google Scholar]
  22. Shi, H.B.; Zhu, Z.N.; Zhang, S.Q. Stress fields analysis of stress release boot region with various materials. J. Solid Rocket Technol. 1995, 18, 24–29. [Google Scholar]
  23. Xu, R.Q.; Yang, M.; Zheng, X.Y. Debond analysis for stress release boot region of solid rocket motor grain. Sci. Technol. Eng. 2011, 11, 76–81. [Google Scholar]
  24. Zhang, X.H.; Zheng, X.Y.; Li, H.Y.; Wang, Z. Stress and strain analysis for solid rocket motor grains with stress-release boot. Chin. J. Appl. Mech. 2012, 29, 426–430. [Google Scholar]
  25. Yıldırım, H.C.; Özüpek, Ş. Structural assessment of a solid propellant rocket motor: Effects of aging and damage. Aerosp. Sci. Technol. 2011, 15, 635–641. [Google Scholar] [CrossRef]
  26. Wang, Y.N.; Wang, Z.Y. Study on assembly manufacturability for a nozzle. Mechan. Eng. 2014, 6, 179–181. [Google Scholar]
  27. China Aeronautical Materials Handbook Committee. China Aeronautical Materials Handbook, 2nd ed.; Standard Press of China: Beijing, China, 2002; Volume 8, pp. 443–448. [Google Scholar]
  28. Lewis Research Center (Design Criteria Office). Solid Rocket Motor Nozzles; National Aeronautics and Space Administration: Cleveland, OH, USA, 1975; pp. 43–44. [Google Scholar]
  29. Chen, R.X. Solid Rocket Motor Design and Study; China Astronautic Publishing House: Beijing, China, 1991; pp. 189–229. [Google Scholar]
  30. Tian, S.P.; Tang, G.J.; Li, D.K.; Yuan, D.C. Gap design of solid rocket motor nozzle structures. J. Propuls. Technol. 2005, 26, 448–451. [Google Scholar]
  31. Tian, S.P.; Tang, G.J.; Li, D.K.; Wu, F. Analysis on nozzle structure integrality of solid rocket motors. J. Solid Rocket Technol. 2005, 28, 180–183. [Google Scholar]
  32. Sun, L.; Bao, F.T.; Zhang, N. A contact nonlinear thermo-structure fully-coupled simulation for nozzle based on one-time adhesive failure. Appl. Mechan. Mater. 2015, 798, 632–637. [Google Scholar] [CrossRef]
  33. Vinay, K.; Goyal, J.I.R.A. Structural Analysis of Solid Rocket Motors. In 49th AIAA/ASME/ASCE/AHS/ASC Structures, Structural Dynamics, and Materials Conference; American Institute of Aeronautics and Astronautics, Inc.: Schaumburg, Germany, 2008; pp. 1–13. [Google Scholar]
  34. Wang, Z.L. A Finite Element Calculation Analysis for Thermal Protection of Nozzles. Master’s Thesis, Harbin Engineering University, Harbin, China, 2005. [Google Scholar]
  35. Zheng, Q. Thermo-structural Analysis and Failure Behavior of C/C Composite Throats. Master’s Thesis, Harbin Institute of Technology, Harbin, China, 2011. [Google Scholar]
  36. Zheng, X.Y.; Chen, F.M.; Cai, F.C. Strategy of thermo-structure coupled computation for composite nozzle. J. Aerosp. Power 2011, 26, 223–227. [Google Scholar]
  37. Zheng, X.Y.; Wang, W.X.; Cai, F.C.; Chen, F.M. Thermo-structure integrative computation for nozzle in SRM. J. Aerosp. Power 2012, 27, 2122–2127. [Google Scholar]
  38. Teng, Y.L.; Huang, L.W. Thermal-structure Analysis of a Composite Nozzle. In 7th China CAE Engineering Technology Conference; Chinese Mechanical Engineering Society: Kunming, China, 2011; pp. 352–356. [Google Scholar]
  39. Li, S.L.; Zhang, F.; Xiong, B.; Hou, X. Influences factor analysis of thermal structure on motor throat. Struct. Environ. Eng. 2013, 40, 56–63. [Google Scholar]
  40. Liu, Q.; Sheng, Z.F.; Shi, H.B.; Chen, H.; Liu, S.G. Experiment of thermal friction coefficient between carbon/carbon and asbestos phenolic material. J. Propuls. Technol. 2012, 33, 468–471. [Google Scholar]
  41. McManus, H.L.N. High-Temperature Thermochanical Behavior of Carbon-Phenolic and Carbon-Carbon Composites. Ph.D. Thesis, Stanford University, Stanford, CA, USA, 1990. [Google Scholar]
  42. Chen, W.H.; Liao, C.Y.; Hung, C.I. A numerical study on the performance of miniature thermoelectric cooler affected by Thomson effect. Appl. Energy 2012, 89, 464–473. [Google Scholar] [CrossRef]
  43. Ming, T.; Wang, Q.; Peng, K.; Cai, Z.; Yang, W.; Wu, Y.; Gong, T. The influence of non-uniform high heat flux on thermal stress of thermoelectric power generator. Energies 2015, 8, 12584–12602. [Google Scholar] [CrossRef]
  44. Wu, X.S.; Chen, J.; Wang, D.; Yang, Y.W. Numerical Simulations of Working Progress of Solid Rocket Engines; Higher Education Press: Beijing, China, 2006. [Google Scholar]
  45. Cai, T.M. Numerical Simulations of Working Progress of Solid Rocket Motor; Northwestern Polytechnical University Press: Xi’an, China, 1991. [Google Scholar]
  46. Bartz, D.R. A Simple Equation for Rapid Estimation of Rocket Nozzle Convective Heat Transfer Coefficients. Jet Propuls. 1957, 1, 49–51. [Google Scholar]
  47. Zhu, B.; Cao, W.W.; Jing, M.; Dong, X.G.; Wang, C.G. Study on spectral emissivity of C/C composites. Spectrosc. Spectr. Anal. 2009, 29, 2909–2913. [Google Scholar]
  48. ANSYS Mechanical APDL Theory Reference; ANSYS, Inc.: Canonsburg, PA, USA, 2013; pp. 12–15, 235–236, 309–312.
  49. Shi, S.B. Ablation Mechanism and Thermo-Mechanical Behavior of Silica/Phenolic Composites. Ph.D. Thesis, Harbin Institute of Technology, Harbin, China, 2013. [Google Scholar]
  50. Zhao, X.G. Research on Ablation Behavior of Carbon/phenolic Composites. Master’s Thesis, Harbin Institute of Technology, Harbin, China, 2015. [Google Scholar]
  51. Yi, F.J.; Liu, Y.Q.; Zhai, P.C.; Kuang, S.N. Thermal stress analysis of carbon/phenolic composites during ablation process. J. Harbin Inst. Technol. 2008, 40, 1081–1084. [Google Scholar]
Figure 1. Sketch of the chosen nozzle.
Energies 09 00430 g001
Figure 2. Mesh generation for the thermo-structural simulation.
Energies 09 00430 g002
Figure 3. Two possible passageways that may lead to flame leak: (a) 1→2→3→4→5 and (b) 6→7→8→9→10.
Energies 09 00430 g003
Figure 4. Curves of static temperature and Mach number along the nozzle axis.
Energies 09 00430 g004
Figure 5. Forced convection coefficient and recovery temperature along the wall.
Energies 09 00430 g005
Figure 6. Relationship between temperature and pore pressure of silica/phenolic composites.
Energies 09 00430 g006
Figure 7. Relationship between temperature and pore pressure of carbon/phenolic composites.
Energies 09 00430 g007
Figure 8. Temperature distribution graphs for the two types of interface treating methods. (a) The interfaces are treated as bonded ones; (b) the interfaces are treated as contact ones, where thermal contact resistance, radiation between the contact and the target, and energy dissipation caused by friction are effective.
Energies 09 00430 g008
Figure 9. Temperature distribution curves of the passageway for the two types of interface treatment methods.
Energies 09 00430 g009
Figure 10. Von Mises stress distribution graphs for the two types of interface treating methods. (a) Bonded interfaces; (b) frictional interfaces.
Energies 09 00430 g010
Figure 11. Von Mises stress variation curves of the passageway for the two different types of interface treatments.
Energies 09 00430 g011
Figure 12. Axial stress variation curves of the passageway for the two different types of interface treatments.
Energies 09 00430 g012
Figure 13. Radial stress variation curves of the passageway for the two different types of interface treatments.
Energies 09 00430 g013
Figure 14. Contact number history of the nine selected modes.
Energies 09 00430 g014
Figure 15. Convergent region after experiment. (a) Overview of the convergent region; (b) Highlighted region of (a).
Energies 09 00430 g015
Figure 16. Divergent region after the experiment.
Energies 09 00430 g016
Table 1. Nozzle Dimensions.
ParameterValue (mm)
Length of the nozzle (L)184
Diameter of the throat (dt)48
Diameter of the exit154
Table 2. Material properties of C/C composite [34].
ρ1540
T(K)EvGCα (×10−6)K
XY/ZXY/XZYZXY/XZYZXY/ZXY/Z
4734600.10.242.489.1714129.84−0.154.3673.3
673230149110.0505.1975.9
8731.518156110.220.155.4379.8
107311016329.50.36.1281.3
32730.253.519856.51.958.9398.5
Table 3. Material properties of carbon-phenolic-resin [41].
ρ1430
T(°C)EvGT(K)α (×10−6)T(K)KC
XY/ZXY/XZYZXY/ZXY/ZT
2316.5517.930.325.176.36616.6713.332730.81.08273880
9312.4117.240.294.836.5547722.18.844730.931.53731165
2045.5213.10.232.763.2458823.976.8554811.554731450
3151.388.960.131.032.2169924.814.96110011.555731475
4260.556.90.081.031.8681025.291.9515001.62.596731500
5370.346.550.061.11.72108815.15019001.6310731500
8150.347.580.051.381.791366−5.70
10930.348.270.061.521.931911−12.91.54
16480.346.90.071.522.072477−13.88.02
22040.342.760.081.241.523033−21.910.23
27600.341.380.090.480.69
Table 4. Material properties of silica-phenolic-resin.
ρ1750
T(°C)Evα (×10−6)KC
2214.30.329.70.521005
2000.58
4005.380.050.861256
6001.15
8001.73
10001300
12007
270020.03
350029.881400
Table 5. The defined initial gap sizes for the chosen possible passageway.
Fitting Surface12345
Gap size (mm)0.10.10.150.150.15
Fitting surface678910
Gap size (mm)0.20.20.20.20.2
Table 6. Comparison of stress release effect (%). The positive value means release of the stress and the negative value means aggravation of the stress.
Time1 s5 s
Path1234512345
Von Mises Stress20.35−14.30−16.67−5.51%−18.07−30.1964.9042.6726.4712.67
Axial stress−85.15−193.18−249.9−182.5−131.7−17165.91−525−387−162
Radial stress32.316.09−17.44−12.42−39−32.8422.4229.4422.724.73
Time15 s20 s
Path1234512345
Von Mises Stress40.2055.4180.8178.6536.7257.1750.2866.7091.9969.29
Axial stress−5.12−151.186.0679.7643.335.16−52.764.8493.5180.39
Radial stress−53.7−17838.755.83−64.55−219−19.99.170.460.75
Table 7. Gap size matching modes.
Fitting SurfaceGap Size (mm)
Mode NumberABCDEFGHI
1 & 20.050.100.15
3→50.150.200.250.150.200.250.150.200.25
Table 8. Best gap sizes for the chosen possible passageway.
Fitting Surface12345
Best gap size (mm)0.050.050.250.250.25

