Article

Numerical Study of Solidification in a Plate Heat Exchange Device with a Zigzag Configuration Containing Multiple Phase-Change-Materials

1
State Key Laboratory of Multiphase Complex Systems, Institute of Process Engineering, Chinese Academy of Sciences, Beijing 100190, China
2
School of Engineering and Technology, China University of Geosciences, Beijing 100083, China
3
Birmingham Centre for Thermal Energy Storage, University of Birmingham, Edgbaston, Birmingham B15 2TT, UK
*
Author to whom correspondence should be addressed.
Energies 2016, 9(6), 394; https://doi.org/10.3390/en9060394
Submission received: 31 January 2016 / Revised: 28 April 2016 / Accepted: 3 May 2016 / Published: 24 May 2016
(This article belongs to the Special Issue Energy Efficient Actuators and Systems)

Abstract

:
Latent heat thermal energy storage (TES) plays an important role in the advocation of TES in contrast to sensible energy storage because of the large storage energy densities per unit mass/volume possible at a nearly constant thermal energy. In the current study, a heat exchange device with a zigzag configuration containing multiple phase-change-materials (m-PCMs) was considered, and an experimental system was built to validate the model for a single PCM. A two-dimensional numerical model was developed using the ANSYS Fluent 14.0 software program. The energy fractions method was put forward to calculate the average Ste number and the influence of Re and Ste numbers on the discharge process were studied. The influence of phase change temperature among m-PCMs on the solidification process has also been studied. A new boundary condition was defined to determine the combined effect of the Re and Ste numbers on the discharging process. The modelling results show that for a given input power, the Ste (or Re) number has a significant impact on the discharging process; however, the period value of inlet velocity has almost no impact on it. Besides, the zigzag plate with m-PCMs has a good impact on the temperature shock as “filter action” in the discharging process.

Graphical Abstract

1. Introduction

In recent decades, environmental pollution and energy shortages have had a significant impact on our lives, and addressing these problems is a great challenge for scientific researchers. Thermal energy storage (TES) plays a key role in addressing environmental pollution and energy shortages. TES systems can be divided into sensible heat thermal storage (SHTS) and latent heat thermal storage (LHTS) systems [1]. However, compared with SHTS, LHTS is a particularly attractive technique because it provides a high energy storage density and a constant or near-constant operating temperature that corresponds to the phase change temperature of phase-change-materials (PCMs). Thus, LHTS systems using PCMs are one of the most attractive methods to store thermal energy in different engineering fields, such as electronic products [2,3], waste heat recovery [4,5], room temperature regulation [6,7,8], solar energy utilization [9] and off-peak electricity tariff implementation [10,11].
Nevertheless, the PCMs loaded in the unit possess a relatively low thermal conductivity that drastically suppresses the energy charging/discharging rates of LHTS systems. There are several common ways to enhance the heat transfer of the LHTS systems, including improving the thermal conductivity of PCMs (using metallic foam [12], carbon nanotube (CNT) [13]), using m-PCMs [14,15], changing LHTS unit configurations (adding fins [16,17], using heat pipes [18,19], using enhanced tubes [20], using eccentric tube [21], etc.) and synthesizing those three enhancements [22,23].
Gong and Mujumdar [14] numerically studied the cyclic melting-freezing of m-PCMs in a series arrangement in an LHTS slab unit on the fixed wall temperature boundary condition. The numerical results indicate that the instantaneous heat flux can be greatly enhanced using m-PCMs slabs. Ismail et al. [24] studied the influence of the fin number, fin length, fin thickness and annular spacing on the freezing process; they found that the fin length and annular spacing, but not the fin thickness, had significant influence on the complete solidification time on the constant wall temperature condition. Blen et al. [25] studied the effect of the fin number on the melting and solidification process of CaCl2·6H2O as a PCM in a vertical two-concentric shell and tube unit with the fins placed inside the PCM, and they also studied the mass flow rate and inlet temperature on the melting and solidification process. It has been reported that the effect of the fins placed inside the PCM to the melting and solidification time is much more than the effects obtained by the flow rate.
Ismail et al. [26] experimentally and numerically studied the effect of different operation parameters, such as the Dean number ( D e = R e / R / r ), fluid flow rate and inlet temperature of the heat transfer fluid (HTF), on the solidification of PCM around a curved cold tube. Al-Abidi et al. [27,28] numerically studied the solidification of PCM in a triplex tube heat exchanger with internal and external fins on the boundary condition of a constant wall temperature using a 2D numerical model. They reported that the case with full-size fins achieved complete solidification in a short time. Al-Abidi et al. [27] also experimentally studied the effect of the flow rate on the solidification of PCM in a triplex tube heat exchanger with fins. Mosaffa et al. [29] studied the effect of the design parameters of thermal storage units, such as the slab length, thickness and fluid passage gap, on the storage performance in the constant inlet temperature condition. The optimum parameters were determined to be air channel thickness of 3.2 mm, slab length of 1.3 m and slab thickness of 10 mm.
As discussed above, there have been very few reports about the solidification process of m-PCMs within a zigzag plate unit. The charging or discharging process of LHTS often use constant wall temperature or wall thermal flux or by heat transfer between HTF and PCM. However, the work conditions of simulation or experiment were focused on the inlet velocity (mass flow rates) or temperature boundaries with one of them fixed while the other varied. In this article, the arrangement of m-PCMs (reversed and forward) within a zigzag plate unit was studied, and different work conditions, such as the inlet temperature (Ste) and inlet velocity (Re), were also studied and the energy fractions was defined to calculate Ste number for the m-PCMs in arbitrary ratio. In addition, a new work condition, inlet power, was defined to determine the synergistic effect of Ste and Re on the discharging process of a zigzag plate in LHTS systems and the effect of “filter action” on the the temperature shock was also studied.

2. Numerical Modelling
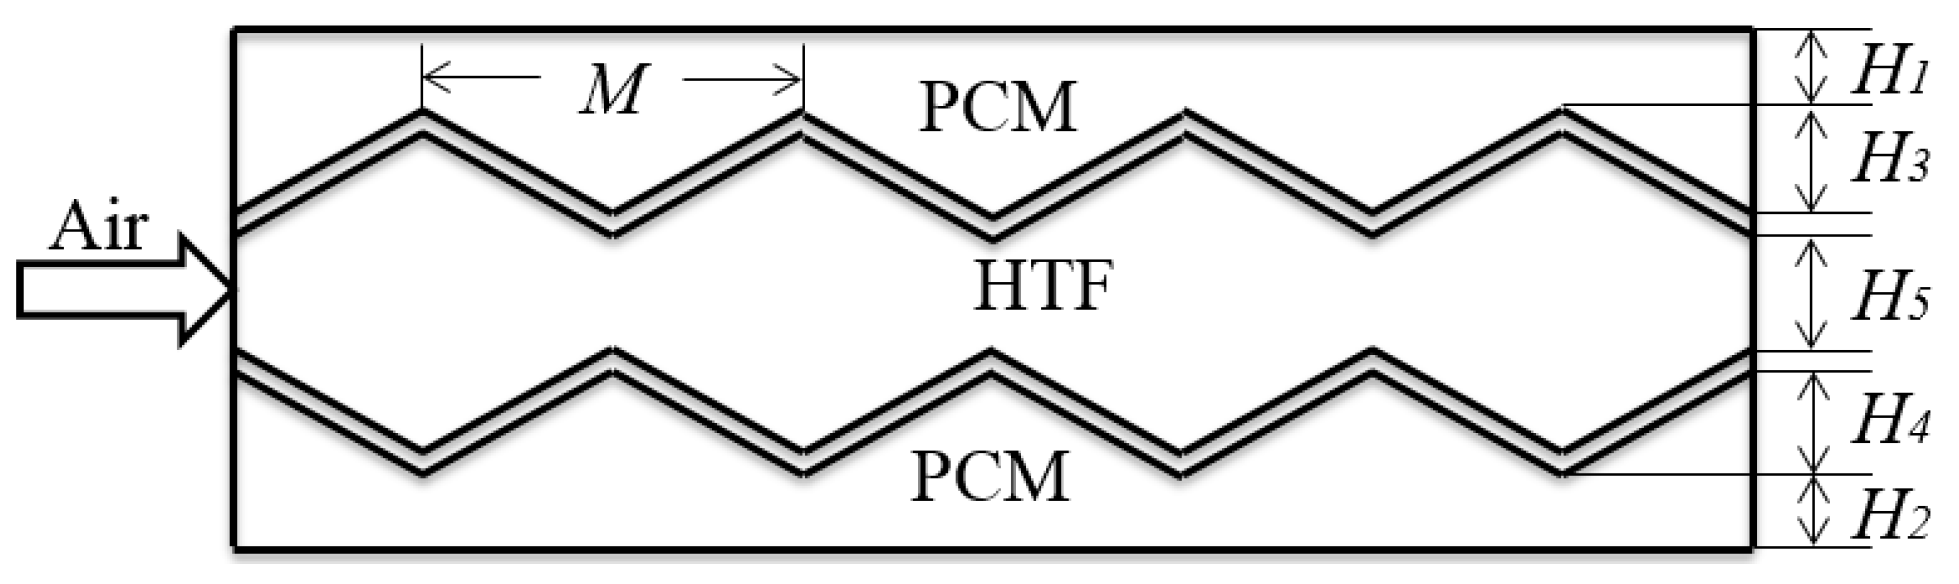
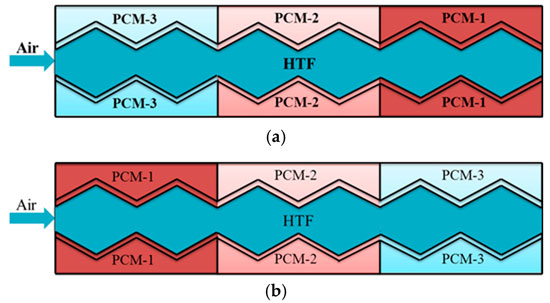
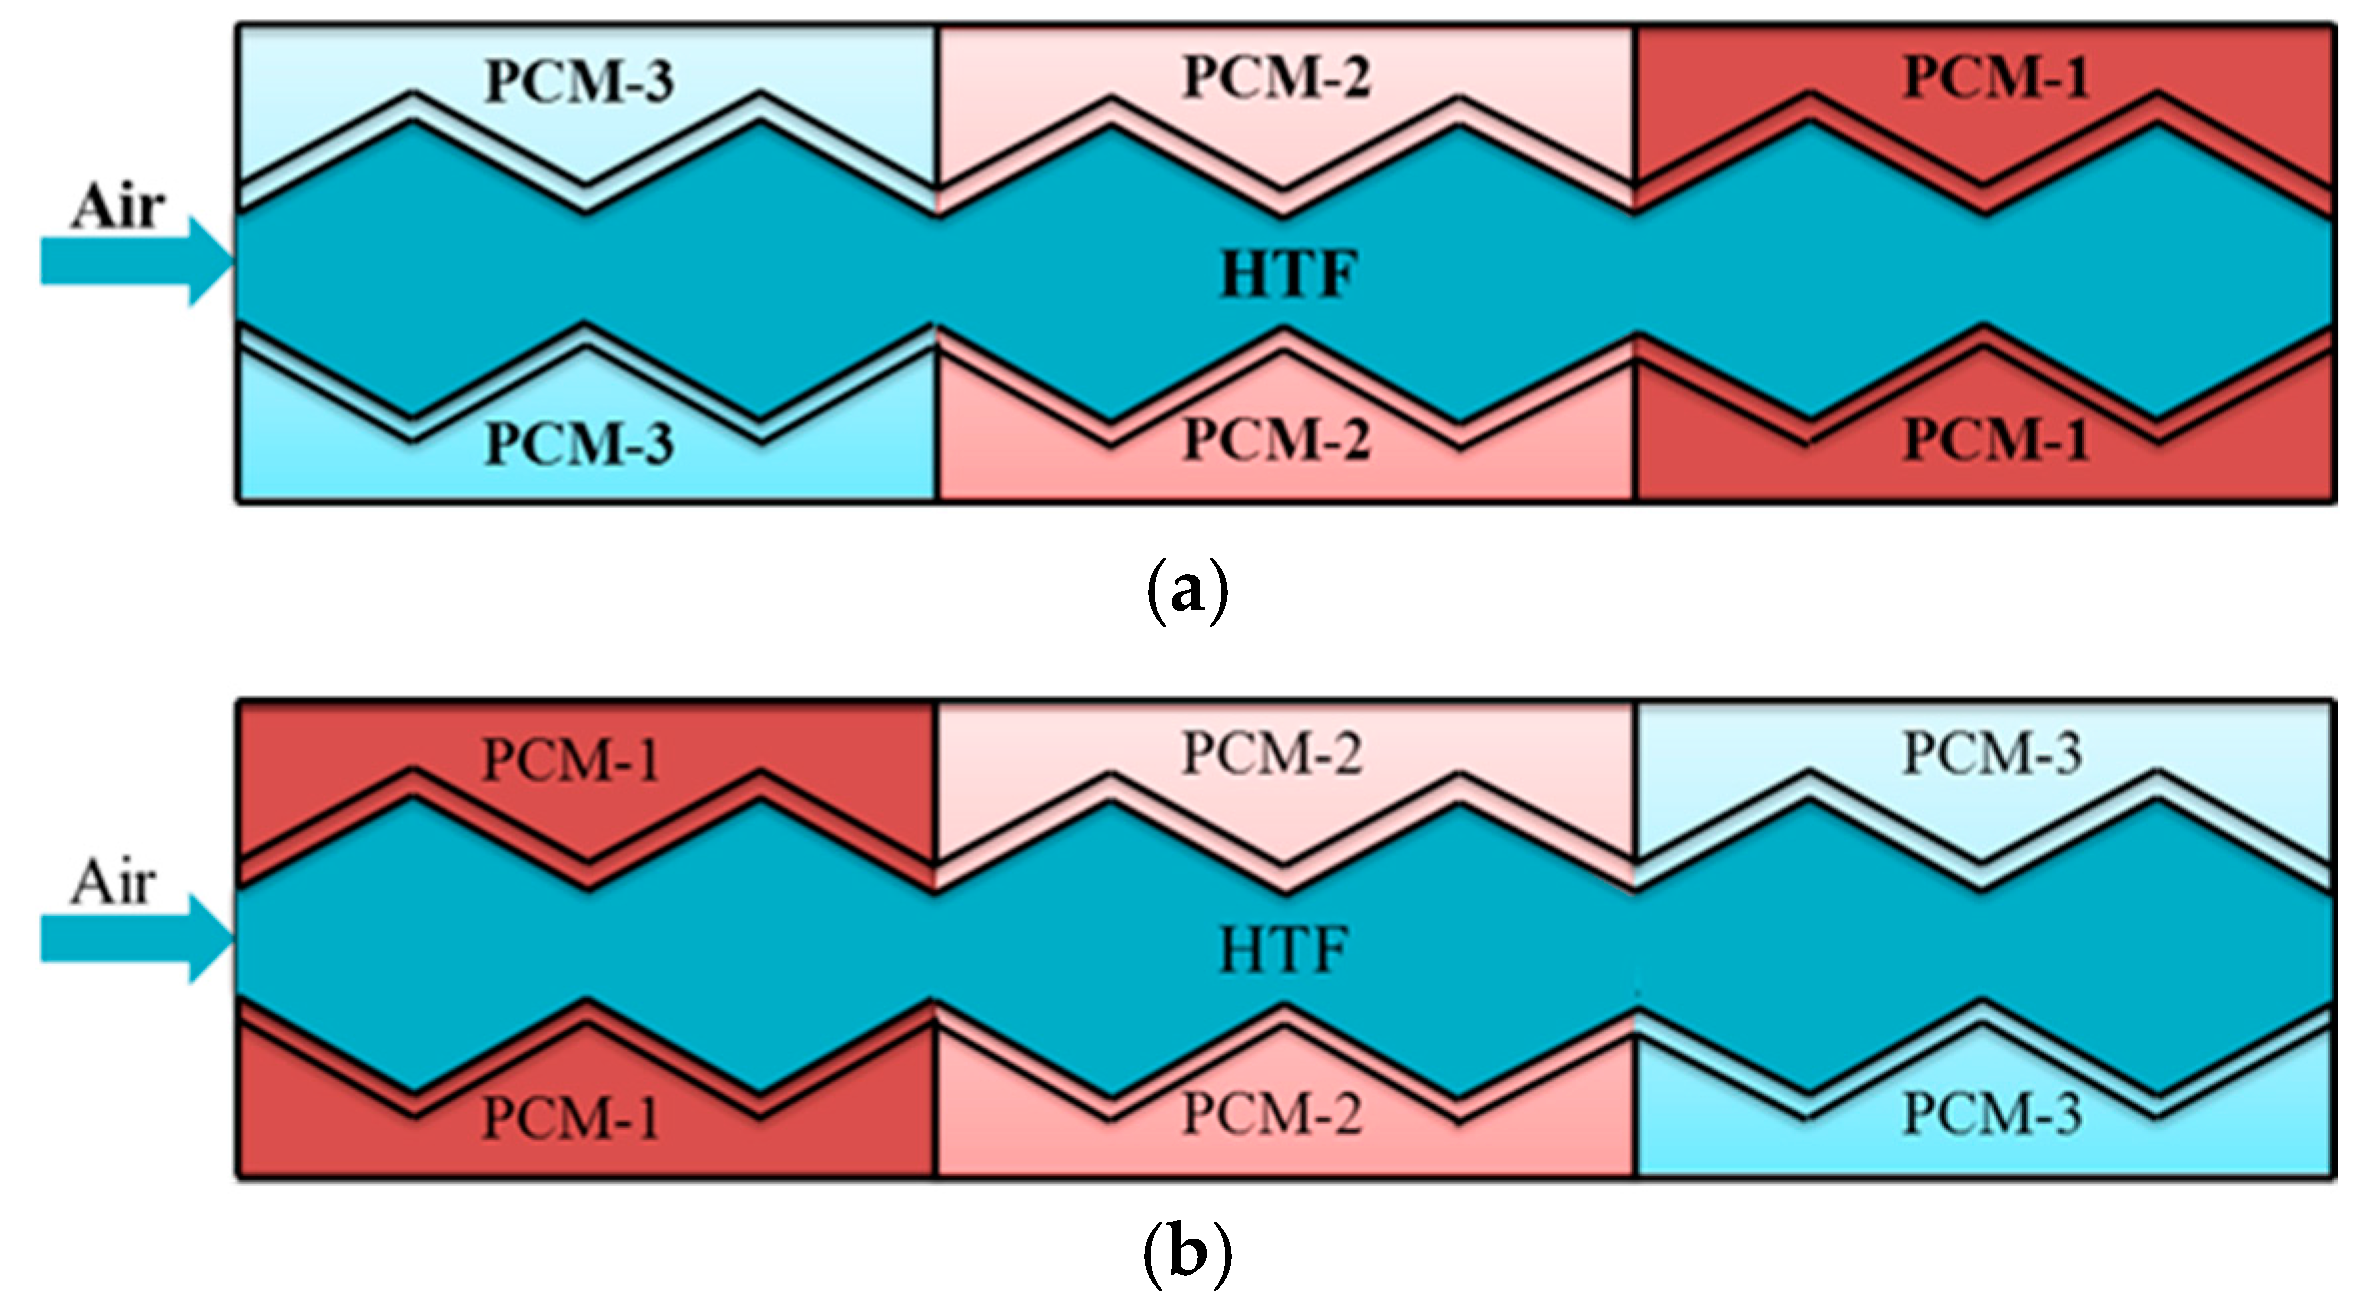
2.1. Physical Model

The physical configuration of the zigzag plate is shown in Figure 1. With reference to this figure, the geometries of the zigzag plate are given as: H1 = H2 = 2 mm, H3 = H4 = 4 mm and H5 = 2 mm. The thickness of the plate is 1 mm. The PCM considered in this work is a salt mixture of sodium chloride and magnesium chloride at a mass ratio of 4:6. The thermophysical properties of the salt mixture are tabulated in Table 1.
The arrangement of m-PCMs in the forward and reversed directions is shown in Figure 2. Figure 2a shows the three PCMs arrangement in reversed direction which means the phase change temperature of the three PCMs increases gradually in the HTF flow direction; Figure 2b shows the three PCMs arrangement in forward direction which means the phase change temperature of the three PCMs decreases gradually in the HTF flow direction.

2.2. Governing Equation

The mathematical formulation of the phase change problem includes mass, momentum and energy balance equations [30]. The energy equation takes the following form:
t ( ρ H ) + · ( ρ v H ) = · ( k T ) + S h
where H, ρ, v , k, T and Sh are the enthalpy, density, velocity vector, thermal conductivity, temperature and energy source term, respectively. The enthalpy, H, includes both sensible enthalpy (h) and latent enthalpy (ΔH):
H = h + Δ H
with the sensible enthalpy given by:
h = h ref + T ref T c p d T
where href, Tref, and cp stand for the enthalpy at a reference temperature, the reference temperature and the specific heat at a constant pressure, respectively. The latent enthalpy in Equation (2) is related to the fraction of liquid phase (β) during a phase change and the specific latent heat of the PCM (L) by:
Δ H = β L
with β given by the following equation:
β = { 0       T T s T T s T l T s         T s < T < T l 1       T T l
where Ts and Tl stand for the solidification point and the melting point, respectively. This method is known as the enthalpy-porosity model, which treats the phase-changing region (mushy region) as porous, with a porosity equal to the liquid fraction. The source term of the energy equation is given as:
S h = ( ρ Δ H ) t + · ( ρ v Δ H )
Because of the formation of liquid during a phase change, fluid flow occurs in the liquid phase and the mushy zones, which are governed by the following set of momentum equations:
( ρ u ) t + · ( ρ v u ) = · ( μ u ) P x + S x
( ρ u ) t + · ( ρ v v ) = · ( μ v ) P y + S y + S b
where u and v are the x- and y-direction velocity, respectively; P is the pressure; µ is the viscosity; and Sx, Sy and Sb stand for the source terms of the phase change zone in the x-direction, the y-direction and that resulting from gravitational acceleration (y-direction), respectively, and are given in the following equations:
S x = A ( 1 β 2 ) β 3 + ε u
S y = A ( 1 β 2 ) β 3 + ε v
S b = ρ g β ( h h ref ) c p
where g is the gravitational acceleration, ε is a small number (e.g., 0.001) to prevent division by zero, and A is the mushy zone constant with a value depending on the structure of the porous mushy zone but normally assumed to be 10−5. The phase change can induce turbulent flows, and as a result the following turbulent sink term needs to be considered:
S t = A ( 1 β 2 ) β 3 + ε Φ
where Φ stands for the turbulence parameter obtained from the turbulent flow model. The large eddy simulation (LES) model is used because of the complexity of the flow field.

2.3. Boundary Conditions

At the initial time, the m-PCMs were superheated in a liquid state and the entire calculation domain was set to a zero velocity (that was higher than the highest melting point of m-PCMs). Periodic boundary conditions were assumed for both the upper and lower computational domain. Adiabatic boundary conditions were applied to the front and back walls. No-slip boundary conditions were applied to the interior zigzag tooth-like wall surfaces and the inlet and outlet boundary condition were set as velocity inlet and outflow respectively in the FLUENT (a commercial software of computational fluid dynamics) environment. The boundary conditions can be pictorial description as follows:
  • Tin = T (constant or changed with time depending on the work condition);
  • vin = v (constant or changed with time depending on the work condition);
  • To = 803.15 K.

2.4. Numerical Modelling

The models were solved in the FLUENT environment. The Semi-Implicit Method for Pressure-Linked Equations (SIMPLE) algorithm was used for velocity-pressure coupling. The PREssure Staggering Option (PRESTO) scheme was used for pressure spatial discretization, whereas the bounded central differencing (BCD) scheme was used for the discretization of the momentum terms. The under relaxation value factors for the pressure, velocity, energy, and liquid fraction were 0.3, 0.2, 1, and 0.9, respectively. The computational domain was represented by a two-dimensional base grid, which had 49,163 mesh cells, with 19,560 cells in the PCM domain and 13,770 cells in the HTF domain. A finer grid was created by increasing the mesh density near the plate walls. Grid independence was studied using grid sizes of 0.3 mm, 0.4 mm and 0.5 mm, which resulted in 84,932, 63,410 and 49,163 total numbers of cells, respectively. There was little effect of the grid size on the time evolution of the liquid fraction. It was therefore decided to use a grid size of 0.5 mm with 49163 cells in all of the subsequent simulations. The independent time steps and grid sizes for the melt fraction for a zigzag plate, as well as the different time steps of 0.005 s, 0.01 s (chosen), and 0.02 s, were examined prior to simulation.

3. Experimental Verification

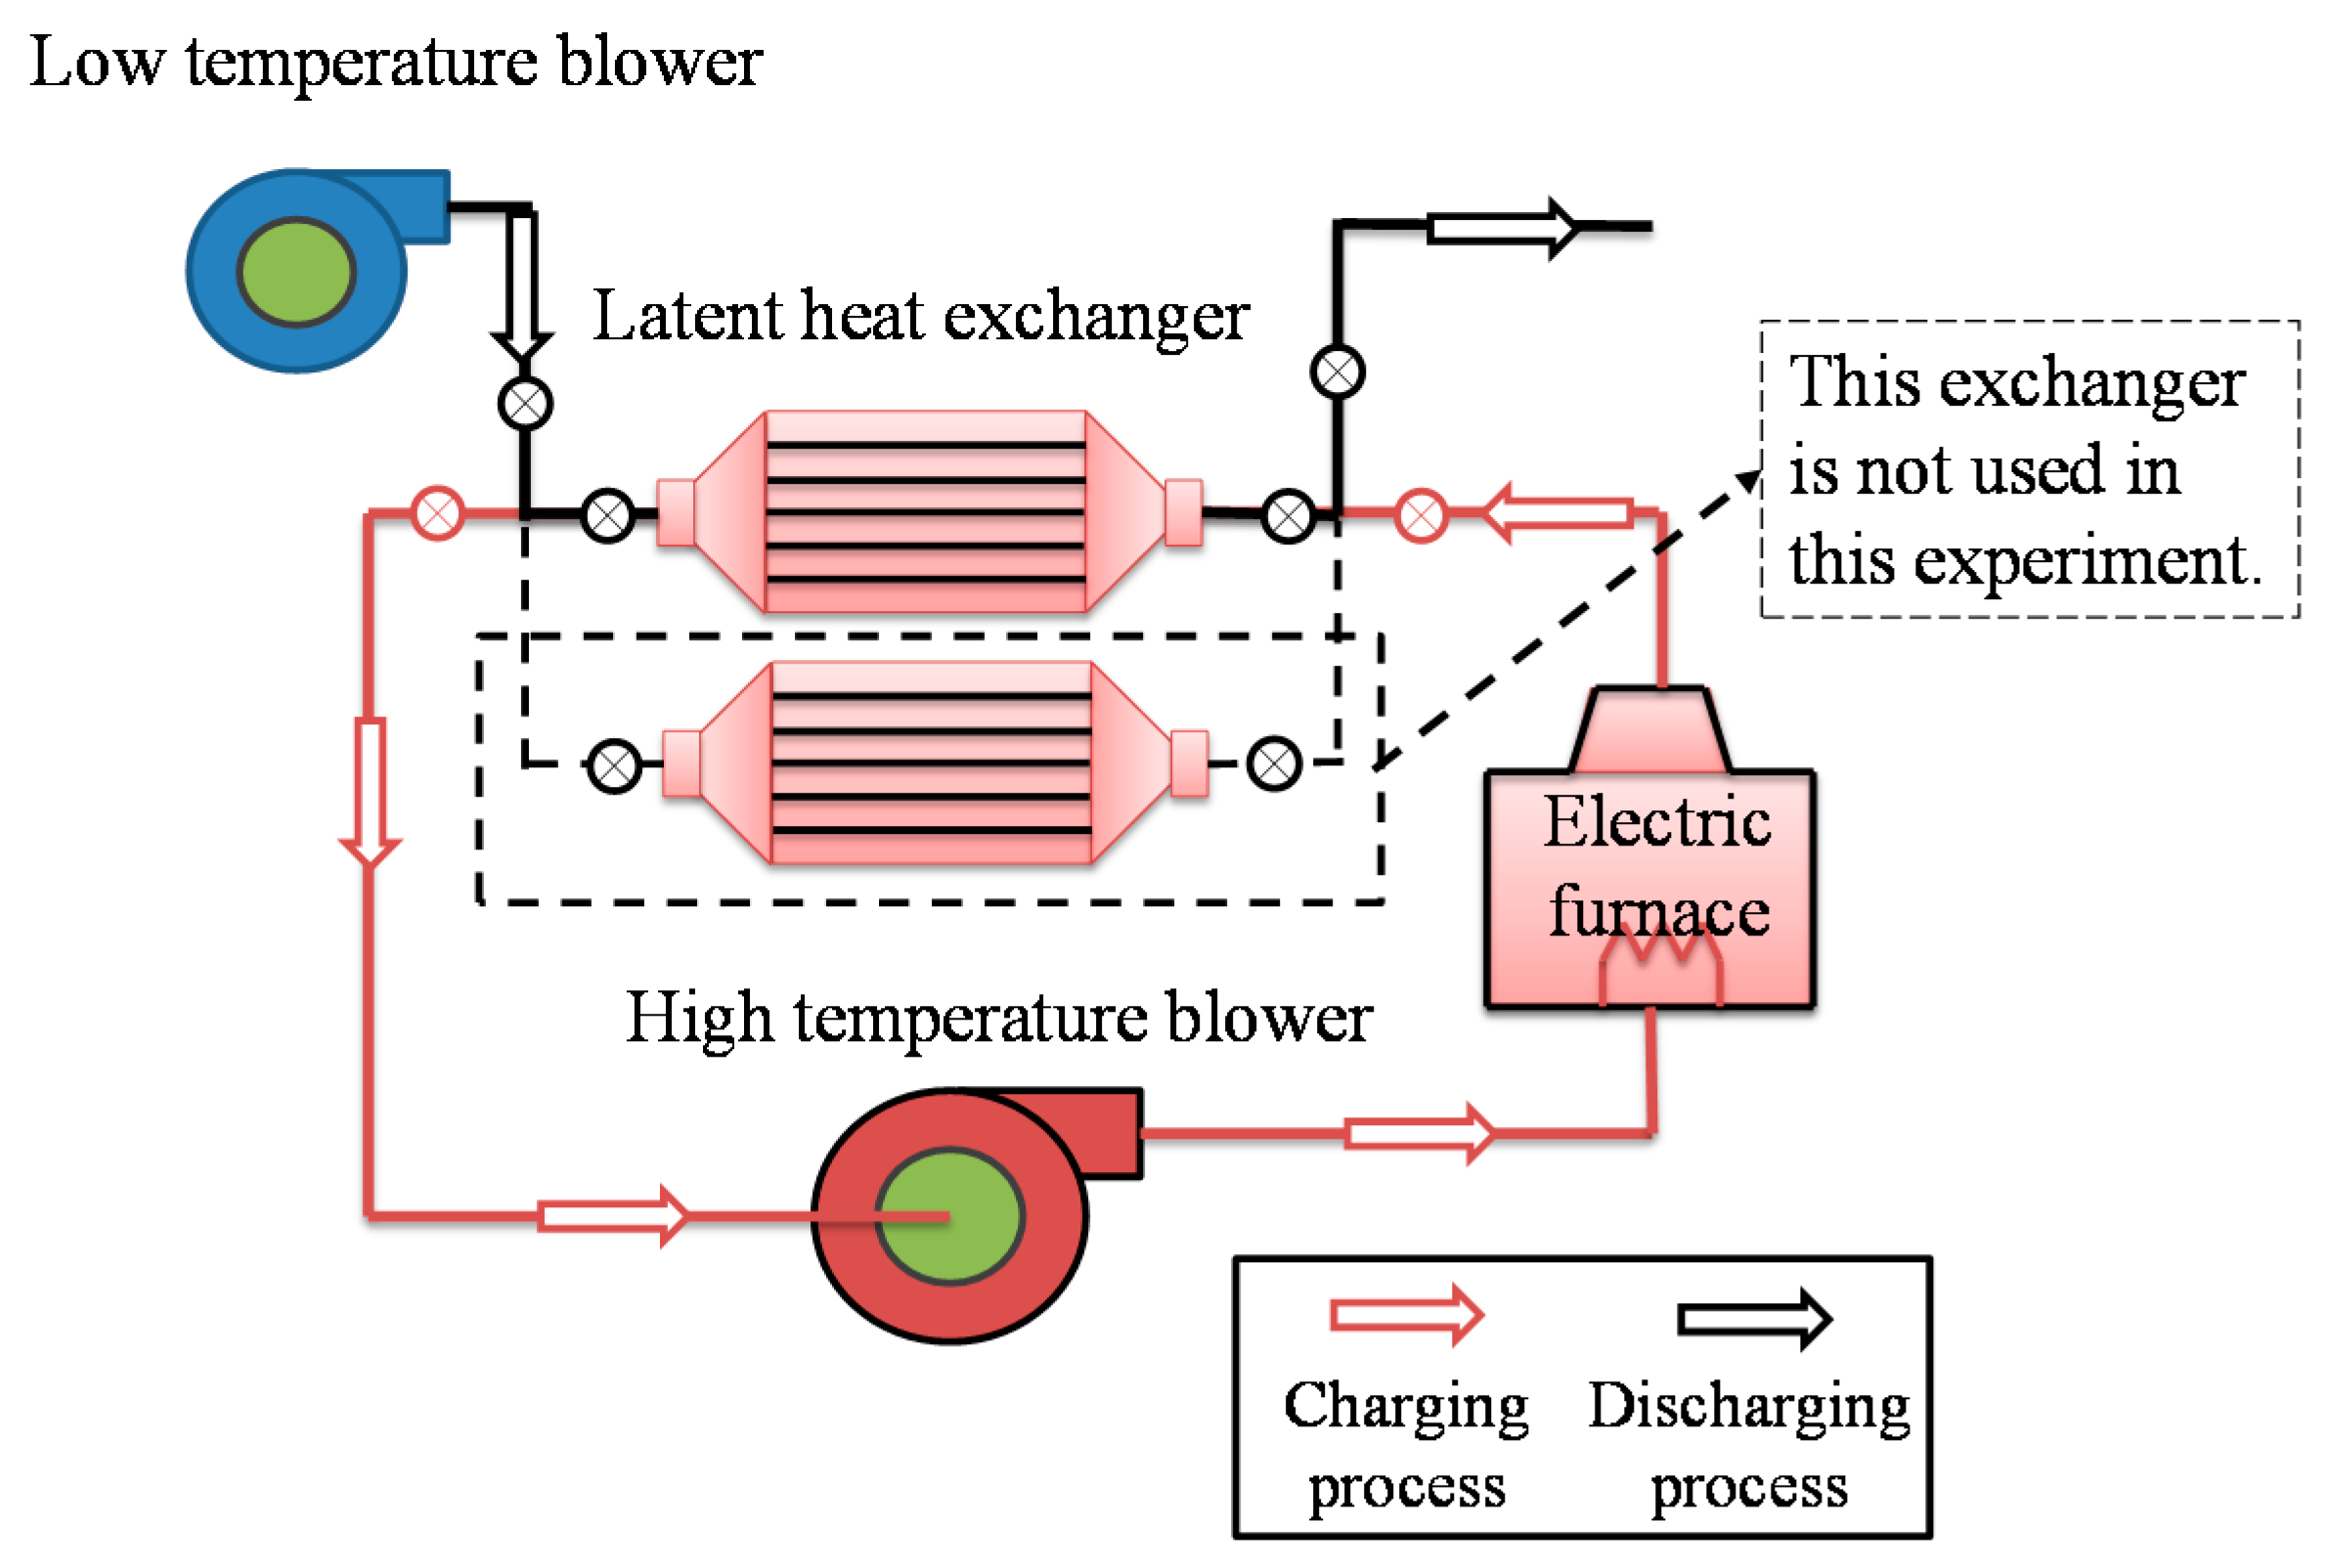
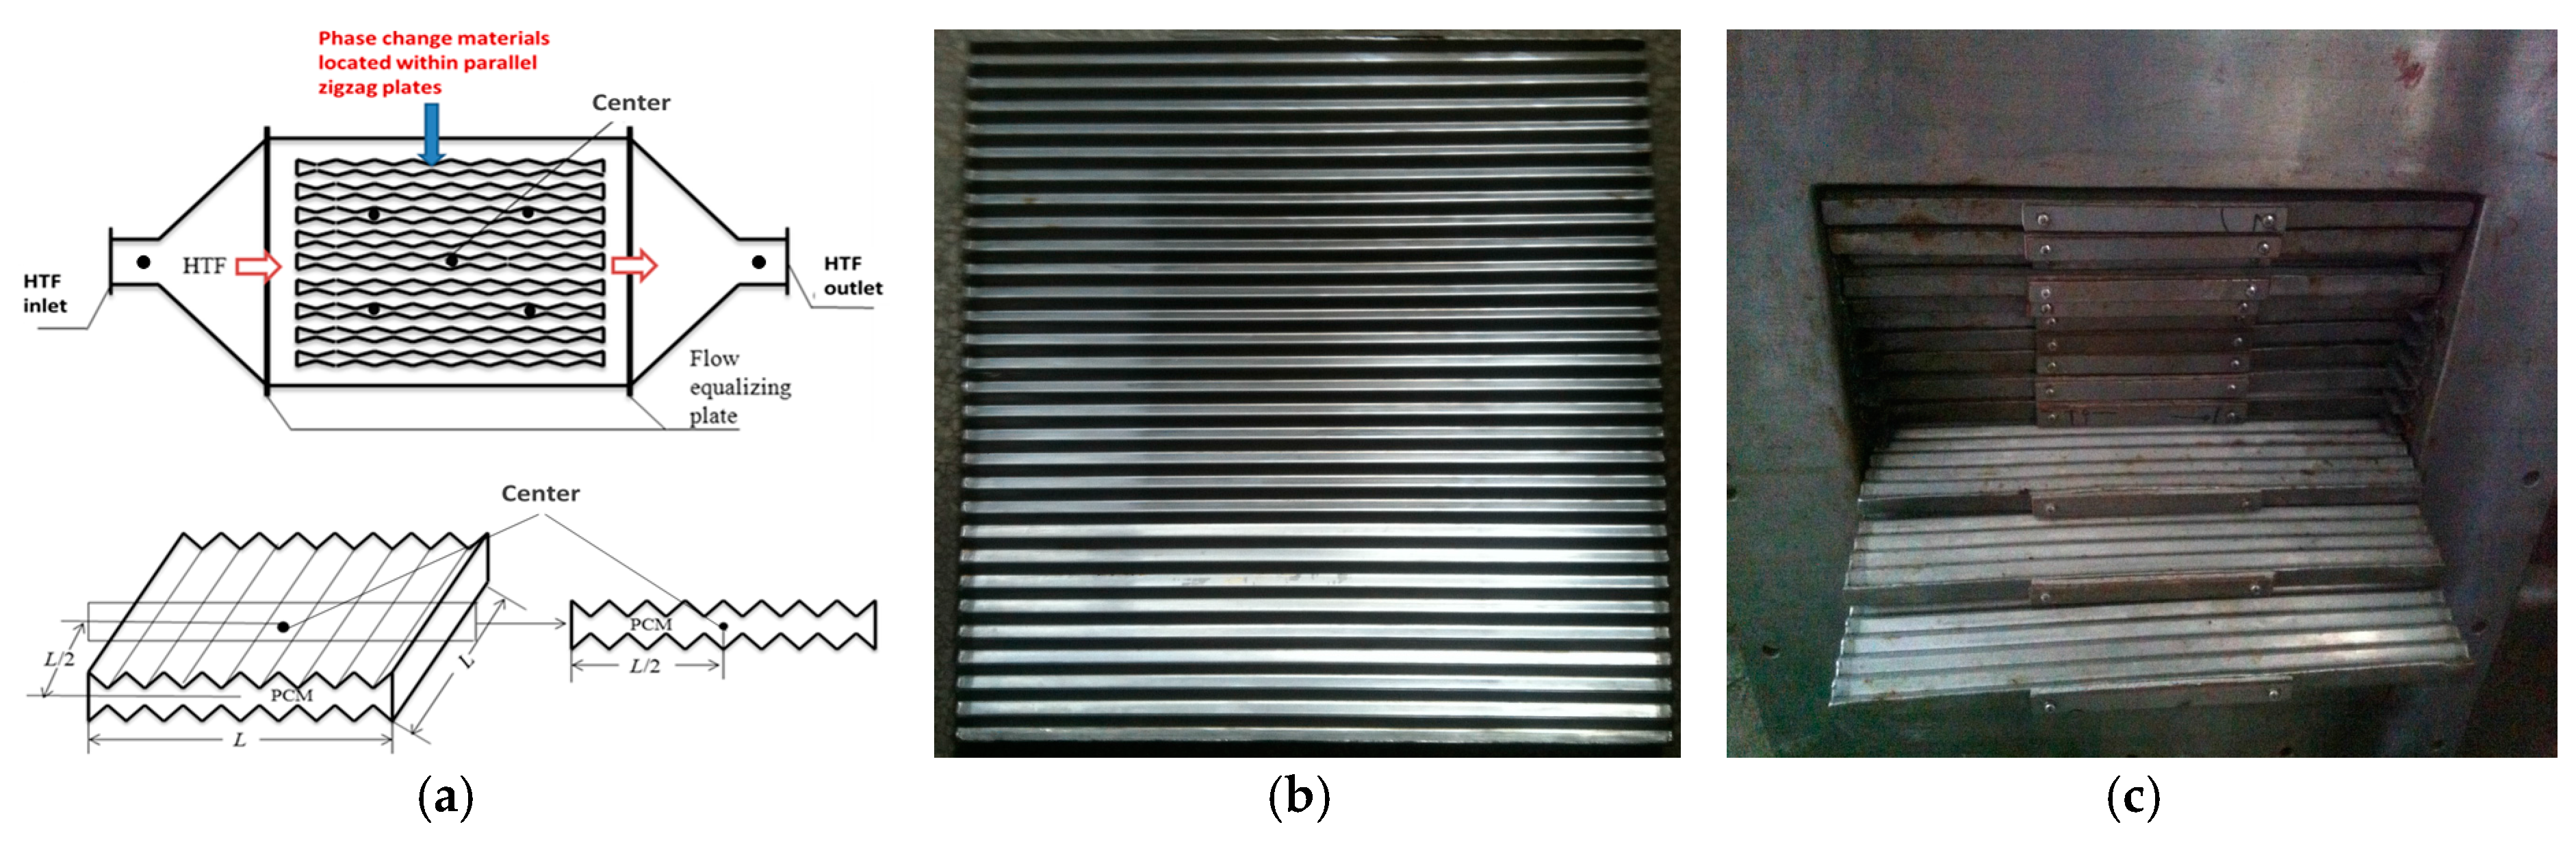
3.1. Experimental System and Procedure

Experimental work was carried out to verify the model. Figure 3 shows a schematic diagram of the experimental system, which consisted mainly of an electric heating furnace, a high temperature blower, and two phase change heat exchangers. In the charge process, air was heated to a preset temperature by the electric heating furnace and driven to circulate in the loop by a high temperature blower. In the charge step, the heated air flowed through the phase changer heat exchangers where heat was transferred to and stored within the phase change material. When fully charged (judged from temperature measurements of the outlet air temperature), the electric furnace and the high temperature blower were switched off to end the charging step. In the discharge step, the ambient air blower was switched on to deliver a preset rate of air flow to the charged phase change heat exchanger. Air was used as the HTF because of the high melting points of the phase change materials considered in this work. The two heat exchangers could be charged at the same time. Through the use of a combination of valves, it was also possible to charge one of the heat exchangers while the other was discharged. In this work, only one phase change heat exchangers was used, and the charge-discharge processes occurred cyclically.
Various temperature, flow and pressure transducers were installed and linked to a data acquisition unit. The temperature of the phase change materials was measured using K-type thermocouples which have the measurement range of 273.15–1273.15 K and error range of ±0.2% and the thermocouple arrangement is shown in Figure 4a. The surface of the zigzag plate is shown in Figure 4b. Each phase change heat exchanger contained 23 pairs of parallel zigzag plates with the phase change materials sealed between each pair of the zigzag plates, and the internal structure of the heat exchanger are shown in Figure 4c. The flow of the HTF was through channels of adjacent pairs of the zigzag plates.

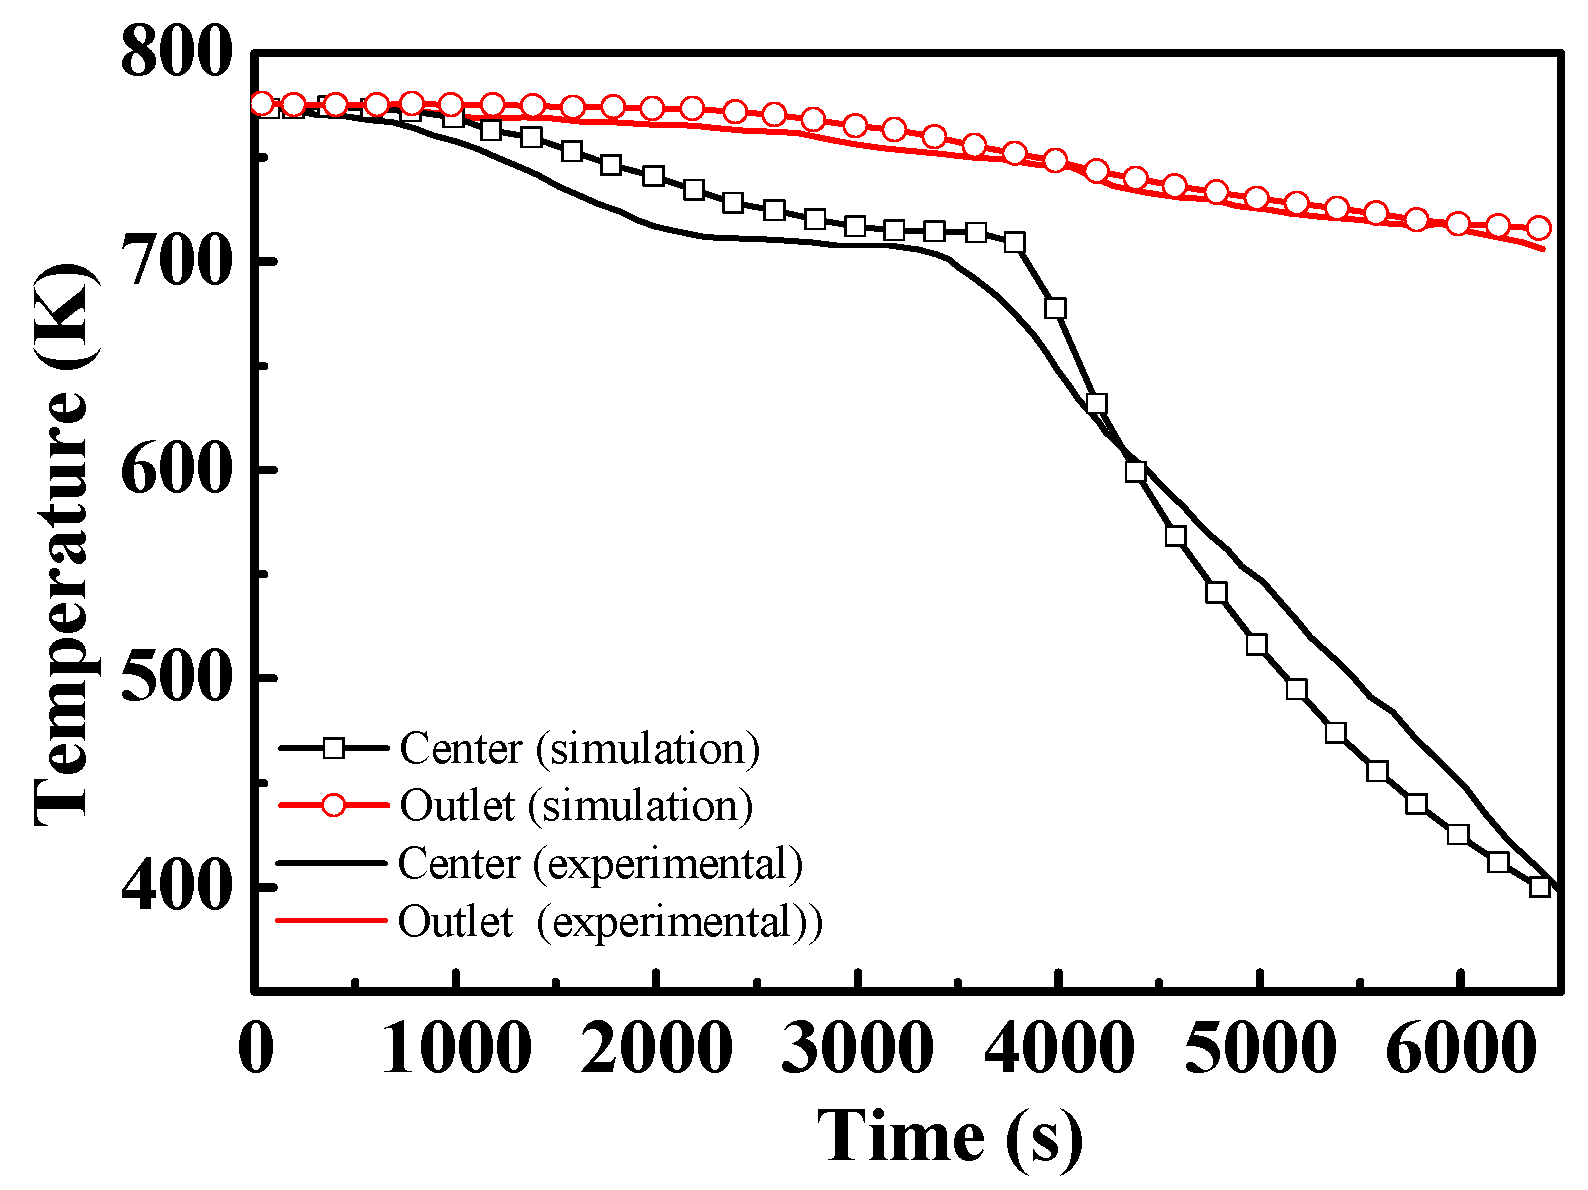
3.2. Verification and Validation of the Simulation Models

Figure 5 compares the measured and calculated time evolutions of the temperature at the outlet and the centre of PCM (as indicated in Figure 4a). It can be seen that reasonably good agreement has been achieved, thus establishing confidence in the model. The deviation of thermocouple 1 is likely associated with the existence of pores in the PCM because the material was loaded into the plate heat exchangers in compacted powder form. Other reasons may include the temperature dependence of the PCM properties, an uneven distribution of the HTF flow across all of the plates, which were not considered in the modelling, or the location of the thermocouple.

4. Modelling Results and Discussion

Numerical simulations were performed on three PCMs that were contained between zigzag plates. The ranking of the phase change temperatures followed PCM-1 (TPCM-1) > PCM-2 (TPCM-2) > PCM-3 (TPCM-3). It is assumed that TPCM-1TPCM-2 = TPCM-2TPCM-3 = ΔT/2, where TPCM-2 = (TPCM-1 + TPCM-3)/2 = 713.15 K and ΔT = TPCM-1TPCM-3. Four sets of m-PCMs with different phase change temperatures were selected for the modelling study with ΔT = 20, 40, 60, and 80 K. The results were compared with ΔT = 0 K (a single PCM only). Unless otherwise indicated, the inlet velocity of the HTF and the mass ratio of m-PCMs were assumed to be unity.

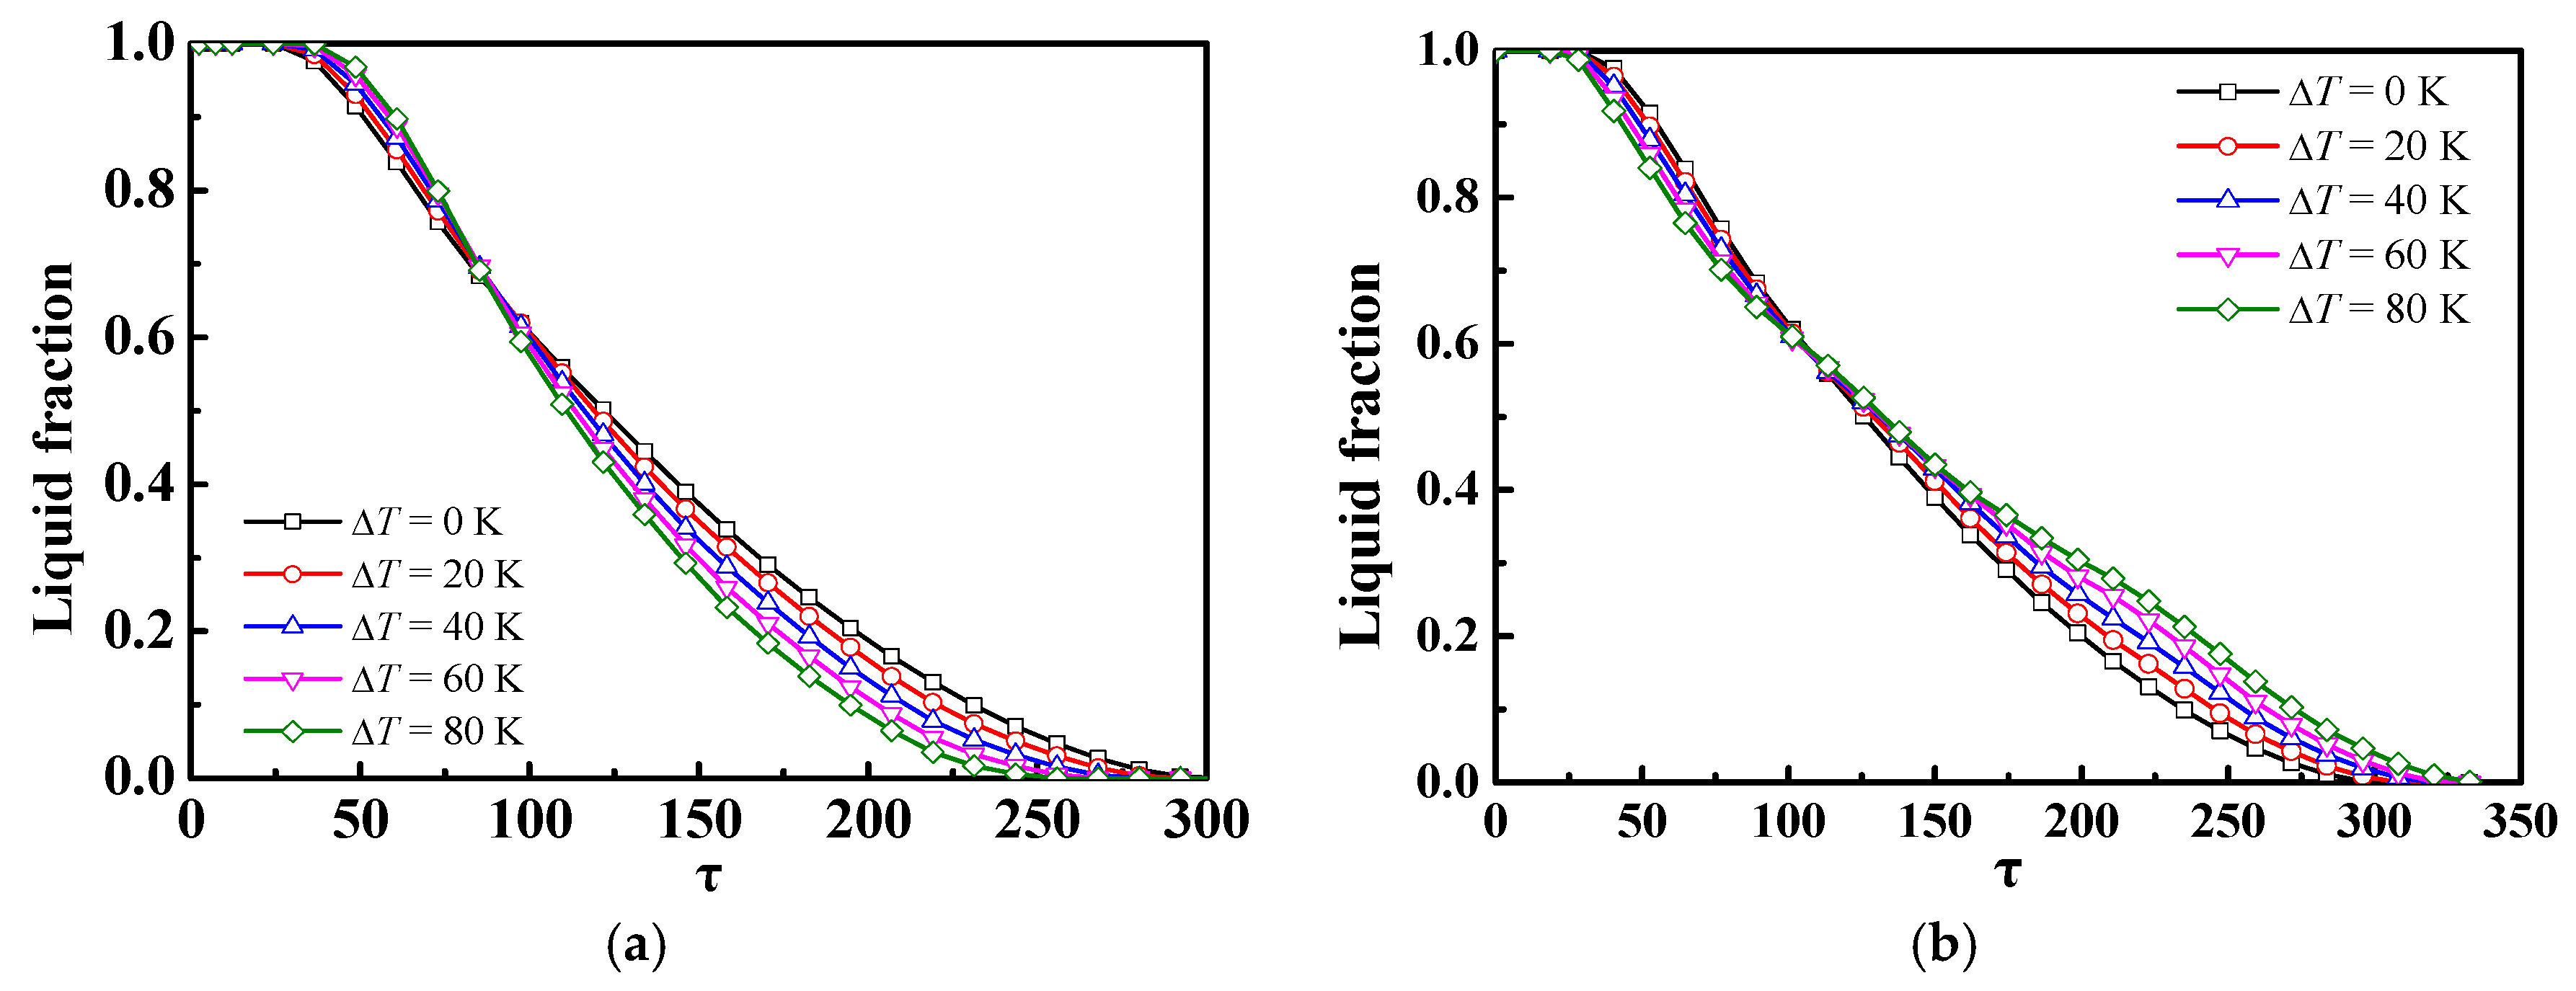
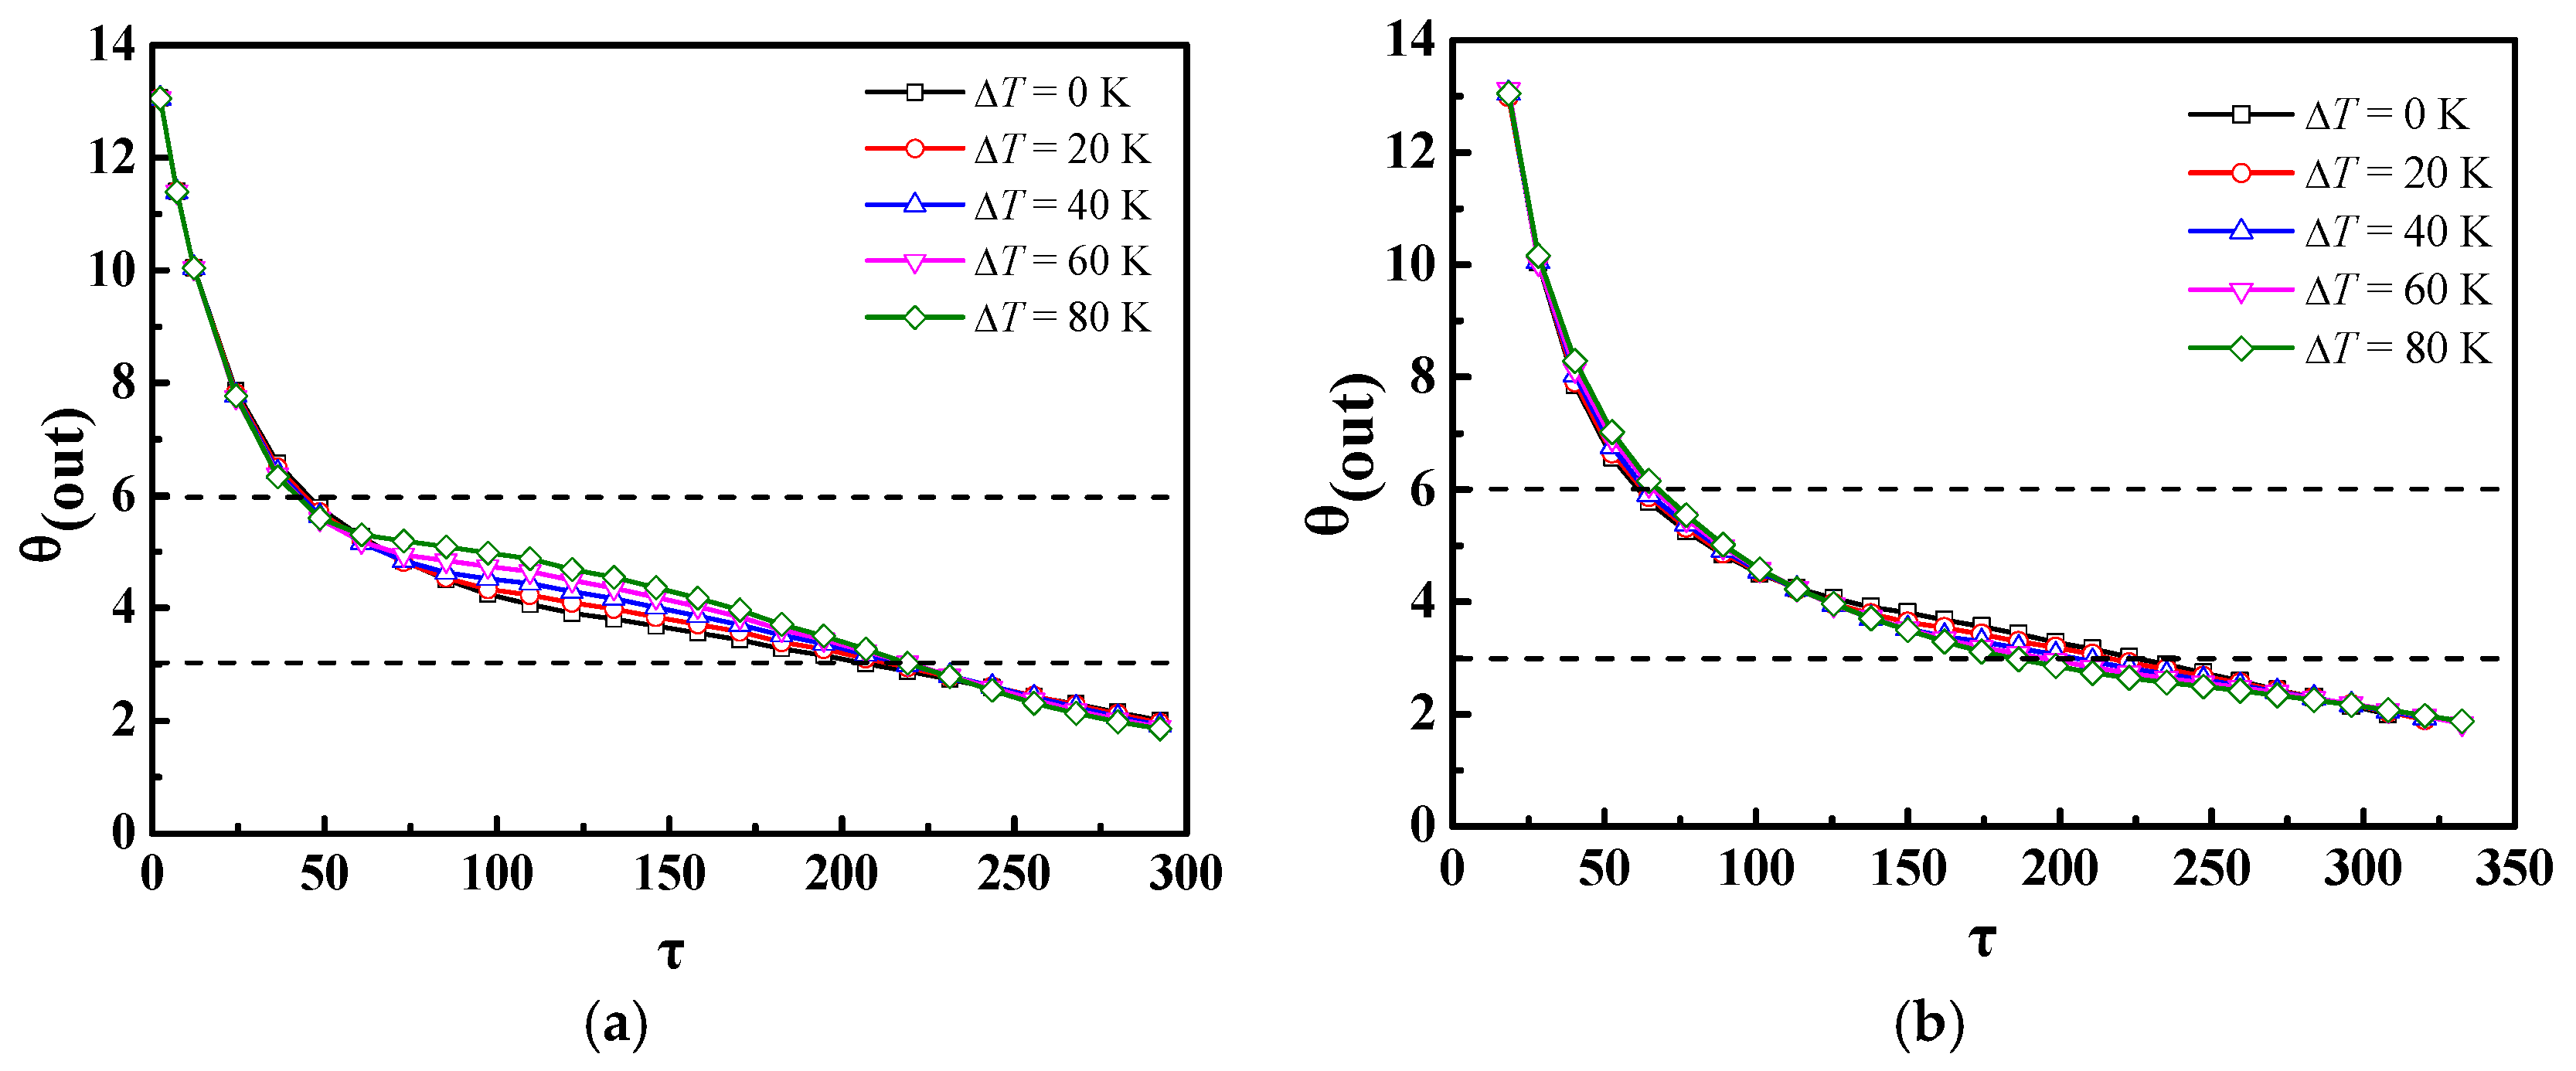
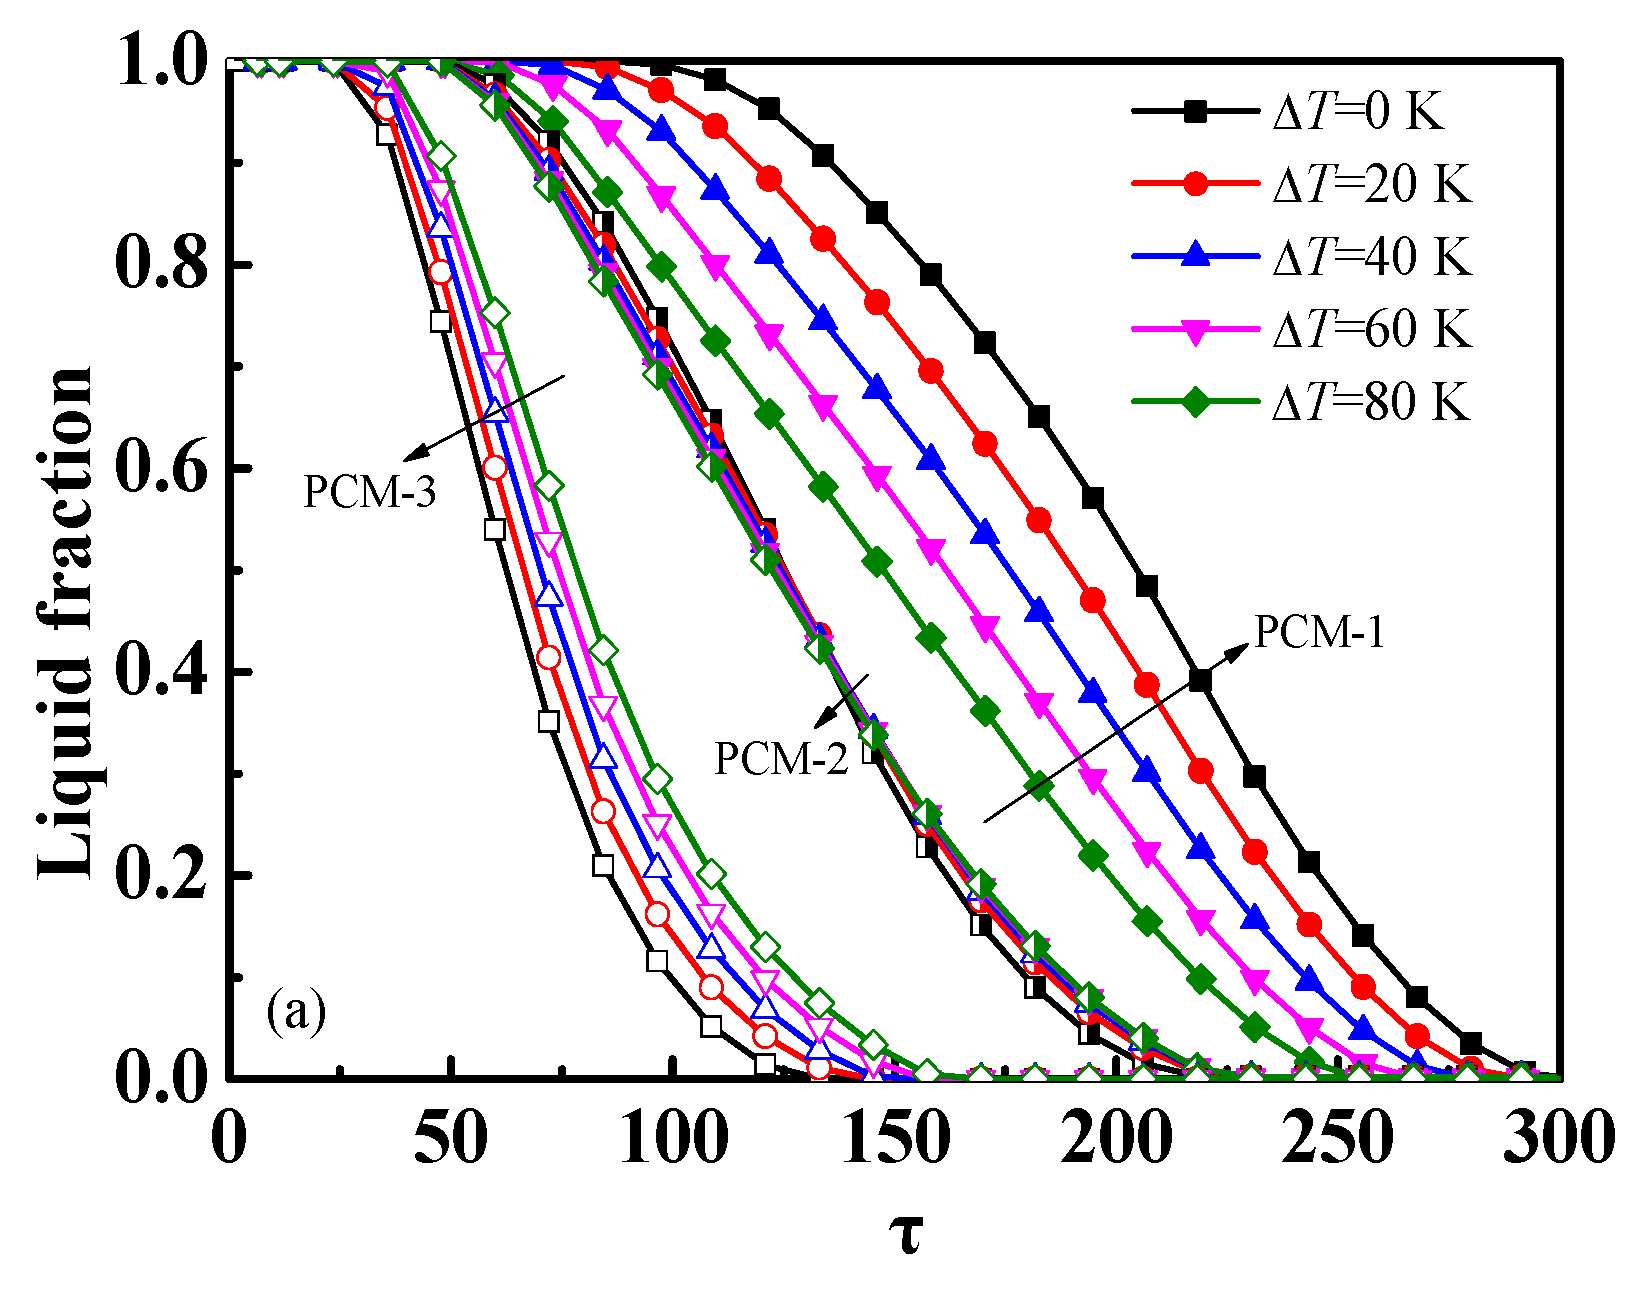
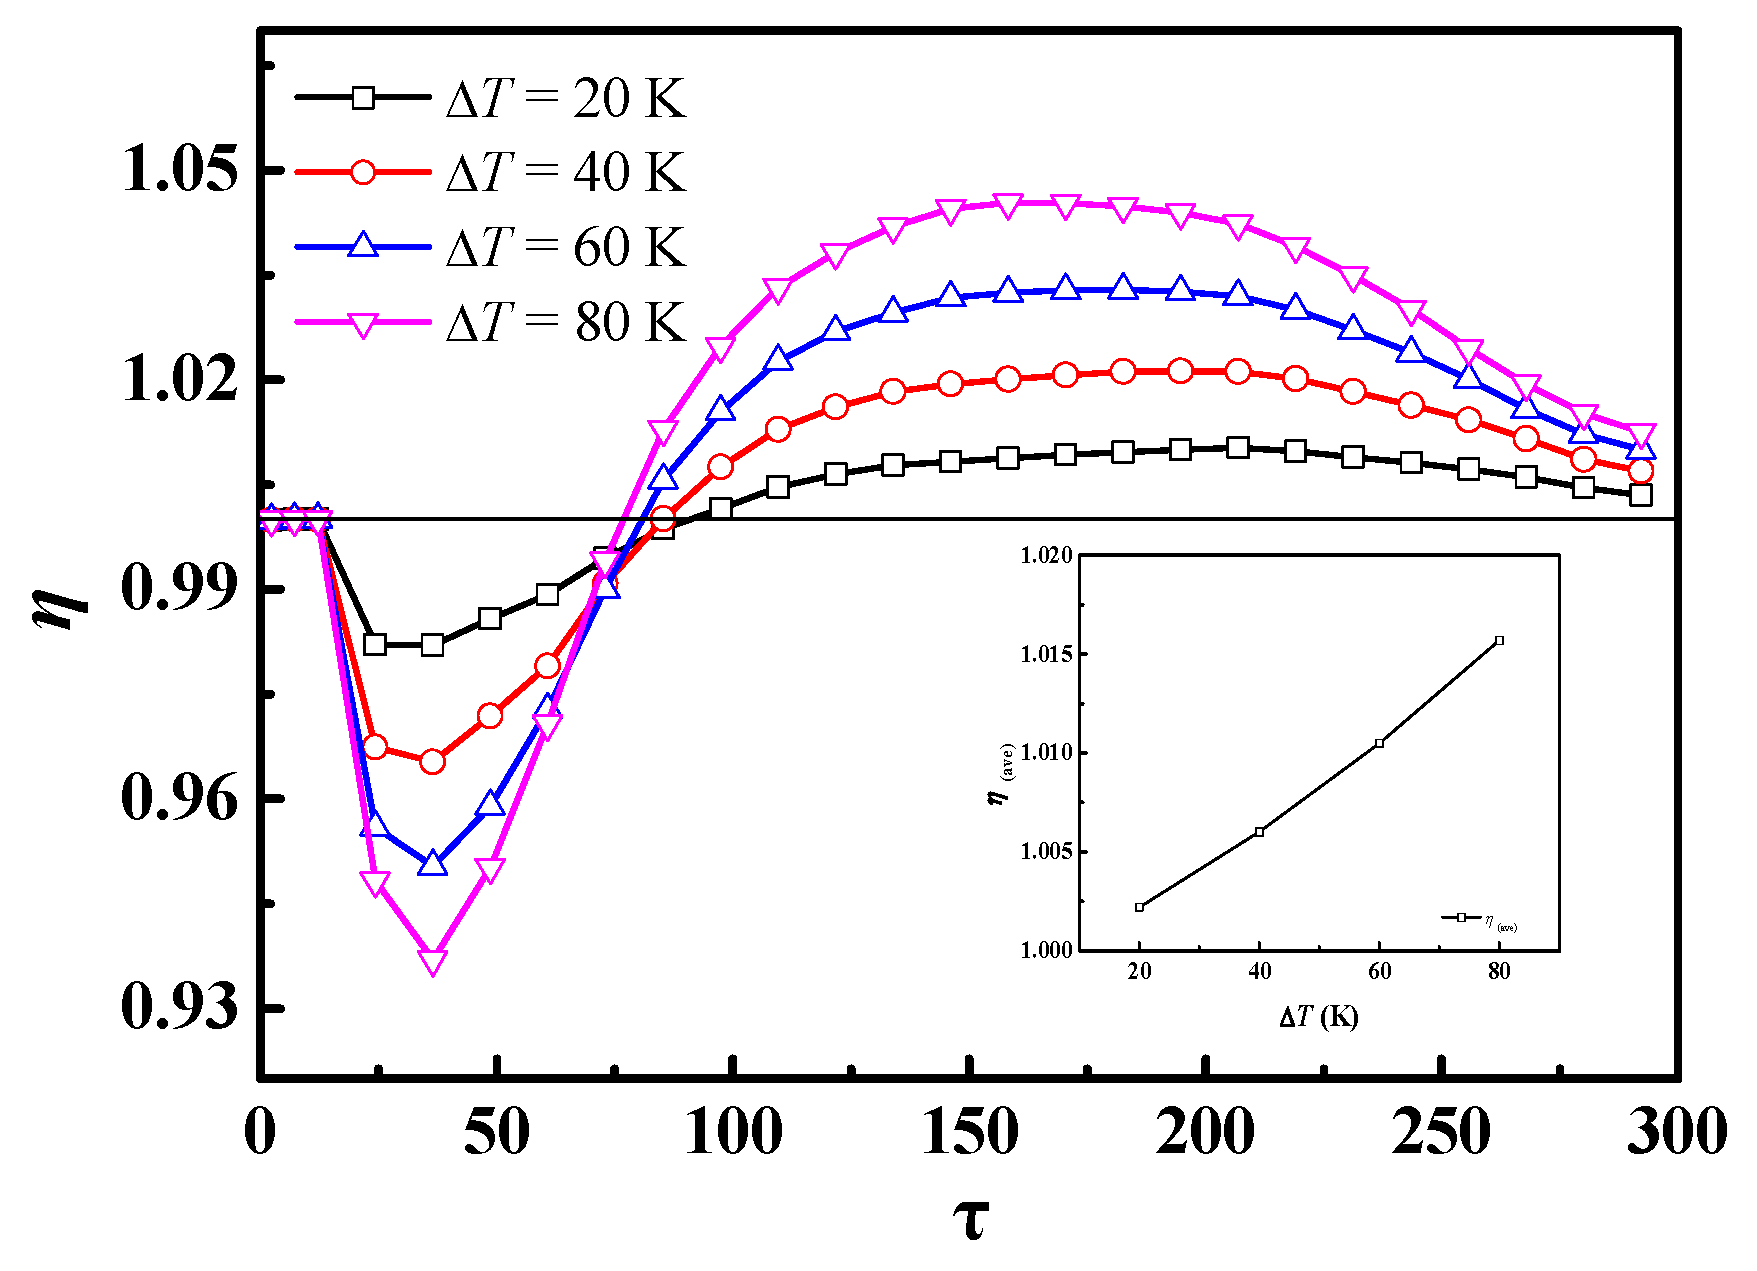
4.1. Multiple Phase-Change-Materials in Different Arrangements

Figure 6 plots the liquid fraction of total PCMs as a function of time and the three PCMs are of equal mass ratio. The temperature and time expressed in dimensionless forms defined as follows:
Dimensionless time:
τ = c p ( T in T o ) L α t H 2 = S t e × F o
where Ste and Fo are the Stefan and Fourier numbers, respectively; α is the PCM thermal diffusivity given by α = k/(ρcp), with k representing the PCM thermal conductivity; Tin and To are the inlet temperature of HTF and initial temperature of PCMs respectively; and t is elapsed time. Regarding m-PCMs units, Ste is changed with Ste(ave) which is calculated as:
S t e ( ave ) = j ( S t e j × ω j ) = j [ c p j ( T in T o ) L j × ω j ]
where ω1, ω2, and ω3 are the energy fractions of PCM-1, PCM-2 and PCM-3, respectively. They are defined as follows:
ω j = m j ( T in T o ) + L j i m i [ c p j ( T in T o ) + L i ]
Because all of the physical properties except the phase change temperatures are the same, the energy fractions are equal to the mass fraction in this study. However, except for the phase change temperature, if other physicals of PCMs are the same, the Ste(ave) number can be calculated in an easier way [31].
Figure 6 is the liquid fractions of all of the PCMs with equal mass ratios as a function of dimensionless time for five different combinations of melting temperatures in reversed and forward arrangement respectively. One can see that it takes less time for bigger ΔT value to complete the solidification process in the reversed arrangement (Figure 6a), but more time for the forward arrangement (Figure 6b). The main reason for this is the arrangement order of the m-PCMs. Thus, the reversed arrangement of m-PCMs can shorten solidification time.
Figure 7 plots the dimensionless outlet temperature (θ(out)) of the heat exchanger with an equal mass ratio as a function of dimensionless time (τ) in the reversed and forward arrangements of m-PCMs, respectively. The dimensionless outlet temperature is defined as:
θ = T o T T o T in
where Tin is the inlet temperature of the HTF.
As shown in Figure 7a, the dimensionless outlet temperatures are close to each other and decrease quickly in the initial period (τ < 50), then separate at a constant value in the middle period (50 < τ < 200), and finally coincide with each other in the discharging process. The constant value of θ(out) increases with ΔT because the PCM-1 is in the downward arrangement and the TPCM-1 increases with ΔT value. As shown in Figure 7b, when the m-PCMs are in the reversed arrangement, the values of θ(out) are close to each other, except in the middle period (125 < τ < 225). However, this separation in the forward arrangement is much smaller than that in the reversed arrangement. In addition, the value of θ(out) in the middle period decreases with the ΔT because the PCM-3 is in the downward arrangement and the TPCM-3 increases with ΔT. From Figure 7, one can find that the value of θ(out) in the reversed arrangement is higher than that in the forward arrangement. Comparing the value of θ(out) between the two imaginary lines from Figure 7, the θ(out) value in Figure 7a is bigger than in Figure 7b.
Thus, as we can see, it is more advantageous for the zigzag plate energy storage unit to arrange the m-PCMs in a reversed fashion than in a forward fashion, so the reversed arrangement is chosen in the following studies.
Figure 8 shows the liquid fractions of PCM as a function of dimensionless time at different value of ΔT under the condition of vin = 6 m/s and Tin = 303.15 K with m-PCMs at a mass ratio of 1:1:1 in the reversed arrangement. As shown in Figure 8, although TPCM-3 is the lowest, it takes the shortest time to complete the freezing process among the three PCMs and the solidification rate of PCM-3 increases while the value of ΔT decreases. This can be explained as following: PCM-3 is located in the inlet region, which results in the largest solidification rate of the three PCMs, and the phase change temperature of PCM-3 decreases as the value of ΔT increases.
As can be seen from Figure 8, there is little difference in the liquid fraction curves of PCM-2 for different values of ΔT. Explanations for this observation could be as follows: the first is that the heat transfer in m-PCMs is controlled by the thermal conductivity in the solidification process; the second one is that there is no relationship between the phase change temperature of PCM-2 and the value of ΔT.
One can see from Figure 8 that although the phase change temperature of PCM-1 is the highest, it takes the longest time to complete the solidification process in all cases, which forms the rate-limiting factor of the whole solidification process in the reversed arrangement. The main reason for this result is because of the arrangement of the three PCMs and the location of PCM-1. When the m-PCMs is in the reversed arrangement, the HTF carries “cool” energy in and absorbs heat from PCM-3 first, then PCM-2 and finally PCM-1 during discharging process. The temperature of the HTF increases during this process. As a result, before the PCM-2 and PCM-3 are fully discharged, the temperature of the HTF at the inlet is always higher than that of PCM-2 and PCM-3. As seen from the liquid fraction curve of PCM-1, the solidification rate increases as the value of ΔT increases. An explanation to this observation could be as follows. In the initial stage of discharge process, heat stored in the PCMs releases in the form of sensible heat to the HTF. Due to the buffering effect of PCM-2, the temperature of HTF entering PCM-1 region does not change much with time. As a result, a bigger value of ΔT (meaning a higher TPCM-1) yields a quicker phase change process for PCM-1. The temperature of HTF decreases as the solidification progressing, making PCM-1 start to freeze at high ΔT values.
To quantitatively compare charging performance enhancements through the m-PCMs in reversed arrangement, the following ratio is introduced:
η = Q Δ T 0   K Q Δ T = 0   K
where Q refers to the total amount of thermal energy stored and η is the ratio of the total heat stored in the m-PCMs (ΔT ≠ 0 K) to that in a single PCM (ΔT = 0 K). η can therefore be regarded as the m-PCMs’ effectiveness. Figure 9 shows the change of η as a function of dimensionless time for different ΔT. For a given ΔT, η decreases first with time, reaches a minimum τ = τmin, then increases with time, peaks at τ = τmax, and finally decreases to 1. Both the τmin and τmax are functions of ΔT. The τmin lies in the range of 25–35, whereas the τmax is between 160 and 200. Dimensionless time durations with ΔT larger than 1 are far longer than that with ΔT smaller than 1. The m-PCMs’ effectiveness at τmin and τmax are also a function of ΔT; a large ΔT gives a lower η at the τmin but a higher η at the τmax. For a given ΔT, η is higher than 1 for most of the discharging process, leading to an overall process intensification through the use of m-PCMs. As shown in the inset figure of Figure 9, the average η (η(ave)) over all τ increases with the value of ΔT, which means a higher ΔT gives a larger extent of overall process enhancement in the case of the reversed arrangement.

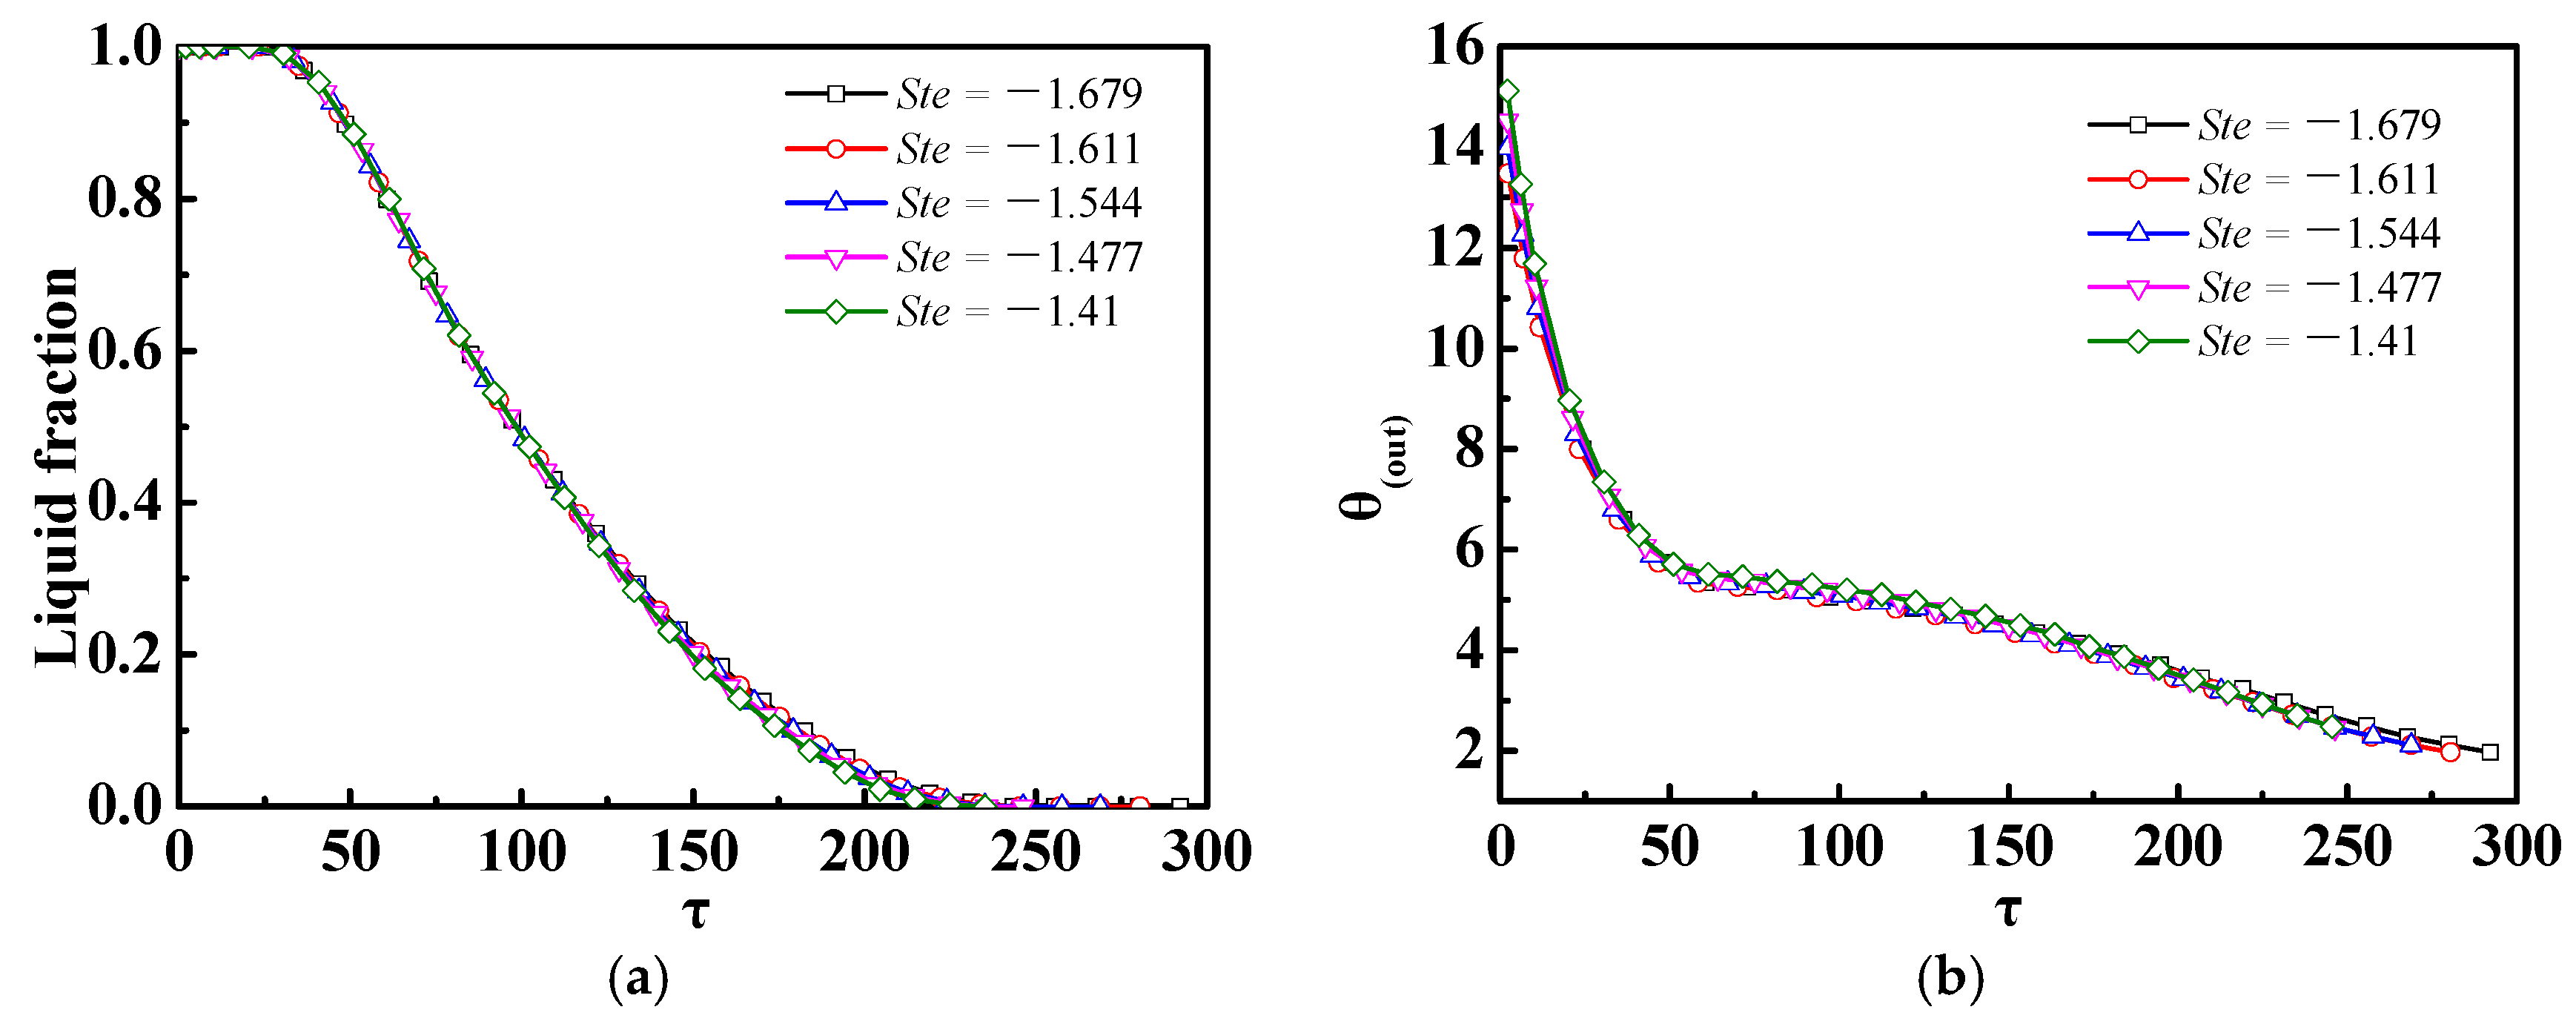
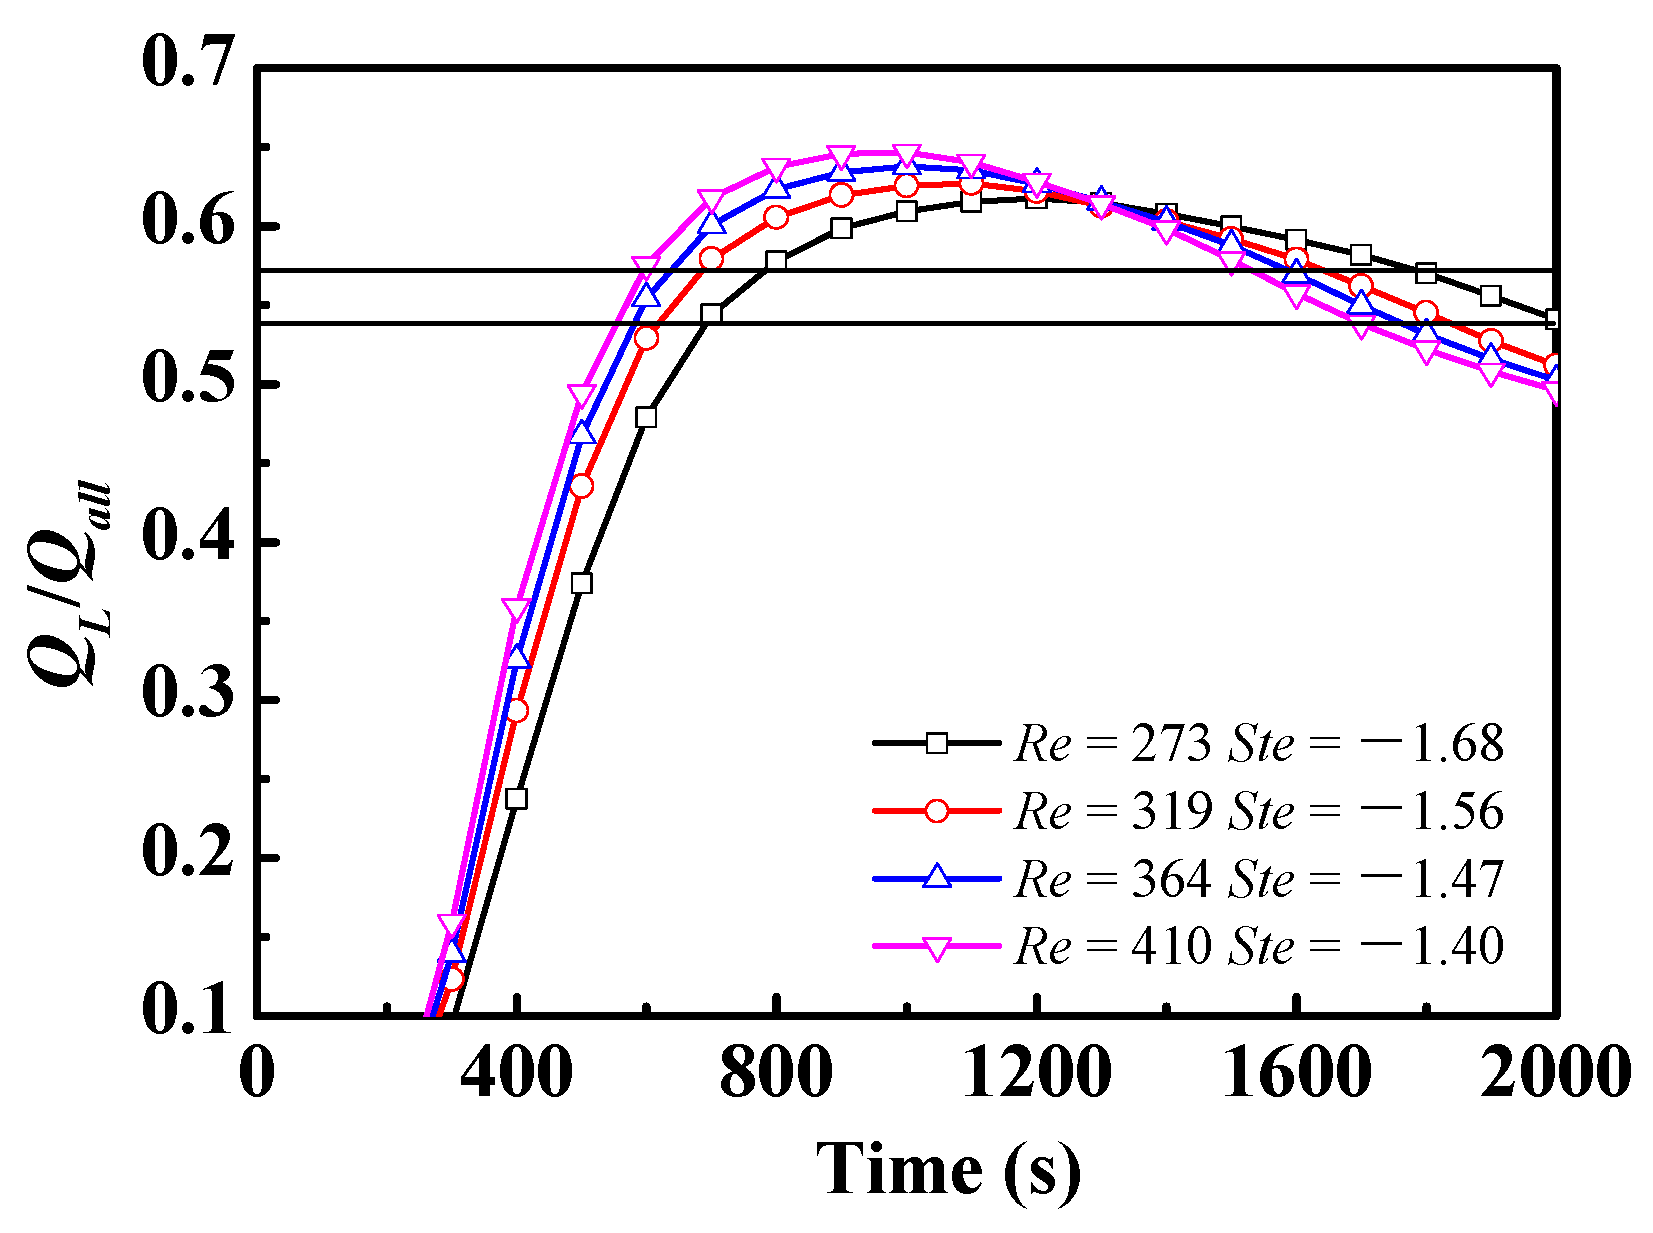
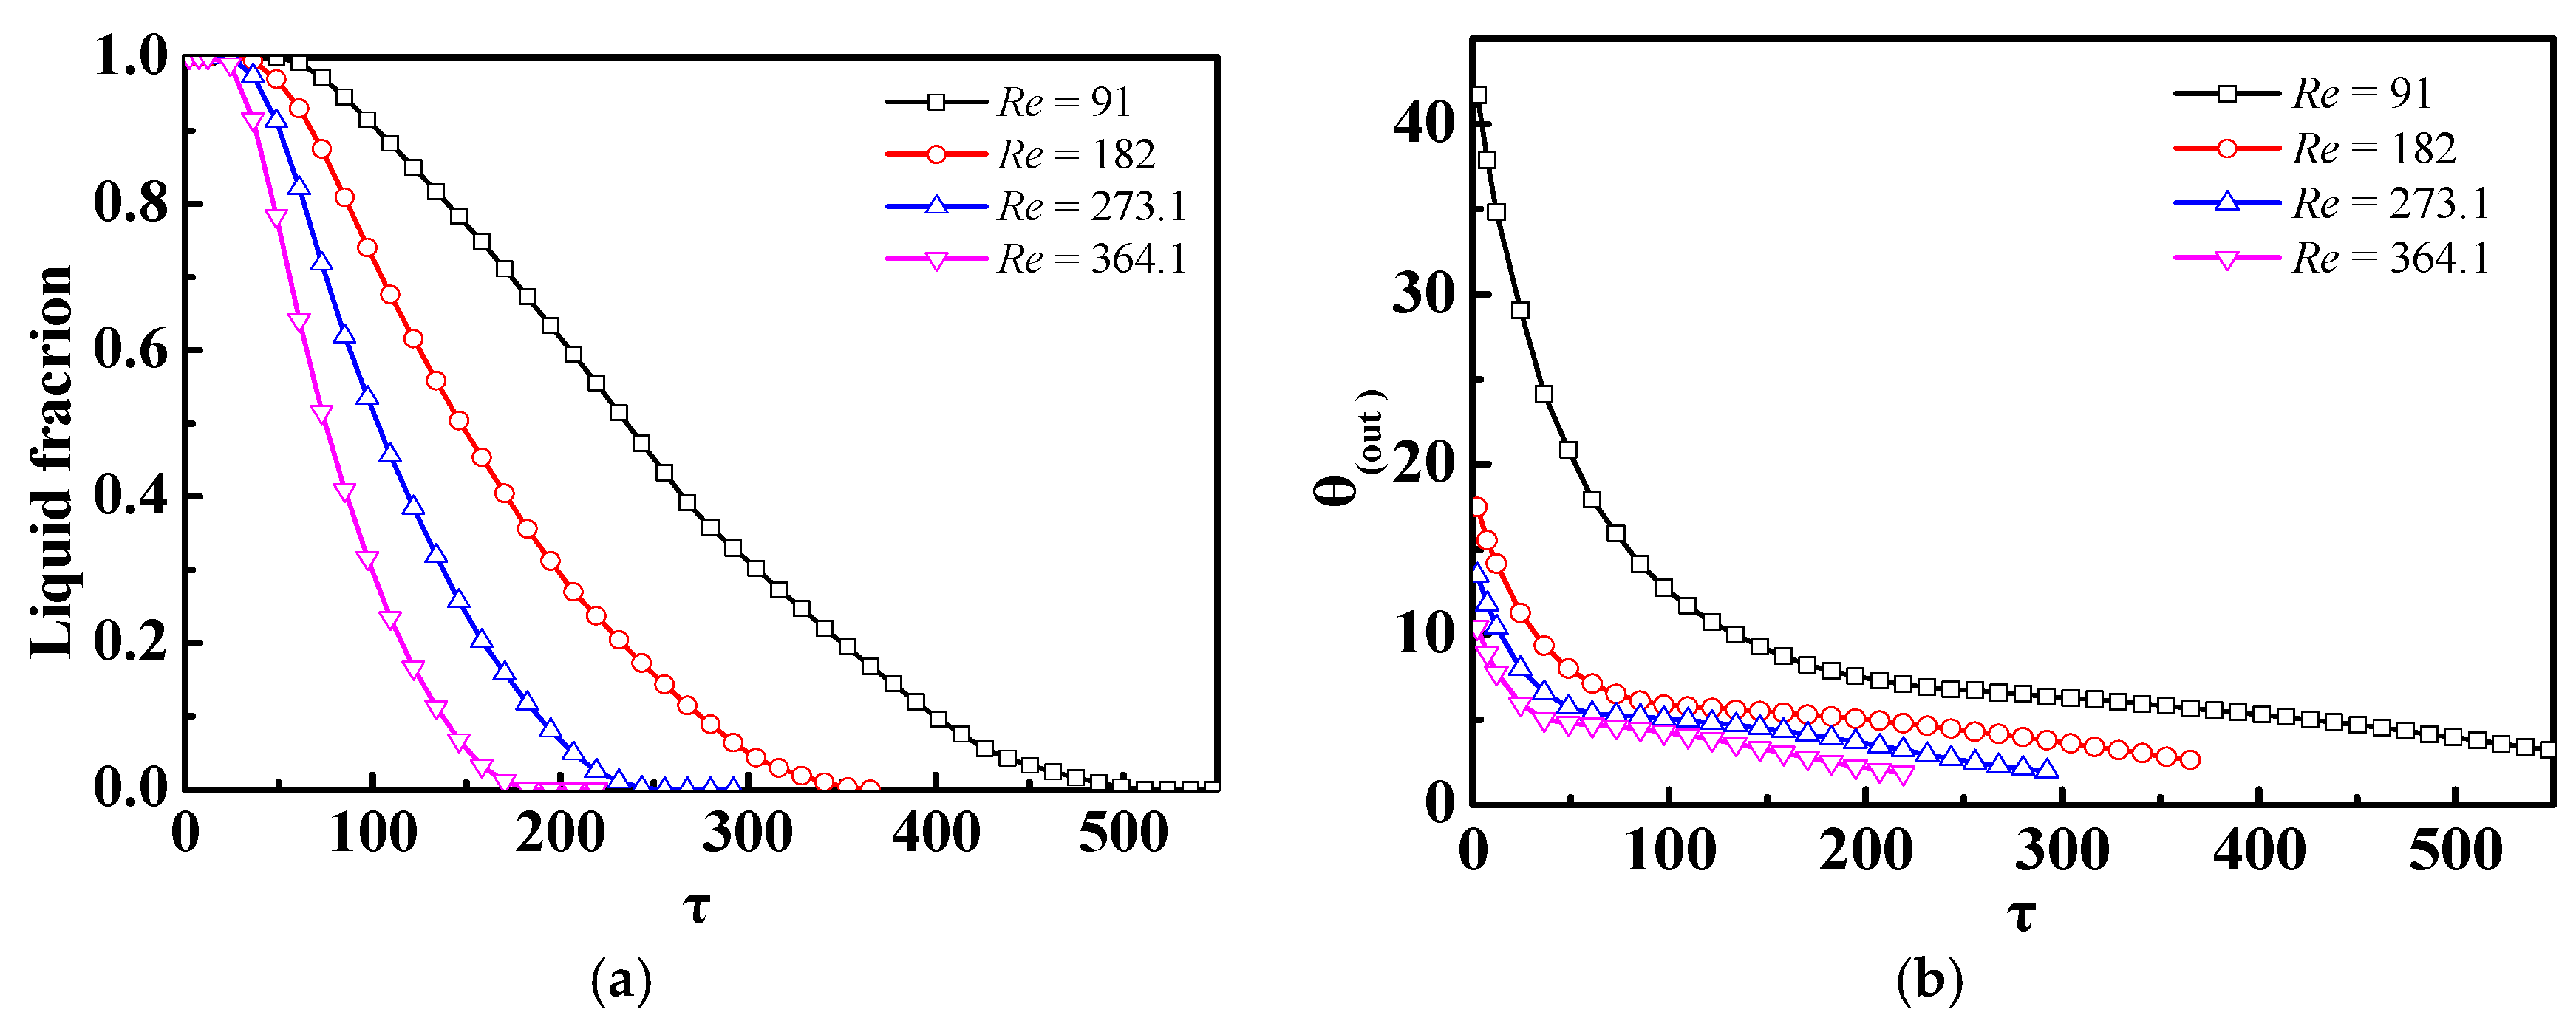
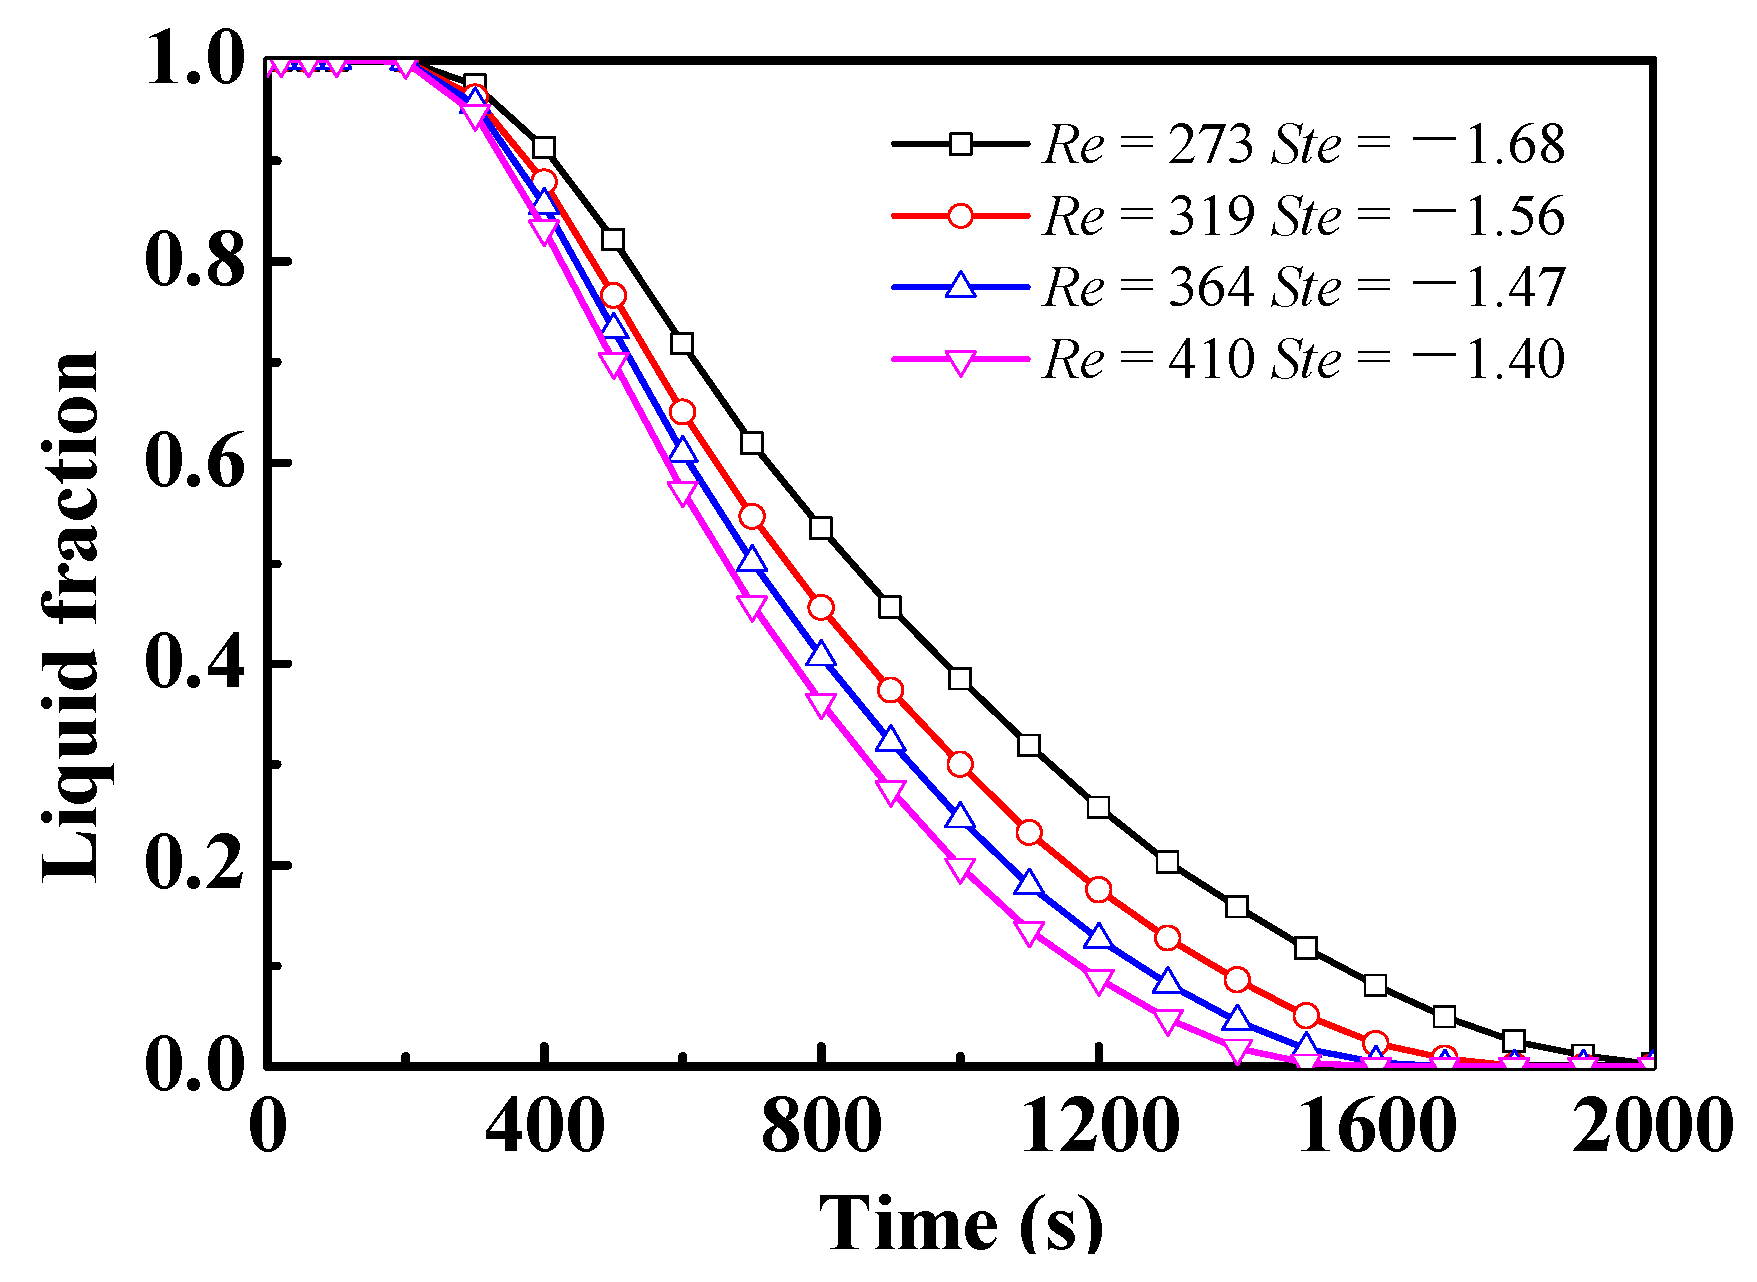
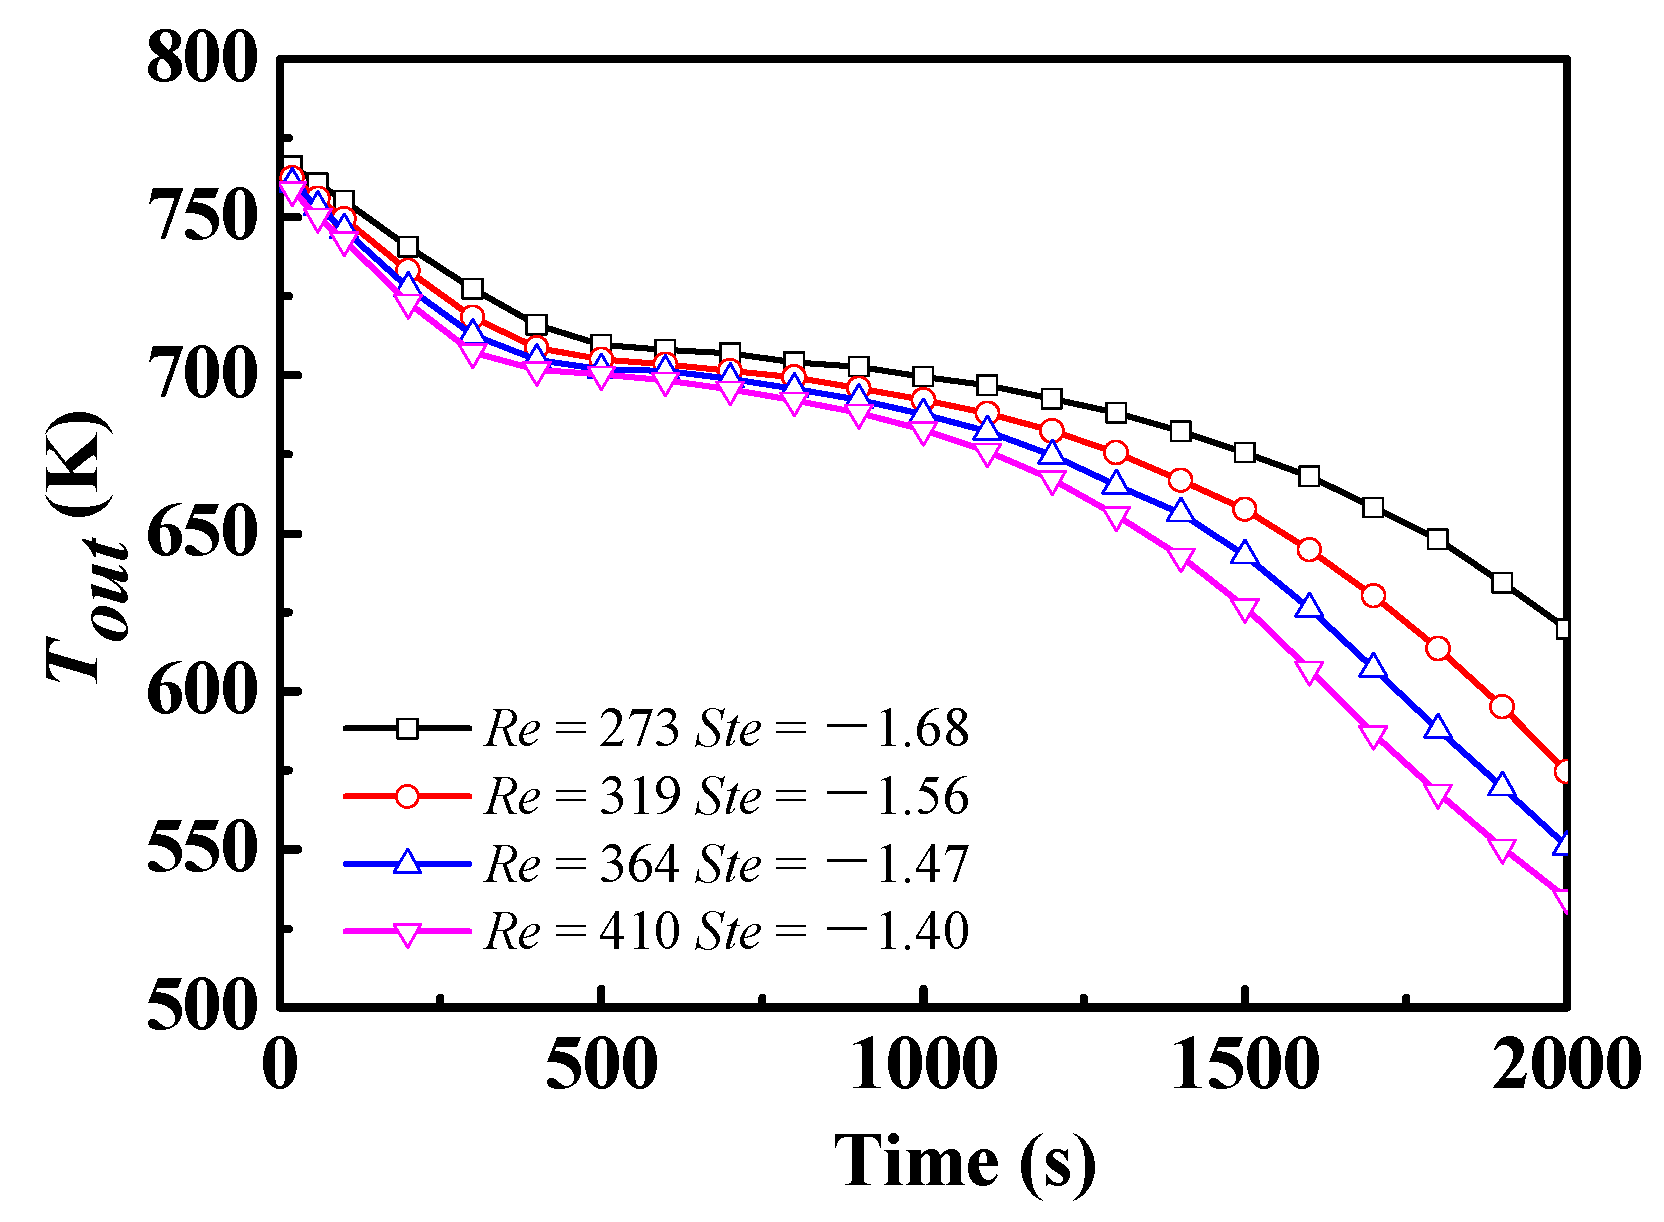
4.2. Effect of Different Ste or Re Numbers

In this part, the set of ΔT = 80 K was chosen to study the effect of various Ste or Re numbers on the discharging process when one of them is fixed while the other varies and the initial temperature of PCMs (To) is 803.15 K. As shown in Figure 10, when the Ste number varies between −1.376 and −1.679 on the condition of vin = 6 m/s, the value of the Ste number almost has no impact on the solidification rate (Figure 10a) or θ(out) (Figure 10b). This is because the heat transfer between HTF and m-PCMs is controlled by conductivity, not by convection, and the temperature difference between HTF and m-PCMs is large. However, when the Re number varies from 91 to 364.1 with Tin = 303.15 K, the value of the Re number has a significant impact on the solidification rate and θ(out) and the Re can be calculated as Equation (18):
R e = ρ v D H μ
where DH is the hydraulic diameter of the zigzag channels [30].
As shown in Figure 11a, the solidification rate increases with the Re number; however, the effect of Re on solidification weakens with an increasing Re number. As shown in Figure 11b, θ(out) decreases with the Re number, and the effect of Re on θ(out) weakens with an increasing Re number. An explanation for this observation could be as follows. With increasing Re value, the more “cool” energy is that transferred to the heat exchanger, the more heat that could be extracted from the m-PCMs, resulting in a higher solidification rate. The larger value of Re, the more “cool” energy that is transferred downstream, resulting in θ(out) decreasing with Re.
As shown in Figure 10b and Figure 11b, the dimensionless time dependence of θ(out) shows a three-stage process. With θ(out) decreasing with τ rapidly at first, then no effect of τ on θ(out), and finally θ(out) decreasing with τ again. This dependence is because the temperature difference between m-PCMs and HTF is large and the m-PCMs releases heat energy in sensible and latent way at first, but mostly in a sensible form. As the discharging process continues, the m-PCMs starts to freeze and release heat energy mostly in the latent form, which leads to the second stage of θ(out). Finally, as the m-PCMs release most of their latent heat, the heat energy released to the HTF is controlled by a sensible form; thus, the θ(out) decreases. However, the temperature difference between the HTF and m-PCMs is smaller than the first two stages, which results in a much slower decrease of θ(out) than during the first stage.

4.3. Effect of Different Ste/Re under a Given Inlet Power

The effects of inlet temperature and velocity are considered for a given input power and expressed as:
P in = c p · ρ v ˜ in A a · ( T ˜ in T b ) = c p · ρ v in A a · ( T in T b )
where Aa is cross-sectional area, vin is the inlet velocity of the HTF and Tb is the base temperature defined as T b = 1 / 2 ( T ˜ in + T o ) . The base case of this set of modelling work is under the conditions of v ˜ in = 6   m s , T ˜ in = 303.15   K , To = 803.15 K, and the set of ΔT = 80 K is chosen. Different conditions are realized by changing the inlet temperature and the inlet velocity of the HTF under the given inlet power.
Figure 12 shows the time evolution of the liquid fractions at different Re/Ste numbers under the given inlet power condition. As shown in Figure 12, the solidification rate of all of the m-PCMs increases as the Re number increases under the given inlet power condition. Such an increase in the solidification rate does not seem to be associated with the overall heat transfer driving force (the temperature difference). It is plausible that an increase in the Re number results in an enhancement of the overall heat transfer between the HTF and the m-PCMs and hence an overall increase in the solidification rate. This increase in the solidification rate can be explained as follows. For a given input power, a decrease in the inlet velocity of the HTF (Re number) indicates a decrease in the inlet temperature of the HTF. This implies that at the inlet region the temperature difference between the HTF and m-PCMs remains high even after the complete freezing of the m-PCMs, leading to more “cool” energy stored in the inlet region as sensible heat and less “cool” energy flow to the downstream region to freeze the m-PCMs there, resulting in the observed low solidification rate.
Figure 13 shows the time evolution of the outlet temperature at different Re/Ste numbers under the given inlet power condition. One can see that the outlet temperature decreases quickly first, then reaches a certain value, and finally decreases relatively fast again. This is because the temperature of the m-PCMs is higher than the phase change temperature at the initial period and the heat released to the HTF is in a sensible form. As the discharge progresses, the m-PCMs begin to freeze and release heat mainly in latent form; over time, the heat released to the HTF is mainly in a sensible form in the final stage because most of the latent heat has been released to the HTF already.
It is interesting to examine the time evolution of the ratio of the latent heat (QL) to the total stored heat (Qall) under a given input power. The ratio of the latent heat to the total stored heat is calculated as in Equation (20):
Q L Q all = 0 t ( β t · L · m ) d t c p · m · ( T o T t ) + 0 t ( β t · L · m ) d t
Figure 14 shows that Q L Q all rises abruptly after an initial stage and reaches a peak which increases with the Re number; then they decrease slowly and intersect with each other in the latter half of the discharging process. The difference among the values of Q L Q all is small (0.54–0.57) at the moment that the m-PCMs are fully frozen. As expressed in Equation (20), the value of lim t + Q L Q all equals 0.271, 0.391, 0.405 and 0.415 when the Re number equals 273, 319, 364 and 410, respectively, which leads to an intersection in the latter half of the discharging process.
Figure 15 shows the liquid fraction of m-PCMs as a function of time at different periods of inlet velocity under the given inlet power condition. For a given inlet power, the inlet velocity (vin) and inlet temperature (Tin) are calculated as in Equations (21) and (22), respectively.
v in = B  sin ( 2 π T t ) + C
T in = T b P in c p · ρ · A a · v in
where T is the period of the inlet temperature. B and C are the amplitude and a constant value, which equal 1.5 and 7.5, respectively. Aa is the cross-sectional area of inlet. To find the impact of a period on the solidification of m-PCMs, two small periods (T = 30 s/60 s) and two large periods (T = 5 min/10 min) are chosen in this work. As one can see from Figure 15, the liquid fraction curves of PCM-1, PCM-2 and PCM-3 almost coincide with each other, which means that the value of the period (30 s < T < 10 min) has little or no effect on the solidification of m-PCMs in the zigzag plate unit.
Figure 16 shows the time evolution of the outlet temperatures at different T under the given inlet power condition. The amplitude of the inlet temperature is 80 K, but the amplitude of the outlet temperature is much smaller (<10 K) at different values of the period, which indicates that the zigzag plate with m-PCMs has a good impact on the temperature shock as “filter action” in the communication field.

5. Conclusions

An experimental system was built to validate the two-dimensional mathematical model that was established to describe the discharging behaviour of the device. A heat exchange device with a zigzag configuration containing m-PCMs was investigated in this work. A new inlet power boundary condition was defined. The following conclusions were obtained in this work:
(1)
It is more advantageous for the plate energy storage unit to arrange the m-PCMs in a reversed direction than in a forward direction.
(2)
If only the Ste (inlet temperature) or Re (inlet velocity) numbers were changed, there was almost no impact of the Ste number on the discharge process of the m-PCMs unit, but there was a significant impact of the Re number; for a given inlet power inlet condition, it was more advantageous to increase the Re number than the Ste number to shorten the phase change time in the discharge process.
(3)
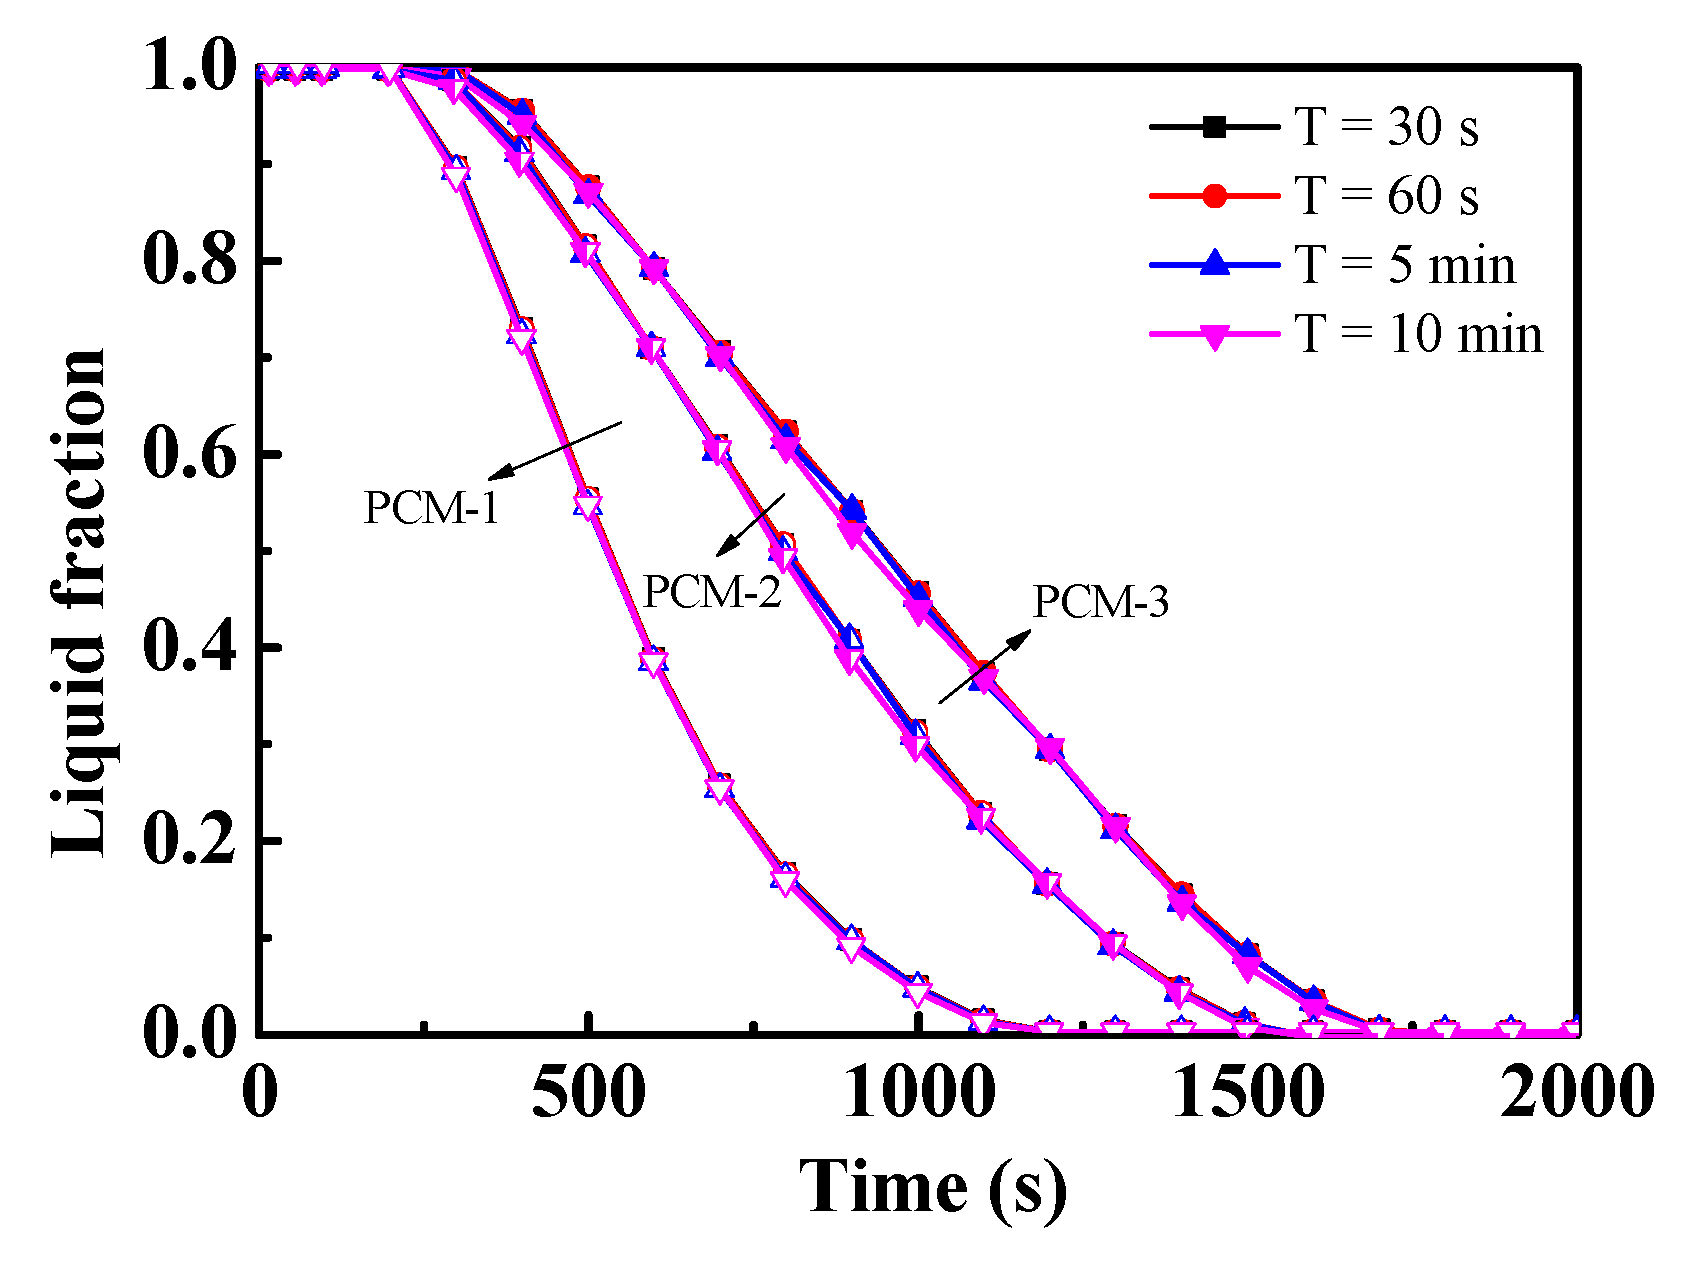
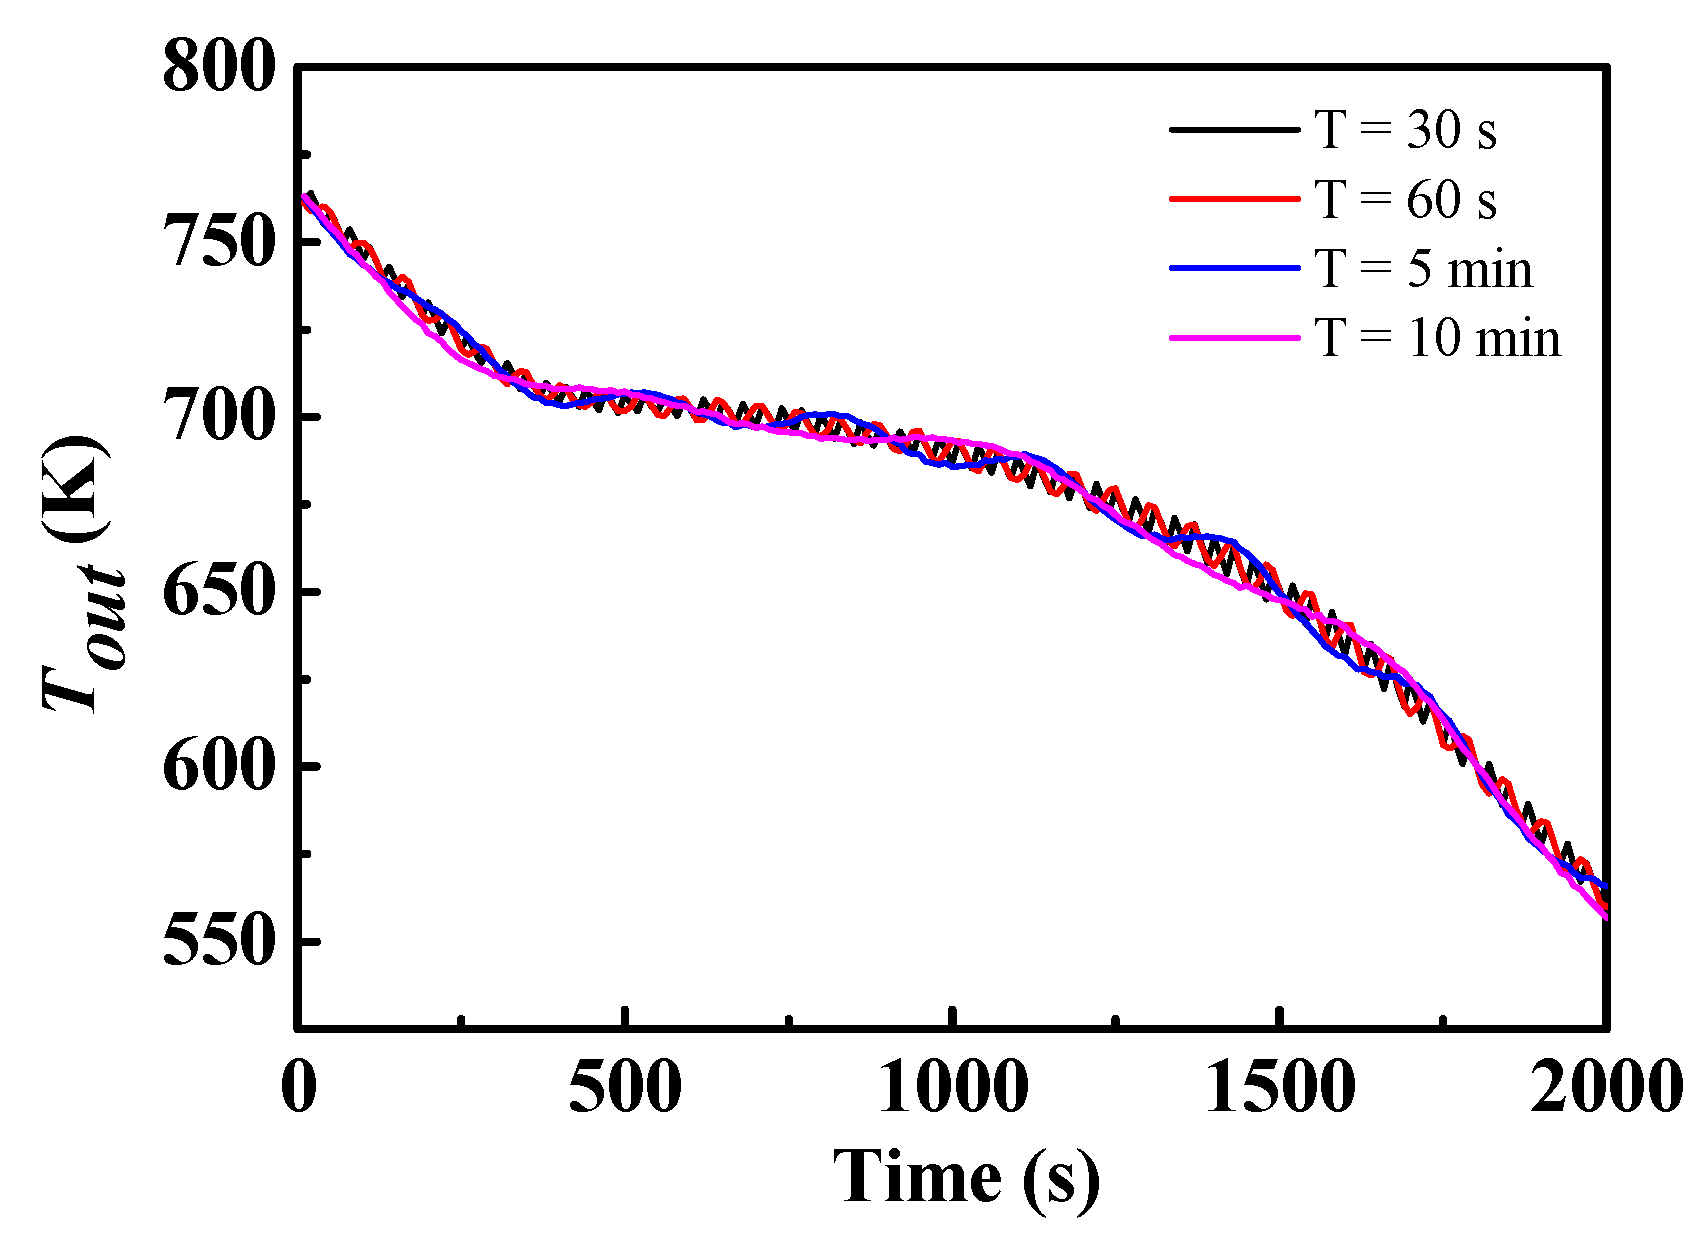
For a given inlet power condition with a periodically varying velocity, the value of the period (30 s–10 min) had almost no impact on the discharge process, which indicates that the zigzag plate with m-PCMs had a positive impact on the temperature shock.

Acknowledgments

The authors gratefully acknowledge financial supports from the China 973 Research Program (2015CB251303 and 2015CB251301), the Key Technologies R&D Program of Jiangsu (BE2015199), and National Natural Science Foundation of China (21406231).

Author Contributions

All the authors contributed to the manuscript. Peilun Wang performed the main research and wrote the manuscript. Yun Huang provide guidance and revised the paper, Yulong Ding, Zhijiang Peng, and Yi Wang provided supervision. Dacheng Li and Xingang Zheng contributed in the experimental and numerical parts of the paper, respectively.

Conflicts of Interest

The authors declare no conflict of interest.

Nomenclature

AMushy zone constant
AaCross-sectional area
cpSpecific heat, J/(kg·K)
hSensitive heat, J
HEnthalpy, J
LLatent heat of the material, J/kg
mMass, kg
PPressure/inlet power, Pa/W
QLLatent heat, J
QallTotal stored heat, J
ReReynolds number
SbBuoyancy source term
ShEnergy source term
SiMomentum sink in i direction
StTurbulence source term
SteStefan number
tTime, s
TTemperature, K
TPeriod
ToInitial temperature, K
TPCM-1/2/3Phase change temperature of PCM-1/2/3, K
v Velocity vector, m/s
wWidth of the inlet, m

Greek Symbols

αThermal conductivity, W/(m·K)
βLiquid fraction or porosity
ρDensity, kg/m3
μViscosity, kg/(m·s)
εAmall number
τDimensionless time
ΔTTemperature difference between TPCM-1 and TPCM-3, K
ωMass fraction
ΦTurbulence parameter

Subscript

aveAverage value
bBase value or buoyancy
inInlet value
l/sLiquid/solid phase
refReference value
tTurbulence or value in t moment

References

  1. Pomianowski, M.; Heiselberg, P.; Zhang, Y. Review of thermal energy storage technologies based on PCM application in buildings. Energy Build. 2013, 67, 56–69. [Google Scholar] [CrossRef]
  2. El Qarnia, H.; Draoui, A.; Lakhal, E.K. Computation of melting with natural convection inside a rectangular enclosure heated by discrete protruding heat sources. Appl. Math. Model. 2013, 37, 3968–3981. [Google Scholar] [CrossRef]
  3. Kandasamy, R.; Wang, X.Q.; Mujumdar, A.S. Transient cooling of electronics using phase change material (PCM)-based heat sinks. Appl. Therm. Eng. 2008, 28, 1047–1057. [Google Scholar] [CrossRef]
  4. Nomura, T.; Oya, T.; Okinaka, N.; Akiyama, T. Feasibility of an advanced waste heat transportation system using high-temperature phase change material (PCM). ISIJ Int. 2010, 50, 1326–1332. [Google Scholar] [CrossRef]
  5. Shon, J.; Kim, H.; Lee, K. Improved heat storage rate for an automobile coolant waste heat recovery system using phase-change material in a fin-tube heat exchanger. Appl. Energy 2014, 113, 680–689. [Google Scholar] [CrossRef]
  6. Antony Aroul Raj, V.; Velraj, R. Heat transfer and pressure drop studies on a PCM-heat exchanger module for free cooling applications. Int. J. Therm. Sci. 2011, 50, 1573–1582. [Google Scholar] [CrossRef]
  7. Izquierdo-Barrientos, M.A.; Belmonte, J.F.; Rodríguez-Sánchez, D.; Molina, A.E.; Almendros-Ibáñez, J.A. A numerical study of external building walls containing phase change materials (PCM). Appl. Therm. Eng. 2012, 47, 73–85. [Google Scholar] [CrossRef]
  8. Parameshwaran, R.; Kalaiselvam, S. Energy conservative air conditioning system using silver nano-based PCM thermal storage for modern buildings. Energy Build. 2014, 69, 202–212. [Google Scholar] [CrossRef]
  9. Yang, L.; Zhang, X.; Xu, G. Thermal performance of a solar storage packed bed using spherical capsules filled with PCM having different melting points. Energy Build. 2014, 68, 639–646. [Google Scholar] [CrossRef]
  10. Agyenim, F.; Hewitt, N. The development of a finned phase change material (PCM) storage system to take advantage of off-peak electricity tariff for improvement in cost of heat pump operation. Energy Build. 2010, 42, 1552–1560. [Google Scholar] [CrossRef]
  11. Qureshi, W.A.; Nair, N.K.C.; Farid, M.M. Impact of energy storage in buildings on electricity demand side management. Energy Convers. Manag. 2011, 52, 2110–2120. [Google Scholar] [CrossRef]
  12. Li, W.Q.; Qu, Z.G.; He, Y.L.; Tao, W.Q. Experimental and numerical studies on melting phase change heat transfer in open-cell metallic foams filled with paraffin. Appl. Therm. Eng. 2012, 37, 1–9. [Google Scholar] [CrossRef]
  13. Ge, Z.; Ye, F.; Cao, H.; Leng, G.; Qin, Y.; Ding, Y. Carbonate-salt-based composite materials for medium- and high-temperature thermal energy storage. Particuology 2014, 15, 77–81. [Google Scholar] [CrossRef]
  14. Gong, Z.X.; Mujumdar, A.S. Enhancement of energy charge-discharge rates in composite slabs of different phase change materials. Int. J. Heat Mass Transf. 1996, 39, 725–733. [Google Scholar] [CrossRef]
  15. Gong, Z.X.; Mujumdar, A.S. Cyclic heat transfer in a novel storage unit of multiple phase change materials. Appl. Therm. Eng. 1996, 16, 807–815. [Google Scholar] [CrossRef]
  16. Ismail, K.A.R.; Lino, F.A.M. Fins and turbulence promoters for heat transfer enhancement in latent heat storage systems. Exp. Therm. Fluid Sci. 2011, 35, 1010–1018. [Google Scholar] [CrossRef]
  17. Wang, Y.H.; Yang, Y.T. Three-dimensional transient cooling simulations of a portable electronic device using PCM (phase change materials) in multi-fin heat sink. Energy 2011, 36, 5214–5224. [Google Scholar] [CrossRef]
  18. Nithyanandam, K.; Pitchumani, R. Analysis and optimization of a latent thermal energy storage system with embedded heat pipes. Int. J. Heat Mass Transf. 2011, 54, 4596–4610. [Google Scholar] [CrossRef]
  19. Robak, C.W.; Bergman, T.L.; Faghri, A. Enhancement of latent heat energy storage using embedded heat pipes. Int. J. Heat Mass Transf. 2011, 54, 3476–3484. [Google Scholar] [CrossRef]
  20. Tao, Y.B.; He, Y.L.; Qu, Z.G. Numerical study on performance of molten salt phase change thermal energy storage system with enhanced tubes. Sol. Energy 2012, 86, 1155–1163. [Google Scholar] [CrossRef]
  21. Darzi, A.R.; Farhadi, M.; Sedighi, K. Numerical study of melting inside concentric and eccentric horizontal annulus. Appl. Math. Model. 2012, 36, 4080–4086. [Google Scholar] [CrossRef]
  22. Kurnia, J.C.; Sasmito, A.P.; Jangam, S.V.; Mujumdar, A.S. Improved design for heat transfer performance of a novel phase change material (PCM) thermal energy storage (TES). Appl. Therm. Eng. 2013, 50, 896–907. [Google Scholar] [CrossRef]
  23. Seeniraj, R.V.; Narasimhan, N.L. Performance enhancement of a solar dynamic LHTS module having both fins and multiple PCMs. Sol. Energy 2008, 82, 535–542. [Google Scholar] [CrossRef]
  24. Ismail, K.; Alves, C.; Modesto, M. Numerical and experimental study on the solidification of PCM around a vertical axially finned isothermal cylinder. Appl. Therm. Eng. 2001, 21, 53–77. [Google Scholar] [CrossRef]
  25. Blen, K.; Takgil, F.; Kaygusuz, K. Thermal Energy Storage Behavior of CaCl2·6H2O during Melting and Solidification. Energy Sources 2008, 30, 775–787. [Google Scholar]
  26. Ismail, K.A.R.; Filho, L.M.S.; Lino, F.A.M. Solidification of PCM around a curved tube. Int. J. Heat Mass Transf. 2012, 55, 1823–1835. [Google Scholar] [CrossRef]
  27. Al-Abidi, A.A.; Mat, S.; Sopian, K.; Sulaiman, M.Y.; Mohammad, A.T. Experimental study of melting and solidification of PCM in a triplex tube heat exchanger with fins. Energy Build. 2014, 68, 33–41. [Google Scholar] [CrossRef]
  28. Al-Abidi, A.A.; Mat, S.; Sopian, K.; Sulaiman, M.Y.; Mohammad, A.T. Numerical study of PCM solidification in a triplex tube heat exchanger with internal and external fins. Int. J. Heat Mass Transf. 2013, 61, 684–695. [Google Scholar] [CrossRef]
  29. Mosaffa, A.H.; Infante Ferreira, C.A.; Talati, F.; Rosen, M.A. Thermal performance of a multiple PCM thermal storage unit for free cooling. Energy Convers. Manag. 2013, 67, 1–7. [Google Scholar] [CrossRef]
  30. Francesco, C.; Sciacovelli, A.; Verda, V. Numerical analysis of a medium scale latent energy storage unit for district heating systems. Energy 2012, 45, 397–406. [Google Scholar]
  31. Wang, P.; Wang, X.; Huang, Y.; Li, C.; Peng, Z.; Ding, Y. Thermal energy charging behaviour of a heat exchange device with a zigzag plate configuration containing multi-phase-change-materials (m-PCMs). Appl. Energy 2015, 142, 328–336. [Google Scholar] [CrossRef]
Figure 1. Physical configuration of the zigzag configuration. H: height; M: tooth length; PCM: phase-change-material; and HTF: heat transfer fluid.
Energies 09 00394 g001
Figure 2. Arrangement of multiple phase-change-materials (m-PCMs) in (a) reverse and (b) forward directions.
Energies 09 00394 g002
Figure 3. Experimental system.
Energies 09 00394 g003
Figure 4. Zigzag plate heat exchanger unit. (a) Arrangement of the thermocouples; (b) surface of the zigzag plates; and (c) internal structure.
Energies 09 00394 g004
Figure 5. Comparison between the experimental and modelling results for the center and the outlet.
Energies 09 00394 g005
Figure 6. Dimensionless time evolution of the liquid fraction of all of the m-PCMs at different ΔT. (a) Reversed arrangement; and (b) forward arrangement.
Energies 09 00394 g006
Figure 7. Dimensionless time evolution of the dimensionless outlet temperature. (a) Reversed arrangement; and (b) forward arrangement.
Energies 09 00394 g007
Figure 8. Liquid fractions of the three m-PCMs as a function of dimensionless time at different value of ΔT (empty, half-filled and filled symbols stand for liquid fractions of PCM-1, PCM-2 and PCM-3, respectively).
Energies 09 00394 g008
Figure 9. Dimensionless time dependence of m-PCMs effectiveness η (inset is the average η(ave) overall η by integrating over the distribution).
Energies 09 00394 g009
Figure 10. (a) Liquid fractions of the m-PCMs and (b) dimensionless outlet temperature as a function of dimensionless time at different Ste numbers.
Energies 09 00394 g010
Figure 11. (a) Liquid fractions of the m-PCMs and (b) dimensionless outlet temperature as a function of dimensionless time at different Re numbers.
Energies 09 00394 g011
Figure 12. Time evolution of liquid fractions at different inlet velocity (Re)/inlet temperature (Ste) (Re/Ste) numbers under the given inlet power condition.
Energies 09 00394 g012
Figure 13. Time evolution of the outlet temperature at different inlet velocity (Re)/inlet temperature (Ste) (Re/Ste) numbers under the given inlet power.
Energies 09 00394 g013
Figure 14. Time evolution of the ratio of the latent heat to the total stored heat at different inlet velocity (Re)/inlet temperature (Ste) (Re/Ste) numbers.
Energies 09 00394 g014
Figure 15. Liquid fractions of the m-PCMs as a function of time at different periods (T) under the given inlet power condition (empty, half-filled and filled symbols stand for liquid fractions of PCM-1, PCM-2 and PCM-3, respectively).
Energies 09 00394 g015
Figure 16. Time evolution of the outlet temperatures at different periods (T) under the given inlet power condition.
Energies 09 00394 g016
Table 1. Thermophysical properties of the NaCl-MgCl2 salt for the validation experiments.
DensityThermal ConductivitySpecific HeatMelting PointLatent Heat
kg/m3W/m·KkJ/(kg·K)KkJ/kg
22000.60.93713.15280

