
Determination of Fracture Initiation Locations during Cross-Measure Drilling for Hydraulic Fracturing of Coal Seams

 ,
,
Abstract
:1. Introduction
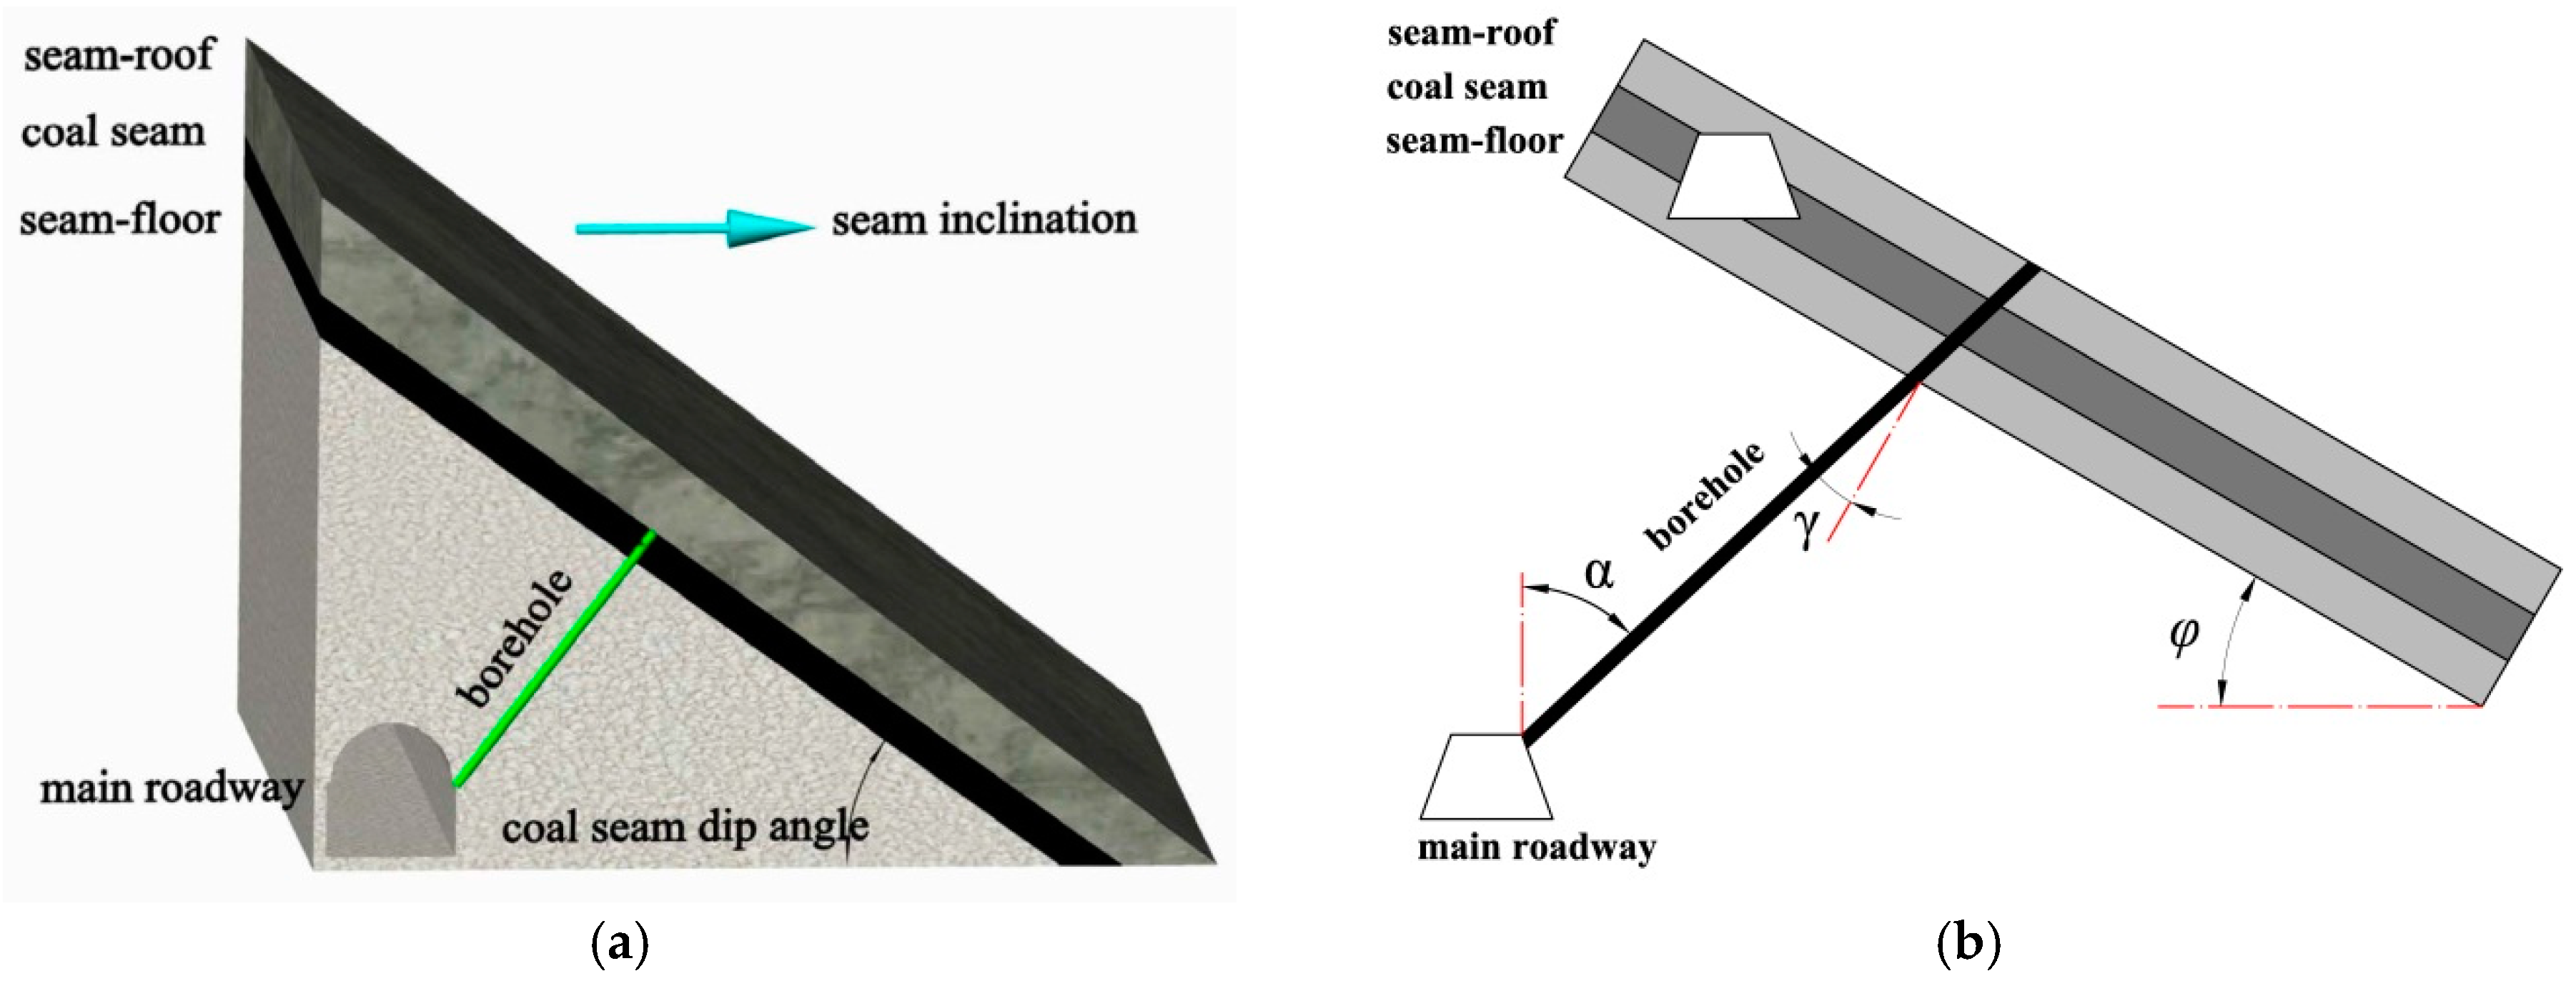
2. Fracture Initiation Location
2.1. Initiation Location in a Coal Seam
2.2. Initiation Location in the Coal-Rock Interface
2.3. Model to Determine the Initiation Location
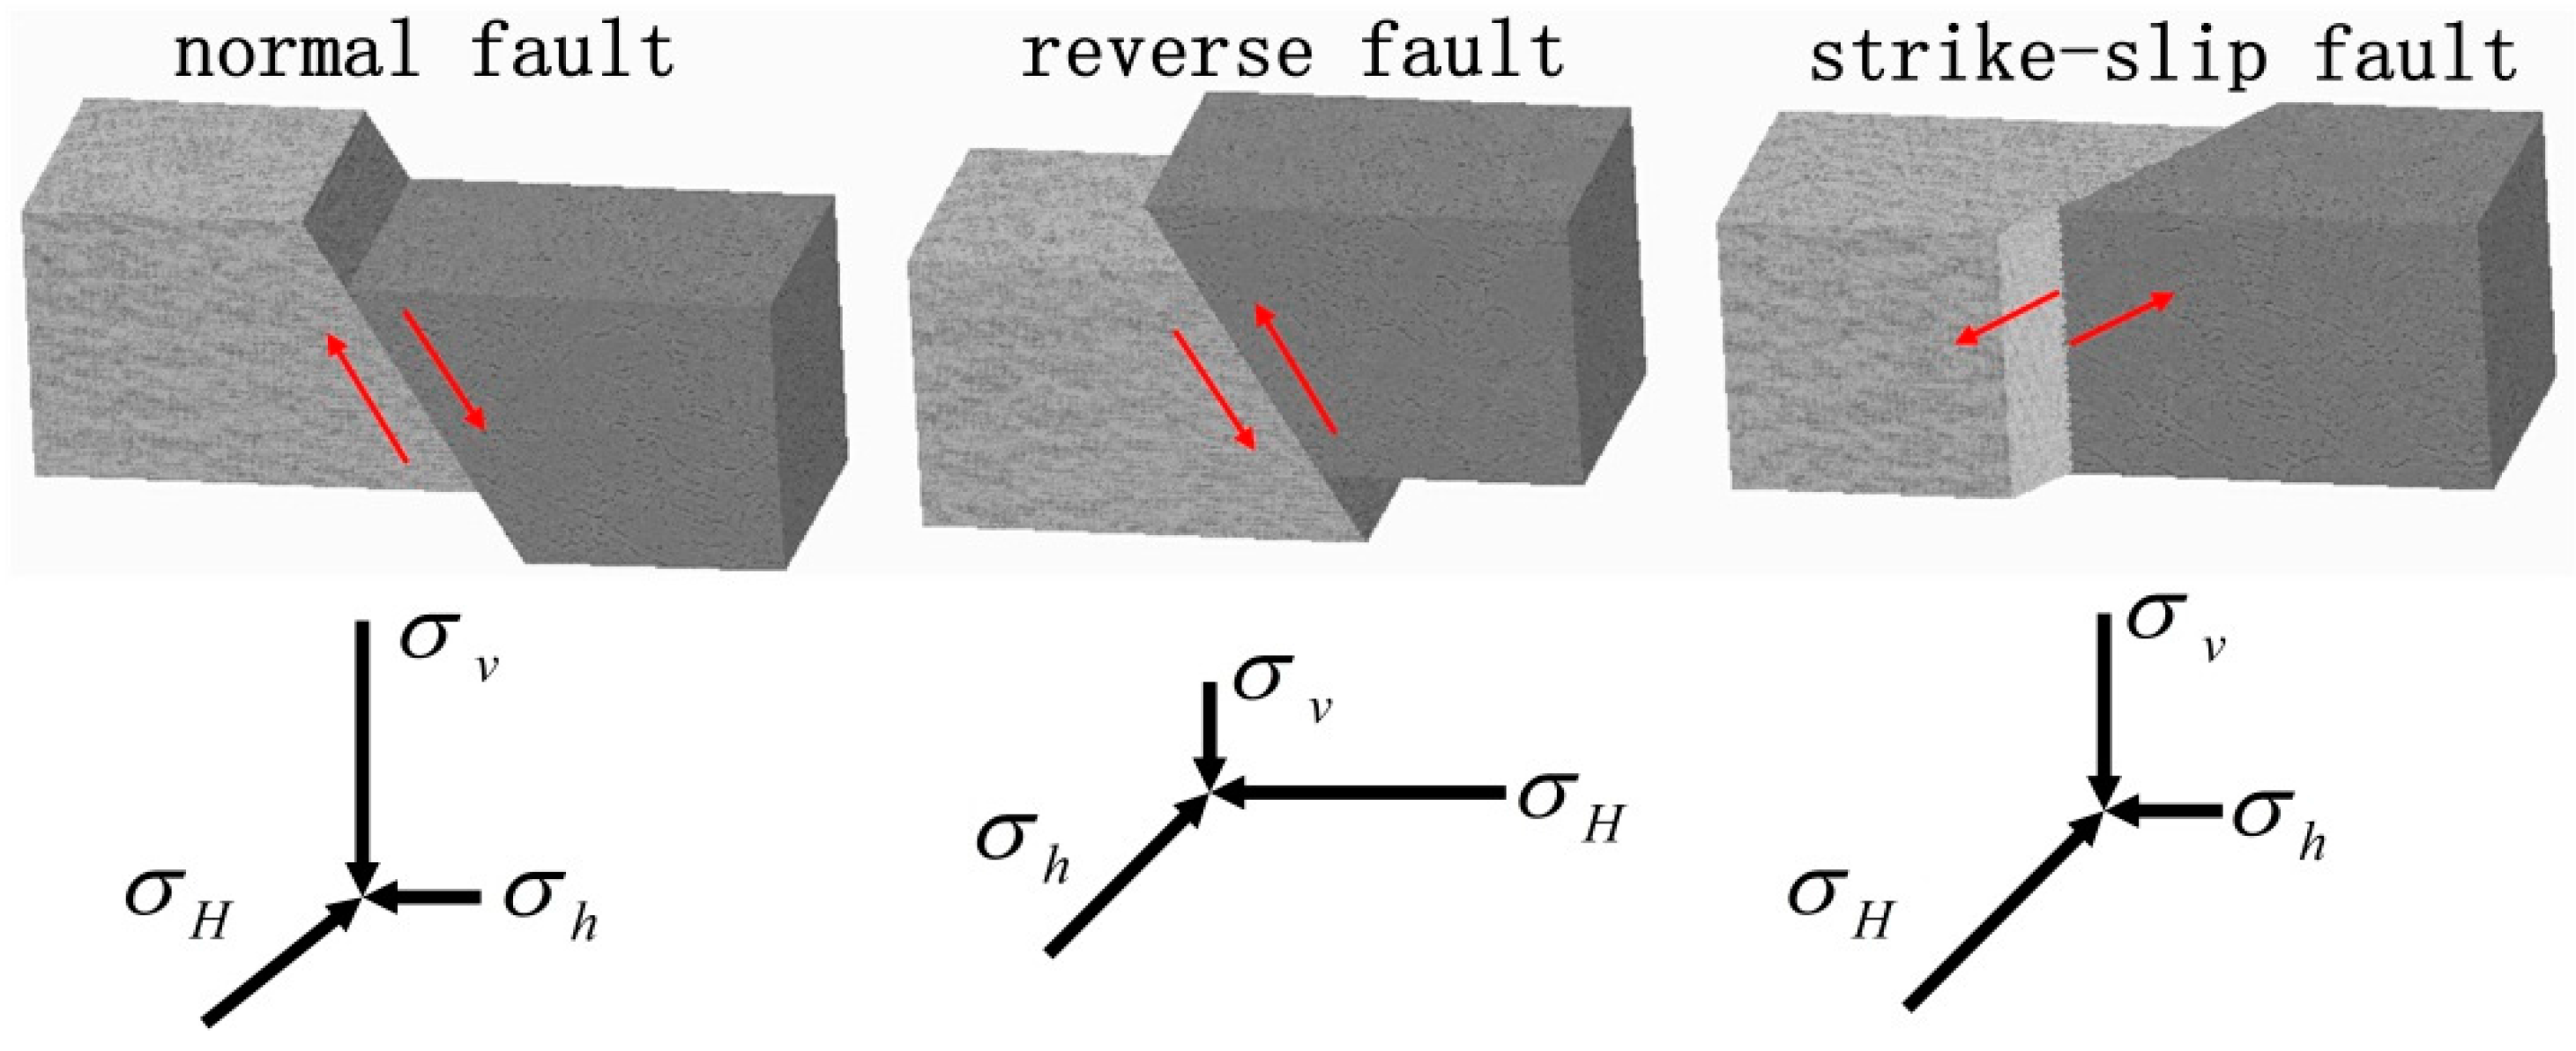
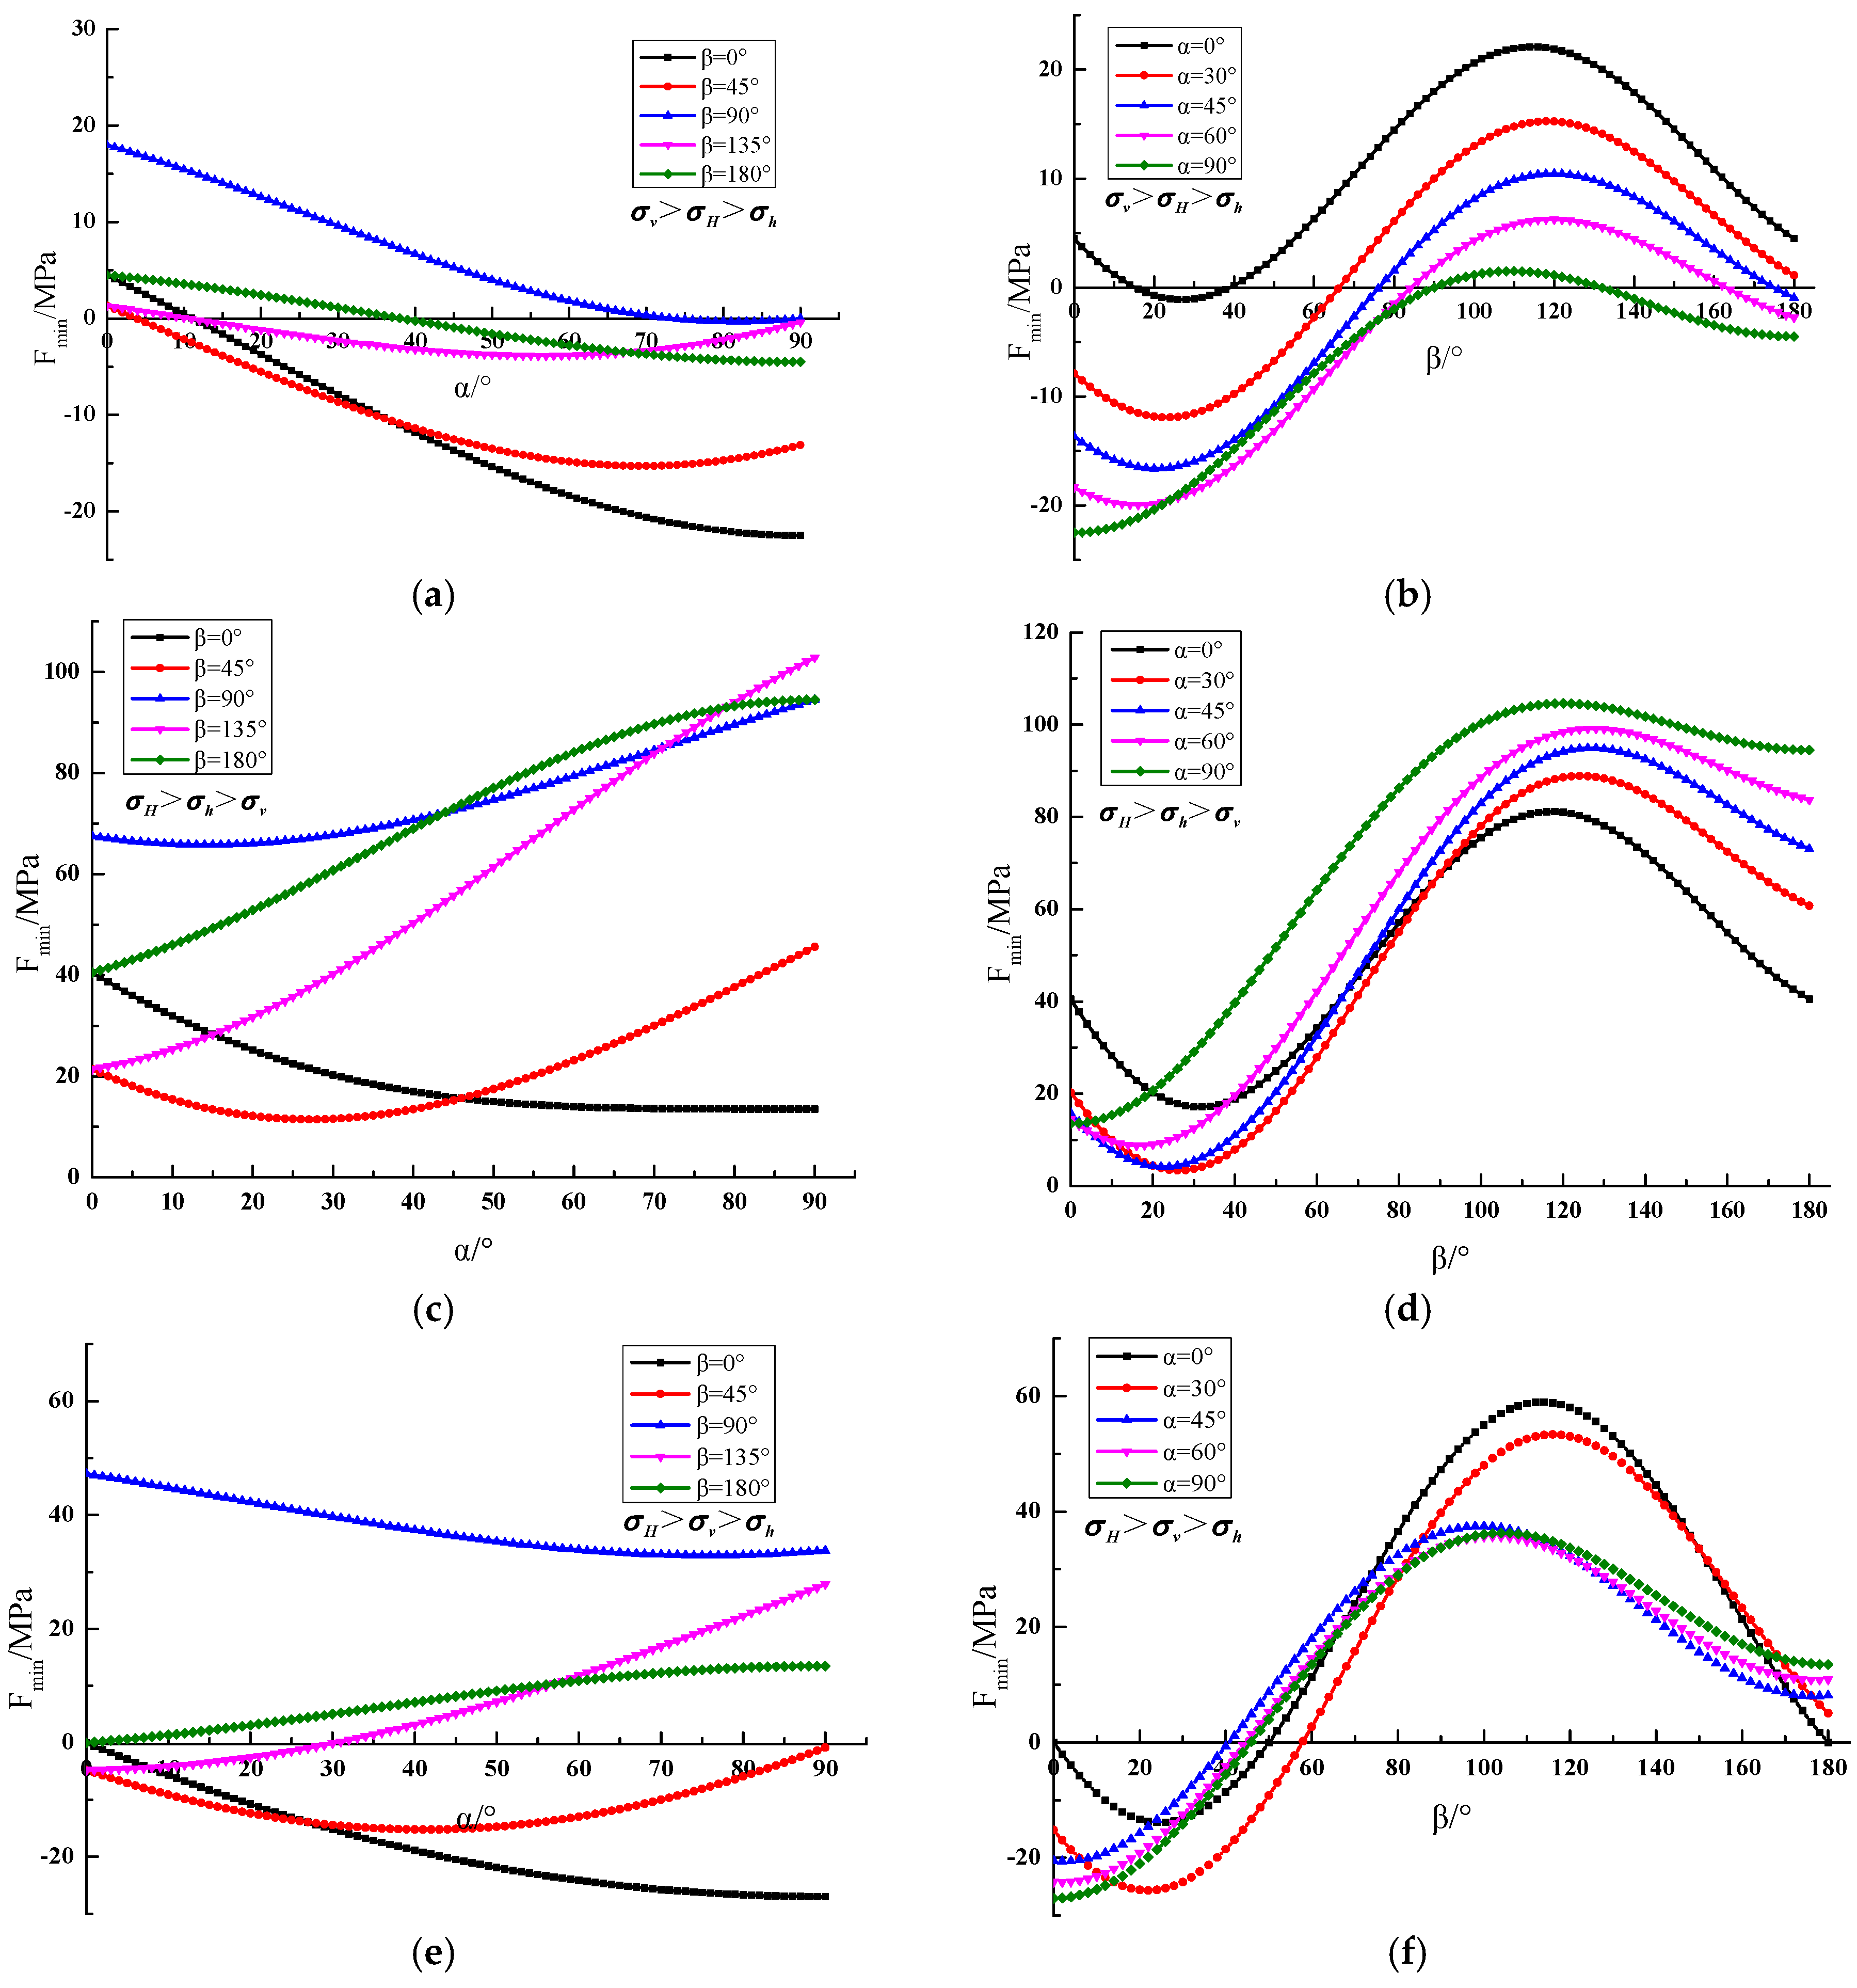
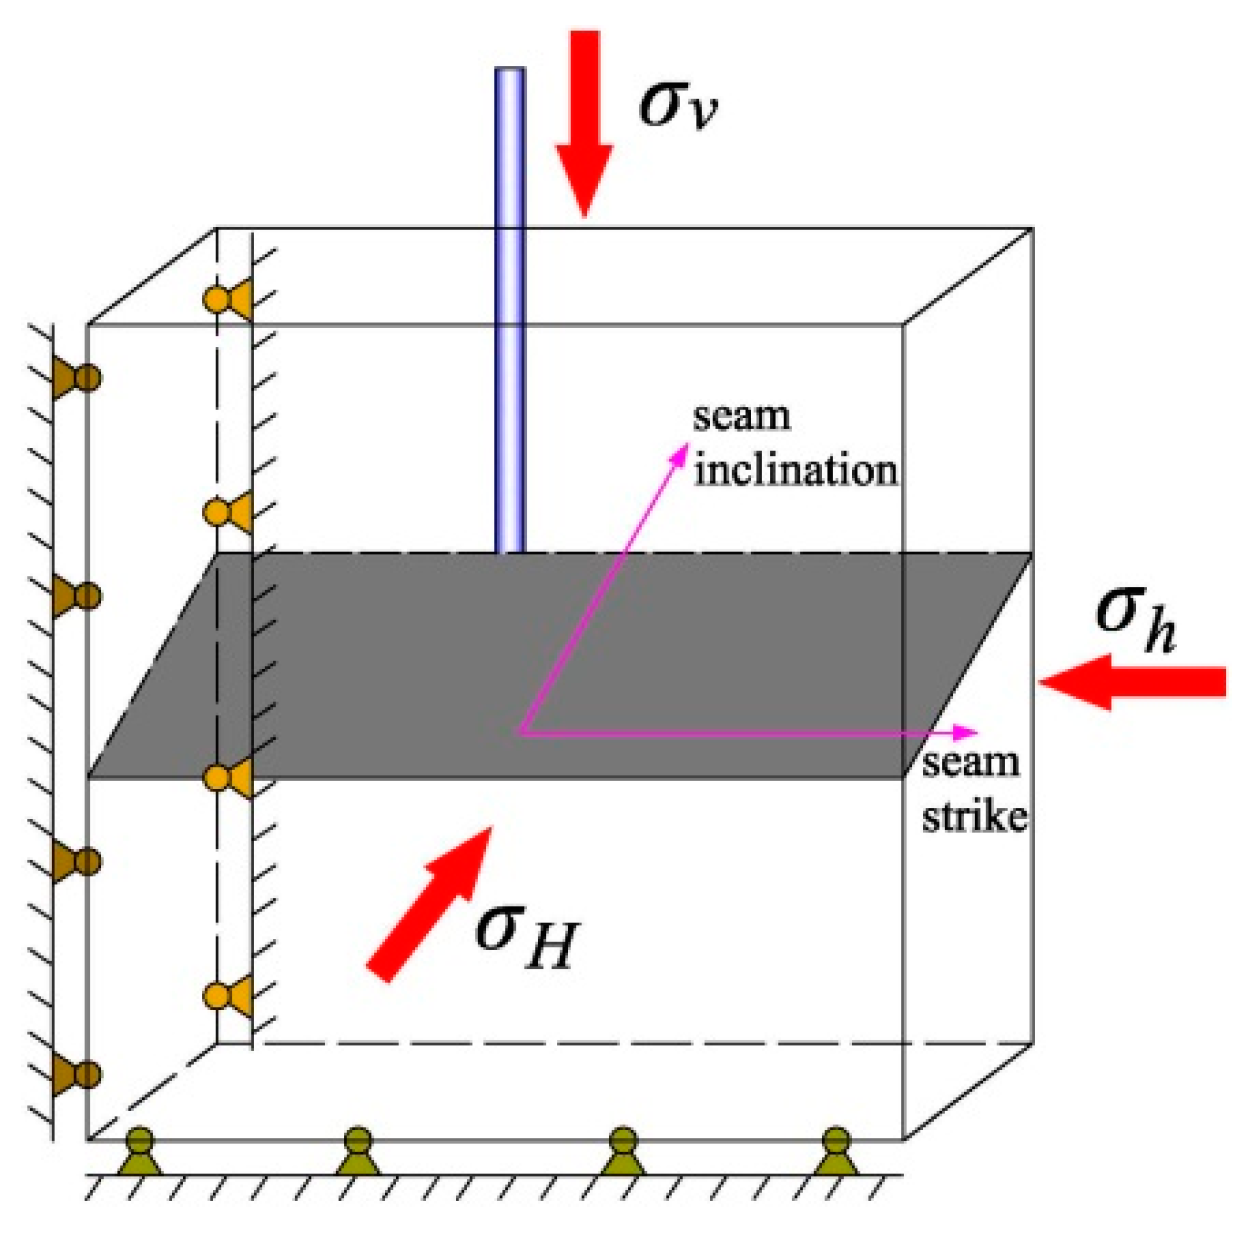
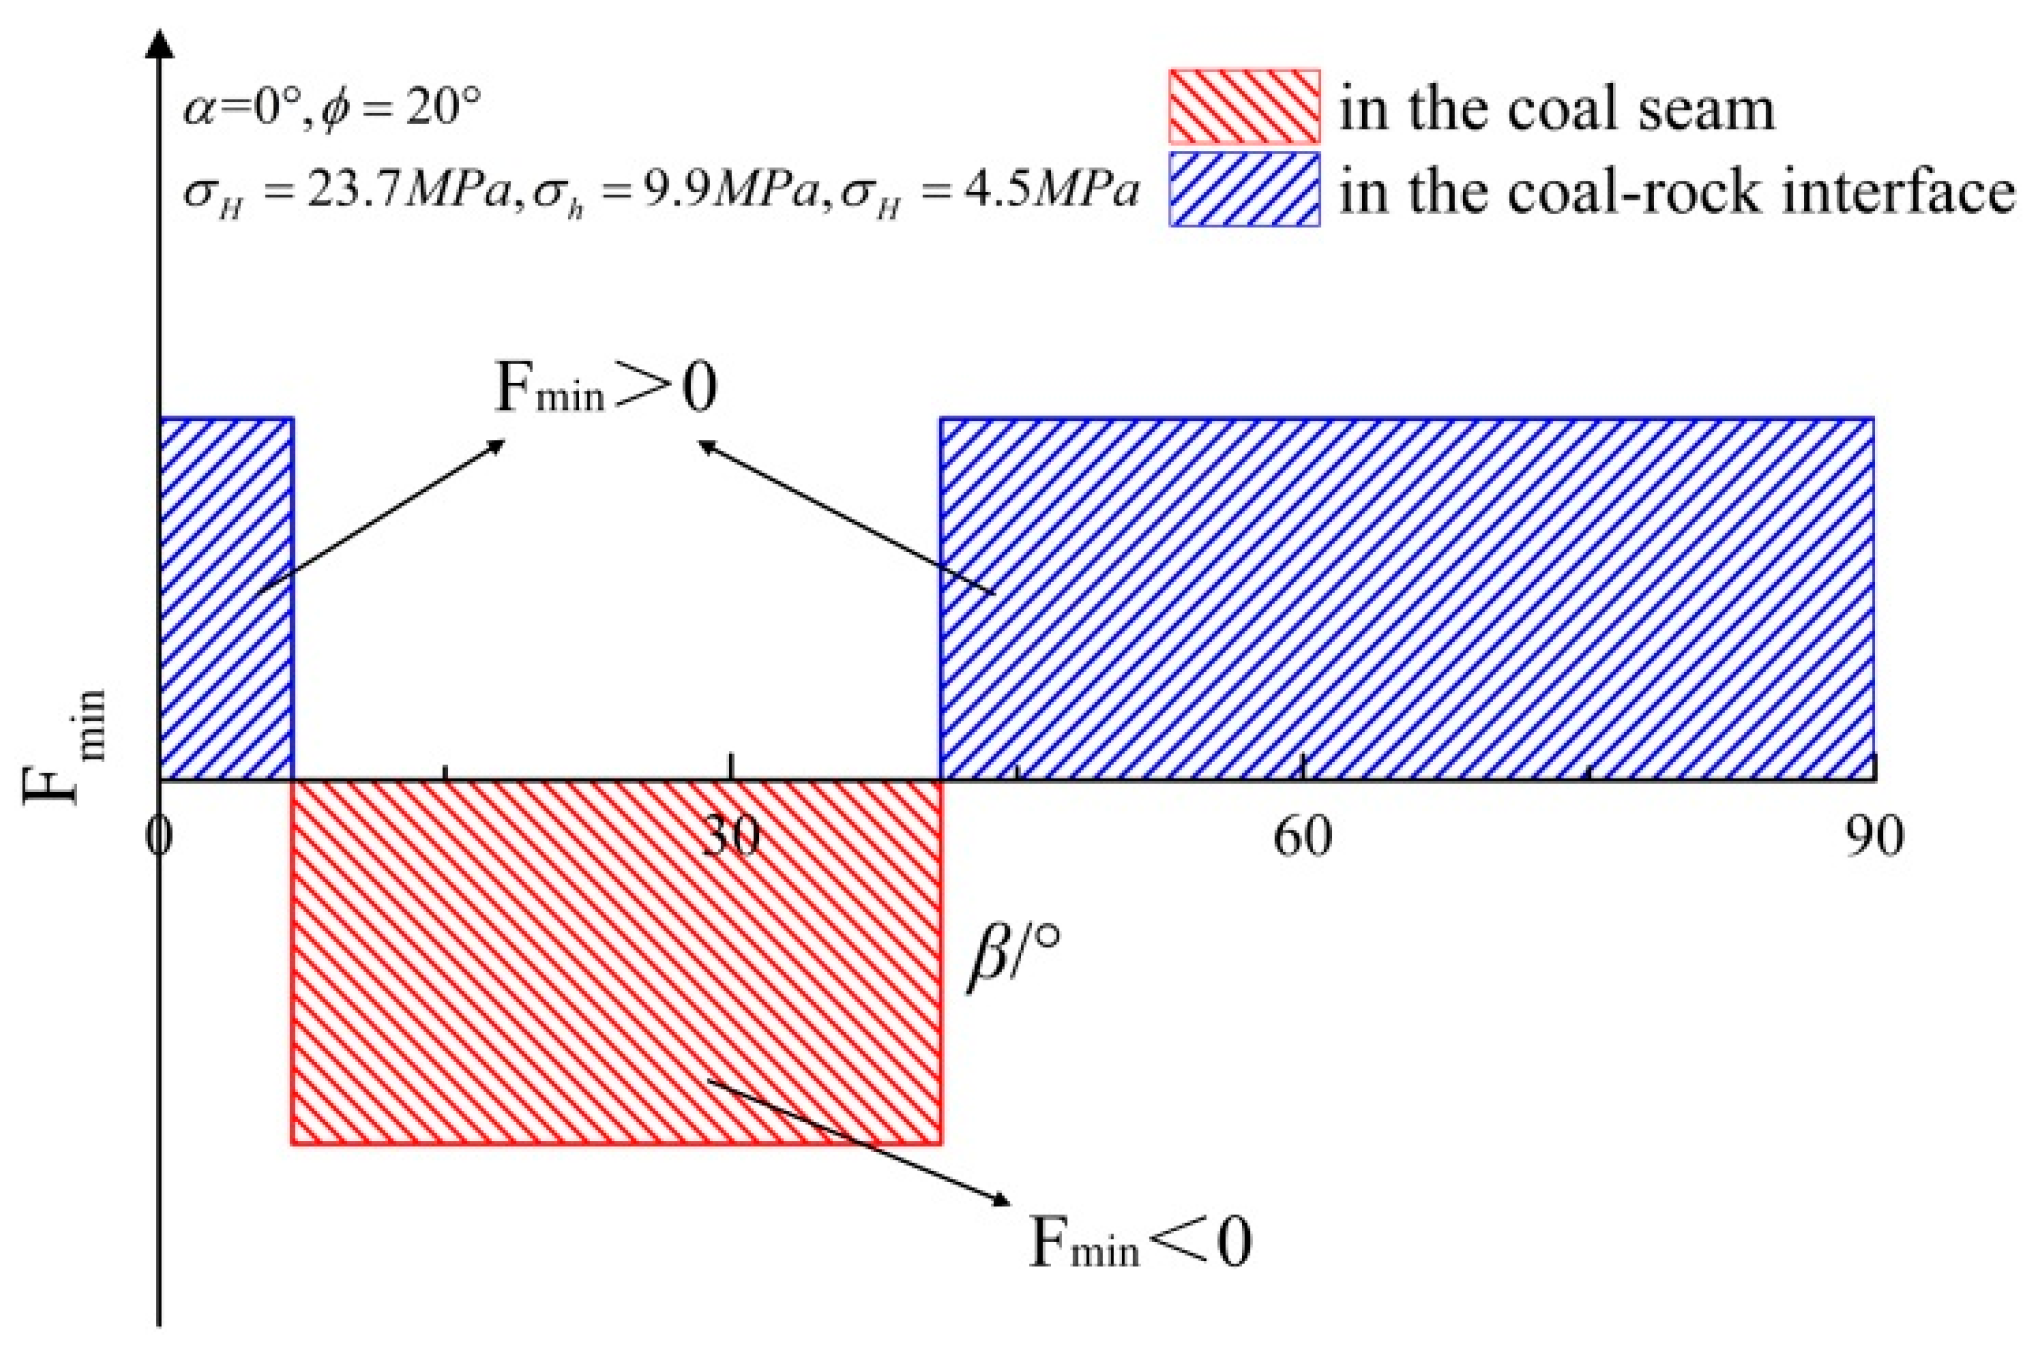
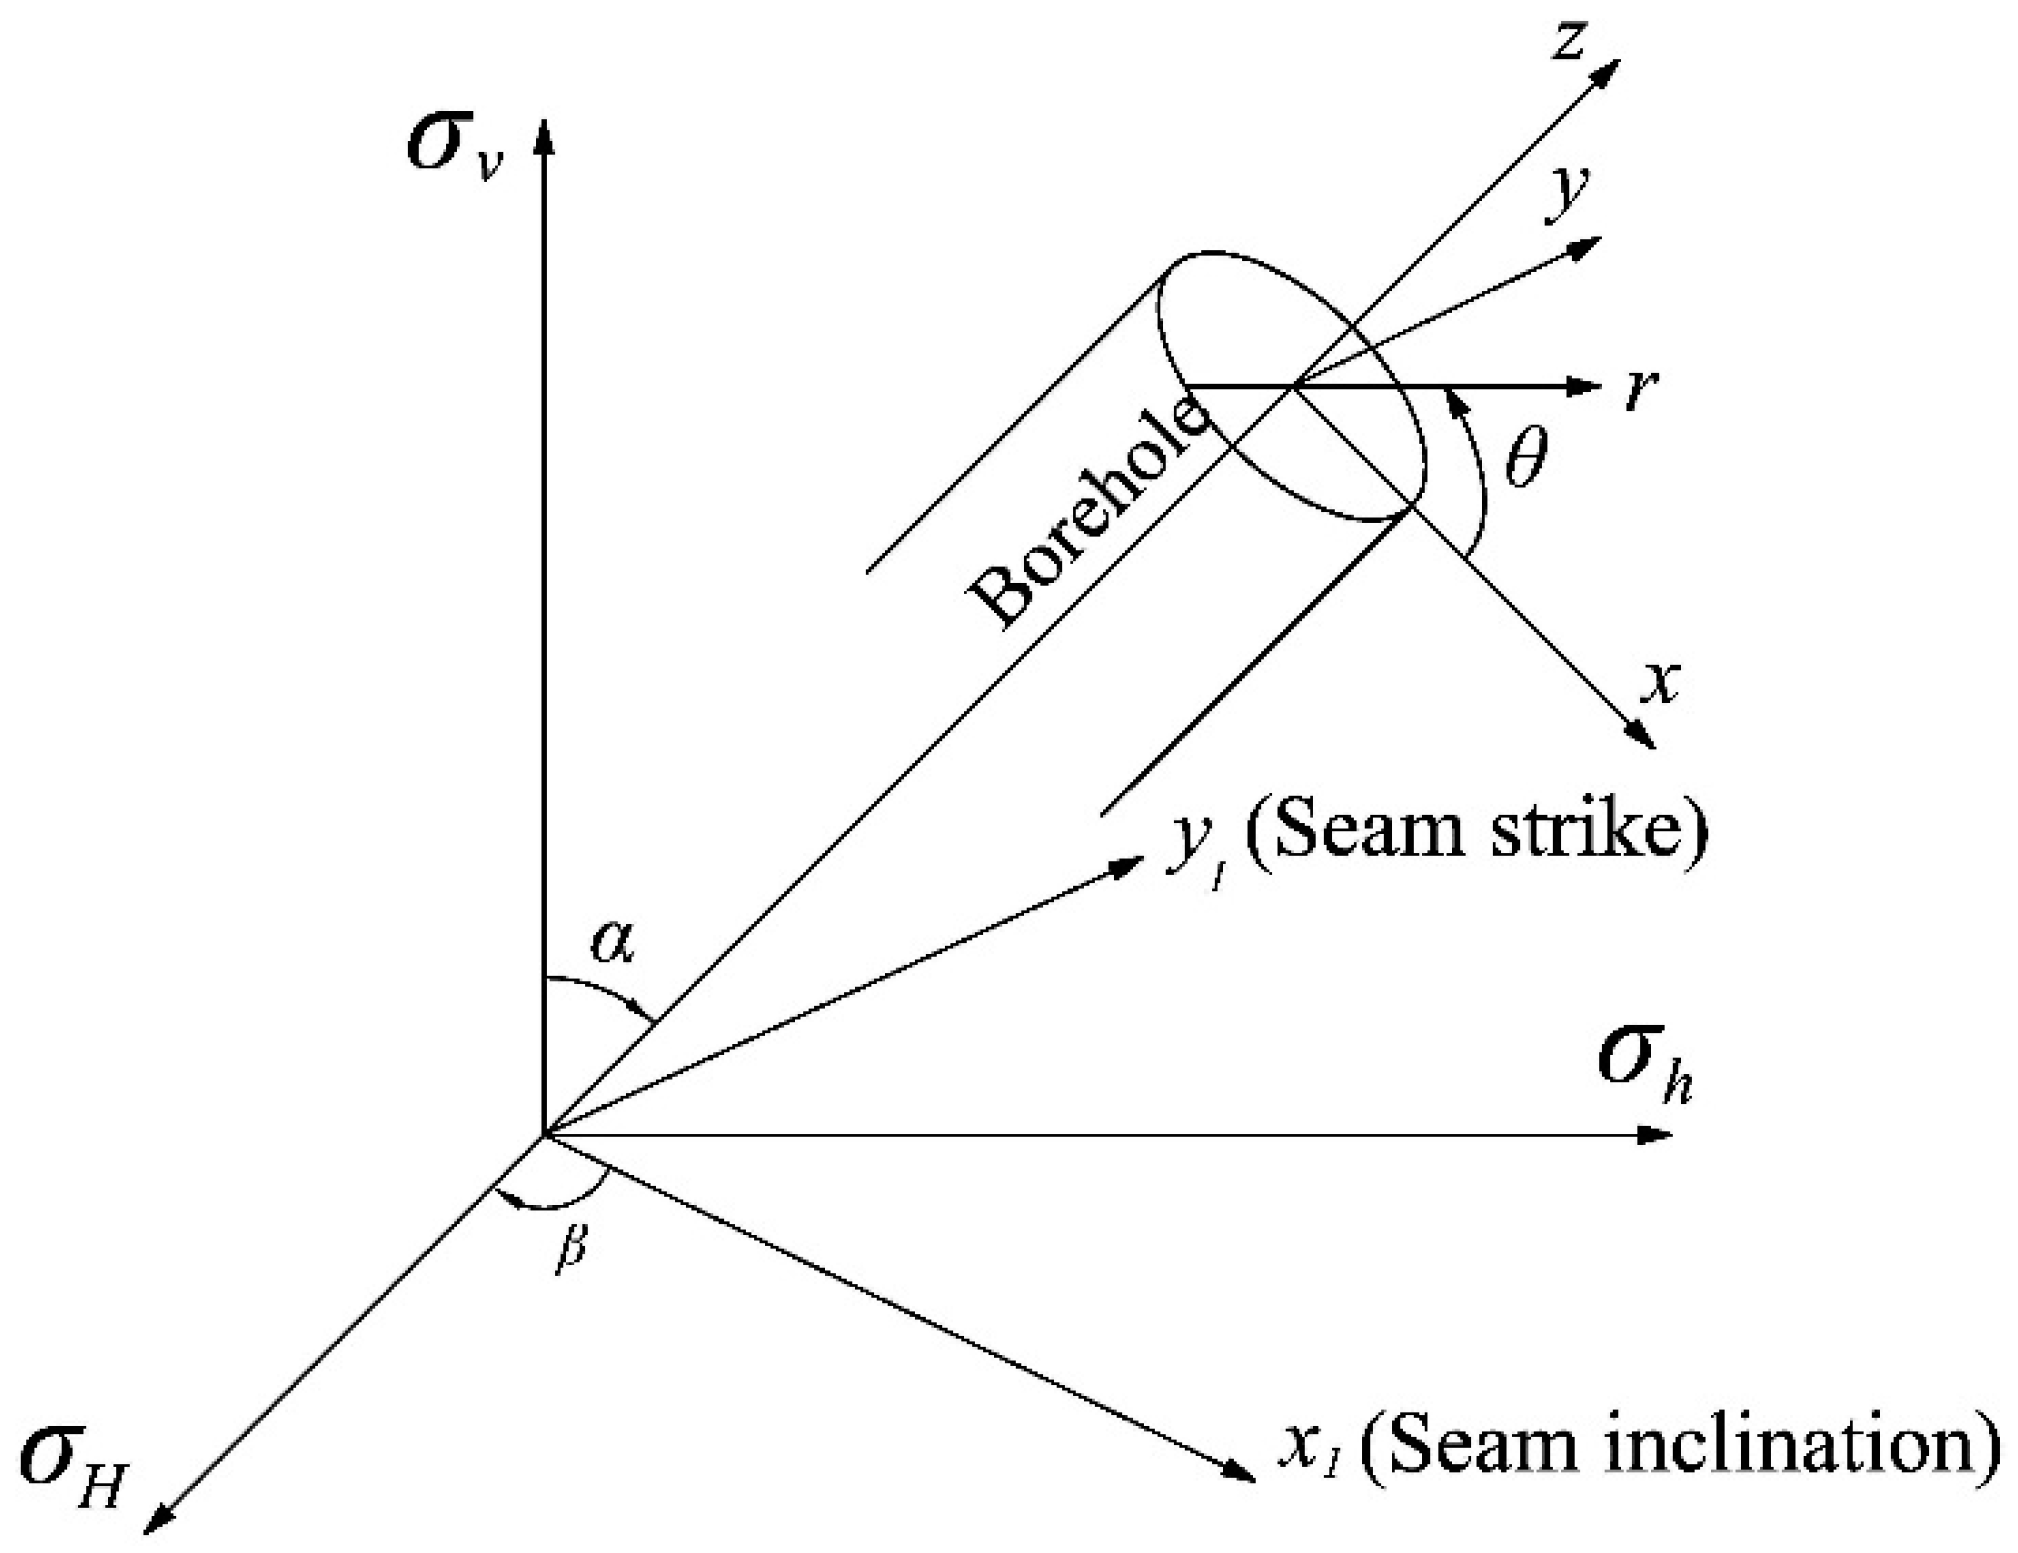
3. Analysis of Initiation Location Parameters
- Since the strength of extension of coal and the coal bonding force are constant and they both inhibit the initiation pressure, it is assumed that their values are equal;
- The borehole is perpendicular to coal seam;
- The coal seam depth of burial is 500 m. The ratios of the principle stresses of a normal fault are , those for a reverse fault are , and stress ratios for a strike-slip fault are .
4. Physical Simulation Experiments
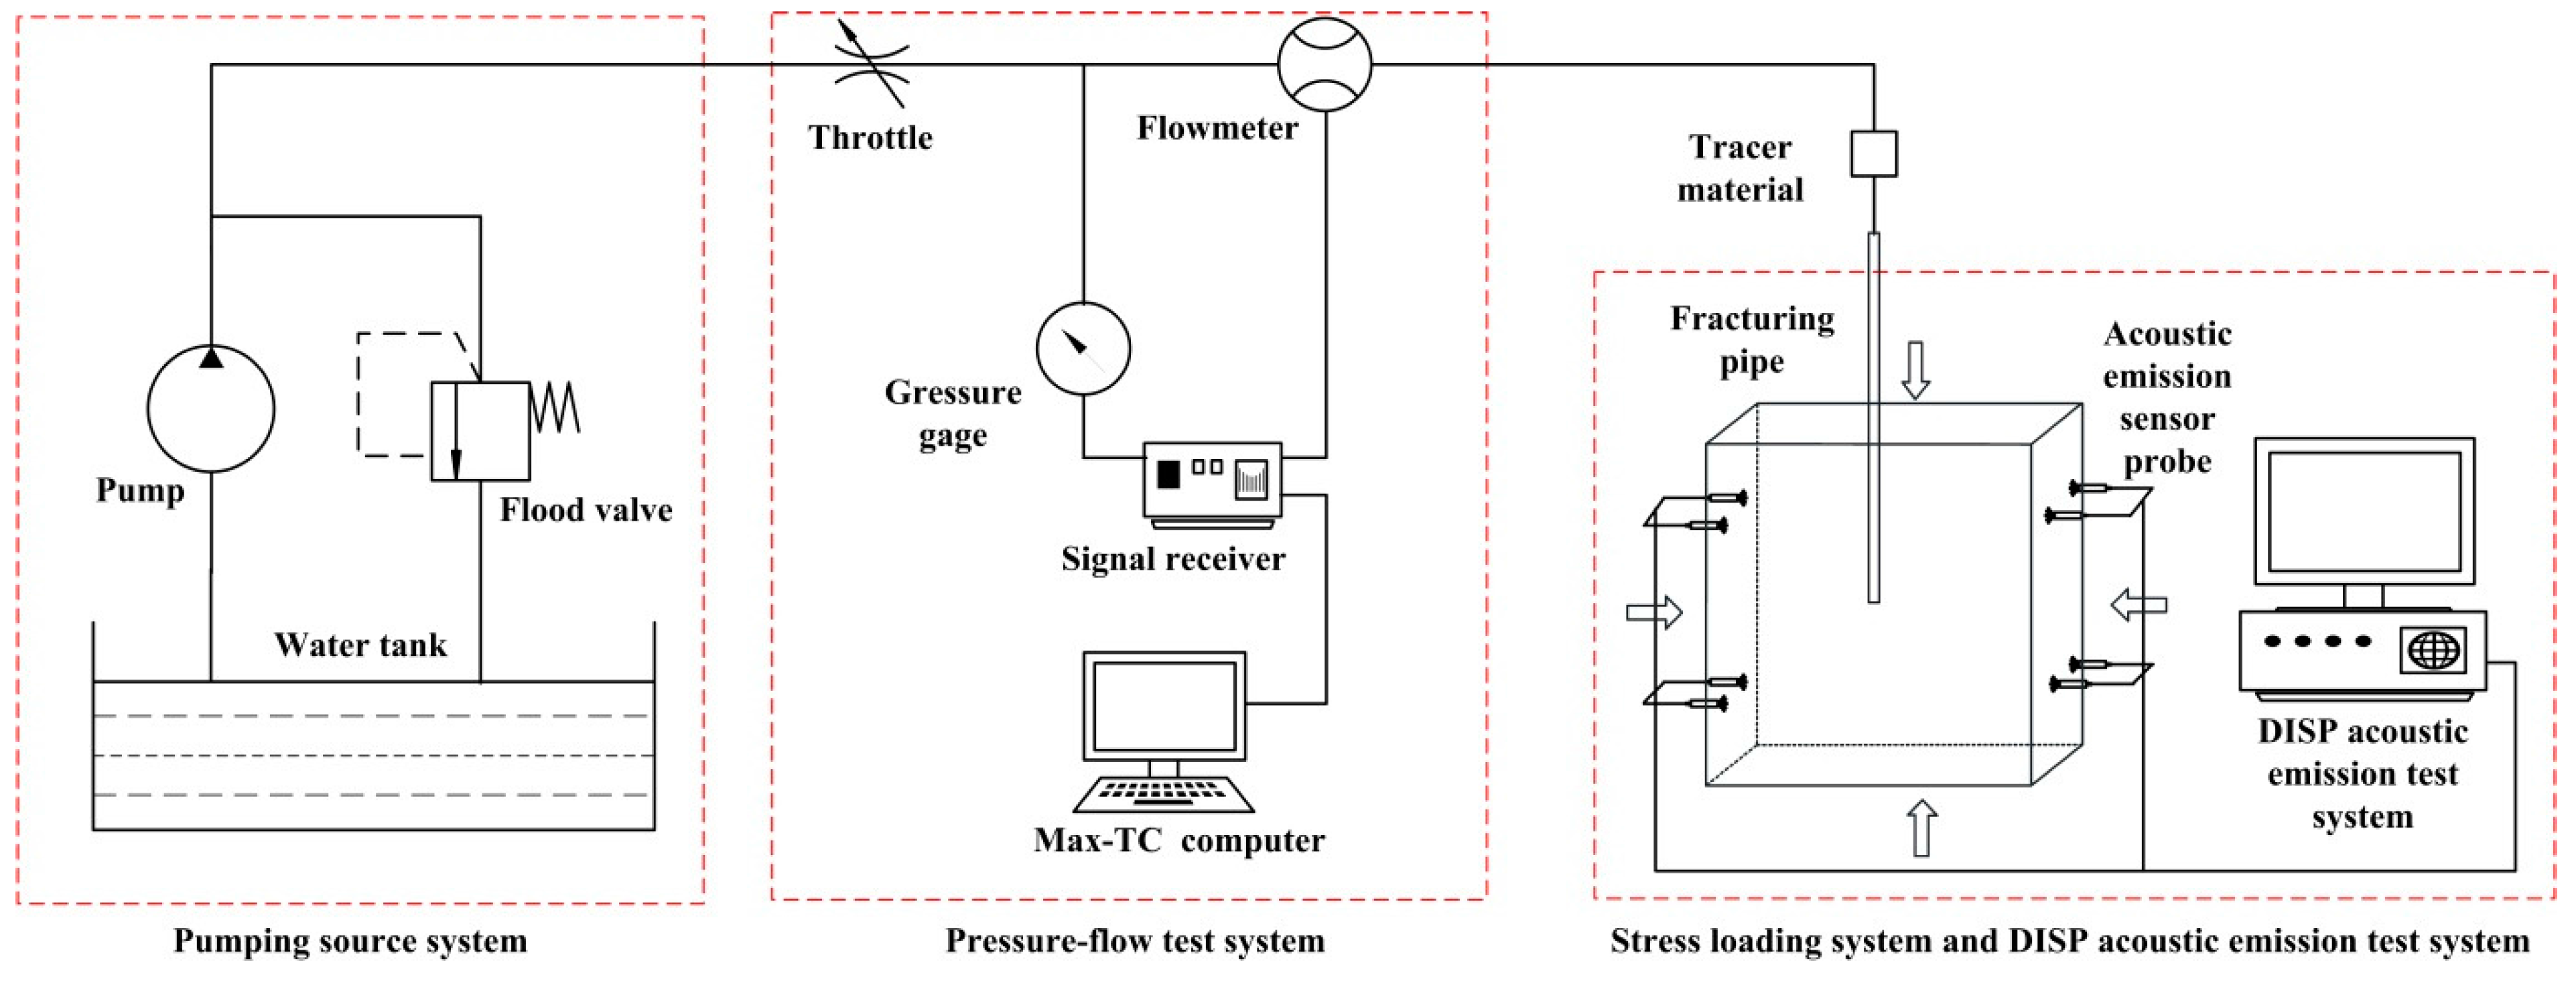
4.1. Test System
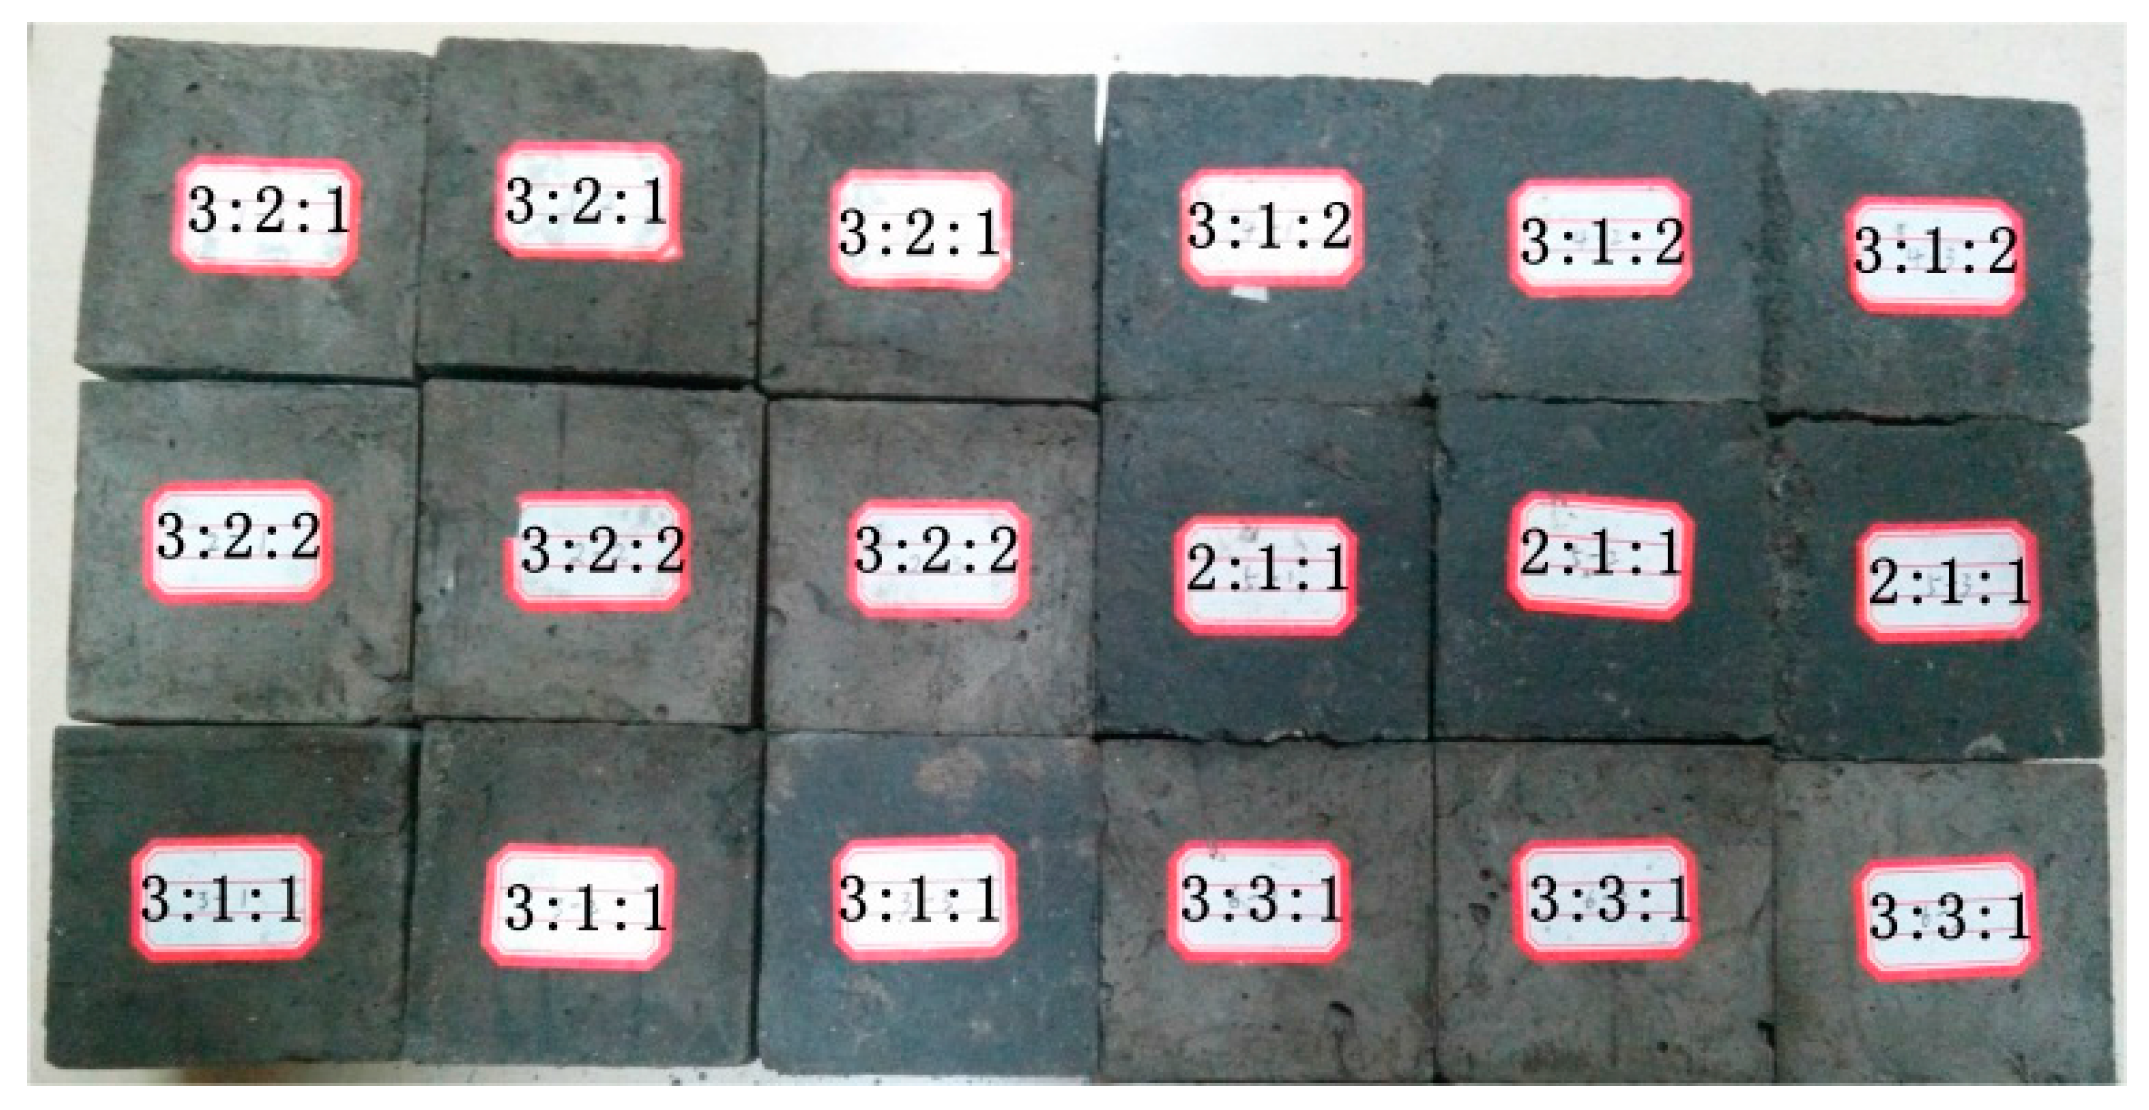
4.2. Sample Preparation and Stress Loading
5. Results and Discussion
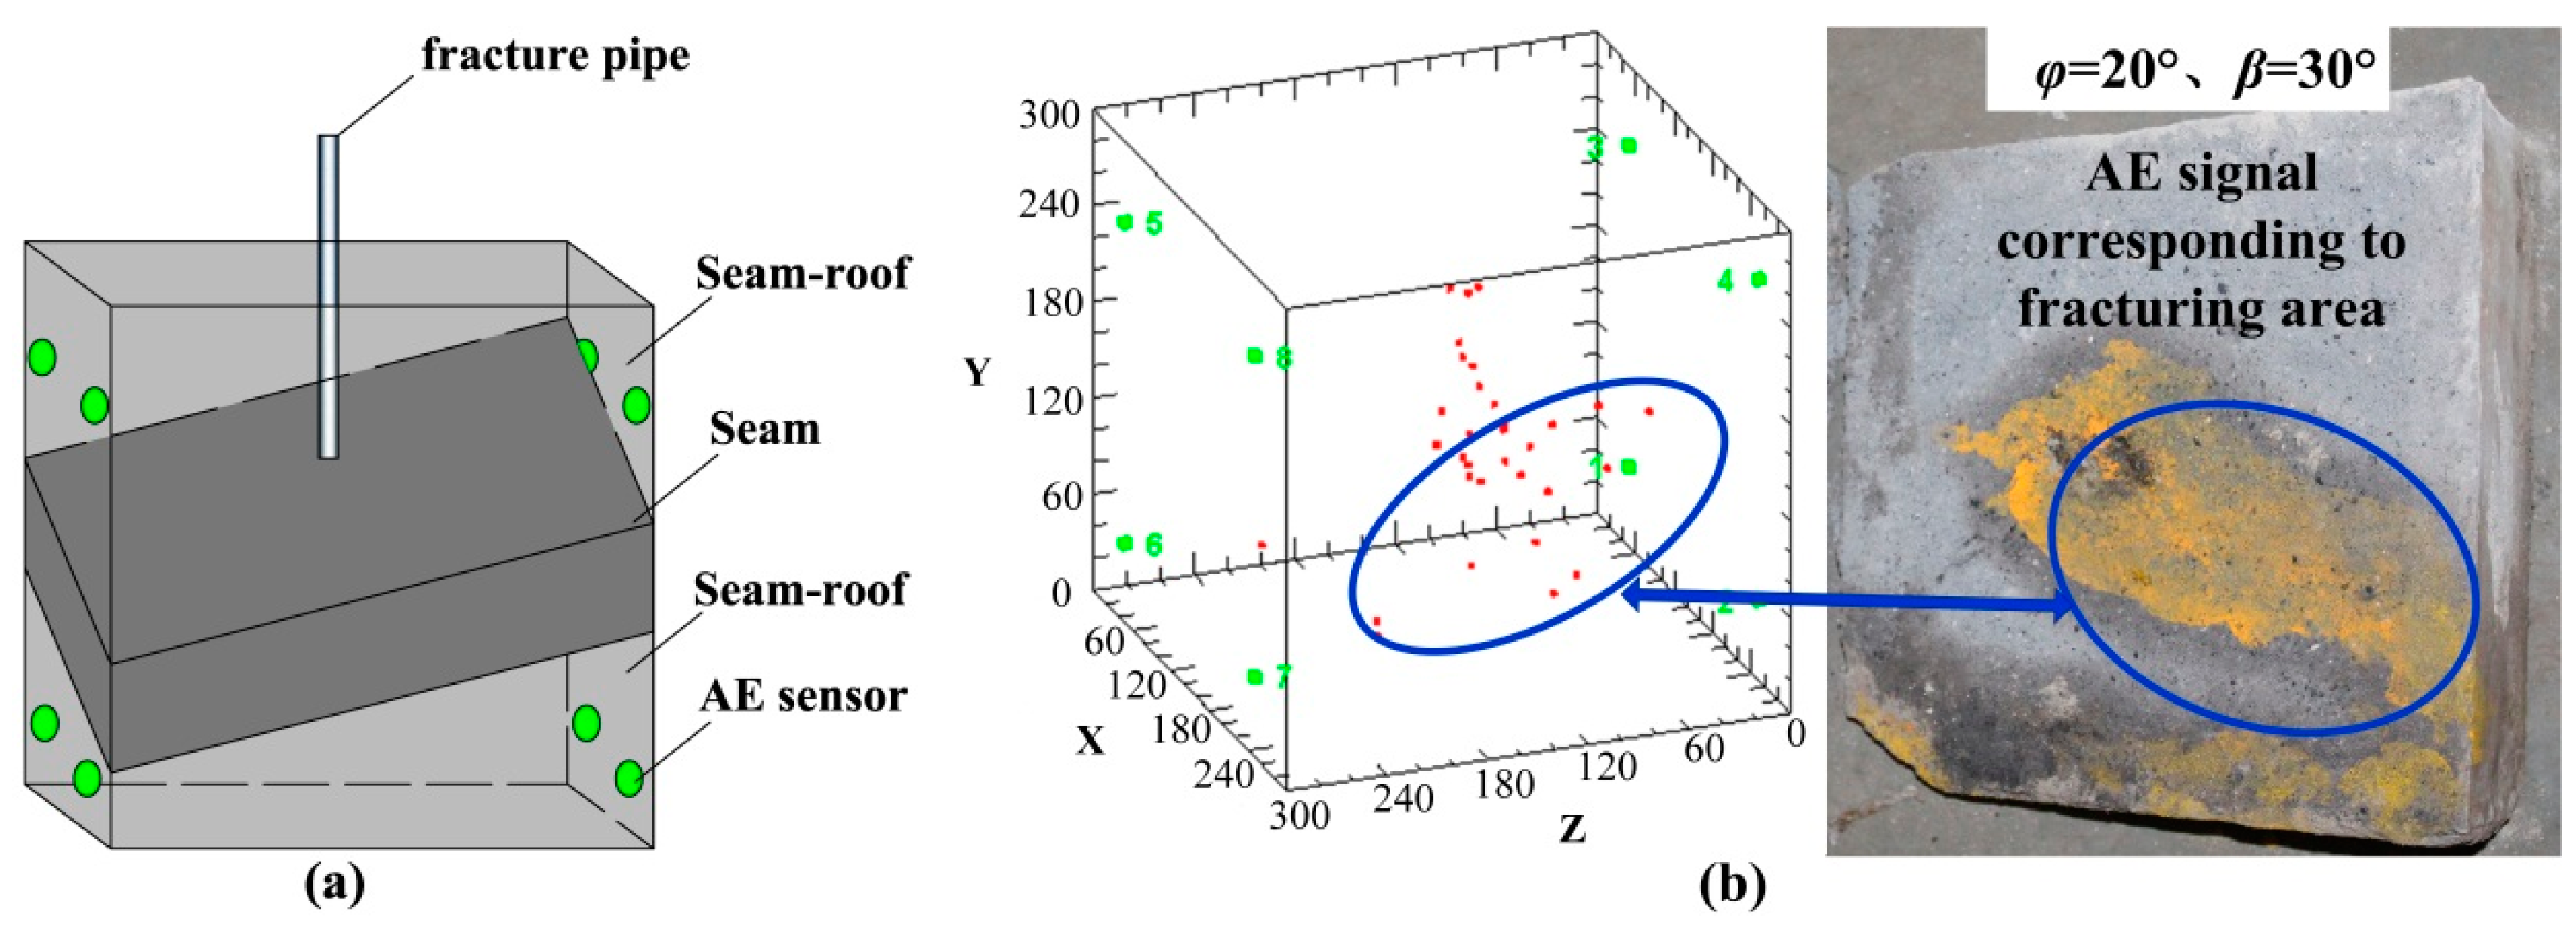
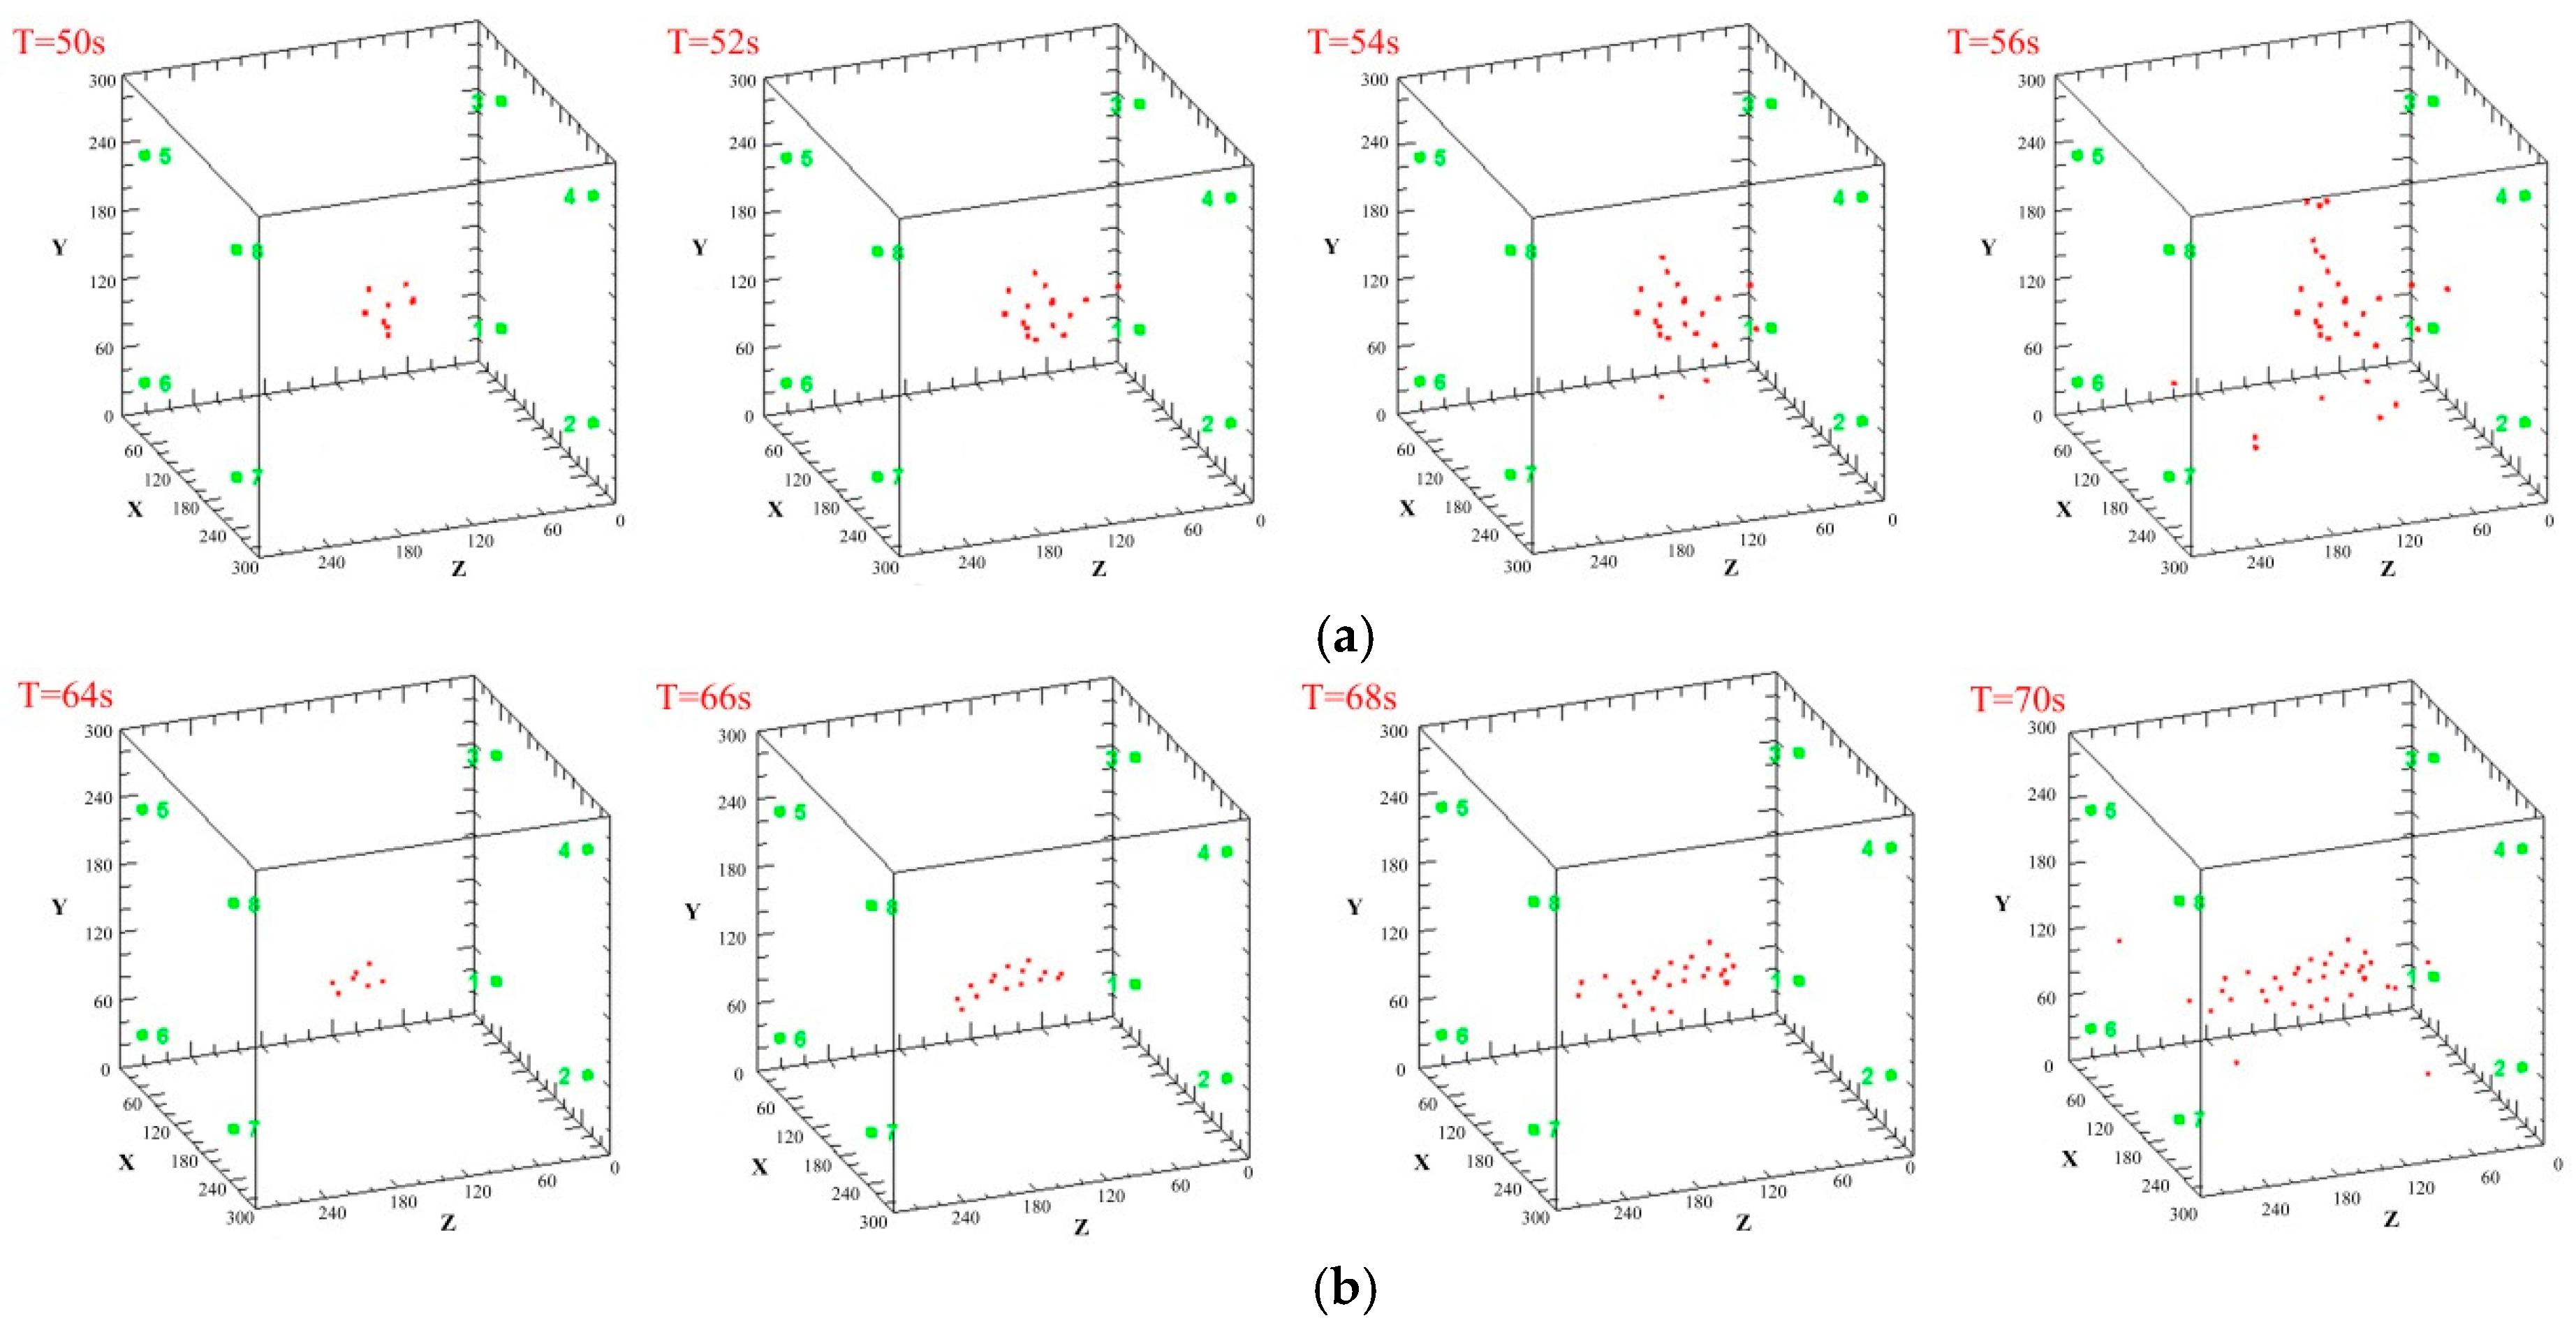
5.1. Sensor Arrangement and Acoustic Emission (AE) Sensor Verification
5.2. Fracture Initiation Location Verification
6. Conclusions
Acknowledgments
Author Contributions
Conflicts of Interest
References
- Li, L.C.; Xia, Y.J.; Huang, B.; Zhang, L.Y.; Li, M.; Li, A.S. The Behaviour of Fracture Growth in Sedimentary Rocks: A Numerical Study Based on Hydraulic Fracturing Processes. Energies 2016, 9. [Google Scholar] [CrossRef]
- Zhai, C.; Yu, X.; Xiang, X.W.; Li, Q.G.; Wu, S.L.; Xu, J.Z. Experimental study of pulsating water pressure propagation in CBM reservoirs during pulse hydraulic fracturing. J. Nat. Gas Sci. Eng. 2015, 25, 15–22. [Google Scholar] [CrossRef]
- Zhang, Z.B.; Li, X.; Yuan, W.N.; He, J.M.; Li, G.F.; Wu, Y.S. Numerical analysis on the optimization of hydraulic fracture networks. Energies 2015, 8, 12061–12079. [Google Scholar] [CrossRef]
- Wang, W.C.; Li, X.Z.; Lin, B.Q.; Zhai, C. Pulsating hydraulic fracturing technology in low permeability coal seams. Int. J. Min. Sci. Technol. 2015, 25, 681–685. [Google Scholar] [CrossRef]
- Wang, T.; Zhou, W.B.; Chen, J.H.; Xiao, X.; Li, Y.; Zhao, X.Y. Simulation of hydraulic fracturing using particle flow method and application in a coal mine. Int. J. Coal Geol. 2014, 121, 1–13. [Google Scholar] [CrossRef]
- Tang, S.H.; Zhu, B.C.; Yan, Z.F. Effect of crustal stress on hydraulic fracturing in coalbed methane wells. J. China Coal Soc. 2011, 36, 65–69. (In Chinese) [Google Scholar]
- Yang, J.S.; Wang, Y.B.; Li, A.Q.; Chen, Z.H.; Chen, Y.P.; Zou, Y.S. Experimental study on propagation mechanism of complex hydraulic fracture in coal-bed. J. China Coal Soc. 2012, 37, 73–77. (In Chinese) [Google Scholar]
- Huang, J.; Griffiths, D.V.; Wong, S.W. In situ stress determination from inversion of hydraulic fracture data. Int. J. Rock Mech. Min. 2011, 48, 476–481. [Google Scholar] [CrossRef]
- Huang, J.; Griffiths, D.V.; Wong, S.W. Initiation pressure, location and orientation of hydraulic fracture. Int. J. Rock Mech. Min. 2012, 49, 59–67. [Google Scholar] [CrossRef]
- Feng, Y.J.; Kang, H.P. Hydraulic fracturing initiation and propagation. Chin. J. Rock Mech. Eng. 2013, 32, 3169–3179. (In Chinese) [Google Scholar]
- Zhao, H.F.; Chen, M. Extending behavior of hydraulic fracture when reaching formation interface. J. Petrol. Sci. Eng. 2010, 71, 26–30. [Google Scholar] [CrossRef]
- Li, D.Q.; Zhang, S.C.; Zhang, S.A. Experimental and numerical simulation study on fracturing through interlayer to coal seam. J. Nat. Gas Sci. Eng. 2014, 21, 386–396. [Google Scholar] [CrossRef]
- Zhang, G.H.; Wei, G.P.; Hou, F.C. Theory of start-split affusion stress and start-split location about through coal delam inaions’ bore of hydraulic fracture. J. China Coal Soc. 2007, 32, 52–55. (In Chinese) [Google Scholar]
- Ranjith, P.G.; Jasinge, D.; Choi, S.K.; Mehic, M.; Shannon, B. The effect of CO2 saturation on mechanical properties of Australian black coal using acoustic emission. Fuel 2010, 89, 2110–2117. [Google Scholar] [CrossRef]
- Perera, M.S.A.; Ranjith, P.G.; Viete, D.R. Effects of gaseous and super-critical carbon dioxide saturation on the mechanical properties of bituminous coal from the Southern Sydney Basin. Appl. Energy 2013, 110, 73–81. [Google Scholar] [CrossRef]
- Perera, M.S.A.; Ranjith, P.G.; Peter, M. Effects of saturation medium and pressure on strength parameters of Latrobe Valley brown coal: Carbon dioxide, water and nitrogen saturations. Energy 2011, 36, 6941–6947. [Google Scholar] [CrossRef]
- Lockner, D. The role of acoustic emission in the study of rock fracture. Int. J. Rock Mech. Min. 1993, 30, 883–899. [Google Scholar] [CrossRef]
- Chen, M.; Jin, Y.; Zhang, G.Q. Rock Mechanics of Petroleum Engineering; Science Press: Beijing, China, 2008; pp. 167–173. [Google Scholar]
- Hossain, M.M.; Rahman, M.K.; Rahman, S.S. Hydraulic fracture initiation and propagation: Roles of wellbore trajectory, perforation and stress regimes. J. Petrol. Sci. Eng. 2000, 27, 129–149. [Google Scholar] [CrossRef]
- Li, C.L.; Kong, X.Y. A theoretical study on rocks break down pressure calculation equation of fracturing process. Oil Drill. Prod. Technol. 2000, 22, 54–57. [Google Scholar]
- Liu, Y.; Xia, B.W.; Liu, X.T. A novel method of orienting hydraulic fractures in coal mines and its mechanism of intensified conduction. J. Nat. Gas Sci. Eng. 2015, 27, 190–199. [Google Scholar] [CrossRef]
- Jing, F.; Sheng, Q.; Zhang, Y.H.; Luo, C.W.; Liu, Y.K. Research on distribution rule of shallow crustal geostress in China mainland. Chin. J. Rock Mech. Eng. 2007, 26, 2056–2062. (In Chinese) [Google Scholar]
- Li, X.H.; Lu, Y.Y.; Kang, Y.; Rao, B.H. Rock Mechanics Experiment Simulation Technology; Science Press: Beijing, China, 2007; pp. 25–44. [Google Scholar]
- Lin, H.X.; Du, C.Z. Experimental research on the quasi three-axis hydraulic fracturing of coal. J. China Coal Soc. 2011, 36, 1801–1805. (In Chinese) [Google Scholar]
- Lu, Y.Y.; Cheng, L.; Ge, Z.L.; Xia, B.W.; Li, Q.; Chen, J.F. Analysis on the initial cracking parameters of cross-measure hydraulic fracture in underground coal mines. Energies 2015, 8, 6977–6994. [Google Scholar] [CrossRef]
- Eleni, T.; Dimitrios, G.A.; Theodore, E.M.; Anastasios, C.M. Acoustic emission activity for characterizing fracture of marble under bending. Appl. Sci. 2016, 6. [Google Scholar] [CrossRef]
- Yan, F.Z.; Lin, B.Q.; Zhu, C.J.; Shen, C.M.; Zou, Q.L.; Guo, C.; Liu, T. A novel ECBM extraction technology based on the integration of hydraulic slotting and hydraulic fracturing. J. Nat. Gas Sci. Eng. 2015, 22, 571–579. [Google Scholar] [CrossRef]


| Material | Material Ratio | Compressive Strength (MPa) | Strength of Extension (MPa) | Unit Weight (g/cm3) |
|---|---|---|---|---|
| Rock strata | cement:sand = 1:6.38 | 6.81 | 0.47 | 2.13 |
| Coal seam | coal:cement:gypsum = 3:1:1 | 3.62 | 0.23 | 1.92 |
| Category | σH | σh | σv |
|---|---|---|---|
| Principle stress/MPa | 23.7 | 9.9 | 4.5 |
| θx (The angle between principal stress and x)/° | 39.0 | 94.6 | 51.1 |
| θy (The angle between principal stress and y)/° | 129.1 | 87.8 | 38.9 |
| θz (The angle between principal stress and z)/° | 86.8 | 3.4 | 88.4 |
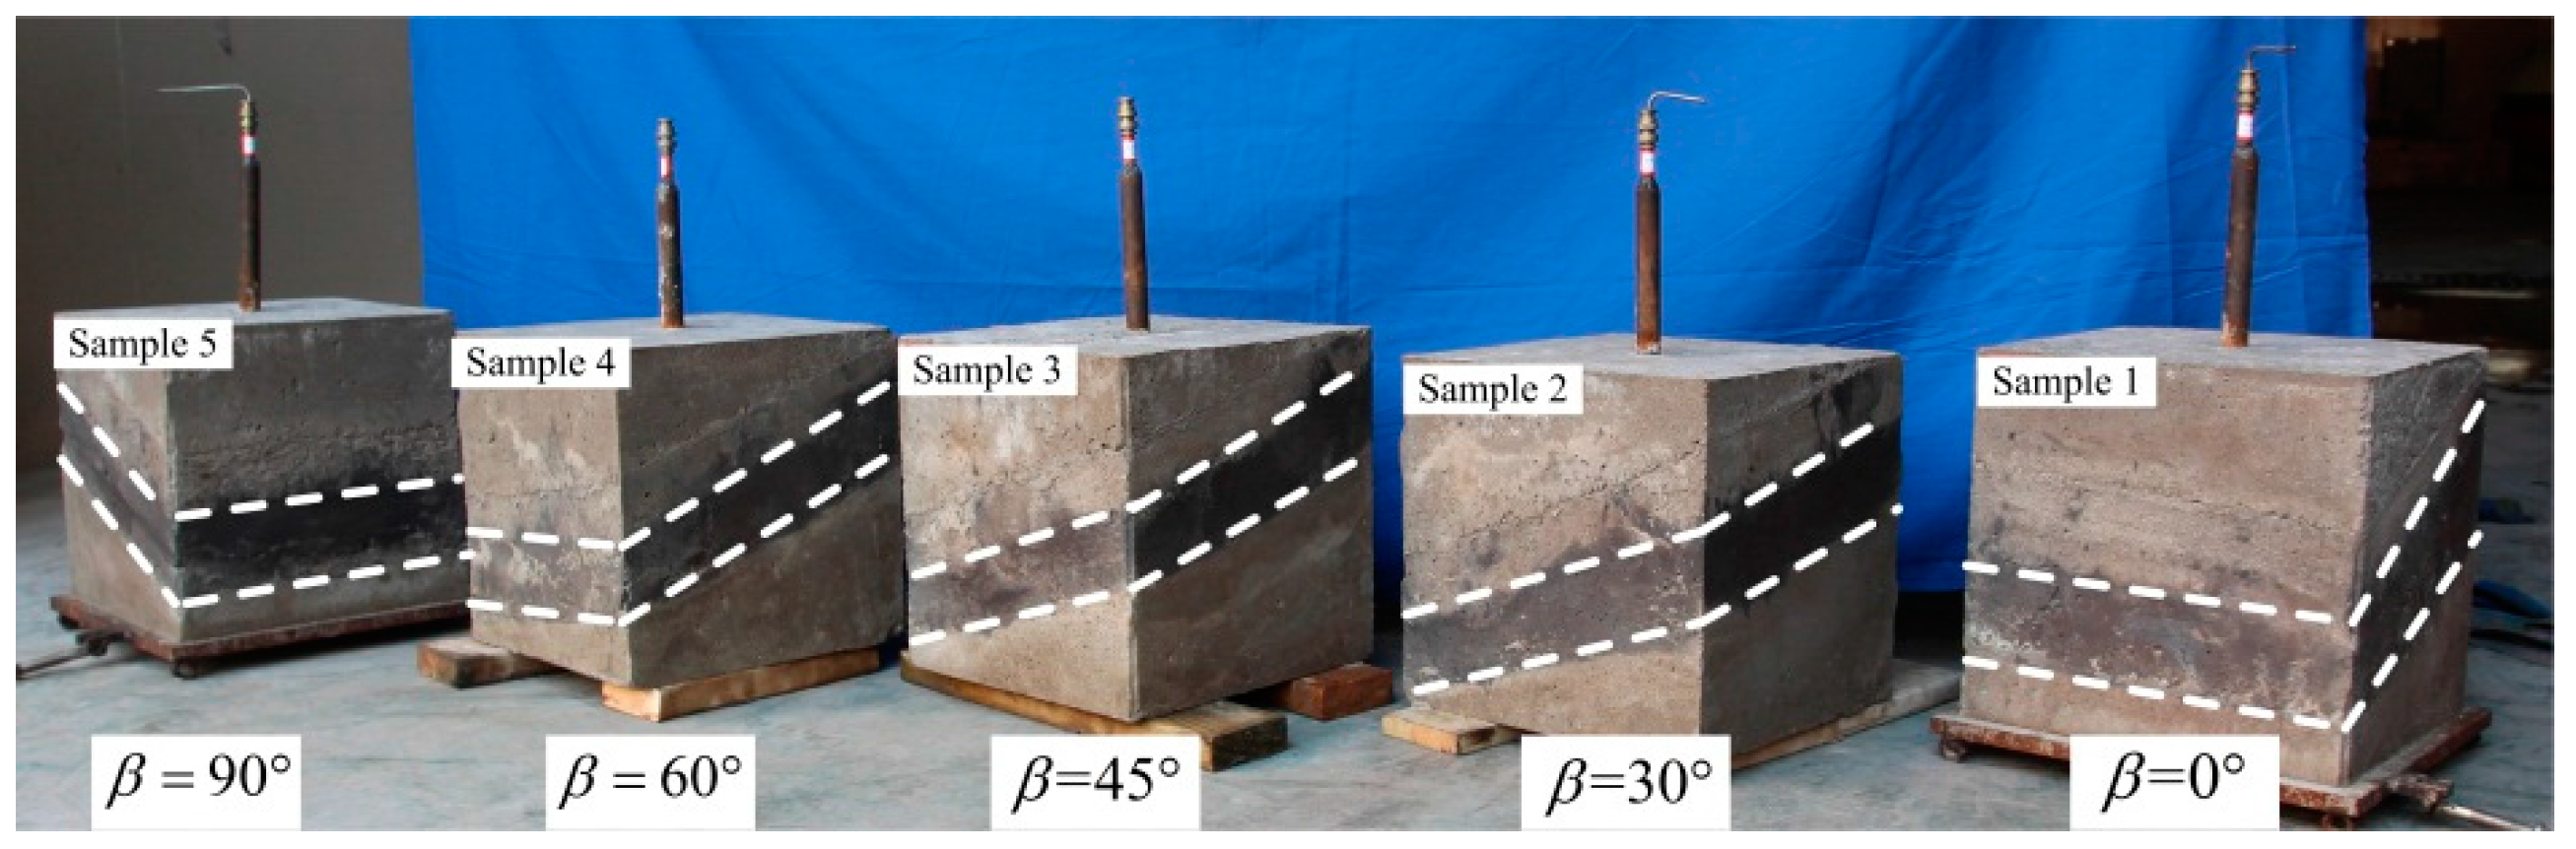
| Sample condition | α = 0°, β = 0°, = 20° | α = 0°, β = 30°, = 20° | α = 0°, β = 45°, = 20° | α = 0°, β = 60°, = 20° | α = 0°, β = 90°, = 20° |
| Fmin | Fmin > 0 | Fmin < 0 | Fmin > 0 | Fmin > 0 | Fmin > 0 |
| Monitor initiation location | in coal-rock interface | in coal seam | in coal-rock interface | in coal-rock interface | in coal-rock interface |
| Fracture shape | 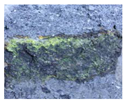 | 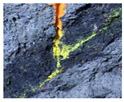 | 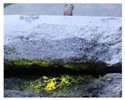 | 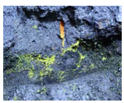 | 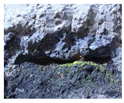 |
© 2016 by the authors; licensee MDPI, Basel, Switzerland. This article is an open access article distributed under the terms and conditions of the Creative Commons Attribution (CC-BY) license (http://creativecommons.org/licenses/by/4.0/).
Share and Cite
Lu, Y.; Cheng, Y.; Ge, Z.; Cheng, L.; Zuo, S.; Zhong, J. Determination of Fracture Initiation Locations during Cross-Measure Drilling for Hydraulic Fracturing of Coal Seams. Energies 2016, 9, 358. https://doi.org/10.3390/en9050358
Lu Y, Cheng Y, Ge Z, Cheng L, Zuo S, Zhong J. Determination of Fracture Initiation Locations during Cross-Measure Drilling for Hydraulic Fracturing of Coal Seams. Energies. 2016; 9(5):358. https://doi.org/10.3390/en9050358
Chicago/Turabian StyleLu, Yiyu, Yugang Cheng, Zhaolong Ge, Liang Cheng, Shaojie Zuo, and Jianyu Zhong. 2016. "Determination of Fracture Initiation Locations during Cross-Measure Drilling for Hydraulic Fracturing of Coal Seams" Energies 9, no. 5: 358. https://doi.org/10.3390/en9050358