Article

Economic Impact of Intelligent Dynamic Control in Urban Outdoor Lighting

Department of Applied Computer Science, AGH University of Science and Technology, Al.Mickiewicza 30, Kraków 30-059, Poland
*
Author to whom correspondence should be addressed.
Energies 2016, 9(5), 314; https://doi.org/10.3390/en9050314
Submission received: 25 February 2016 / Revised: 5 April 2016 / Accepted: 18 April 2016 / Published: 25 April 2016

Abstract

:
This paper presents and compares the possible energy savings in various approaches to outdoor lighting modernization. Several solutions implementable using currently-available systems are presented and discussed. An innovative approach using real-time sensor data is also presented in detail, along with its formal background, based on Artificial Intelligence methods (rule-based systems) and graph transformations. The efficiency of all approaches has been estimated and compared using real-life data recorded at an urban setting. The article also presents other aspects which influence the efficiency and feasibility of intelligent lighting projects, including design quality, design workload and conformance to standards.

1. Introduction

Methods of obtaining energy from renewable resources are well-studied and under constant improvement. However, the other main factor contributing to improvement of sustainability is reduction of power consumption. Consumption reduction techniques are most important in fields which constitute a significant share of global electricity usage.
Outdoor lighting accounts for a fifth of global power usage; according to [1], the actual figure is 19% globally, and around 14% in the European Union. The difference is due to EU’s commitment to replacing legacy technologies, such as incandescent light sources, with eco-friendly ones like Solid State Lighting (SSL, e.g., LED-based fixtures).
The change of technology itself usually yields savings of 40%, though this value may increase depending on the initial technology used and the quality of the existing infrastructure. An additional 30% reduction can be achieved by improving the design quality (thus reducing overlighting) and introducing adaptive or dynamic control of light intensity based on sensor data [2]. SSL can also decrease the maintenance costs, improving the total cost of ownership (TCO) [3].

2. Problem Statement

The intensity of lighting (among other parameters) is defined by the lighting class applied to a given area being illuminated; different lighting class families exist for various types of areas (roads for motor vehicles, pavements, cycle lanes, collision areas, etc.). According to the CEN/TR 13201-1:2004 standard [4], as well as its 2004 predecessor (Currently, due to a transition phase, two versions of the international lighting standard are being used: CEN/TR 13201 from 2004 and the newly-introduced 2014 edition [4,5]. Local regulations exist in various countries; they are either based on the aforementioned standards or defined anew. The actual calculations in the following sections are based on the Polish standard [6], but the scheme of operation presented here is similar to most regulations) [5], the application of a given lighting class within a family depends on a number of parameters. As some of them (such as traffic volume or ambient light) usually change in time, the standards allow for temporary change of the lighting class.
The “ideal” situation occurs when light is adapted to real and up-to-date values of these dynamic parameters. Artificial Intelligence (AI) systems which support both the design phase (by supplying high-quality designs for all alternative classes) and the operation phase (by providing decisions in appropriate time at the scale of a city) are crucial to achieving this result. Their formal background is presented in the paper.
If such an approach is not feasible, certain simplifications need to be made, which introduces several risks and difficulties. One option—common in currently-available systems—is based on predefined dimming schedules. However, they can be used only when the pattern of parameter value variation is well-known [4]. Even then, there is a risk of providing insufficient lighting (and violating the standards) if unpredicted variations occur, which can lead to a range of consequences, from reduced comfort to legal issues.
Several approaches to remedy this problem are possible. A reasonable solution would be to assume “safe” values (i.e., the maximum traffic intensity recorded for a given road section during certain hours). However, this approach may have negative effects on power savings.
The goal of this paper is to propose viable alternatives, such as the aforementioned real-time interactive control based on current sensor values, as well as categorized statistics, an improvement over the predefined schedule method. Each variant is assessed using a real-life scenario and actual traffic levels recorded in several points at an urban setting during a one-year period.
The rest of this paper is organized as follows. Section 3 provides more insight on the solutions which are used in currently deployed outdoor lighting systems. Section 4 describes the issues encountered during the execution of an innovative dynamic lighting control project implemented in Kraków, Poland, including several simplified approaches and their shortcomings. The proposed solution to these issues is described in Section 5, which also compares its estimated efficiency to the other approaches. Finally, Section 6 sums up the paper, provides a discussion of the results and outlines the conclusions from already-completed research as well as the future work.

3. State of the Art

As stated in Section 2, the type of the area to be illuminated (e.g., road, junction, pavement, cycle lane, etc.) defines the lighting class family to be used. Then, by assessing certain parameters, a specific lighting class within that family is applied. For instance, for the “M” class family (applicable to roads for motor vehicles), the parameters include:
  • vehicle speed,
  • traffic volume,
  • traffic composition (motorized only, mixed),
  • carriageway separation,
  • junction density,
  • presence of parked vehicles,
  • ambient light levels,
  • difficulty of navigational task.
Although each road is assigned one base lighting class, an alternative (usually lower) class can be applied temporarily when the values of parameters allow this.
The simplest solutions do not make use of this possibility. They are based on the so-called astronomical clock—given geographic coordinates (either pre-programmed or obtained via GPS), they calculate the sunset and sunrise times and switch the lamps on or off at these times (or with an optional shift value, usually expressed in minutes).
Some more advanced systems also use the astronomical clock to switch the lighting on and off, but also allow for definition of a schedule—hours when an alternative lighting level is to be applied. For instance, the lamp dimming can be set to 70% from midnight until 3 a.m. Of course, these schedules should be based on statistics (e.g., from traffic monitoring systems). Since parameters such as traffic intensity differ from day to day and from month to month, maximum observed values in given hours should be taken. Otherwise, risks of violating standards (usually by providing insufficient lighting), outlined in Section 2, may occur.
This statistics-based approach is popular, as many lighting control systems provide means to implement it. Simple controllers installed in cabinets often include programmable power reducers, which are typically used with mercury or sodium-based luminaires. LED-based solutions offer much more dimming capabilities and are commonly installed together with control systems which allow remote access. These solutions, which include Owlet (Schréder), LightGrid (General Electric) and CityTouch (Philips), provide a Graphical User Interface (GUI) where the user can define dimming levels for specific periods during the night.
Actually, a schedule based on traffic statistics already provides significant energy savings. The unit used for values is daily traffic—the number of vehicles traversing a given road per day. The lighting class is selected using thresholds. Depending on the standard used, they can be expressed in absolute daily traffic values [5] or as percentages of the maximum road capacity (The maximum capacity is defined by [4] as the “maximum rate of flow at which vehicles can be reasonably expected to traverse a point or uniform segment of a lane or carriageway during a specified time period under prevailing road, traffic and control conditions”) [4].
For instance, for a road with ME2 as the base class, the lighting class can be temporarily lowered down to ME3 or ME4. The schedule tells when a particular lighting class (either ME2, ME3 or ME4) has to be met, thus how much the luminaires should be dimmed. The schedule takes the maximum traffic intensity into consideration. An example of real-life daily traffic intensity is given in Figure 1.
Another solution used for dynamic control of outdoor lighting is based on local sensors, usually radars, which affect the operation of a certain luminaire. Although it may seem like a feasible solution, it is burdened with several problems. First, each lamp controls its behavior independently using a local sensor. Therefore, some differences among lamps in a series may occur, which may lead to decreased illuminance uniformity. Second, standards usually require the lighting level to be adjusted not to instantly measured traffic intensity, but to intensity averaged over a certain preceding period of time, e.g., 15 min. Last but not least, photometric design methodologies involve performing calculations for a series of lamp, and a given lighting class should be applied to the entire road segment (see Section 4).
It needs to be noted that the quality of photometric design itself has direct influence on the efficiency of lighting, and the effort needed to prepare the design is one of the factors which determine the feasibility of such projects. Usually, design is performed by hand and verified using an industry-standard software such as DIALux (DIAL GmbH, Lüdenscheid, Germany).
To make such a design process feasible, certain simplifications are applied. For instance, lamps in each series are assumed to be precisely in line and variations of their spacing are ignored This may cause the designs to not fulfill the standards completely, or to be suboptimal with regard to energy efficiency. Fortunately, a new generation of software tools, which automatically calculate the optimum configuration, may remedy this problem. As shown in [7], they can save as much as 15% of power consumed by lamps in the photometric design phase alone.
This issue becomes even more important when dynamic lighting is to be applied. That is because the designer must prepare not only the design for the base lighting class (e.g., ME2), but also designs which assure fulfillment of values for each alternative lighting class (e.g., ME3 and ME4). If other factors, such as the level of ambient light (significant during dusk or dawn), are to be taken into account, it may be necessary to prepare not one, but a few dozen photometric designs for each street. The aforementioned automatic photometric design tools may prove even more useful in such scenario. Moreover, the performance of such tools can be improved e.g., using parallel computations [8,9].
There are multiple references to lighting classes throughout the paper. Any reference to ME3 is actually a reference to ME3b, and ME4 is ME4a. This is to increase the paper’s readability.

4. Current Issues

The current issues, described below, are based on experiences from the Inteligentne Sieci Energetyczne (ISE) Project, an LED retrofit and dynamic lighting control project executed in Kraków, Poland. The project entails implementation of an intelligent lighting system for 3768 newly-installed LED luminaires.

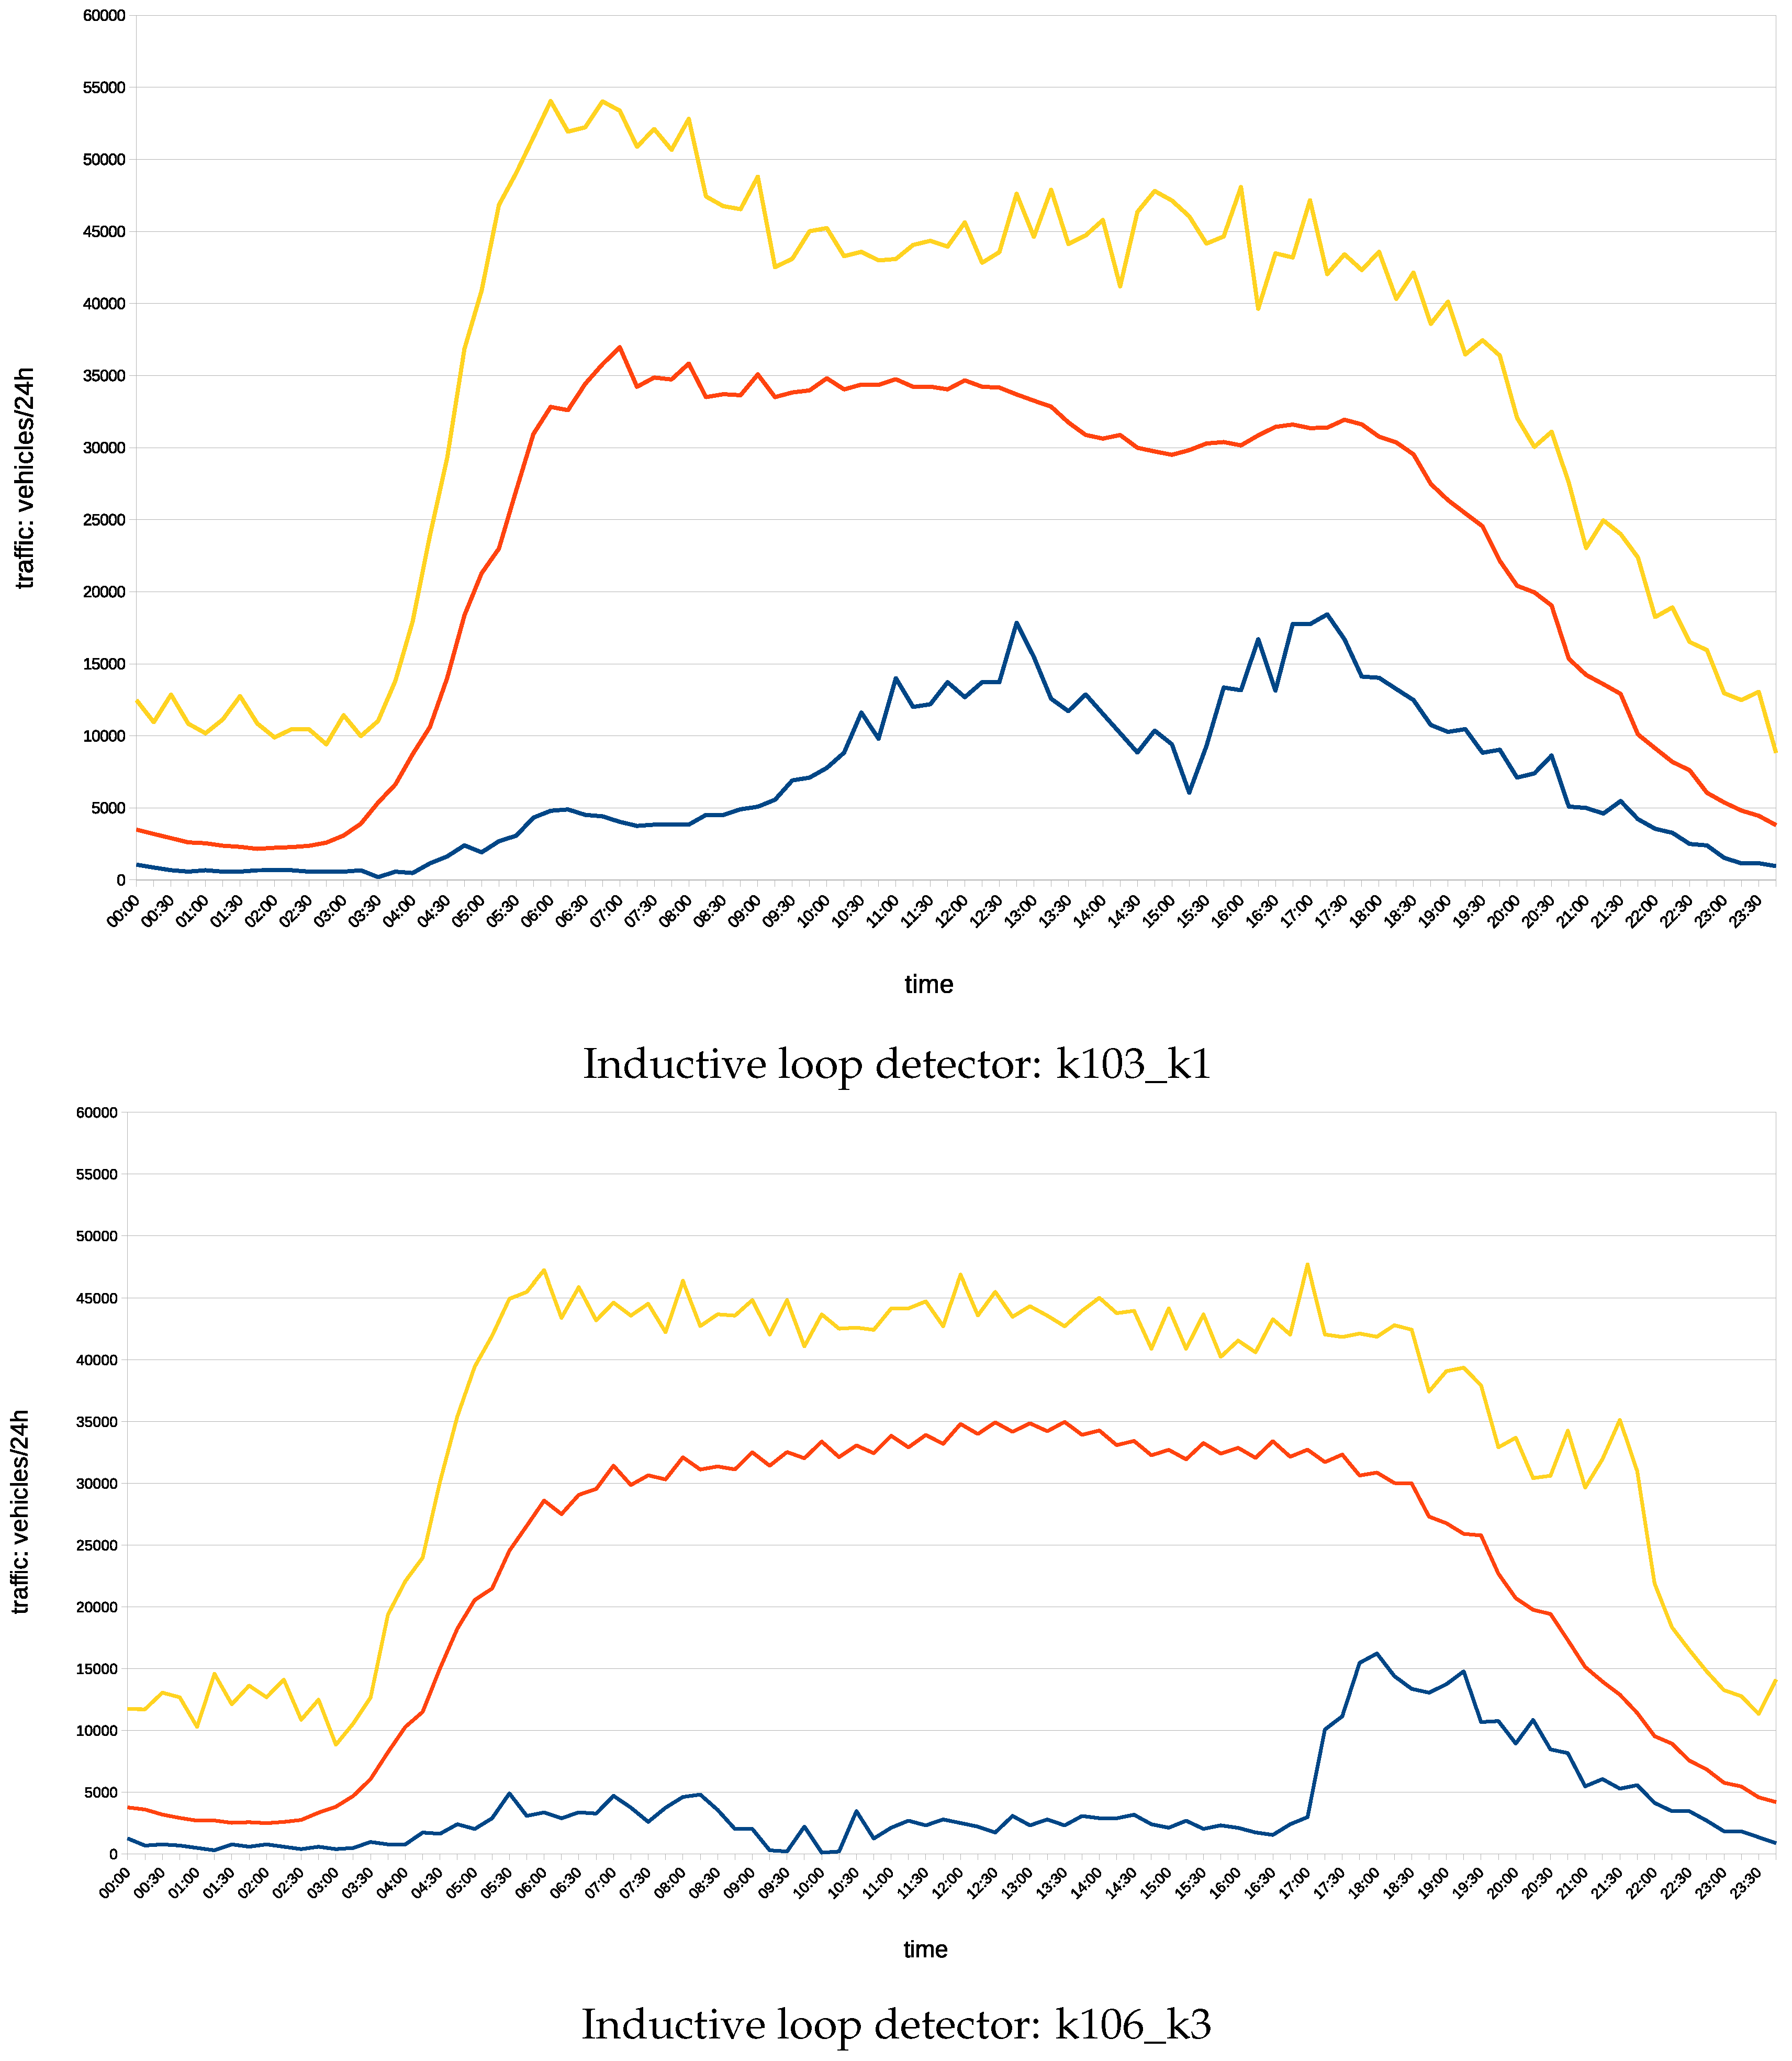
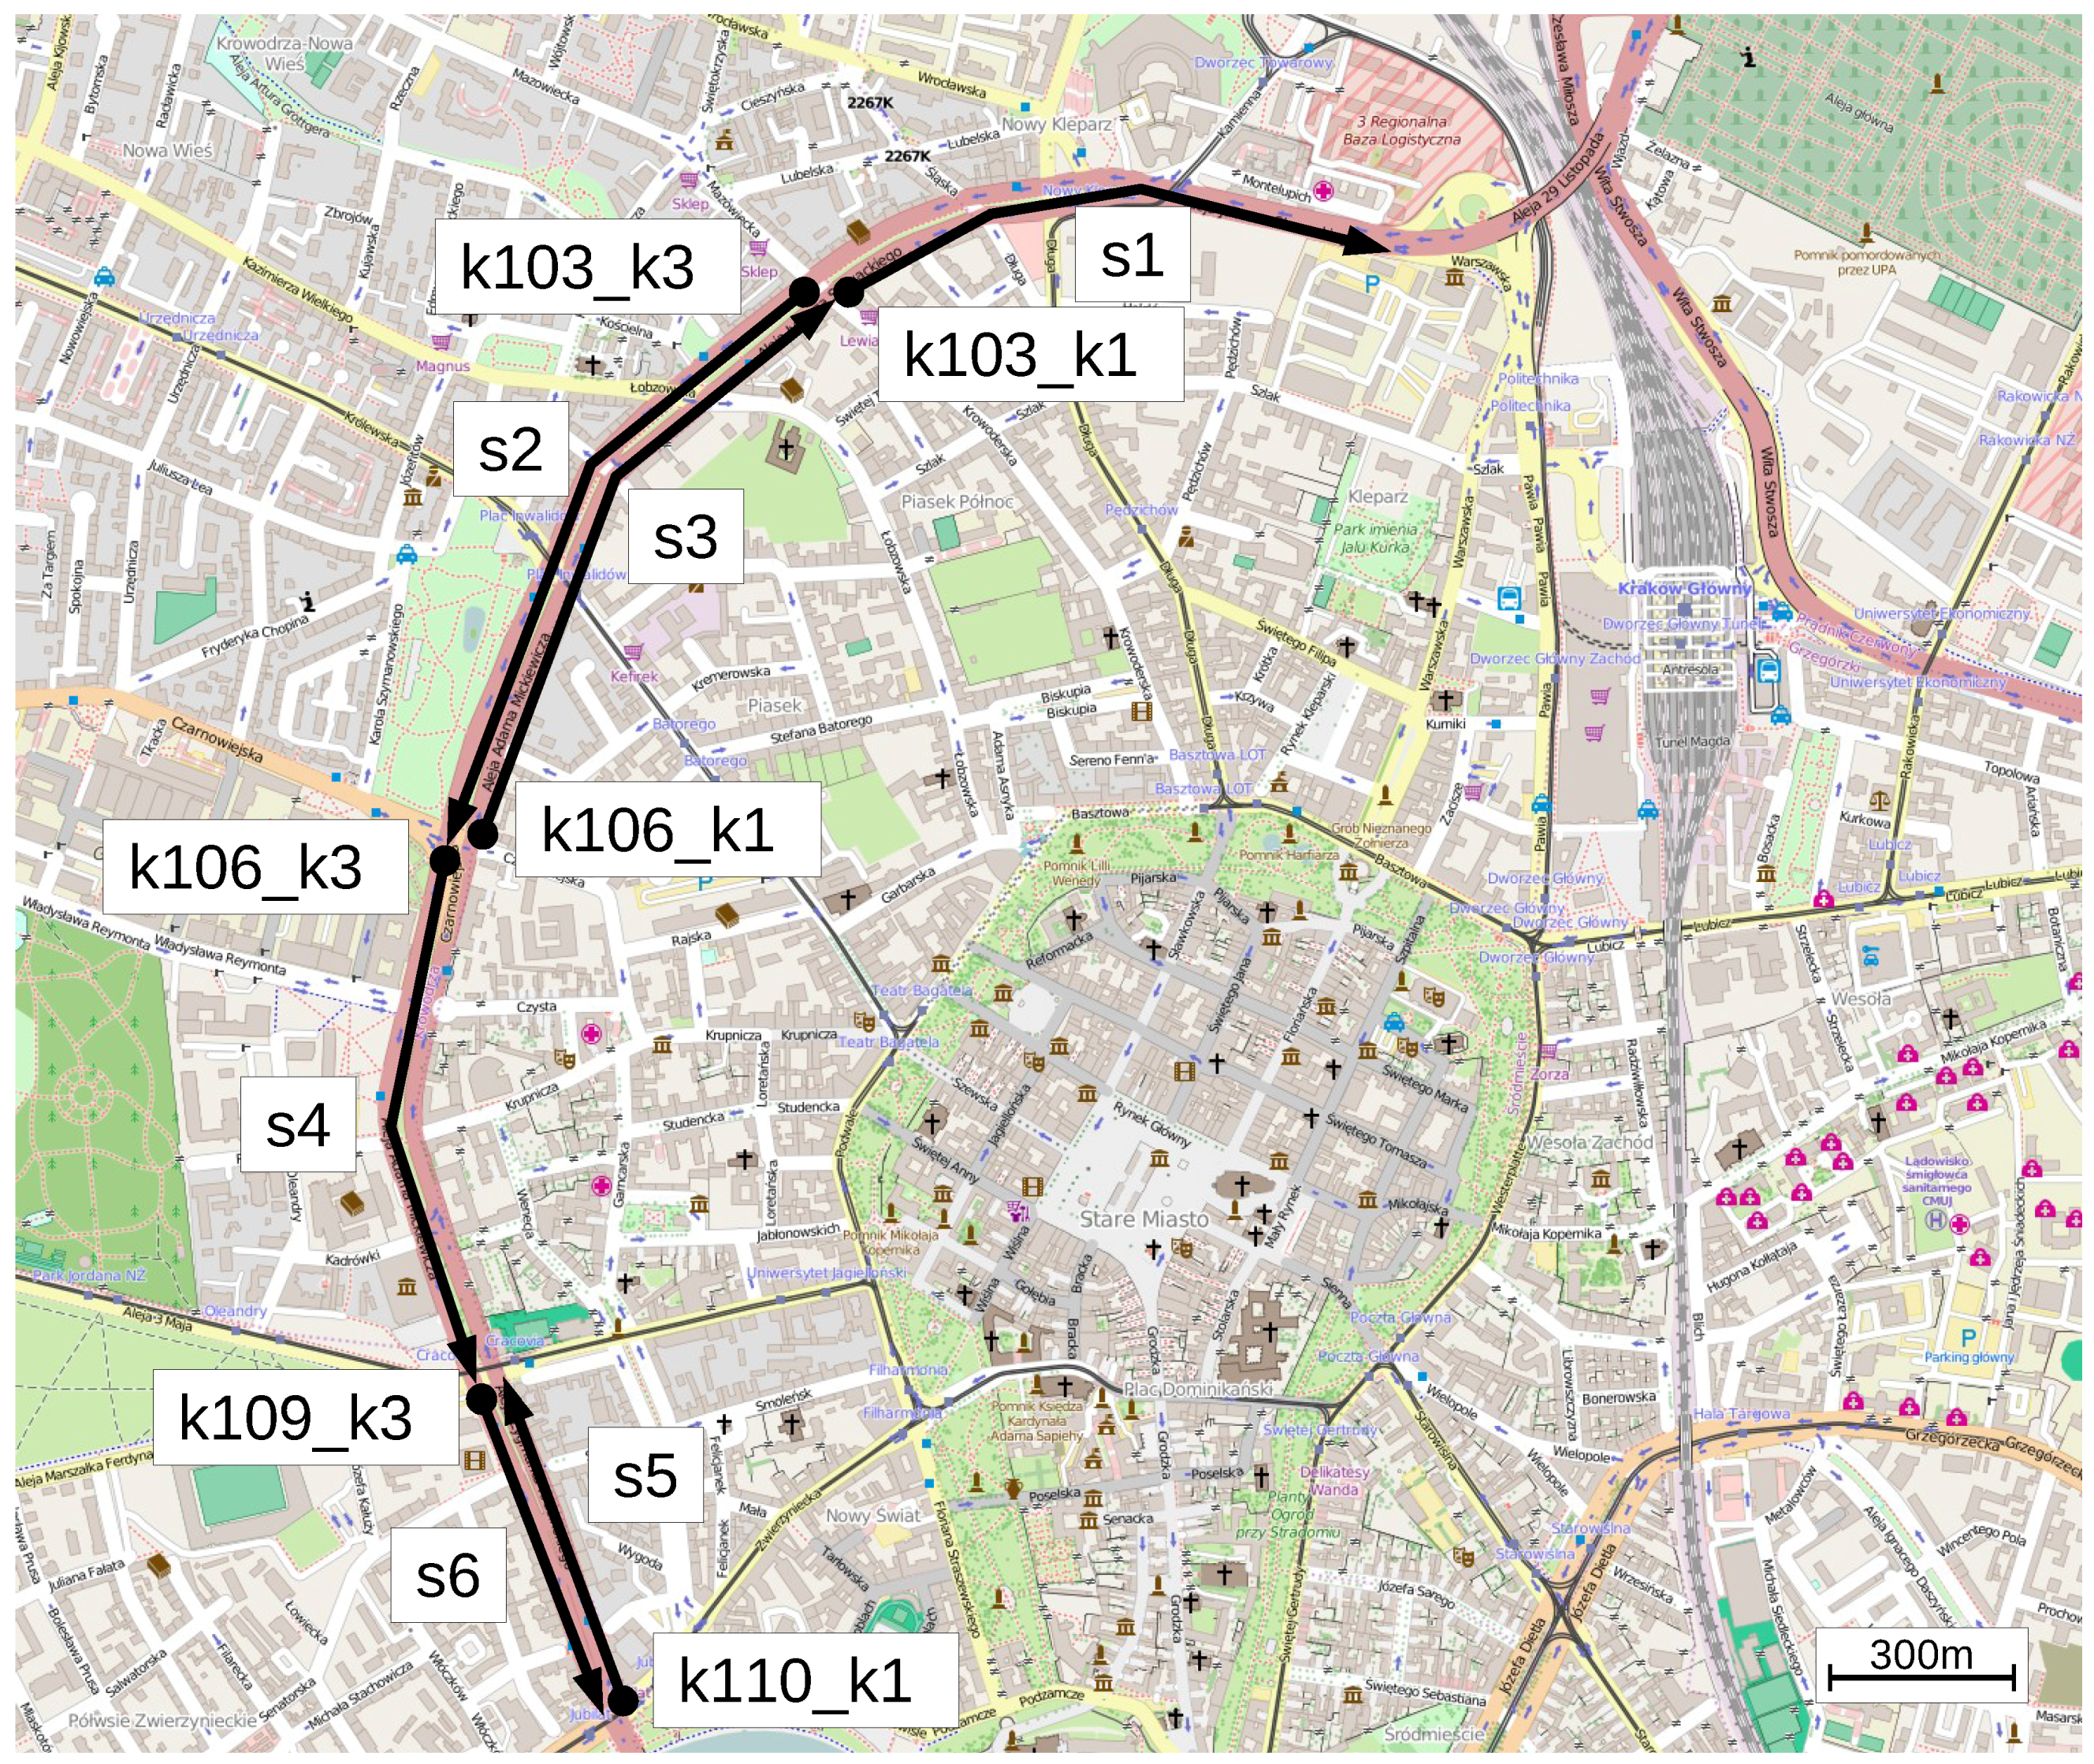
4.1. Description of the Analyzed Case

Let us consider an example street presented in Figure 2. It is divided into segments (A segment is a defined area, on which a certain lighting standard is to be achieved. In case of cities, a segment will usually be defined as part of a street, with granularity appropriate to achieve the desired level of control independence) indicated with arrows: s1–s6. The 100 luminaires within the indicated segments can be controlled independently. The average distance between neighboring luminaires is 34 m. Each luminaire is equipped with a 71-watt, linearly-dimmable and controllable LED light source. According to the astronomical clock, in Kraków, there are 4286 on-hours (hours when the lamps are on) during the year. The base lighting class for the street is ME2. Each segment is equipped with inductive loop traffic intensity detectors labeled as: k103_k3, k103_k1, k106_k3, k106_k1, k109_k3, k110_k1.

4.2. Simple Traffic Statistics Approach

Since the lighting class can be lowered due to lower traffic intensity, traffic statistics need to be calculated. The data originates from the aforementioned inductive loops. Analysis results of one year of data from two detectors, k103_k1 and k106_k3, are shown in Figure 1. Traffic intensity is measured with a 15-min interval and normalized to daily traffic intensity. Minimum, maximum and average traffic intensities are shown. It is assumed that the traffic intensity for a given time can be predicted based on prior knowledge of its maximum intensity for a given 15-min slot based on one year of observations. As shown in Figure 1, the traffic significantly differs depending on location, and the minimum-maximum spread is noticeable.
Using a control system with a schedule based on statistical traffic intensity values will result in ME2 being needed for only 51% of the total on-time. The luminaires can be dimmed down to meet ME3 throughout 25% of the on-time, while, during the rest (24%), even more dimming can be applied to meet ME4. Taking into account the particular wattage and dimming characteristics of the luminaires under consideration, it results in 20% of total energy savings compared to the astronomical clock approach.

4.3. Categorized Statistics Approach

Using one set of traffic intensity statistics throughout the year is far from optimal. As shown in Figure 1, the spread of traffic measured during the same hours in different days is significant. For instance, during the 4:00–4:15 a.m. time slot, the minimum traffic intensity recorded by detector k103_k1 is 500 vehicles/day, while the maximum is 17,500 vehicles/day. This spread is caused by lack of categorization. A hypothesis is that traffic varies for working days, holidays, Saturdays and Sundays. Traffic-based schedules prepared using such categorized statistics confirm the hypothesis, yielding better results. Establishing a separate schedule for working days, holidays, Saturdays and Sundays results in the following. The lighting is turned on and off by the astronomical clock, and an appropriate daily schedule is used for dimming depending on the date. The ME2 class is required only for 46.5%, ME3 for 15%, while the most power-efficient ME4 is used for 38.5% of the on-time. It leads to 24% savings, compared to the astronomical clock approach.

4.4. Shortcomings of Schemes Based on Statistics

The statistics-based approach provides significant savings; however, it is flawed by design. First, current traffic estimation is based on maximum historical traffic for a given time slot. While it is rather safe to assume that current traffic will not exceed the historical maximum, it might actually be much lower. Categorization helps but does not solve the problem completely; this is confirmed by the fact the spread of the traffic intensity for each of the time slots is still significant. Such an overestimation decreases energy savings.
Furthermore, it cannot be guaranteed that the actual traffic intensity is not greater than the historical maximum. In the case of traffic intensity surpassing that historical maximum, there might be insufficient light emitted, which results in violating lighting standards. This might lead to legal issues, and is especially significant if inappropriately dimmed lighting reduces traffic safety. If traffic accidents occur in such circumstances, the lighting operator may be liable for damages.
To resolve the aforementioned problems, dimming has to depend not on statistics, but on real-time data regarding traffic intensity. A logical connection between sensors, luminaires and segments enabling intelligent control needs to be established and appropriate data flows regarding sensors and actuators have to be defined.

5. Proposed Solution

There are two major requirements a successful intelligent control system has to fulfill: (1) compliance with regulations and (2) situation awareness. Compliance with regulations ensures that lighting standards are met under any circumstances. Situation awareness precisely defines these circumstances in terms of semantic, spatial, qualitative and quantitative relationships among components of the environment being considered.
The proposed solution is built around a formal specification of architectural features, sensors and actuators. Coupled together with precise photometric calculations, it forms an intelligent environment model expressed in the form of a labeled and attributed graph. The model is fed with data from sensors and provides information that is sent to actuators engaging appropriate lighting. It is achieved through an inference process based on rules expressed as graph transformations [10]. Sensor and actuator information are represented as attributes.

5.1. Description of the Model

The core concept of the model is a lighting profile. It is a set of parameters for lighting points that need to be established in order to meet certain lighting conditions at given circumstances. A profile is always activated at a given segment. As defined previously, a segment is the smallest physical area with uniform lighting requirements. For each profile at a given segment, there are pre-calculated lighting point configurations, obtained through photometric calculations. In order to activate a given profile, selected configurations (usually dimming levels) within the segment are applied to the luminaires. The circumstances are defined as information originating from sensors. The sensors detect certain conditions such as motion, direction, presence, etc. at a given segment. The above relationships are expressed as the so-called Control Availability Graph (CAG). It is defined as an attributed graph over the set of node labels L V and the set of edge labels L E , G = ( V , E , l a b V , l a b E , L V , L E , a t t V , a t t E , A V , A E ) , where:
  • V is a finite, nonempty set of graph nodes identified unambiguously by some injective indexing function I n d e x : V IS , where IS is a set of indexing symbols (usually N is used but in some cases it is easier to provide arbitrary symbols to increase readability),
  • E V × V is a set of edges,
  • l a b V : V L V is a node labeling function,
  • l a b E : E L E is an edge labeling function,
  • L V and L E are sets of node and edge attributes respectively, L V = { s , l , d , c } , where:
    s is the label of vertices representing segments,
    l labels nodes representing luminaires,
    d is the label of nodes representing any sensor device (traffic intensity, presence, movement, etc.),
    c is the label of the node representing a set of adjustments, a configuration, associated with a relevant set of segments and lamps.
  • a t t V : V × intent 2 A V (it allows for having multiple values for a single attribute at a vertex),
  • a t t E : E × A E Y E are attributing functions for nodes and edges respectively, such that a t t X ( x X , a A X ) Y X is a value of the attribute a, for the element x X , where X = V , E .

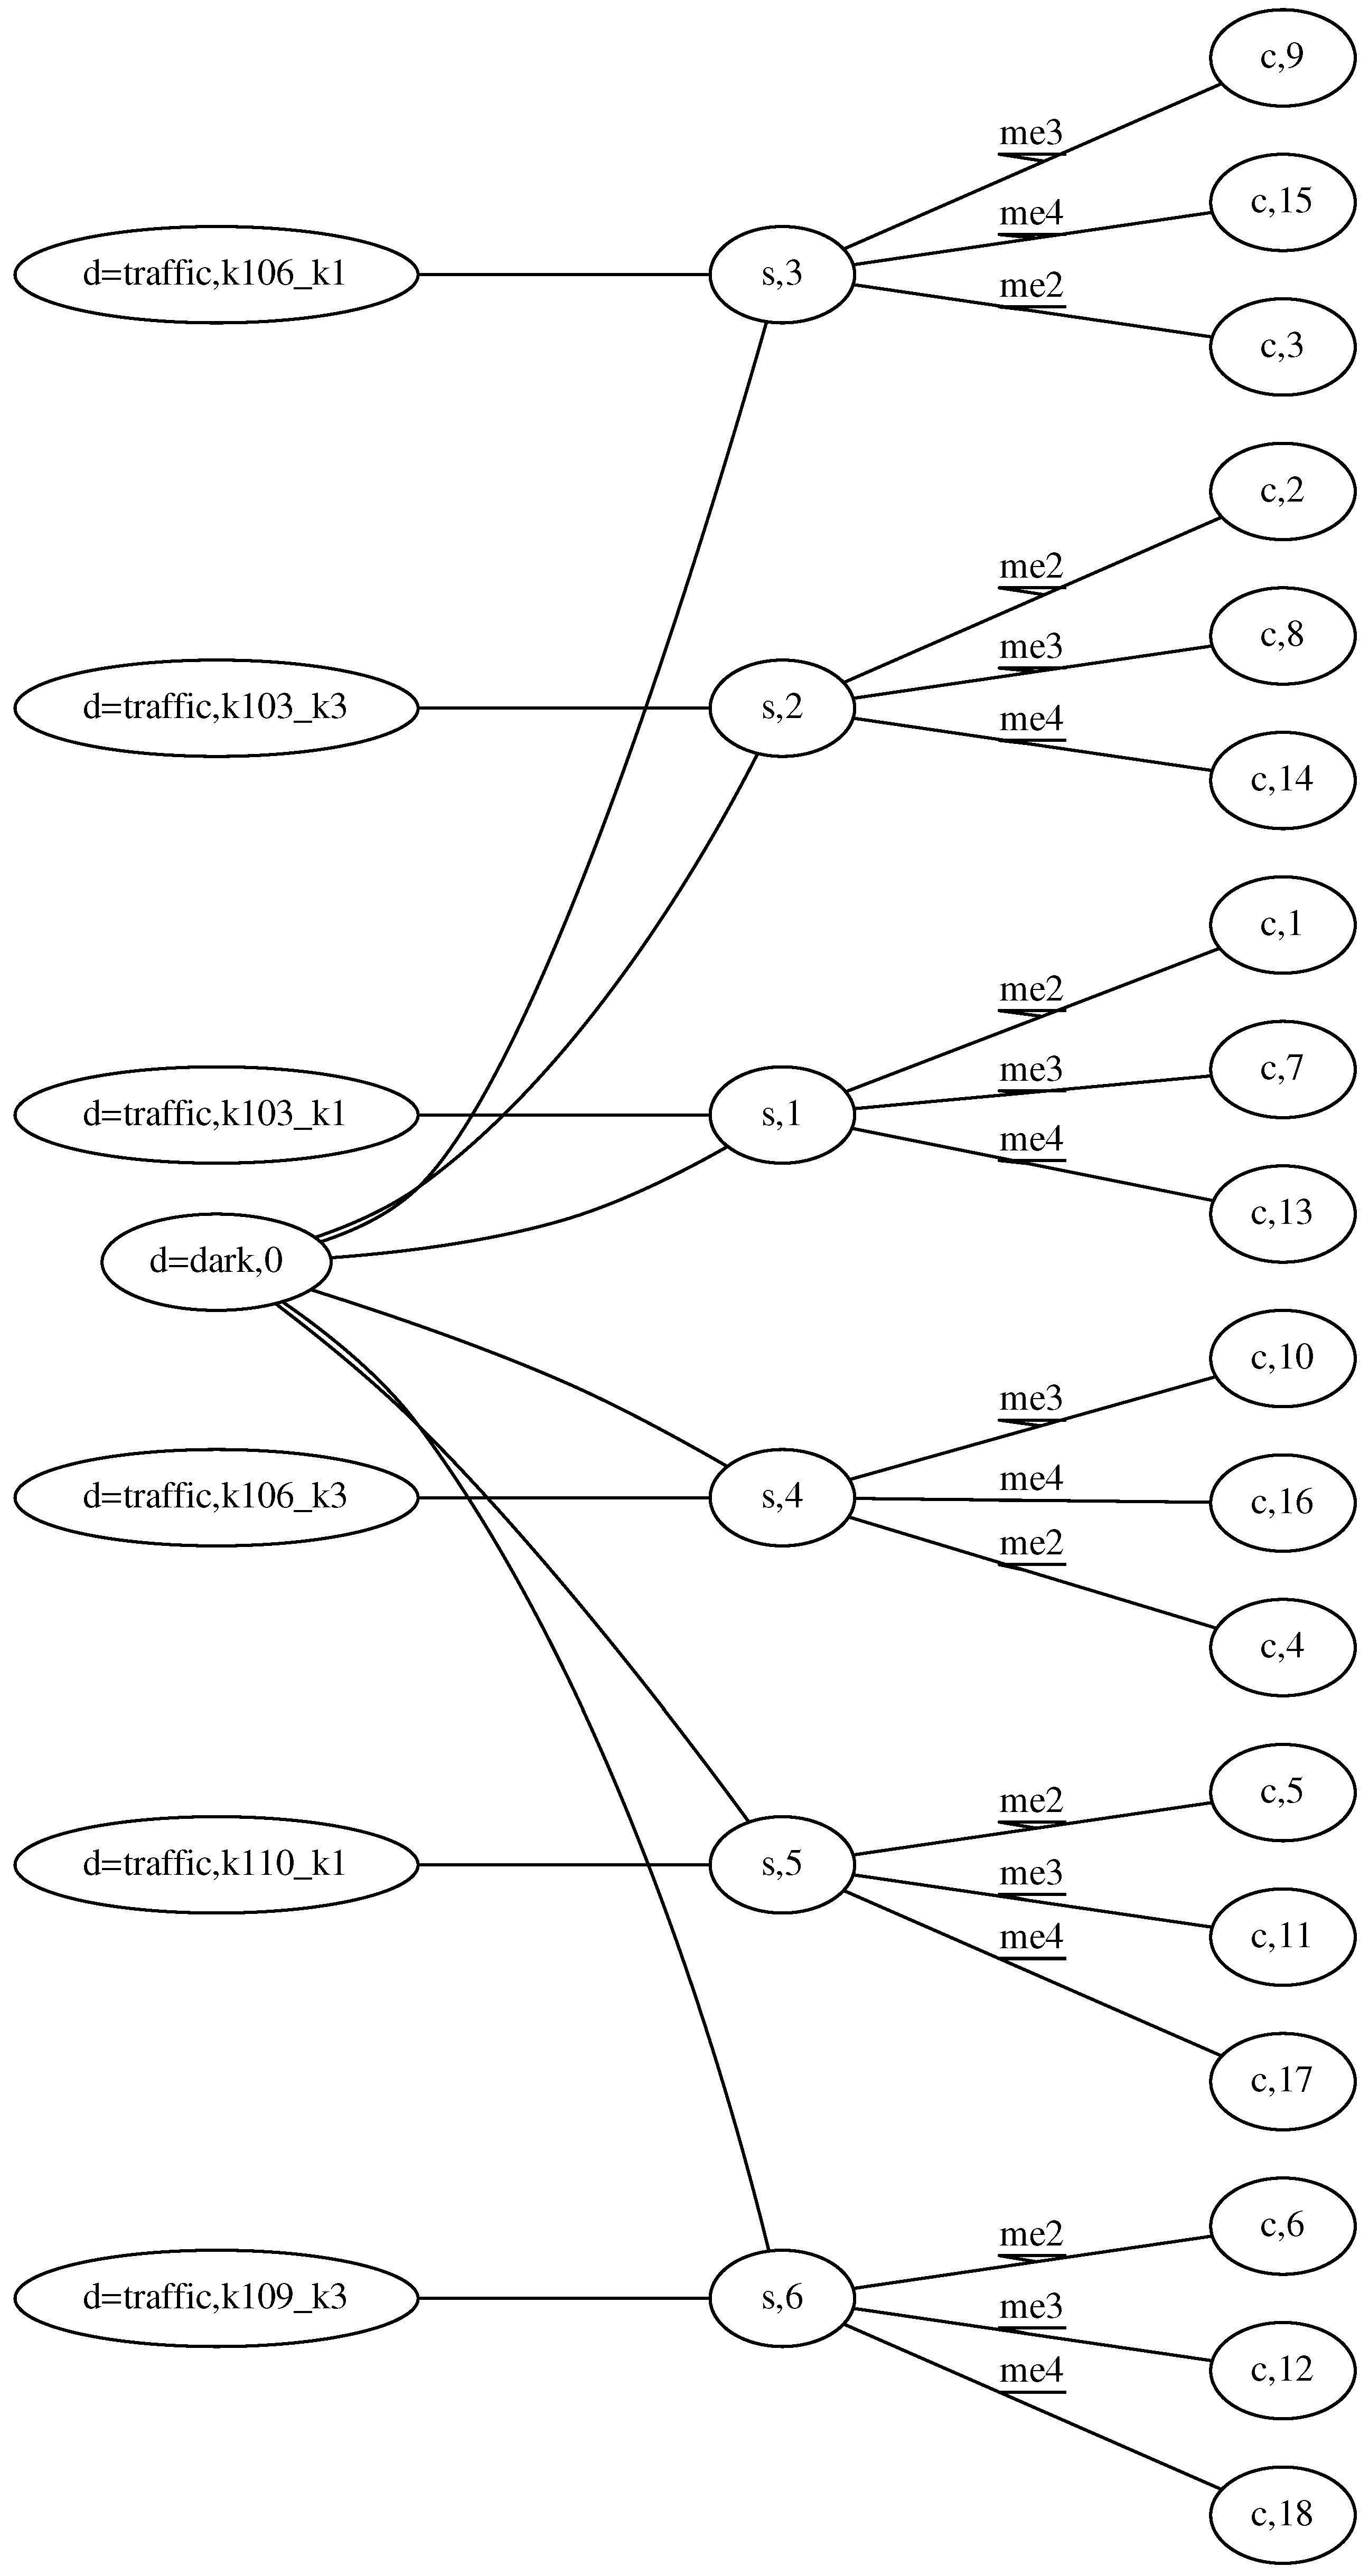
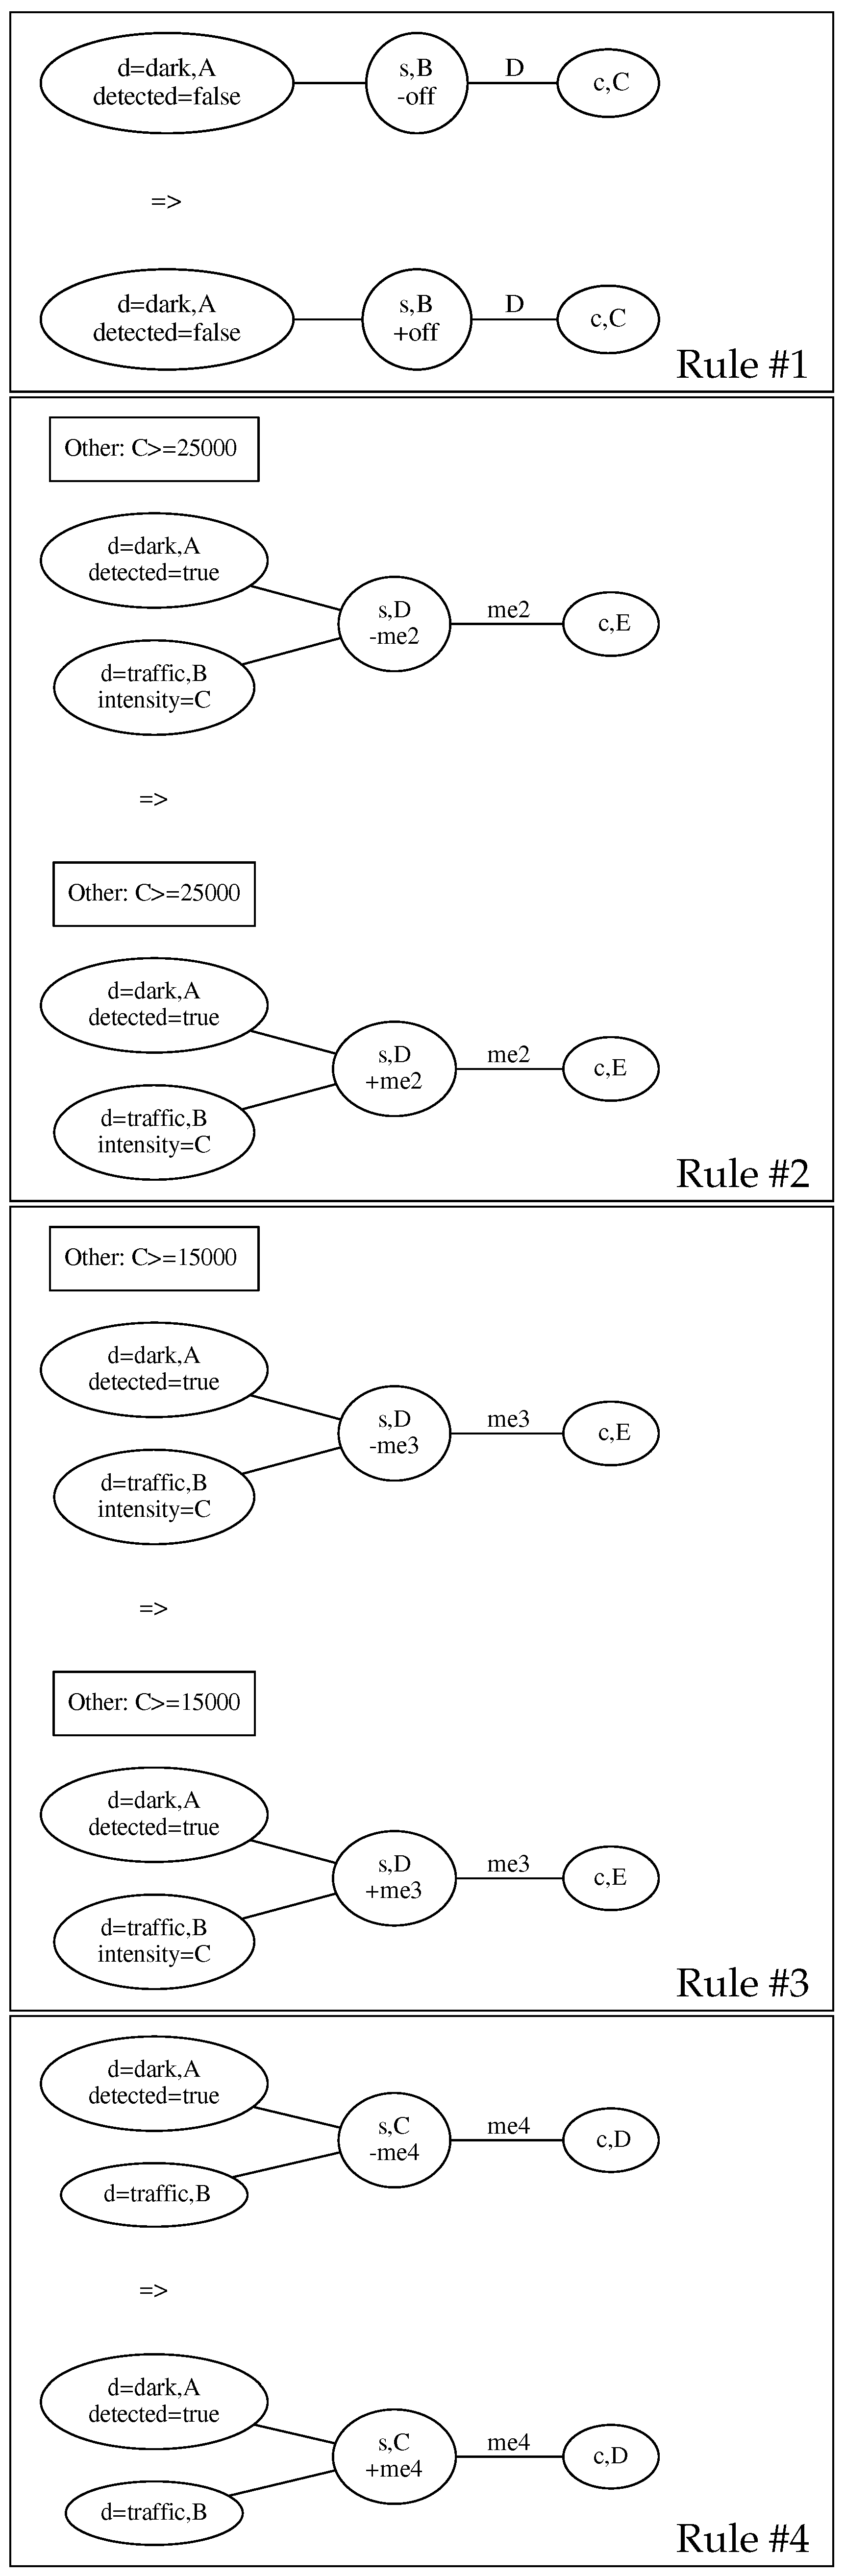
5.2. Example of Application to the Considered Case

A simplified Control Availability Graph which represents logical relationships among segments (s), sensors (d) and configurations (c), is shown in Figure 3. It does not show the representation of the actual luminaires in order to increase readability—otherwise, there would be an additional one hundred vertices presented. There are labels and indices given and, in the case of d vertices which represent sensors, values of the class attribute. They are provided at the vertex label in a short form: vertex-label = class-attribute-value. The class attribute indicates the value a particular sensor measures. In the presented case, there are two classes: traffic and dark. Edges between segments and configurations are labeled with lighting profile names. They signify that in order to obtain a certain lighting profile at a given segment, the corresponding configuration should be activated. Actual luminaire parameters are given as edge attributes between configurations and luminaires (which are not shown in the figure). Luminaire configurations are pre-calculated during the photometric design phase for all applicable profiles.
There are the following rules for controlling the outdoor lighting depending on traffic intensity, based on and in compliance with [6] (as well as [5], which is identical in that respect).
  • If it is not dark, turn lights off.
  • If it is dark and traffic intensity for past 15 min is more than or equal to 25,000 vehicles per 24 h, establish ME2.
  • If it is dark and traffic intensity for past 15 min is more than or equal to 15,000 vehicles per 24 h, establish ME3.
  • If it is dark, establish ME4.
Dynamic intelligent control for the environment described by the proposed Control Availability Graph is based on graph transformations. They are so-called trivial transformations, since they only transform a graph’s attributes. The transformations define what should happen upon certain changes of the input values measured by sensors. These changes are represented either by providing additional structural components (vertices or edges) or attributing existing ones. This approach is similar to the one based on rules, also referred to as Artificial Intelligence (AI) control. The rule-based approach has already proved to be suitable for control purposes [11,12,13,14]. The difference is that the knowledge representation model and its processing is formally based on graphs.
To give an example, let us assume that there is an initial graph G which is transformed into the target graph G as a result of applying certain transformations which implement dynamic intelligent control. Thus, after the transformation, G contains information to be sent to actuators so they can carry out the actual control. The graphs are denoted as:
G = ( V , E , l a b V , l a b E , L V , L E , a t t V , a t t E , A V , A E ) ,
G = ( V , E , l a b V , l a b E , L V , L E , a t t V , a t t E , A V , A E ) .
Transformation examples are given below.
Actual graph transformations are split into the following stages:
  • intention generation,
  • intention resolution.
Splitting the control process into stages prevents recursive inference [15]. That makes it suitable for implementation of the inference engine and transformations, even if it needs to be deployed directly in a resource-constrained embedded street light controller.
Stage 1 generates attribute values at s indicating an intention, e.g., activation of a given lighting profile at a given segment. Multiple intentions, even contradictory, may occur at the same time. Stage 2 resolves the intentions according to the provided transformations. It reduces the intent set to a single value. This value is in turn assigned to an attribute at c, indicating the profile to be activated.
The transformations covering intentions are shown in Figure 4. Capital letters are variables which are instantiated with matching indices while executing the graph transformations. Additional constraints in terms of attribute values or variable values are also given. Attribute value constraints are given at the vertices, while variable value constraints are given in separate rectangular boxes. Thus, the transformation for rule #1 can be read as follows:
Find three vertices: d, s and c, such that:
  • A, B, C are indices of the identified vertices,
  • d attribute are as follows: class = dark, detected = false,
  • there is no attribute intent set to off at s (minus sign at the vertex),
  • there is some label at the edge between s and c.
For the established values of A, B, C and D, add an attribute intent equal to off at s (plus sign at the vertex).
This graphical representation can be expressed as an algebraic counterpart shown as Transformation 1:
k , s , c V , ( k , s ) , ( s , c ) E , x L E : k , s , c V , ( k , s ) , l a b V ( k ) = D , a t t V ( k , class ) = d a r k , a t t V ( k , detected ) = f a l s e , k , s , c V , ( k , s ) , l a b V ( k ) = D , l a b V ( s ) = S , off a t t V ( s , intent ) , k , s , c V , ( k , s ) , l a b V ( k ) = D , l a b V ( c ) = C , l a b E ( ( s , c ) ) = x a t t V ( s , intent ) = a t t V ( s , intent ) { off } .
Stage 2 is performed in a similar way. It provides intention resolution, replacing multiple intents with a single action to be performed in terms of appropriate attribute values. In the case of the proposed master lighting control system, that action would be activation of a certain light profile. Formally, it reduces the set of attribute values at a given vertex to a single value.
Let us consider a rule stating that: if there is an intention of switching off the lights, and there is no intention of switching to profile ME2 or ME3 or ME4 at s, turn all lighting configurations off (set attribute engage to off at each corresponding c).The rule is provided as a trivial Transformation 2:
s , c 1 , c 2 , c 3 V , ( s , c 1 ) , ( s , c 2 ) , ( s , c 3 ) E : s , c 1 , c 2 , c 3 V l a b V ( s ) = S , ME 2 , ME 3 , ME 4 a t t V ( s , intent ) , off a t t V ( s , intent ) , l a b V ( c 1 ) = C 1 , l a b E ( ( s , c 1 ) ) = ME 2 , l a b V ( c 2 ) = C 2 , l a b E ( ( s , c 2 ) ) = ME 3 , l a b V ( c 3 ) = C 3 , l a b E ( ( s , c 3 ) ) = ME 4 a t t V ( s , intent ) = , a t t V ( c 1 , engage ) = off , a t t V ( c 2 , engage ) = off , a t t V ( c 3 , engage ) = off .
This way, dynamic intelligent control is provided by switching profiles upon certain events. The events are triggered by appropriate attributing of CAG’s vertices representing sensors. The control process is implemented by applying graph transformations, which represent control logic in the aforementioned stages. The results of the transformations are expressed by applying attributes to certain vertices, which correspond to actuators [16]. Lighting profiles are switched for each of the segments independently. However, more sophisticated control rules introducing dependencies regarding, for instance, switching lighting profiles in neighbouring segments, can be easily provided. Such a feature finds its application for example in tunnel lighting where, according to the standards, the gradient of light intensity when entering and leaving the tunnel has to meet certain criteria.
The CAG’s vertices corresponding to sensors are attributed with sensor data. The data is read from already deployed inductive loop sensors which are part of the city’s Intelligent Transportation System (ITS) (The major role of the existing ITS is to provide traffic control through traffic light optimization). The actual readings are provided through the ITS’s Application Programming Interface (API), which allows for obtaining traffic intensity data from each of the sensors. Applying the graph transformations presented above leads to appropriate configuration attribution indicating which particular configuration is active on a given segment. It directly translates to assignment of certain, pre-calculated configuration parameters to particular luminaires (luminaires and their attributions are not showed due to readability reasons). Then, the configuration parameters are sent directly to the particular luminaires using their lighting control system’s API. The proposed solution works as a master lighting control system obtaining data from ITS and sending control commands to luminaires through their respective remote control systems. Multiple ITS and luminaire control systems can be covered in a single deployment.
The proposed solution is based on formal graph representation and graph transformations. However, application of actual transformations and graph labeling is implemented as a rule-based forward-chaining inference engine. It employs pattern matching on CAG to match the left hand side of the graph transformations and provides the appropriate attribution. It ensures that all transformations are applied if the corresponding left hand sides match any subgraphs. The use of pattern matching and rule-based forward-chaining classify the proposed approach as AI-based.

5.3. Efficiency of the Proposed Approach

In the considered scenario, applying the proposed intelligent control approach leads to an additional 10% of savings compared with the categorized statistics approach (cf. Section 4.3), giving 34% savings in total. A detailed comparison is given in Table 1. It shows the percentage participation of applicable lighting classes during on-time, the annual energy consumption of the considered area and the energy savings for the discussed approaches.
Furthermore, the proposed intelligent control does not trigger additional infrastructure costs in the considered case of the ISE Project. The inductive loop sensors being used are already part of the street infrastructure at almost every junction controlled using traffic lights, and traffic information is available through the ITS.
It needs to be pointed out that energy savings are not the only significant factor in a general case of such a setup. Upfront investment for obtaining traffic information and controlling individual luminaires need to be taken into consideration. Deployment of traffic sensors is one factor which can significantly increase investment costs. In the case presented here, this cost is negligible since an ITS has already been deployed and offers traffic data through a well-defined API. Lighting control systems allowing for the aforementioned dimming of individual luminaires, while quite expensive a few years ago, are becoming more and more economically feasible, and are in fact a standard in many outdoor lighting retrofit projects. They also offer additional benefits, such as luminaire health monitoring, including malfunction detection and maintenance planning. Malfunction detection not only regards luminaire failure but also addresses problems with infrastructure damage due to traffic accidents, construction works or theft. In general, it reduces the owner’s operational costs of such an installation. Furthermore, leading outdoor lighting vendors, such as Schréder, have begun offering remote control features at no additional charge. Thus, new outdoor lighting installations become more and more controllable, and, together with ITS, they form components necessary to implement smart city concepts [17]. They stimulate urban development and improve the quality of life.
The proposed separation of the model and controlling rules results in scalability. Extending CAG’s coverage to other segments does not require altering the rules or the graph transformations. Thus, to enable the entire city’s outdoor lighting infrastructure to be controlled by the proposed system, codenamed PhoCa Control, only requires an update of the CAG and integration of traffic intensity data sources and luminaries’ controllers with the system.

6. Conclusions

In this paper, the economic impacts of various approaches to modernization of outdoor lighting infrastructures have been estimated and presented. It has been shown that merely replacing old luminaires with SSL (e.g., LEDs) does not utilize the full potential of the light sources based on the new technology. Several options have been presented: from static global dimming schedules, through categorized schedules which take additional parameters (e.g., day of week, holidays) into account, to truly dynamic lighting based on traffic intensity sensors.
Rule-based systems, based of the formal background of graph transformations, efficiently support the coordination of sensor information with the dimming of lighting points. The presented results, based on work performed within an intelligent lighting project in Kraków, Poland (which involves almost 4000 luminaires), show that dynamic lighting may reduce the power consumption of a simple LED retrofit by over a third. In addition, in many cases, such control can be introduced with little to no investments in the infrastructure.
Let us note that in the scope of the European Union, each 1% of reduction of energy consumption is equivalent to generation of 30 TWh of energy. Globally, 34% reduction of power consumed by outdoor lighting would be equivalent to twice the worldwide wind farm generation [18].
The presented solution would not be feasible without automation of the design process [7,8]. This is due to the fact that design is usually performed by hand and relies on the designer’s experience and intuition.Only then is it verified by computer software with regard to fulfillment of lighting standards.
Automatic photometric design tools, such as PhoCa Design, may reduce a human designer’s workload and shift most of the work towards the computer (Additional economic benefits may come from better photometric design. Existing installations suffer from imprecise design, which leads to overlighting).This yields better results, as the system automatically selects the optimal configuration. Moreover, certain simplifications usually made by designers (regarding uneven or non-linear lamp spacing) can be avoided.
Dynamic, adaptive control requires the design process to be repeated several times in order to obtain the parameters which guarantee fulfillment of several different lighting standards, resulting in multiple designs. Providing these designs takes time and money; hence, the benefit of automatic design tools is even more significant in this scenario.

Acknowledgments

The paper is partially supported by AGH UST research project 9.9.120.527.

Author Contributions

The lighting profile and the profile switching concepts were developed by all authors. The graph transformations were verified by Leszek Kotulski. Implementation of the transformations, the inference process, the rules and the inference engine were designed and developed by Igor Wojnicki. Result verification was performed by Sebastian Ernst.

Conflicts of Interest

The authors declare no conflict of interest.

References

  1. European Commission. Green Paper: Lighting the Future. Accelerating the Deployment of Innovative Lighting Technologies; Technical Report; European Commission: Brussels, Belgium, 2011. [Google Scholar]
  2. Flaig, K.; Wikens, M. Lighting the Way Ahead: Second Strategic Agenda in Photonics; Technical Report; European Technology Platform Photonics21: Stuttgart, Germany, 2010. [Google Scholar]
  3. European Commission. Lighting the Cities: Accelerating the Deployment of Innovative Lighting in European Cities; Technical Report; European Commission: Brussels, Belgium, 2013. [Google Scholar]
  4. European Commitee for Standardization. CEN/TR 13201-1:2014, Road Lighting—Part 1: Guidelines on Selection of Lighting Classes; Technical Report; European Commitee for Standardization: Brussels, Belgium, 2014. [Google Scholar]
  5. European Commitee for Standardization. CEN/TR 13201-1:2004, Road Lighting. Selection of Lighting Classes; Technical Report; European Commitee for Standardization: Brussels, Belgium, 2004. [Google Scholar]
  6. Polski Komitet Normalizacyjny. PKN-CEN/TR 13201-1, OśWietlenie dróg, Część 1: Wybór Klas Oświetlenia; Technical Report; Polski Komitet Normalizacyjny: Warszawa, Poland, 2007. [Google Scholar]
  7. Sędziwy, A. A new approach to street lighting design. LEUKOS 2015. in print. [Google Scholar]
  8. Sedziwy, A. On acceleration of multi-agent system performance in large scale photometric computations. Advanced methods and technologies for agent and multi-agent systems. In Frontiers in Artificial Intelligence and Applications; Barbucha, D., Le, M.T., Howlett, R.J., Jain, L.C., Eds.; IOS Press: Amsterdam, The Netherlands, 2013; Volume 252, pp. 58–67. [Google Scholar]
  9. Kotulski, L.; Strug, B. Multi-Agent System for Distributed Adaptive Design. Key Eng. Mater. 2011, 486, 217–220. [Google Scholar] [CrossRef]
  10. Wojnicki, I.; Ernst, S.; Kotulski, L.; Sędziwy, A. Advanced street lighting control. Expert Syst. Appl. 2014, 41, 999–1005. [Google Scholar] [CrossRef]
  11. Travé-Massuyès, L.; Milne, R. Gas-turbine condition monitoring using qualitative model-based diagnosis. IEEE Expert Intell. Syst. Their Appl. 1997, 12, 22–31. [Google Scholar] [CrossRef]
  12. Moore, R.; Lindenfilzer, P.; Hawkinson, L.; Matthews, B. Process control with the G2 real-time expert system. In Proceedings of the 1st International Conference on Industrial and Engineering Applications of Artificial Intelligence and Expert Systems, Tullahoma, TN, USA, 1 June 1988; pp. 492–497.
  13. Gouyon, J.P. Kheops Users’s Guide; Report of Laboratoire d’Automatique et d’Analyse des Systemes; LAAS CNRS: Toulouse, France, 1994. [Google Scholar]
  14. Laffey, T.J.; Cox, P.A.; Schmidt, J.L.; Kao, S.M.; Readk, J.Y. Real-time knowledge-based systems. AI Mag. 1988, 9, 27–45. [Google Scholar]
  15. Smith, D.E.; Genesereth, M.R.; Ginsberg, M.L. Controlling recursive inference. Artif. Intell. 1986, 30, 343–389. [Google Scholar] [CrossRef]
  16. Wojnicki, I.; Kotulski, L.; Ernst, S. On scalable, event-oriented control for lighting systems, KES-AMSTA. In Frontiers in Artificial Intelligence and Applications; Barbucha, D., Le, M.T., Howlett, R.J., Jain, L.C., Eds.; IOS Press: Amsterdam, The Netherlands, 2013; Volume 252, pp. 40–49. [Google Scholar]
  17. Michell, N. Lighting as a tool for urban development. Cities Today 2015, 19, 28–32. [Google Scholar]
  18. BP Statistical Review of World Energy. BP Statistical Review of World Energy 2014; Technical Report; BP plc: London, UK, 2014. [Google Scholar]
Figure 1. Daily traffic intensity, one year of data; maximum, minimum and average values.
Energies 09 00314 g001
Figure 2. Map presenting the case under consideration.
Energies 09 00314 g002
Figure 3. The control availability graph for the considered case.
Energies 09 00314 g003
Figure 4. Graph transformations providing control.
Energies 09 00314 g004
Table 1. Lighting class change based control, comparison of different approaches.
ME2 [%]ME3 [%]ME4 [%]Energy [kWh]Savings [%]
Astronomical clock100.00.00.030,430.600
Statistics51.025.024.024,243.0420
Categorized Statistics46.515.038.523,020.7624
PhoCa27.014.059.020,033.4734

