Article

Decreasing NOx of a Low-Speed Two-Stroke Marine Diesel Engine by Using In-Cylinder Emission Control Measures

Institute of Internal Combustion Engine, Dalian University of Technology, Dalian 116024, China
*
Author to whom correspondence should be addressed.
Energies 2016, 9(4), 304; https://doi.org/10.3390/en9040304
Submission received: 29 February 2016 / Revised: 8 April 2016 / Accepted: 15 April 2016 / Published: 21 April 2016
(This article belongs to the Special Issue Combustion and Propulsion)

Abstract

:
The authors applied one-dimensional (1-D) simulation and 3-D Computational Fluid Dynamics (CFD) simulation to evaluate the potential of in-cylinder control methods on a low-speed 2-stroke marine engine to reach the International Maritime Organization (IMO) Tier 3 NOx emissions standards. Reducing the combustion temperature is an important in-cylinder measure to decrease NOx emissions of marine diesel engines. Miller-cycle and Exhaust Gas Recirculation (EGR) are effective methods to reduce the maximum combustion temperature and accordingly decrease NOx emissions. The authors’ calculation results indicate that with a combination of 2-stage turbocharging, a mild Miller-cycle and 10% EGR rate, the NOx emissions can be decreased by 48% without the increased Specific Fuel Oil Consumption (SFOC) penalties; with a medium Miller-cycle and 10% EGR, NOx can be decreased by 56% with a slight increase of SFOC; with a medium Miller-cycle and 20% EGR, NOx can be decreased by 77% and meet IMO Tier 3 standards, but with the high price of a considerable increase of SFOC. The first two schemes are promising to meet IMO Tier 3 standards with good fuel economy if other techniques are combined.

1. Introduction

The third stage harmful emission control regulations of the International Maritime Organization (IMO) (IMO Tier 3) have been in place since 1 January 2016 [1]. In order to comply with the IMO Tier 3 NOx standards, newly built marine diesel engines operating in the Emission Control Areas (ECA) must apply in-cylinder control measures or aftertreatment devices to satisfy the NOx control requirements. Selective Catalyst Reduction (SCR) is a major aftertreatment device considered as a good option to decrease NOx to meet the limit of Tier 3, but the uncertainties of future fuel and urea market prices make it difficult to make a decision to install it [2]. Therefore in-cylinder NOx control measures are important options to meet IMO Tier 3 standards. Since the NOx limit of IMO Tier 3 corresponds to 76% reduction from that of IMO Tier 2 level, using a single in-cylinder measure alone cannot reach IMO Tier 3 standard. There must be a combination of multiple in-cylinder control measures to decrease NOx emissions to IMO Tier 3 level. The basic rule for decreasing NOx emissions is to reduce the maximum combustion temperature and reduce the oxygen concentration of the cylinder charge. There are a series of measures to do so: Miller-cycle, Exhaust Gas Recirculation (EGR), water injection or water-emulsified-oil, pre-injection, Premixed Charge Compression Ignition (PCCI), etc. PCCI is still not mature in the diesel engine engineering field, therefore this paper will not consider it. This paper will evaluate the potential of the combination of Miller-cycle and EGR on a low-speed 2-stroke marine engine to reach the IMO Tier 3 standard by 1-D and 3-D Computational Fluid Dynamics (CFD) simulation of the engine working process.
The Miller-cycle [3] is an effective method to reduce NOx emissions of diesel engines. By changing the valve timing, the effective Compression Ratio (CR) is reduced, and accordingly a lower combustion temperature leads to decreased NOx. Most Miller-cycle application cases involve 4-stroke engines, in which lower effective CR is realized by advancing or retarding the Intake Valve Closing (IVC) time. There have been a number of successful Miller-cycle application cases in small-bore diesel engines [4,5,6,7,8]. In recent years, Miller-cycles were practiced in large-bore medium-speed 4-stroke marine diesel engines [9,10,11]. Both Millo’s and Imperato’s work indicate that the application of the Miller-cycle in medium-speed 4-stroke engine can bring up to 50% NOx reductions [9,10]. Fiedler proposed a combination of Miller-cycle, 2-stage turbocharging, 2-stage high pressure fuel injection and fuel-water-emulsification to meet the IMO Tier 3 standard [11], but for a 2-stroke marine diesel engine, the application of a Miller-cycle is more complicated than for a 4-stroke engine, as 2-stroke marine engines don’t have intake valves, and the only way of realizing a Miller-cycle is to retard the Exhaust Valve Closing (EVC) time. Thus the extent of the Miller-cycle of 2-stroke engines cannot be as high as that of 4-stroke engines and accordingly, the Miller-cycle NOx reduction potential of a 2-stroke engine is lower than that in a 4-stroke engine. In order to further reduce NOx emissions, the combination with other in-cylinder control measures is needed. Exhaust Gas Recirculation (EGR) have been widely evaluated as one of the effective techniques to reduce NOx. There have been tests running EGR systems on low-speed 2-stroke engines [12,13,14]. The test on a 2-stroke indicated that the engine can meet the IMO Tier 3 NOx limit when an EGR system is running, but with a higher Specific Fuel Oil Consumption (SFOC) penalty [15]. In the meantime, EGR also results in higher diesel engine soot emissions. A 2-stage turbocharging system is unavoidable to secure high air fuel ratios with EGR to obtain low soot emissions for the EGR engine concept [14].
The existing literatures about the use of Miller-cycles are limited in 4-stroke engines, and there is still no literature investigating the application of Miller-cycles in 2-stroke marine diesel engines and giving an overall evaluation of the engine performance. This paper will investigate the influence of the Miller-cycle on a 2-stroke marine diesel engine’s combustion, NOx emissions, and fuel economy. Meanwhile, considering that a high EGR rate would worsen fuel economy and cause high Particulate Matter (PM) emissions, the authors will use low and moderate EGR rates to avoid the worsening of fuel economy. Based on the analysis the characteristics of in-cylinder NOx emission control methods presented in the above literature, this paper uses a combination of Miller-cycle, EGR and higher geometric CR to decrease NOx and maintain a low engine SFOC.

2. Results and Discussion

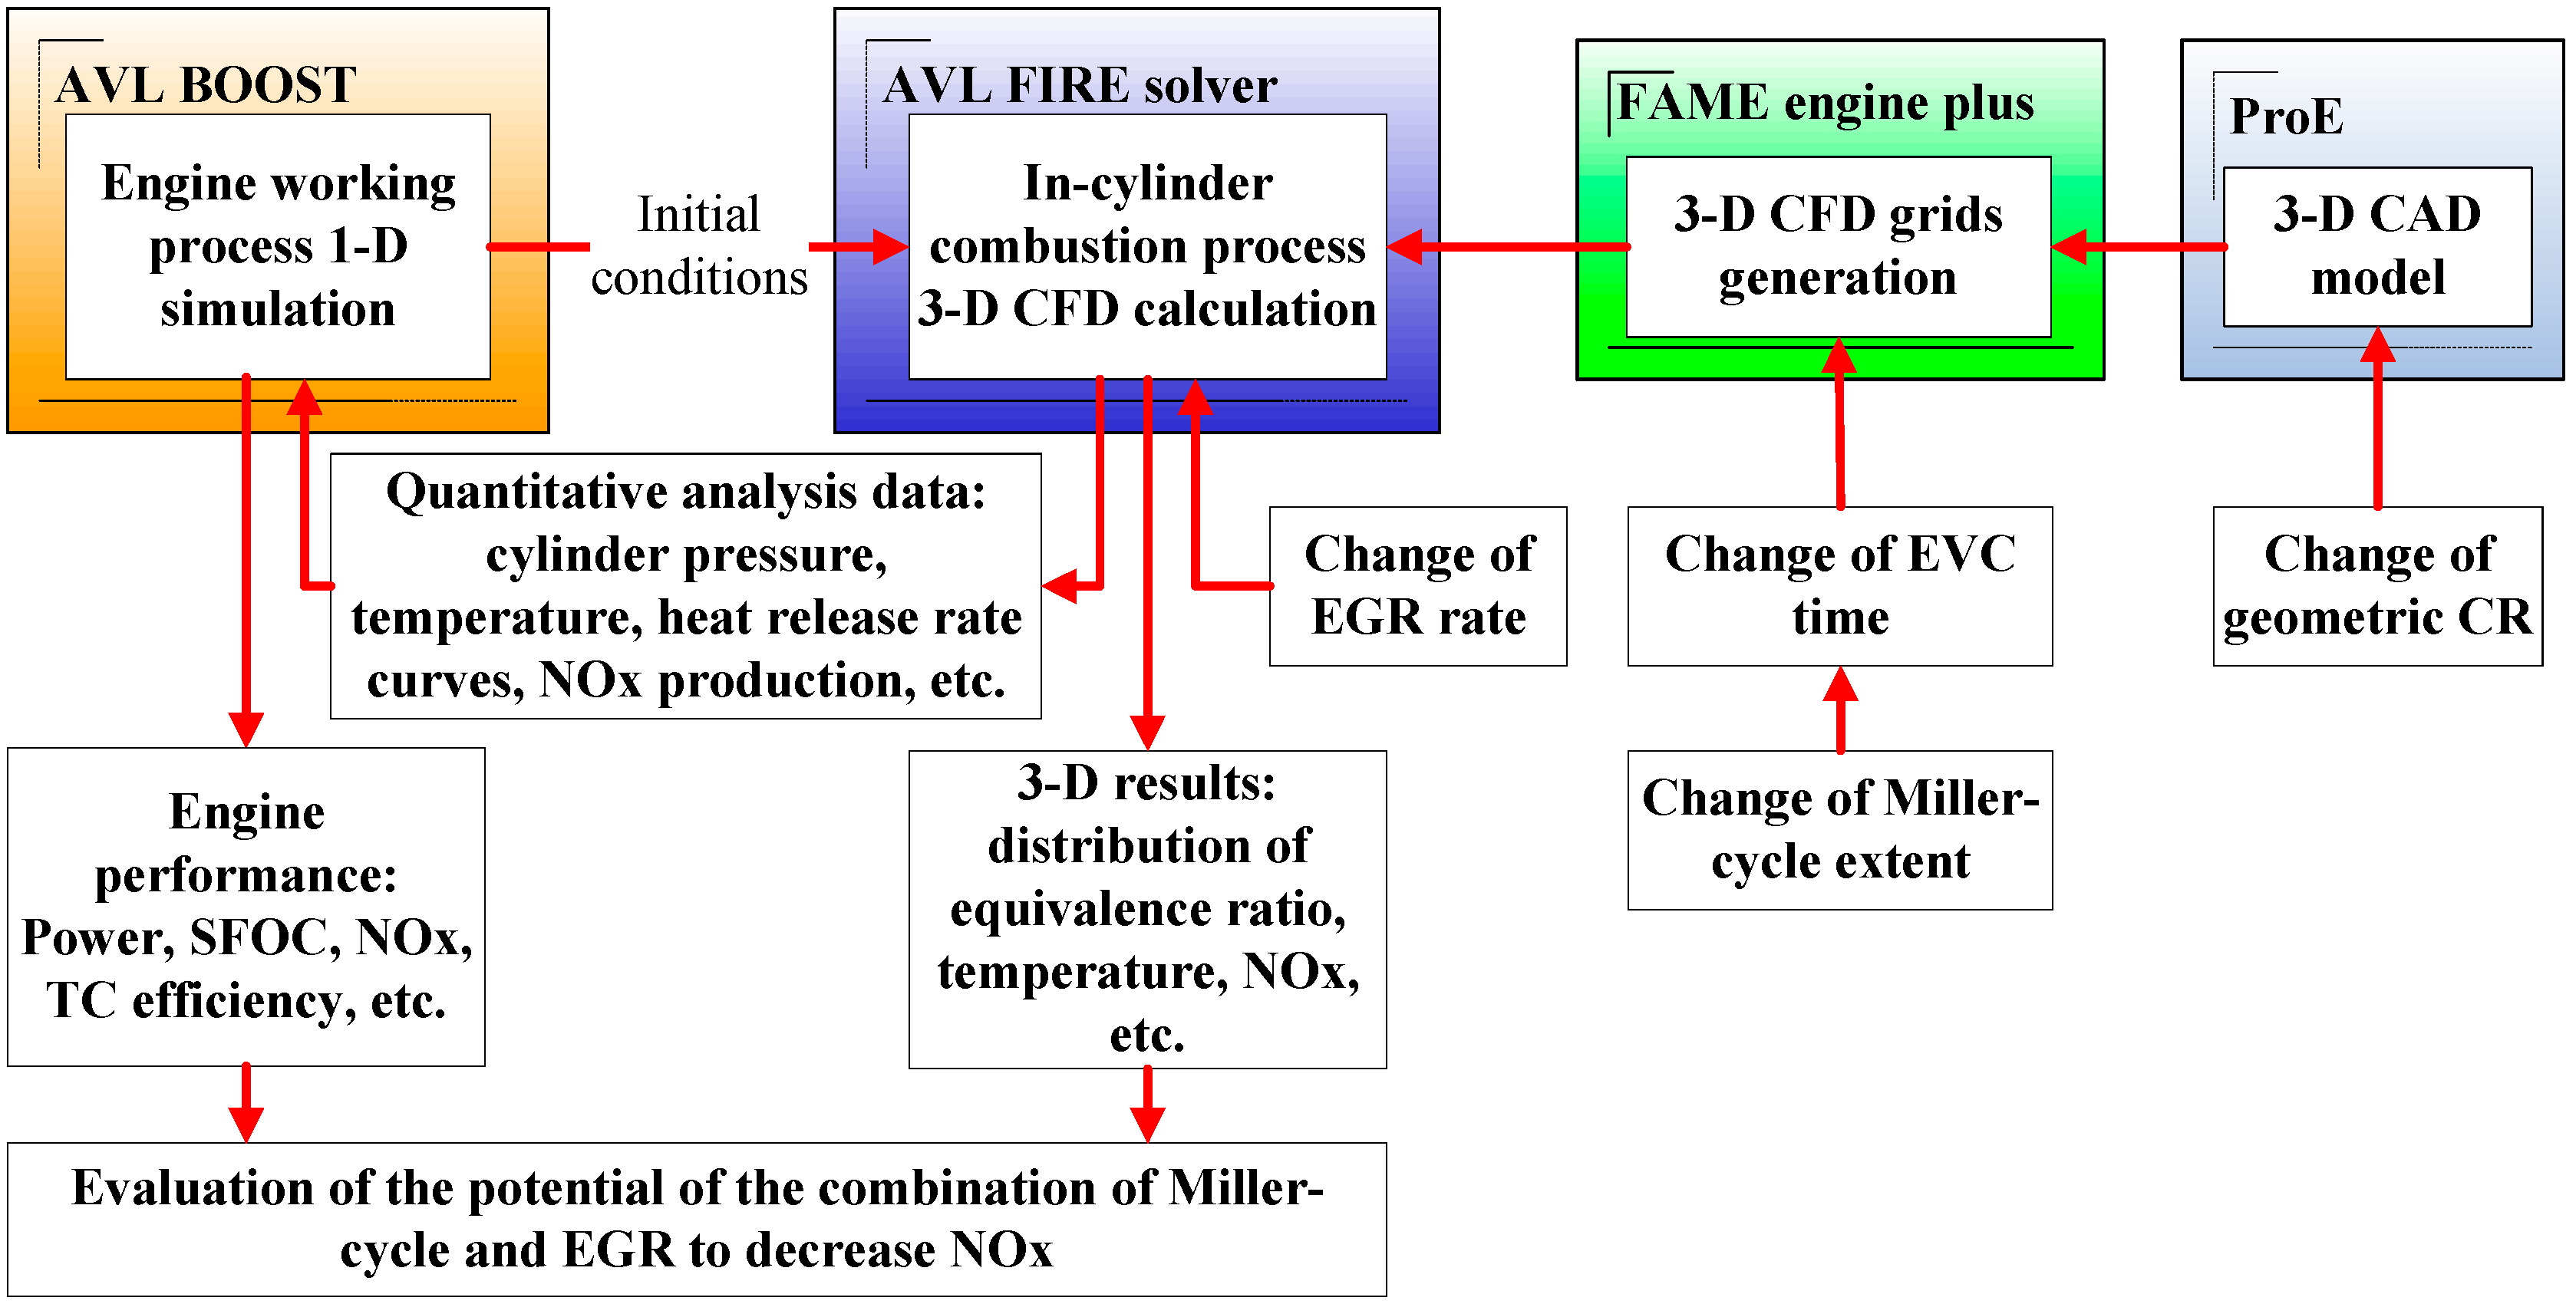
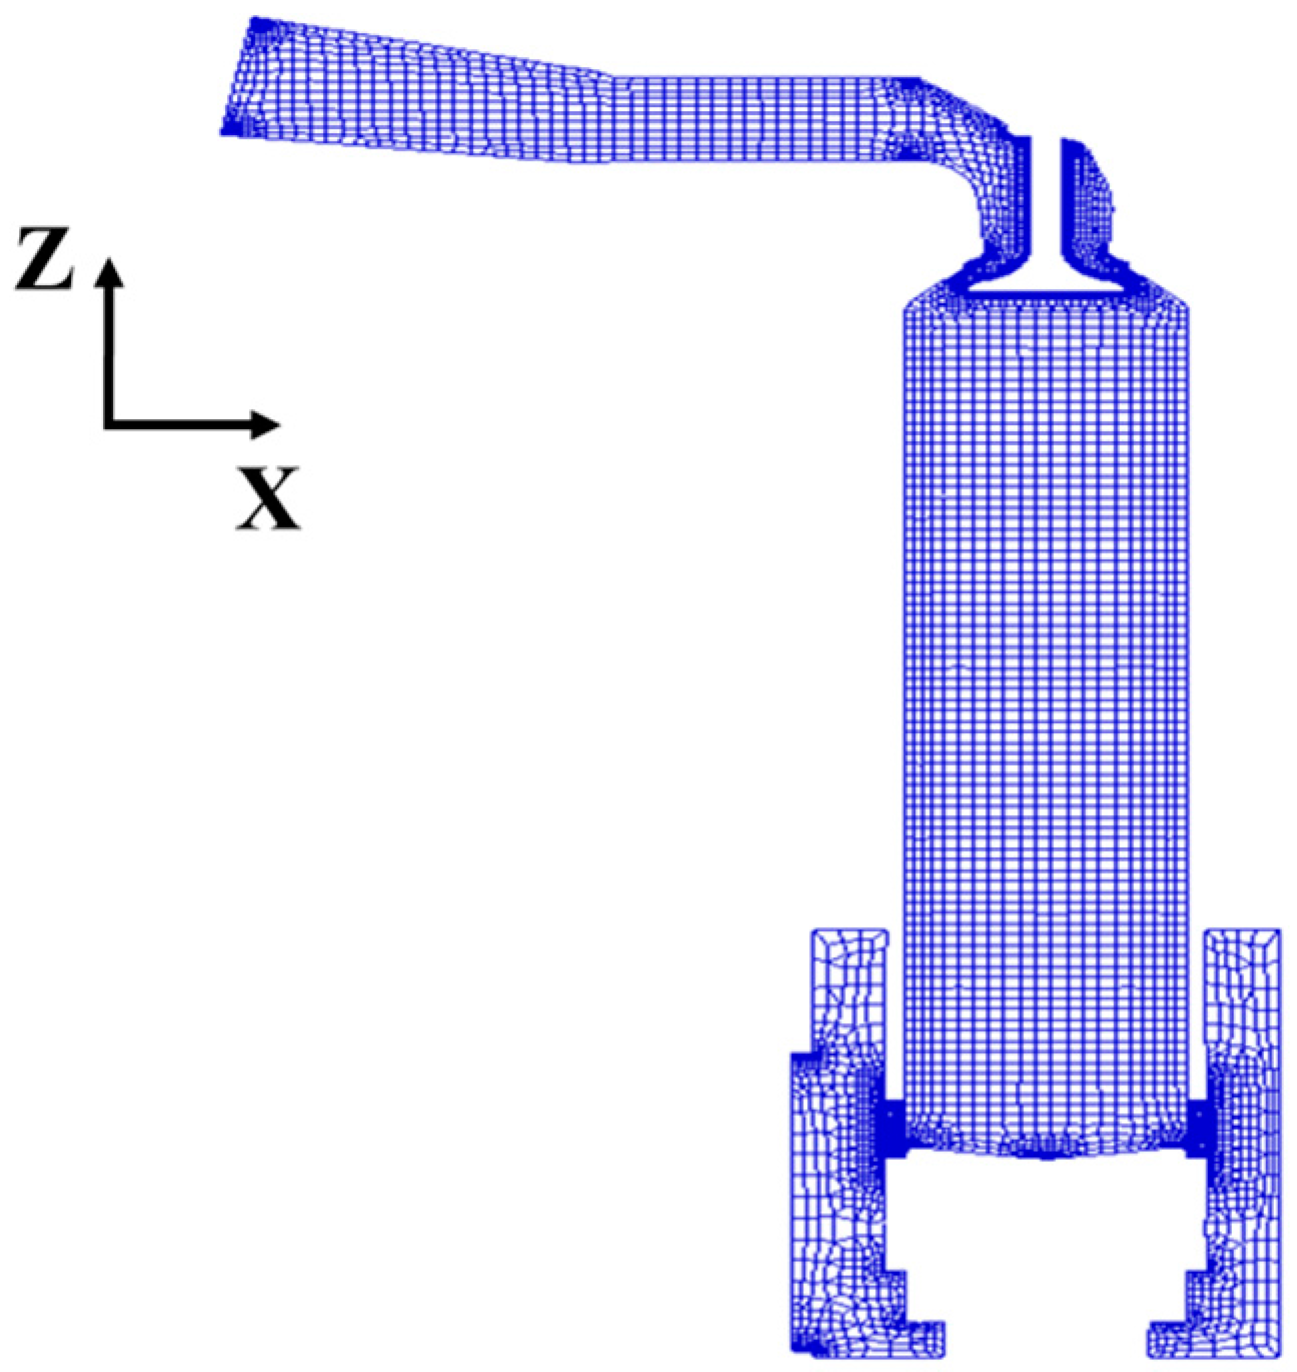
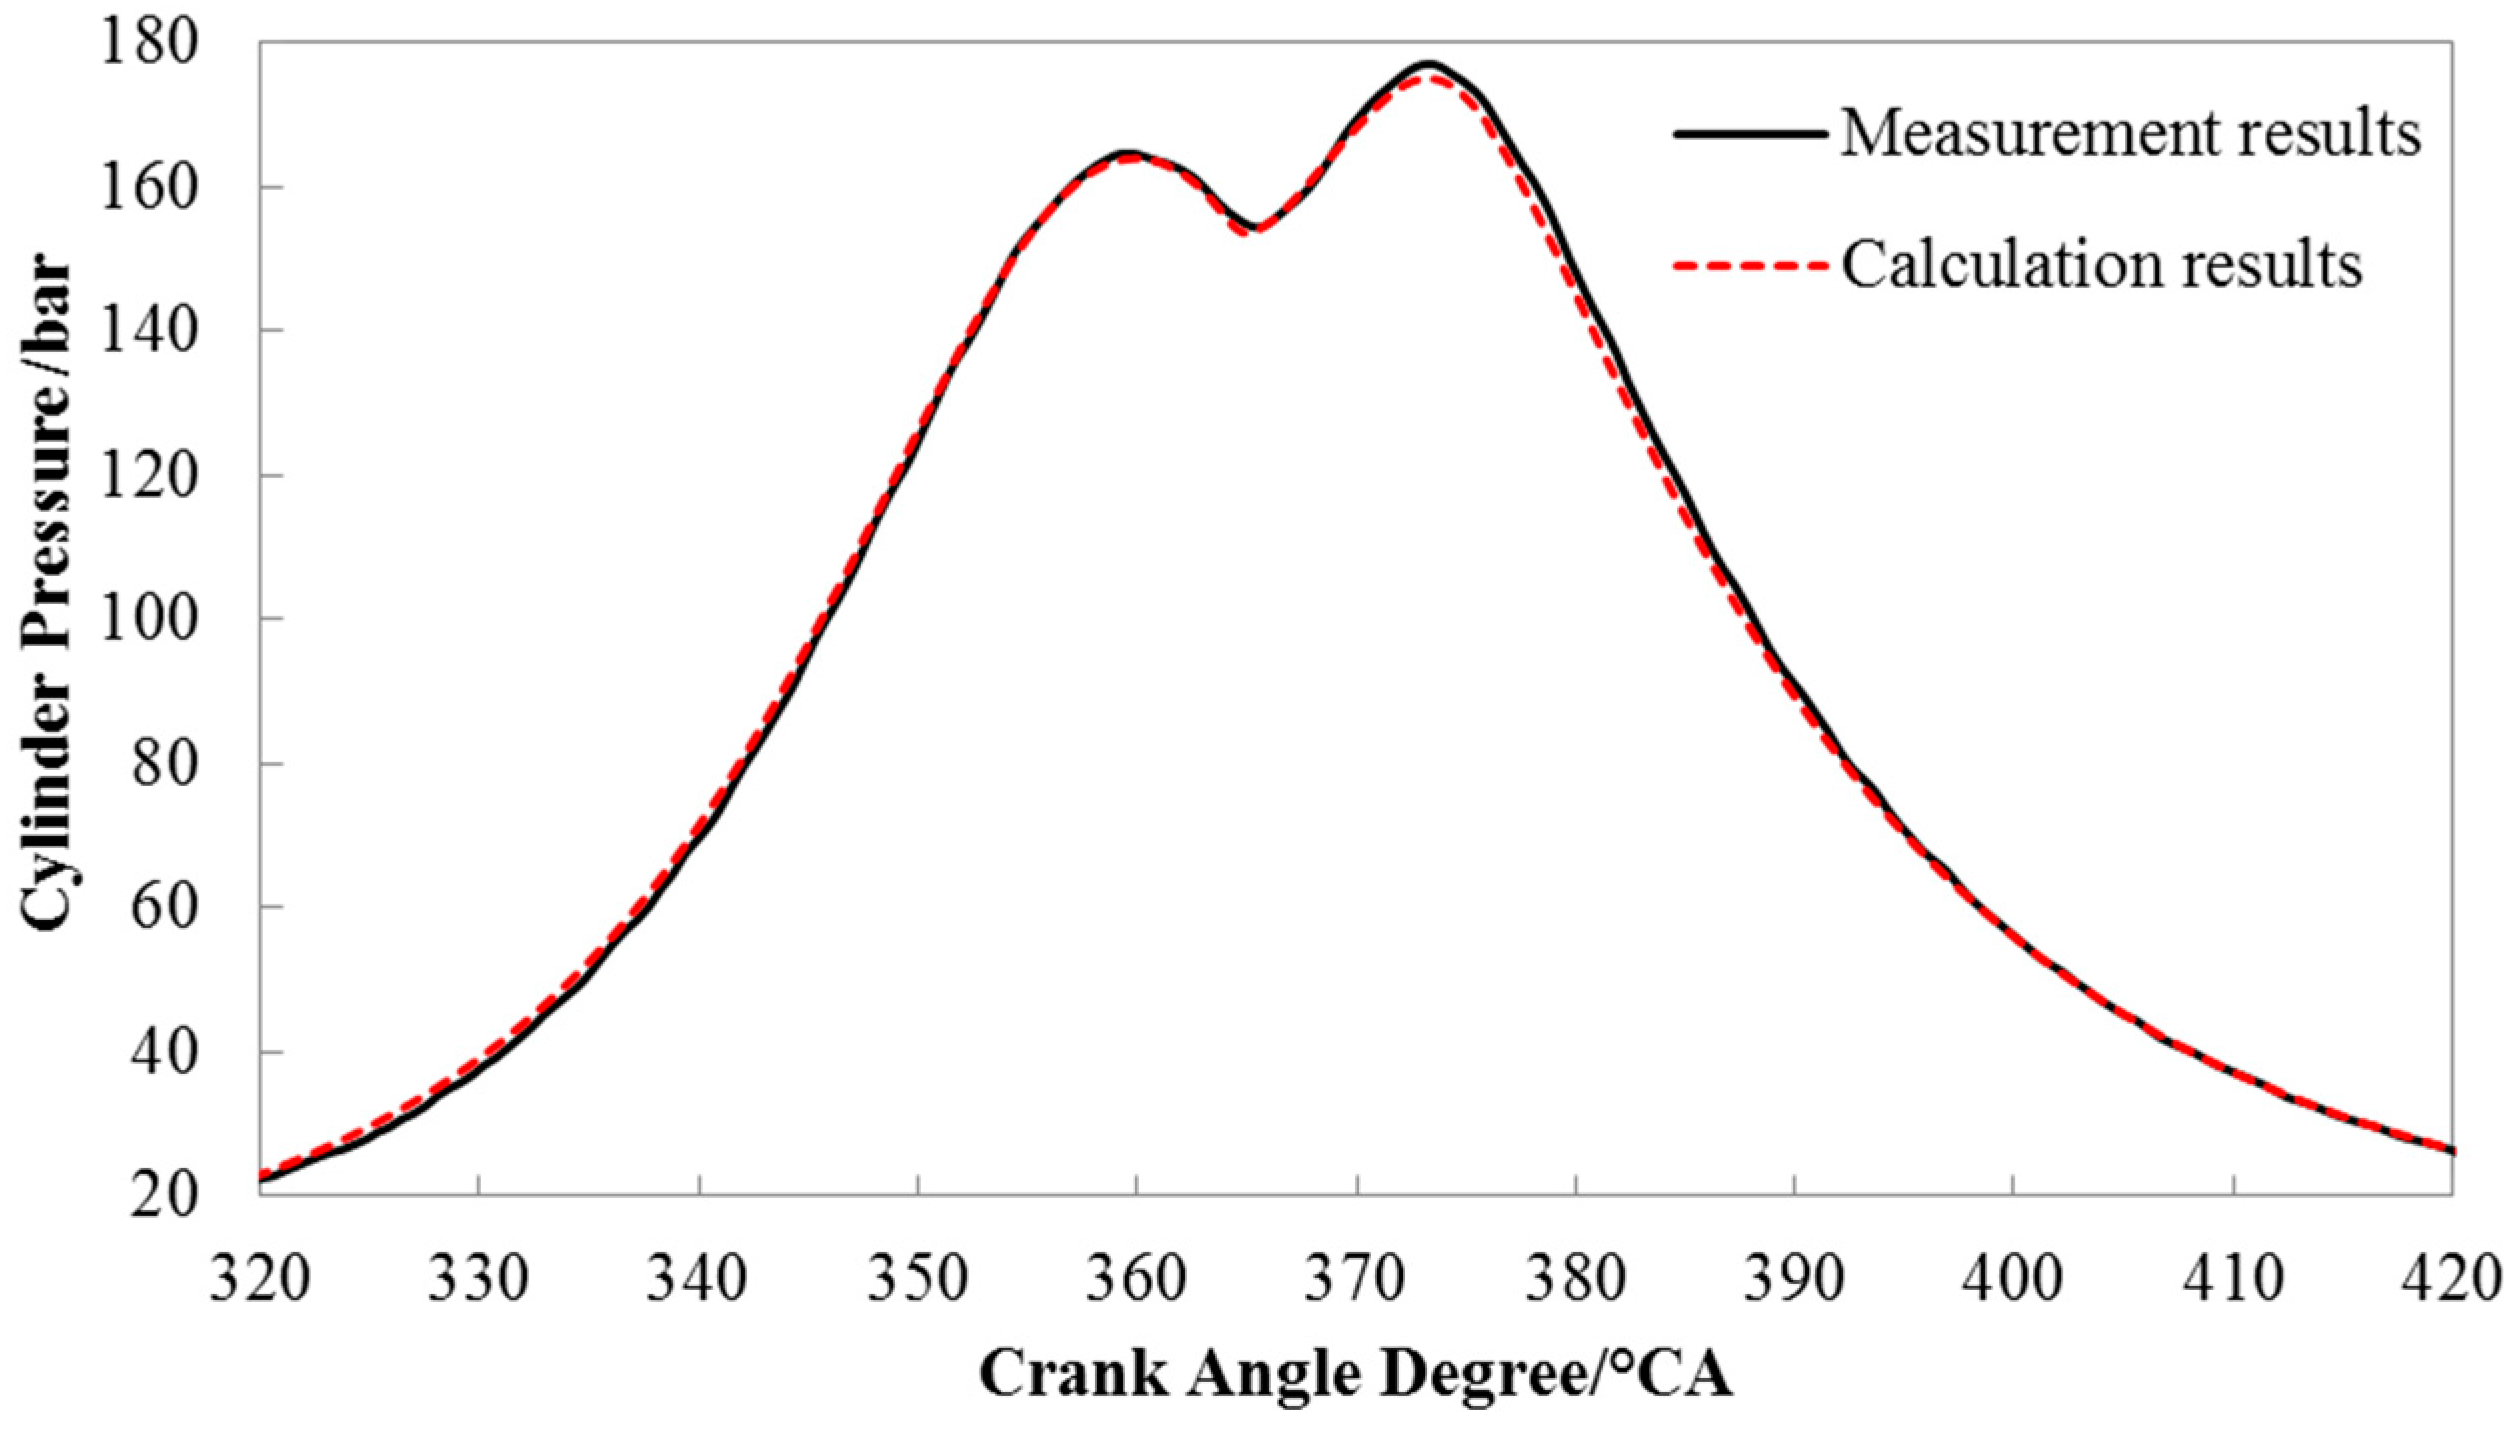
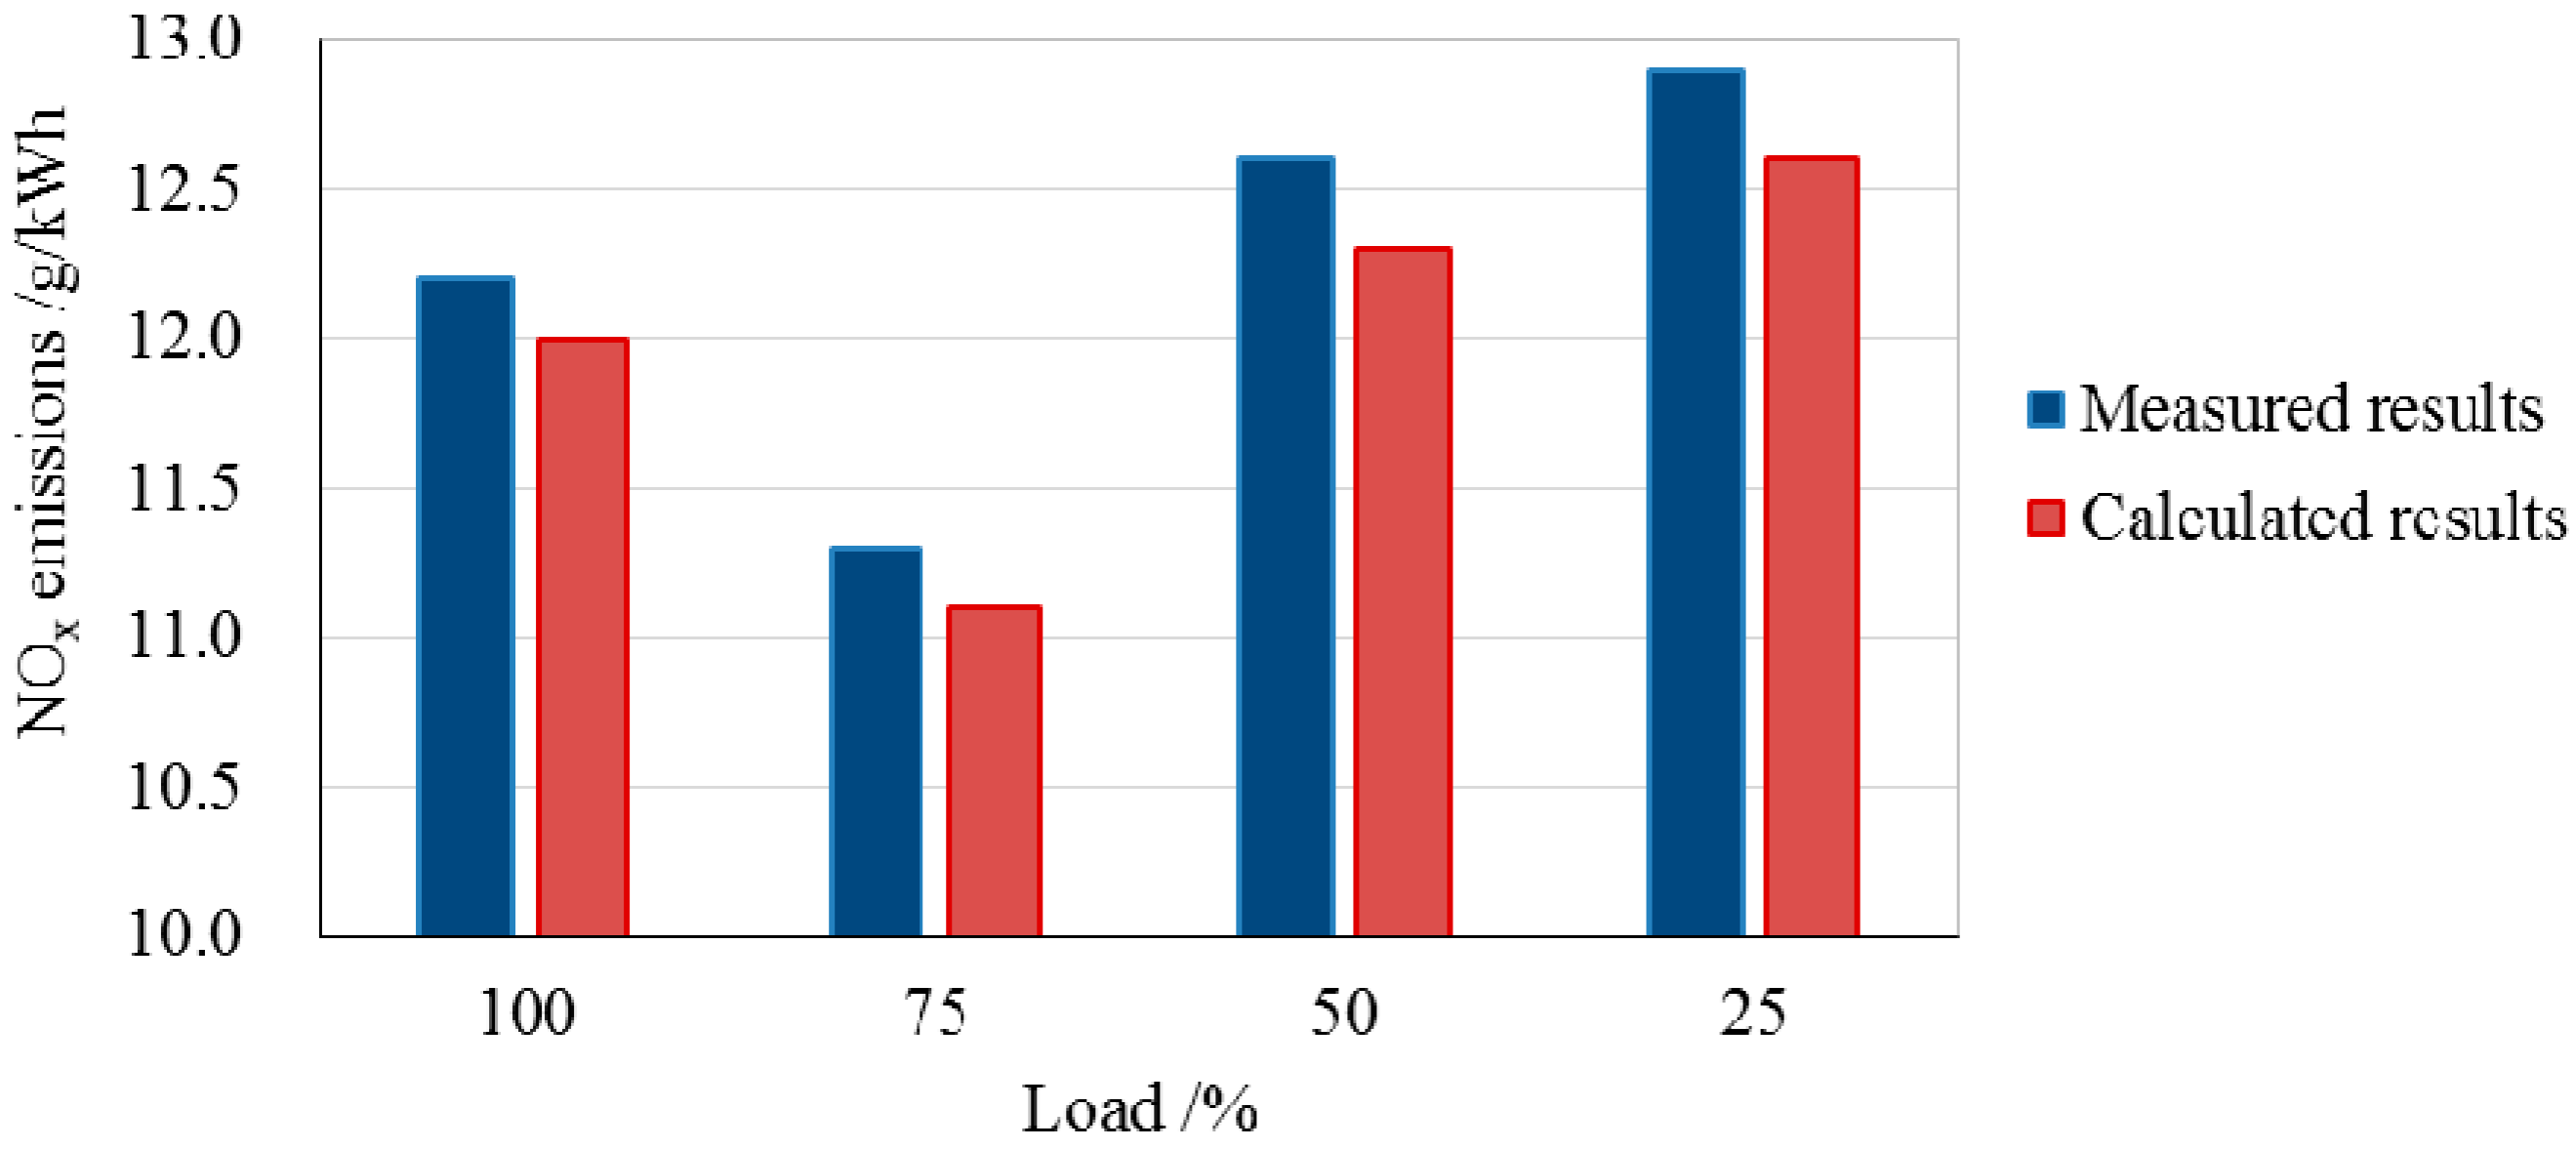
2.1. Specifications of the Engine and the Investigation Methods

The researched engine is a low-speed 2-stroke marine diesel engine, which complies with IMO Tier 2 standard. Table 1 lists the specifications of the engine.
The authors used a 1-D simulation tool, AVL BOOST v5.0, to calculate the engine working process. 1-D simulation functions to output the initial conditions for 3-D CFD calculation and calculate the engine performance. Since the 1-D simulation model uses a zero-dimensional or quasi-dimensional combustion model to calculate the in-cylinder working process, it cannot fully reflect the complexity of diesel mixing-controlled combustion. The authors used a 3-D CFD code, AVL FIRE v2008, to calculate the fuel injection, fuel-air mixing, combustion and emissions formation processes. FIRE calculates in-cylinder processes and output quantitative analysis data of combustion and emission formation, which include cylinder pressure, heat release rate, mean temperature curves, and the production of NOx emissions, to BOOST for engine performance calculation. Meanwhile, for each calculation case, 3-D results of the distribution of fuel-air equivalence ratio, temperature, NOx were output and read by authors for the evaluation of in fuel-air mixing, combustion and NOx formation processes. Figure 1 shows the workflow of the investigation.
According to the engine structure and specifications, a 1-D working process simulation model was created. Figure 2 shows the 1-D simulation model of the baseline engine. The baseline engine is a single-stage turbocharged engine. Accordingly in the 1-D simulation model, there is one turbocharger (TC) for the engine. In the figure, SB1 and SB2 are inlet and outlet boundaries; T and C mean a turbine and a charger respectively; CO1 represents an intercooler; TCP1 and TCP2 are blowers; C1 through C6 mean six cylinders; VP1 through VP6 are intake ports; PL1 is a scavenge air receiver, and PL2 is an exhaust receiver.
The 1-D working process simulation was carefully validated based on the comparison of simulation results and measurement results. Table 2 presents a part of the comparison of simulated and tested results of the engine under full load operating condition.
Figure 3 shows the volumes cells when piston is at Bottom Dead Center (BDC). In this paper, BDC is defined as 180 crank angle degree (°CA), and TDC (Top Dead Center) is defined as 360 °CA. The working process simulation was started from the opening of exhaust valve (EVO), and stopped at the next time of EVO. The k-ε turbulence model was applied. The Wave Droplets Breakup model [16] was selected for the calculation of atomization process. The extended coherent flame model was used as the combustion model [17]. The Extended Zeldovich model in the emission models was selected to calculate the NOx formulation [18].
The measurement results and 3-D CFD calculation results of the baseline engine were compared. Figure 4 shows the comparison of cylinder pressure curves of the engine under full load operating conditions.
As can be seen in the figure, the calculated data agree well with the experimental data. Meanwhile, the NOx emissions calculation was validated base on the NOx emissions data measured on test bench. Table 3 lists the parameters of the NOx analyzer used in the measurement and Figure 5 presents the comparison of measured and calculated NOx results under Test cycle type E3. The deviations of calculated results from measured results are smaller than 2.4%. Based on the validation, other cases were calculated.
Figure 6 shows the simulation results of fuel spray injected from two injectors. Figure 7 presents the temperature distribution in cylinder during the combustion process. Figure 8 is the NOx formation in cylinder. Figure 7 and Figure 8 indicate that during the main combustion period, from 366 °CA to 380 °CA, the formation of NOx clearly correlates with high temperature distribution. Since 366 °CA, NOx can be observed in local high temperature regions. At the initial stage, peak temperatures are under 2400 K, and correspondingly NOx concentration is still low. At 376 °CA, peak temperatures approach 2617 K, and high concentrations of NOx appear in high temperature regions. After 380 °CA, with piston moving down, burned gas temperatures decrease as the cylinder gases expand. The decreasing temperature due to expansion and mixing of high-temperature gas with air or cooler burned gas freezes the NO chemistry [19]. Around the end of combustion, NOx production rate decreases [20]. Most of NOx were formed during the main combustion period. This trend agrees with the results of reference [20]. At 380 °CA, in Figure 7, there are two peak temperature region groups: groups A and B. Correspondingly, in Figure 8, there are also two NOx concentration region groups. NOx concentration region group A was formed during main combustion period, while group B is newly formed in peak temperature region group B. After 380 °CA, newly formed NOx represents only a small part of the total NOx; the highest NOx concentration regions (group A) do not correlate with peak temperature, but vary with the swirl in cylinder.

2.2. NOx Reduction by Miller-Cycle

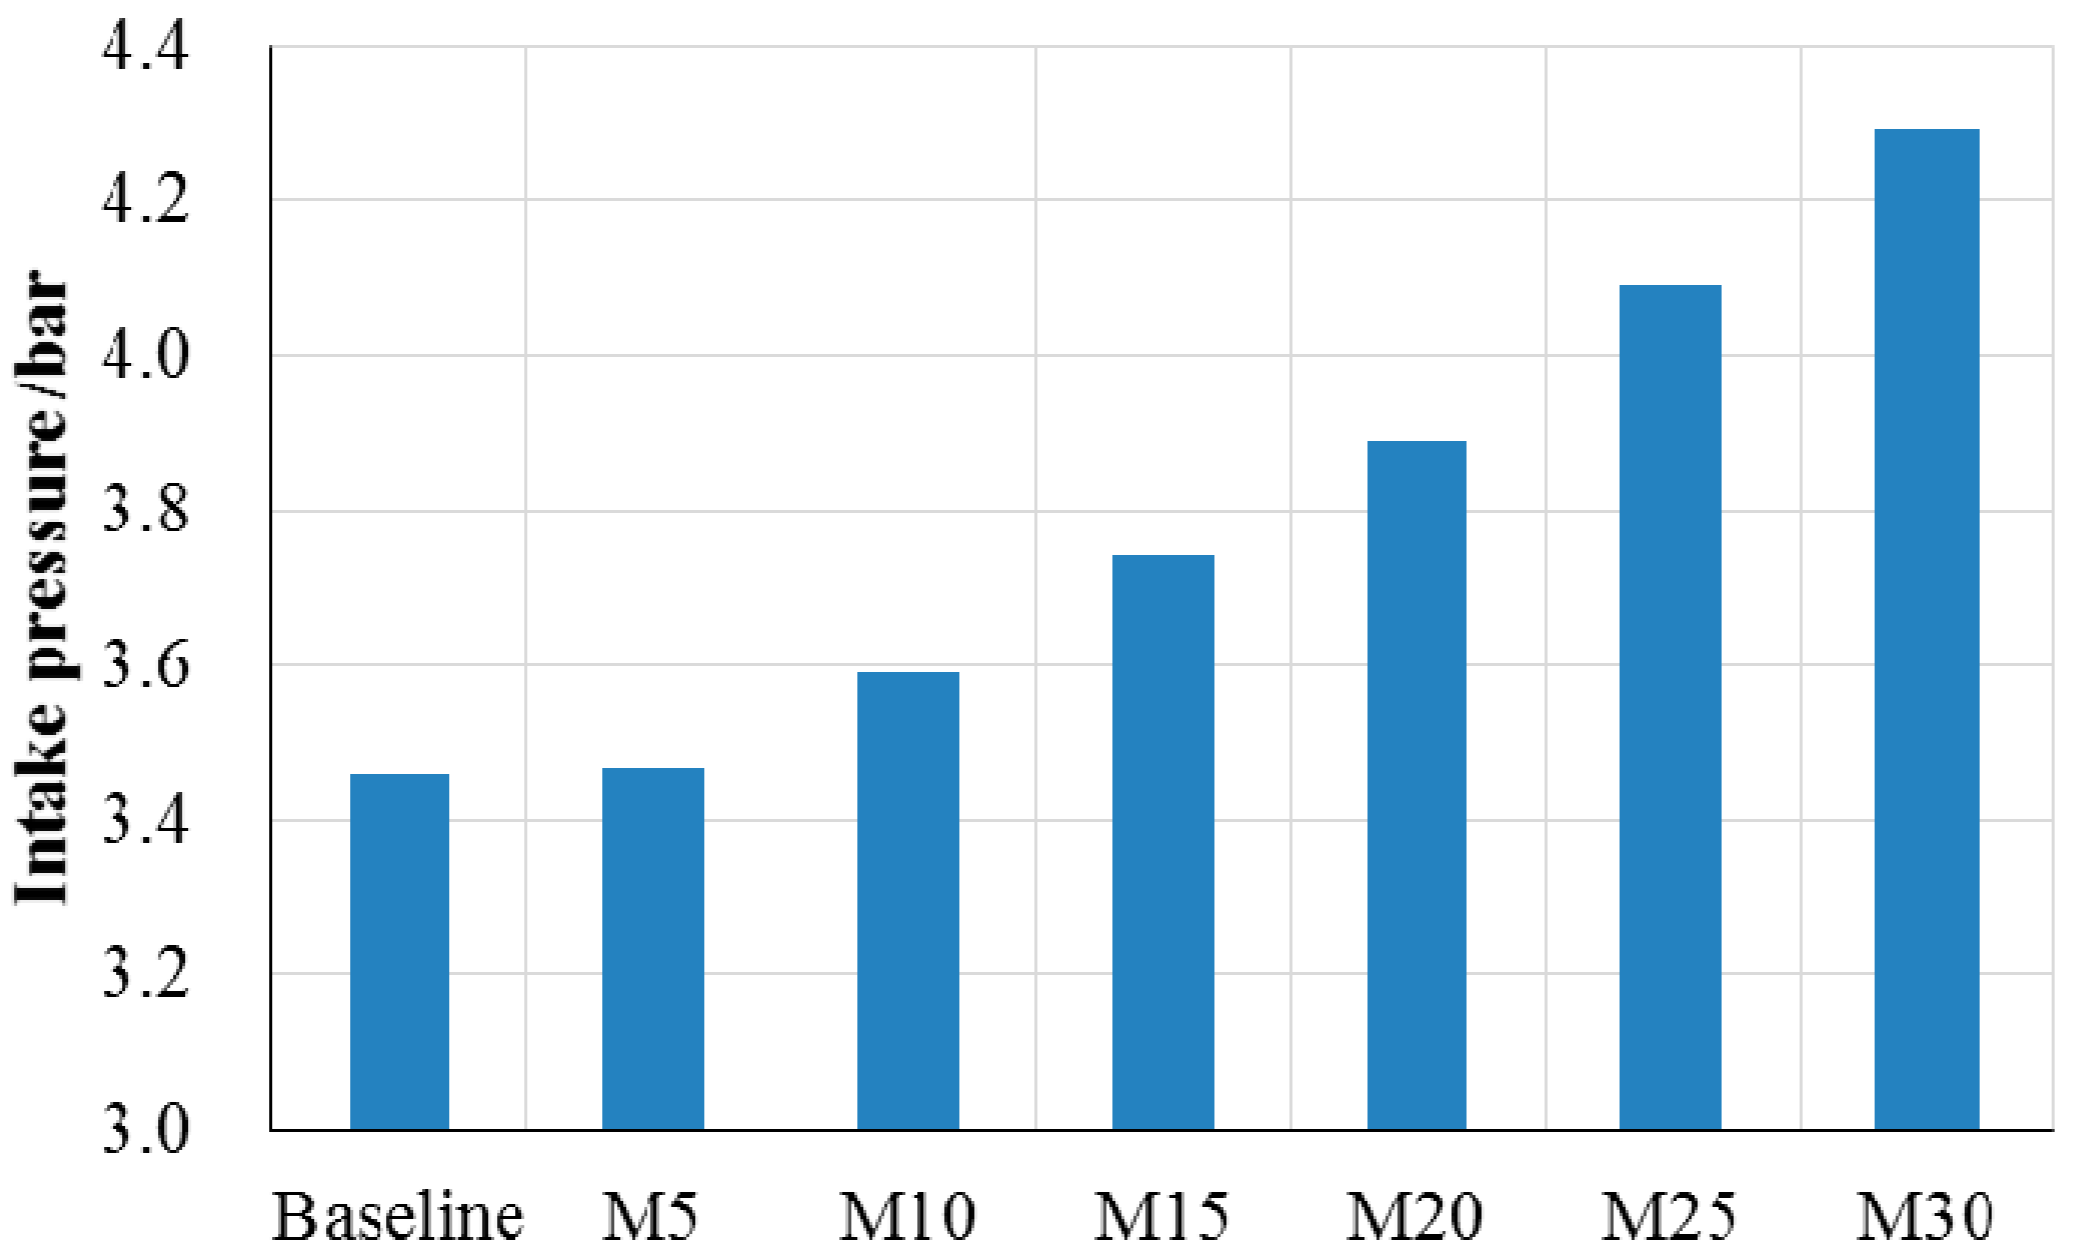
2.2.1. Miller Timing

The mechanism of Miller-cycle NOx reduction in a 2-stroke engine is to retard the EVC time. The authors designed six Miller timing schemes, which take 5 °CA as retarding interval. Figure 9 shows the exhaust valve lift curves of the six schemes. In the figure, the numbers correlate with the EVC delay compared to the baseline scheme. Due to the EVC delay, a part of the fresh charge is expelled out of the cylinder. Thus, for the purpose of maintaining a similar excess air ratio, Miller-cycle schemes need higher intake pressure than the baseline scenario. With the extended Miller-timing, the intake pressure must be further increased to compensate the loss of intake charge. Figure 10 shows the intake pressure values of different schemes. The case of M30 has the highest intake pressure, being 24% higher than that of the baseline case.

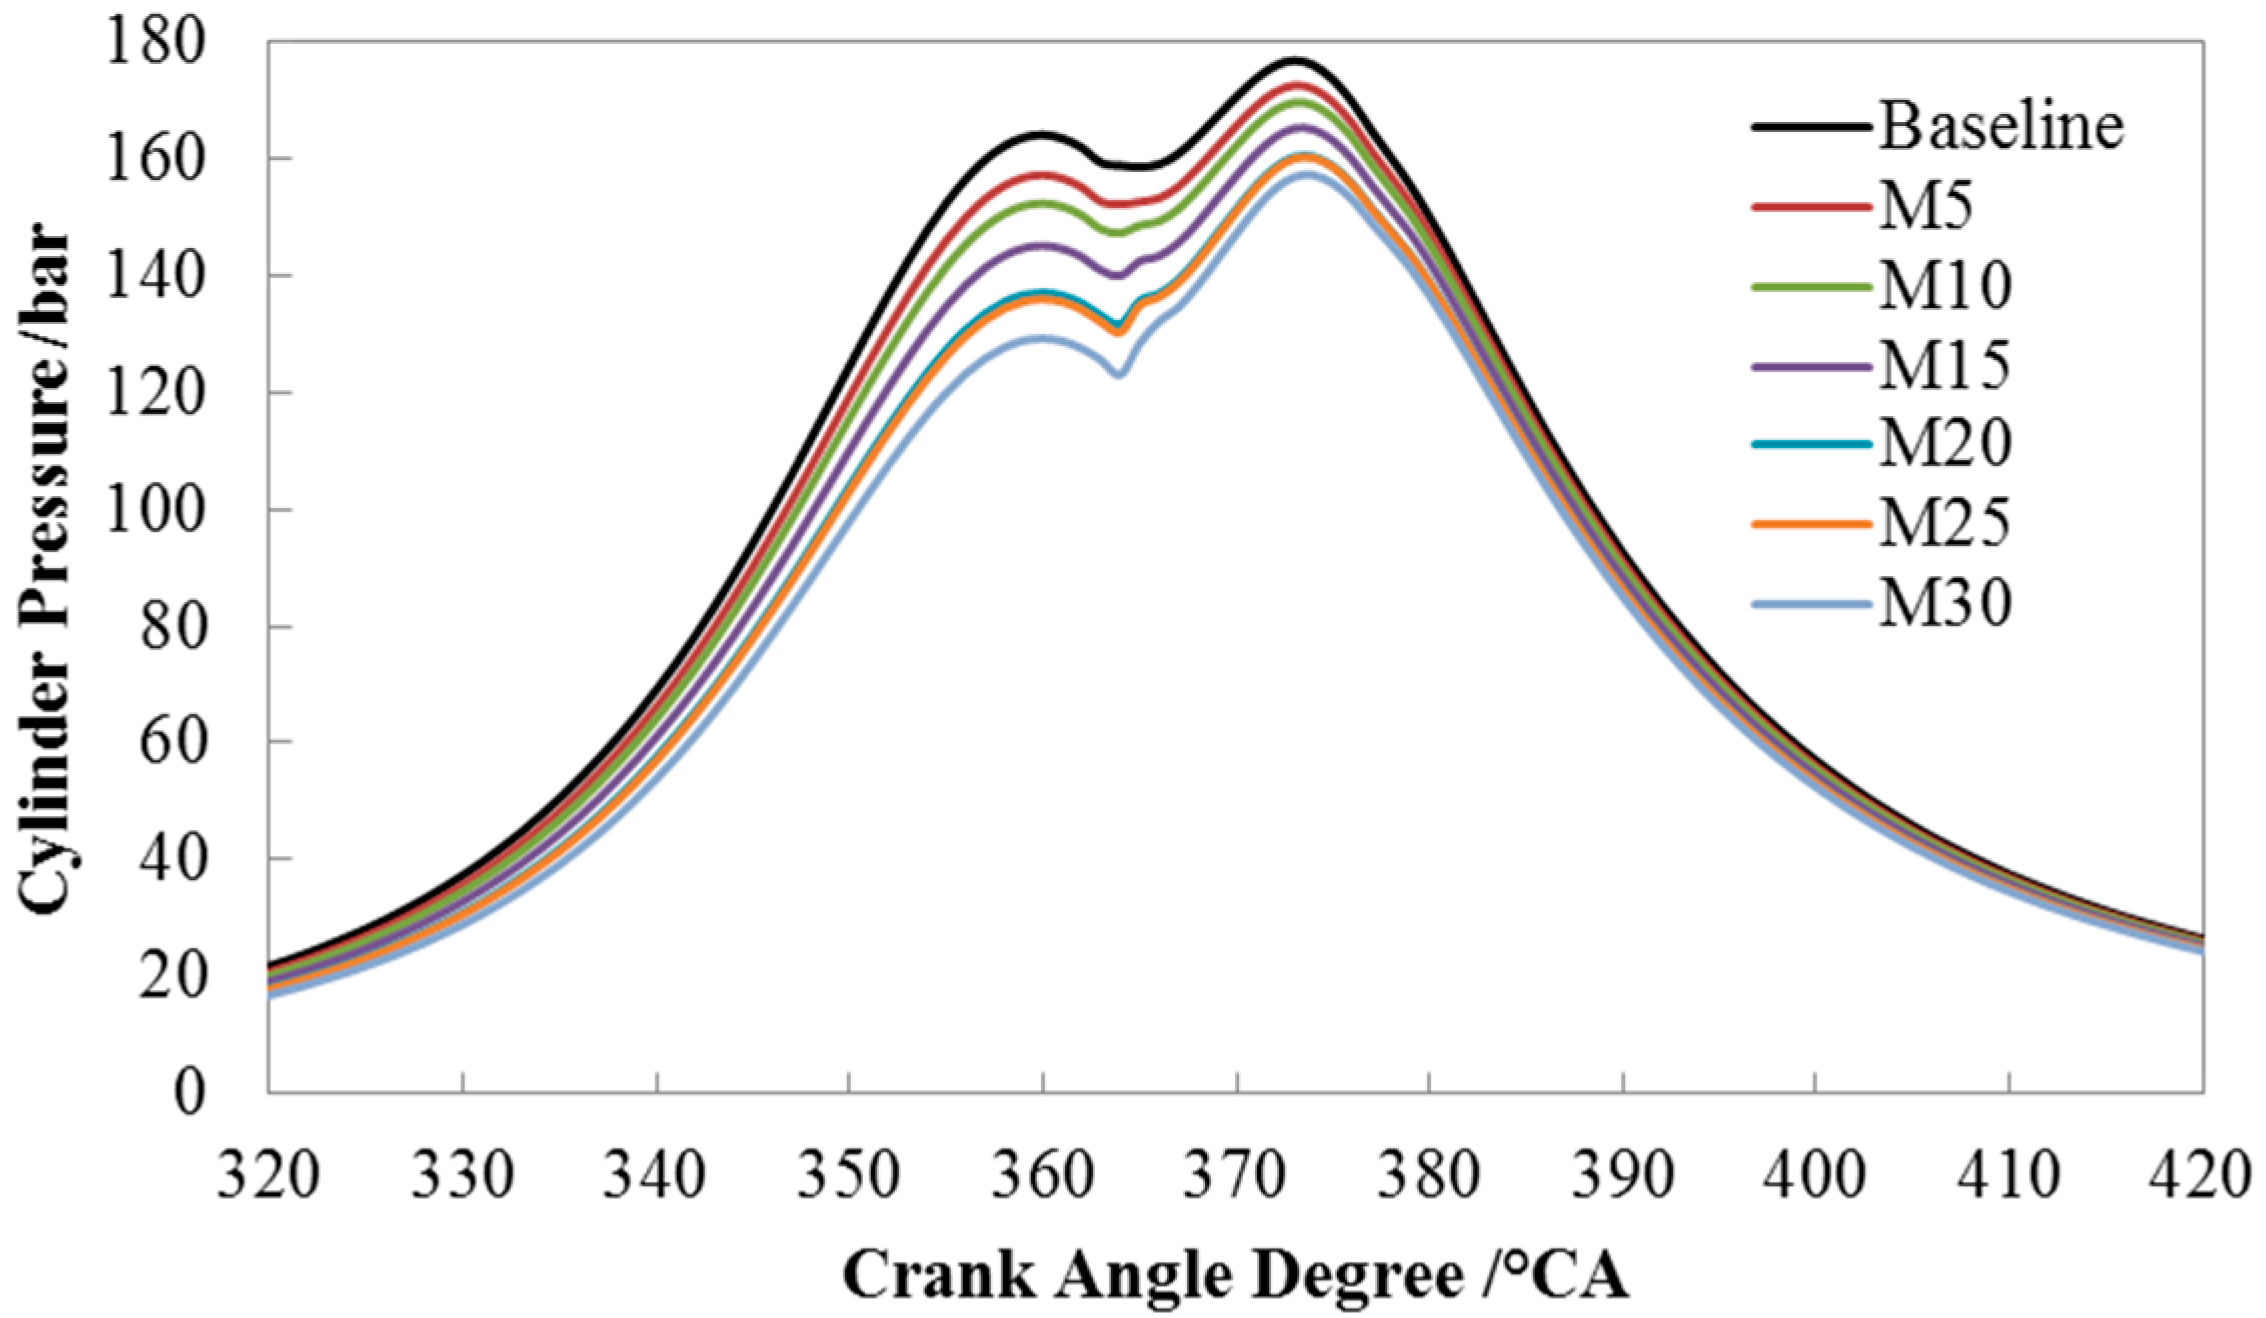
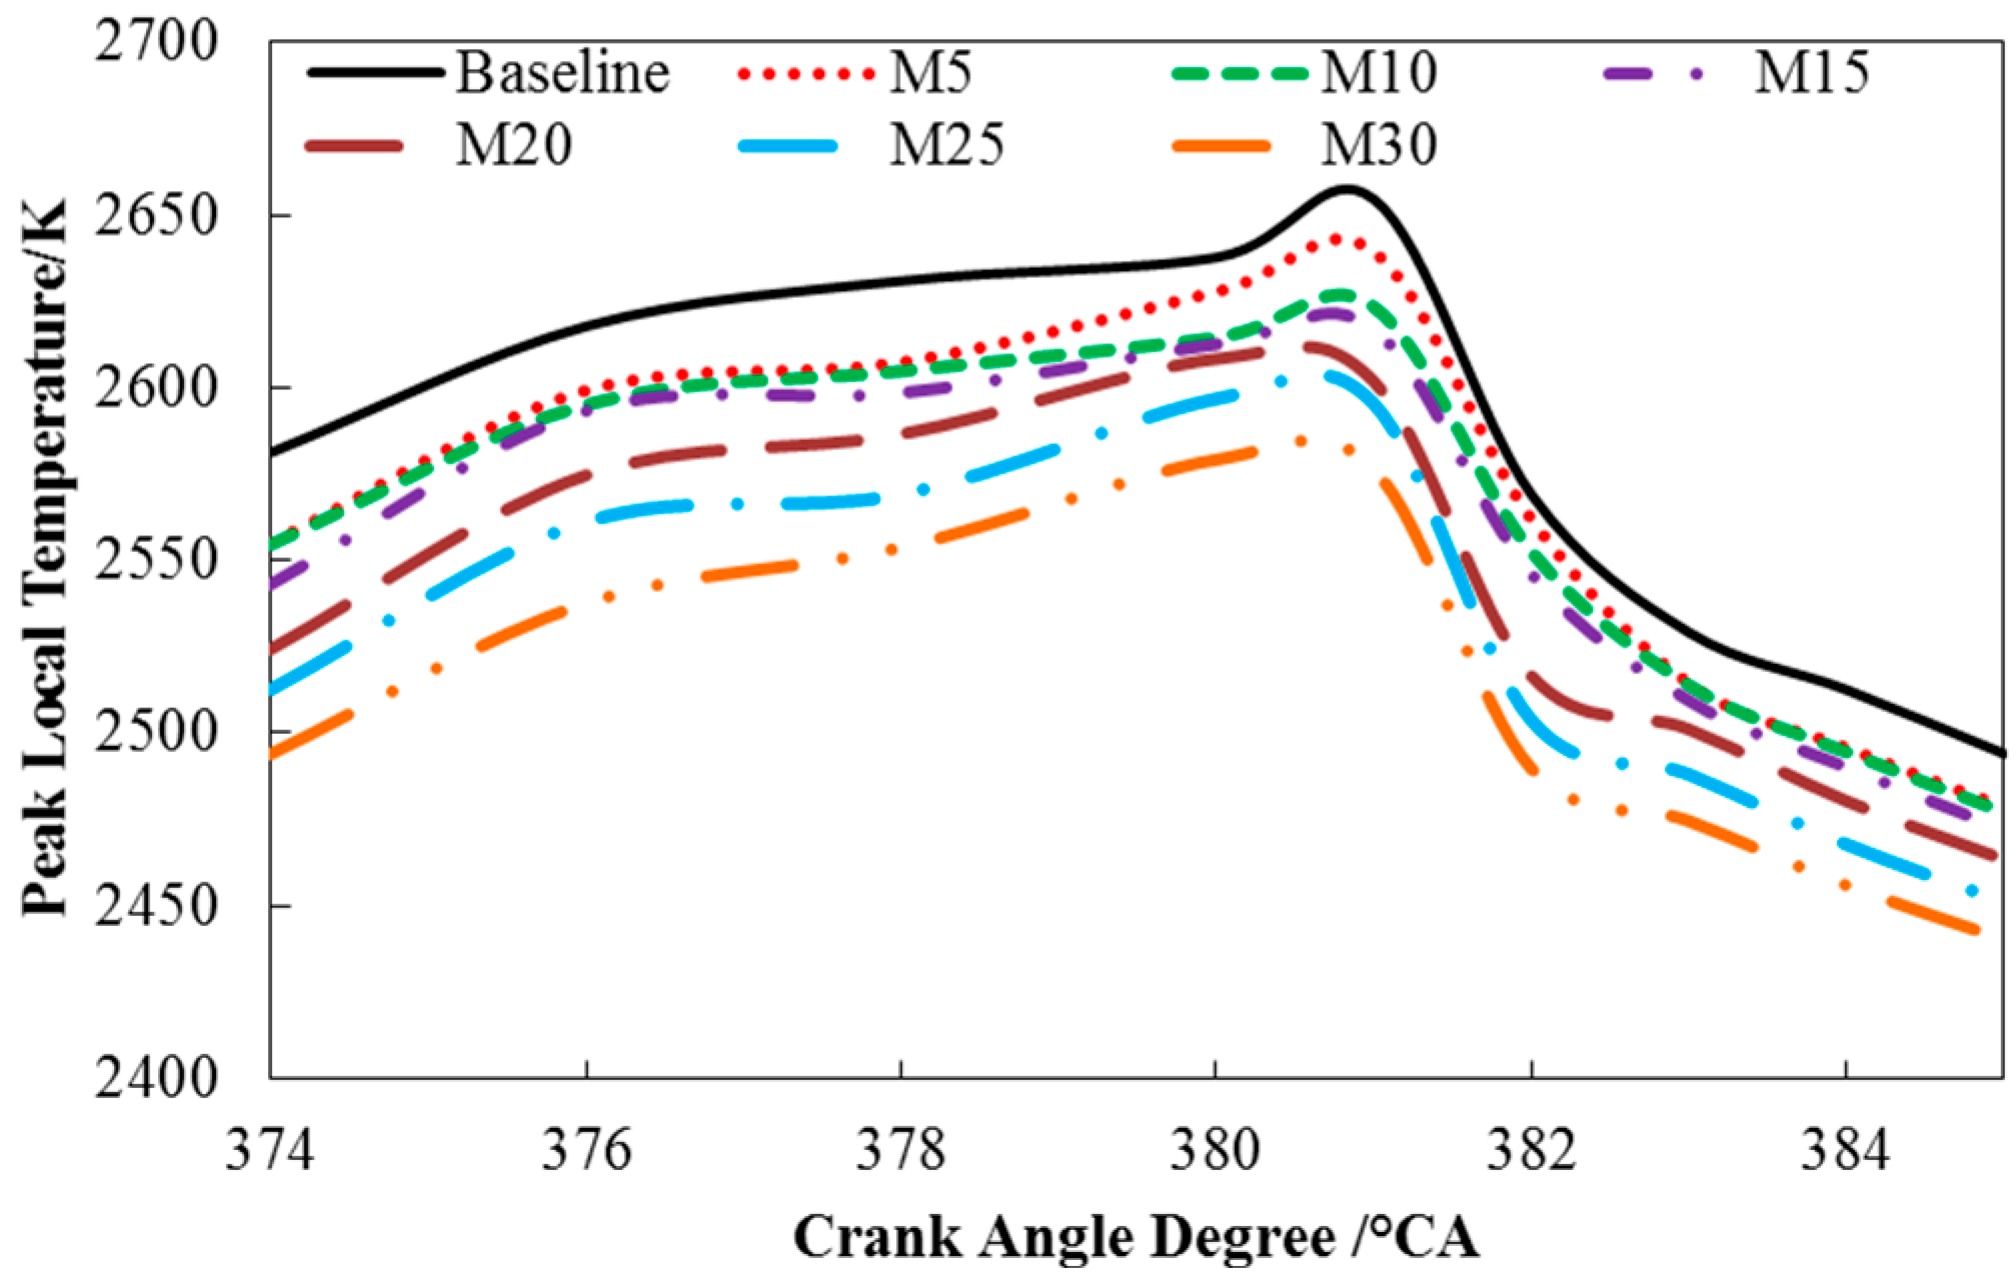
2.2.2. Miller-Cycle with a 1-Stage Turbocharging

The baseline engine was equipped with a 1-stage turbocharger. Therefore, the characteristics of a Miller-cycle with 1-stage turbocharging were investigated first. The authors used FIRE to calculate the in-cylinder processes, and coupled the calculation results with BOOST to calculate the engine performance. Figure 11 shows the comparison of pressure curves of different Miller-cycle cases. It can be seen that with the increase of Miller-timing, the maximum cylinder pressure decreases due to the smaller effective CR.
Figure 12 presents the comparison of peak local temperatures of different Miller-cycle cases. It is shown that with the increase of Miller-timing, the peak local temperature decreases. M30 and M25 have the two lowest peak local temperatures. Since the formation of NOx largely depends on the peak local temperature, 3-D results give a clear explanation of the NOx variation trend.
Figure 13 presents temperature distribution in cylinder by a vertical cut view, in which the temperature value is read by color. In the picture, the baseline case has the highest local temperature, and M30 has the lowest local temperature. This explains why larger Miller-timing cases have lower NOx. Figure 14 shows that Miller cases have smaller NOx mass fractions in cylinder compared with the baseline.
The engine performance of different cases is compared by Table 4. With the increase of Miller-timing, the reduction of NOx is more apparent, but larger Miller-timings correspond to lower power and higher SFOC. Taking M30 as an example, its specific NOx emissions decrease by 45.8%, but its power decreases by 2.66% and SFOC increases by 2.67%. Similar variation trends of NOx, SFOC and power can be observed in the research results of Millo [9].

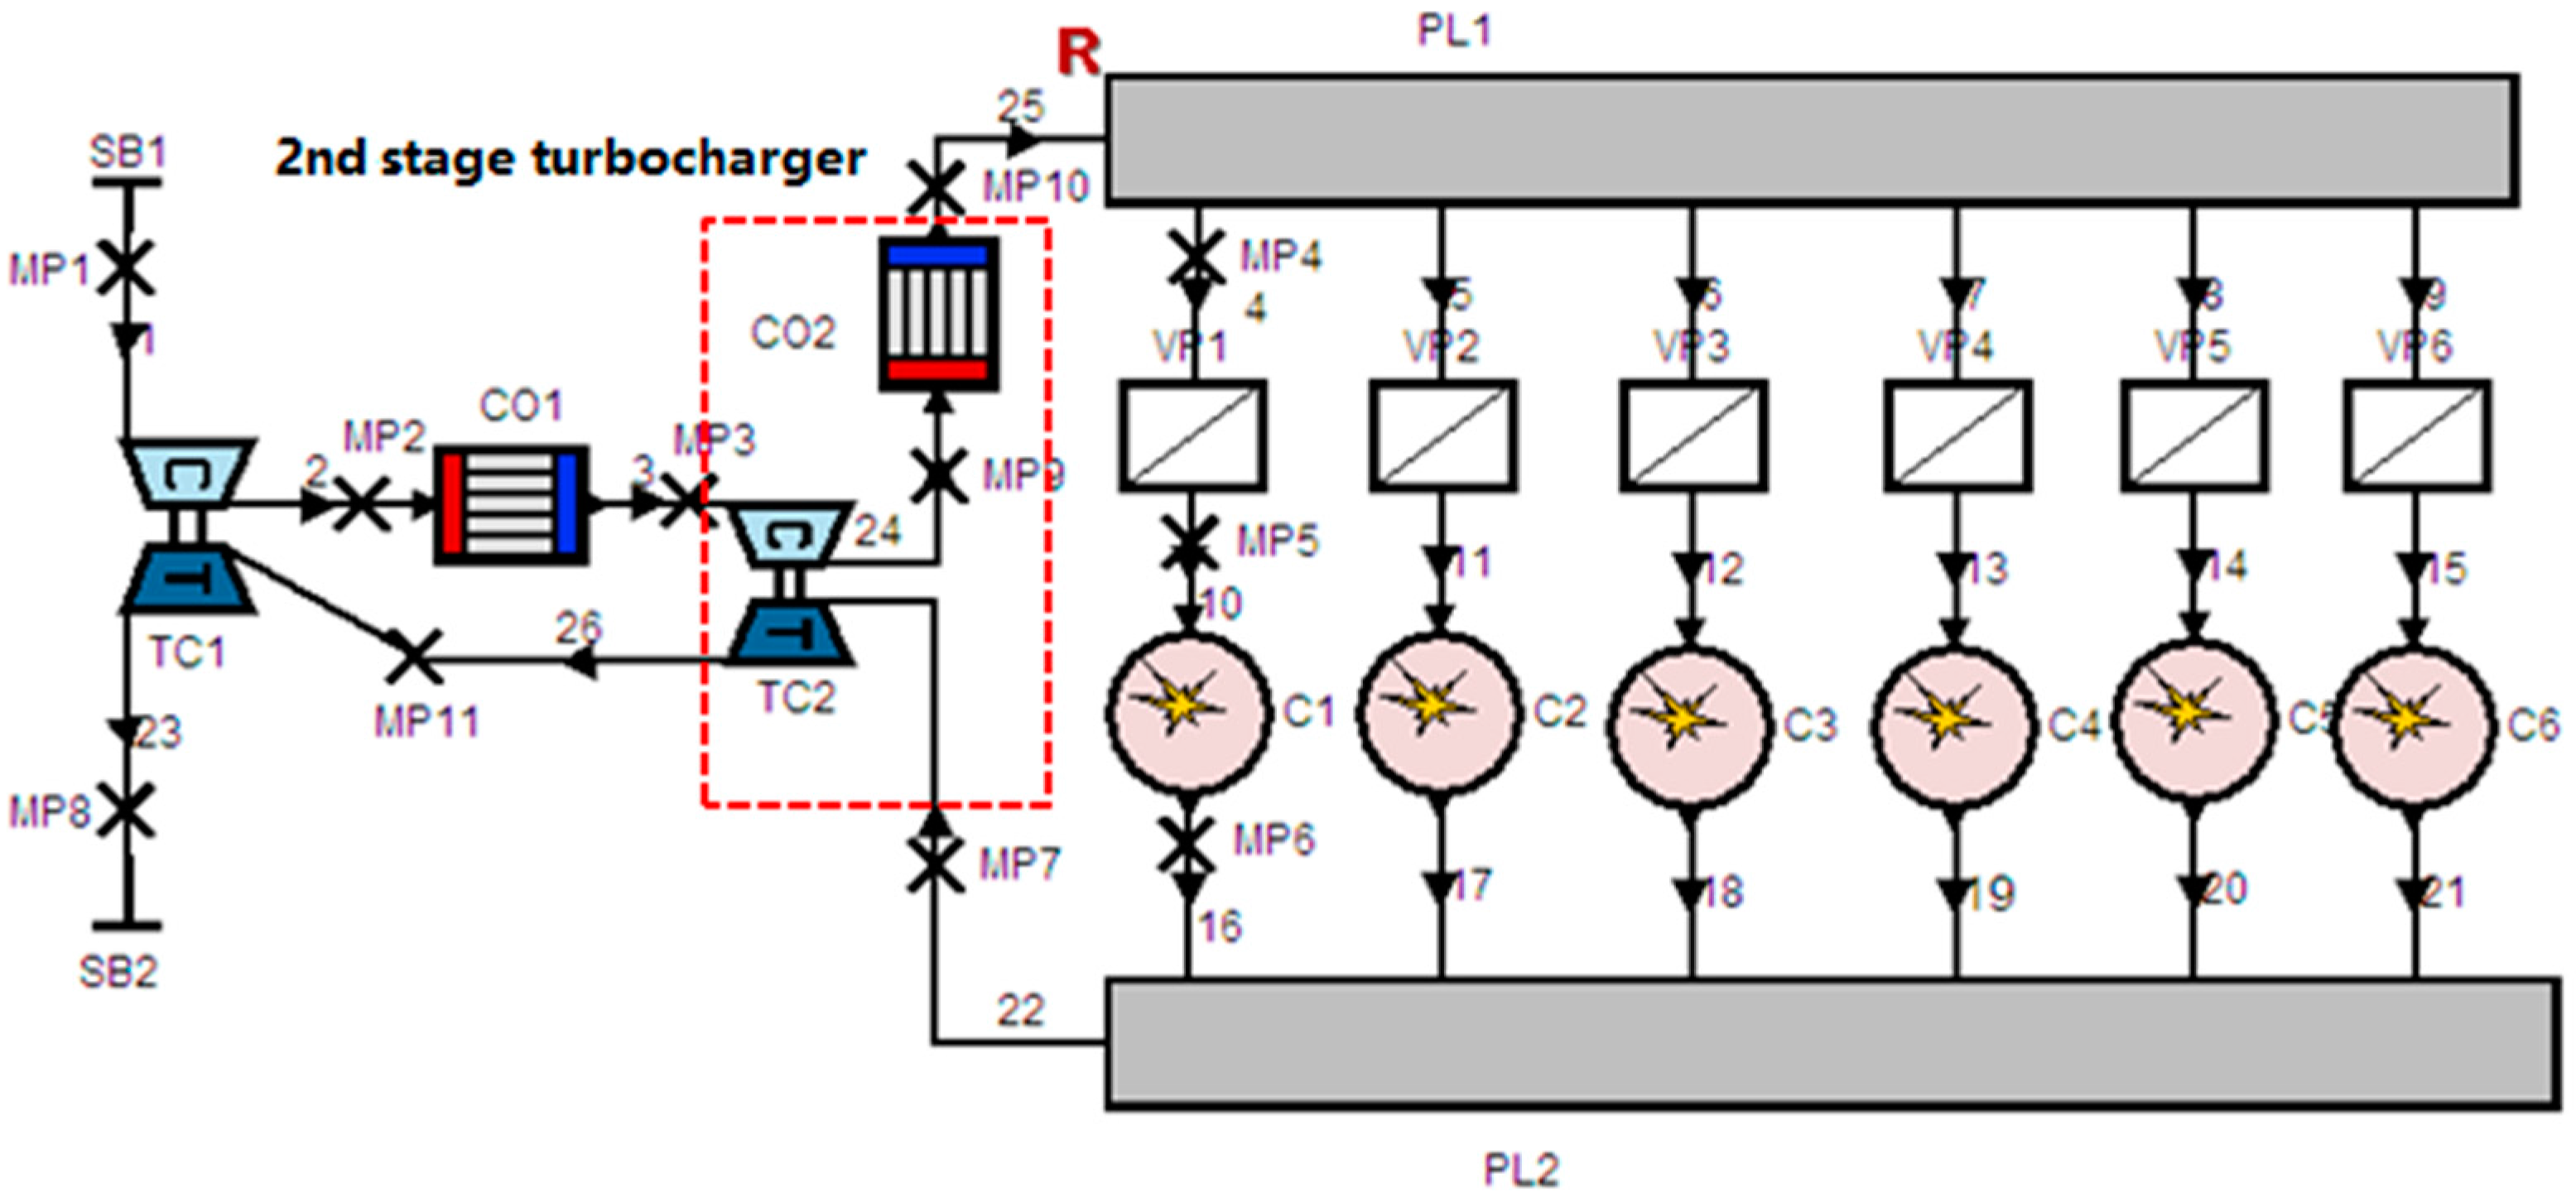
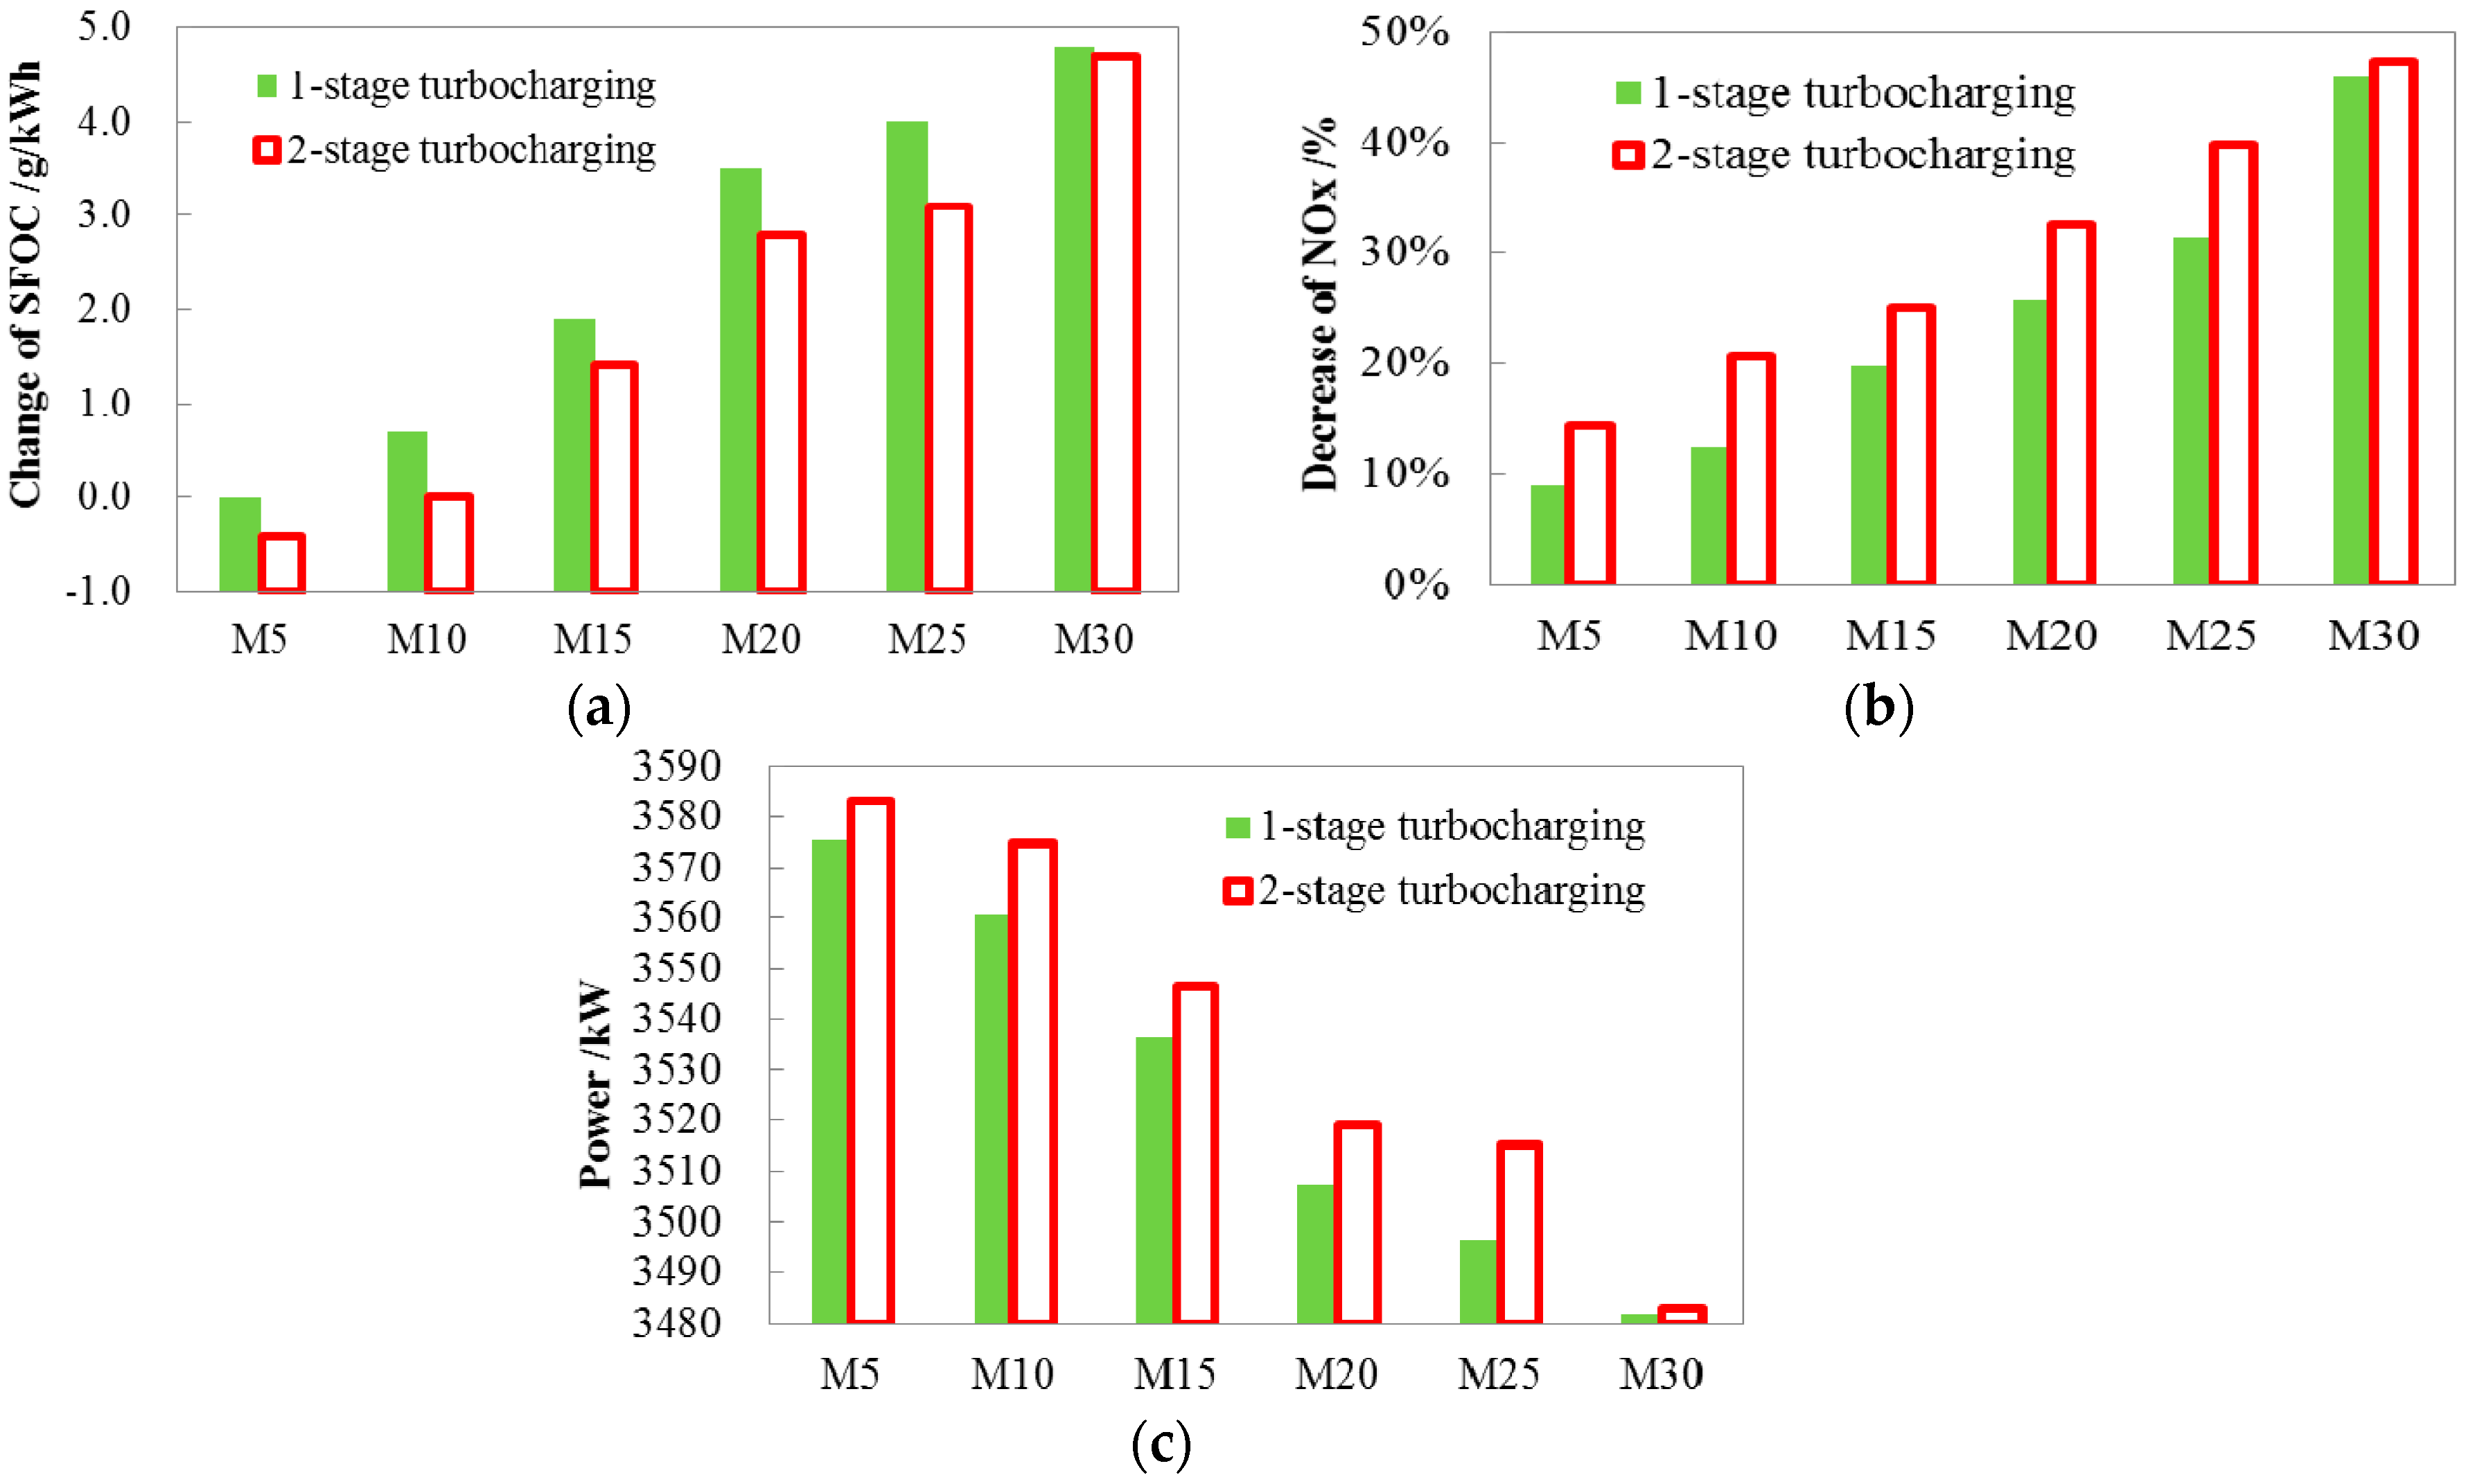
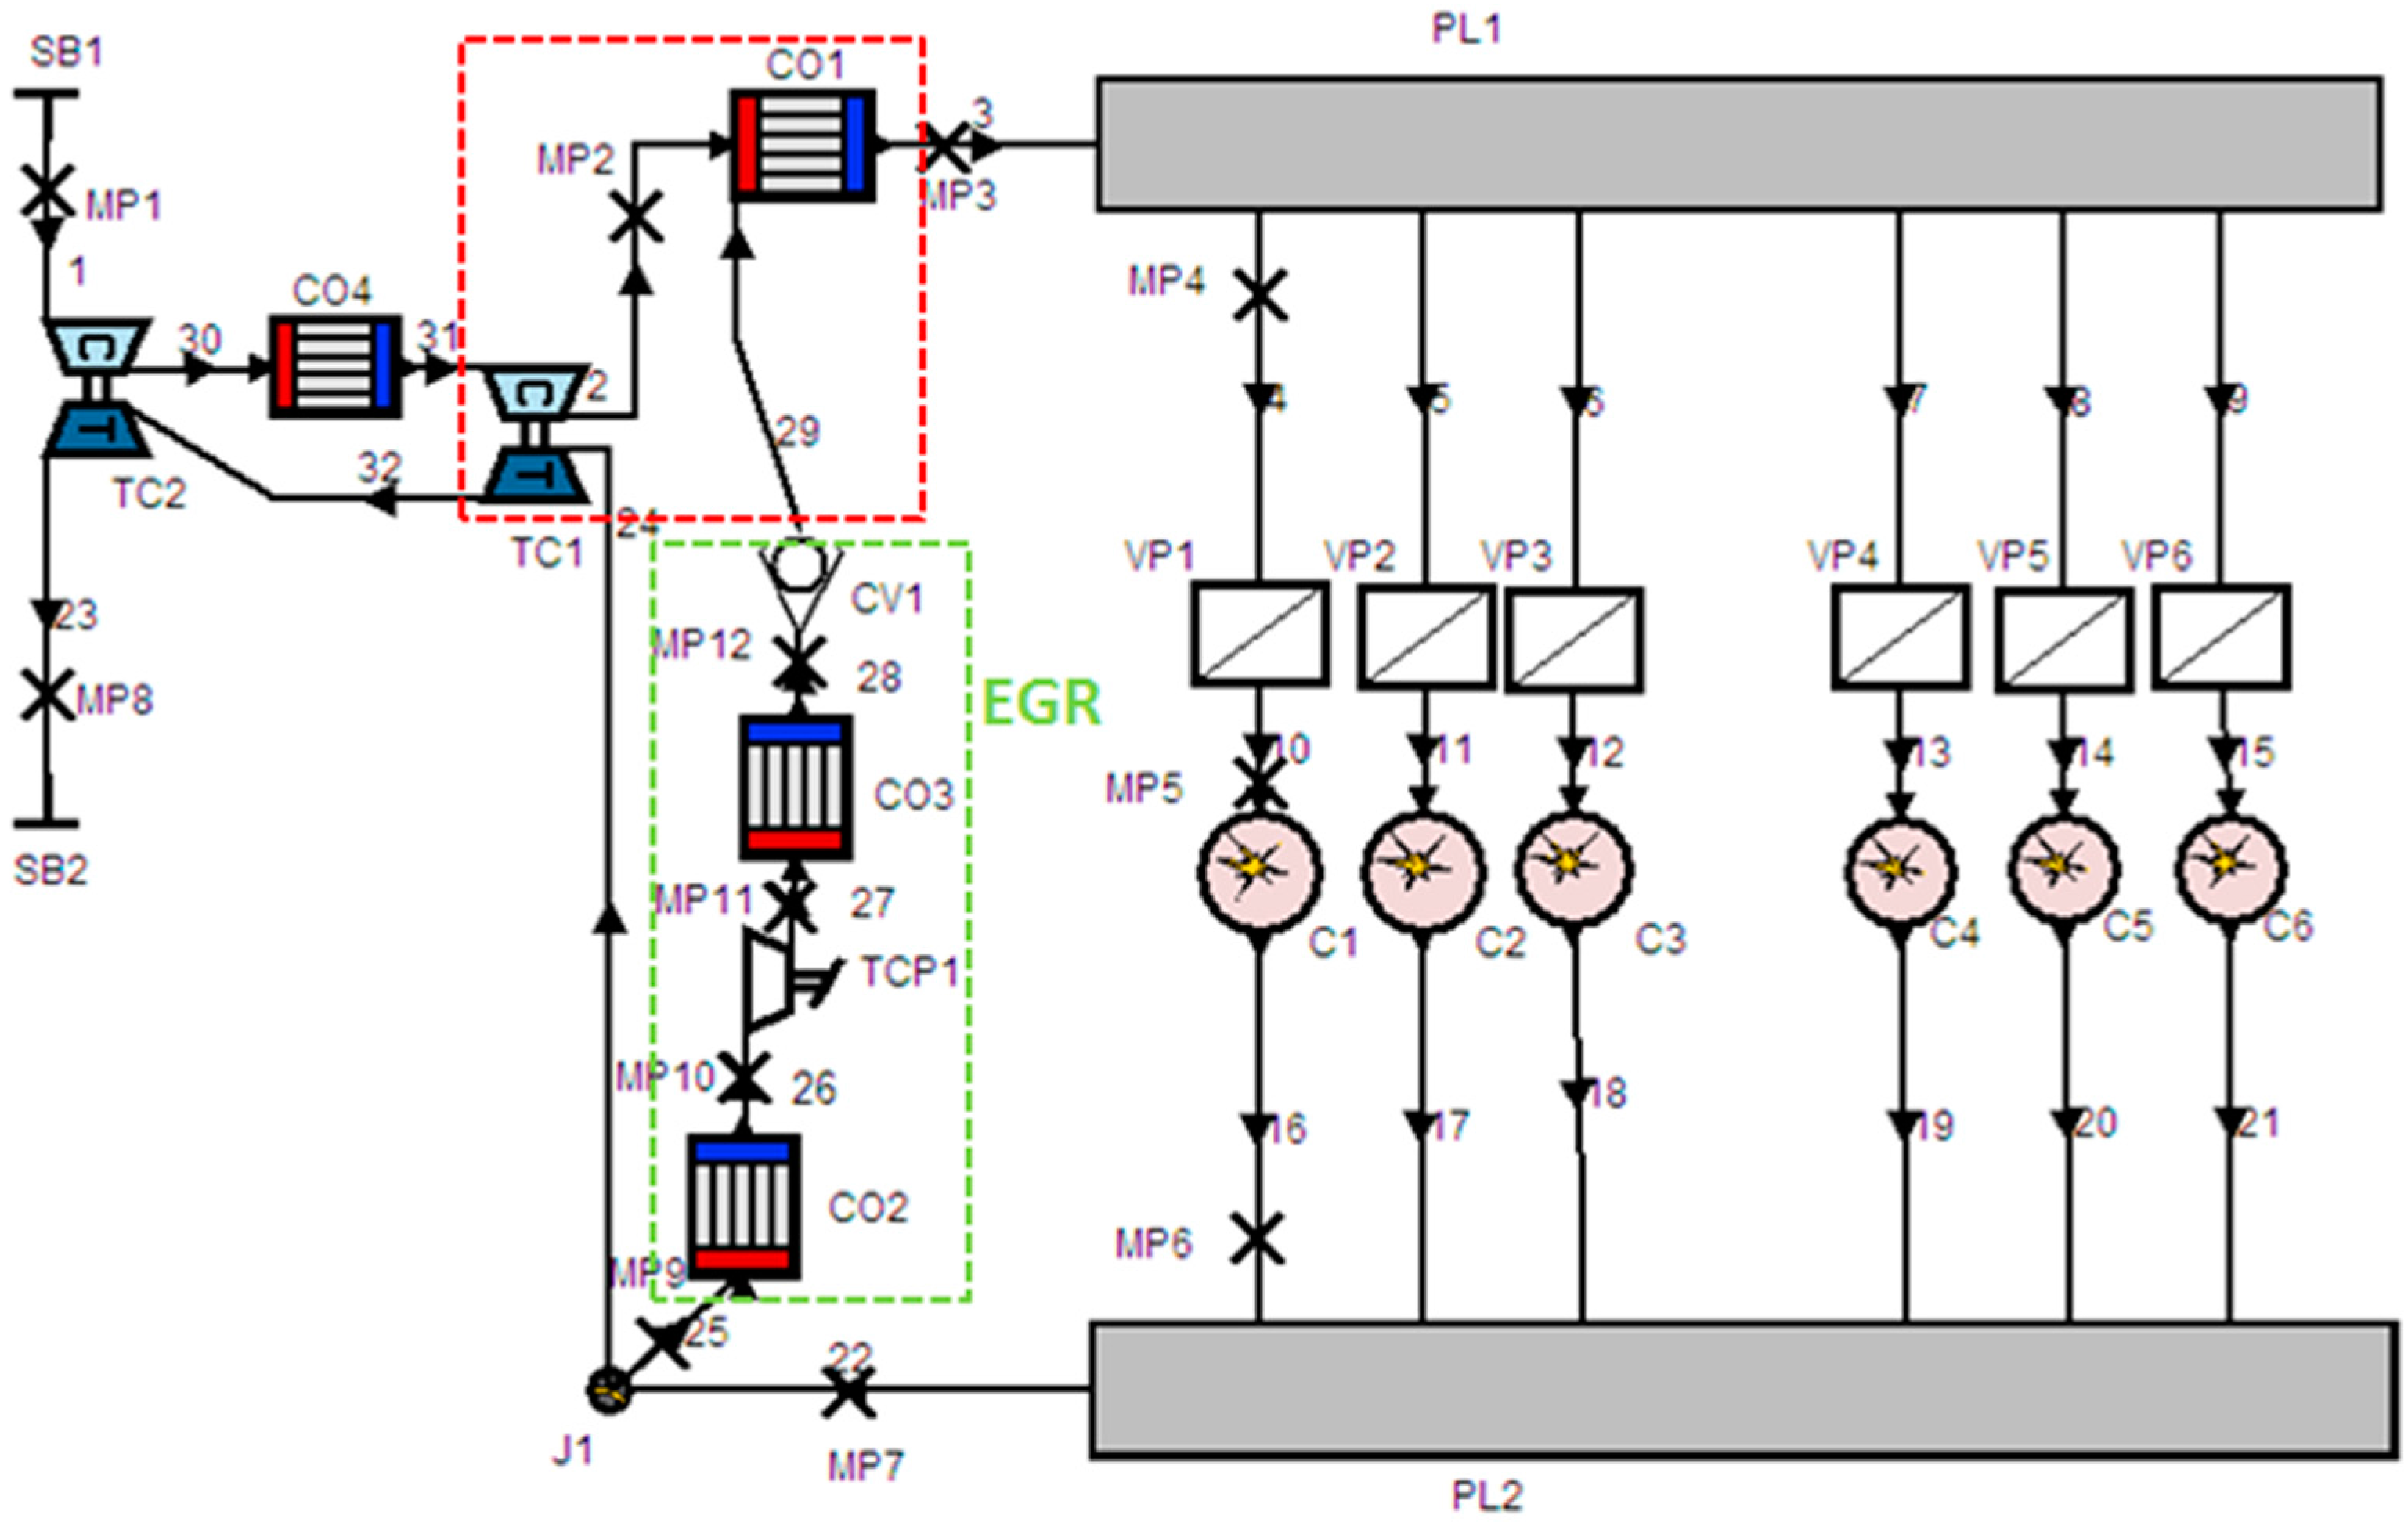
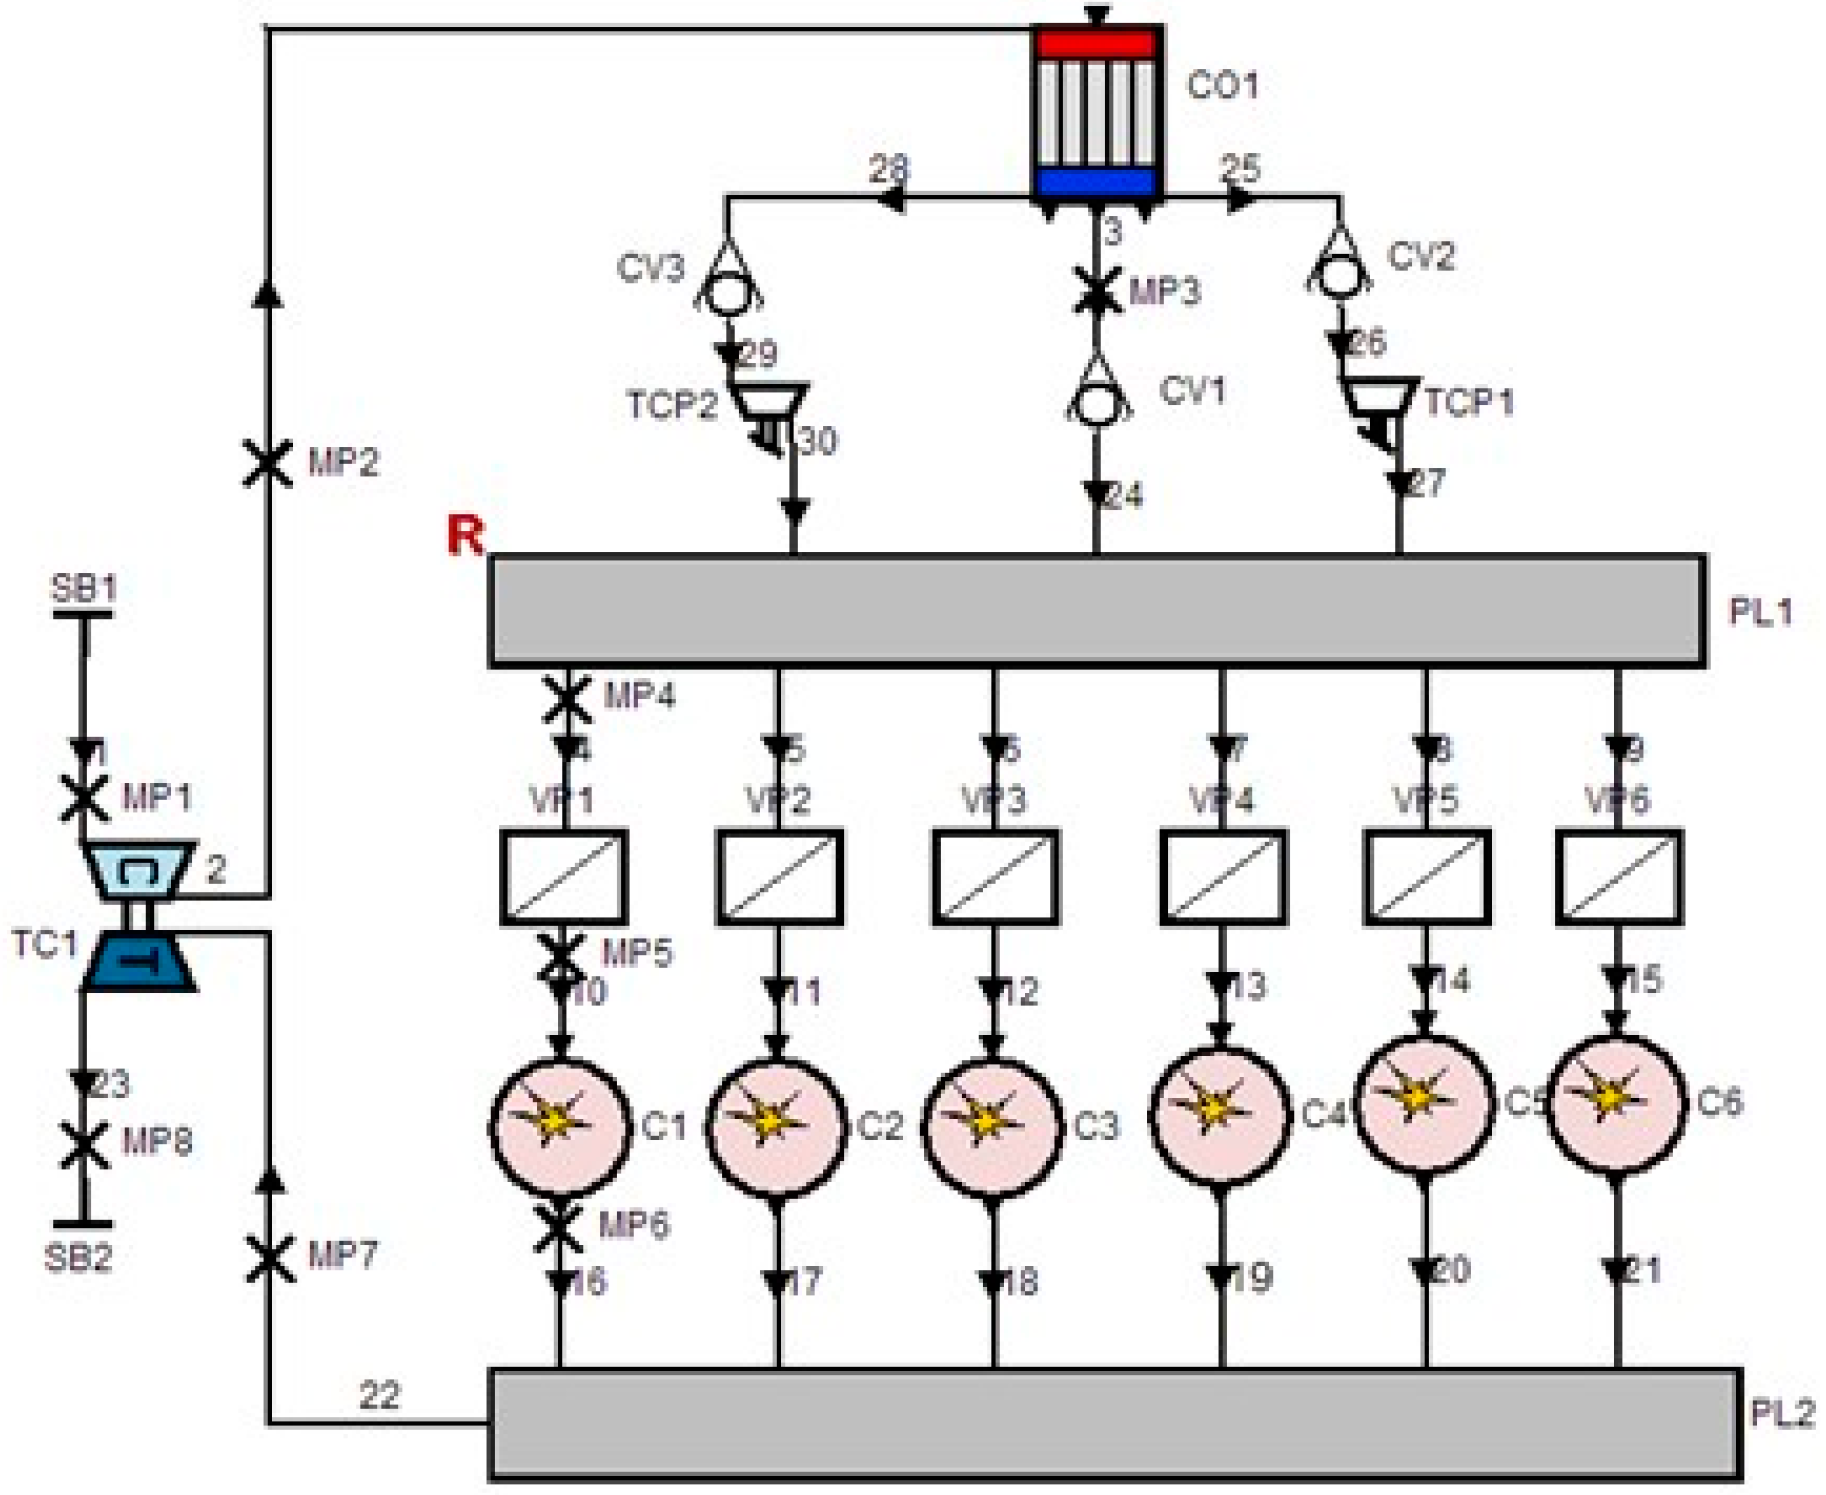
2.2.3. Miller-Cycle with a 2-Stage Turbocharging

Considering 2-stage turbocharging has higher charger efficiency and better fuel economy, the authors designed a model with a 2-stage turbocharging to simulate the six Miller-cycle cases. Figure 15 is the 1-D simulation model of the engine.
It has one more intercooler (shown as CO2) compared to the 1-stage turbocharging to further decrease intake temperature, which is an advantage to increase volumetric efficiency and reduce the combustion temperature. In order to compare the 1-stage and 2-stage turbocharging under the same conditions, for each Miller-cycle cases, the intake pressure values are the set to the same.
Figure 16 presents the comparison of NOx decrease extent, change of SFOC and engine power of the two turbocharging schemes. It is indicated that for all of the Miller-cycle cases, 2-stage turbocharging has lower SFOC and a greater NOx decrease than 1-stage turbocharging. Lower SFOC is basically due to the higher TC efficiency of 2-stage turbocharging than 1-stage turbocharging. In this research, the 2-stage turbocharging cases have 10% higher TC efficiency than the 1-stage turbocharging cases. This result is comparable to the test results on a medium-speed engine [21]. Research on a high-speed engine also presented a trend of SFOC decrease by using 2-stage turbocharging [22]. Due to its higher volumetric efficiency, 2-stage turbocharging cases present higher power than 1-stage turbocharging cases. These results indicate that the combination of Miller-cycle with a 2-stage turbocharging is more promising than with 1-stage turbocharging for decreasing NOx and saving energy.

2.3. Combination of Miller-Cycle and EGR

As mentioned above, the combination of Miller-cycle and a 2-stage turbocharging has a potential of NOx reduction by 47% compared with the baseline case. This reduction is still not enough to meet the IMO Tier 3 standard. Meanwhile, deeper Miller-cycle corresponds to higher SFOC. In order to further reduce NOx and still maintain good fuel economy, the combination of EGR and higher geometry CR was adopted and investigated. Referring to the schematics of an EGR system in a low-speed 2-stroke engine [13], a 1-D simulation model with an EGR system was made, which is shown in Figure 17. In the figure, CO2 represents a combination of a pre-scrubber, a water mist catcher, and a scrubber; TCP1 represents an EGR blower; CO3 is an EGR cooler; and CV1 is a change valve.
By applying EGR, the combustion temperature is reduced. Figure 18 present the 3-D simulation results of the engine with different EGR rate. It indicates that with the increase of EGR rate, the peak local temperature decreases. The peak local temperature of the M10-2s-E15 case is 2489 K, being 126 K lower than that of M10-2s case. Meanwhile, the EGR decelerate the combustion rate of the engine. Therefore, the case with EGR present apparent NOx reduction effect. This trend is shown in Figure 19.
Although the application of EGR can clearly reduce NOx, it also has a negative influence on the engine’s fuel economy. Especially, when the EGR rate is higher than 20%, the increase of SFOC is higher than 10 g/kW in the studied case. Meanwhile, a high EGR rate also causes high PM emissions. Therefore, this paper only adopted EGR rates lower than 20% and combined EGR with 2-stage turbocharging and mild Miller-cycle to decrease NOx. For the purpose of compensating the EGR and Miller-cycle’s negative influence on fuel economy, two higher geometric CR were used, which are 0.6 and 1.2 higher than the baseline, respectively. With such a combination, a number of cases were calculated. The calculation results are shown in Figure 20.
It is shown that the M10-2s-HCR1.2-E20 case (with the combination of Miller-cycle, 2-stage turbocharging, 1.2 higher compression ratio and EGR ratio of 20%, marked by a red circle) can meet IMO Tier 3 NOx standard, but with the penalty of 5.5 g/kWh higher SFOC than the baseline. The M10-2s-HCR0.6-E10 case (marked by a purple circle) has a NOx reduction potential of 55.6% and 1.2 g/kWh higher SFOC. The M15-2s-CR1.2-E10 case (marked by a yellow circle) has a NOx reduction potential of 47.9% and 0.45 g/kWh lower SFOC. The latter two cases are attractive candidates to combine other techniques to approach the IMO Tier 3 NOx standard.

3. Conclusions

On the basis of 1-D simulation and 3-D CFD simulation of the working process of a low-speed 2-stroke marine diesel engine, the potential of in-cylinder control methods to meet the IMO Tier 3 NOx emission standard was evaluated and the following conclusions can be made:
(1)
By extending EVO timing, a Miller-cycle can be applied in low-speed 2-stroke marine diesel engines to decrease NOx emissions. Since further increasing the intake pressure is needed for the application of Miller-cycles, 2-stage turbocharging is necessary to ensure high TC efficiency and maintain good fuel economy. In addition, since 2-stage turbocharging has a lower intake temperature, it is more advantageous to further decrease NOx emissions and increase power.
(2)
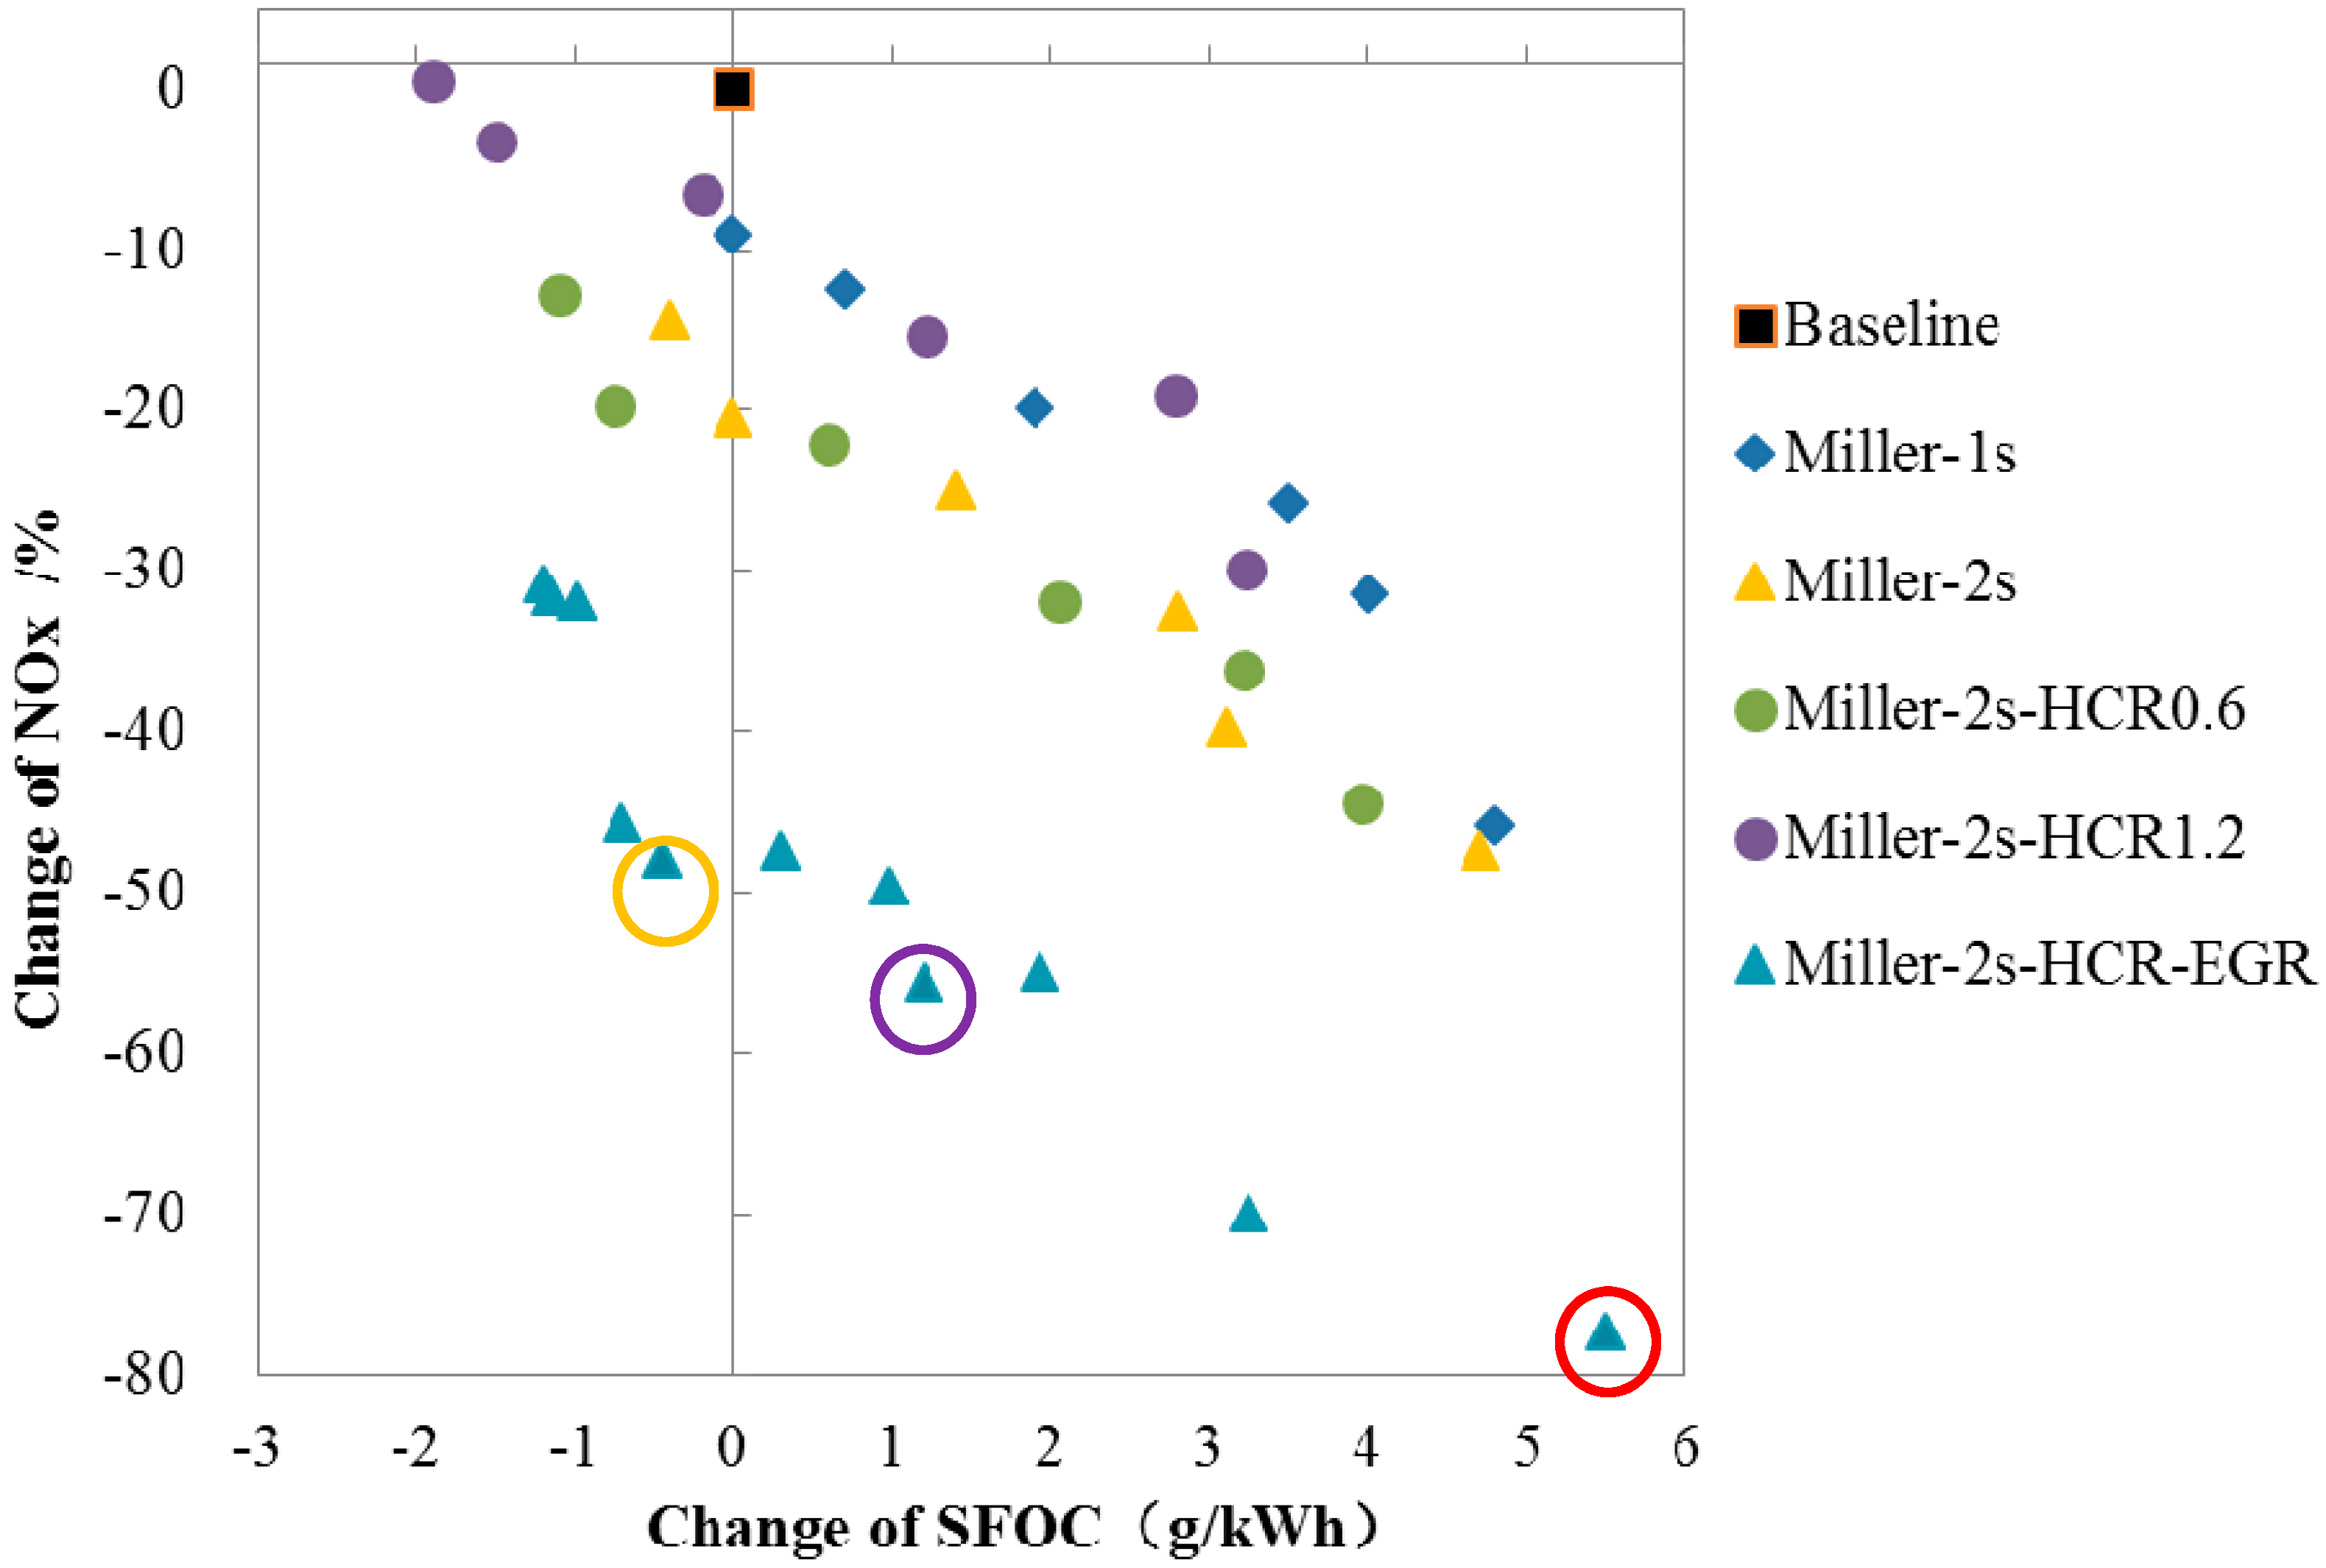
The combination of 2-stage turbocharging, Miller-cycle and EGR has the potential of decreasing the researched engine’s NOx emissions by 77% and meeting the IMO Tier 3 standard, but the existing case that complies with the Tier 3 standard has the deficiency of too high an increase of SFOC. This is unacceptable for engine users.
(3)
The case with a mild Miller-cycle and 10% EGR has the potential of decreasing NOx by 56% with a slight increase of SFOC; the case with a medium Miller-cycle and 10% EGR but 1.2 higher CR has a NOx reduction potential of 47.9% and 0.45 g/kWh lower SFOC. Although these two cases do not meet the IMO Tier 3 standard, they already reduce NOx emissions considerably. Considering that there are other applicable NOx reduction techniques such as combustion tuning, water emulsification, direct water injection, which have the NOx reduction potentials of 10%, 25%, and 50%, respectively [2], if these techniques were combined with this case, the IMO Tier 3 standard could be reached with only a slight increase of SFOC.

Acknowledgments

This work was supported by the Natural Science Foundation of China (Grant No. 51479028 and No. 51079026) and the Fundamental Research Funds for the Central Universities (Grant No. DUT15ZD102).

Author Contributions

All the authors have co-operated for the preparation of the work. Liyan Feng and Wuqiang Long have designed the research. A part of experiment and analysis were carried out by Jiangping Tian, Weixin Gong, Baoguo Du, Dan Li and Lei Chen.

Conflicts of Interest

The authors declare no conflict of interest.

References

  1. International Maritime Organization. Nitrogen Oxides (NOx)—Regulation 13. Available online: http://www.imo.org/en/OurWork/Environment/PollutionPrevention/AirPollution/Pages/Nitrogen-oxides-%28NOx%29-%E2%80%93-Regulation-13.aspx (accessed on 10 February 2016).
  2. Wik, C. Reducing medium-speed engine emissions. J. Mar. Eng. Technol. 2010, 9, 37–44. [Google Scholar]
  3. Miller, R.; Lieberherr, H.U. The Miller supercharging system for diesel and gas engines operating characteristics. In Proceedings of the 5th CIMAC Congress, Zurich, Switzerland, 15–22 June 1957.
  4. Kamo, R.; Mavinahally, N.; Kamo, L.; Bryzik, W.; Reid, M. Emissions Comparisons of an Insulated Turbocharged Multi-Cylinder Miller Cycle Diesel Engine. In SAE Technical Paper 980888, Proceedings of the International Congress and Exposition, Detroit, MI, USA, 23–26 February 1998.
  5. Ishizuki, Y.; Shimizu, Y.; Hikino, H.; Kawashima, Y. A New Type of Miller Supercharging System for High Speed Engines-Part 2—Realization of High BMEP Diesel Engines. In SAE Technical Paper 851523, Proceedings of the 1985 SAE International Off-Highway and Powerplant Congress and Exposition, Milwaukee, WI, USA, 9–12 September 1985.
  6. Brückner, C.; Kyrtatos, P.; Boulouchos, K. Extending the NOx Reduction Potential with Miller Valve Timing Using Pilot Fuel Injection on a Heavy-Duty Diesel Engine. SAE Int. J. Engines 2014, 7, 1838–1850. [Google Scholar] [CrossRef]
  7. Niemi, S.; Nousiainen, P.; Lassila, P.; Tikkanen, V.; Ekman, K. Effects of Miller timing on the performance and exhaust emissions of a non-road diesel engine. In Proceedings of the 26th CIMAC Congress, Paper No. 52, Bergen, Norway, 14–16 June 2010.
  8. Benajes, J.; Molina, S.; Novella, R.; Riesco, M. Improving pollutant emissions in diesel engines for heavy-duty transportation using retarded intake valve closing strategies. Int. J. Autom. Technol. 2008, 9, 257–265. [Google Scholar] [CrossRef]
  9. Millo, F.; Gianoglio, M.; Delneri, D. Combining dual stage turbocharging with extreme Miller timings to achieve NOx emissions reductions in marine diesel engines. In Proceedings of the 26th CIMAC Congress, Paper No. 210, Bergen, Norway, 14–16 June 2010.
  10. Imperato, M.; Nurmiranta, J.; Sarjovaara, T.; Larmi, M.; Wik, C. Multi-injection and advanced Miller timing in large-bore CI engine. In Proceedings of the 27th CIMAC Congress, Paper No. 157, Shanghai, China, 13–16 May 2013.
  11. Fiedler, M.; Fiedler, H.; Boy, P. Experimental Experience Gained with a Long-Stroke Medium-Speed Diesel Research engine using Two Stage Turbo Charging and Extreme Miller Cycle. In Proceedings of the 27th CIMAC Congress, Paper No. 253, Shanghai, China, 13–16 May 2013.
  12. Higashida, M.; Nakamura, T.; Onishi, I.; Yoshizawa, K.; Takata, H.; Hosono, T. Newly Developed Combined EGR & WEF System to comply with IMO NOx Regulation Tier 3 for Two-stroke Diesel Engine. In Proceedings of the 27th CIMAC Congress, Paper No. 200, Shanghai, China, 13–16 May 2013.
  13. Kaltoft, J.; Preem, M. Development of integrated EGR system for two-stroke diesel engines. In Proceedings of the 27th CIMAC Congress, Paper No. 219, Shanghai, China, 13–16 May 2013.
  14. Stoeber-Schmidt, C.; Eilts, P. Strategies for switching between ECA and nonECA operation for a medium-speed diesel engine with EGR. In Proceedings of the 27th CIMAC Congress, Paper No. 232, Shanghai, China, 13–16 May 2013.
  15. MAN Diesel & Turbo, Tier III Two-Stroke Technology. Available online: http://marine.man.eu/docs/librariesprovider6/technical-papers/tier-iii-two-stroke-technology.pdf?sfvrsn=18 (accessed on 10 February 2016).
  16. Liu, A.B.; Mather, D.; Reitz, R.D. Modeling the effects of drop drag and breakup on fuel sprays. In SAE Technical Paper 930072, Proceedings of the International Congress and Exposition, Detroit, MI, USA, 1–5 March 1993.
  17. Colin, O.; Benkenida, A. The 3-Zones Extended Coherent Flame Model (ECFM3Z) for Computing Premixed/Diffusion Combustion. Oil Gas Sci. Technol.—Rev. IFP 2004, 59, 593–560. [Google Scholar] [CrossRef]
  18. AVL List GmbH. ICE Physics & Chemistry, 2008, AVL FIRE User Manual v.2008; AVL List GmbH: Graz, Austria, 2008. [Google Scholar]
  19. Heywood, J. Internal Combustion Engine Fundamentals; McGraw-Hill: New York, NY, USA, 1988. [Google Scholar]
  20. Dec, J.; Canaan, R. PLIF Imaging of NO Formation in a DI Diesel Engine. In SAE Technical Paper 980147, Proceedings of the International Congress and Exposition, Detroit, MI, USA, 23–26 February 1998.
  21. Wik, C.; Hallbäck, B. Reducing emissions using 2-stage turbo charging. Wärtsilä Tech. J. 2008, 1, 35–41. [Google Scholar]
  22. Quazi, M.; Dhiman, V.; Singh, S. Development of Two-stage Turbocharger System for Off Road Application Diesel Engine in Order to Achieve 75 HP. In SAE Technical Paper 2013-01-2749, Proceedings of the 8th SAEINDIA International Mobility Conference & Exposition and Commercial Vehicle Engineering Congress 2013 (SIMCOMVEC), Chennai, Tamil Nadu, India, 4–7 December 2013.
Figure 1. The coupled three-dimensional (3-D) Computational Fluid Dynamics (CFD) calculation and 1-D working process calculation for the evaluation of NOx reduction of the engine. CAD, Computer Aided Design; CR, Compression Ratio; EGR, Exhaust Gas Recirculation; EVC, Exhaust Valve Closing; NOx, nitrogen oxides; SFOC, Specific Fuel Oil Consumption; TC, turbocharger.
Energies 09 00304 g001
Figure 2. One-dimensional (1-D) working simulation model of the baseline engine.
Energies 09 00304 g002
Figure 3. Three-dimensional (3-D) Computational Fluid Dynamics (CFD) model of a cylinder or the engine.
Energies 09 00304 g003
Figure 4. Comparison of measured and calculated cylinder pressure curves.
Energies 09 00304 g004
Figure 5. Comparison of measured and calculated results of NOx emissions.
Energies 09 00304 g005
Figure 6. Fuel spray at the time of 364 °CA.
Energies 09 00304 g006
Figure 7. Temperature distribution in cylinder during combustion process.
Energies 09 00304 g007
Figure 8. NOx formation in cylinder.
Energies 09 00304 g008
Figure 9. Exhaust valve lift curves of the six Miller timings.
Energies 09 00304 g009
Figure 10. Intake pressure values of different schemes.
Energies 09 00304 g010
Figure 11. Comparison of pressure curves of different Miller-cycle schemes.
Energies 09 00304 g011
Figure 12. Comparison of peak local temperatures of different cases.
Energies 09 00304 g012
Figure 13. Comparison of cylinder temperature distribution of Miller-cycle cases.
Energies 09 00304 g013
Figure 14. NOx distribution of Miller-cycle cases.
Energies 09 00304 g014
Figure 15. One-dimensional (1-D) simulation model of the engine with 2-stage turbocharger.
Energies 09 00304 g015
Figure 16. Comparison of (a) the change of Specific Fuel Oil Consumption (SFOC); (b) specific NOx emissions and (c) engine power between 1-stage and 2-stage turbocharging.
Energies 09 00304 g016
Figure 17. One-dimensional (1-D) simulation model of the engine with 2-stage turbocharging and Exhaust Gas Recirculation (EGR) system.
Energies 09 00304 g017
Figure 18. Comparison of temperature distribution in cylinder for Exhaust Gas Recirculation (EGR) cases. Note: 2-s means 2-stage turbocharging; E5, E10 and E15 mean EGR rates are 5%, 10% and 15% respectively.
Energies 09 00304 g018
Figure 19. Comparison of NOx distribution in cylinder for Exhaust Gas Recirculation (EGR) cases.
Energies 09 00304 g019
Figure 20. Map of NOx and Specific Fuel Oil Consumption (SFOC) changing of the researched cases.
Energies 09 00304 g020
Table 1. Primary parameters of the research engine.
ItemParameter
Number of cylinders6
Bore × stroke (mm)350 × 1550
Length of connecting rod (mm)1550
Geometric compression ratio (CR)21.3
Number of injectors for each cylinder2
Rated speed (r/min)142
Rated power (kW)3575
Table 2. Comparison of simulated and tested results.
ItemsMeasured ValuesCalculated ValuesDeviations
Pe (kW)35753575.70.02%
pmax (bar)177.0177.30.17%
pcompression (bar)164.7164.90.12%
SFOC (g/kWh)180.0180.10.06%
Pe, rated power; pmax, maximum cylinder pressure; pcompression, cylinder pressure at the end of compression; SFOC, Specific Fuel Oil Consumption.
Table 3. Major parameters of the NOx analyzer used in test bench.
ManufacturerModelMeasurement RangeSpan Gas ConcentrationDeviation
CAI USACLD 6000–2000 ppm1904.4 ppm≤0.2%
CAI, California Analytical Instruments, Inc. (Orange, CA, USA).
Table 4. Comparison of engine performance of Miller-cycle cases.
ItemsBaselineM5M10M15M20M25M30
pmax (bar)177172.6169.7165.3160.5160.3157.3
Pe (kW)3577357535613537350734973482
Reduction of Pe (%)-0.060.451.121.962.242.66
Change of SFOC (g/kWh)0.00.0+0.7+1.9+3.5+4.0+4.8
Excess air ratio2.262.222.192.132.062.092.10
Decrease of specific NOx (%)-9.112.519.825.831.545.8
Pe, rated power; pmax, maximum cylinder pressure; SFOC, Specific Fuel Oil Consumption.

