Article

The Effect of Biomass Physical Properties on Top-Lit Updraft Gasification of Woodchips

by
Arthur M. James R.
1,
Wenqiao Yuan
2,* and
Michael D. Boyette
2
1
Department of Mechanical Engineering, Universidad Tecnológica de Panamá, Apartado 0819-07289, El Dorado, Panamá City, Panama
2
Department of Biological and Agricultural Engineering, North Carolina State University, Campus Box 7625, Raleigh 27695, NC, USA
*
Author to whom correspondence should be addressed.
Energies 2016, 9(4), 283; https://doi.org/10.3390/en9040283
Submission received: 4 February 2016 / Revised: 28 March 2016 / Accepted: 6 April 2016 / Published: 12 April 2016

Abstract

:
The performance of a top-lit updraft gasifier affected by biomass (pine wood) particle size, moisture content and compactness was studied in terms of the biochar yield, biomass burning rate, syngas composition and tar content. The highest biochar yield increase (from 12.2% to 21.8%) was achieved by varying the particle size from 7 to 30 mm, however, larger particles triggered tar generation that reached its maximum of 93.5 g/m3 syngas at 30-mm biomass particles; in contrast, the hydrogen content in syngas was at its minimum of 2.89% at this condition. The increase in moisture content from 10% to 22% reduced biochar yield from 12% to 9.9%. It also reduced the tar content from 12.9 to 6.2 g/m3 which was found to be the lowest range of tar content in this work. Similarly, the carbon monoxide composition in syngas decreased to its minimum of 11.16% at moisture content of 22%. Finally, the biomass compactness increased biochar yield up to 17% when the packing mass was 3 kg. However, the addition of compactness also increased the tar content in syngas, but little effect was noticed in syngas composition.

1. Introduction

The use of lignocellulosic biomass to produce energy and biomaterials has increased significantly in the last decades [1,2]. Compared to petroleum-based products, biomass-based fuels generate less net carbon emissions since these biomass-based materials are formed as a result of carbon dioxide used by plants during the growing process [3]. Similarly, biomaterials are reported to be more environmentally friendly than their petroleum-based equivalents [4]. Biochar and syngas are some examples of well-known products from biomass conversion processes. Biochar is the result of the thermal devolatilization or pyrolysis of biomass in an oxygen-limited condition at temperatures higher than 300 °C [5]. This carbon rich material can have high absorption capacity, and, thus, can be used to purify liquid and gas media [6,7]. In addition, biochar can be used to improve soil quality because of the improved retention of nutrients and its surface area that serves as support for microbes in the soil [8]. In a similar way, the thermochemical conversion of biomass as a result of incomplete combustion may produce syngas, which is a mixture of H2 and CO, in addition to other non-combustible gases, such as CO2 and N2 [9]. Syngas from biomass gasification presents low H2/CO ratios that require adjustment for specific applications (e.g., Fischer Tropsch synthesis) [10]. Syngas reforming, tar cracking and water gas shift reaction are some of the current techniques used to adjust the H2/CO ratio of syngas from gasification [11,12]. This gaseous fuel can be used to generate heat in boilers, electricity in turbines, hydrocarbons via Fischer-Tropsch processes and ethanol through biological conversion [13,14,15]. There are a wide number of biomass gasification technologies that are designed to process different feedstock; fixed bed and fluidized bed gasifiers are the two major categories [16]. Examples of fixed bed gasifiers are the downdraft, updraft, crossdraft and top-lit updraft gasifiers [17,18]. Extensive work has been published on the individual production of biochar or syngas [19,20]. However, attempts to simultaneously produce biochar in biomass gasifier systems has been rare and challenging [21]. For instance, Qian et al. [22] tested a fluidized bed gasifier for the production and characterization of biochar. However, the yield of biochar was not reported due to incapacity to retrieve the produced biochar after reaction, as consequence of the use of a system designed to generate gas products.
The top-lit updraft gasifier (TLUD) also known as inverter downdraft gasifier has the capabilities to produce syngas and biochar simultaneously [23]. Most of the published work on TLUDs has been focused on the application of this reactor for cooking purposes in developing countries since it generates low pollutant emissions with relatively high efficiency [24,25,26,27]. Brown [28] recognized the potential of the top-lit updraft configuration for the production of biochar and remarked the lack of research on this process. The fact that this reactor can produce biochar and syngas in a single chamber can increase the overall efficiency of this process. However, it is apparent that the physical properties of the biomass can significantly affect the performance of gasification and the quality of the biochar [29]. For example, Huangfu et al. [30] carried out experiments in a top-lit updraft stove to investigate the effect of the biomass moisture content. However, information about the syngas composition and tar content were not reported. In a similar way, Tinaut et al. [31] investigated the effect of biomass particle size on the performance of a top-lit updraft gasifier. However, the work was focused on the rate of biomass consumption as well as the heat transfer distribution throughout the gasification bed, but it did not contribute to understanding the effect of the particle size on the products of gasification.
The objective of this study was to understand the effect of the physical properties of the biomass on the performance of a top-lit updraft biomass gasifier. Woodchips with varying particle sizes, moisture contents and biomass compactness were studied. Combustion temperature, burning rate, biochar yield, syngas composition and tar contents were evaluated. This approach could help to identify potential variations of product distribution and gasification mechanisms due to changes in the physical properties of the raw material.

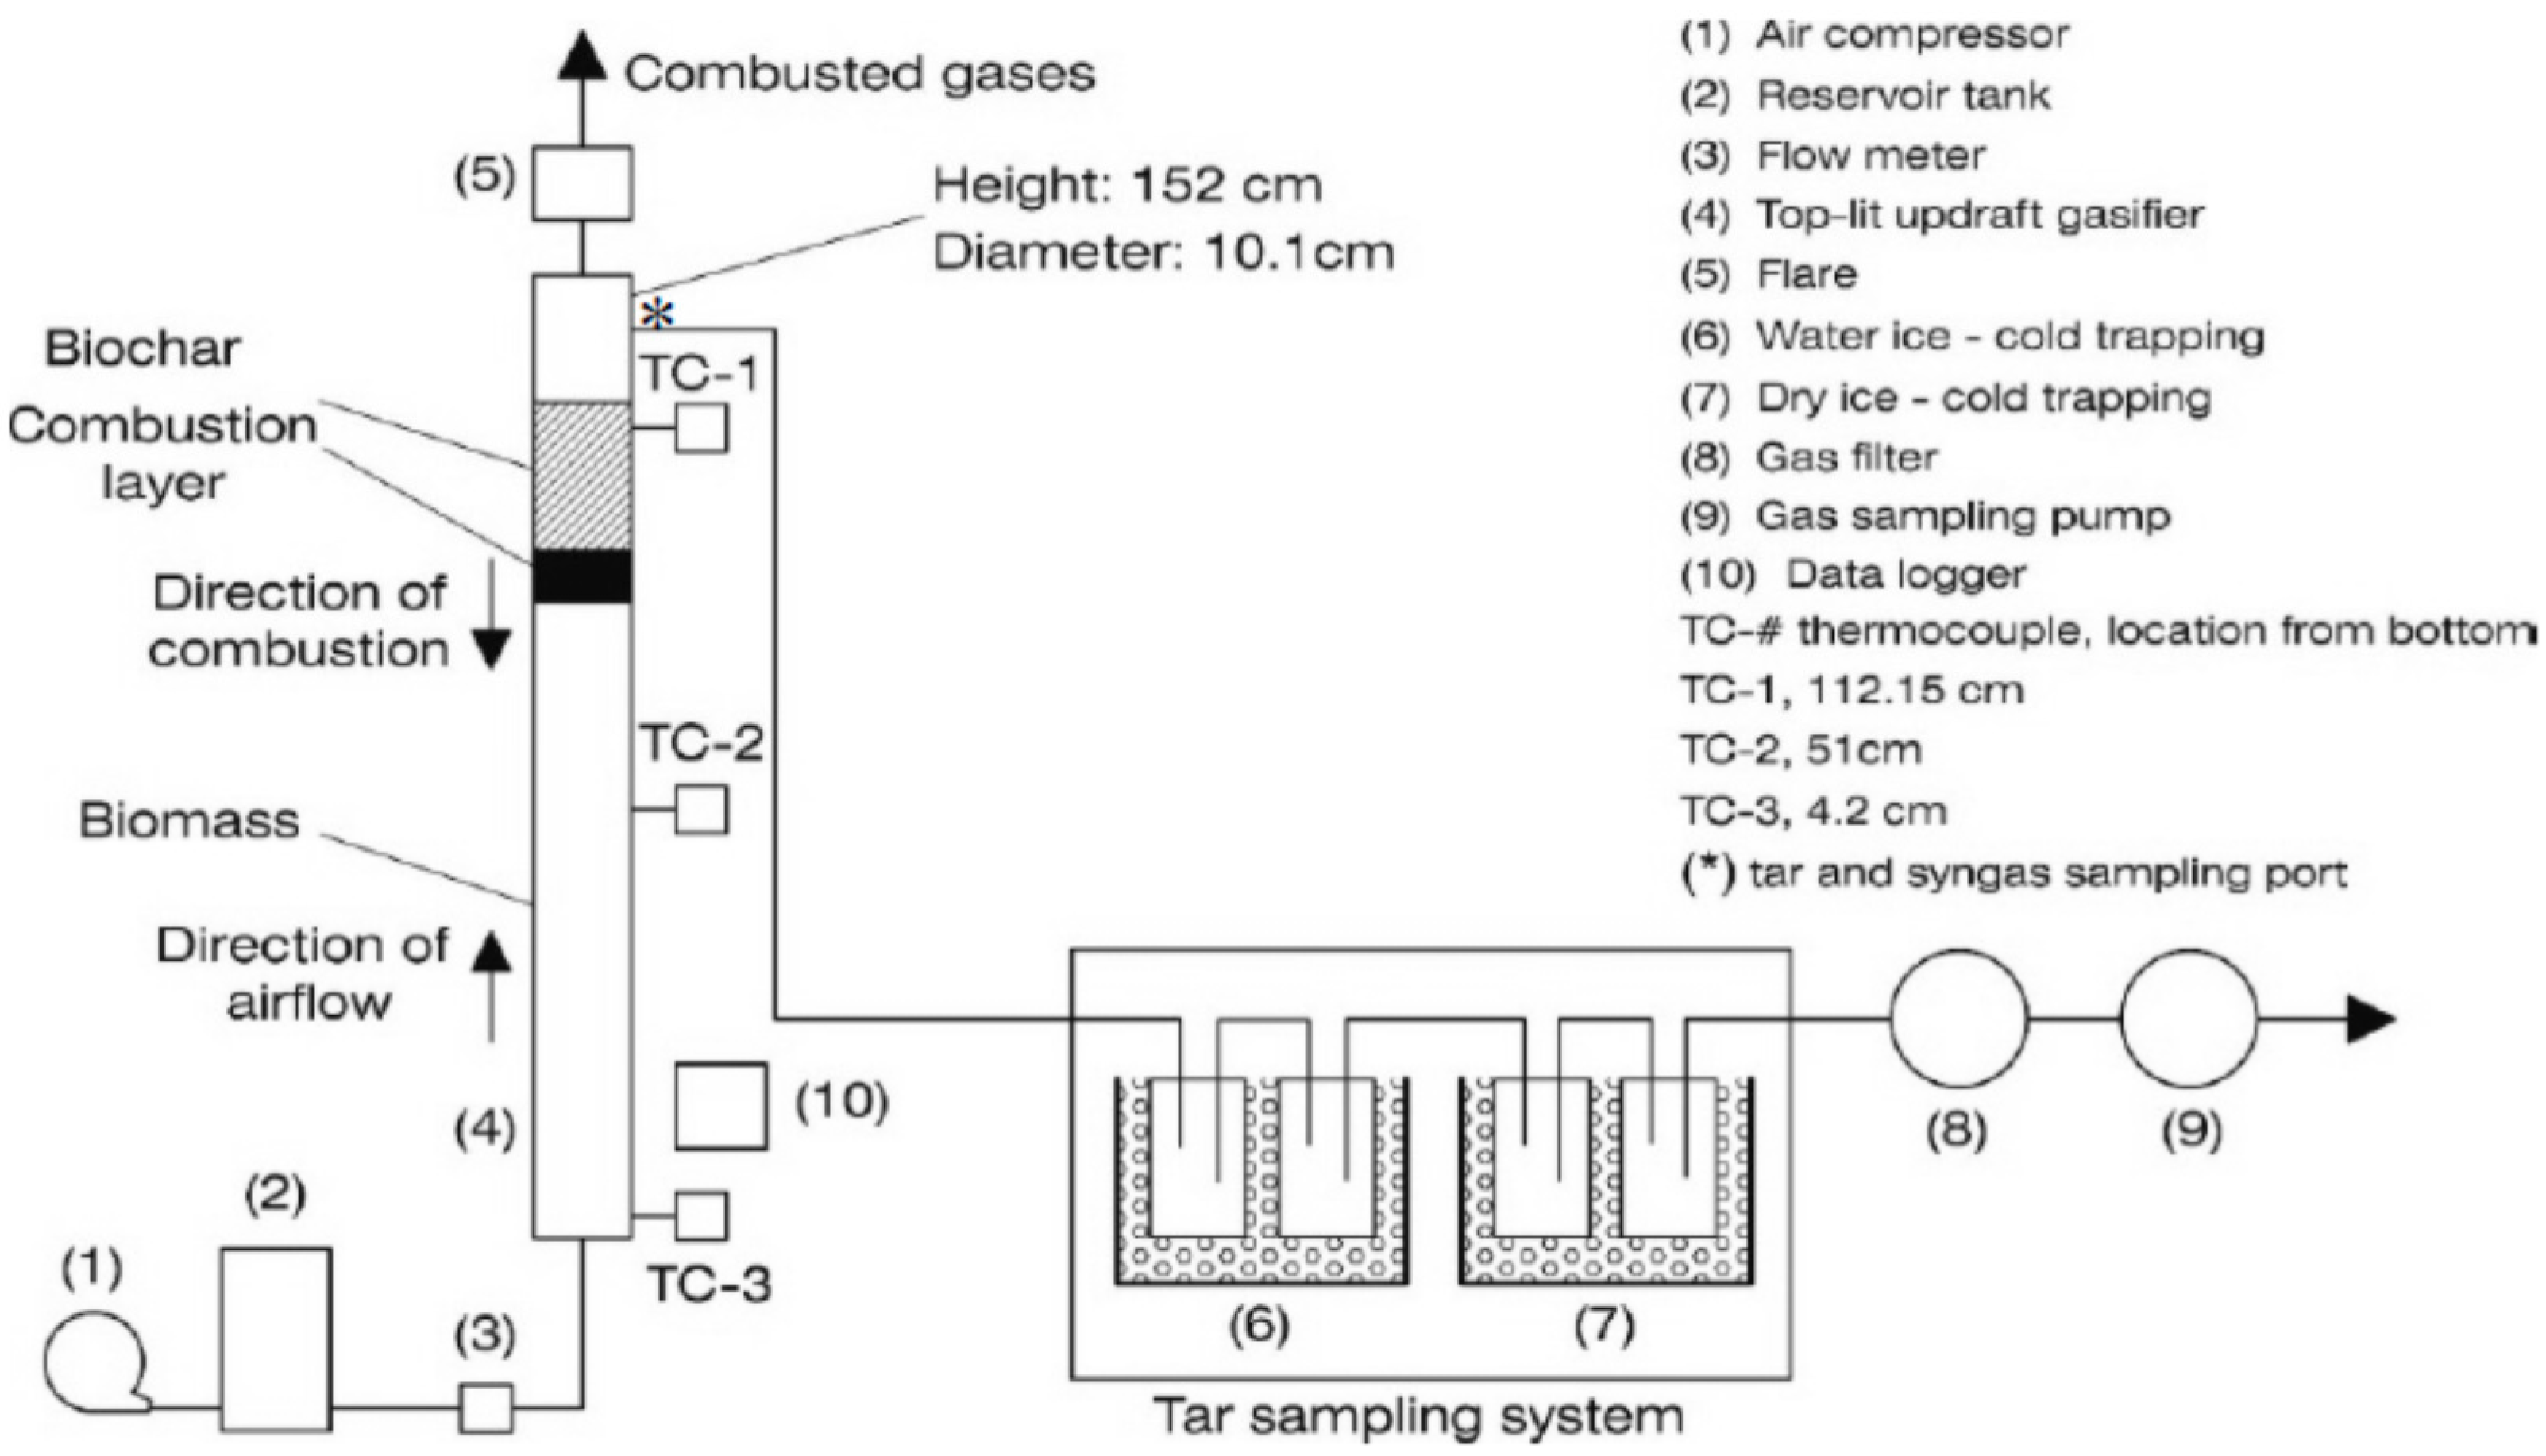
2. Material and Methods

The investigation of the effect of biomass particle size, moisture content and compactness was performed in a 10.1 cm internal diameter steel gasifier column with 152 cm height. A layer of 8.89 cm Fiberglass® insulation (Owens Corning: Toledo, OH, USA) on the outside wall of the gasifier was used to reduce heat loss. Initially, this gasifier was filled with woodchips. Then, the top layer of the biomass was lit with a propane torch for one minute, in order to provide the initial exothermic heat for reaction. Air was provided by an air compressor (1.5 kW–8.62 Bar max. operational pressure, WEN, Elgin, IL, USA) equipped with a reservoir tank (18.90 L) to maintain a uniform flow. The airflow rate was controlled using a variable area flow meter (Cole-Parmer 150 mm, max. pressure 200 psi, Chicago, IL, USA). The airflow of 20 lpm at atmospheric pressure was selected for the experiments based on previous results not shown in this work. As air was injected, the combustion (flame) front moved from the top to the bottom of the column. The temperatures within the gasifier were measured with thermocouples at the top, middle and bottom; and were recorded with a data acquisition system (HOBO® onset®, UX120-014M, Bourne, MA, USA), as shown in Figure 1. The combustion temperature was defined as the average peak temperature recorded on the three thermocouples. Once the flame front reached the bottom, the airflow was suppressed; as a result, the oxidation reactions were stopped. The cooled biochar was collected and the yield was calculated based on the final weight of the biochar and the weight of the biomass, as presented in Equation (1). The burning rate was calculated form Equation (2), dividing the distance between the thermocouple TC-1 and TC-2 by the time that the peak combustion temperature moved from TC-1 to TC-2.
Biochar yield (%) = (DWC − MC)/(DWB − MB) × 100
where DWC is the dry weight of biochar (g), DWB is the dry weight of biomass (g), MC is the moisture in biochar (g) and MB is the moisture content in biomass (g).
Burning rate (mm/min) = DT/t
where DT is the distance between thermocouple TC-1 and TC-2 (609.6 mm), and t is the time for the flame to move from thermocouple TC-1 to TC-2 in minutes.
Pine woodchips from a local grinding company (Newton County, NC, USA) were selected as the raw material due to their local availability. Table 1 presents a summary of the main properties of the biomass. The elemental analysis was determined in a CHNS/O elemental analyzer (Elmer Perkin 2400, PerkinElmer: Waltham, MA, USA). A part of the proximate analysis, the volatile matter content was determined based on ASTM D3175-11 standard [32] and the ash content was measured following ASTM E1755-01 [33]. The fixed carbon was calculated based on the percentage difference of volatile matter, ash and moisture. The higher heating value was performed in a bomb calorimeter (IKA-Calorimeter C 200, IKA-Werke GmbH and Co. KG, Staufen, Germany) using benzoic acid as the standard.
The particle sizes of the biomass were controlled progressively using screens of 3, 10, 25 and 35 mm. Throughout this work, the average particle size (e.g., 2, 7, 17, and 30 mm) was used to represent each range of particles, which was calculated by dividing the upper and lower screen sizes by two. The moisture content and the biomass compactness were kept at 10% and 0, respectively, in all particle size experiments. Similarly, four moisture contents were tested at 10%, 14%, 18% and 22%, while the particle size and the biomass compactness were maintained at 7 mm and 0, respectively. The required moisture content was achieved by calculating the amount of water needed to increase the moisture content of the biomass by Equation (3). Then, the biomass was placed in a container and water was sprayed using a sprayer bottle. The initial moisture of the biomass was determined by drying the biomass at 105 °C for 24 h.
Water added (g) = [(DM × DWB)/(100 − DM)] − MB
where DM is the desirable moisture content (%), DWB is the dry weight of biomass (g) and MB is the moisture in biomass (g).
In addition, the four biomass compactness levels were no compacting (0), 1, 2 and 3 kg packing masses. The increasing compactness was tested with the particle size of 7 mm and 10% moisture content. The biomass compactness within the gasifier chamber was controlled by gradually adding 100 g of biomass and compacting it with the respective mass weight until the reactor was full.
During reaction, tar samples were collected from the gasifier using the cold-trapping method. The first stage of this tar sampling system was composed of two flasks submerged in ice (0 °C) in which water and heavy tars were condensed. The second stage was composed of two additional flasks submerged in dry ice (approximately −79 °C) at which most of the remaining tars was condensed. A similar method for tar collection was previously implemented [11,34,35]. A vacuum pump (Cole-Parmer, L-79200-30, Monroe, LA, USA) was used to flow the syngas within the tar sampling system, and a gas flow meter (Omega, PMR1-014697, Stanford, CT, USA) controlled the sampling rate at 10 lpm. The tar samples were dried in an oven at 105 °C for 24 h and the final weight of the samples was reported as tar. The syngas was also sampled from the gasifier using 0.5 L Teldar® sampling bags (RESTEK Corporation: Bellefonte, PA, USA), and it was analyzed in a Gas Chromatograph (SRI8610C, SRI, Torrance, CA, USA) with a thermo-conductivity detector (TCD) using helium as the carrier gas. Every experiment was replicated three times and the recorded data was analyzed using SAS® statistical software. Multiple comparison analyses were performed to investigate variations in the output factor as a result of the physical properties of the biomass. In addition, multiple linear regressions of the gasification parameters and the biomass physical properties were carried out.

3. Results and Discussion

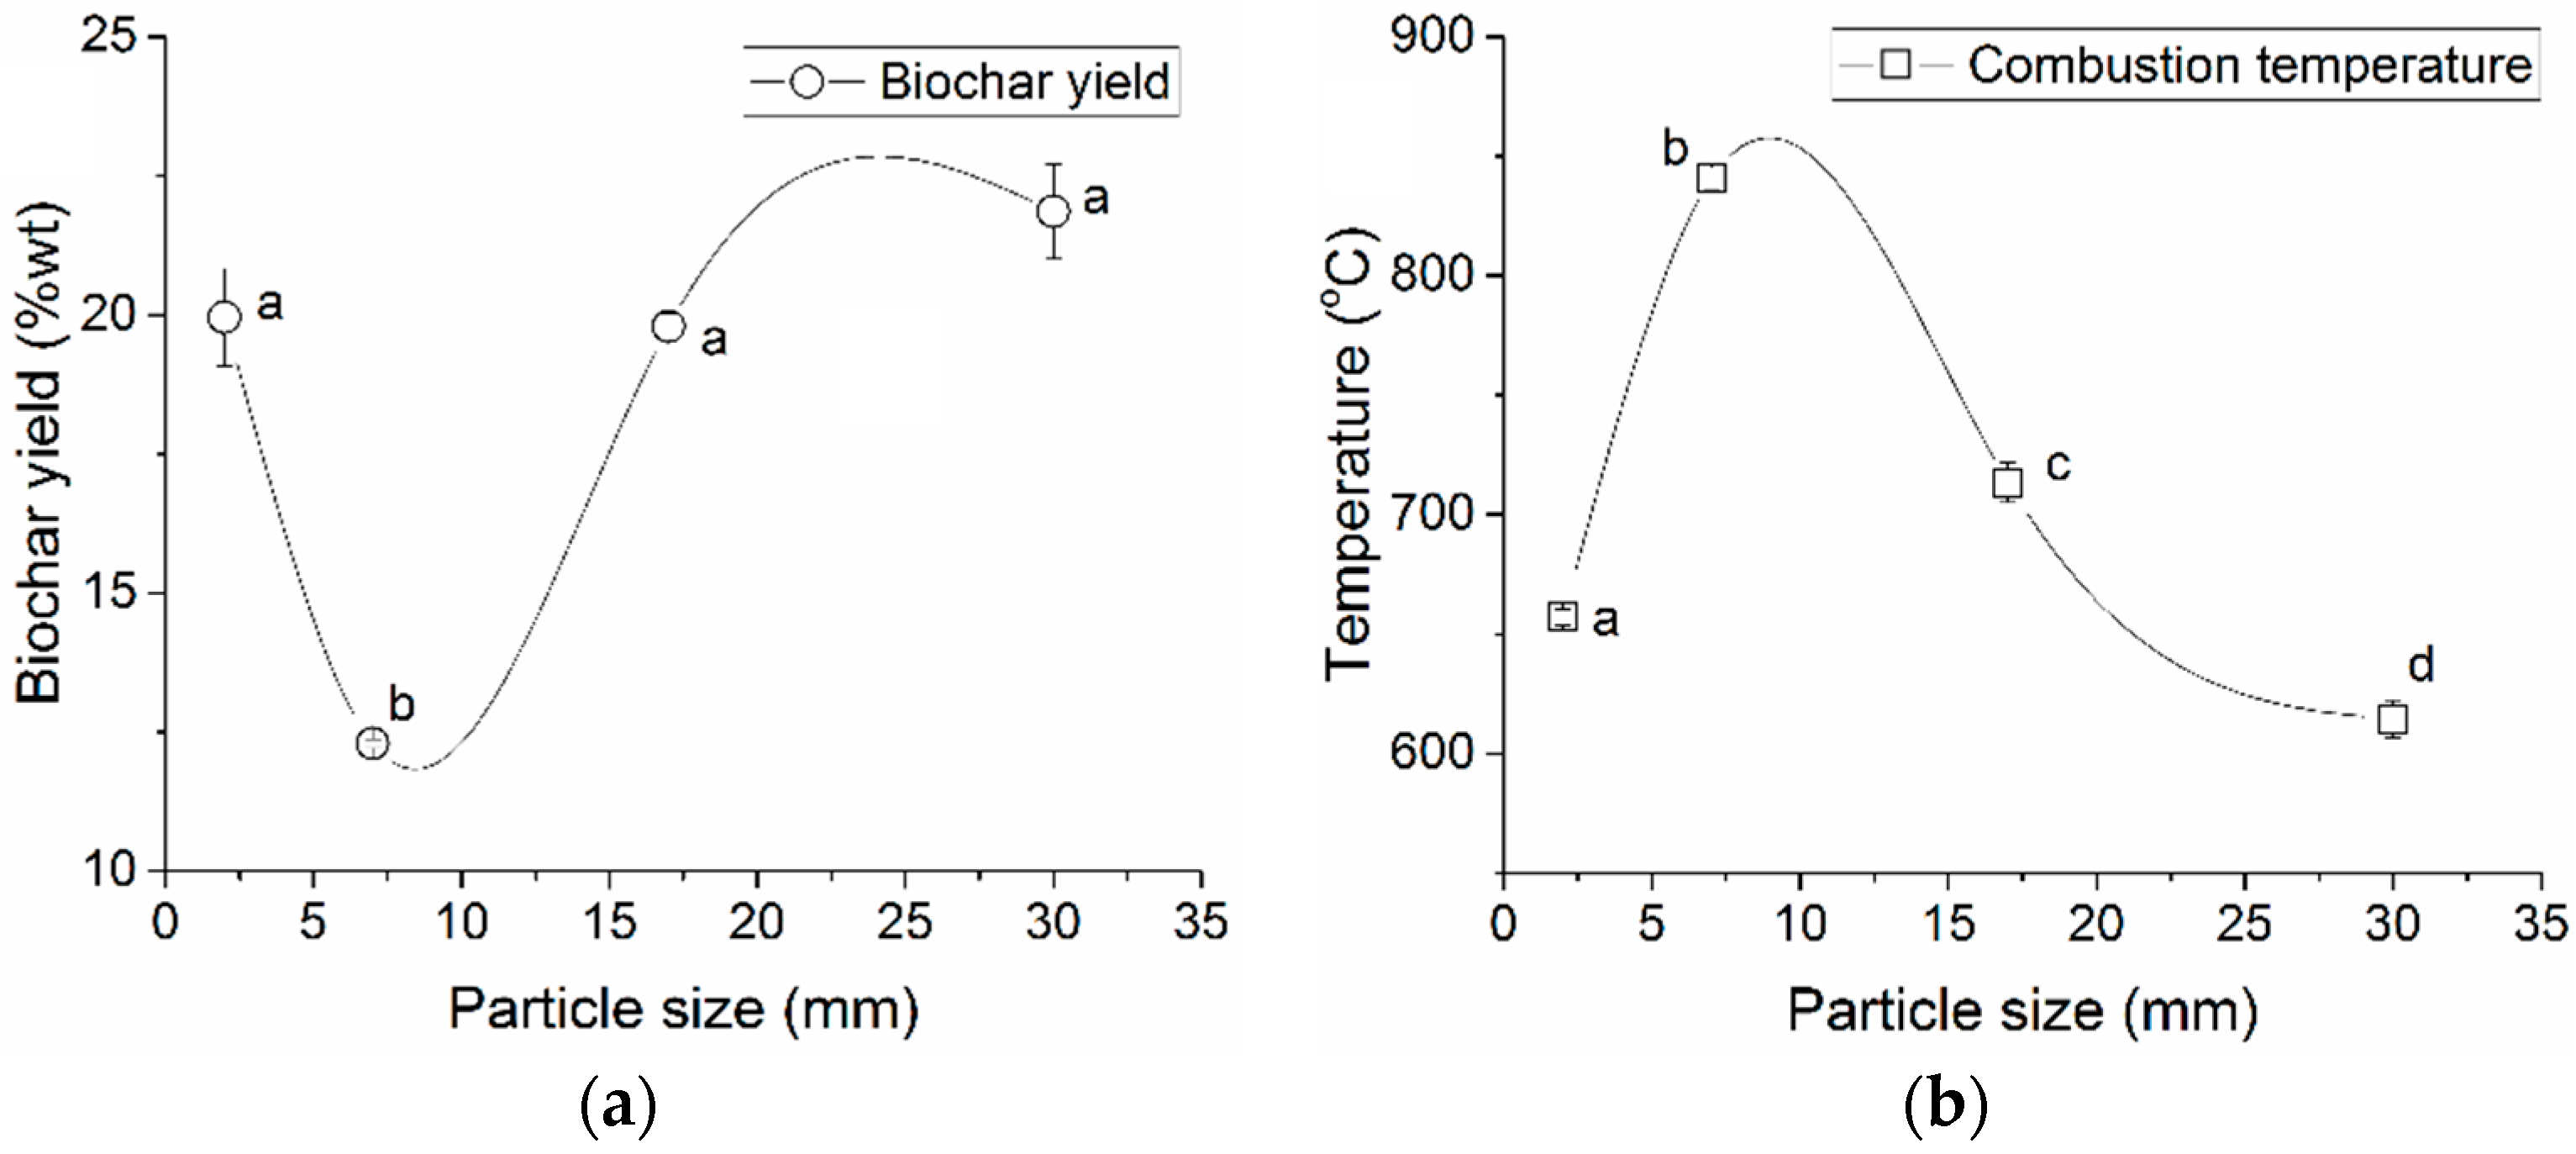
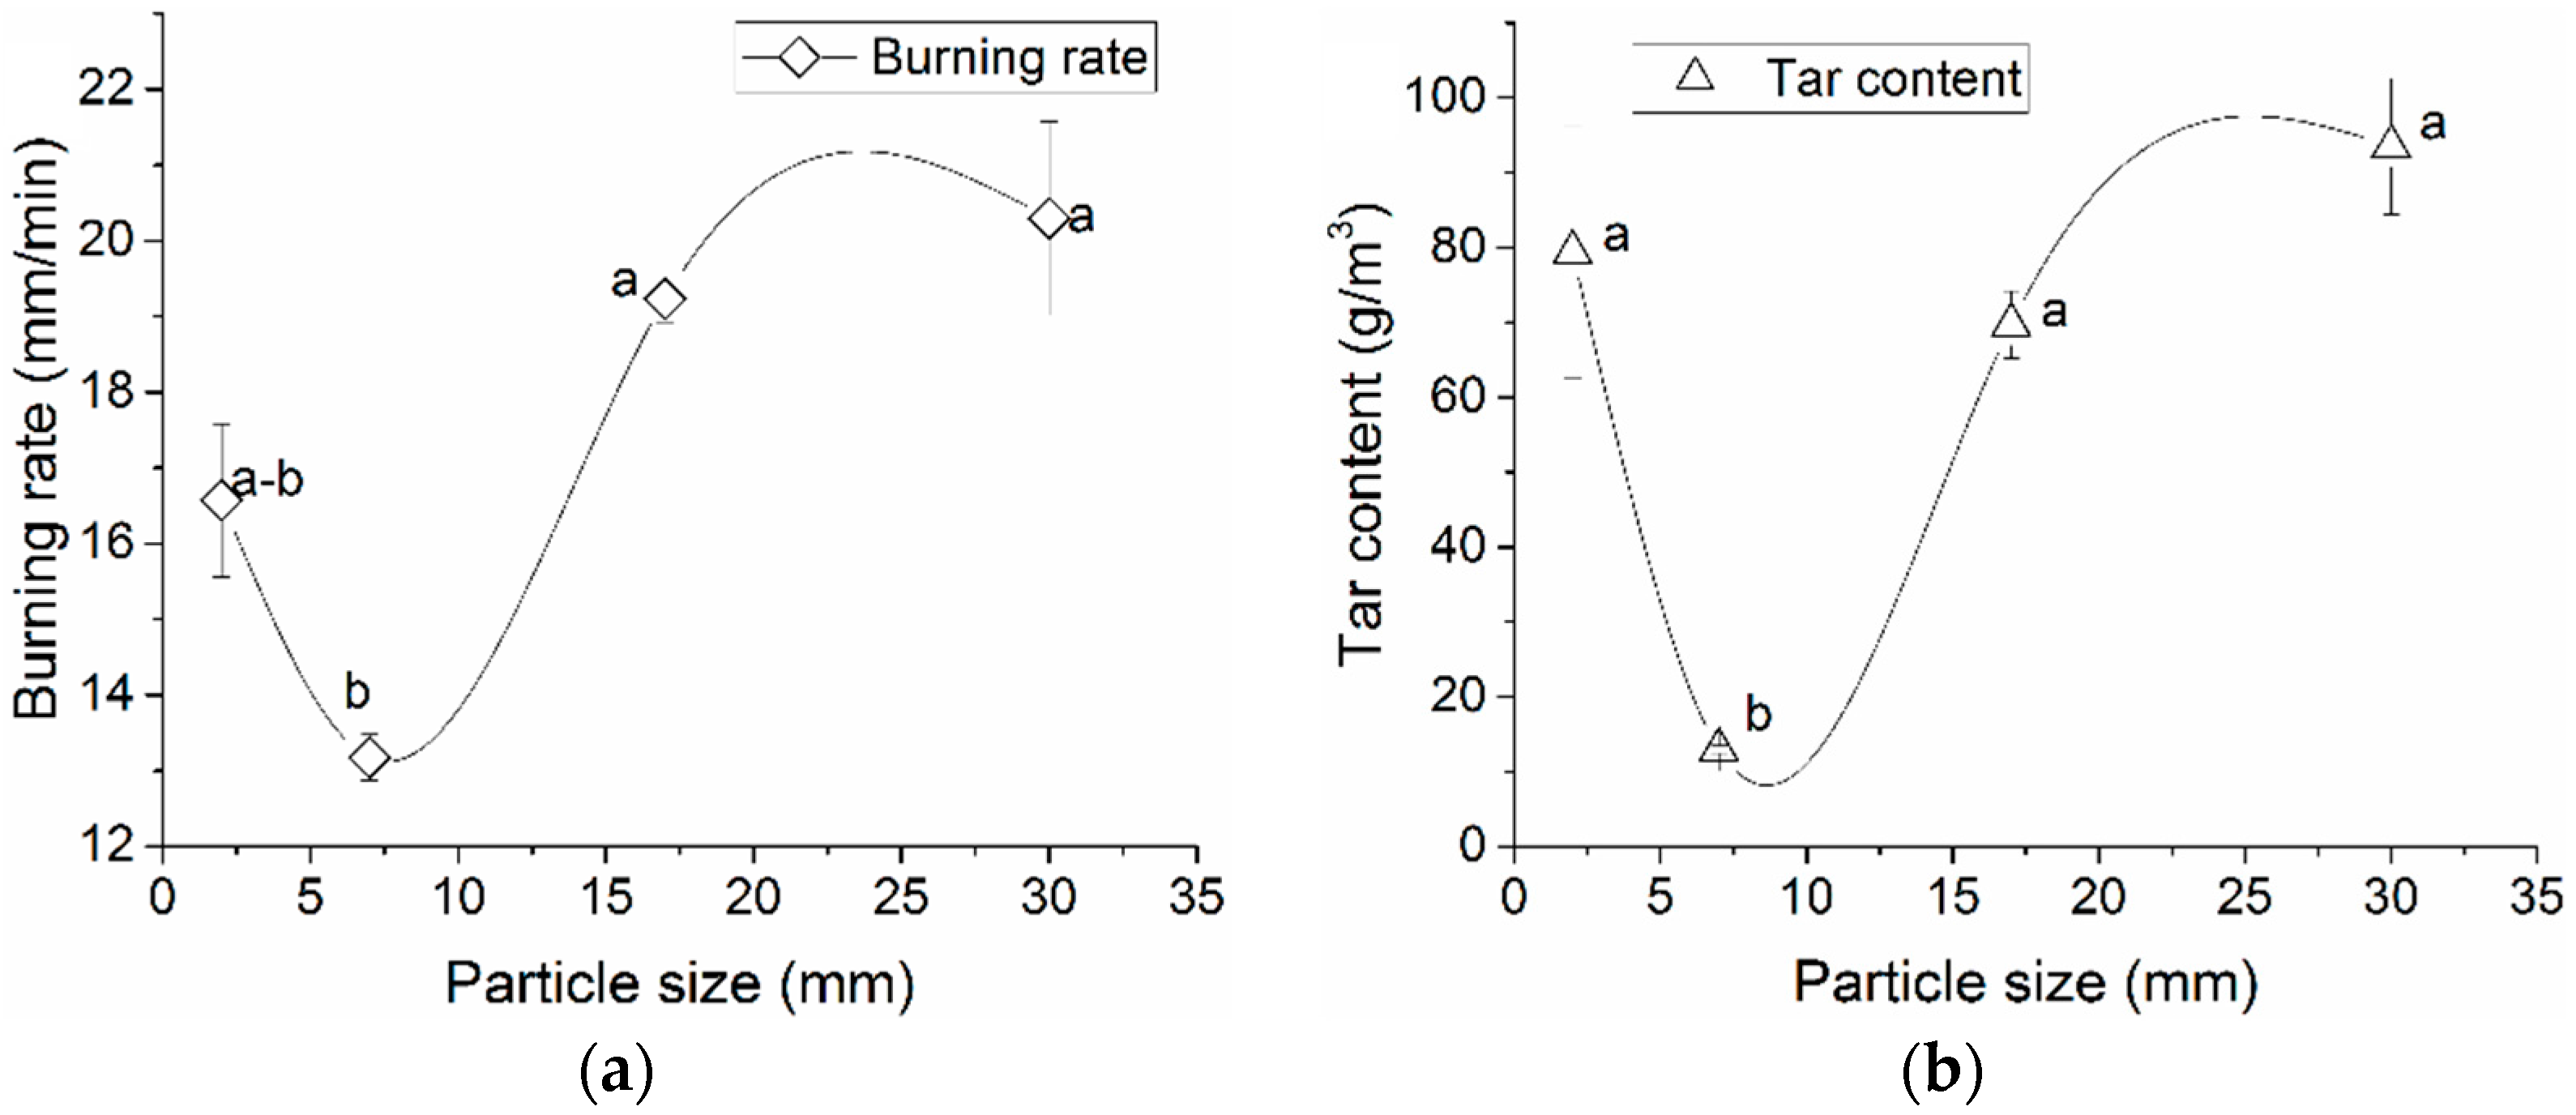
3.1. The Effect of Biomass Particle Size

The size of biomass particles significantly influenced the gasification performance. It can be seen from Figure 2a that as the particle size increased from an average size of 2 to 7 mm, the yield of biochar significantly decreased from 19% to 12%. However, as the size of the particles further increased from 7 to 17 mm, the yield of biochar started to increase from 12% to 19.8%. Moreover, this was not significantly different from the biochar yield (21.8%) achieved with a larger particle size of 30 mm. Figure 2b shows that the combustion temperature increased from 657 °C to 840 °C, and then dropped to 614 °C when the biomass particle size changed from 2 to 7 and finally 30 mm. It was evident that the yield of biochar was negatively correlated with the combustion zone temperature (R2 = 0.86). Previous studies also found that there was a strong correlation between the reaction temperature and biochar yield [36,37]. Demirbas [38] performed pyrolysis experiments with olive husk, corncob and tea waste varying the reaction temperature from 450 K to 1250 K. They found that the yield of biochar decreased for all biomasses as the temperature increased. For instance, the yield of corncob decreased from 30% to 5%. In addition to the characteristic tendency of the combustion temperature, it is important to note that the effect of biomass particle size on biochar yield can also be associated with the bulk density of the biomass. Biomass with an average particle size of 2 mm presented a bulk density of 0.207 g/cm3, which increased to 0.211 g/cm3 when the particle size was increased to an average of 7 mm. However, larger particle sizes presented decreasing bulk densities as shown in Table 1. As the bulk density decreased less biomass was concentrated, as a result less fuel was generated during the devolatilization reactions. Therefore, the combustion temperatures decreased.
Despite the increase in the combustion temperature presented in Figure 2b, the burning rate (Figure 3a) displayed a significant reduction from 16.6 to 13.2 mm/min as the particle size increased from 2 to 7 mm. However, the burning rate had an opposite tendency, increasing from 13.2 to 20.3 mm/min when the particle size was further enlarged (from 7 to 30 mm), regardless of the decrease in temperature presented when the particle size increased. This suggested that the burning rate was not only a factor of the reaction temperature (R2 = 0.54), but it also depended on the particle size because of the variations in biomass bulk density since it was correlated with the burning rate (R2 = 0.74). If the burning rate is compared with the biomass bulk density, a lower bulk density of biomass resulted in a higher burning rate; in contrast, denser biomass reduced the burning rate. In addition, the biochar yield was correlated with the burning rate (R2 = 0.79), which promoted increase in the yield of biochar.
The tar content in the syngas showed negative correlation with the combustion temperature (R2 = 0.77). Additionally, the tar content in syngas was positively correlated with the burning rate (R2 = 0.69); as a result, a faster devolatilization produced more tars. As the particle size increased from 2 to 7 mm the tar content significantly decreased from 79.4 to 13 g/m3 (Figure 3b), as a result of the increasing combustion zone temperature. However, as the combustion temperature reduced at larger particle sizes, the tar content in the syngas was elevated from 13 to 93 g/m3. Increasing the reaction temperature of gasification systems have been proven to inhibit the generation of tars because of the effect of tar cracking and reforming reactions [39,40]. For instance, Li et al. [41] carried out experiments with sawdust in a fluidized bed gasifier increasing the reaction temperature from 700 to 815 °C. The tar content decreased from 15.2 to 0.5 g/m3.
Table 2 shows the effect of particle size on syngas composition. As the average particle size increased from 2 to 7 mm, hydrogen content of the syngas increased from 4.26% to 6.61%. However, little variation was observed in carbon monoxide composition. Further, increasing the particle size from 7 to 30 mm significantly reduced hydrogen composition from 6.6% to 2.9% and the carbon monoxide composition from 15% to 11.8%. Consequently, the higher heating value declined from 3.67 to 2.7 MJ/m3. Similar results were reported by Hernandez et al. [42] who investigated the effect of particle size in an entrained flow gasifier at 1050 °C. When the particle size varied from 0.5 to 8 mm, the H2 and CO contents in the syngas reduced from 9% to 3% and from 14% to 5%, respectively. This change in the gas composition was attributed to the reduced surface area for gasification reaction due to the increasing particle size that discouraged mass and heat transfer throughout the biomass particles. Moreover, the reduction in H2 content can also be attributed to the reaction temperature. Lv et al. [43] studied the effect of particle size and reaction temperature in a biomass fluidized bed gasifier using air/steam mixtures. The results showed that as increasing the temperature from 700 to 900 °C, the H2 content increased from 20% to 40%. However, little difference was noticed in the H2 content when the particle size was varied from 0.25 to 0.75 mm at 800 °C. As a result, the tar reforming (e.g., CxHy (tar) + m H2O → m CO + (m + p/2) H2) and cracking reactions (e.g., CxHy (tar) → CO + C + H2 + CwHv) were minimized at larger particle sizes [44].

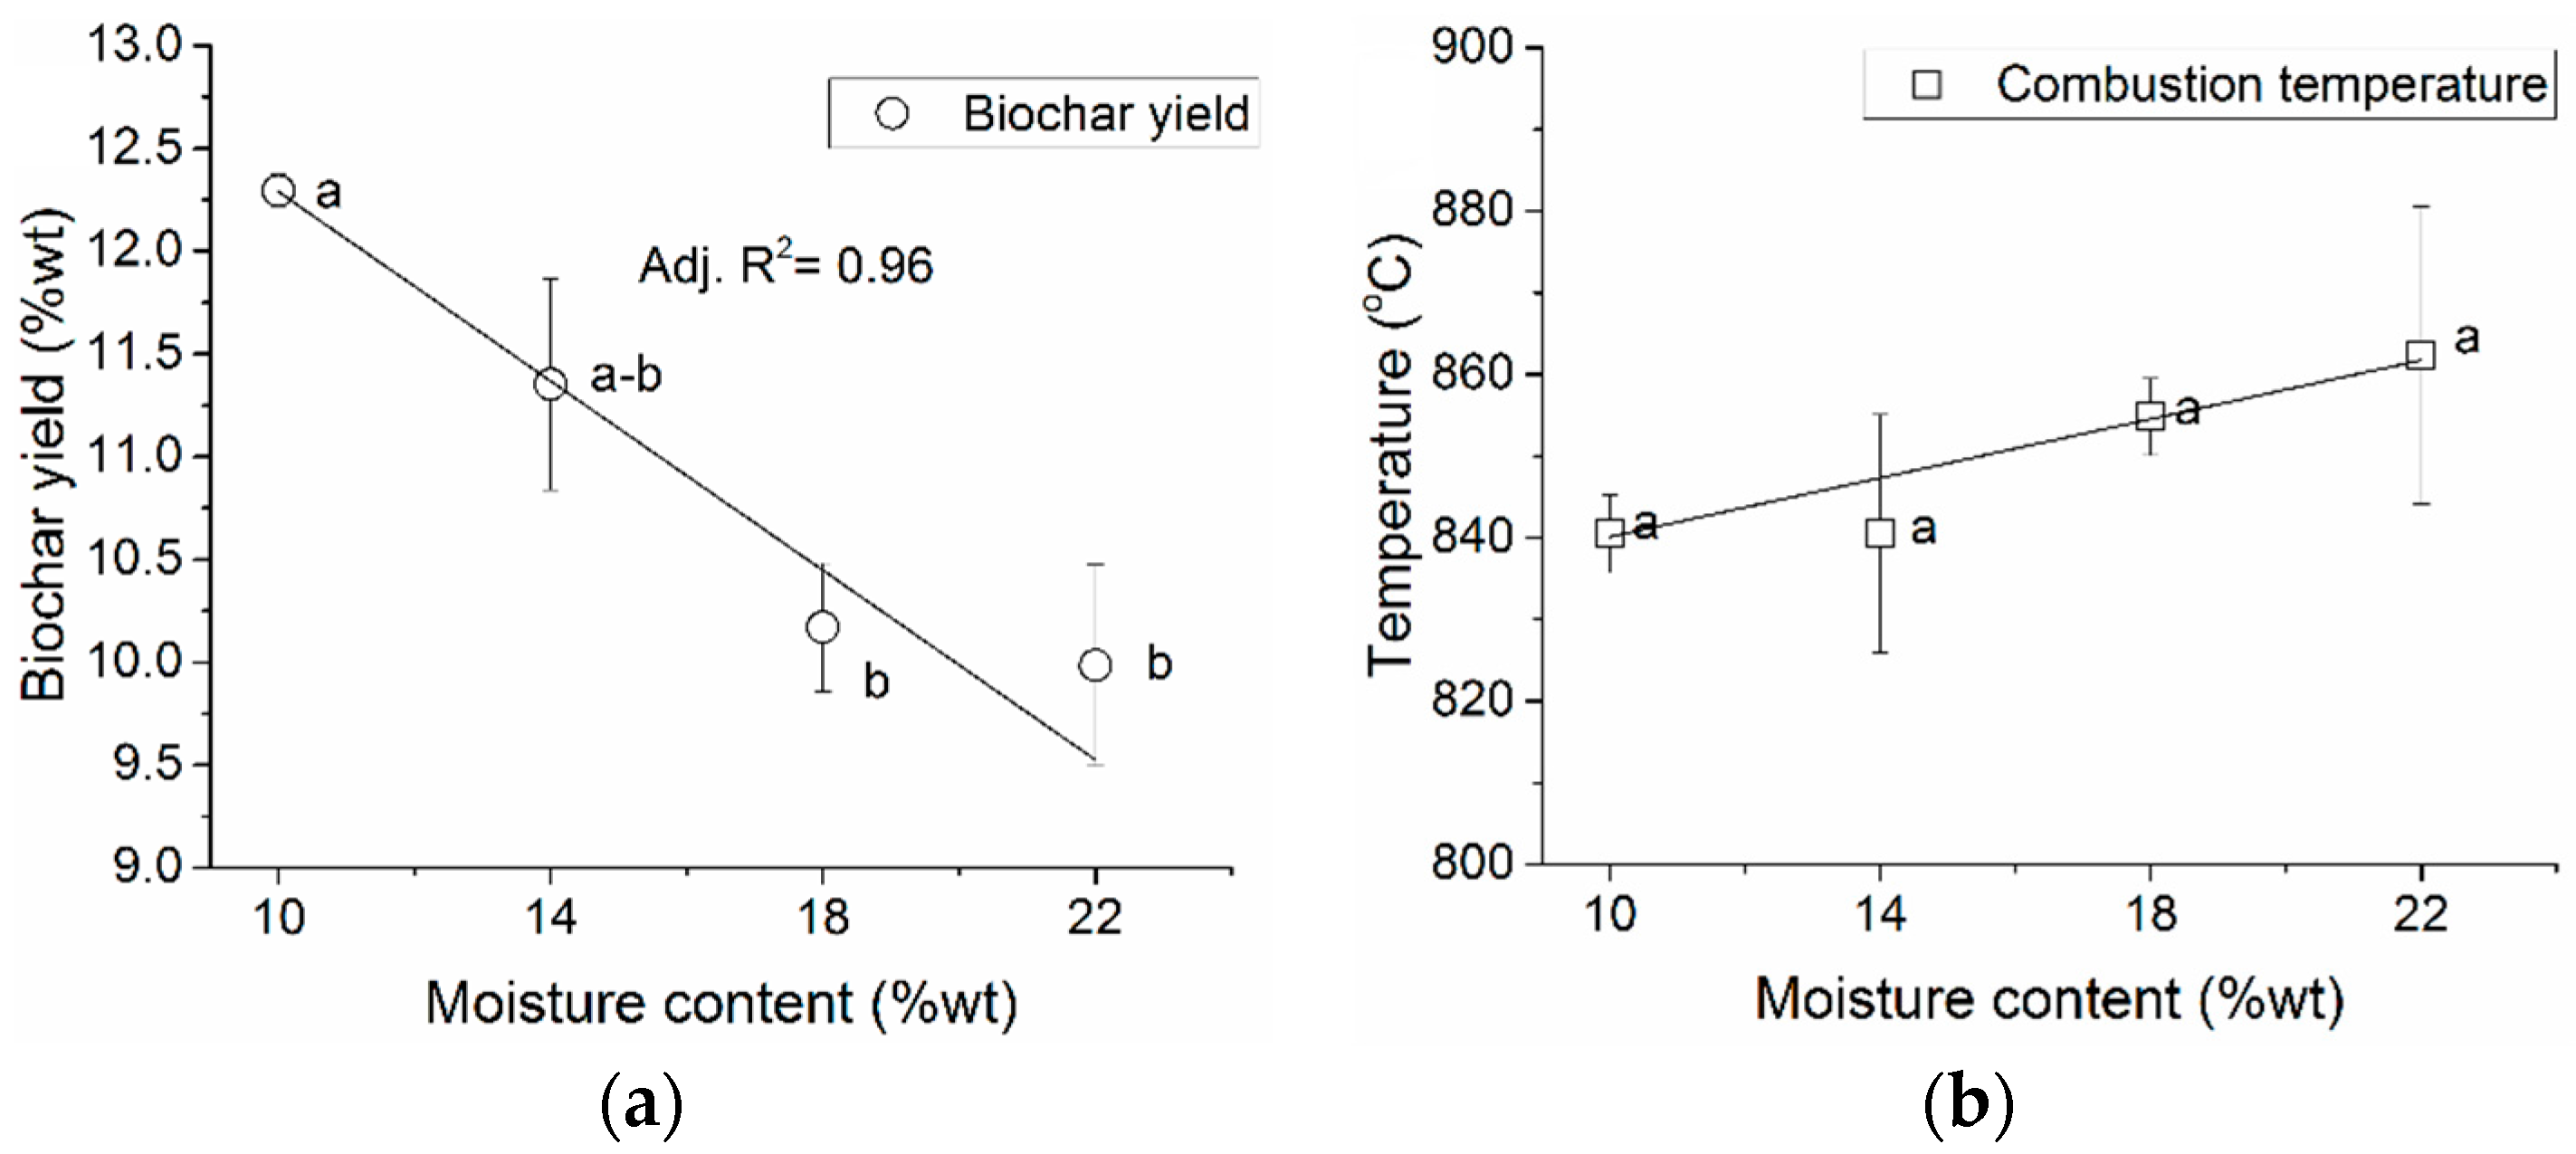
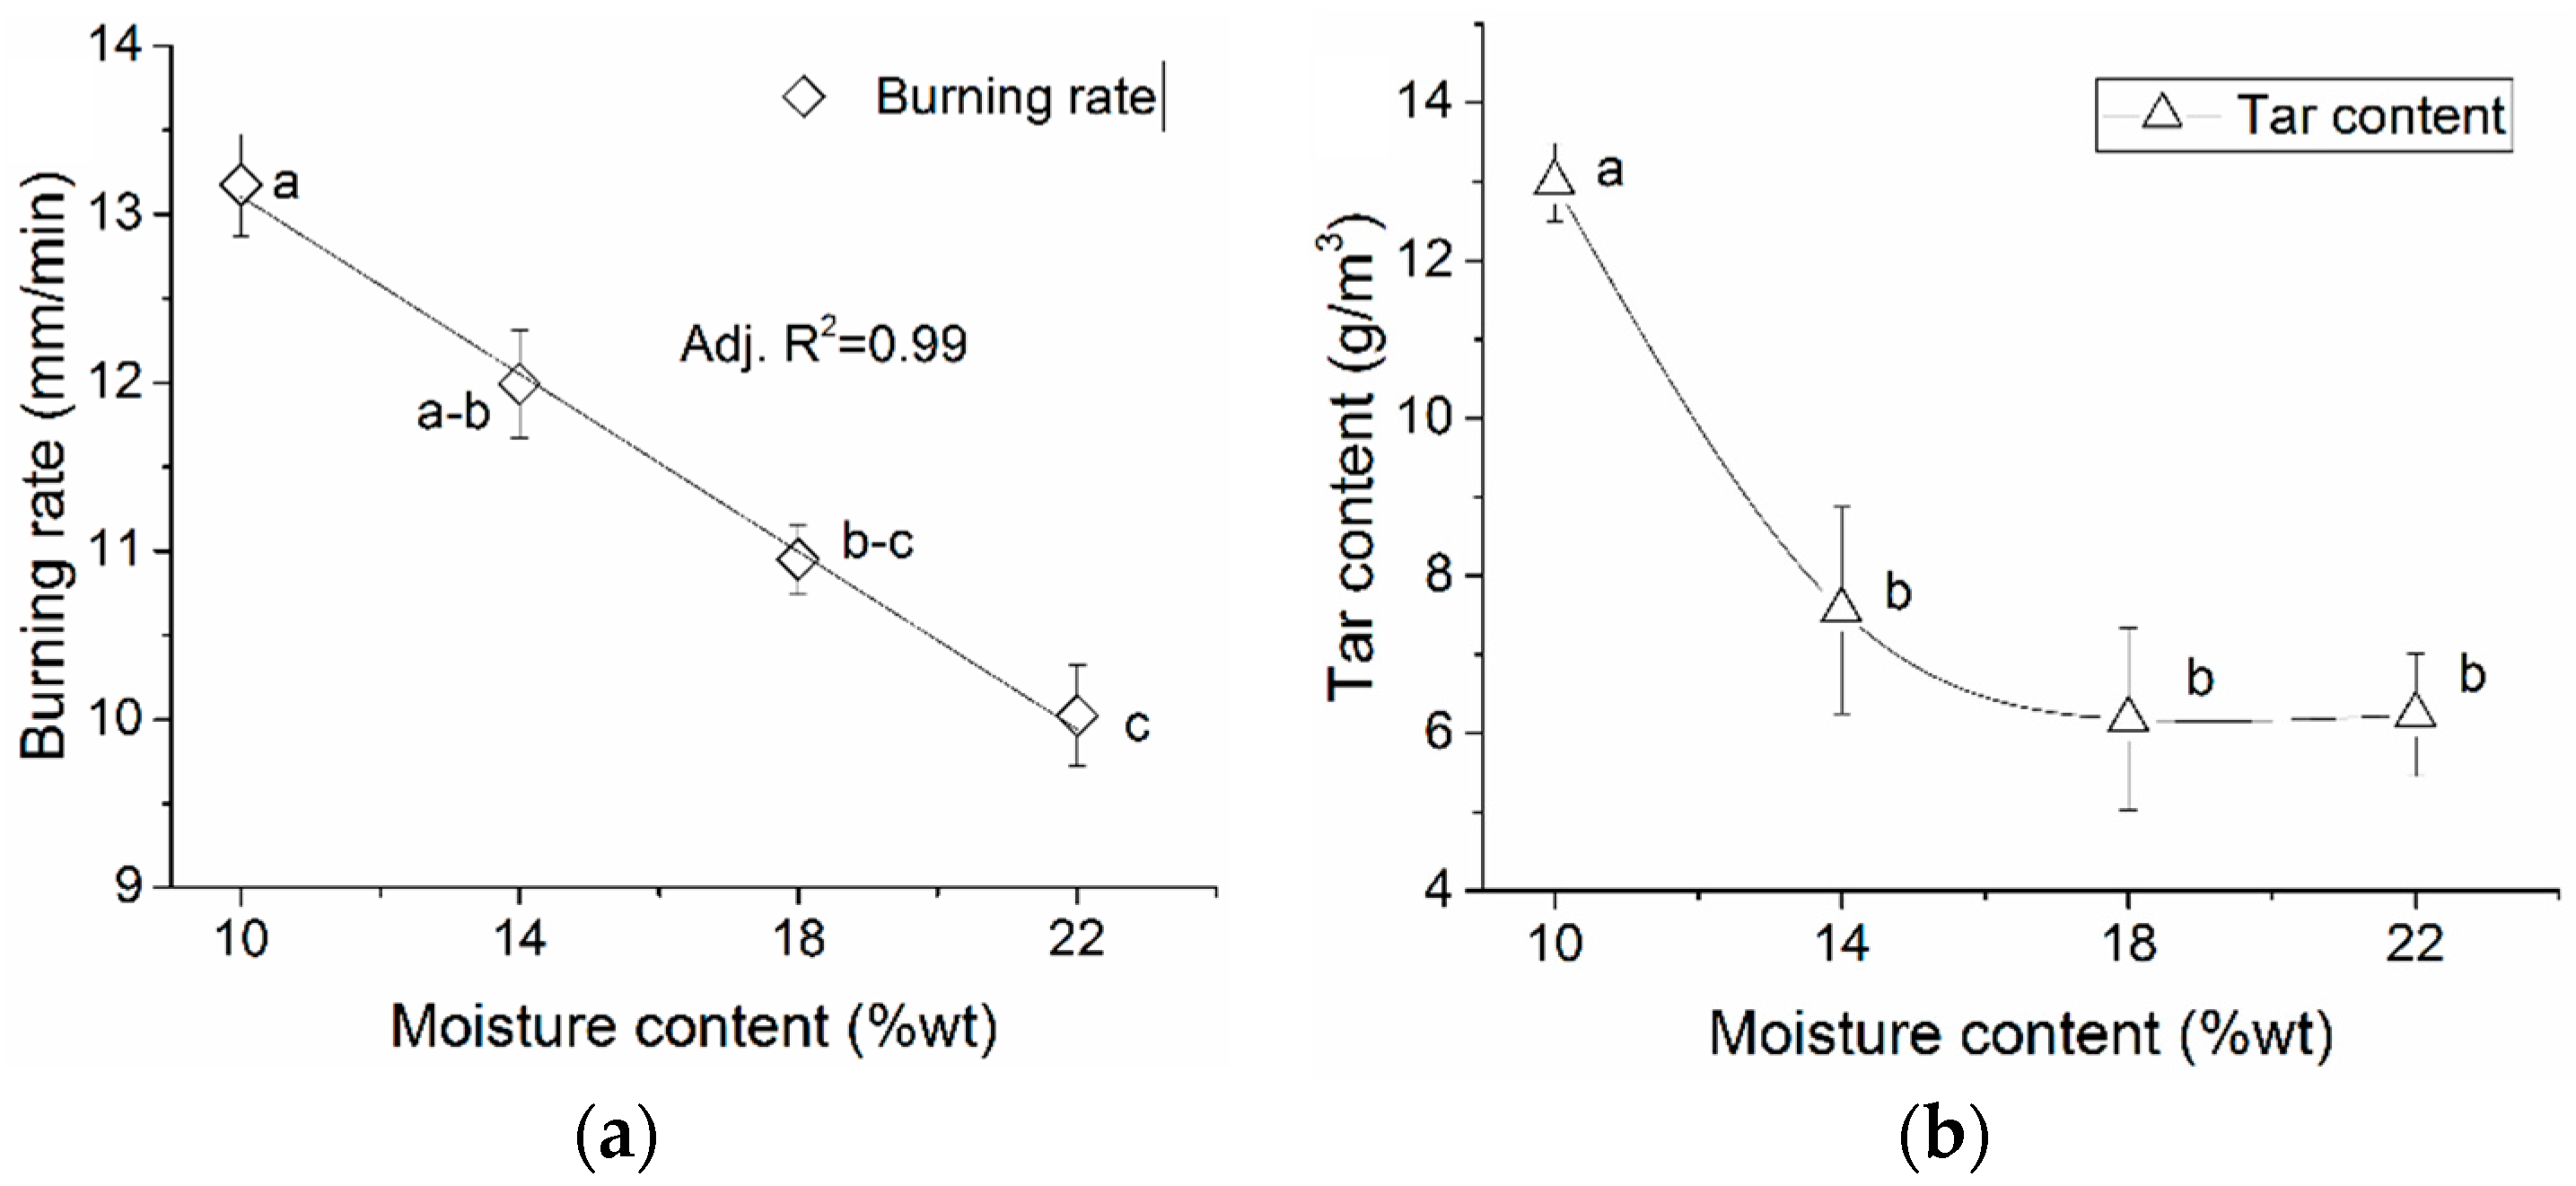
3.2. The Effect of Biomass Moisture Content

The moisture content of the biomass was found to be linearly and negatively correlated with biochar yield (R2 = 0.96). As increasing the moisture content from 10% to 22%, the yield of biochar dropped from 12% to 9.9% (Figure 4a). However, in spite of the apparent increase in the combustion temperature, no significant differences in the combustion temperature were found as the moisture content changed (Figure 4b). As stated in the particle size analysis, the reaction temperature can be a strong indicator of minimization of biochar yield. Therefore, the reduction of the biochar yield due to addition of moisture content cannot be attributed to the combustion temperature.
As presented in Figure 5a, the burning rate was impacted by the addition of moisture to the biomass. The burning rate reduced from 13 to 10 mm/min as the moisture content increased from 10% to 22%. Biomass with higher moisture content burned at a slower pace due to the additional heat required to evaporate the water in the biomass before its thermochemical conversion [45]. This suggested that the decrease in the biochar yield, as a result of increasing moisture content can be attributed to the decrease in the burning rate that stimulated the oxidation of more organic components within the produced biochar. A similar tendency of biochar yield has been previously reported by Huangfu et al. [30], who carried out moisture content experiments in a natural draft top-lit updraft gasifier. The gasification of wood pellets with increasing moisture content (from 6% to 22%) was found to reduce the burning rate from 30 to 20 g/min, thus yield of biochar decreased from 26% to 20%.
Moreover, the reduction in burning rate also reduced tars in syngas during the carbonization of biomass. The tar content reduced from 13 to 6.24 g/m3 (Figure 5b) which was identified as the lowest range of tar content achieved in the gasification of woodchips in this top-lit updraft gasifier. This indicated that a slower burning rate represented a more efficient burning of biomass to balance the excessive moisture and maintain the combustion temperature. Therefore, tar cracking and reforming reactions were encouraged by the increasing moisture in the gas phase. A similar reduction in tar content was reported by Ponzio et al. [46] in the evaluation of a high temperature air/steam gasification configuration. It was reported that the gasification of paper at different air/steam mixtures, including 5%, 53% and 82% water showed decreases in tar content from 2.3 to 1.4 mg per sample. The reduction in the tar content was attributed to the steam reforming reactions. The top-lit updraft gasifier configuration could also be further catalyzed by the produced biochar. Previous works [11,47] have investigated the catalytic effects of carbon in tar cracking reactions. For instance, James et al. [48] performed tar cracking experiments in an in-situ thermo-catalytic reactor at approximately 900 °C using charcoal as the catalyst. It was found that charcoal alone removed up to 60% of the tars in the syngas. Therefore, the top-lit updraft configuration might also help to break down tar molecules since biochar with high carbon content was presented along the carbonization and reduction zones.
Table 3 presents the effect of moisture content on the syngas composition. The hydrogen composition was found to have no significant changes when the moisture content increased. In contrast, the carbon monoxide composition significantly reduced from 15.2% to 11.1% when the moisture increased from 10% to 18%, and slightly increased to 11.1% with further increase of moisture content to 22%. Likewise, the higher heating value of the syngas decreased from 6.67 to 2.65 MJ/m3 when increasing the moisture content from 10% to 18%, and increased to 2.84 MJ/m3 at 22% moisture content. Due to the configuration of the top-lit updraft gasifier, in which the combustion zone moves towards the bottom carbonizing the biomass; it can be assumed that the additional moisture added to the biomass is continuously supplied as steam. This is because the heat from the combustion zone uniformly dries the biomass as the combustion zone advances. This assumption can help to understand the effect of the moisture content using the steam to biomass ratio (S/B) which for this study can be represented as 0.11, 0.16, 0.22 and 0.28 for moisture content of 10, 14, 18 and 22, respectively. The S/B ratio is calculated as the mass of steam per dry mass of biomass used during gasification. Franco et al. [49] investigated the effect of the S/B (from 0.5 to 0.8) on a fluidized bed gasifier at a temperature of 800 °C. The CO content in the syngas decreased from approximately 45% to 38% as increasing the S/B ratio. In a similar way, the higher heating value decreased from approximately 1.9 to 1.6 kJ/L, and the S/B ratio content increased the hydrogen content. This tendency of low hydrogen content and decreasing CO composition with increasing biomass moisture content from 10% to 22% suggested that there was not sufficient steam supplied to the steam reforming reactions and water-gas reactions. Similar tendency was also found by Gil et al. [50]. In addition, the little variation in the reaction temperature contributed to limit the main reduction reactions that were not encouraged by the addition of moisture (e.g., water shift reaction CO + H2O → CO2 + H2, char reforming C + H2O → CO + H2) [14]. As a result, the moisture content did not have significant effect on the syngas heating value and composition. Despite the fact that some evidence of methanation was observed with the variation of methane from 2.39% to 1.69%, Table 3.

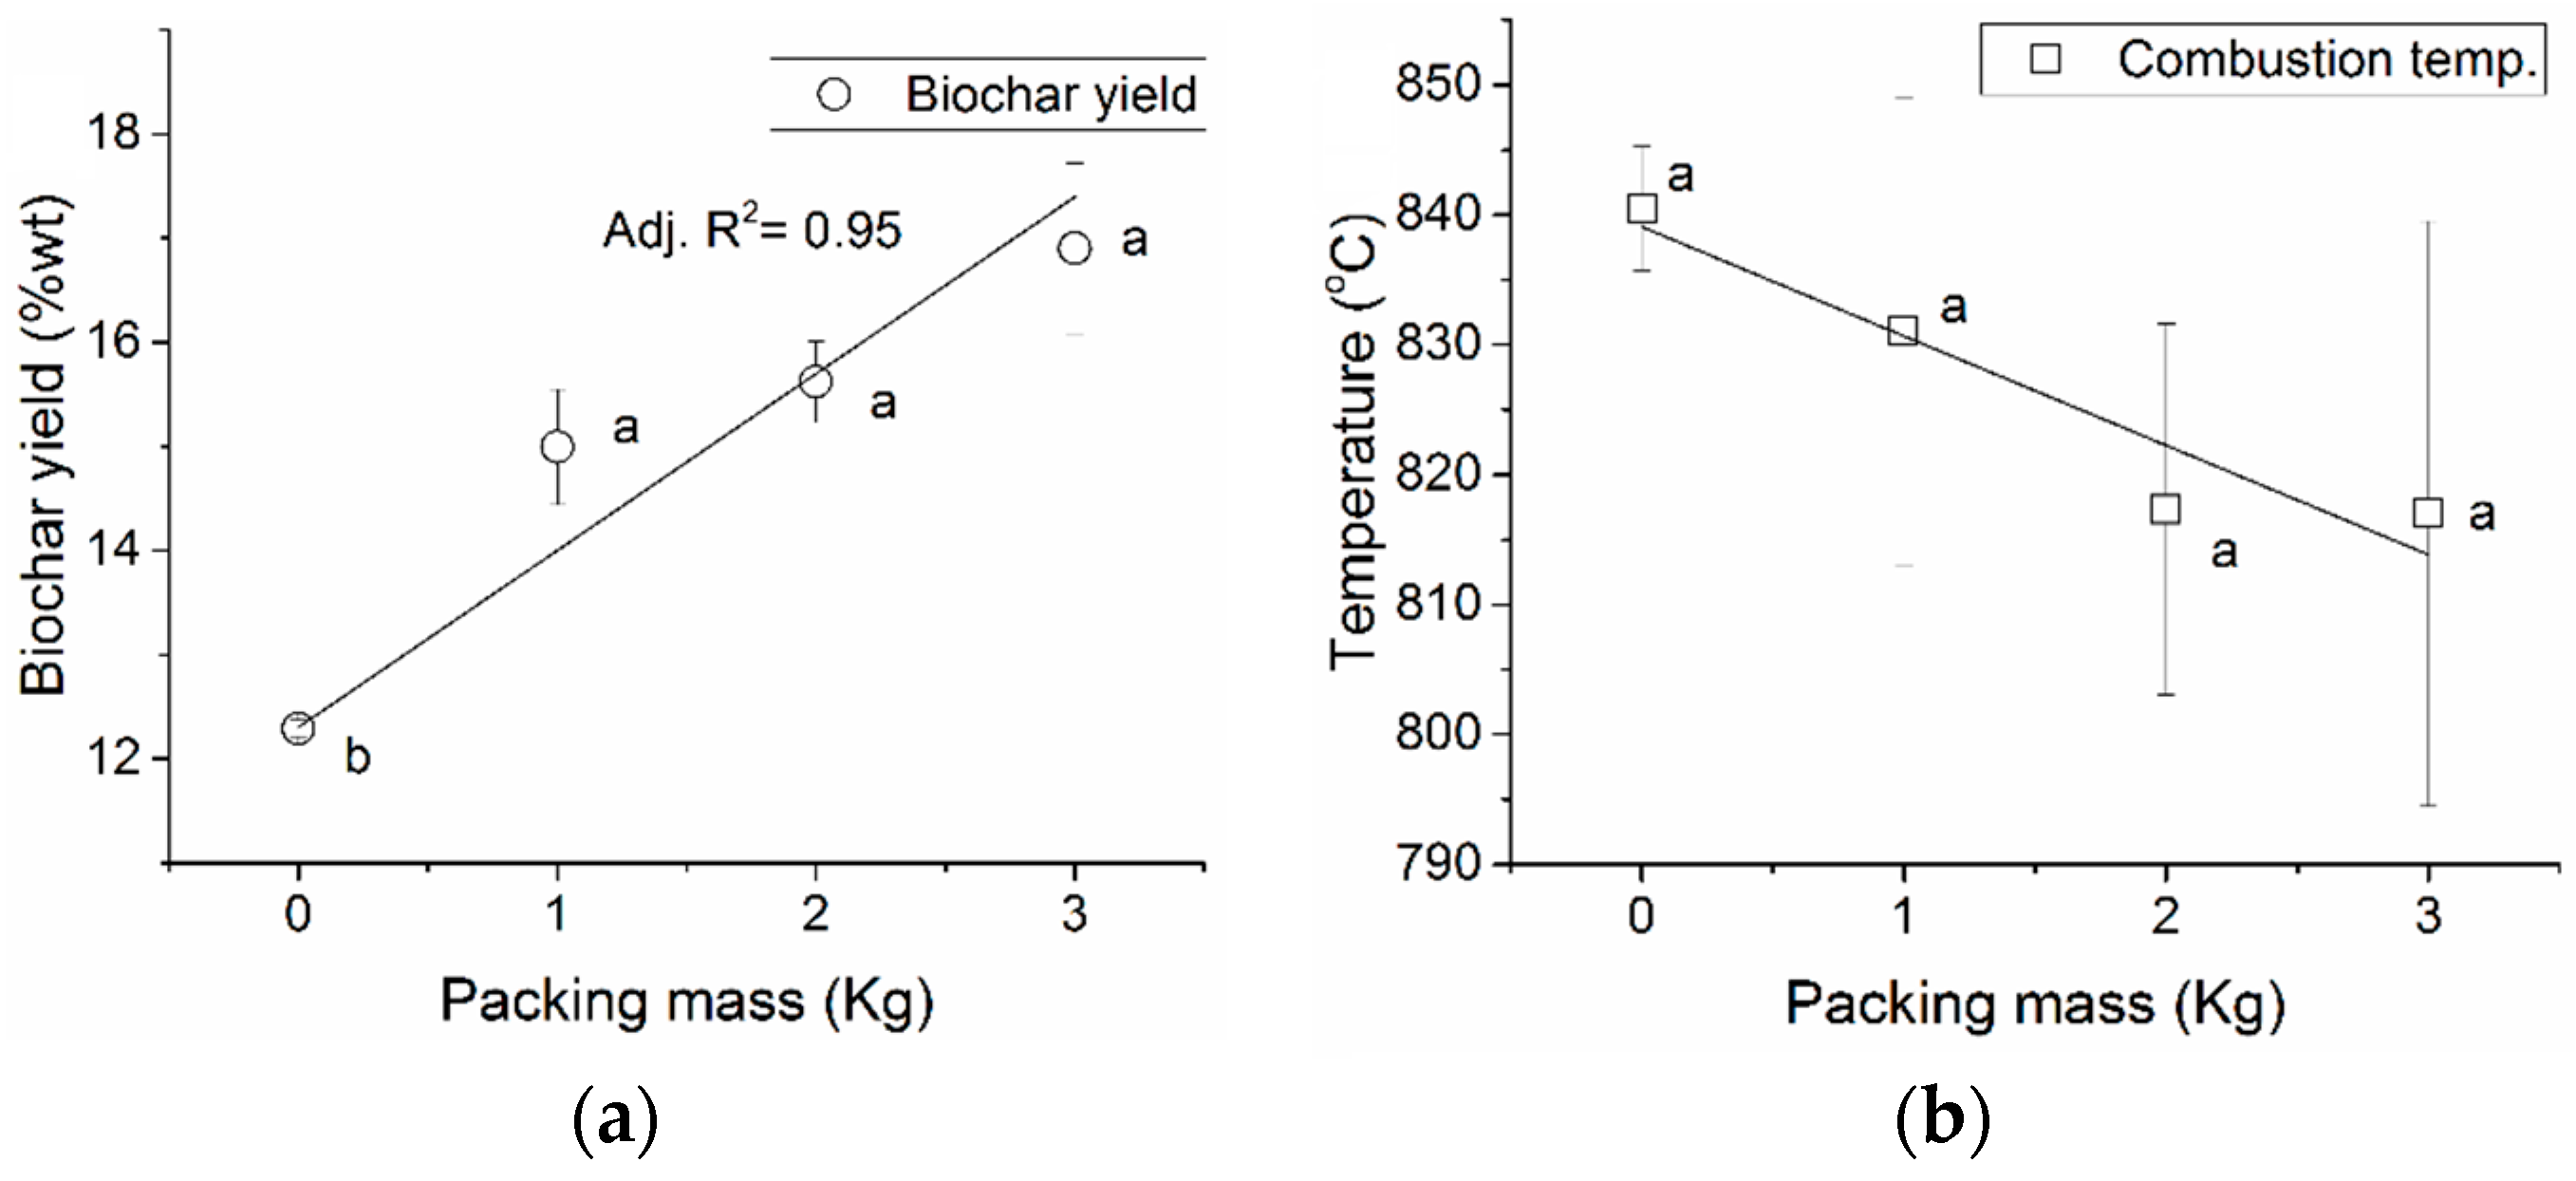
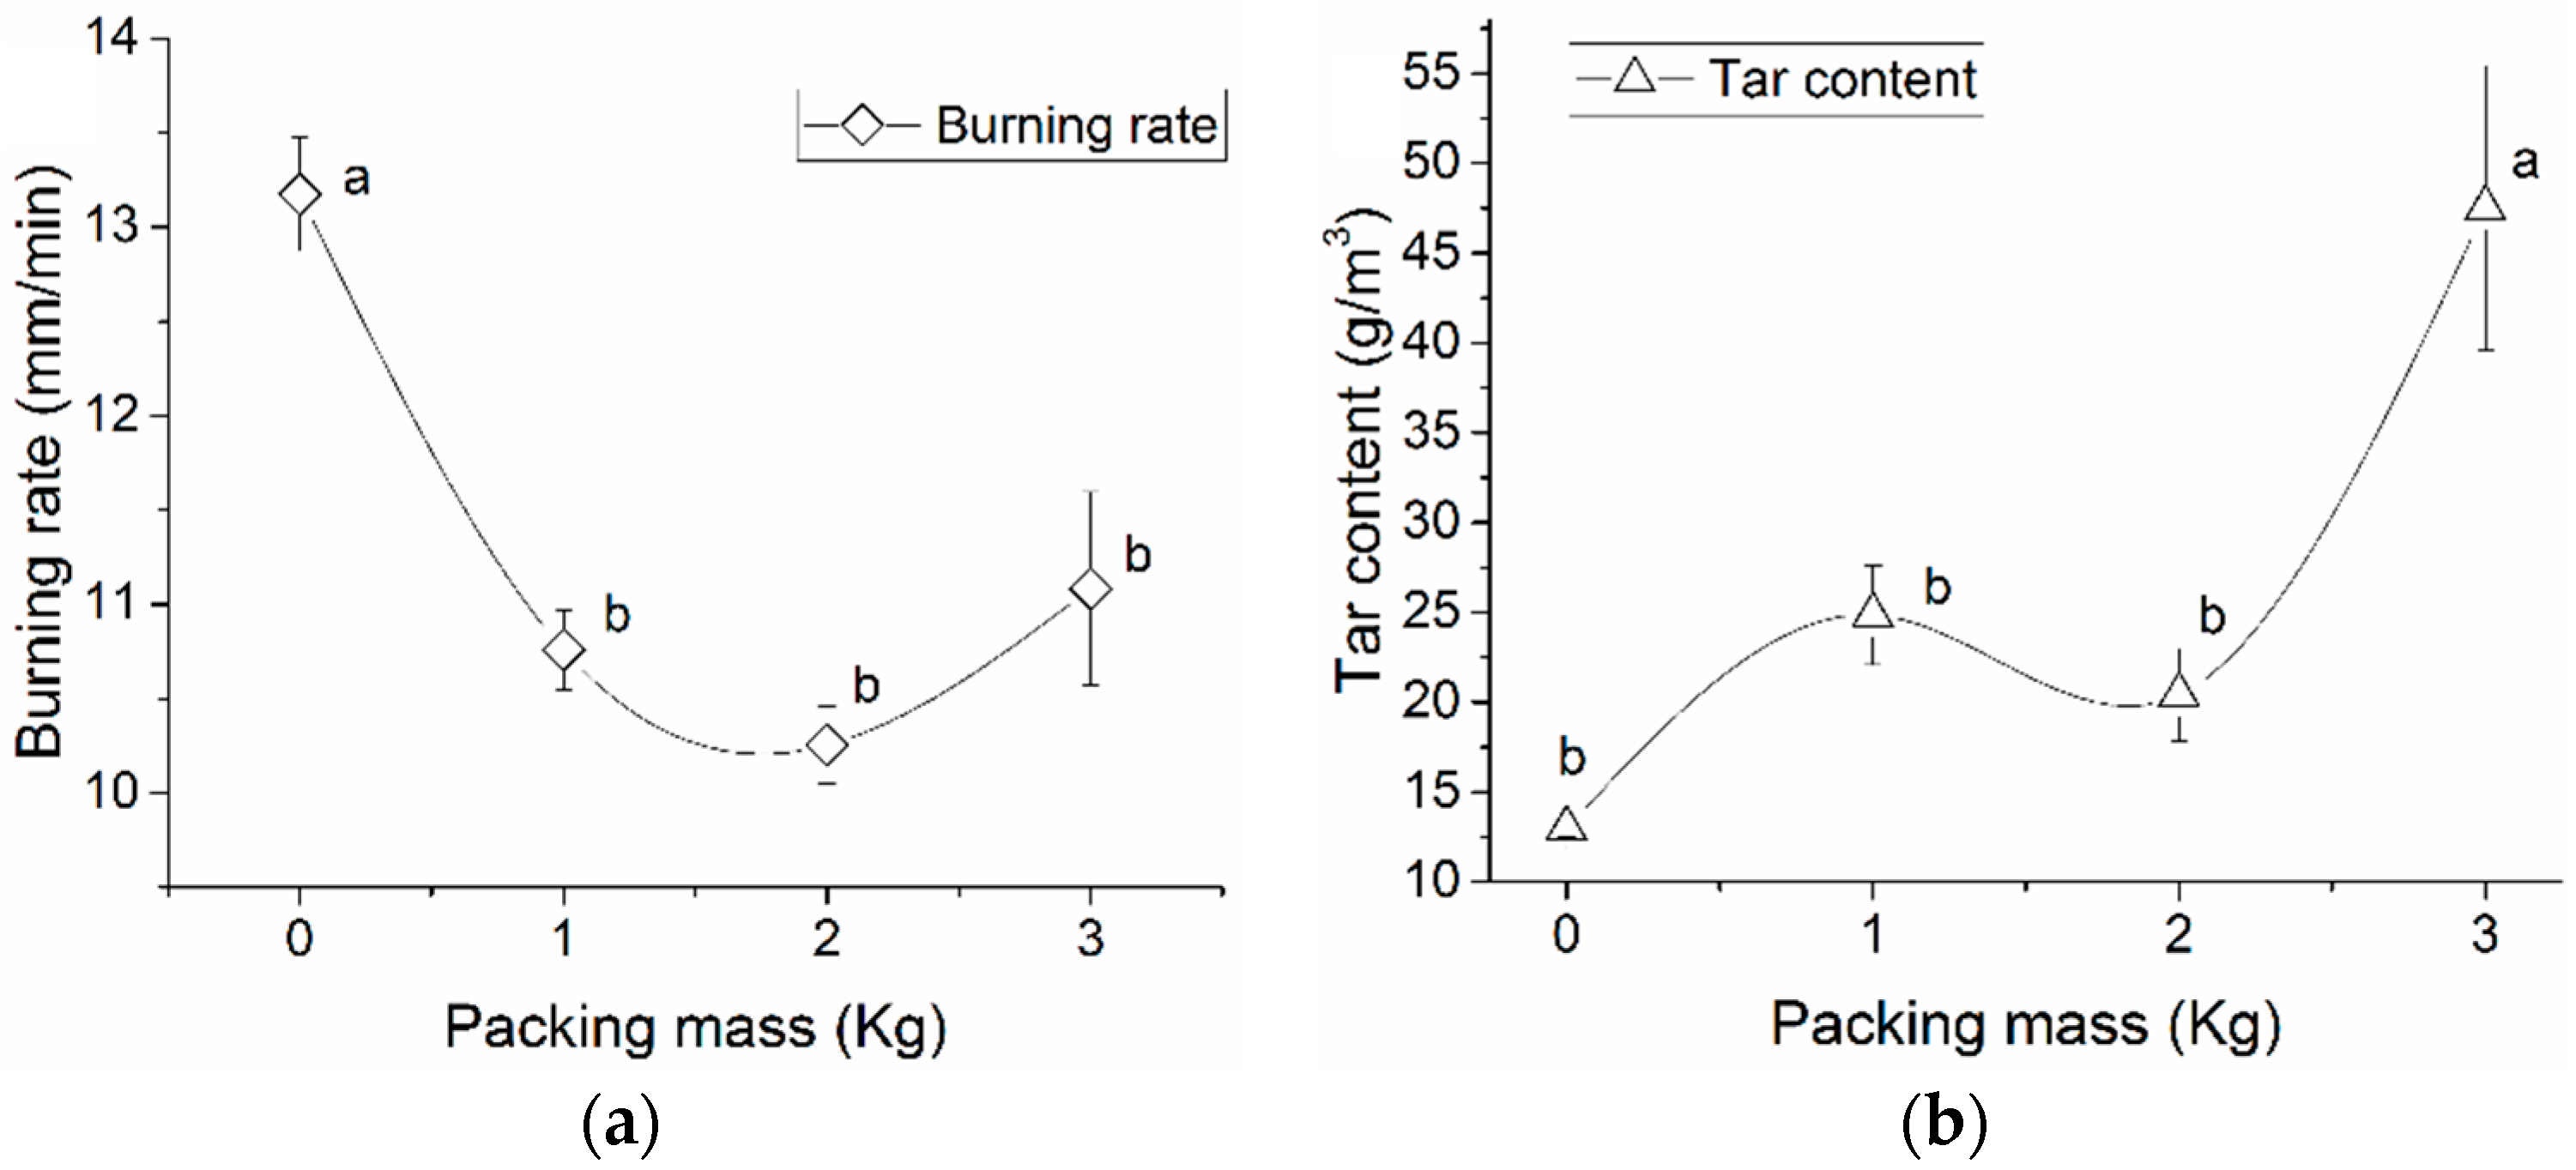
3.3. The Effect of Biomass Compactness

Increasing the biomass compactness in the top-lit updraft biomass gasifier improved the yield of biochar from 12.2% to 17% when the compactness increased from 0 to 3 kg of mass (Figure 6a). However, the combustion temperature did not statistically vary as the biomass compactness increased (Figure 6b).
Increasing the biomass compactness meant more mass of biomass per unit area in the gasifier column, thus more biomass was carbonized when compared with no compacting it. Subsequently, if the reaction temperature remained unchanged, the burning rate was expected to decrease. As shown in Figure 7a, the average burning rate of biomass decreased from 13 to 10.2 mm/min as increasing the biomass compactness from 0 to 2 kg, but it slightly increased to 11 mm/min when further increasing the biomass density. Moreover, the variations were not statistically different when all compacting masses were considered. The fact that the combustion temperature did not present significant differences (Figure 6b) when increasing the compactness suggested a more efficient carbonization of biomass.
In contrast, the biomass compactness had a negative effect on the tar content, which raised from 13 to 47 g/m3 as the compactness increased from 0 to 3 kg (Figure 7b). This confirmed that the compaction significantly increased the number of biomass particles within the gasifier. Thus more volatiles emanated from the biomass when compared with lower levels of compactness. However, despite this increased amount of volatiles the combustion temperature did not increase because of the limited availability of air for reaction. The increased biochar in the reduction bed might help to reduce some tars by thermalcatalytic cracking, however, this was not sufficient to offset the increased tar generation due to compacted biomass particles. Contrary to the particle size and moisture content, the biomass compactness did not have statistically significant effects on the syngas compositions or syngas higher heating value (Table 4).

4. Conclusions

The particle size, moisture content and biomass compactness of wood chips were found to influence the gasification performance of a top-lit updraft gasifier. The increase in particles size had two different tendencies that were correlated with the bulk density of the raw biomass. Particles with average size of 7 mm presented the highest combustion temperature when compared with smaller and larger particles. As a result, the gasification of wood chips with 7 mm particles presented lower biochar yield, burning rate and tar content due to the relatively higher bulk density of wood chips. The addition of moisture to the biomass represented reduction in the burning rate that promoted the utilization of carbon that resulted in decrease in biochar yield. Furthermore, the moisture content helped to considerably reduce the tar content in the syngas due to reforming and cracking reactions that were catalyzed by the excess of water and the abundant carbon in the reactor. In addition, the yield of biochar increased when the biomass compactness increased, but it aggravated the minimization of tars. This was because of the increased amount of biomass per unit area within the gasifier chamber that generated large amounts of volatiles at higher levels of biomass compactness. In general, the hydrogen gas and carbon monoxide contents of the syngas generated from the studied top-lit updraft gasification process were much lower than those from conventional gasification processes. Thus, the main product from the process should be biochar, and the use of the byproduct syngas may be limited.

Acknowledgments

This material was based upon the work supported by the U.S. Department of Agriculture and Sun Grant (Award No. 2010-38502-21836 and Subaward No. AB-5-67630. KSU11) and the startup fund of North Carolina State University. The lead author was also partially supported by the scholarship program of IFARHU-SENACYT (Institute for Training and Development of Human Resources-National Secretary of Science, Technology and Innovation) from the Government of Panama. We thank Justin Macialek, research assistant at North Carolina State University, for his help building the top-lit updraft gasifier.

Author Contributions

All the authors conceived and designed the experiments and analyzed the data; Arthur James performed the experiments; Wenqiao Yuan contributed reagents/materials/analysis tools; Arthur James and Wenqiao Yuan wrote the paper.

Conflicts of Interest

The authors declare no conflict of interest. The founding sponsors had no role in the design of the study; in the collection, analyses, or interpretation of data; in the writing of the manuscript, and in the decision to publish the results.

Abbreviations

The following abbreviations are used in this manuscript:
DMDesirable moisture content (%)
DWCDry weight of biochar (g)
DWBDry weight of biomass (g)
WTarWeight of tar in biochar (g)
MCMoisture in biochar (g)
MBMoisture in biomass (g)

References

  1. Isikgor, F.; Becer, C.R. Lignocellulosic Biomass: A Sustainable Platform for Production of Bio-Based Chemicals and Polymers. Polym. Chem. 2015, 6, 4497–4559. [Google Scholar] [CrossRef]
  2. Salehi Jouzani, G.; Taherzadeh, M.J. Advances in consolidated bioprocessing systems for bioethanol and butanol production from biomass: A comprehensive review. Biofuel Res. J. 2015, 2, 152–195. [Google Scholar] [CrossRef]
  3. Wyman, C.E. Ethanol from lignocellulosic biomass: Technology, economics, and opportunities. Bioresour. Technol. 1994, 50, 3–15. [Google Scholar] [CrossRef]
  4. Schrader, J.; McCabe, K.; Graves, W.; Grewell, D. Function and Biodegradation in Soil of Bioplastic Horticultural Containers Made of PLA-BioResTM Composites. Available online: http://lib.dr.iastate.edu/cgi/viewcontent.cgi?article=3160&context=farms_reports (accessed on 2 February 2016).
  5. Emrich, W. Handbook of Charcoal Making. The Traditional and Industrial Methods; D. Reidel Pub. Co.: Dordrecht, The Netherland, 1985. [Google Scholar]
  6. Ahmad, A.; Loh, M.; Aziz, J. Preparation and characterization of activated carbon from oil palm wood and its evaluation on methylene blue adsorption. Dyes Pigments 2007, 75, 263–272. [Google Scholar] [CrossRef]
  7. Sadasivam, B.Y.; Reddy, K.R. Adsorption and transport of methane in landfill cover soil amended with waste-wood biochars. J. Environ. Manag. 2015, 158, 11–23. [Google Scholar] [CrossRef] [PubMed]
  8. Winsley, P. Biochar and bioenergy production for climate change mitigation. N. Z. Sci. Rev. 2007, 64, 5–10. [Google Scholar]
  9. Cao, Y.; Wang, Y.; Riley, J.T.; Pan, W. A novel biomass air gasification process for producing tar-free higher heating value fuel gas. Fuel Process. Technol. 2006, 87, 343–353. [Google Scholar] [CrossRef]
  10. Tijmensen, M.J.; Faaij, A.P.; Hamelinck, C.N.; van Hardeveld, M.R. Exploration of the possibilities for production of Fischer Tropsch liquids and power via biomass gasification. Biomass Bioenergy 2002, 23, 129–152. [Google Scholar] [CrossRef]
  11. Wang, D.; Yuan, W.; Ji, W. Char and char-supported nickel catalysts for secondary syngas cleanup and conditioning. Appl. Energy 2011, 88, 1656–1663. [Google Scholar] [CrossRef]
  12. Chianese, S.; Loipersböck, J.; Malits, M.; Rauch, R.; Hofbauer, H.; Molino, A.; Musmarra, D. Hydrogen from the high temperature water gas shift reaction with an industrial Fe/Cr catalyst using biomass gasification tar rich synthesis gas. Fuel Process. Technol. 2015, 132, 39–48. [Google Scholar] [CrossRef]
  13. Dry, M.E. The Fischer-Tropsch process: 1950–2000. Catal. Today 2002, 71, 227–241. [Google Scholar] [CrossRef]
  14. Knoef, H. Handbook Biomass Gasification; BTG Biomass Technology Group: Enschede, The Netherlands, 2005. [Google Scholar]
  15. Latif, H.; Zeidan, A.A.; Nielsen, A.T.; Zengler, K. Trash to treasure: Production of biofuels and commodity chemicals via syngas fermenting microorganisms. Curr. Opin. Biotechnol. 2014, 27, 79–87. [Google Scholar] [CrossRef] [PubMed]
  16. Richardson, Y.; Drobek, M.; Julbe, A.; Blin, J.; Pinta, F. Chapter 8-Biomass Gasification to Produce Syngas. In Recent Advance in Thermos-Chemical Conversion of Biomass; Pandey, A., Bhaskar, T., Stöcker, M., Sukumaran, R., Eds.; Elsevier: Boston, MA, USA, 2015; pp. 213–250. [Google Scholar]
  17. Molino, A.; Chianese, S.; Musmarra, D. Biomass gasification technology: The state of the art overview. J. Energy Chem. 2016, 25, 10–25. [Google Scholar] [CrossRef]
  18. Saravanakumar, A.; Haridasan, T.; Reed, T.B.; Bai, R.K. Experimental investigation and modelling study of long stick wood gasification in a top lit updraft fixed bed gasifier. Fuel 2007, 86, 2846–2856. [Google Scholar] [CrossRef]
  19. Kirubakaran, V.; Sivaramakrishnan, V.; Nalini, R.; Sekar, T.; Premalatha, M.; Subramanian, P. A review on gasification of biomass. Renew. Sustain. Energy Rev. 2009, 13, 179–186. [Google Scholar] [CrossRef]
  20. Antal, M.J.; Grønli, M. The art, science, and technology of charcoal production. Ind. Eng. Chem. Res. 2003, 42, 1619–1640. [Google Scholar] [CrossRef]
  21. Cheah, S.; Malone, S.C.; Feik, C.J. Speciation of sulfur in biochar produced from pyrolysis and gasification of oak and corn stover. Environ. Sci. Technol. 2014, 48, 8474–8480. [Google Scholar] [CrossRef] [PubMed]
  22. Qian, K.; Kumar, A.; Patil, K.; Bellmer, D.; Wang, D.; Yuan, W.; Huhnke, R.L. Effects of biomass feedstocks and gasification conditions on the physiochemical properties of char. Energies 2013, 6, 3972–3986. [Google Scholar] [CrossRef]
  23. Nsamba, H.K.; Hale, S.E.; Cornelissen, G.; Bachmann, R.T. Designing and Performance Evaluation of Biochar Production in a Top-Lit Updraft Up-scaled Gasifier. J. Sustain. Bioenergy Syst. 2015, 5, 41–55. [Google Scholar] [CrossRef]
  24. Reed, T.B.; Larson, R. A wood-gas stove for developing countries. Energy Sustain. Dev. 1996, 3, 34–37. [Google Scholar] [CrossRef]
  25. Birzer, C.; Medwell, P.; MacFarlane, G.; Read, M.; Wilkey, J.; Higgins, M.; West, T. A Biochar-producing, Dung-burning Cookstove for Humanitarian Purposes. Procedia Eng. 2014, 78, 243–249. [Google Scholar] [CrossRef]
  26. Mukunda, H.; Dasappa, S.; Paul, P.; Rajan, N.; Yagnaraman, M.; Ravi Kumar, D.; Deogaonkar, M. Gasifier stoves—Science, technology and field outreach. Curr. Sci. 2010, 98, 627–638. [Google Scholar]
  27. Tryner, J.; Willson, B.D.; Marchese, A.J. The effects of fuel type and stove design on emissions and efficiency of natural-draft semi-gasifier biomass cookstoves. Energy Sustain. Dev. 2014, 23, 99–109. [Google Scholar] [CrossRef]
  28. Brown, R. Biochar production technology. In Biochar for Environmental Management: Science and Technology; Lehmann, J., Joseph, S., Eds.; Earthscan: London, UK, 2009; pp. 127–146. [Google Scholar]
  29. Birzer, C.; Medwell, P.; Wilkey, J.; West, T.; Higgins, M.; MacFarlane, G.; Read, M. An analysis of combustion from a top-lit up-draft (TLUD) cookstove. J. Humanit. Eng. 2013, 2, 1–8. [Google Scholar]
  30. Huangfu, Y.; Li, H.; Chen, X.; Xue, C.; Chen, C.; Liu, G. Effects of moisture content in fuel on thermal performance and emission of biomass semi-gasified cookstove. Energy Sustain. Dev. 2014, 21, 60–65. [Google Scholar] [CrossRef]
  31. Tinaut, F.V.; Melgar, A.; Pérez, J.F.; Horrillo, A. Effect of biomass particle size and air superficial velocity on the gasification process in a downdraft fixed bed gasifier. An experimental and modelling study. Fuel Process. Technol. 2008, 89, 1076–1089. [Google Scholar] [CrossRef]
  32. ASTM D3175-11 Standard. Standard Test Method for Volatile Matter in the Analysis Sample of Coal and Coke—ASTM Coal and Coke; ASTM International: West Conshohocken, PA, USA, 2011. [Google Scholar]
  33. ASTM E1755-01 Standard. Standard Test Method for Ash in Biomass—ASTM Bioenergy and Industrial Chemicals from Biomass; ASTM International: West Conshohocken, PA, USA, 2015. [Google Scholar]
  34. Wang, D.; Yuan, W.; Wei, J. Effective syngas cleanup and reforming using Ni. Int. J. Agric. Biol. Eng. 2010, 3, 39–45. [Google Scholar]
  35. James, A.M.; Yuan, W.; Boyette, M.D.; Wang, D. The effect of air flow rate and biomass type on the performance of an updraft biomass gasifier. Bioresources 2015, 10, 3615–3624. [Google Scholar] [CrossRef]
  36. Demirbas, A. Carbonization ranking of selected biomass for charcoal, liquid and gaseous products. Energy Convers. Manag. 2001, 42, 1229–1238. [Google Scholar] [CrossRef]
  37. Sun, Y.; Gao, B.; Yao, Y.; Fang, J.; Zhang, M.; Zhou, Y.; Chen, H.; Yang, L. Effects of feedstock type, production method, and pyrolysis temperature on biochar and hydrochar properties. Chem. Eng. J. 2014, 240, 574–578. [Google Scholar] [CrossRef]
  38. Demirbas, A. Effects of temperature and particle size on bio-char yield from pyrolysis of agricultural residues. J. Anal. Appl. Pyrolysis 2004, 72, 243–248. [Google Scholar] [CrossRef]
  39. Vreugdenhil, B.; Zwart, R.; Neeft, J.P.A. Tar Formation in Pyrolysis and Gasification. Available online: ftp://130.112.2.101/pub/www/library/report/2008/e08087.pdf (accessed on 2 February 2016).
  40. Kinoshita, C.M.; Wang, Y.; Zhou, J. Tar formation under different biomass gasification conditions. J. Anal. Appl. Pyrolysis 1994, 29, 169–181. [Google Scholar] [CrossRef]
  41. Li, X.T.; Grace, J.R.; Lim, C.J.; Watkinson, A.P.; Chen, H.P.; Kim, J.R. Biomass gasification in a circulating fluidized bed. Biomass Bioenergy 2004, 26, 171–193. [Google Scholar] [CrossRef]
  42. Hernández, J.J.; Aranda-Almansa, G.; Bula, A. Gasification of biomass wastes in an entrained flow gasifier: Effect of the particle size and the residence time. Fuel Process. Technol. 2010, 91, 681–692. [Google Scholar] [CrossRef]
  43. Lv, P.M.; Xiong, Z.H.; Chang, J.; Wu, C.Z.; Chen, Y.; Zhu, J.X. An experimental study on biomass air-steam gasification in a fluidized bed. Bioresour. Technol. 2004, 95, 95–101. [Google Scholar] [CrossRef] [PubMed]
  44. Guo, F.; Dong, Y.; Dong, L.; Guo, C. Effect of design and operating parameters on the gasification process of biomass in a downdraft fixed bed: An experimental study. Int. J. Hydrog. Energy 2014, 39, 5625–5633. [Google Scholar] [CrossRef]
  45. McKendry, P. Energy production from biomass (part 3): Gasification technologies. Bioresour. Technol. 2002, 83, 55–63. [Google Scholar] [CrossRef]
  46. Ponzio, A.; Kalisz, S.; Blasiak, W. Effect of operating conditions on tar and gas composition in high temperature air/steam gasification (HTAG) of plastic containing waste. Fuel Process. Technol. 2006, 87, 223–233. [Google Scholar] [CrossRef]
  47. Shen, Y.; Zhao, P.; Shao, Q.; Ma, D.; Takahashi, F.; Yoshikawa, K. In-situ catalytic conversion of tar using rice husk char-supported nickel-iron catalysts for biomass pyrolysis/gasification. Appl. Catal. B Environ. 2014, 152–153, 140–151. [Google Scholar] [CrossRef]
  48. James, R.A.M.; Yuan, W.; Boyette, M.D.; Wang, D.; Kumar, A. In-chamber thermocatalytic tar cracking and syngas reforming using char-supported NiO catalyst in an updraft biomass gasifier. Int. J. Agric. Biol. Eng. 2014, 7, 91–97. [Google Scholar]
  49. Franco, C.; Pinto, F.; Gulyurtlu, I.; Cabrita, I. The study of reactions influencing the biomass steam gasification process. Fuel 2003, 82, 835–842. [Google Scholar] [CrossRef]
  50. Gil, J.; Corella, J.; Aznar, M.P.; Caballero, M.A. Biomass gasification in atmospheric and bubbling fluidized bed: Effect of the type of gasifying agent on the product distribution. Biomass Bioenergy 1999, 17, 389–403. [Google Scholar] [CrossRef]
Figure 1. The top-lit updraft biomass gasification system setup.
Energies 09 00283 g001
Figure 2. (a) The biochar yield and (b) combustion zone temperature of wood chips gasification at varying particles sizes (airflow 20 lpm, moisture content 10%, and biomass compactness 0 kg). Different letters on data points indicate significant differences (p < 0.05).
Energies 09 00283 g002
Figure 3. (a) Gasification burning rate and (b) tar content in syngas at varying particle sizes (airflow rate 20 lpm, moisture content 10%, and biomass compactness 0 kg). Different letters on data points indicate significant differences (p < 0.05).
Energies 09 00283 g003
Figure 4. (a) Biochar yield and (b) combustion zone temperature of wood chips at different moisture contents (airflow 20 lpm, avg. particle size 7 mm, biomass compactness 0 kg). Different letters on data points indicate significant differences (p < 0.05).
Energies 09 00283 g004
Figure 5. (a) Burning rate and (b) tar content in syngas using biomass with varying moisture contents (airflow rate 20 lpm, avg. particle size 7 mm, biomass compactness 0 kg). Different letters on data points indicate significant differences (p < 0.05).
Energies 09 00283 g005
Figure 6. (a) Biochar yield and (b) combustion zone temperature using biomass with different biomass compactness. Airflow 20 lpm, 10% moisture content, avg. particle size 7 mm. Different letters on data points indicate significant differences (p < 0.05).
Energies 09 00283 g006
Figure 7. (a) Burning rate and (b) tar content in syngas using biomass at different biomass compactness. Airflow 20 lpm, 10% moisture content, avg. particle size 7 mm. Different letters on data points indicate significant differences (p < 0.05).
Energies 09 00283 g007
Table 1. Properties of wood chips.
PropertyValue
C (%)47.90
H (%)1.70
N (%)0.30
O ** (%)49.90
S (%)0.20
Ash (%)0.57
Volatile Matter (%)72.63
Fixed Carbon ** (%)16.66
Moisture (%)10.14
Higher Heating Value (MJ/kg)19.53
Bulk Density (g/cm3)/avg. Particle Size0.207/2 mm
0.211/7 mm
0.196/17 mm
0.192/30 mm
** Calculated by difference.
Table 2. CO and H2 compositions and the higher heating value of syngas generated at varying particle sizes (airflow rate 20 lpm, moisture content 10%, and biomass compactness 0 kg).
Particle Size (mm)H2 (% v/v)CO (% v/v)CH4 (% v/v)CO2 (% v/v)O2 (% v/v)N2 (% v/v)HHV MJ/m3
24.26 ± 0.66 a14.71 ± 1.01 ab2.18 ± 0.30 NS12.54 ± 0.37 b1.41 ± 0.17 NS64.90 ± 1.49 ab3.26 ± 0.30 b
76.61 ± 0.38 a14.97 ± 0.22 a2.39 ± 0.09 NS13.48 ± 0.34 ab1.51 ± 0.31 NS61.04 ± 0.71 b3.67 ± 0.11 a
173.59 ± 0.07 ab12.80 ± 0.23 b2.20 ± 0.05 NS14.38 ± 0.44 ab1.57 ± 0.41 NS65.46 ± 0.33 a2.94 ± 0.05 b
302.89 ± 0.19 b11.84 ± 0.46 b2.15 ± 0.12 NS14.73 ± 0.51 a1.76 ± 0.27 NS66.63 ± 0.59 a2.71 ± 0.12 b
Different superscripts indicate significant differences (p < 0.05). NS—not significantly different.
Table 3. Syngas composition and higher heating value of syngas at varying biomass moisture contents (airflow 20 lpm, avg. particle size 7 mm, biomass compactness 0 kg).
Moisture Content (% wt)H2 (% v/v)CO (% v/v)CH4 (% v/v)CO2 (% v/v)O2 (% v/v)N2 (% v/v)HHV MJ/m3
106.61 ± 0.38 a14.97 ± 0.22 a2.39 ± 0.09 a13.48 ± 0.34 NS1.51 ± 0.31 NS61.04 ± 0.71 b3.67 ± 0.11 NS
145.73 ± 0.30 ab12.92 ± 0.07 ab1.94 ± 0.03 ab12.57 ± 0.42 NS2.34 ± 0.29 NS64.50 ± 0.51 ab3.13 ± 0.06 NS
185.62 ± 0.59 b10.51 ± 1.46 b1.55 ± 0.22 b11.98 ± 1.79 NS3.69 ± 2.04 NS66.65 ± 1.99 a2.65 ± 0.35 NS
226.02 ± 0.27 b11.16 ± 0.11 b1.69 ± 0.04 b13.70 ± 0.0 NS1.77 ± 0.09 NS65.67 ± 0.41 ab2.84 ± 0.05 NS
Different superscripts indicate significant differences (p < 0.05), NS—not significantly different.
Table 4. Syngas composition and higher heating value at varying biomass compactness (airflow 20 lpm, 10% moisture content, avg. particle size 7 mm).
Biomass Compactness (kg)H2 (% v/v)CO (% v/v)CH4 (% v/v)CO2 (% v/v)O2 (% v/v)N2 (% v/v)HHV MJ/m3
06.61 ± 0.38 NS14.97 ± 0.22 NS2.39 ± 0.0913.48 ± 0.34 1.51 ± 0.3161.04 ± 0.713.67 ± 0.11 NS
15.91 ± 0.12 NS14.50 ± 0.60 NS2.30 ± 0.0912.59 ± 0.281.64 ± 0.37 NS63.05 ± 0.723.49 ± 0.13 NS
25.73 ± 0.06 NS14.82 ± 0.23 NS2.33 ± 0.0312.71 ± 0.151.29 ± 0.02 NS63.13 ± 0.243.52 ± 0.04 NS
35.80 ± 0.21 NS15.25 ± 0.10 NS2.41 ± 0.0413.09 ± 0.021.15 ± 0.0262.30 ± 0.243.61 ± 0.02 NS
NS—not significantly different.

