Article

Design and Analysis of Jacket Substructures for Offshore Wind Turbines

Department of Engineering Science and Ocean Engineering, National Taiwan University, Taipei 106, Taiwan
*
Author to whom correspondence should be addressed.
Energies 2016, 9(4), 264; https://doi.org/10.3390/en9040264
Submission received: 31 January 2016 / Revised: 22 March 2016 / Accepted: 30 March 2016 / Published: 2 April 2016

Abstract

:
This study focused on investigating various existing types of offshore jacket substructures along with a proposed twisted-tripod jacket type (modified jacket (MJ)-structures). The architectures of the three-leg structure, as well as the patented twisted jacket structure motivated the design of the proposed MJ-structures. The dimensions of the structures were designed iteratively using static stress analysis to ensure that all structures had a similar level of load-carrying capability. The numerical global buckling analyses were performed for all structures after the validation by the scaled-down experiments. The local buckling strength of all compressive members was analyzed using the NORSOK standard. The results showed that the proposed MJ-structures possess excellent structural behavior and few structural nodes and components competitive with the patented twisted jacket structures, while still maintaining the advantages of low material usage similar to the three-leg jacket structures. This study provides alternatives for the initial selection and design of offshore wind turbine substructures for green energy applications.

1. Introduction

The consumption and overdevelopment of fossil energy have caused serious environmental problems and are believed to be some of the critical factors contributing to global warming. Renewable energy, such as solar, wind, geothermal and biomass, are all clean energy with tremendous amounts of resources for electricity generation. It was centuries ago when the technology of wind energy made its first steps. As one of the most developed renewable energy technologies, wind power has become the primary consideration with accelerated growth during the past few decades [1,2,3,4]. 2014 was a record year for the wind industry, as annual installations crossed the 50 GW mark for the first time. More than 51 GW of new wind power capacity was brought on line. The big story, of course, was China, installing an astonishing 23 GW in 2014, cornering 45% of the annual market, mostly onshore [5]. 2014 saw total cumulative installations in the offshore sector rise to nearly 9 GW. Most of all offshore wind installations can be found in European waters. As of 30 June 2015, cumulatively, there are 3072 offshore wind turbines with a combined capacity of 10,393.6 MW fully-grid connected in European waters in 82 wind farms across 11 countries, including demonstration sites [6]. However, governments outside of Europe have set ambitious targets for offshore wind, and development is staring to take off in China, Japan, South Korea, U.S. and, of course, Taiwan.
There are needs to develop associated wind technology, including support structures that can withstand local environmental conditions. Commonly, a few types of offshore wind tower support structures include monopile, gravity, tripod, jacket, tripile and floating types. The type of wind tower is chosen on the basis of two factors: depth of the open sea and the condition of the seabed [7,8]. Monopile and gravity structures are often found to be the most suitable for constructing in the shallow water region, where the water depth is lower than 30 m. Golightly [9] showed that the monopiles are developed in water depths greater than 30 m. Tripod and jacket structures can be built in transitional water regions, which have a water depth between 30 and 50 m. Floating structures are mostly constructed in deep water regions, where the water depth exceeds 50 m [10,11]. Note that a number of floating wave and offshore wind hybrids have been proposed as a new concept in recent times with the development of floating offshore wind prototypes [12].
The cost of the substructure and foundation was evaluated for approximately 14% of the total capital expenditures of the offshore wind plant reference project [13]. It has been suggested that using jacket structure rather than others offshore has positive effects, such as low wave and current impact loads on the structure compared to others [14]. In particular, four substructure types (monopile, tripile, tripod and jacket) designed for an average water depth of 70 m in central Mediterranean waters were compared [15]. The results showed that the jacket type substructure is least expensive considering the cost of procurement and fabrication for the Hurd Bank site (one of the sites considered for wind farms in Malta). In addition, the results of finite element analysis concluded that the jacket was the most hydrodynamically transparent among the four types. All aforementioned results agreed with those in [16,17] and indicated that the jacket type is most attractive for substructures in water depths greater than 30 m and is the most cost-efficient solution for wind turbines up to 8 MW.
A number of traditional jacket substructures have been introduced and investigated, including K-braces, X-braces, Z-braces, subdivided-braces, rhombus-braces and mixed-braces [18,19]. For instance, a jacket with Z-braces seems to have less mass of the structure and smaller dynamic forces acting on the structures, as compared to the jacket with X-braces [18]. Tubular joints are widely used for the jacket substructures. The tubular members create a complicated geometry at the intersection of members, i.e., joint-can. Joint-cans can play an important role in the jacket substructures. For extreme loads in the jacket, joint-cans help increase extreme capacity to a certain extent [20]. A well-designed jacket frame equipped with joint-cans dissipates energy much more effectively in comparison with a poorly-designed jacket frame without joint-cans [21]. Buckling of braces will be normally encountered prior to joint failure if the joint-cans were to be carefully designed and constructed [22]. This is rather expected since the buckling of structural members is better understood and controlled than the fracture of joints.
A recently-designed new jacket substructure was invented and patented by Keystone Engineering Inc., called the inward battered guide structure (IBGS), or “twisted jacket” foundation [23,24,25]. A number of advantages of the IBGS have been suggested, such as the fabrication costs are approximately 20% less expensive than traditional offshore wind turbine jackets, it has fewer nodes and components compared to a traditional jacket, it is safer and easier to manufacture than a traditional jacket, it is more compact, allowing for more structures to be transported, and it has less offshore welding and underwater work, greatly reducing commercial and schedule risks, etc. [25].
This study compares several jacket substructures on the basis of stress and buckling analysis. In total, 14 substructures categorized into four types were constructed and investigated, including one proposed type. Stress analysis using beam element models, as well as global and local buckling analysis were performed. The results provide insights into development of a novel design for offshore wind turbine substructures.

2. Design and Specification of Jacket Substructures

2.1. Basic Information for Design

The substructures investigated in the present study were designed and modeled for potentially supporting heavy wind turbines, such as the NREL 5-MW baseline wind turbine [26,27] in the Taiwan Strait with an average water depth 50 m. The wind turbine machine and tower were not of interest in the design. The weight of the structures above the tower and loads acting on the wind turbine and tower were simplified in the analysis.
All substructures were initially designed with the assumed dimensions. Stress analyses described in Section 3 were then performed to determine the maximum von Mises stresses in the structures. The dimensions of the structures were iteratively modified so that the maximum stresses generated in all designed structures, under identical load and boundary conditions, fell at a similar level. Note that the iteration procedure did not aim to optimize the structures and was stopped once the maximum stress was found within the expected level.

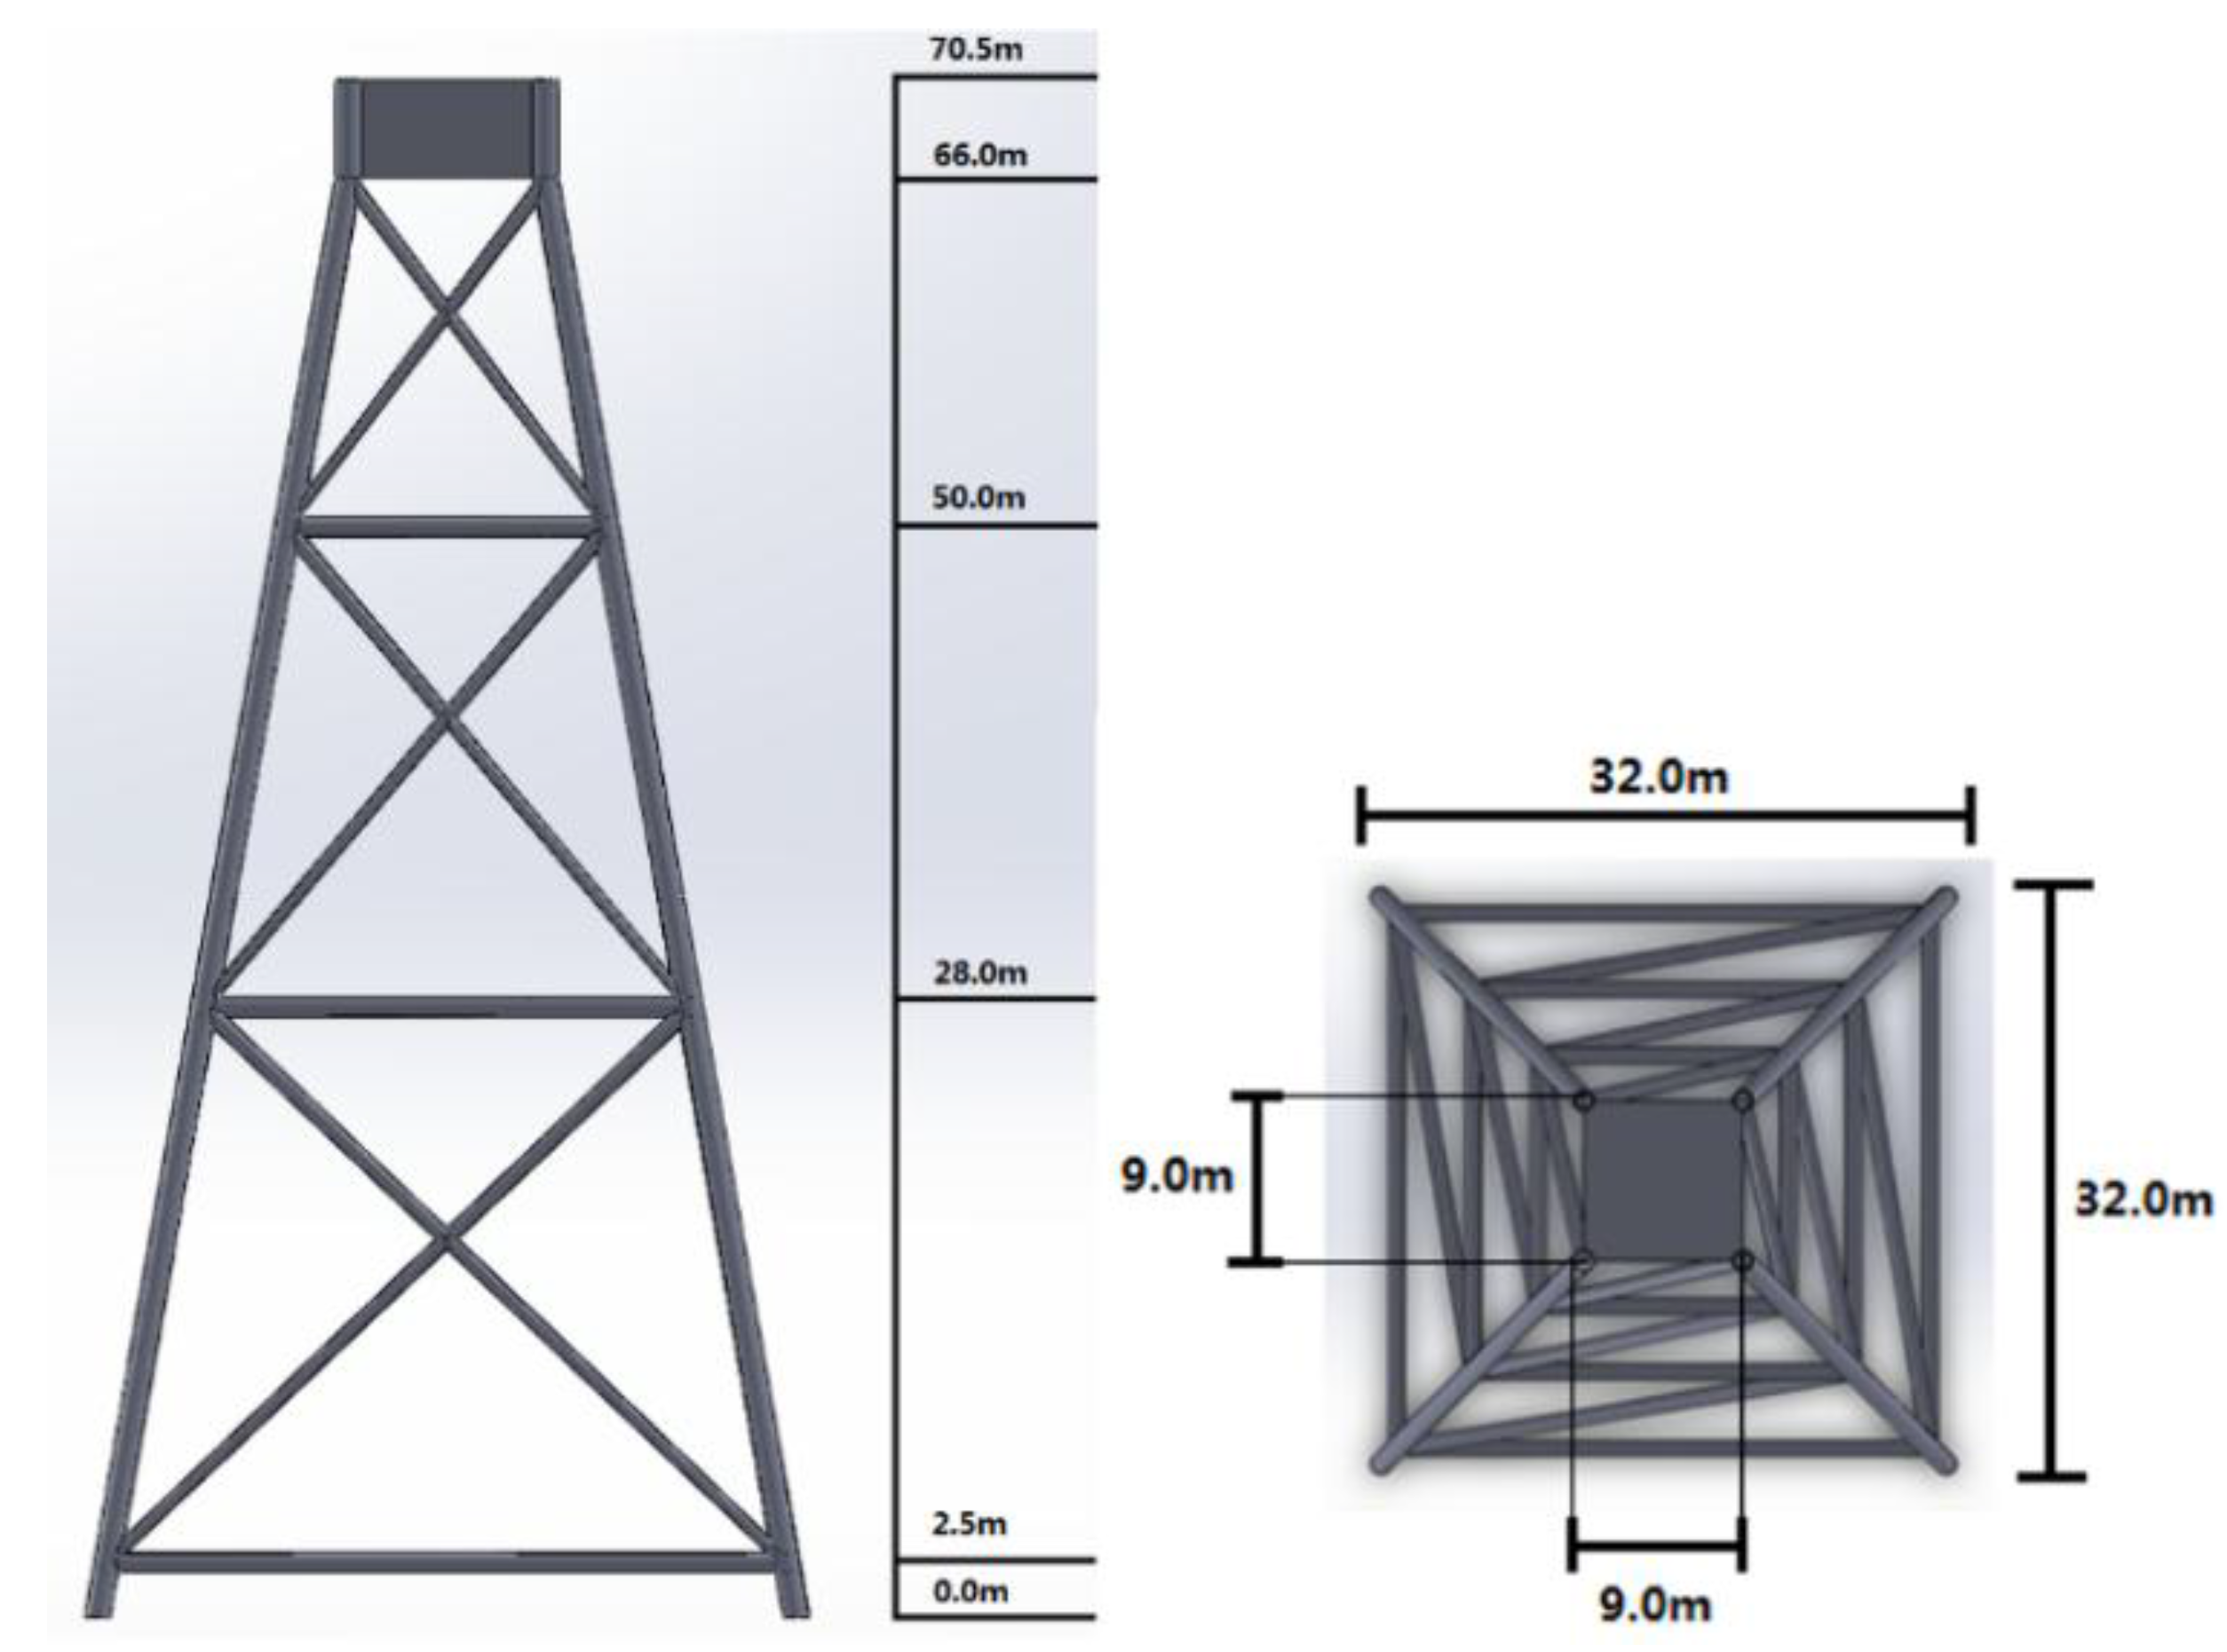
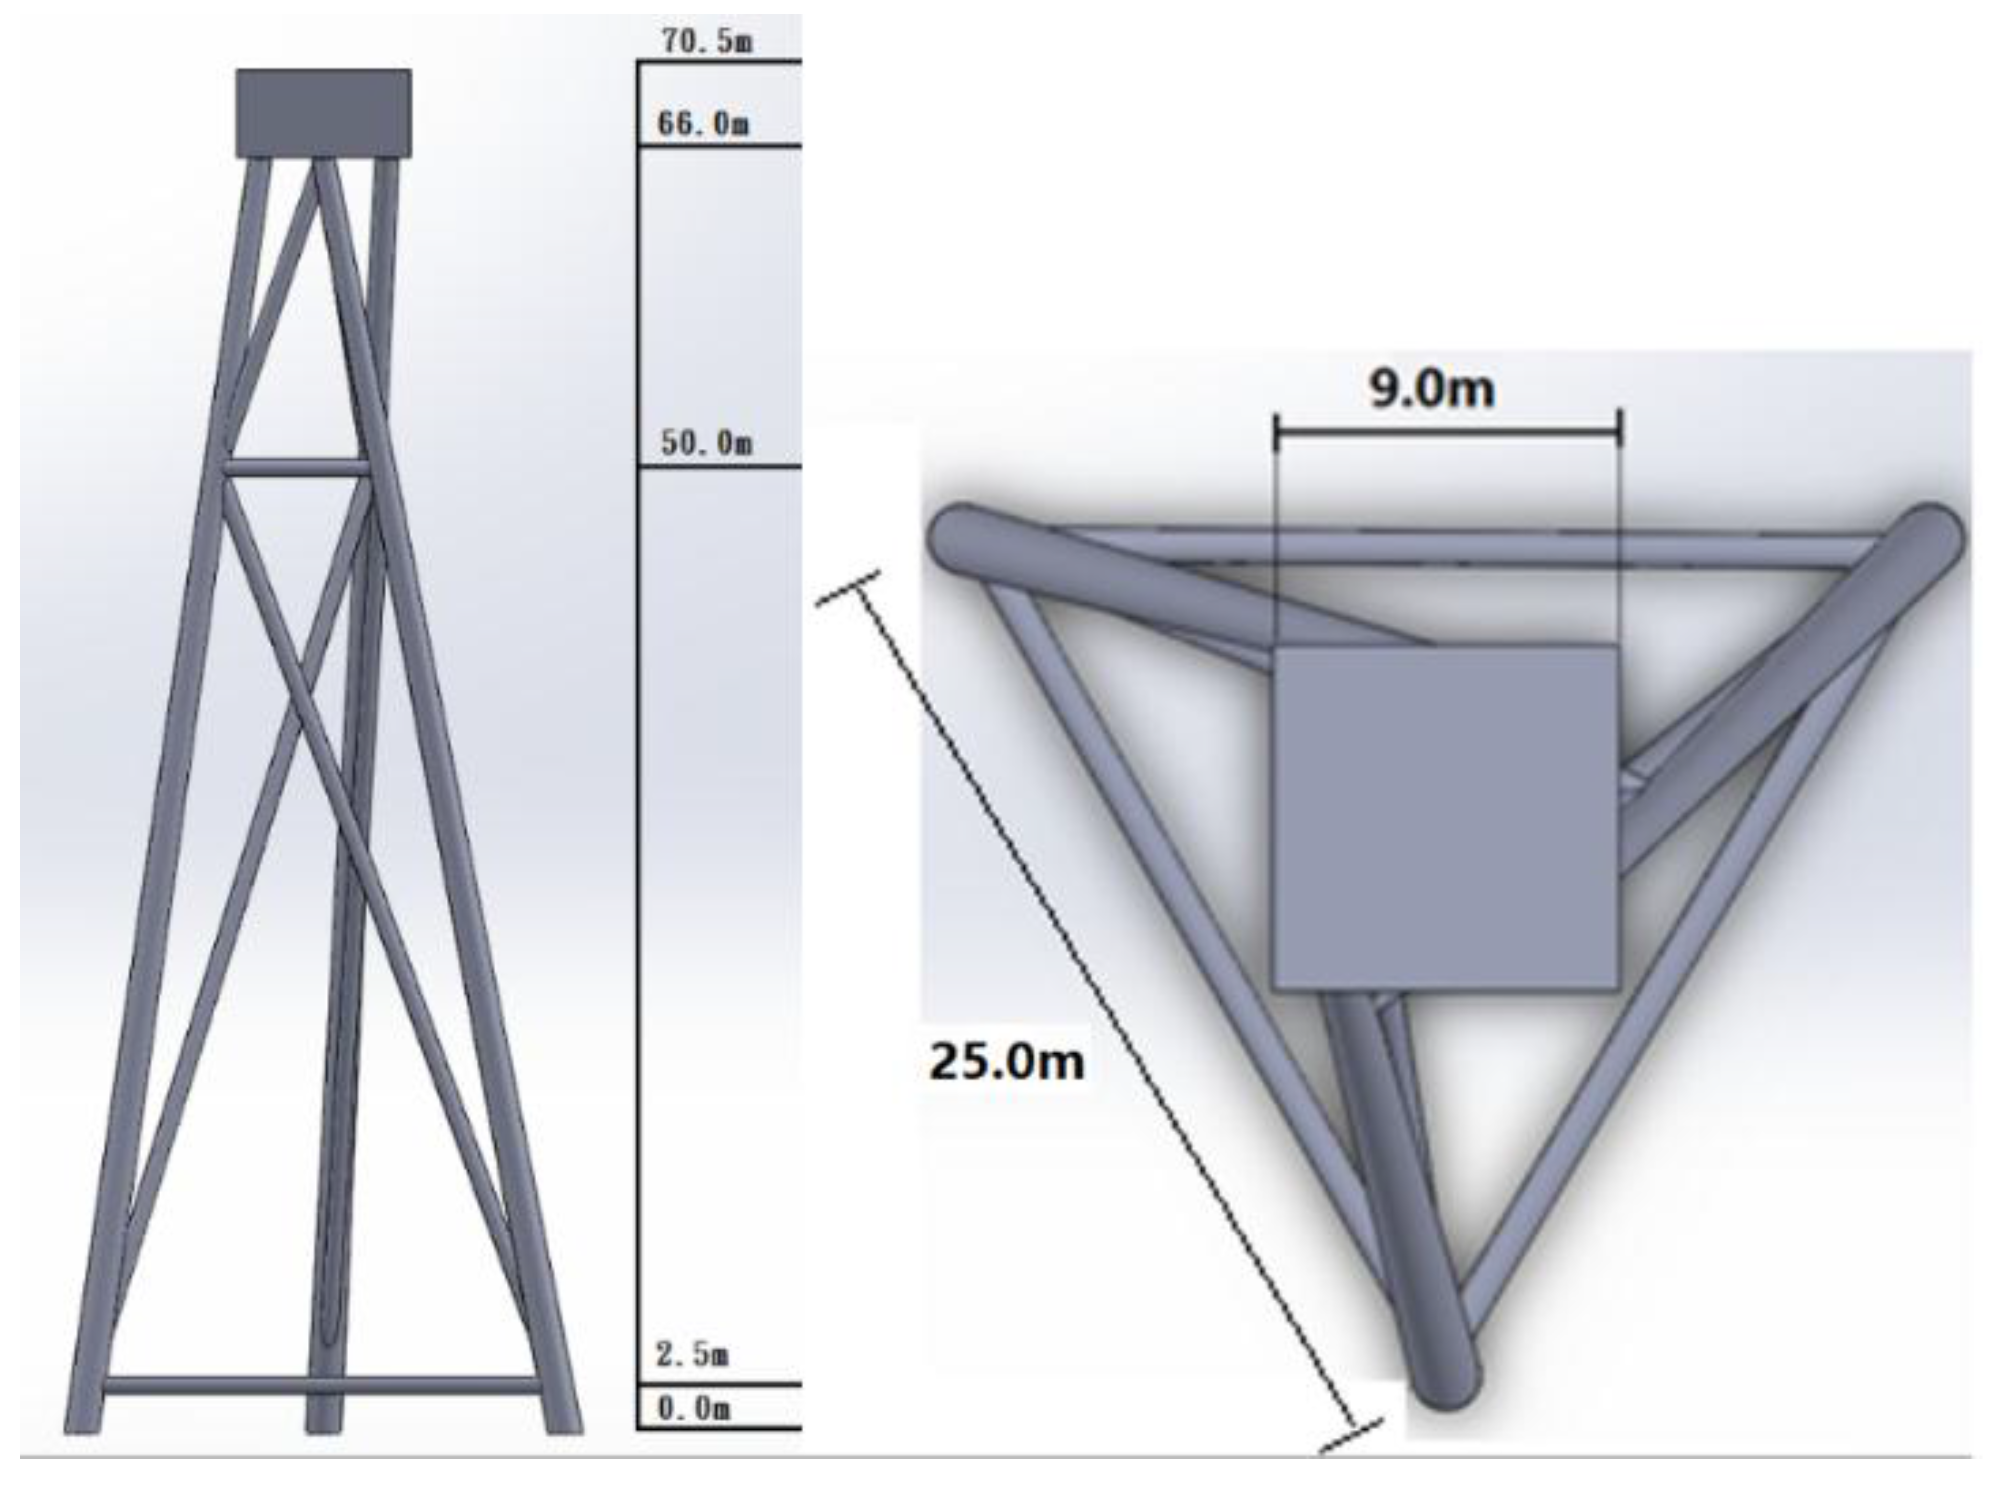
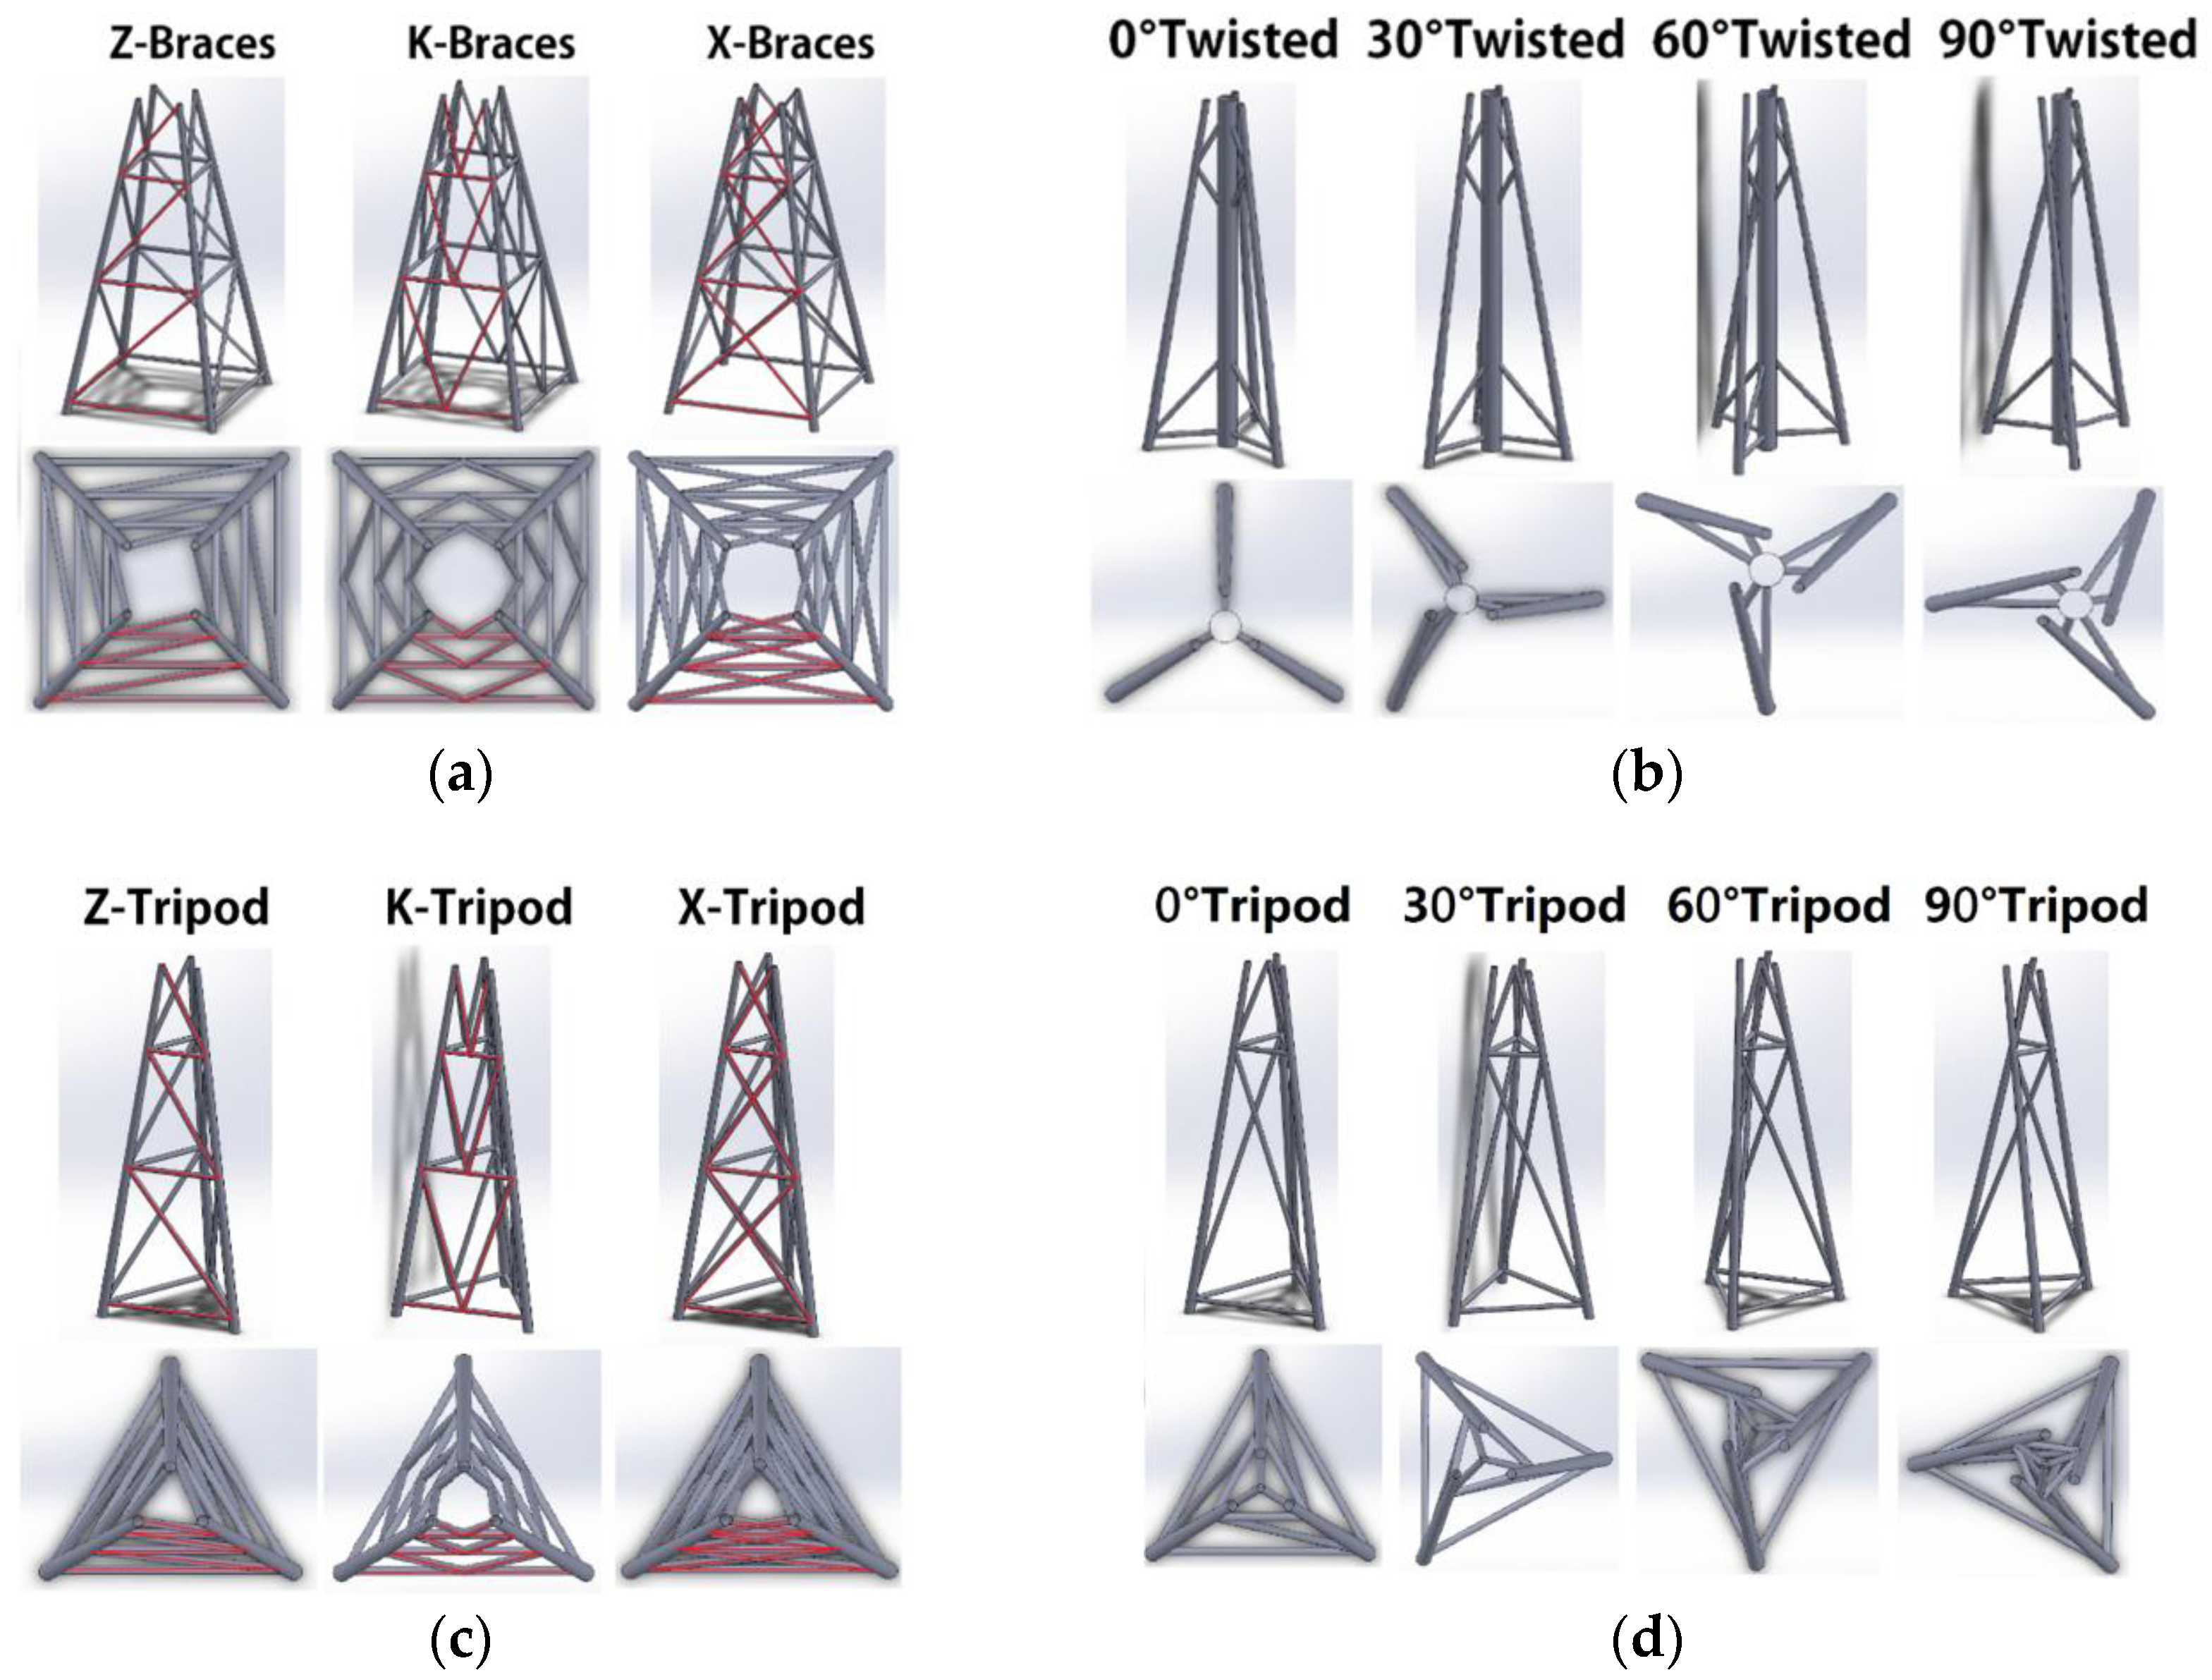
2.2. Dimensions of Jacket Substructures

This study considered 14 jacket substructures categorized into four groups for comparison. Each jacket structure was assumed 70.5 m in total height installed at a 50.0-m water depth.
First, three traditional jacket substructures (abbreviated as J-structures) were selected as reference structures: namely, X-braces (JX), K-braces (JK) and Z-braces (JZ) (Figure 1a). Second, recently-patented twisted jacket substructures (TJ-structures) were considered [23,24,25]. Detailed geometrical information, however, was not disclosed anywhere in the patents. Thus, the geometrical information of the TJ-structures assumed in this study should not reflect the real-world cases. Four TJ-structures were considered: namely, 0° twisted (TJ0), 30° twisted (TJ30), 60° twisted (TJ60) and 90° twisted (TJ90) (Figure 1b).
The study in [28] concluded that both three- and four-leg jacket substructures are suitable for deep water conditions. It also noted that the designed three-leg jacket is the most lightweight and cost efficient among the studied models. A similar conclusion was reached in a comparison study [29]. We thus considered the three-leg jacket substructures (termed tripod jacket structures in the present study, abbreviated PJ-structures) as the third type. Three PJ-structures were considered: namely Z-tripod (PJZ), K-tripod (PJK) and X-tripod (PJX) (Figure 1c). Last, with the advantages of both TJ-structures and PJ-structures taken into consideration (e.g., few structural members, few welded connections, low cost, etc.), a number of twisted tripod jacket structures (or modified jacket structures, abbreviated as MJ-structures) were designed. Similar to the TJ-structures, the MJ-structures were designed with four different twisted angles of the three main structural legs: namely 0° tripod (MJ0), 30° tripod (MJ30), 60° tripod (MJ60) and 90° tripod (MJ90) (Figure 1d). It is noted that the designed MJ-structures are not optimal. Detailed final geometrical information is directed to Appendix A in this paper.

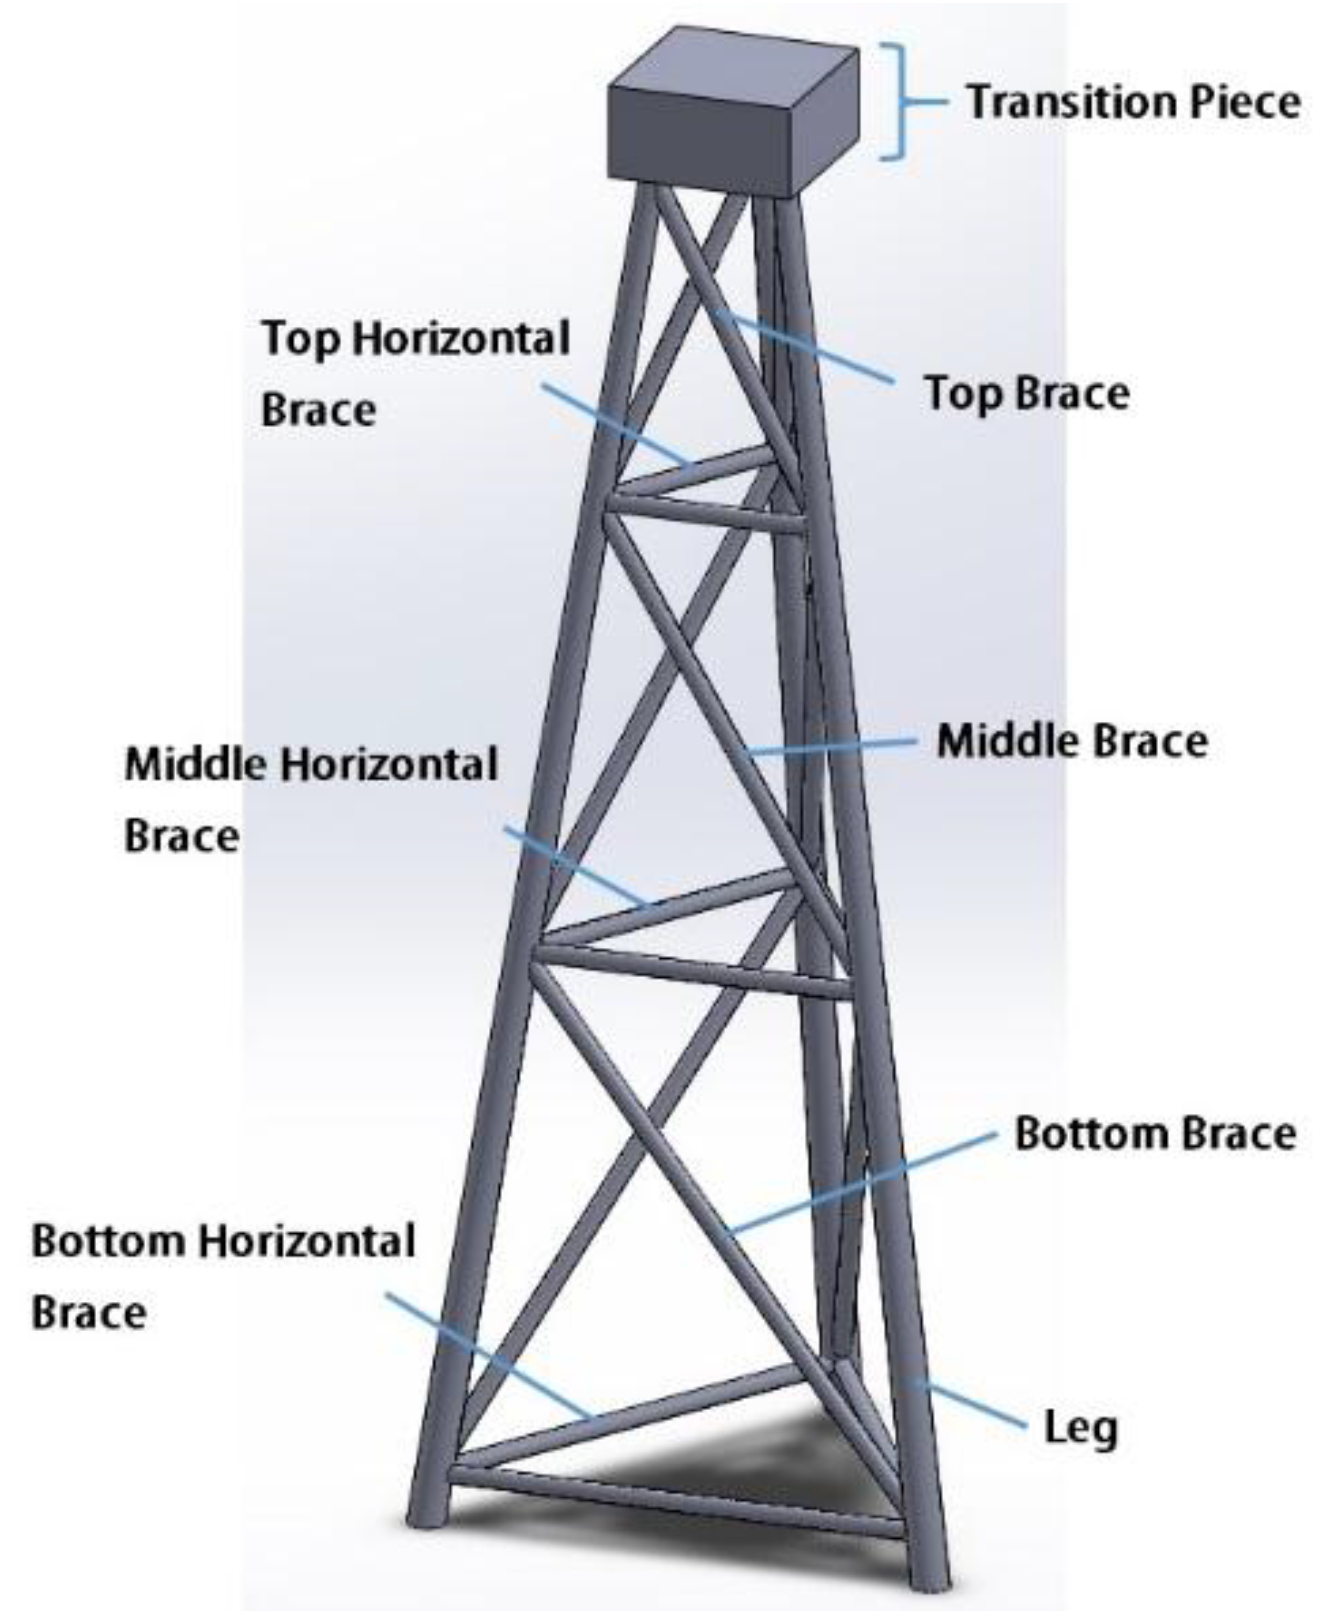
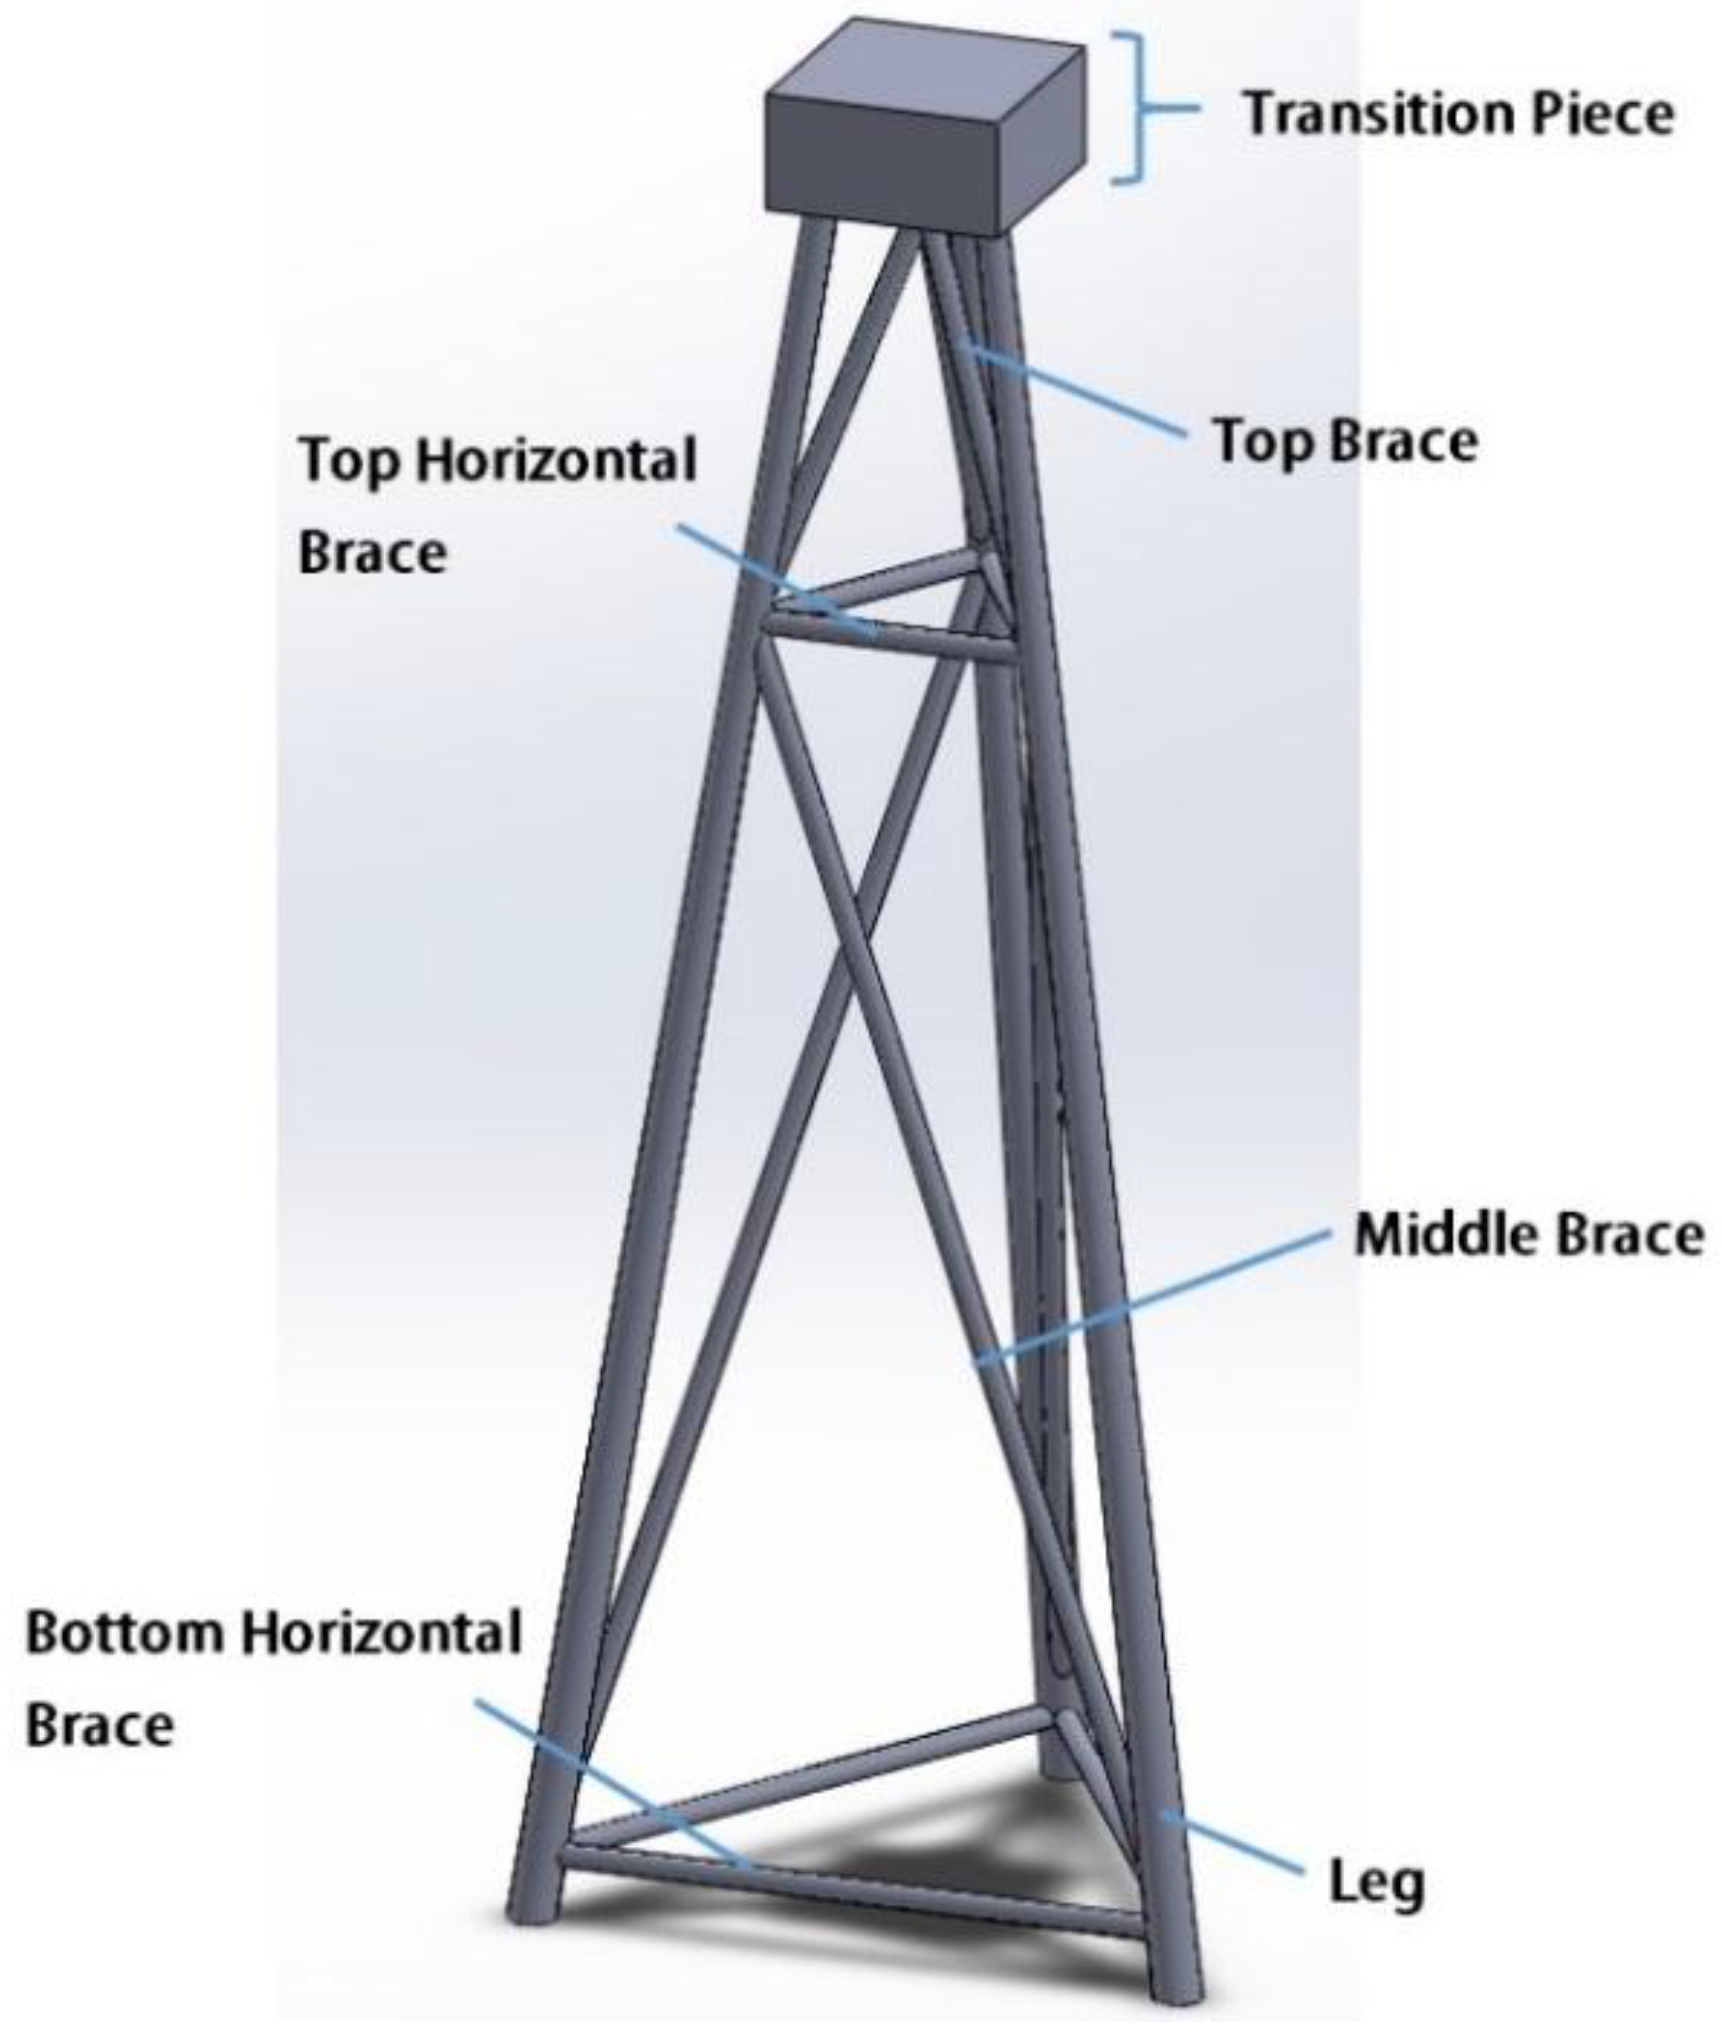
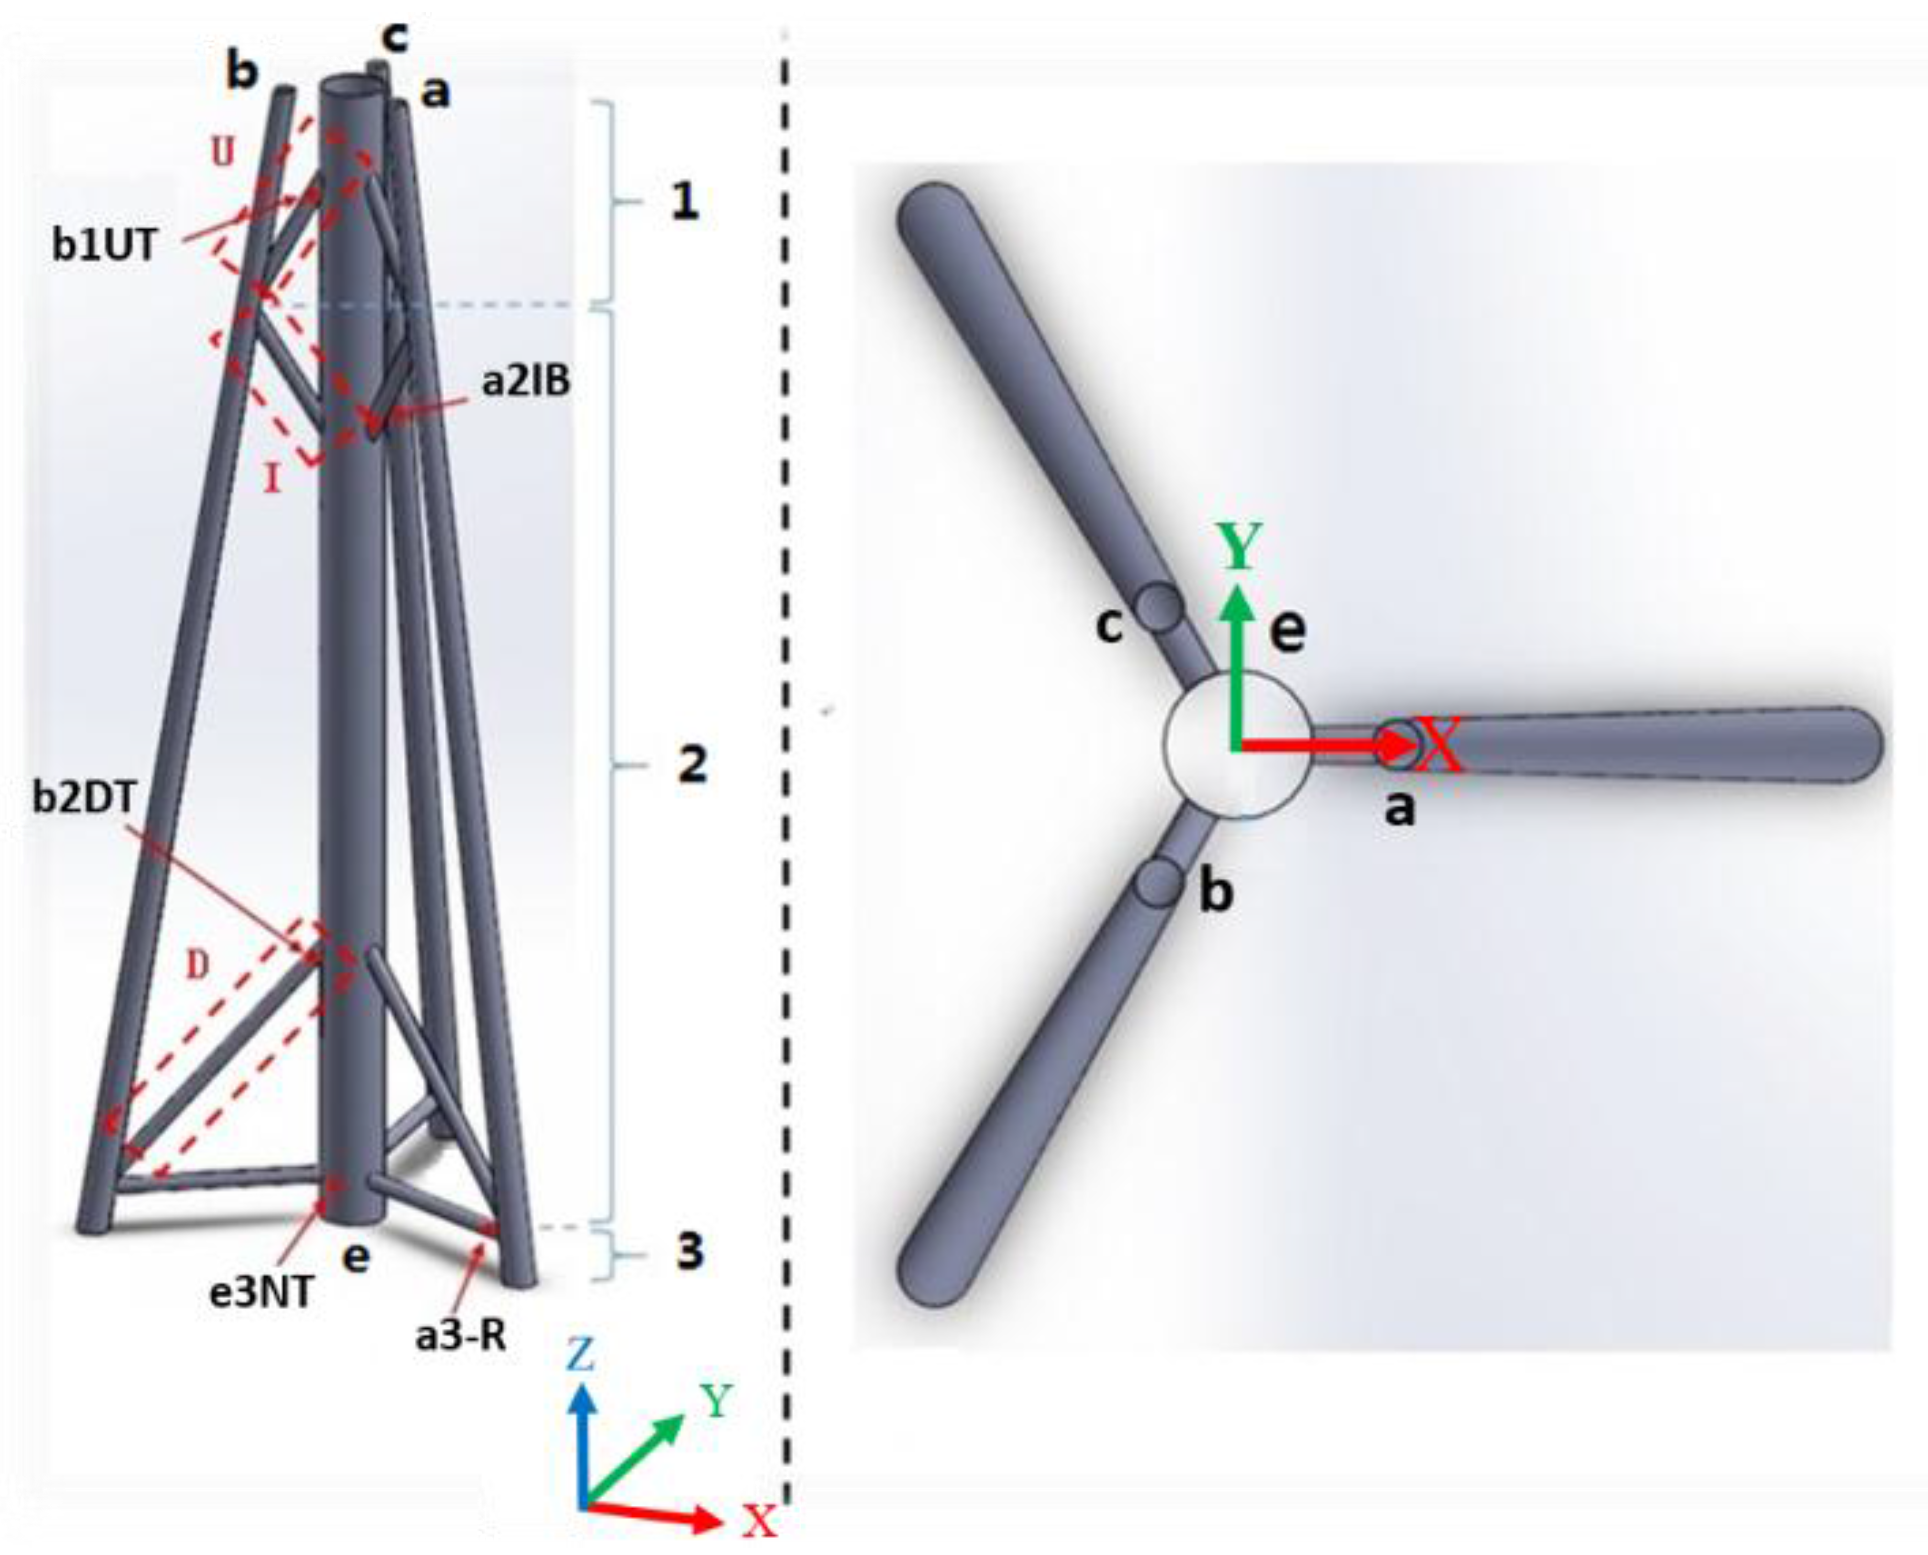
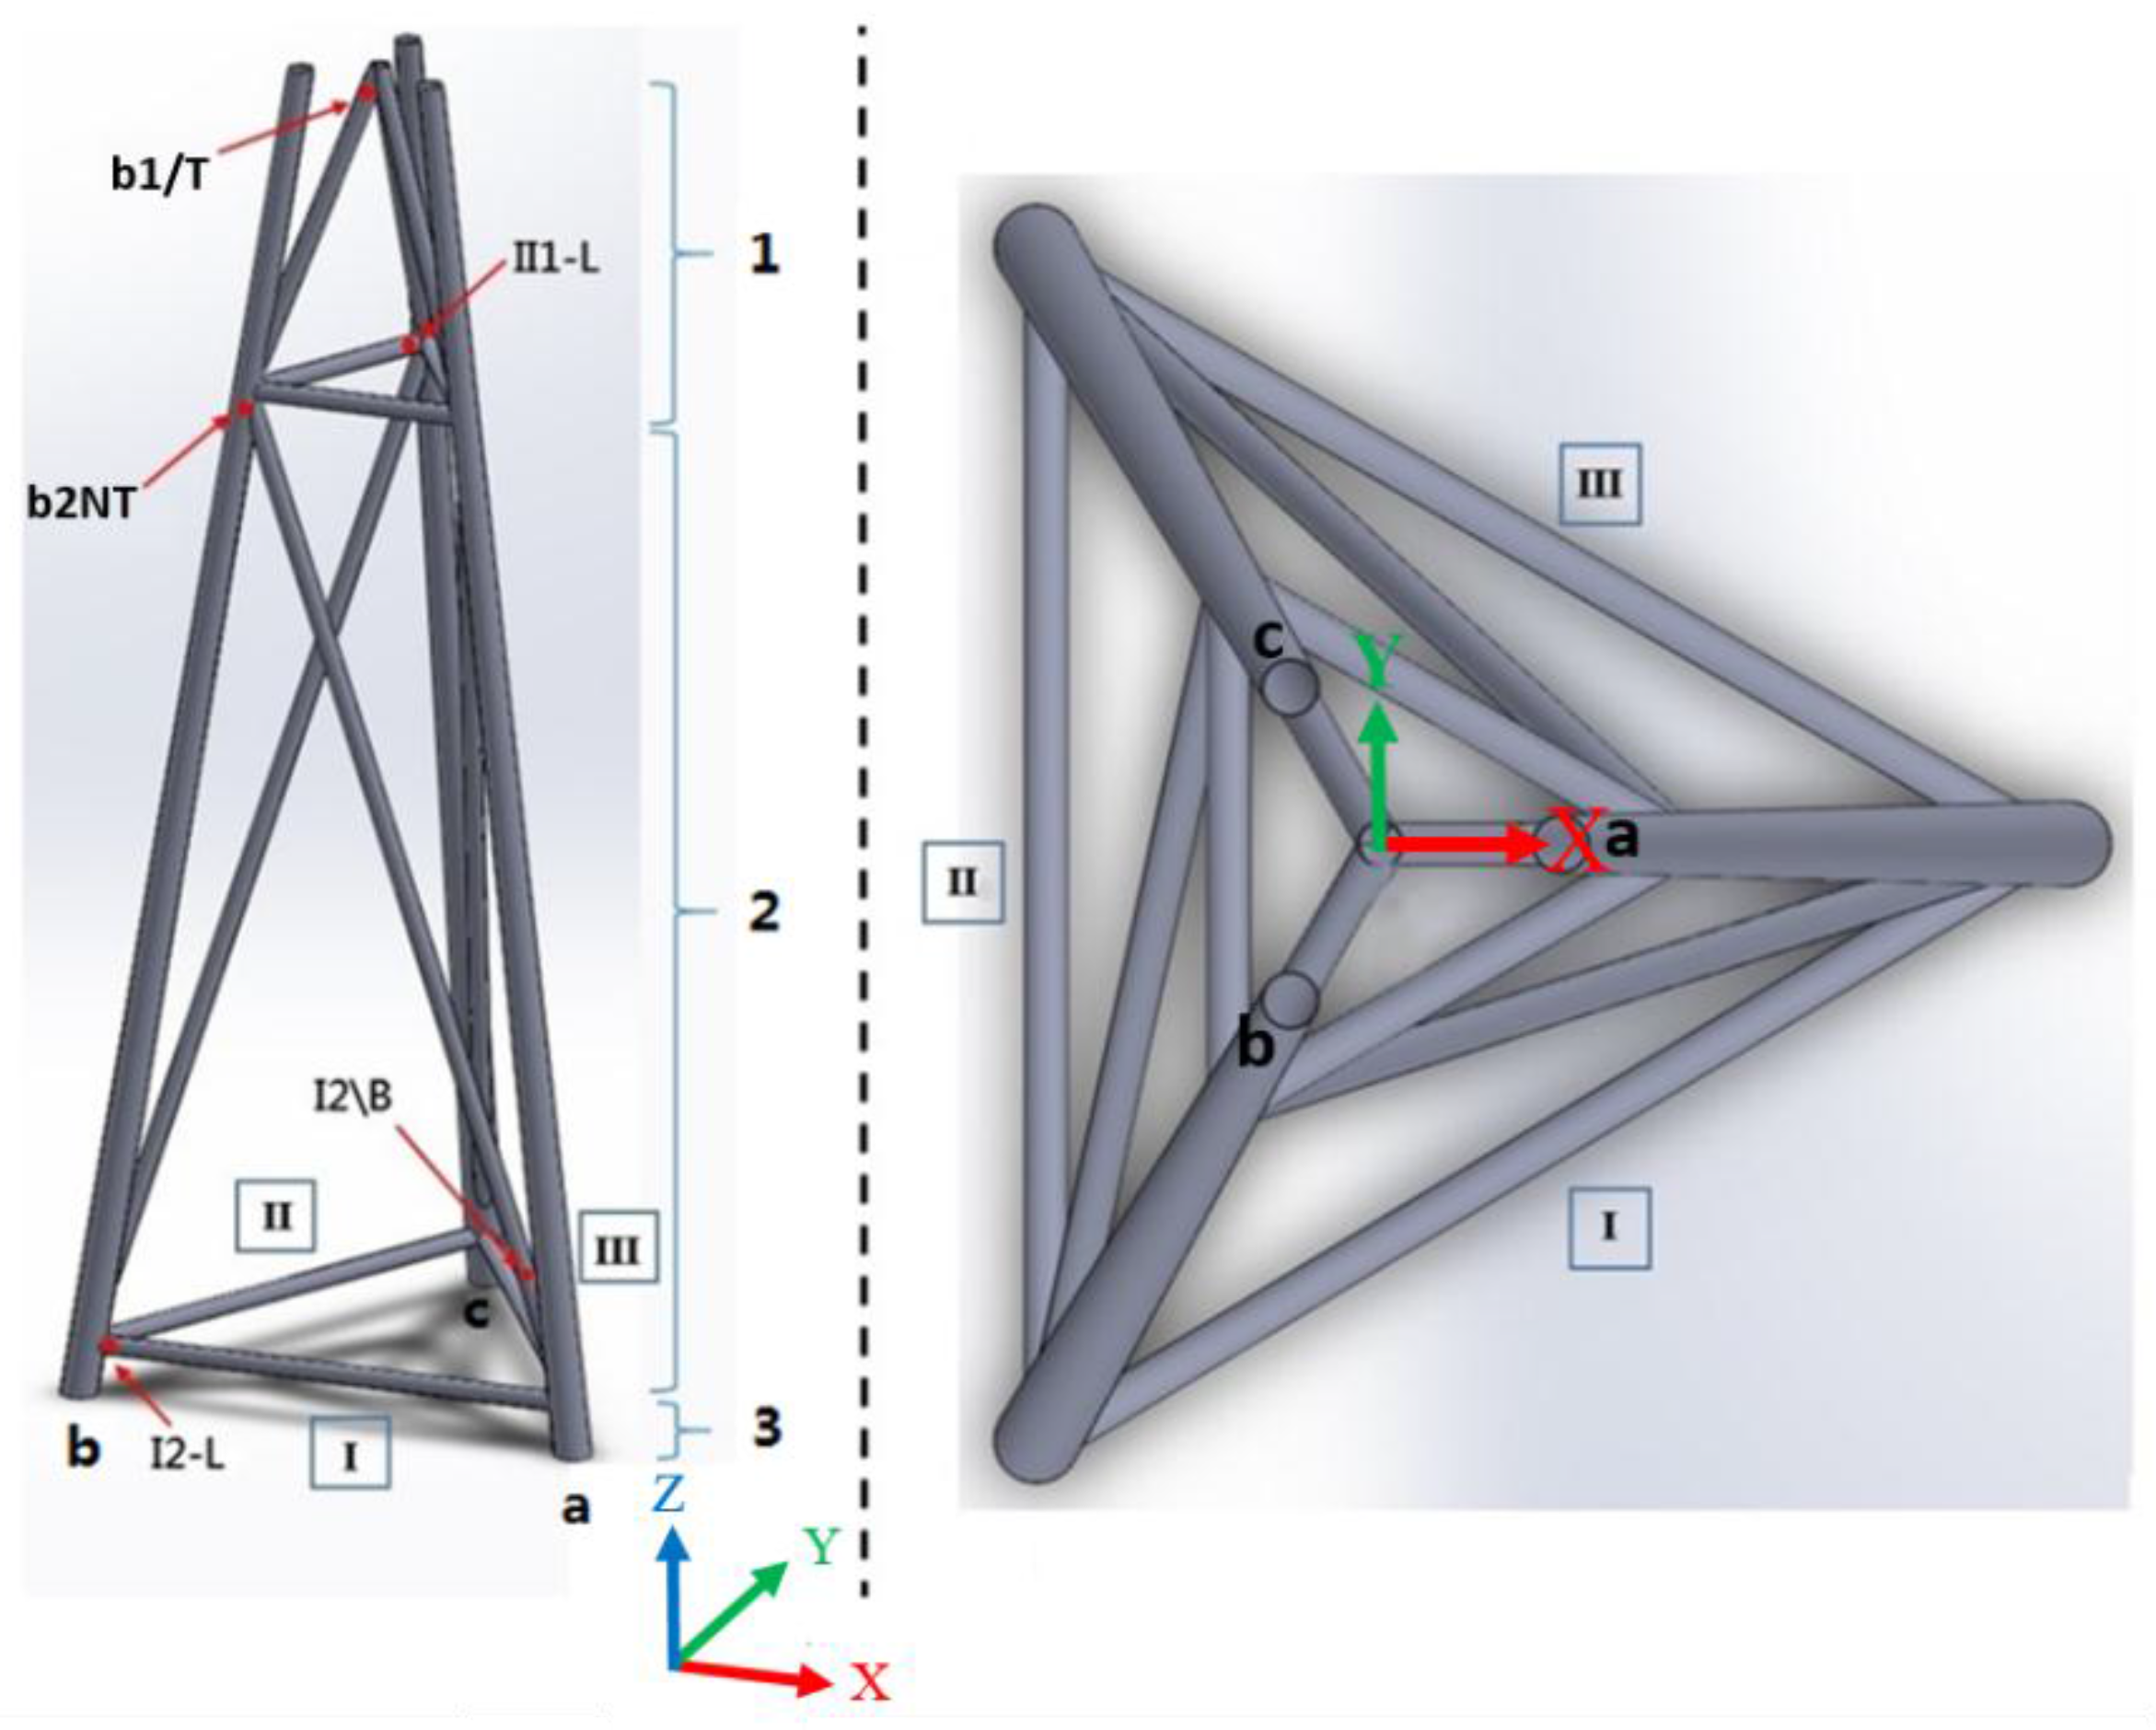
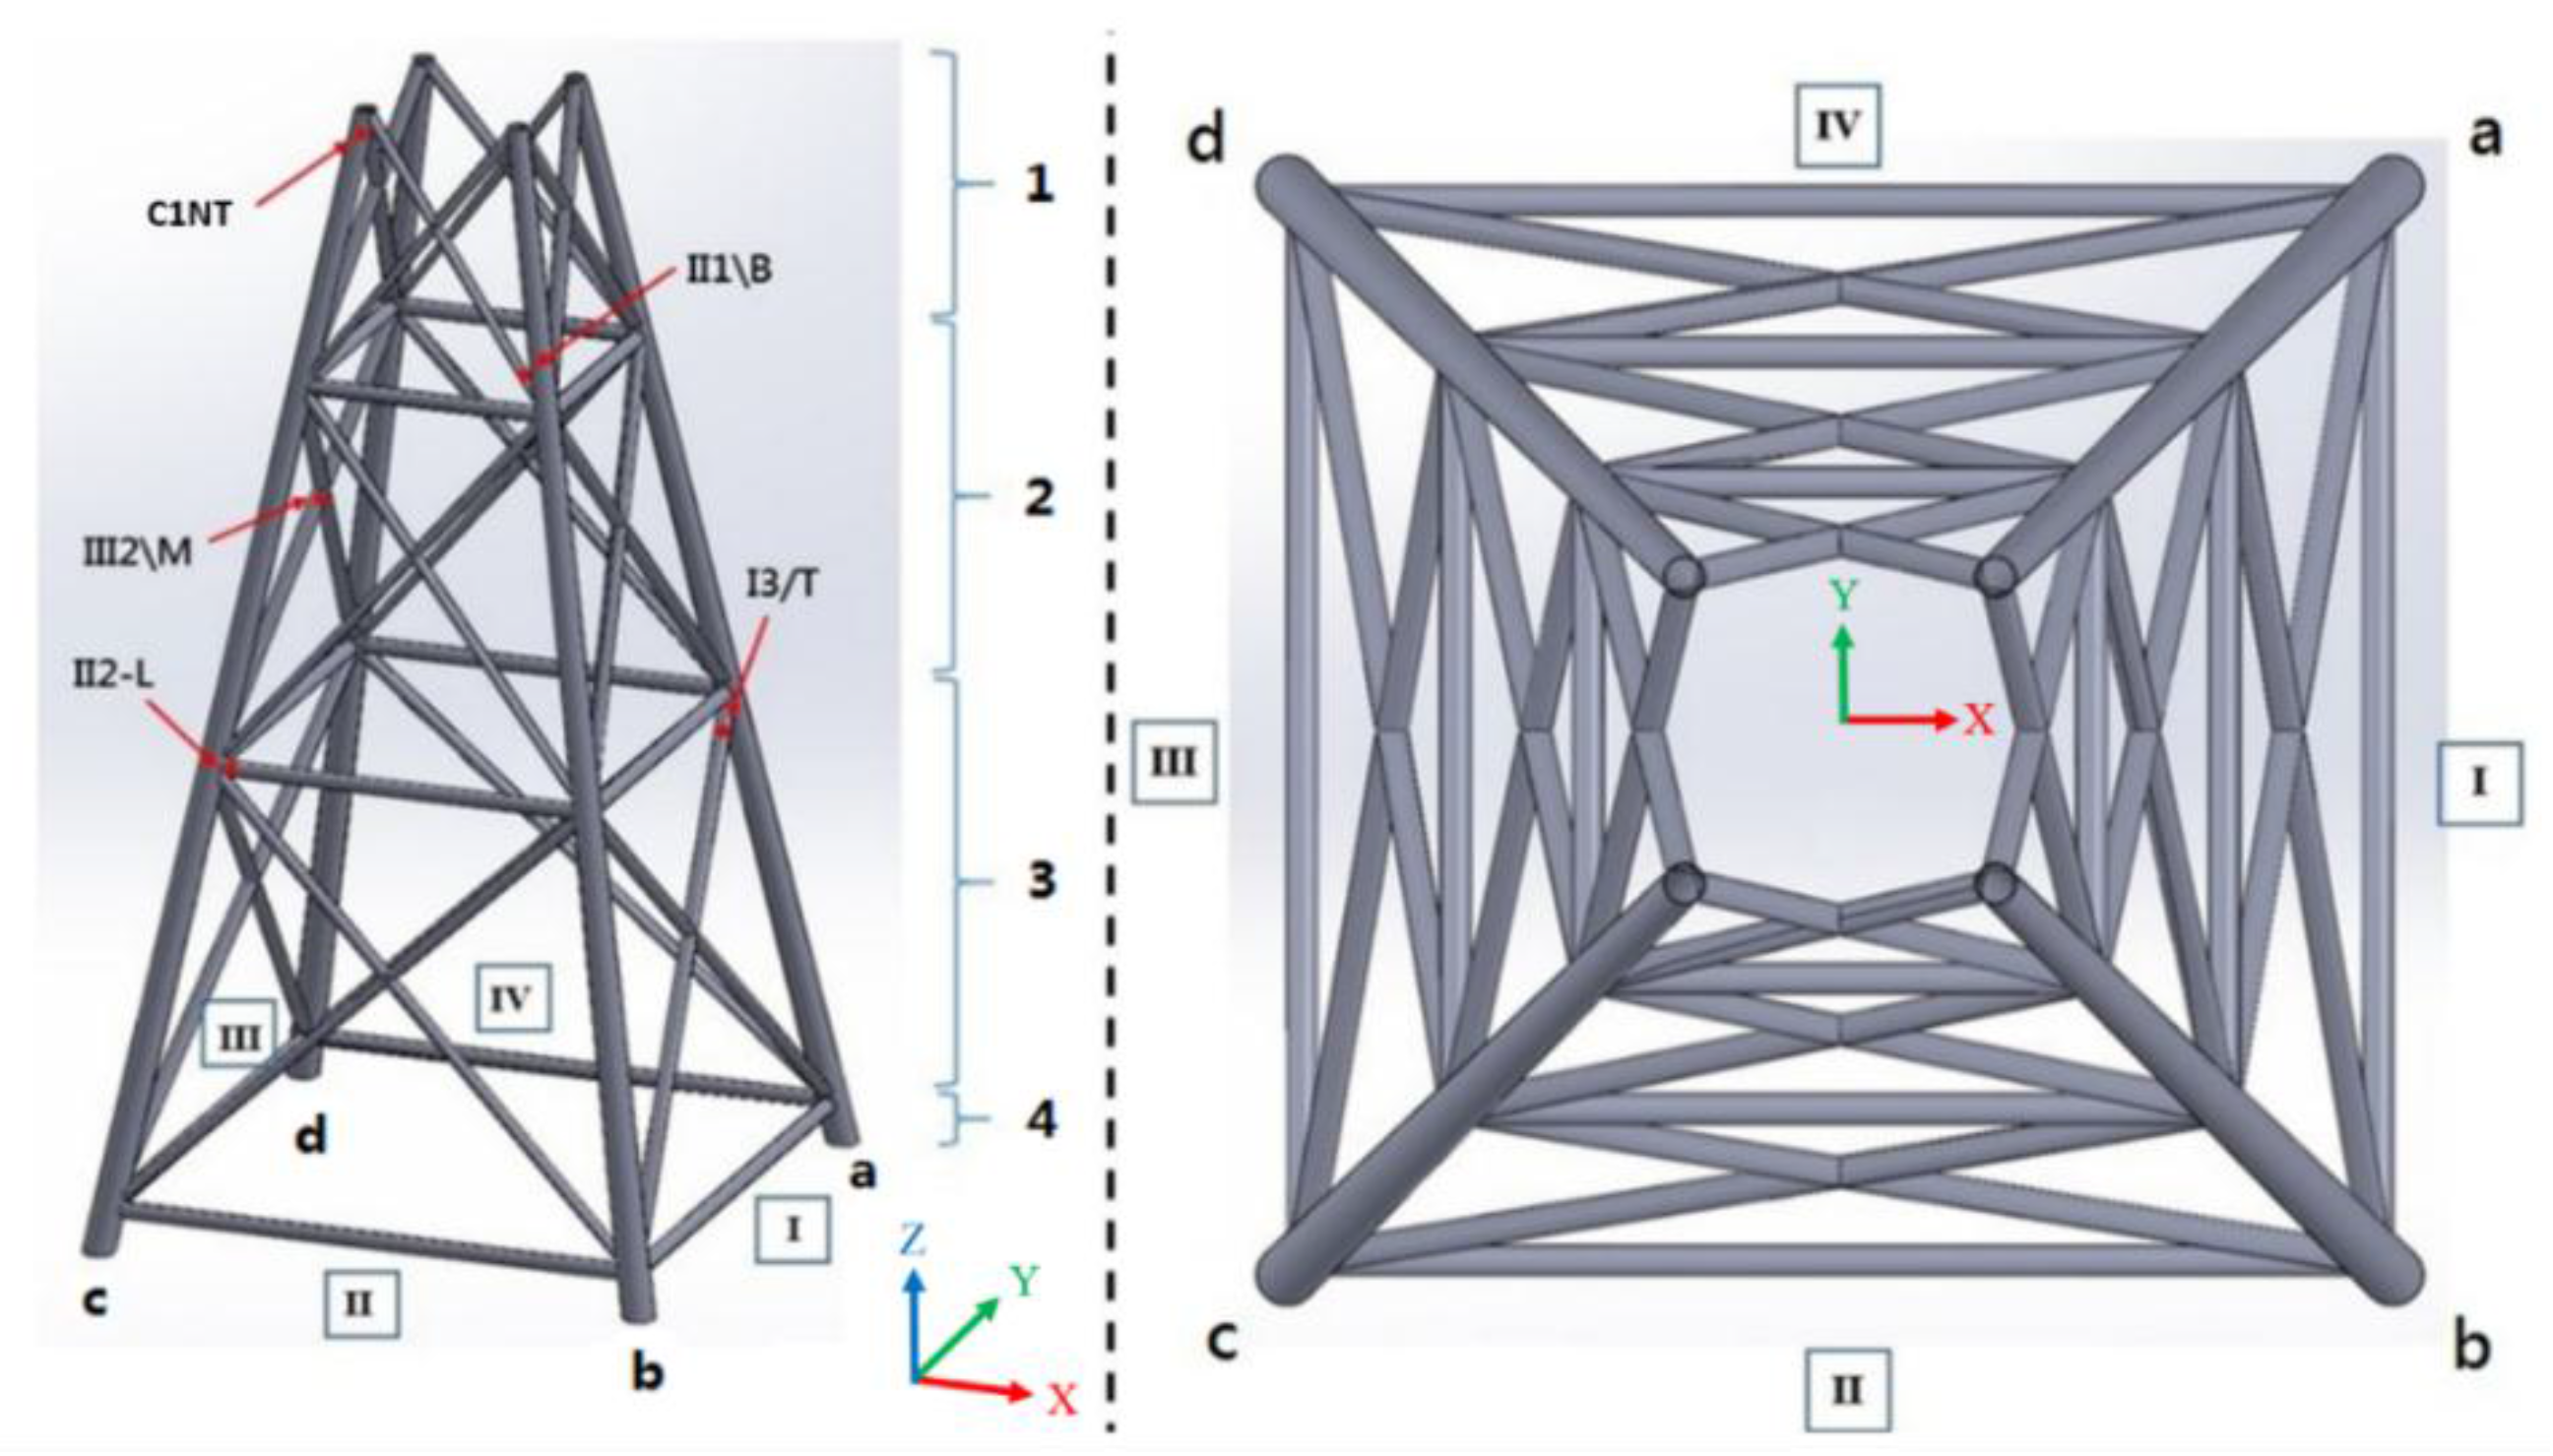
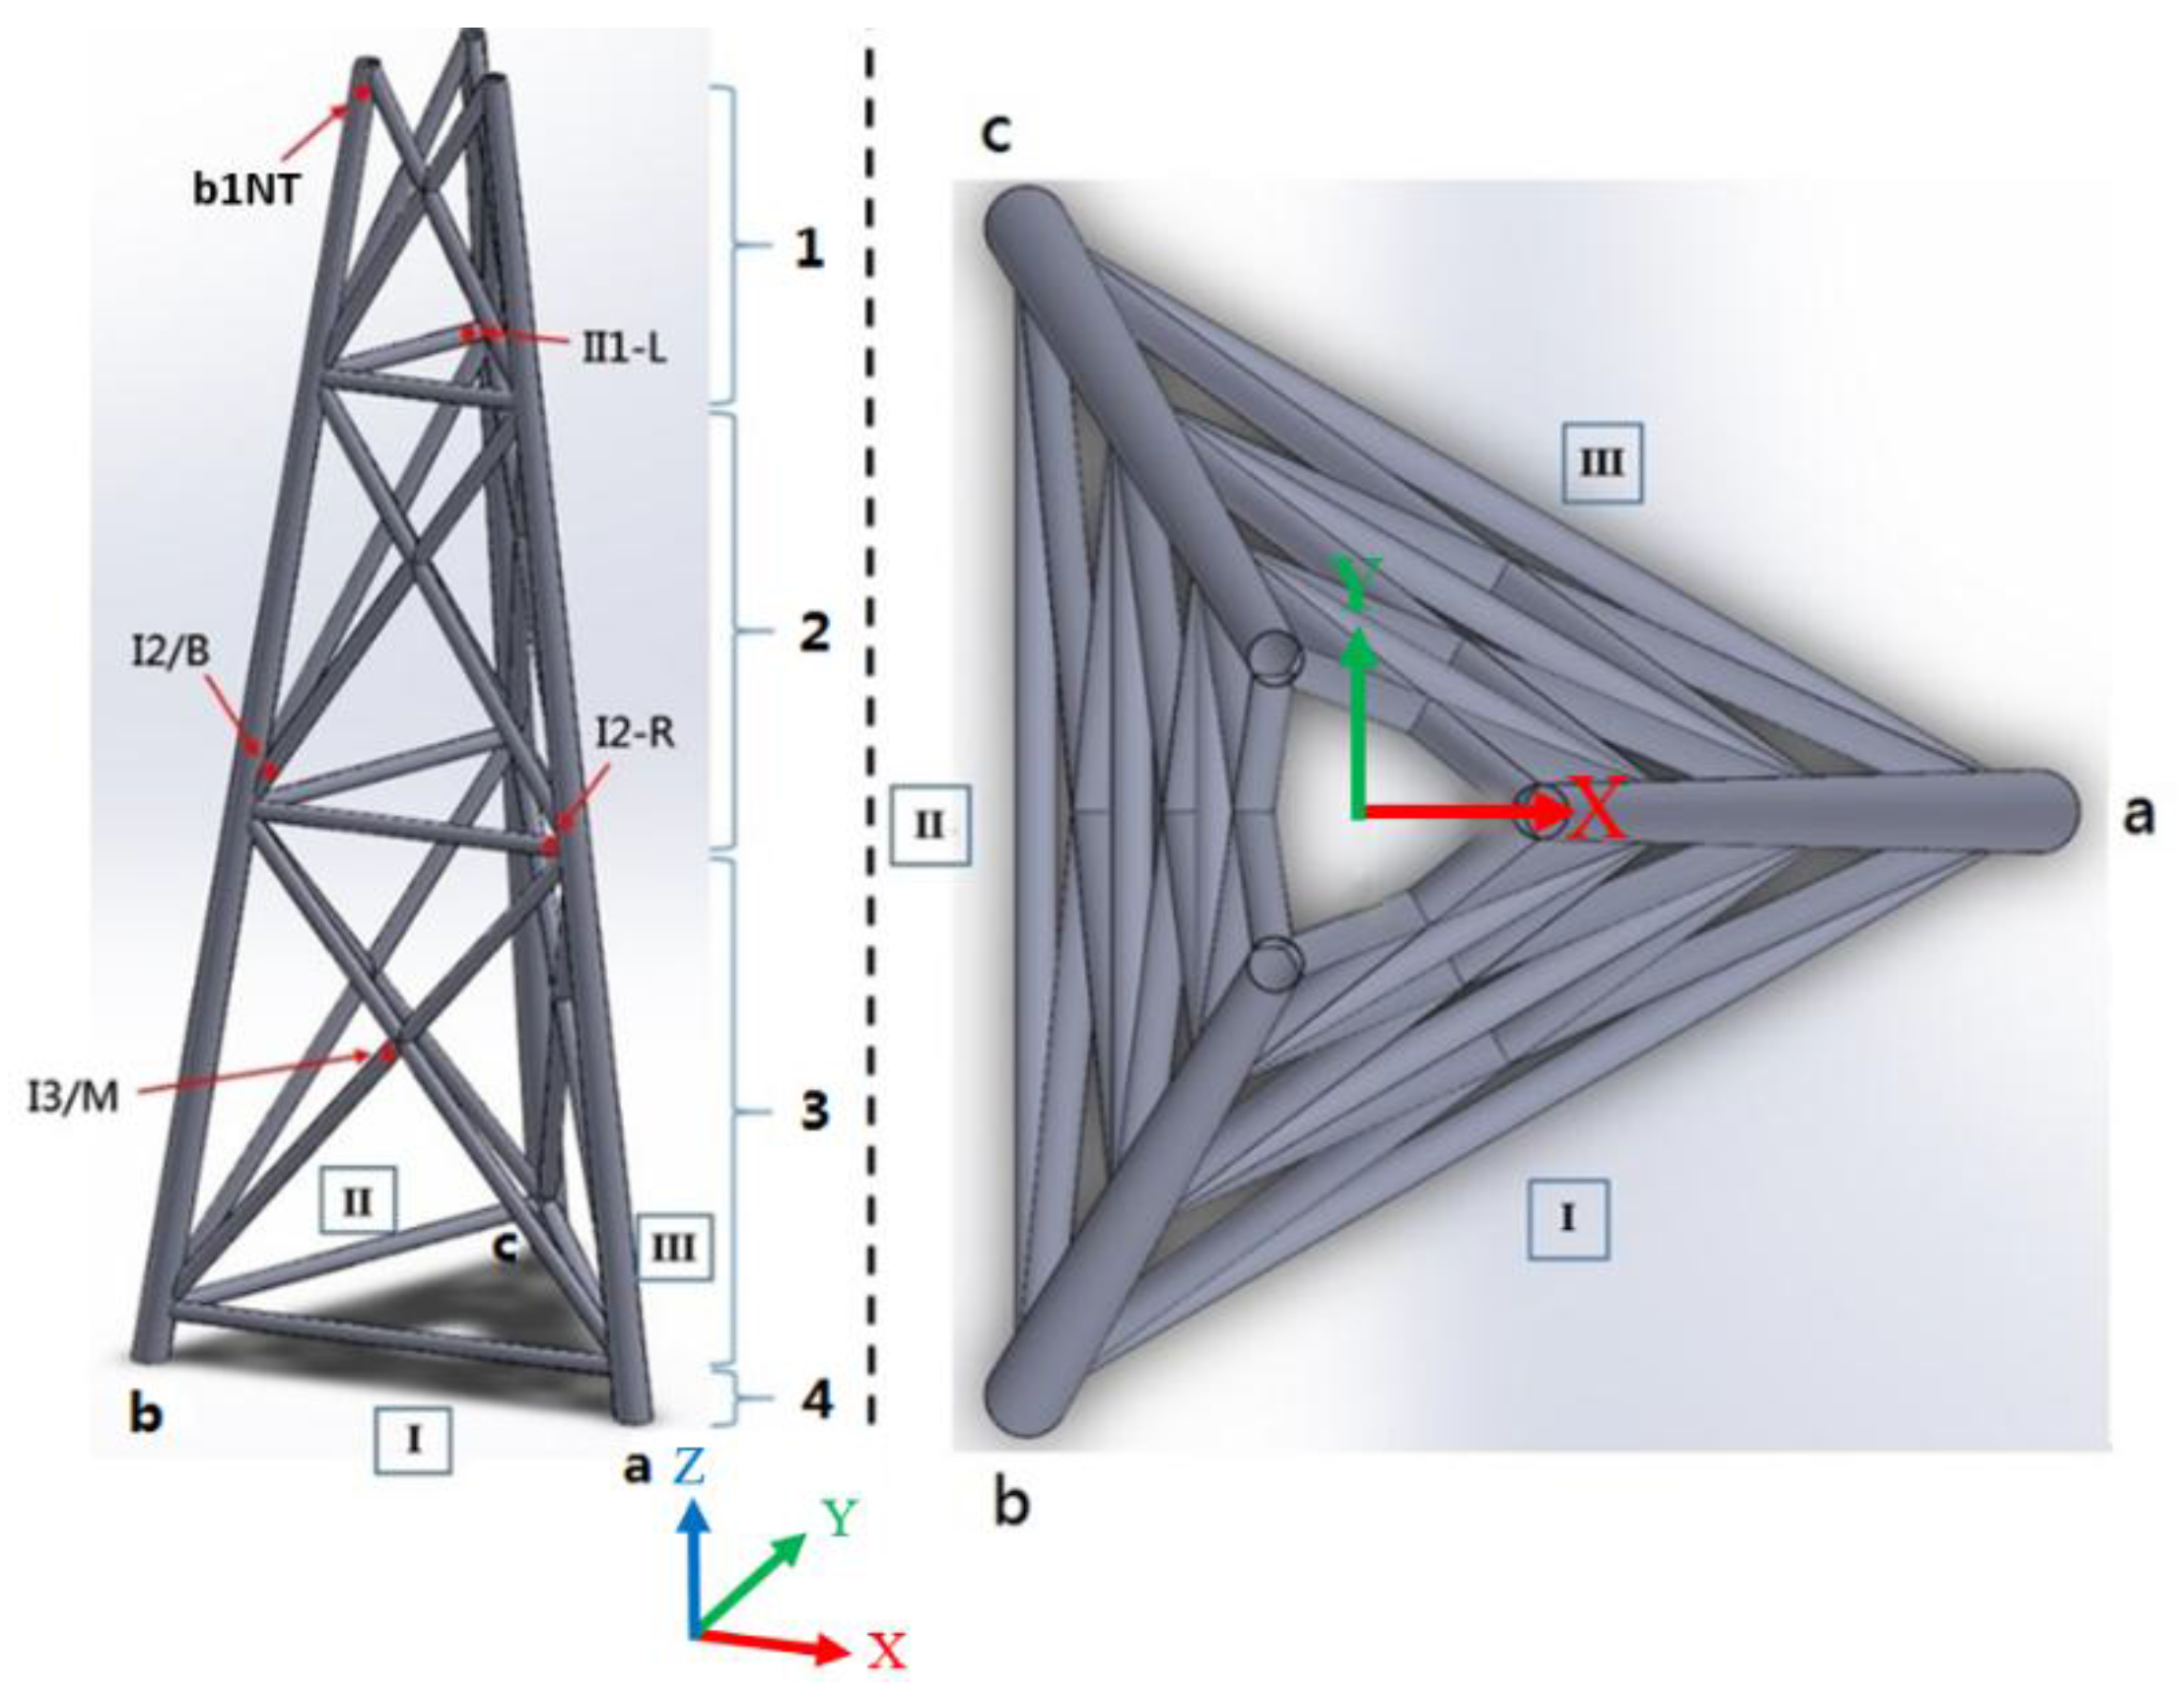
2.3. Terms and Definitions of Abbreviations for Jacket Members and Parts

This section lists the abbreviations that will be used hereafter in the study for convenience (Table 1). Abbreviations are defined at four levels: (1) α , (2) β , (3) γ and (4) δ . Members and parts are termed in the order of α β γ , and the part (location) of the members are termed α β γ δ . The definitions and examples of the terminology for jacket structural members and parts is directed to Appendix B in this paper.

3. Methods of Analysis

3.1. Basic Properties

Commercial finite element software packages, including Abaqus/CAE and Abaqus/Standard, were used for stress and postbuckling analysis. All structures were assumed to be made of structural steel A36, where in the simulations, the density, Young’s modulus, Poisson’s ratio and yield stress were set to 7800 kg/m3, 200 GPa, 0.3 and 250 MPa, respectively. Material was assumed linear elastic for all analyses, except for global buckling analysis. The beam element method was employed for stress analysis and local buckling strength check. The modified Riks method with solid and shell elements was employed for unstable collapse and postbuckling analysis. In all analyses, the interaction between soil and structure was neglected, and thus, the structures were assumed fixed in all six degrees of freedom at the bottom.

3.2. Static Stress Analysis

The readers should be aware that the analysis of the present study was limited to static methods. Dynamic analyses, including modal analysis and time-domain analysis, as well as fatigue analysis, are important and require additional comprehensive investigation in the future. The beam element type, B31 (2-node linear beam in space), in Abaqus was selected for stress analysis. The maximum mesh size of all jackets was 3 m, such that the element numbers meshed for all jackets range from 151 to 432.

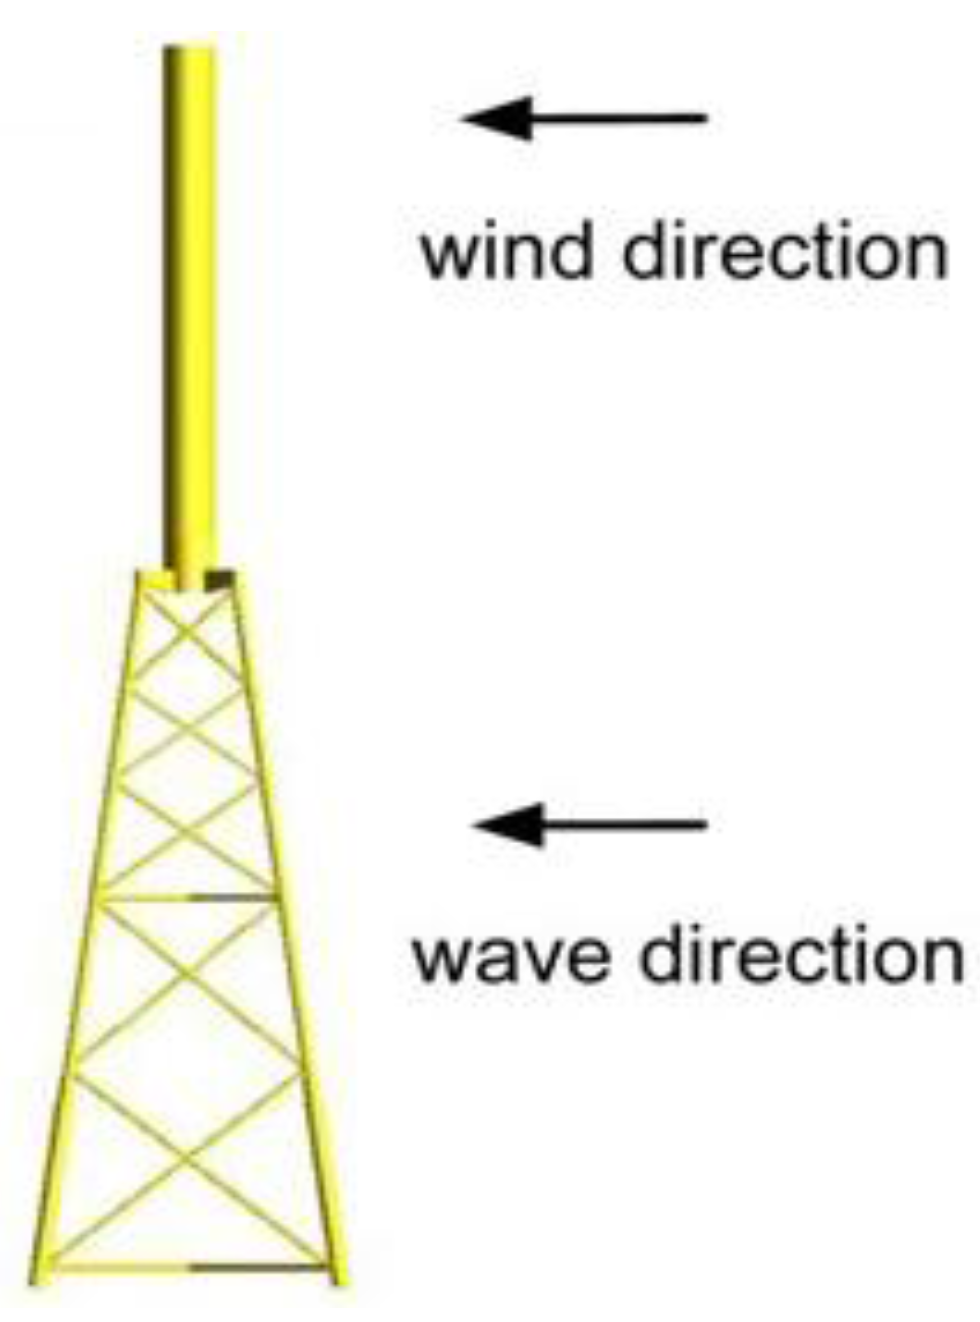
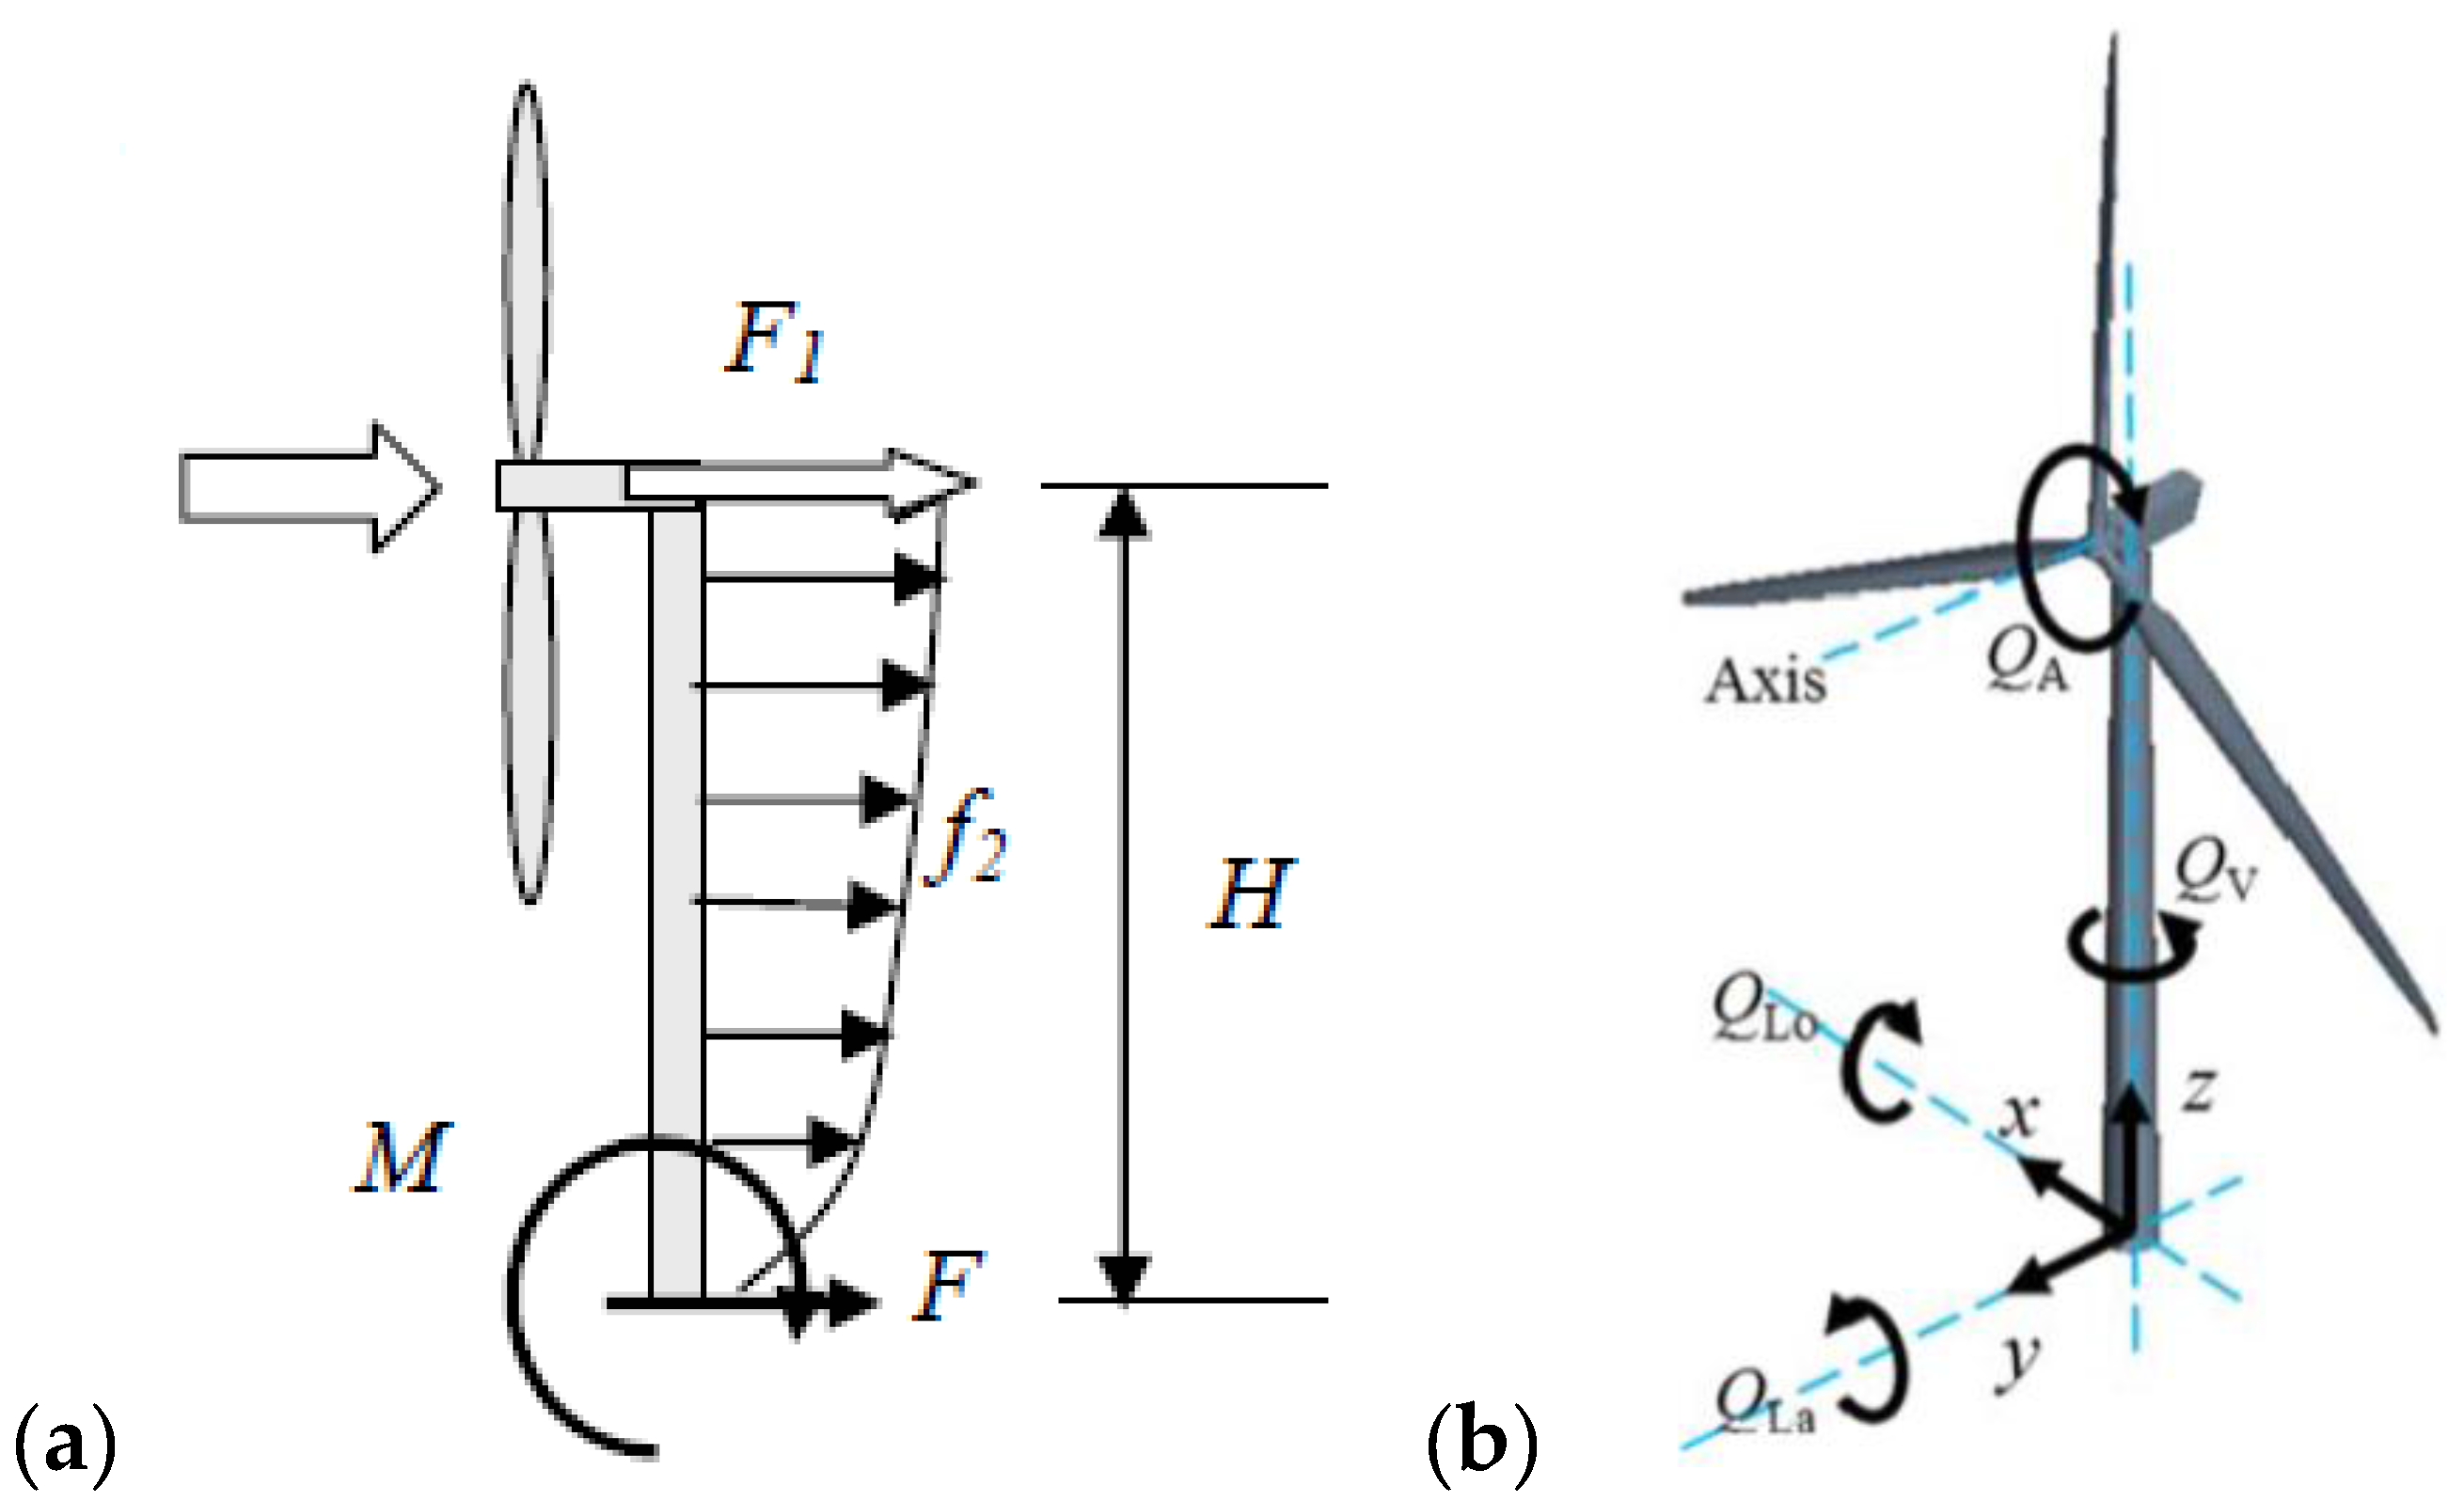
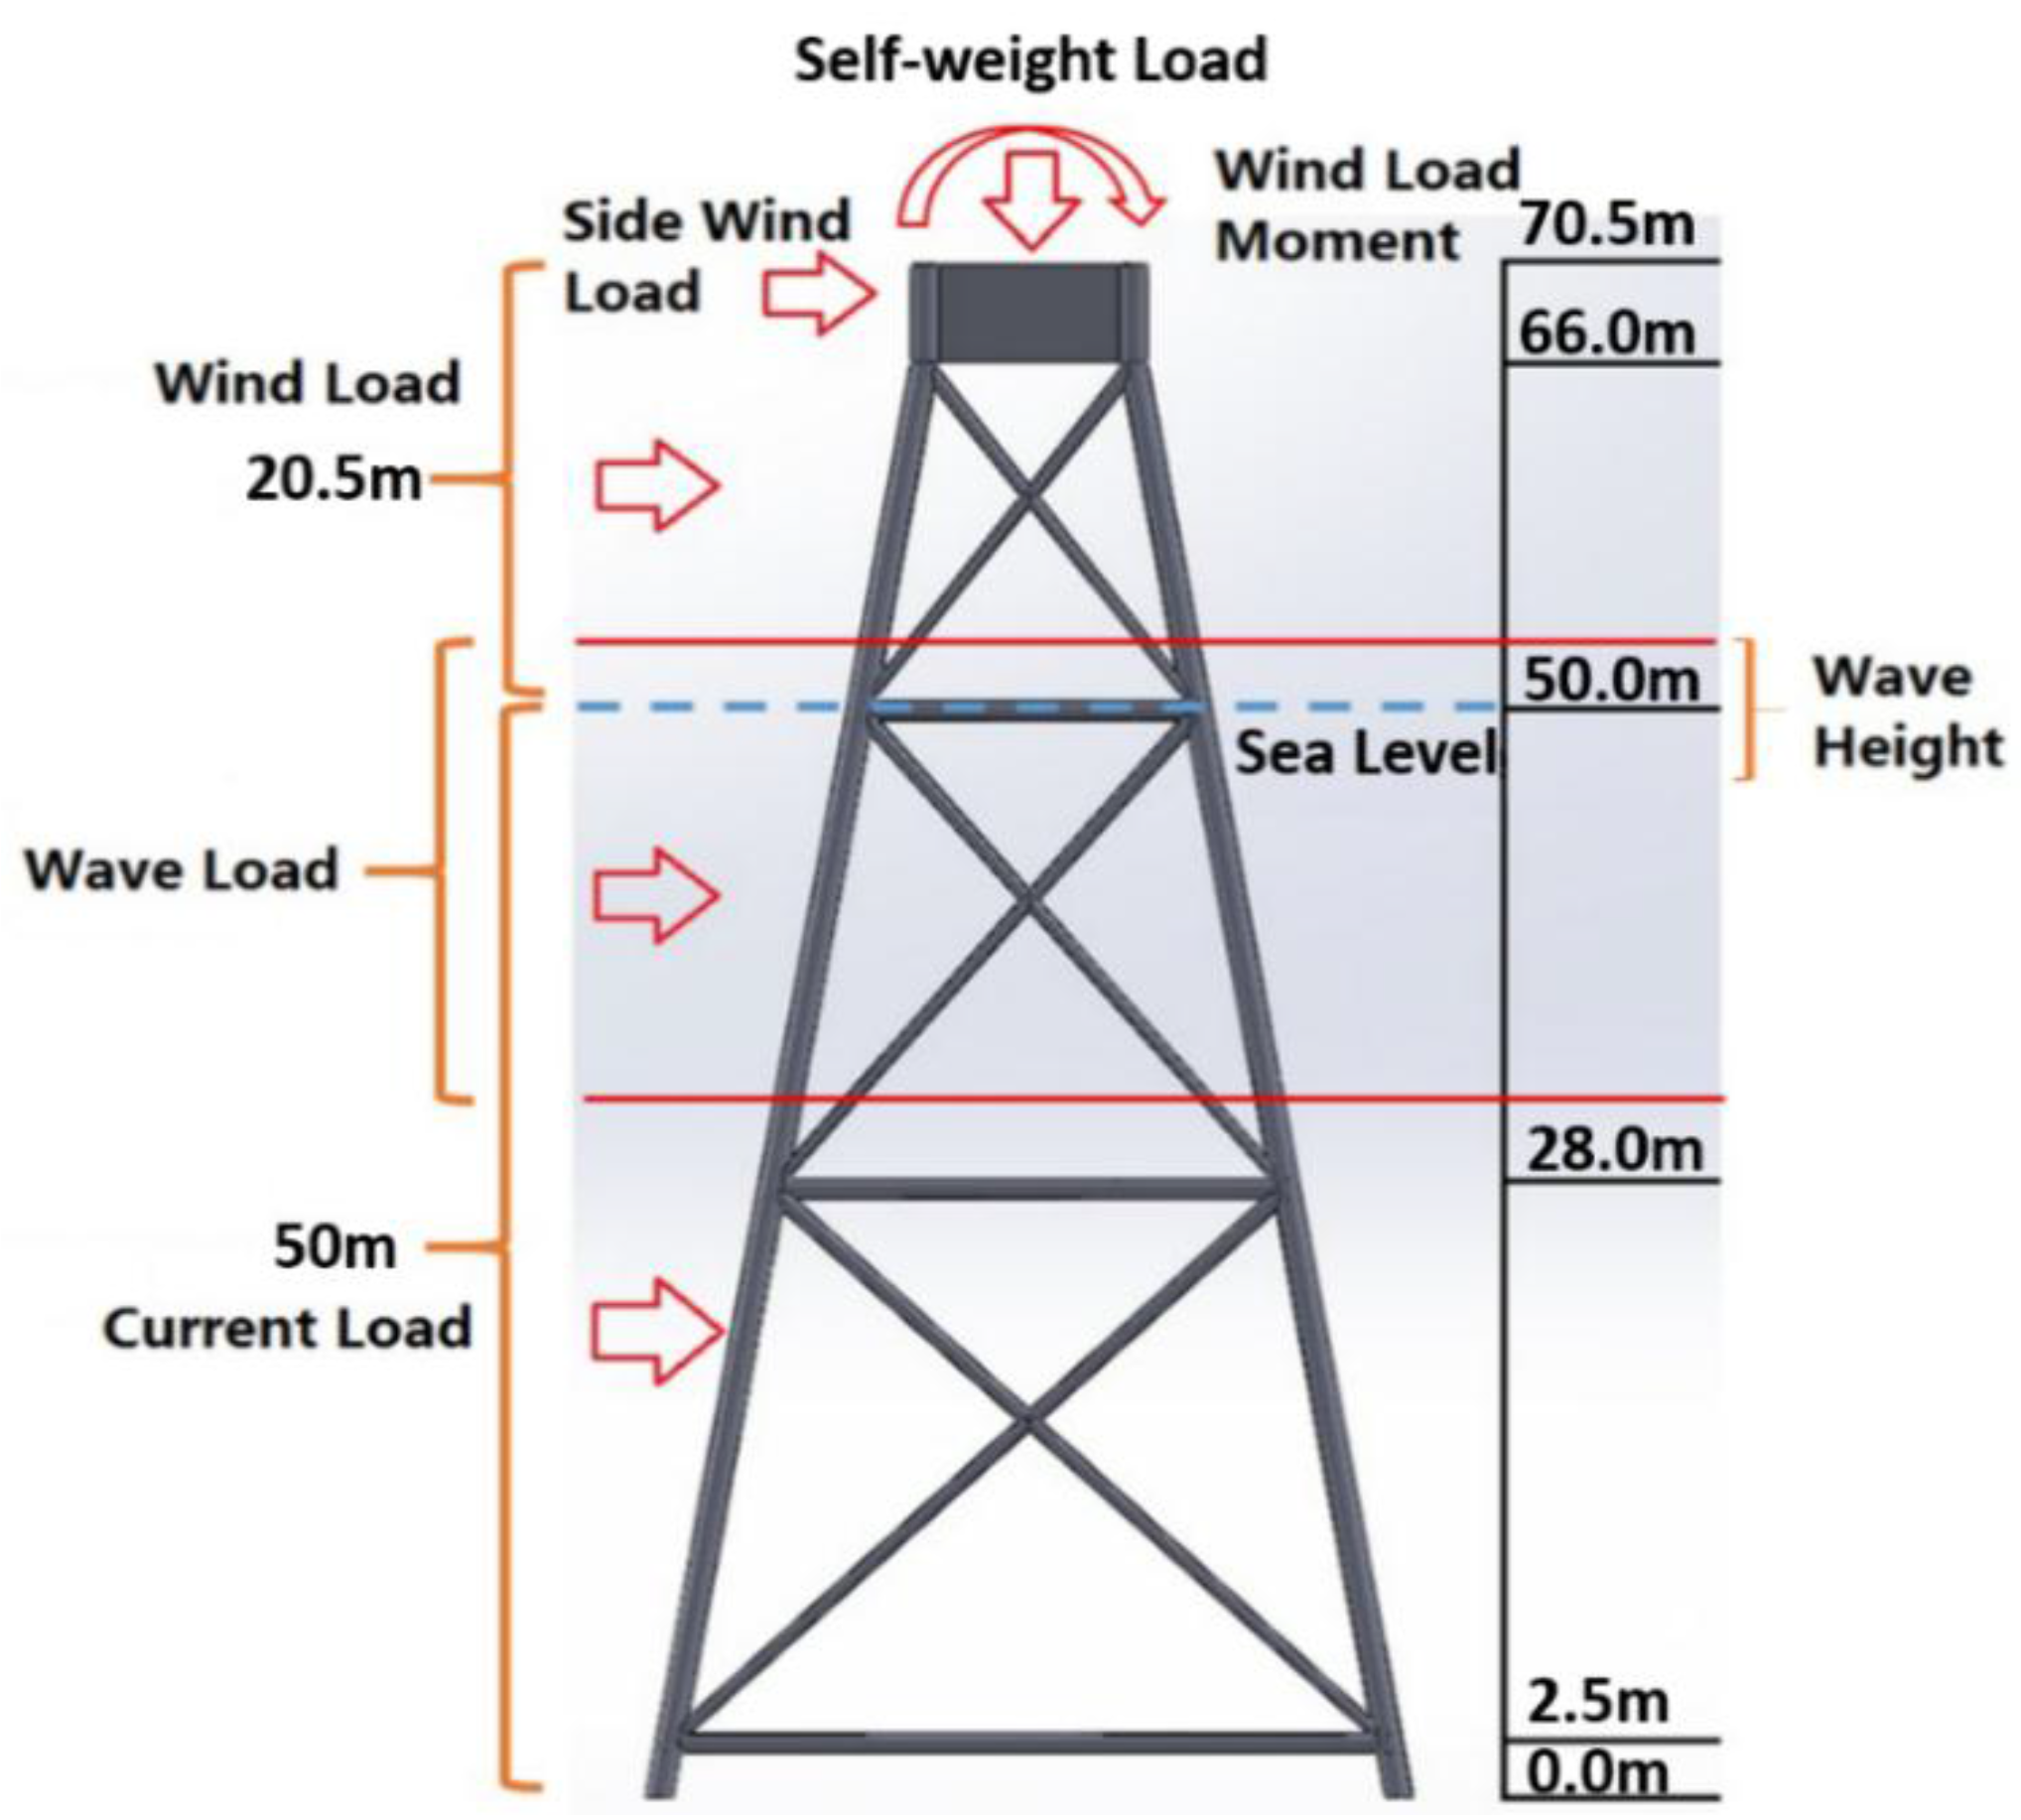
3.2.1. Load Settings

In general, loads that should be considered for design include permanent, variable, environmental, accidental, etc. [30,31]. The overall load combination applied on the whole offshore wind turbine structure is complex in nature and site specific. Since the focus of the present study was on the investigation of the modified substructures and the comparison of those proposed structures with other existing structures, for simplicity and without loss of generality, only permanent load-like mass of the structures and environmental loads, such as wind, wave and current loads, were considered in the analysis. Other environmental loadings, such as tidal, seismic and ice loads, as well as soil conditions and temperature effect, were not taken into account. Two load combinations were considered: normal condition with simplified (2D) loads and extreme condition comprehensive (3D) loads.

3.2.2. Load Combination 1: Normal Condition with Simplified (2D) Loads

The normal condition considered in this case refers to local oceanographic data collected near the Pescadores Islands (Penghu). Annual average wind speed, average wave height, average wave period, and average speed of ocean currents were set to 7.5 m/s, 0.49 m, 7.5 s and 0.134 m/s, respectively, for the normal condition [32].
In this load combination, we simply assumed that the wind, wave and current loads act in the same horizontal direction and that the resultant forces and moment are solely in-plane (Appendix C.4). The combination of simplified (2D) loads includes the self-weight of the 5-MW baseline wind turbine machine and tower, side wind load and wind load moment acting on the top transition piece and the wind load, wave load and current load acting on the substructure. The self-weight of the baseline wind turbine machine and tower refer to [26,27]. It is simplified to a vertical point load acting on the center of the transition piece. The side wind load and wind load moment are effective loads and representative of the wind load acting on the wind turbine machine. They can be simply calculated using elementary mechanics, so long as the wind load acting on the blades and tower are identified. Wave and current loads are calculated using Morison’s equation and Airy’s linear theory with additional assumptions and approximations. The detailed description of the load settings is directed to Appendix C in this paper.

3.2.3. Load Combination 2: Extreme Condition with Comprehensive (3D) Loads

The extreme condition in this case considers the wind speed, wave height, wave period and speed of ocean currents equal to 70 m/s, 14.88 m, 12.47 s and 1.4 m/s, respectively.
The self-weight of the baseline wind turbine machine and tower was set identical to the first load case. The airflow around a stationary wind turbine is described by the time-averaged continuity and momentum equations together with a k-ω turbulence model [33]. Therefore, the flow solver StarCCM+ was employed to calculate the fully-three-dimensional flow around the wind turbine at the wind speed of 70 m/s. Wave and current loads are calculated using Morison’s equation and the nonlinear immediate-depth 5th-order Stokes’ wave theory. For the three-legged structures (all structures, except J-structures), the wave and current loads were applied in the principal direction (denoted (0)), defined as the positive direction of the x-axis for all three- and four-legged models in Appendix B), whereas for the four-legged structures (J-structures in this study), these loads were applied in the diagonal direction (denoted (45)), because the wave and current loads applied in the diagonal direction generated higher stresses than those applied in the principal direction.

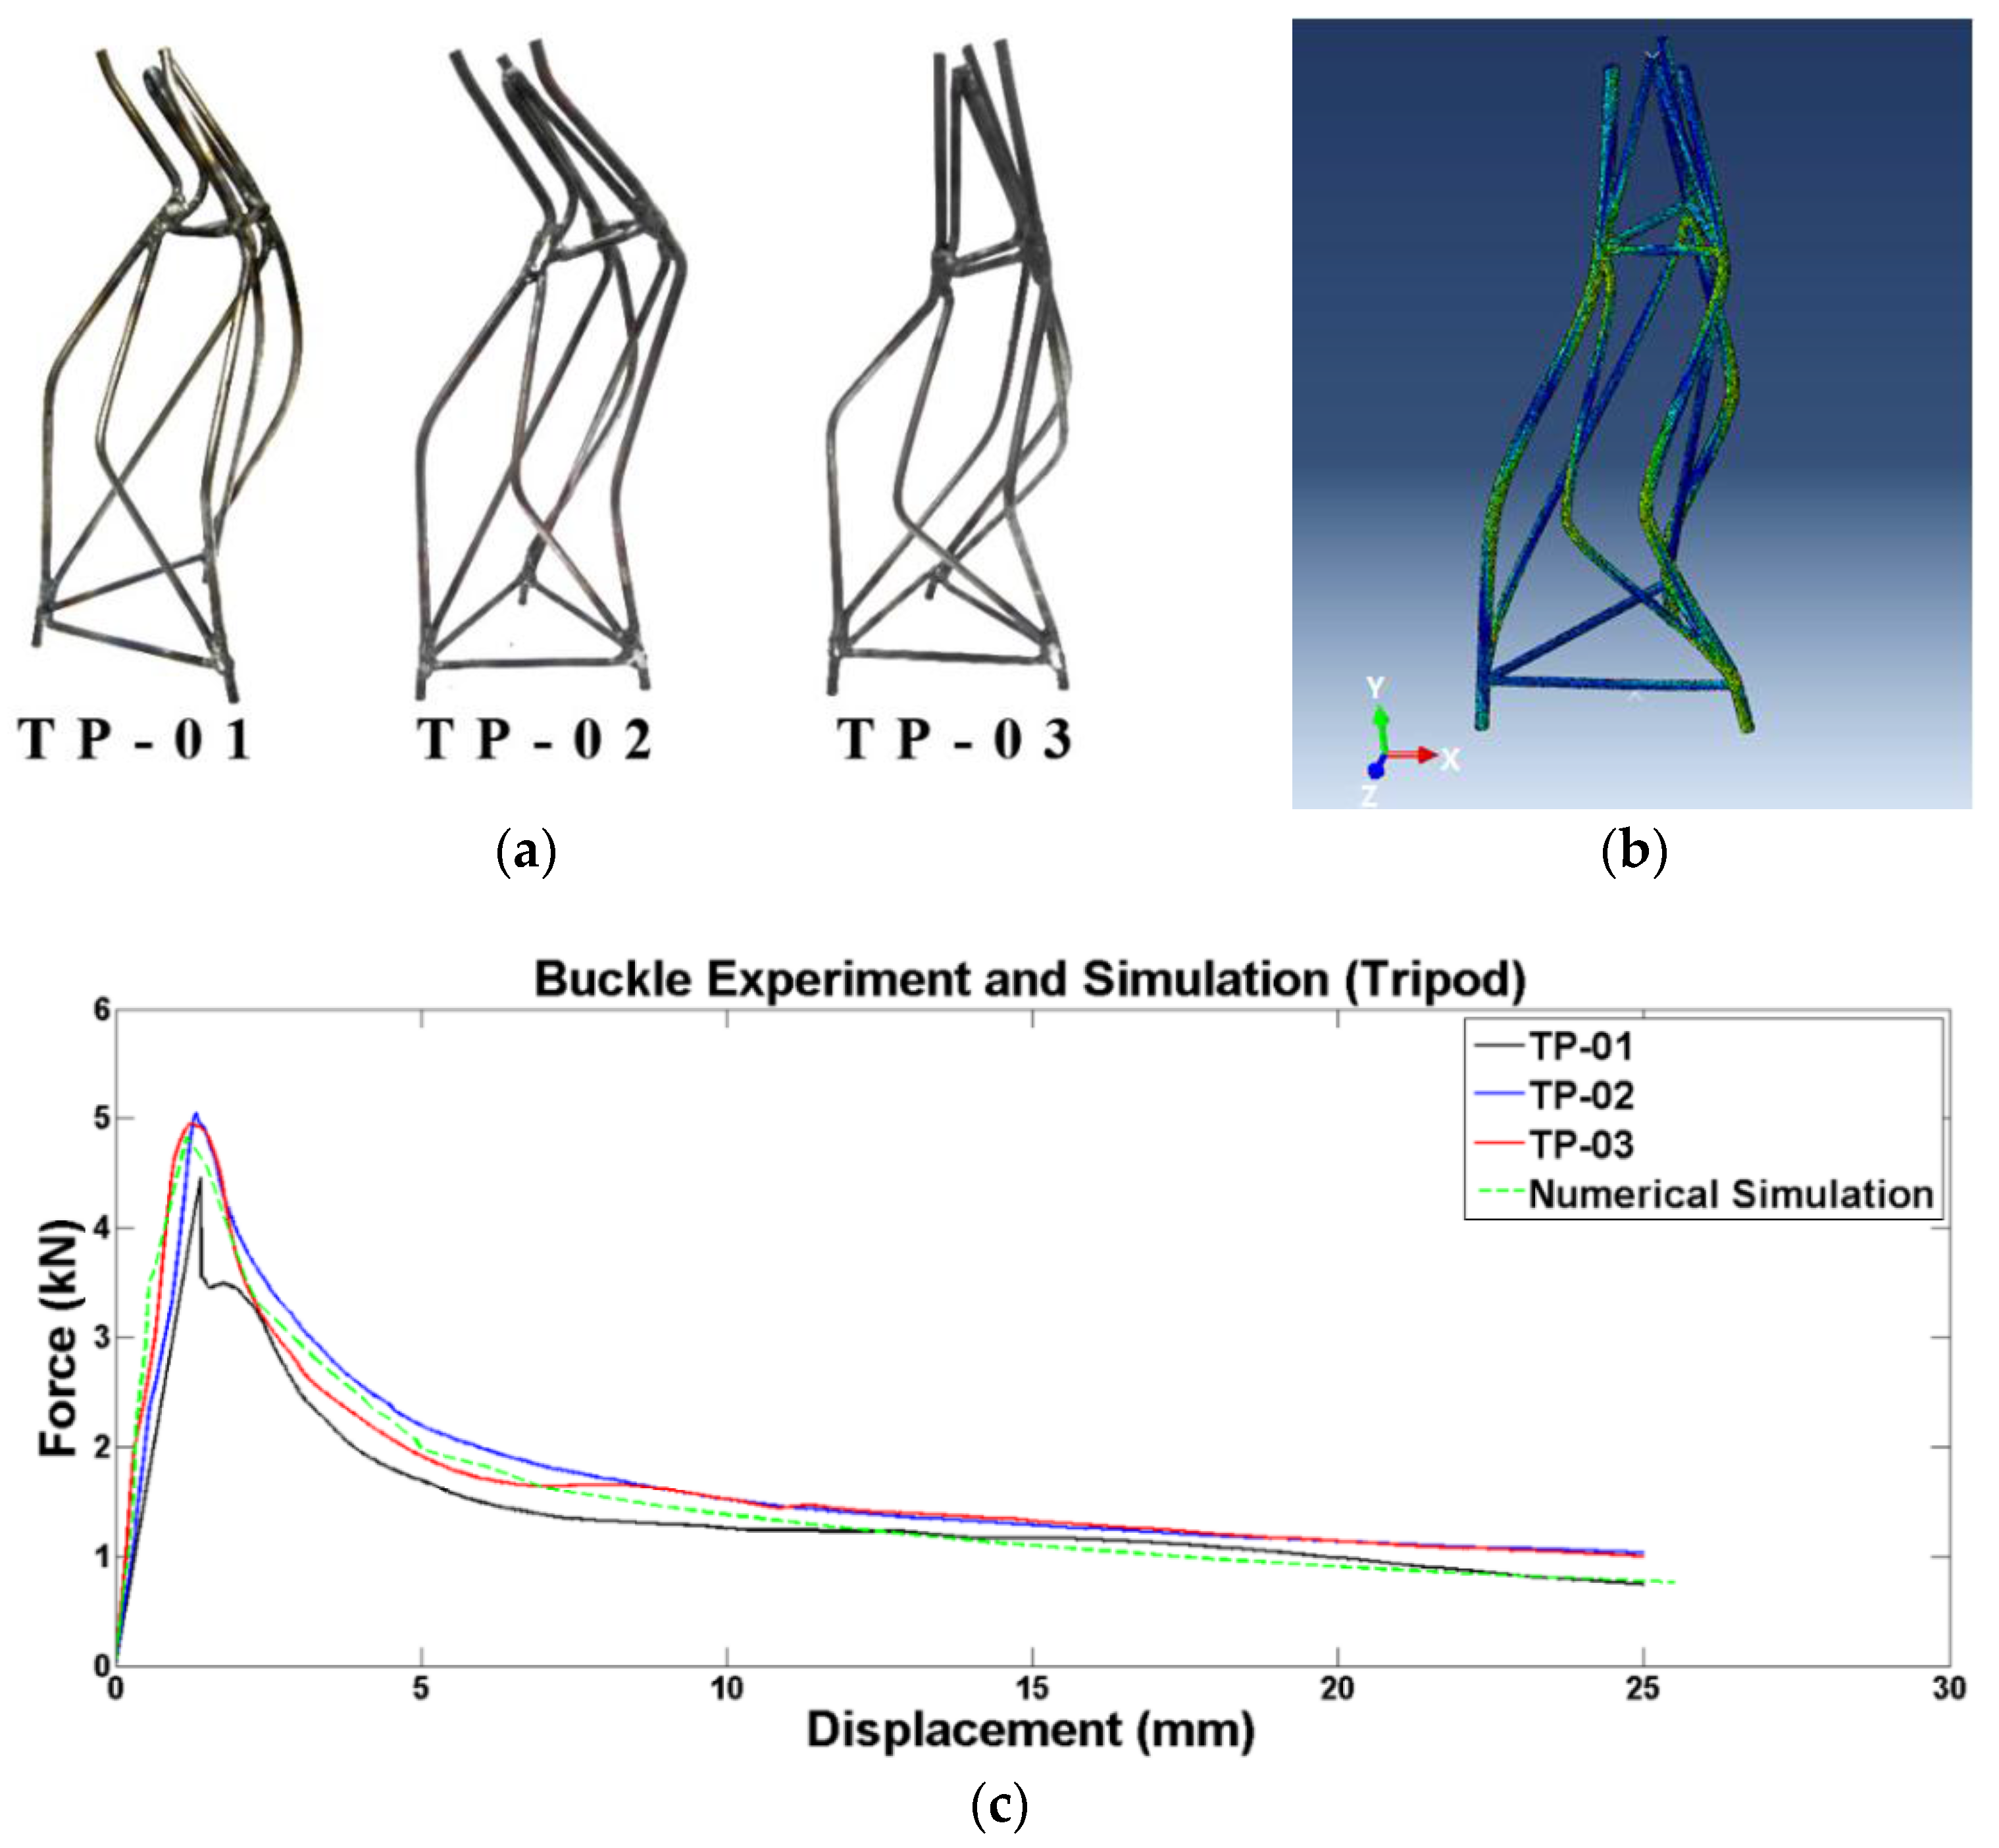
3.3. Unstable Collapse and Postbuckling Analysis
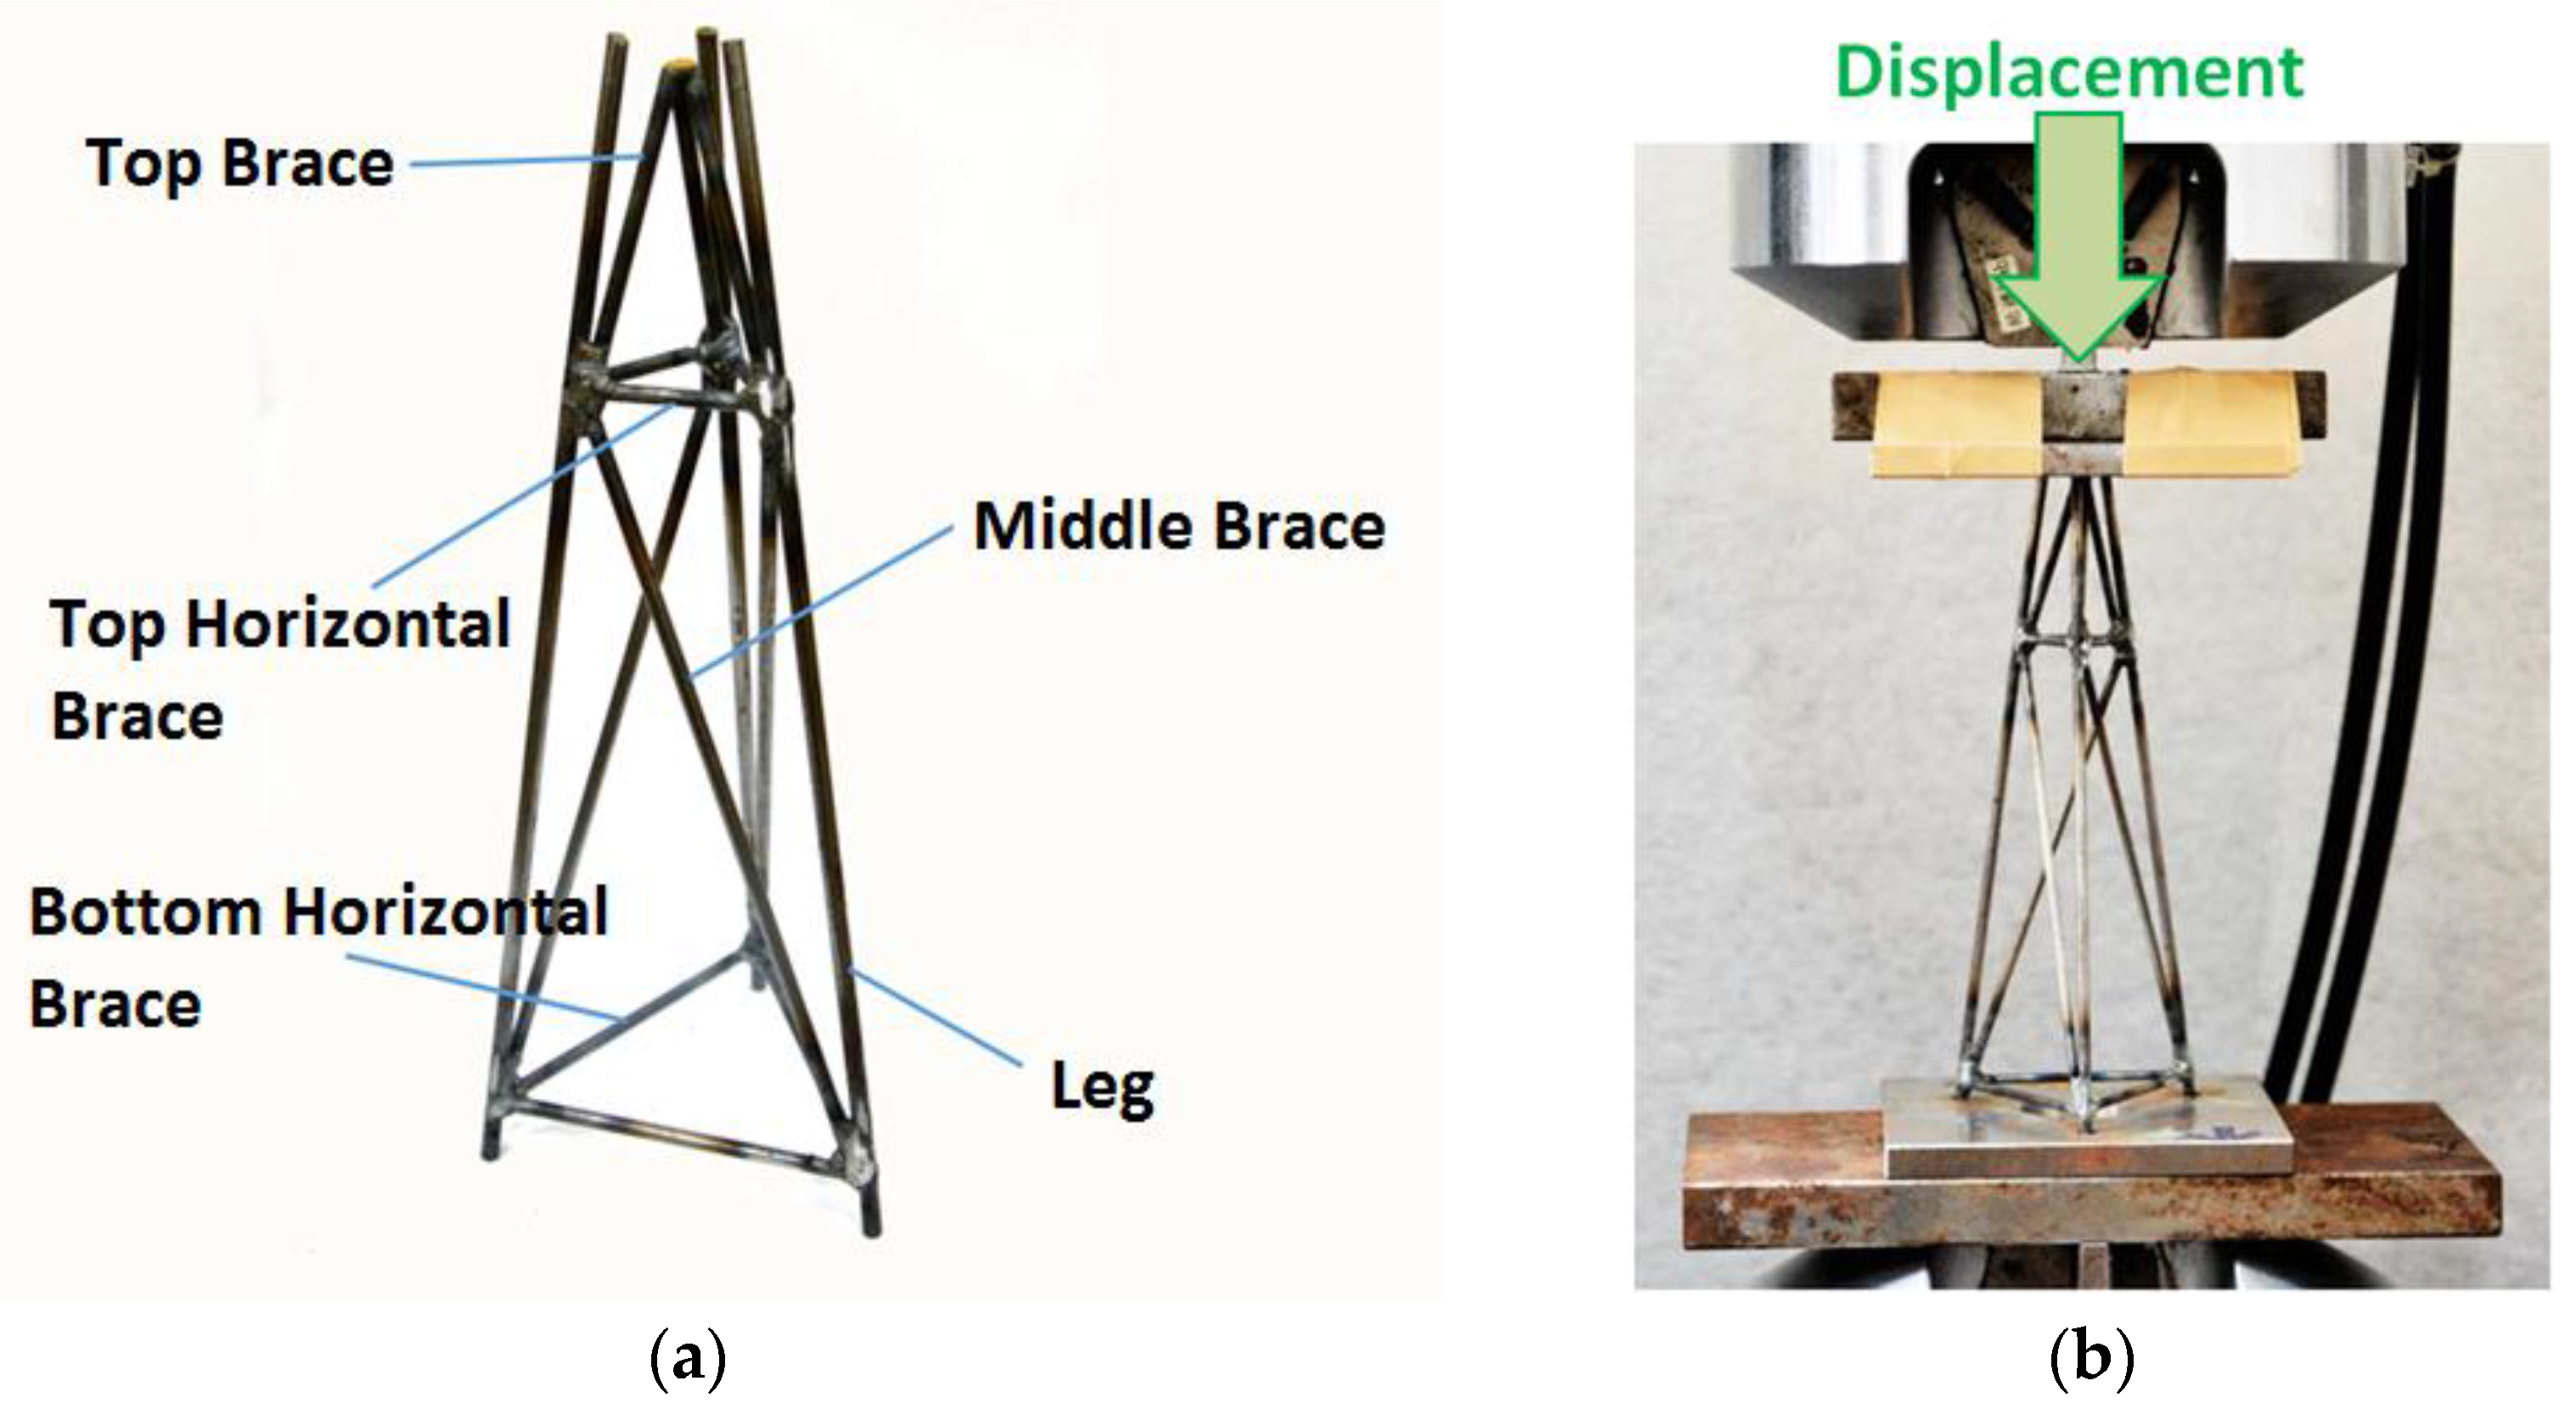
The stability of the substructure during and after construction is of particular interest. In this analysis, not only simulations were carried out, but also the experimental validation was conducted using small-scale test specimens. First, the numerical simulation and experiment with scaled-down models were performed for validation. Then, full-scale models of all 14 substructures were numerically investigated for the comparison.

3.3.1. Experiment

Small-scale experimental validation is an alternative and economic when the full-scale experimental validation is difficult. Three scaled-down test specimens of the MJ0-structure, having a scale of 1:330, made with solid steel tubes, were fabricated (Figure 2a). Because fabrication of the scaled-down specimens with hollow tubes was extremely difficult, solid cross-sections were purposely chosen as an alternation. The MTS 810 materials testing system was used for unidirectional compressive testing. Both the top and bottom ends were slightly inserted in the metal plates to create fixed-end boundary conditions. The displacement-controlled tests were performed, and the compression rate and total displacement of the tests were set to −0.04 mm/s and −25 mm, respectively (Figure 2b). During each displacement-controlled experiment, the load cell of the MTS machine continuously measured the corresponding applied vertical load on top of the structure, leading to a force-displacement diagram for analysis and comparison.

3.3.2. Numerical Simulation

The modified Riks method with solid and shell elements in Abaqus was employed for unstable collapse and postbuckling analysis [34]. In simple cases, linear eigenvalue analysis is sufficient for design evaluation. The Riks analysis, a load-deflection analysis method, yields very accurate results for problems with material nonlinearity, geometric nonlinearity prior to buckling or unstable postbuckling response.
The first part was the analysis using the scaled-down model for validation purposes. In the simulation, the material was assumed perfectly plastic, and the properties were defined in Section 3.1. The C3D8R (8-node linear brick, reduced integration with hourglass control) elements were used for the whole scaled-down model with the maximum mesh size equal to 0.025 mm. The applied force, as well as the top and bottom boundaries were set to represent the experiment.
The second part was the analysis of all 14 structures using full-scale models for comparison. The C3D8R (8-node linear brick, reduced integration with hourglass control) elements were used for the transition piece, whereas the S4R (4-node doubly-curved general-purpose shell, reduced integration with hourglass control under finite membrane strains) elements were used for the rest of the substructures. The maximum mesh size of the full-scale models was set to 150 mm. A nonlinear load-displacement relation was obtained from each analysis. We defined two points on the obtained nonlinear curve leading to the maximum load and the critical load for comparison purposes. The maximum load is the point with the absolute maximum load of the entire curve, whereas the critical load is the point at which the slope of the curve, i.e., the stiffness of the entire structure in the vertical direction, is 20% of the initial slope near the origin of the curve. With the two points defined, two loads and the corresponding displacements were obtained. Note that the maximum load is the load that the structure can no longer survive. In addition, determination of the critical load provides additional information that the structure may soon, and how soon to, experience catastrophic collapse.

3.4. Analysis of Local Buckling Strength Using the NORSOK Standard

The NORSOK standards are developed by the Norwegian petroleum industry to ensure adequate safety, value adding and cost effectiveness for petroleum industry developments and operations [35]. The standard specifies guidelines and requirements for the design and documentation of offshore steel structures and is applicable to all types of offshore structures made of steel with a specified minimum yield strength less than or equal to 500 MPa. Since the offshore steel structures used in the present study follow the standard, it was therefore of interest to check if all structural members in each type satisfy the requirements of the standard specifically in local buckling.
Structural members in all 14 types of substructure are tubular, subjected to combined axial compression and bending loads. The condition without hydrostatic pressure was assumed to meet the simulation conditions. According to the standard, tubular members subjected to combined axial compression and bending should be designed to satisfy the following conditions at all cross-sections along their length:
C R 1 = N S d N t , R d + M 2 y , S d + M 2 z , S d M R d 1.0
C R 2 = N S d N c , R d + 1 M R d { [ C m y M y , S d 1 N S d N E y ] 2 + [ C m z M z , S d 1 N S d N E z ] 2 } 0.5 1.0
where NSd is the design axial force, NEy and NEz are the Euler buckling resistance corresponding to the member y- and z-axis, respectively, Nt,Rd is the design axial tension resistance, Nc,Rd is the design axial compressive resistance, MRd is the design bending moment resistance, My,Sd is the in-plane design bending moment, Mz,Sd is the out-of-plane design bending moment and Cmy and Cmz are the reduction factors corresponding to the member y- and z-axis, respectively. Readers are directed to the NORSOK standard for the complete definition of each parameter shown in Equations (1) and (2). Since buckling of structural members is of particular interest in the present study, only members under compression were checked using the aforementioned criteria.

4. Results and Discussion

4.1. Stress Analysis

The maximum von Mises stresses and their corresponding locations occurring on the structures for 14 substructures under two load cases were obtained from stress analyses (Table 2). The maximum stresses were iteratively obtained, so that the values of all 14 cases fell at a similar level under the extreme condition. The location of the maximum von Mises stresses in all cases on the present designs are also given in Table 2. Notably, the structures were not optimized during the iteration. The maximum stresses can be further decreased by increasing the structural member sizes in all cases.

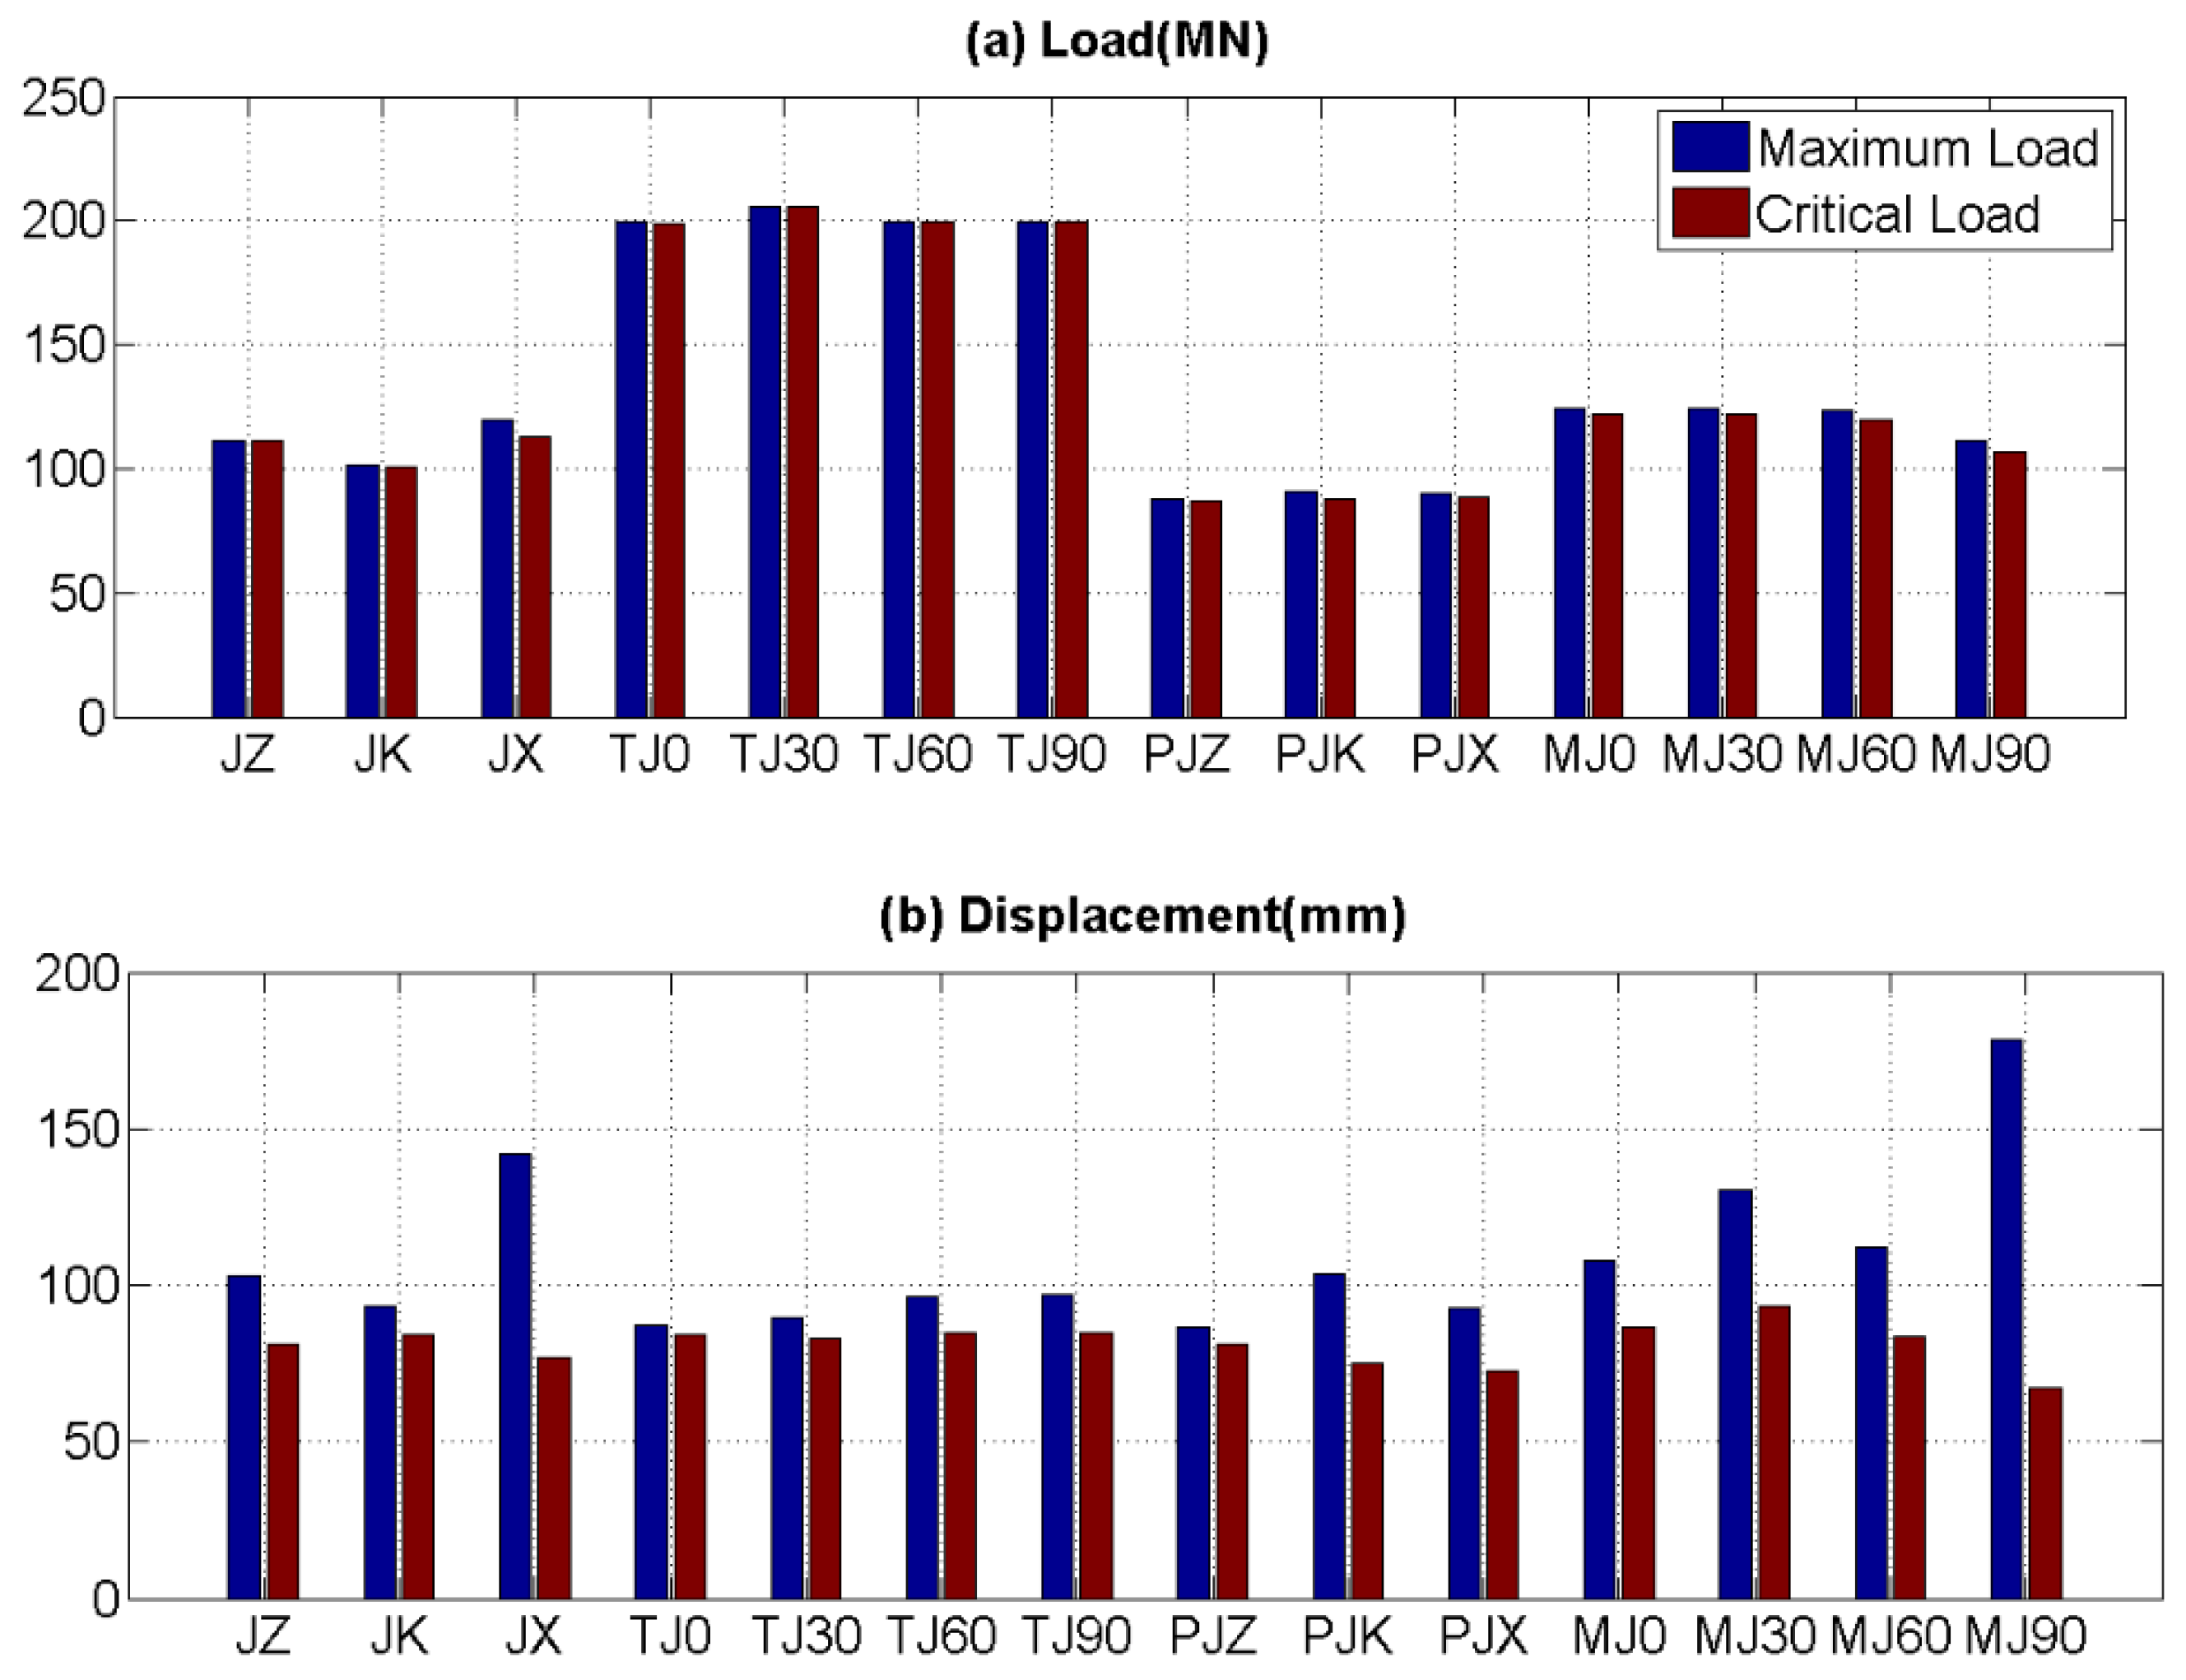
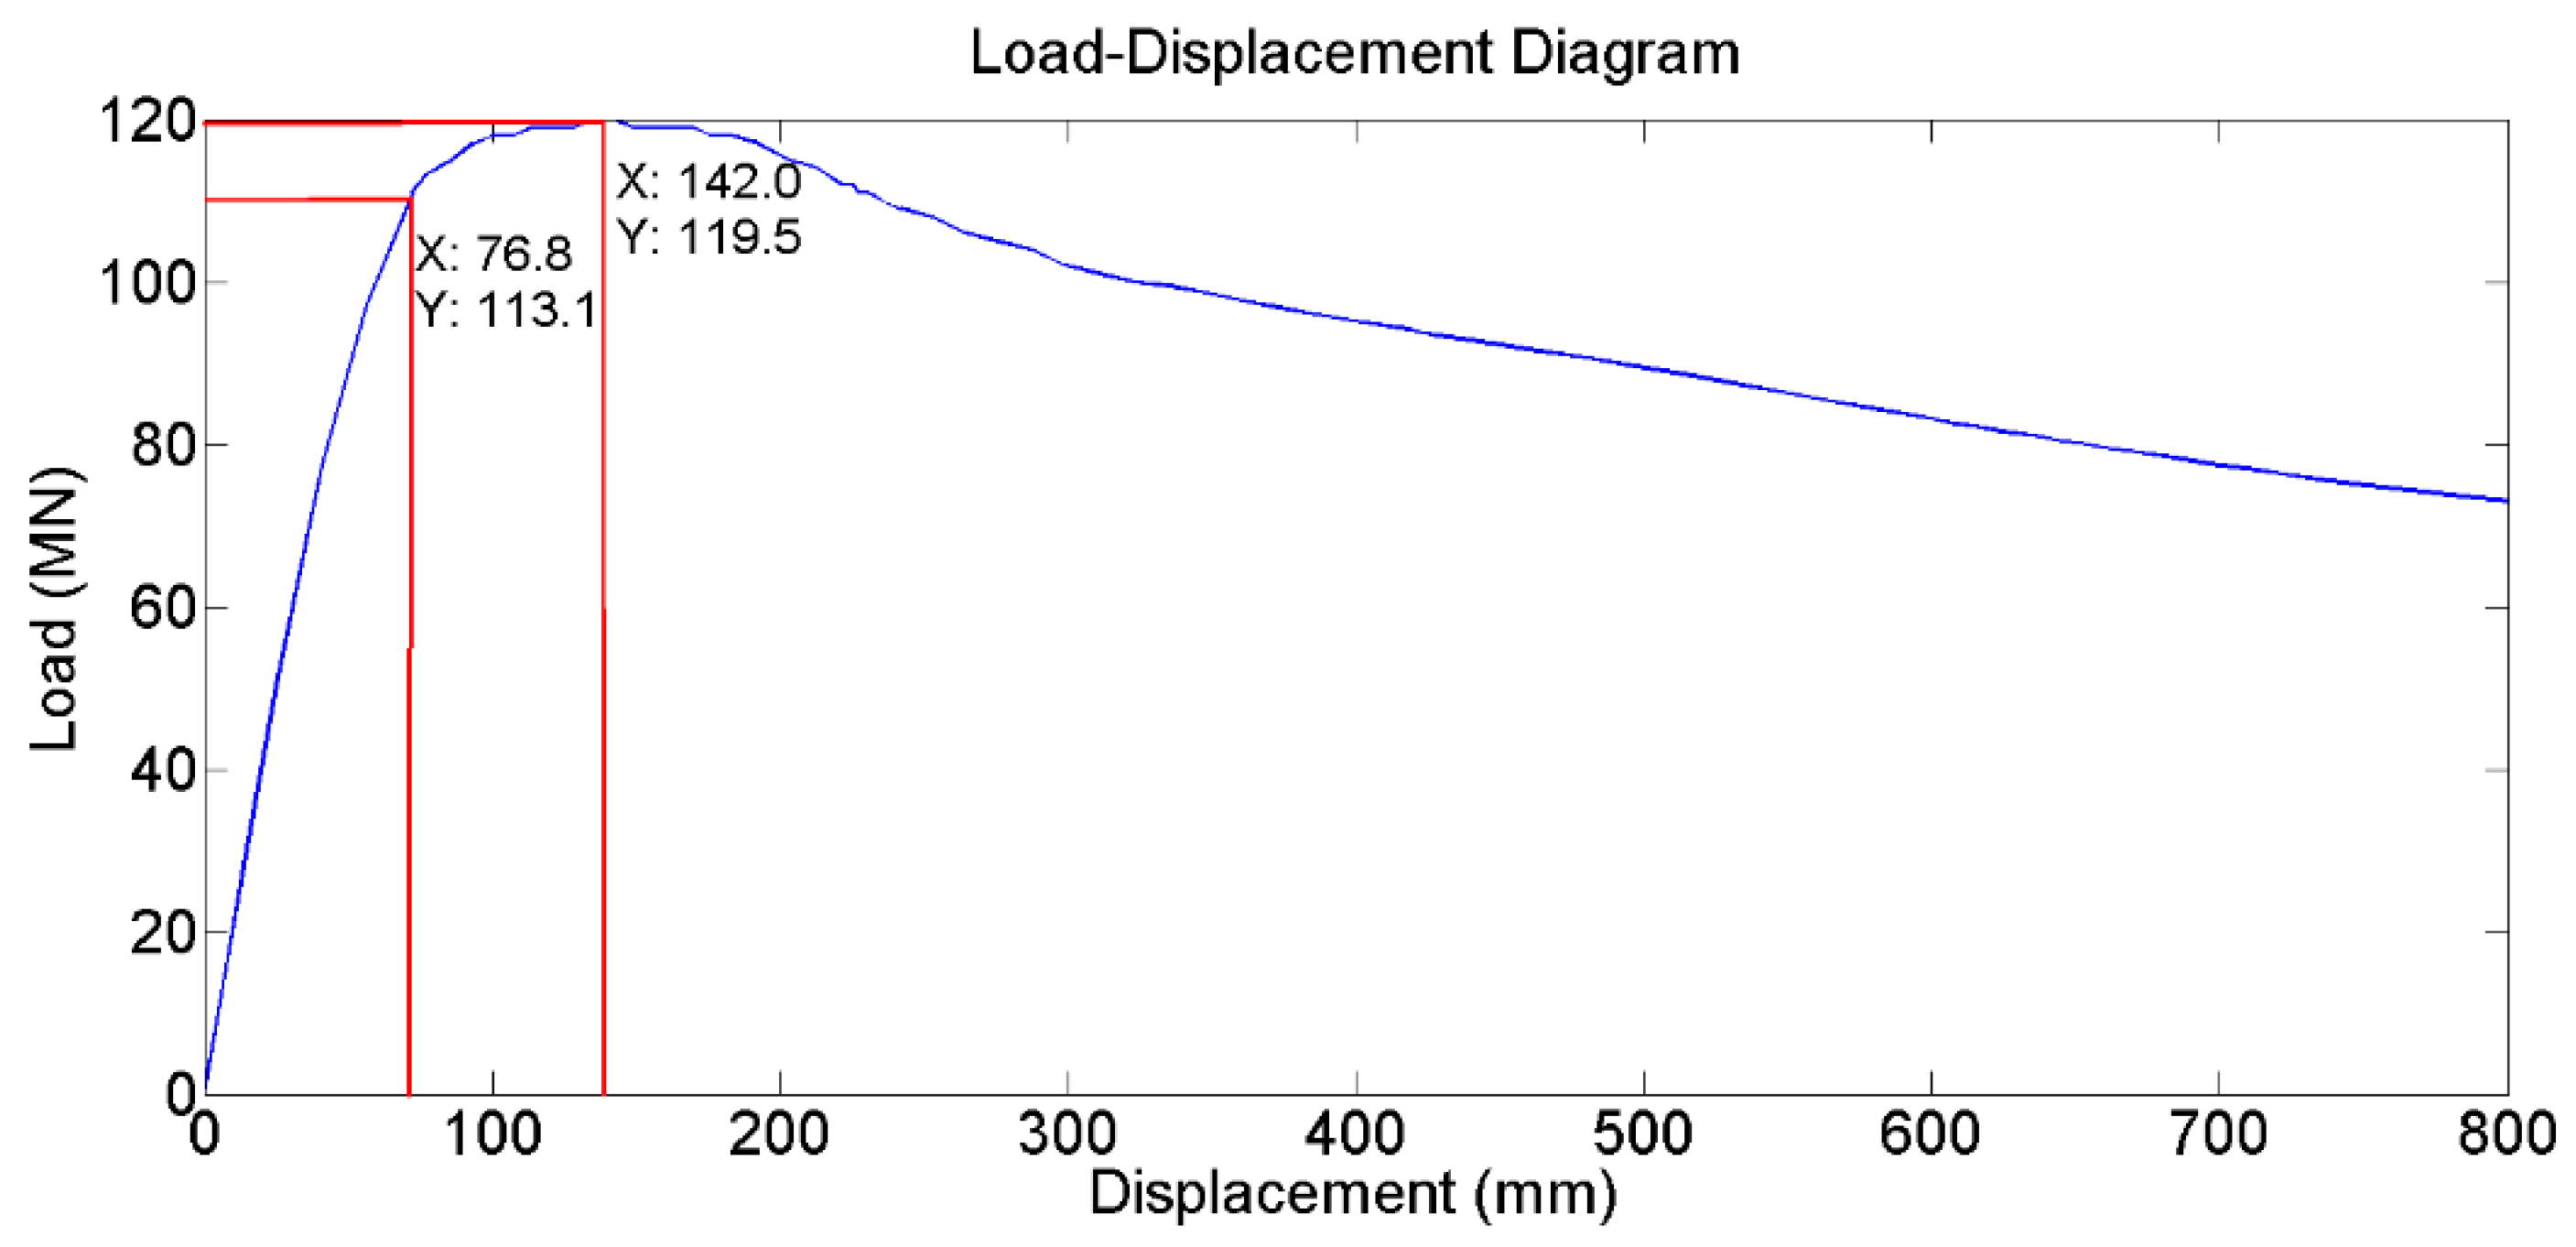
4.2. Unstable Collapse and Postbuckling Analysis

The first part is the validation of the simulation and experimental results using scaled-down models. Figure 3a,b show the after-compression deformation pattern of the scaled-down experimental test specimens and numerical models, respectively. Moreover, the load-displacement curves obtained from both the experimental and numerical tests are illustrated in Figure 3c. The results showed excellent agreement, indicating that the numerical method used for analysis is reliable and the numerical model is highly representative.
The second part is the analysis of 14 substructures using full-scale models. The force-displacement relations were determined for obtaining the maximum and critical loads and their corresponding vertical displacements (Figure 4). For instance, the force-displacement diagram of the JX-structure (Figure 5) shows that the maximum load and the corresponding displacement are 119.5 MN and 142.0 mm and that the critical load and the corresponding displacement are 113 MN and 76.8 mm, respectively. The TJ-structures resisted high critical and maximum loads compared to other types, possibly because the TJ-structures consist of a central huge column that is capable of withstanding vertical compressive loads, hence preventing buckling. The proposed MJ-structures are comparable to other types under Riks analysis.

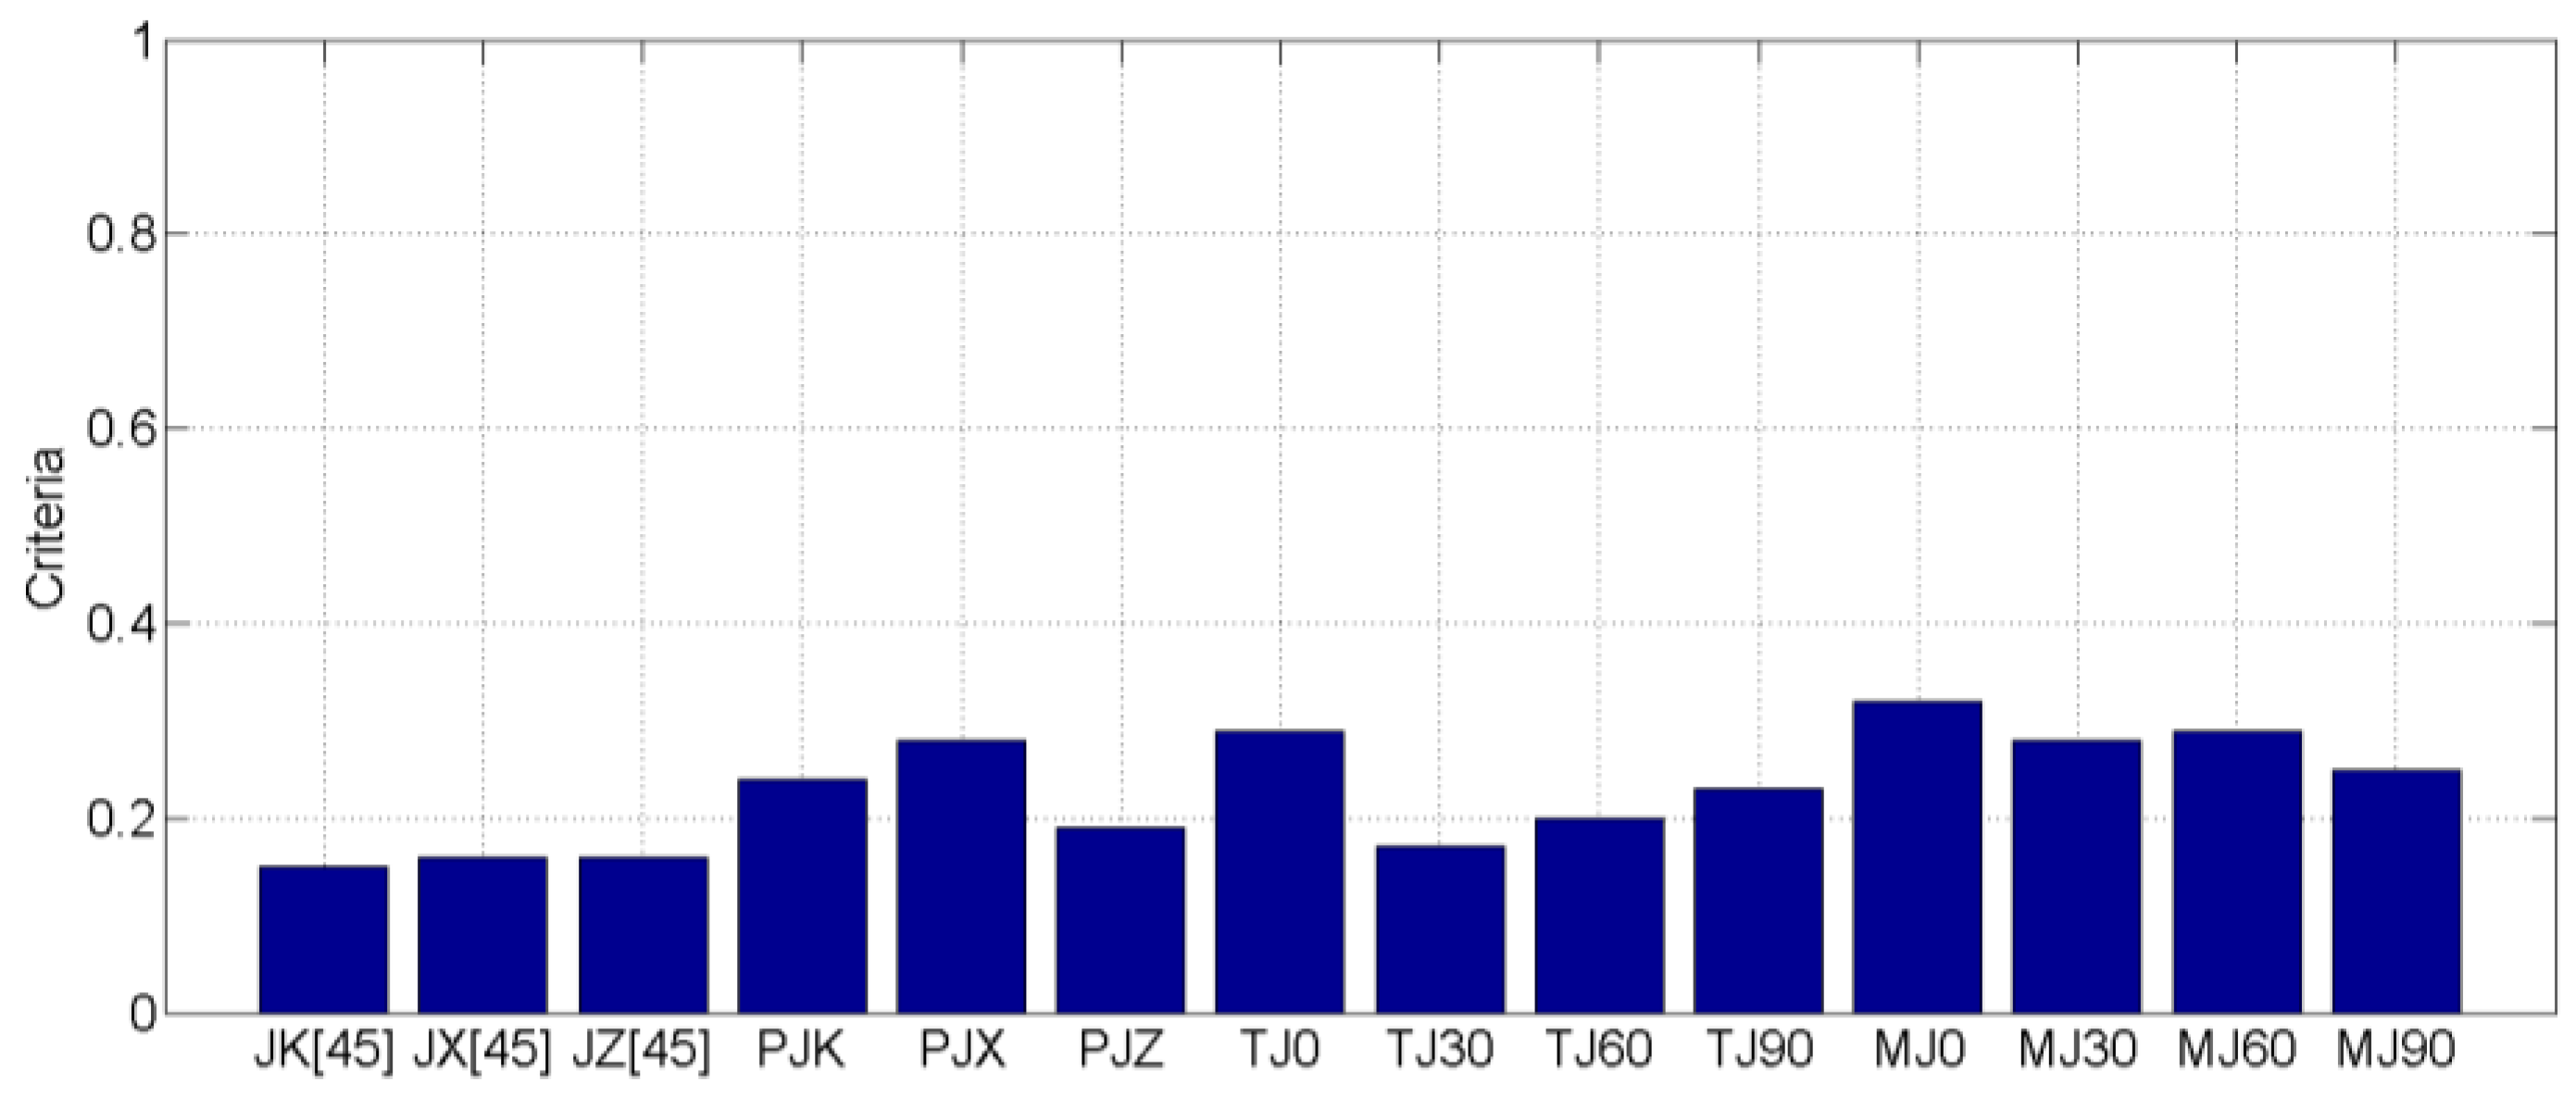
4.3. Analysis of Local Buckling Strength

Let (CR,max)j = Max {(CR1)j, (CR2)j}, where (CR1)j and (CR2)j were obtained using Equations (1) and (2) for the member j of a substructure. Then, the maximum criteria calculated for a substructure with in total n members in compression were obtained as CR,max = Max {(CR,max)1, (CR,max)2, … , (CR,max)j, … , (CR,max)n}. When the maximum criteria value, CR,max, is greater than one, the corresponding structural member is subjected to local buckling failure. The maximum criteria of 14 substructures are illustrated in Figure 6. The results showed that all structures under the present designs were shown safe from local buckling failure and possessed similar local buckling strength during the comprehensive extreme condition.

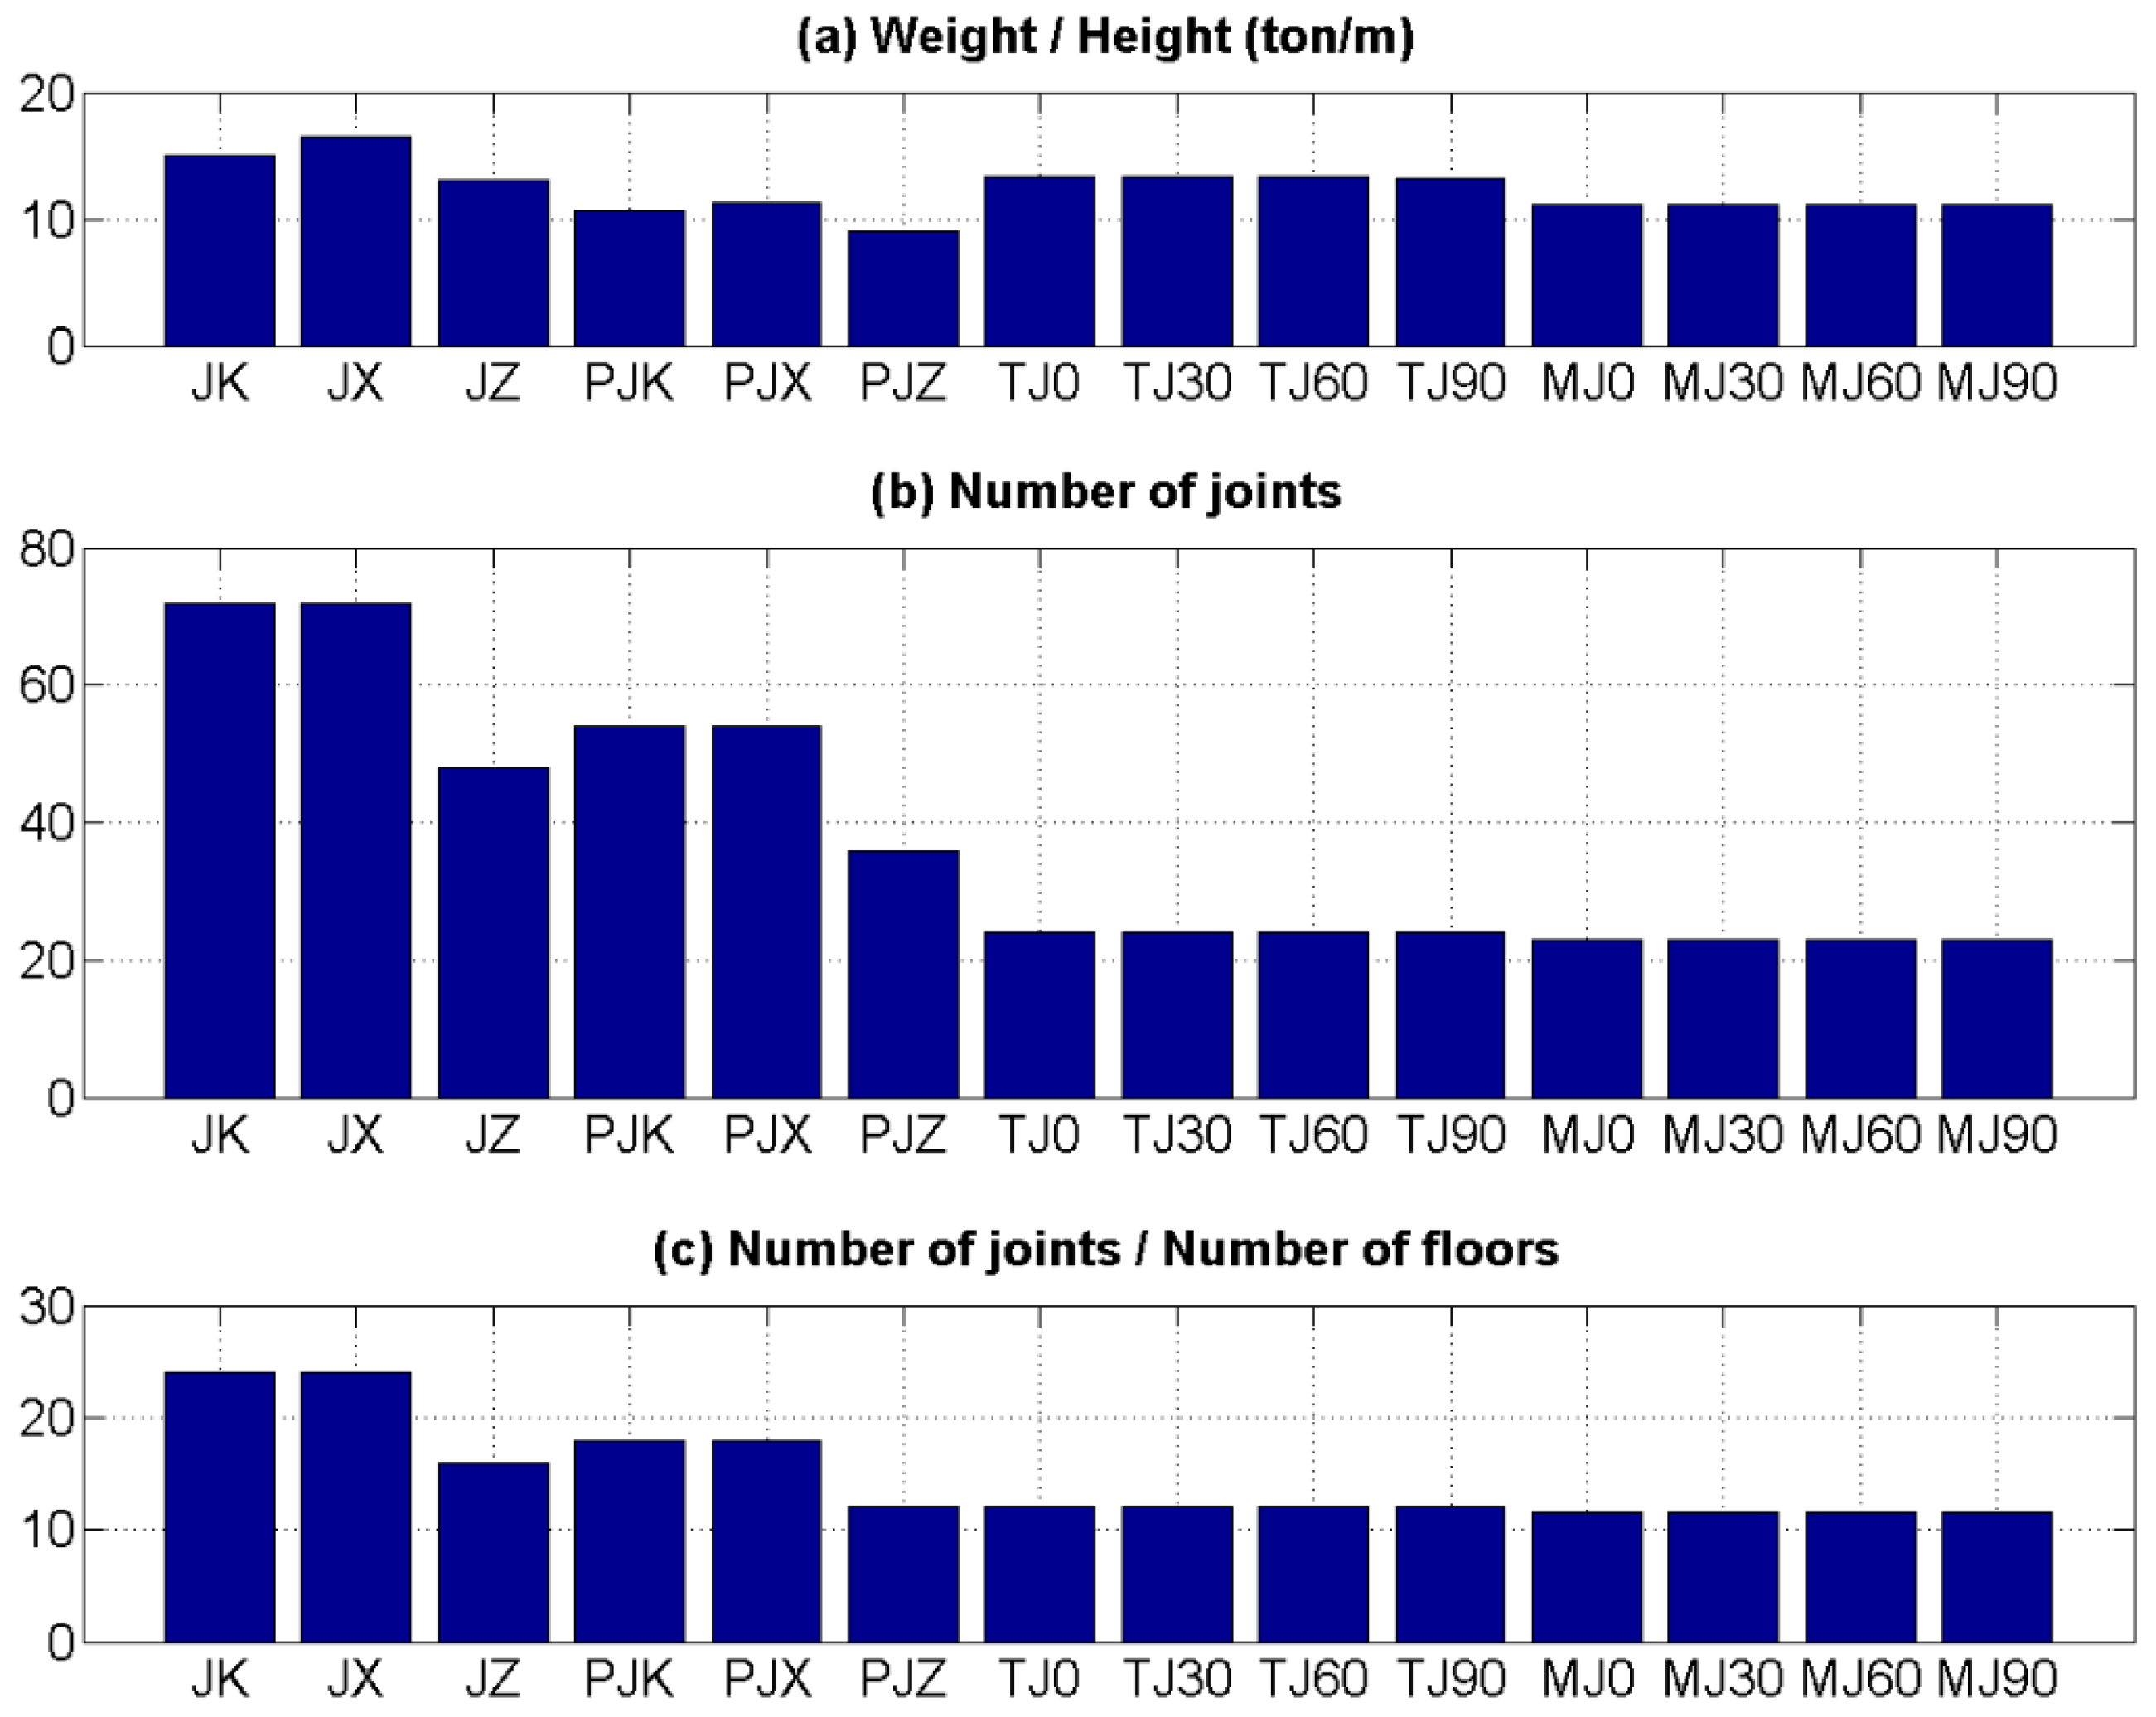
4.4. Miscellaneous Properties

The weight of the structures that straightforwardly leads to the cost of materials and the number of welded joints, which implies the complexity of construction and the risks of fatigue and fracture, both under the present 14 geometrical designs, were also of main concern. Figure 7 shows the ratio of the weight to height, the number of joints and the ratio of joint numbers to floor numbers. The J-structures and PJ-structures were counted as three floors, and the TJ-structures and MJ-structures were counted as two floors.
Under the present designs, the group of J-structures is the heaviest, possessing the greatest number of joints per floor number. The MJ-structures, anticipated to combine both the advantages of TJ- and PJ-structures, are the lightest, simultaneously possessing the least number of joints per floor number. The performance of MJ-structures can be further optimized by increasing the thicknesses and diameters of the structural members or by adjusting the architecture of the substructure to change the slenderness ratio of structural members through iteration.

5. Conclusions

In summary, this study presented the investigation of various types of offshore jacket substructures along with a proposed twisted-tripod-jacket type. The dimensions of the structures were decided iteratively using static stress analysis to ensure that all structures had a similar level of load-carrying capability. The numerical global buckling analyses were performed for all structures after being validated by the scaled-down experiments. Analyses of local buckling strength using the NORSOK standard were also of interest. The results revealed that all structures were safe under the provided load combinations. The MJ-structures were expected and proven to possess excellent structural behavior similar to the patented twisted jacket structures, while still maintaining the advantage of low material usage, similar to the three-leg jacket structures. Although the design of offshore wind turbine substructures is site dependent and requires additional dynamic and fatigue analysis with many specific site load combinations, the results obtained in this study shall provide alternatives for the initial selection and design of offshore wind turbine substructures.

Acknowledgments

The help of Yann Quemener, Tsung-Yueh Lin and Chien-Hua Huang from the Research Department of the CR Classification Society (CR) is gratefully acknowledged. This work was financially supported partly by the CR Classification Society (No. 103E31037) and partly by the Ministry of Science and Technology (MOST), Taiwan (Nos. 104-3113-E-002-001 and 105-3113-E-002-001).

Author Contributions

Hsin-Haou Huang conceived of and supervised the study. I-Wen Chen and Bao-Leng Wong performed the simulations. Yu-Hung Lin performed the experiments. Hsin-Haou Huang, I-Wen Chen, Bao-Leng Wong and Yu-Hung Lin analyzed the data. Shiu-Wu Chau generated input load data for the analysis. Hsin-Haou Huang and I-Wen Chen wrote the paper.

Conflicts of Interest

The authors declare no conflict of interest. The funding sponsors had no role in the design of the study; in the collection, analyses or interpretation of data; in the writing of the manuscript; nor in the decision to publish the results.

Abbreviations

The following abbreviations are used in this manuscript:
J
Traditional jacket substructure
TJ
Twisted jacket substructure
PJ
Tripod jacket substructure
MJ
Twisted-tripod jacket substructure
JZ
Traditional jacket substructure Z-braces
JK
Traditional jacket substructure K-brace
JX
Traditional jacket substructure X-braces
TJ0
Twisted jacket substructures 0° Twisted
TJ30
Twisted jacket substructures 30° twisted
TJ60
Twisted jacket substructures 60° twisted
TJ90
Twisted jacket substructures 90° twisted
PJZ
Tripod jacket substructures Z-tripod
PJK
Tripod jacket substructures K-tripod
PJX
Tripod jacket substructures X-tripod
MJ0
Twisted-tripod jacket substructures 0° tripod
MJ30
Twisted-tripod jacket substructures 0° tripod
MJ60
Twisted-tripod jacket substructures 60° tripod
MJ90
Twisted-tripod jacket substructures 90° tripod

Appendix A. Definitions and Dimensions of Jacket Substructure Members

Four types of jacket substructure were designed in the study: the traditional jacket substructure (J), the twisted jacket substructure (TJ), the tripod jacket substructure (PJ) and the twisted-tripod jacket substructure (MJ).

A.1. Traditional Jacket Substructure (J-Structure)

The J-structure is four-legged. The terminology of the structural members is shown in Figure A1. Three J-structures were designed: X-braces (JX), K-braces (JK) and Z-braces (JZ). The dimensions are listed in Table A1. The side and top views of the J-structure are shown in Figure A2 (JX structure shown as an example).
Figure A1. Terminology of the structural members of a J-structure.
Energies 09 00264 g008
Table A1. Specification of three J-structures.
Traditional Jacket Substructure (J)
Jacket TypeZ-BracesK-BracesX-Braces
Total Height66.00 m66.00 m66.00 m
Length of Leg67.97 m67.97 m67.97 m
Length of Top Brace20.07 m16.85 m20.07 m
Length of Middle Brace28.94 m23.49 m28.94 m
Length of Bottom Brace37.18 m28.17 m37.18 m
Length of Top Horizontal Brace14.58 m14.58 m14.58 m
Length of Middle Horizontal Brace22.24 m22.24 m22.24 m
Length of Bottom Horizontal Brace31.13 m31.13 m31.13 m
Thickness of Brace 0.03 m0.03 m0.03 m
Thickness of Leg 0.04 m0.04 m0.04 m
Diameter of Brace0.90 m0.90 m0.90 m
Diameter of Leg1.80 m1.80 m1.80 m
Figure A2. Side and top views of the X-braces (JX) structure.
Energies 09 00264 g009

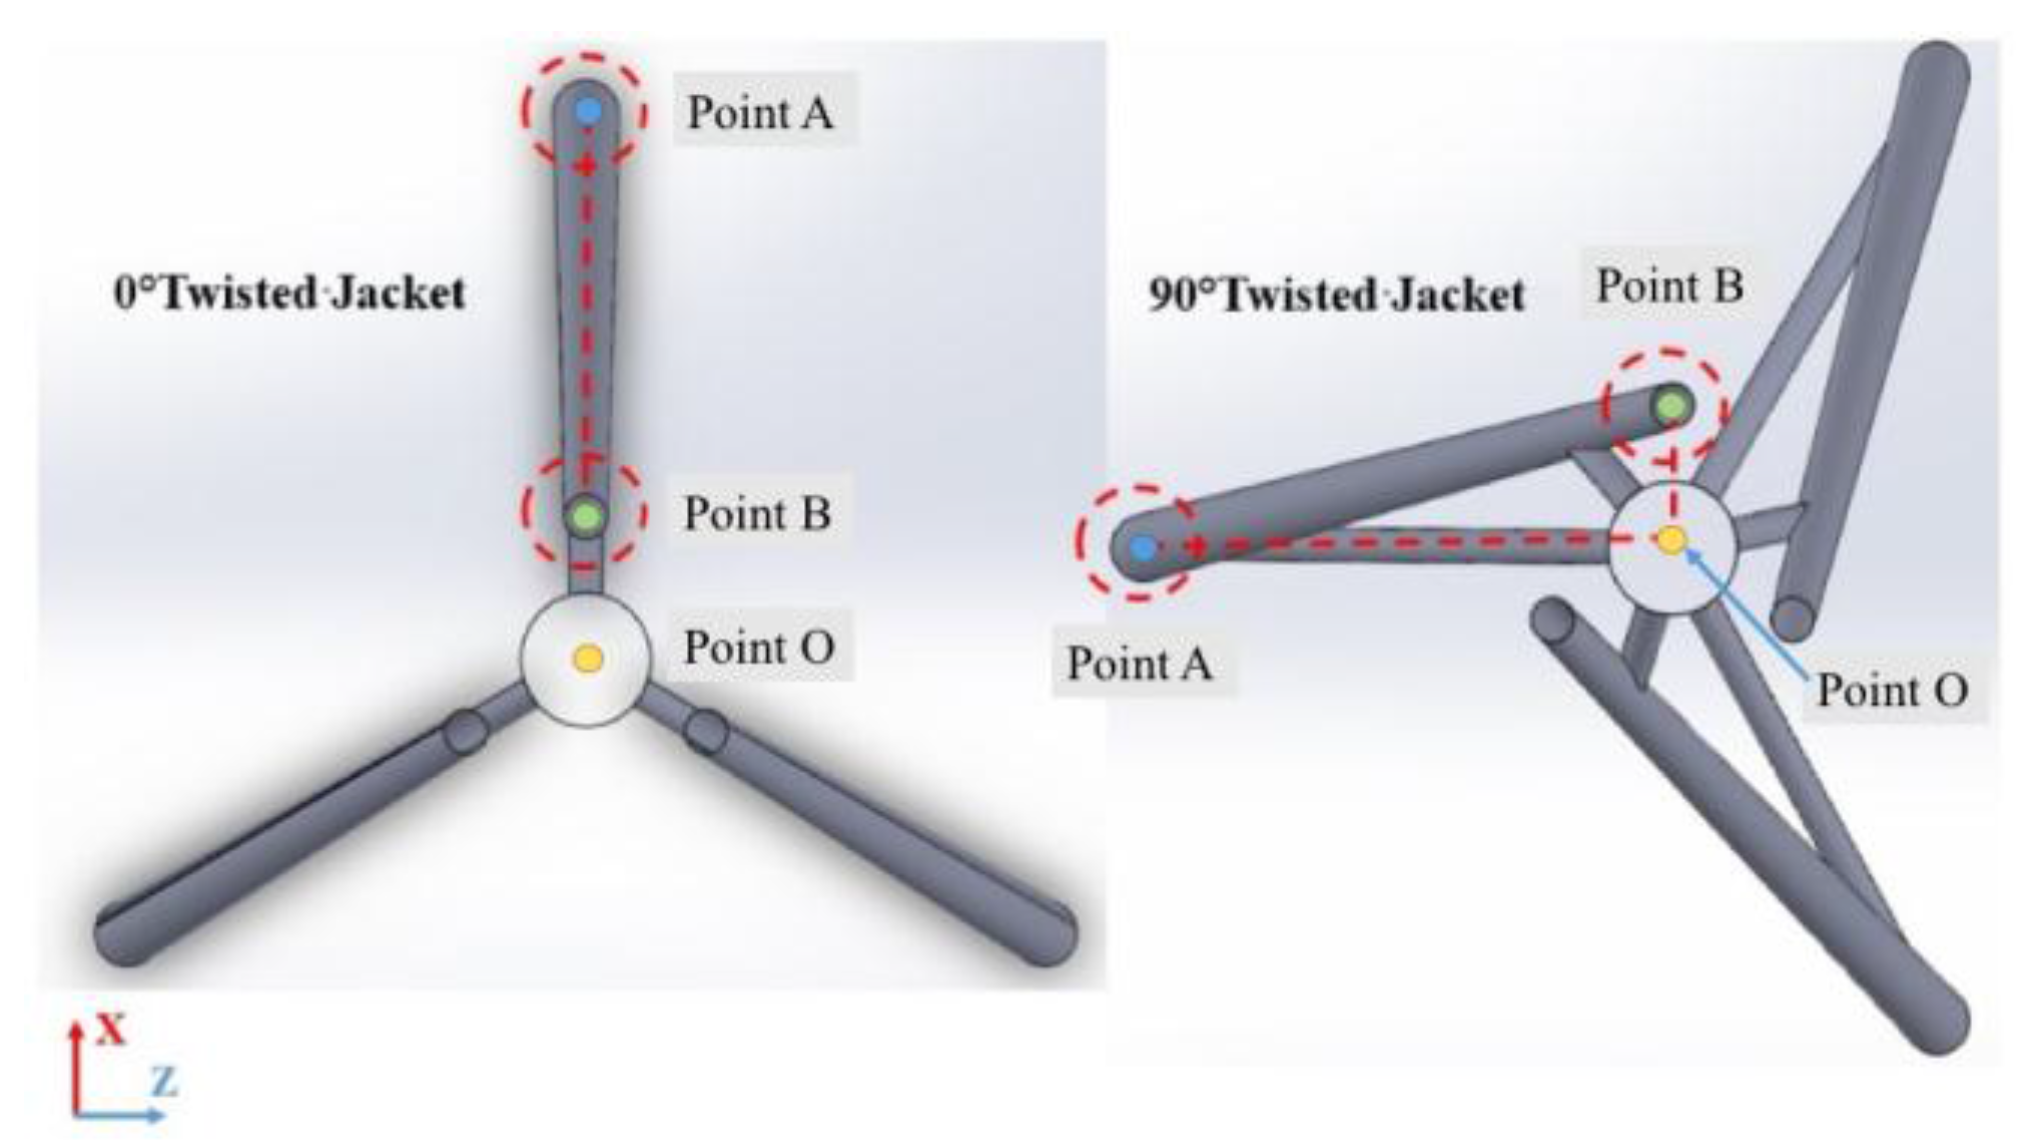
A.2. Twisted Jacket Substructure (TJ-Structure)

The terminology of the TJ-structure members is shown in Figure A3. Four TJ-structures were designed: 0° twisted (TJ0), 30° twisted (TJ30), 60° twisted (TJ60) and 90° twisted (TJ90). In Figure A4, the bottom-end center and the top-end center of a leg are projected to Points A and B on the x-z plane, respectively. The center of the central column is projected to Point O on the same plane. The angle between two vectors, O A and O B , is defined as the twisted angle. The dimensions of the TJ-structures are listed in Table A2. The side and top views of the TJ-structure are shown in Figure A4 (TJ30 structure shown as an example).
Figure A3. Terminology of the structural members of a TJ-structure.
Energies 09 00264 g010
Figure A4. Illustration for the definition of the twisted angle.
Energies 09 00264 g011
Table A2. Specification of four TJ-structures.
Twisted Jacket Structure
Jacket StructureTJ0TJ30TJ60TJ90
Total Height66.00 m66.00 m66.00 m66.00 m
Length of Leg66.86 m66.97 m67.28 m67.68 m
Length of Top Brace11.57 m11.48 m11.20 m10.82 m
Length of Middle Brace11.57 m11.48 m11.20 m10.82 m
Length of Bottom Brace20.58 m20.57 m20.54 m20.49 m
Length of Bottom Horizontal Brace14.09 m14.08 m14.03 m13.95 m
Thickness of Top Brace 0.04 m0.04 m0.04 m0.04 m
Thickness of Middle Brace0.05 m0.05 m0.05 m0.05 m
Thickness of Bottom Brace0.05 m0.05 m0.05 m0.05 m
Thickness of Bottom Horizontal Brace0.05 m0.05 m0.05 m0.05 m
Thickness of Leg 0.04 m0.04 m0.04 m0.04 m
Thickness of Central Column0.04 m0.04 m0.04 m0.04 m
Diameter of Top Brace1.2 m1.2 m1.2 m1.2 m
Diameter of Middle Brace1.6 m1.6 m1.6 m1.6 m
Diameter of Bottom Brace1.6 m1.6 m1.6 m1.6 m
Diameter of Bottom Horizontal Brace1.6 m1.6 m1.6 m1.6 m
Diameter of Leg1.80 m1.80 m1.80 m1.80 m
Diameter of Central Column3.60 m3.60 m3.60 m3.60 m
Figure A5. Side and top views of the 0° twisted (TJ30) structure.
Energies 09 00264 g012

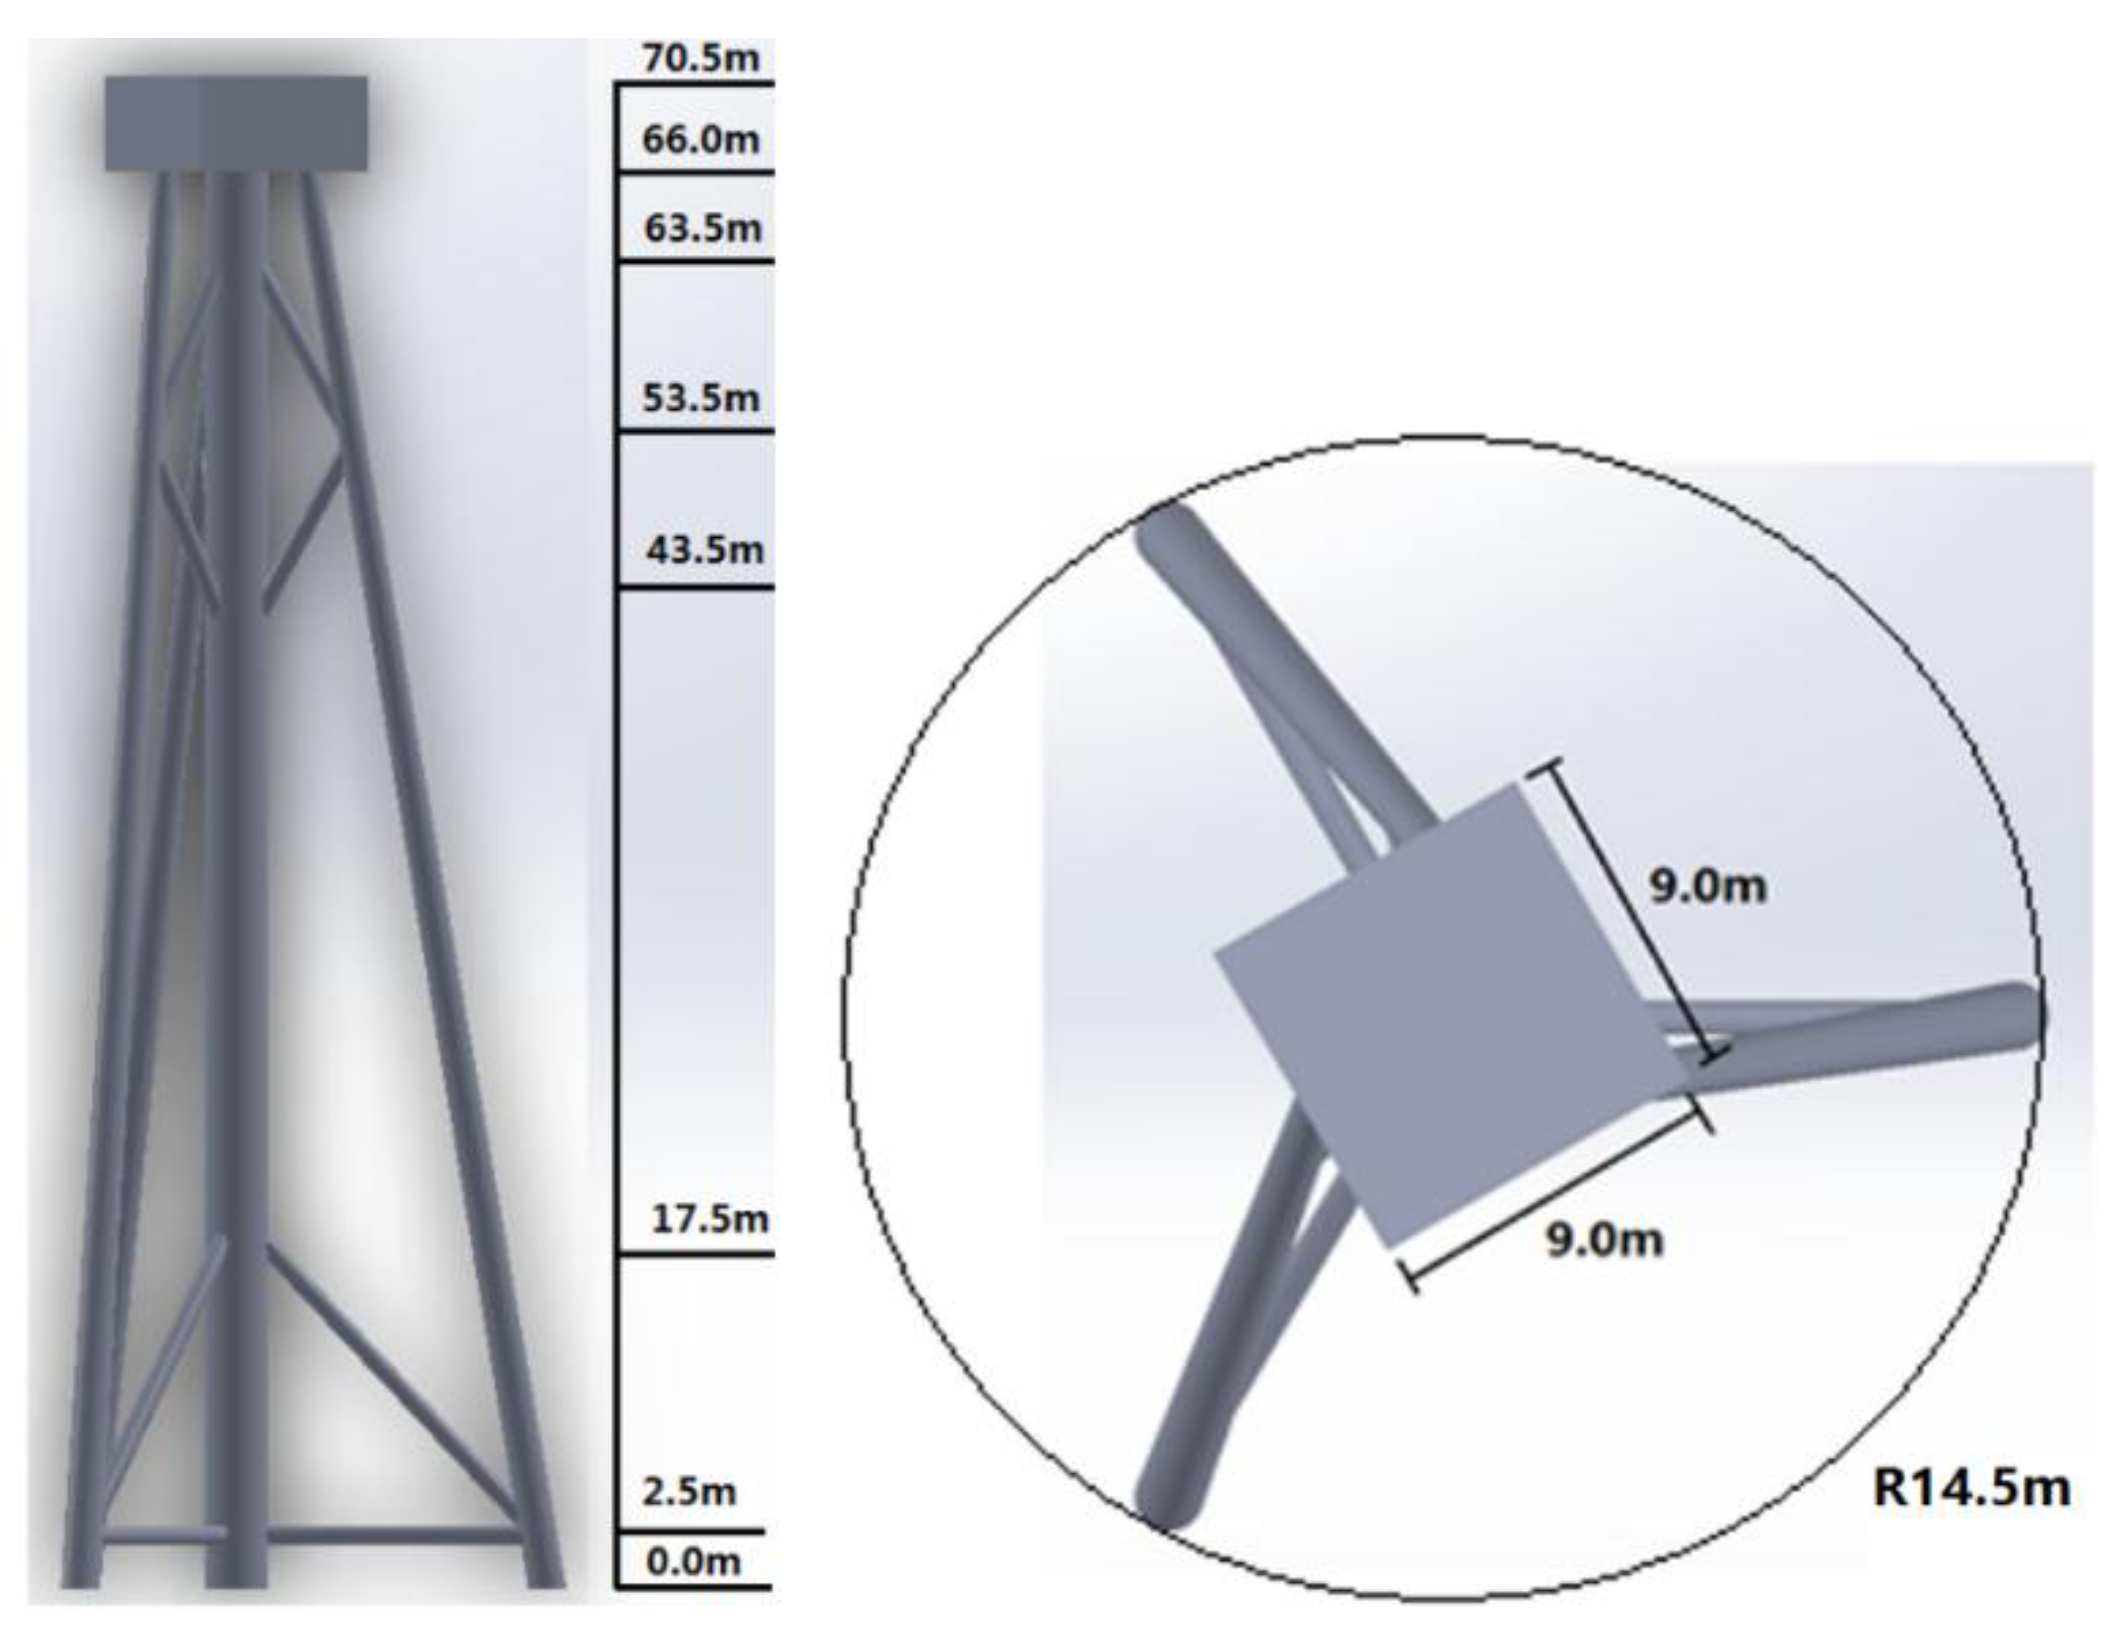
A.3. Tripod Jacket Substructure (PJ-Structure)

The terminology of the PJ-structure members is shown in Figure A6. Three PJ-structures were designed: Z-tripod (PJZ), K-tripod (PJK) and X-tripod (PJX). The dimensions of the PJ-structures are listed in Table A3. The side and top views of the PJ-structure are shown in Figure A7 (PJZ structure shown as an example).
Figure A6. Terminology of the structural members of a PJ-structure.
Energies 09 00264 g013
Table A3. Specification of three PJ-structures.
Tripod Jacket Substructure (PJ)
Jacket TypePJZPJKPJX
Total Height66.00 m66.00 m66.00 m
Length of Leg66.86 m66.86 m66.86 m
Length of Top Brace18.32 m16.39 m18.32 m
Length of Middle Brace26.23 m22.76 m26.23 m
Length of Bottom Brace32.99 m27.00 m32.99 m
Length of Top Horizontal Brace11.07 m11.07 m11.07 m
Length of Middle Horizontal Brace17.25 m17.25 m17.25 m
Length of Bottom Horizontal Brace24.41 m24.41 m24.41 m
Thickness of Brace 0.03 m0.03 m0.03 m
Thickness of Leg 0.04 m0.04 m0.04 m
Diameter of Brace0.90 m0.90 m0.90 m
Diameter of Leg1.80 m1.80 m1.80 m
Figure A7. Side and top views of the Z-Tripod (PJZ) structure.
Energies 09 00264 g014

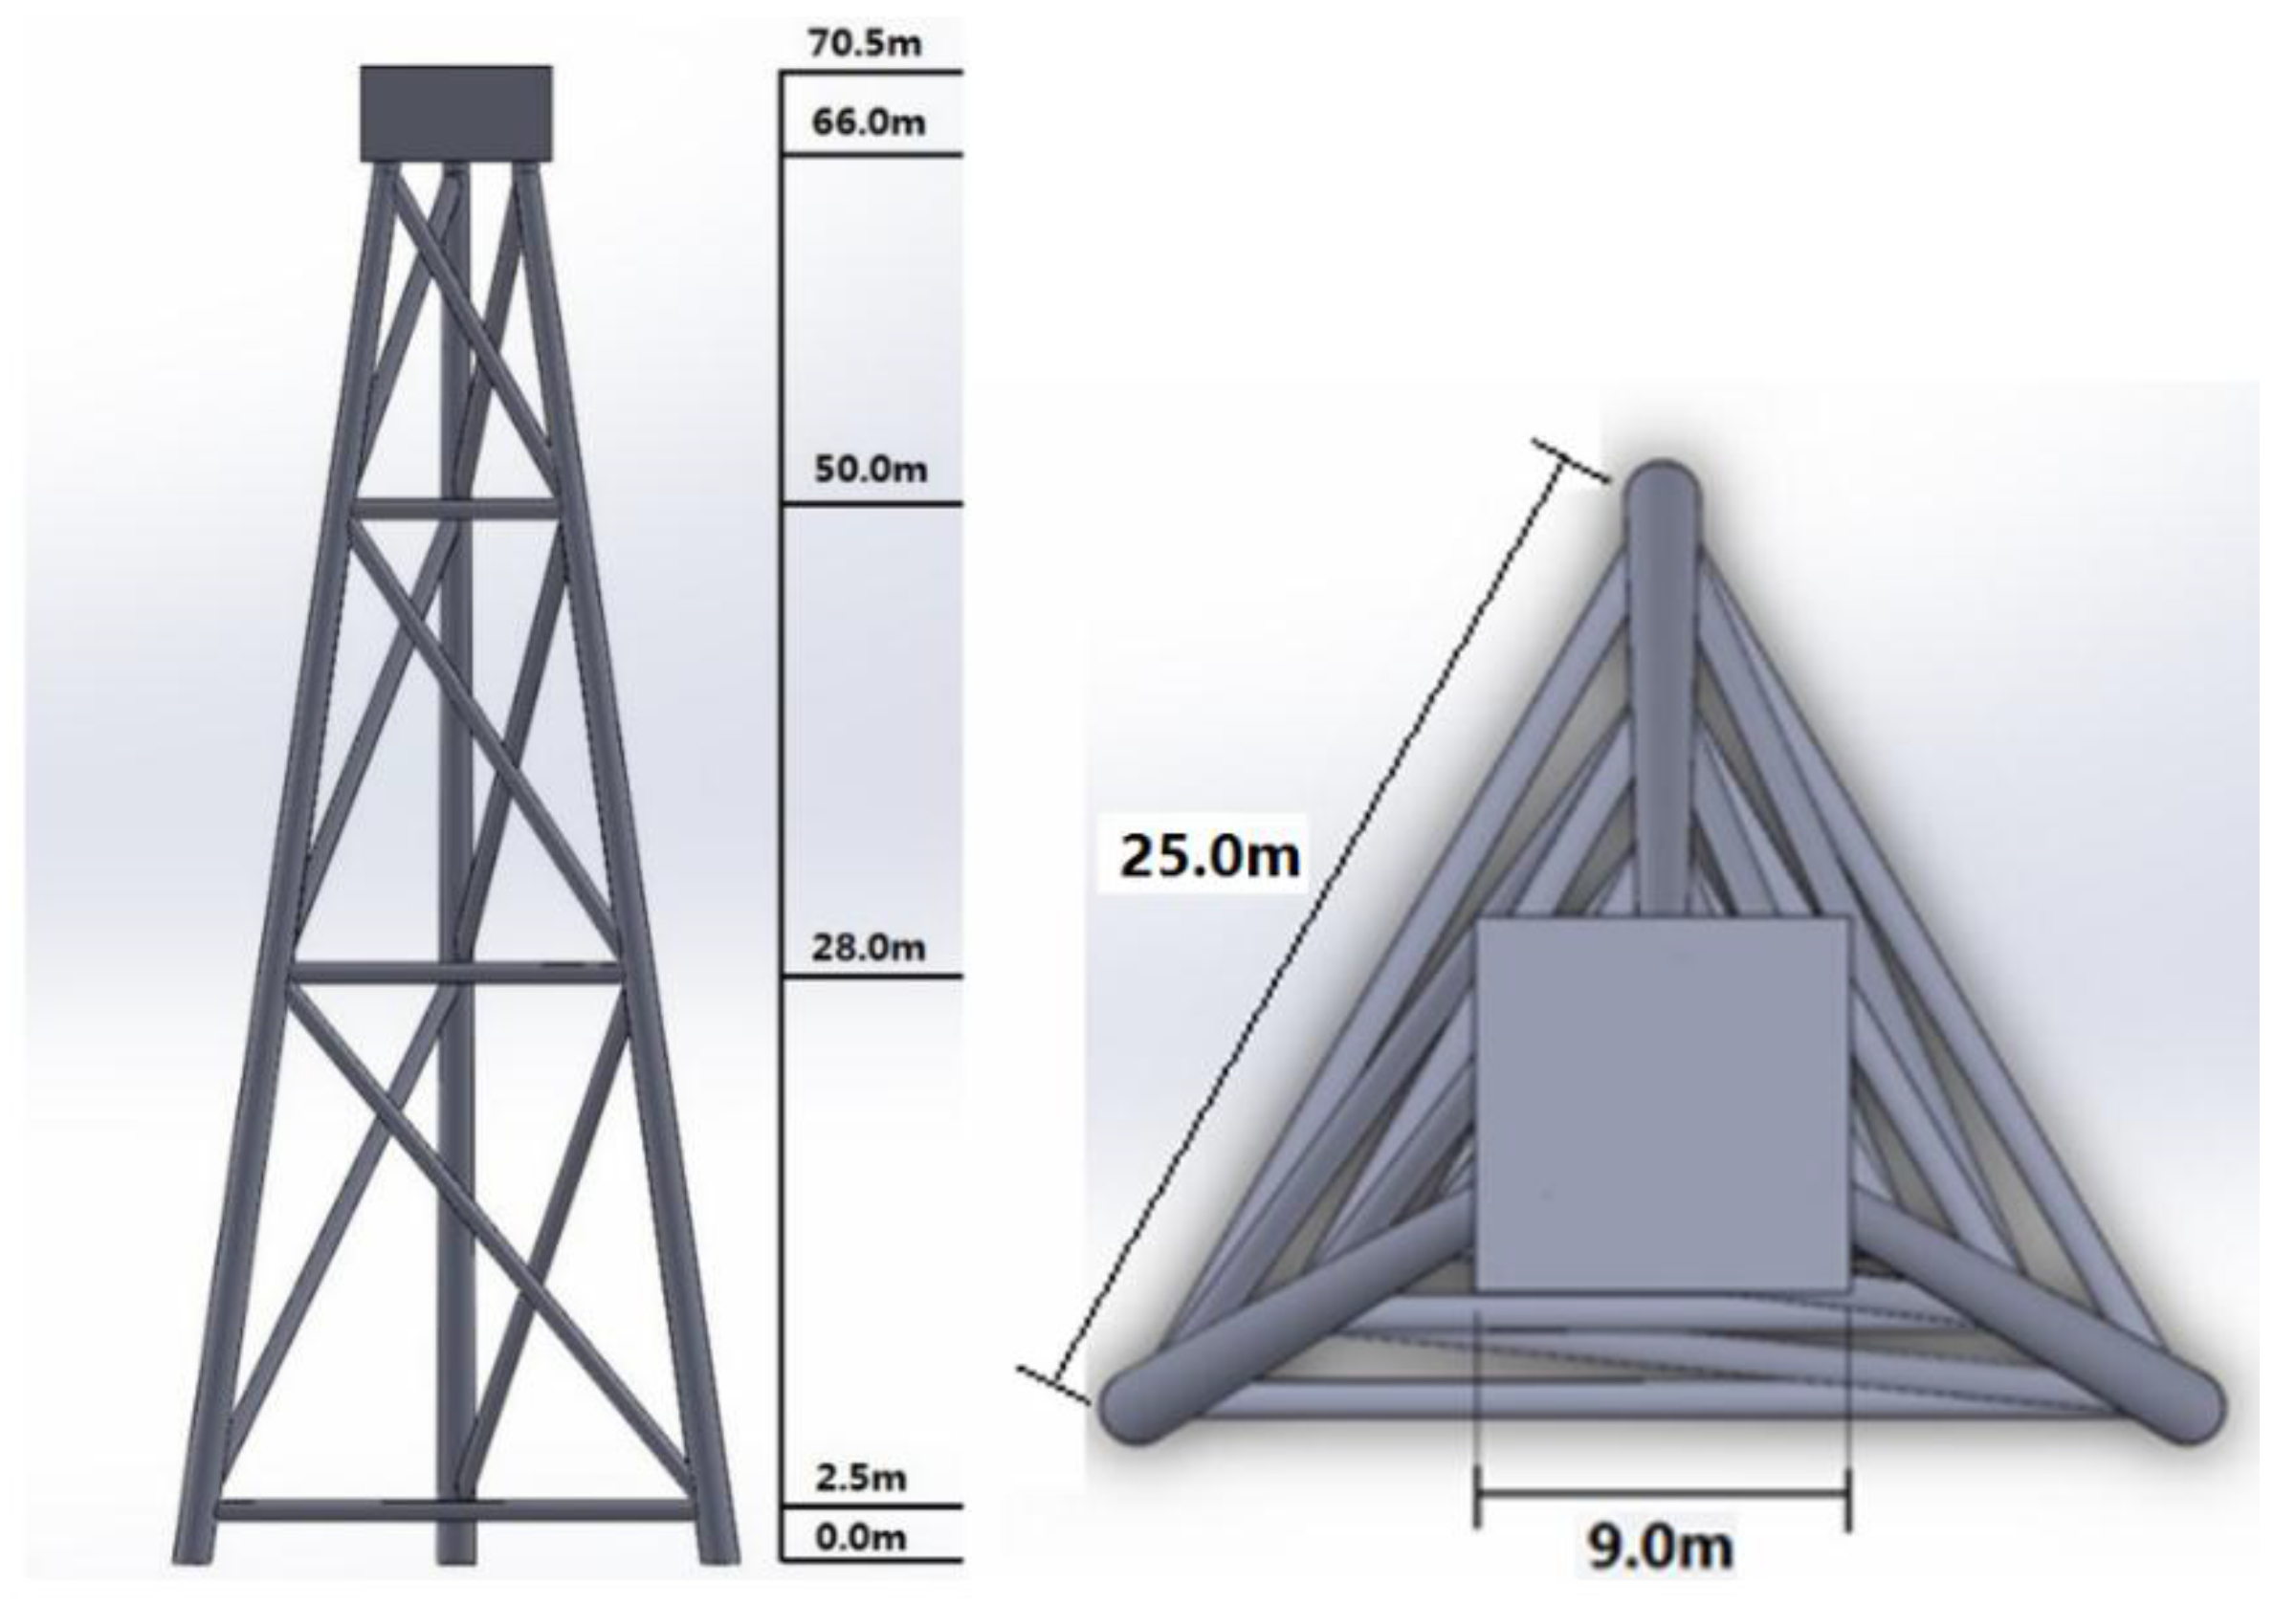
A.4. Twisted-Tripod Jacket Substructure (MJ-Structure)

The terminology of the MJ-structure members is shown in Figure A8. Four MJ-structures were designed: 0° tripod (MJ0), 30° tripod (MJ30), 60° tripod (MJ60) and 90° tripod (MJ90). The definition of the twisted angle for the MJ-structures is the same as that for the TJ-structures. The dimensions of the MJ-structures are listed in Table A4. The side and top views of the MJ-structure are shown in Figure A9 (MJ60 structure shown as an example).
Figure A8. Terminology of the structural members of an MJ-structure.
Energies 09 00264 g015
Table A4. Specification of four MJ-structures.
Twisted Tripod Jacket Substructure (MJ)
Jacket TypeMJ0MJ30MJ60MJ90
Total Height66.00 m66.00 m66.00 m66.00 m
Length of Leg66.86 m66.97 m67.28 m67.68 m
Length of Top Brace17.23 m17.15 m16.93 m16.63 m
Length of Middle Brace50.85 m51.10 m51.12 m50.89 m
Length of Top Horizontal Brace11.07 m10.70 m9.61 m7.87 m
Length of Bottom Horizontal Brace24.41 m24.38 m24.32 m24.16 m
Thickness of Horizontal Brace 0.03 m0.03 m0.03 m0.03 m
Thickness of Top Brace0.06 m0.06 m0.06 m0.06 m
Thickness of Middle Brace0.06 m0.06m0.06 m0.06 m
Thickness of Leg 0.04 m0.04 m0.04 m0.04 m
Diameter of Horizontal Brace0.90 m0.90 m0.90 m0.90 m
Diameter of Top Brace0.90 m0.90 m0.90 m0.90 m
Diameter of Middle Brace1.20 m1.20 m1.20 m1.20 m
Diameter of Leg1.80 m1.80 m1.80 m1.80 m
Figure A9. Side and top views of the 60° tripod (MJ60) structure.
Energies 09 00264 g016

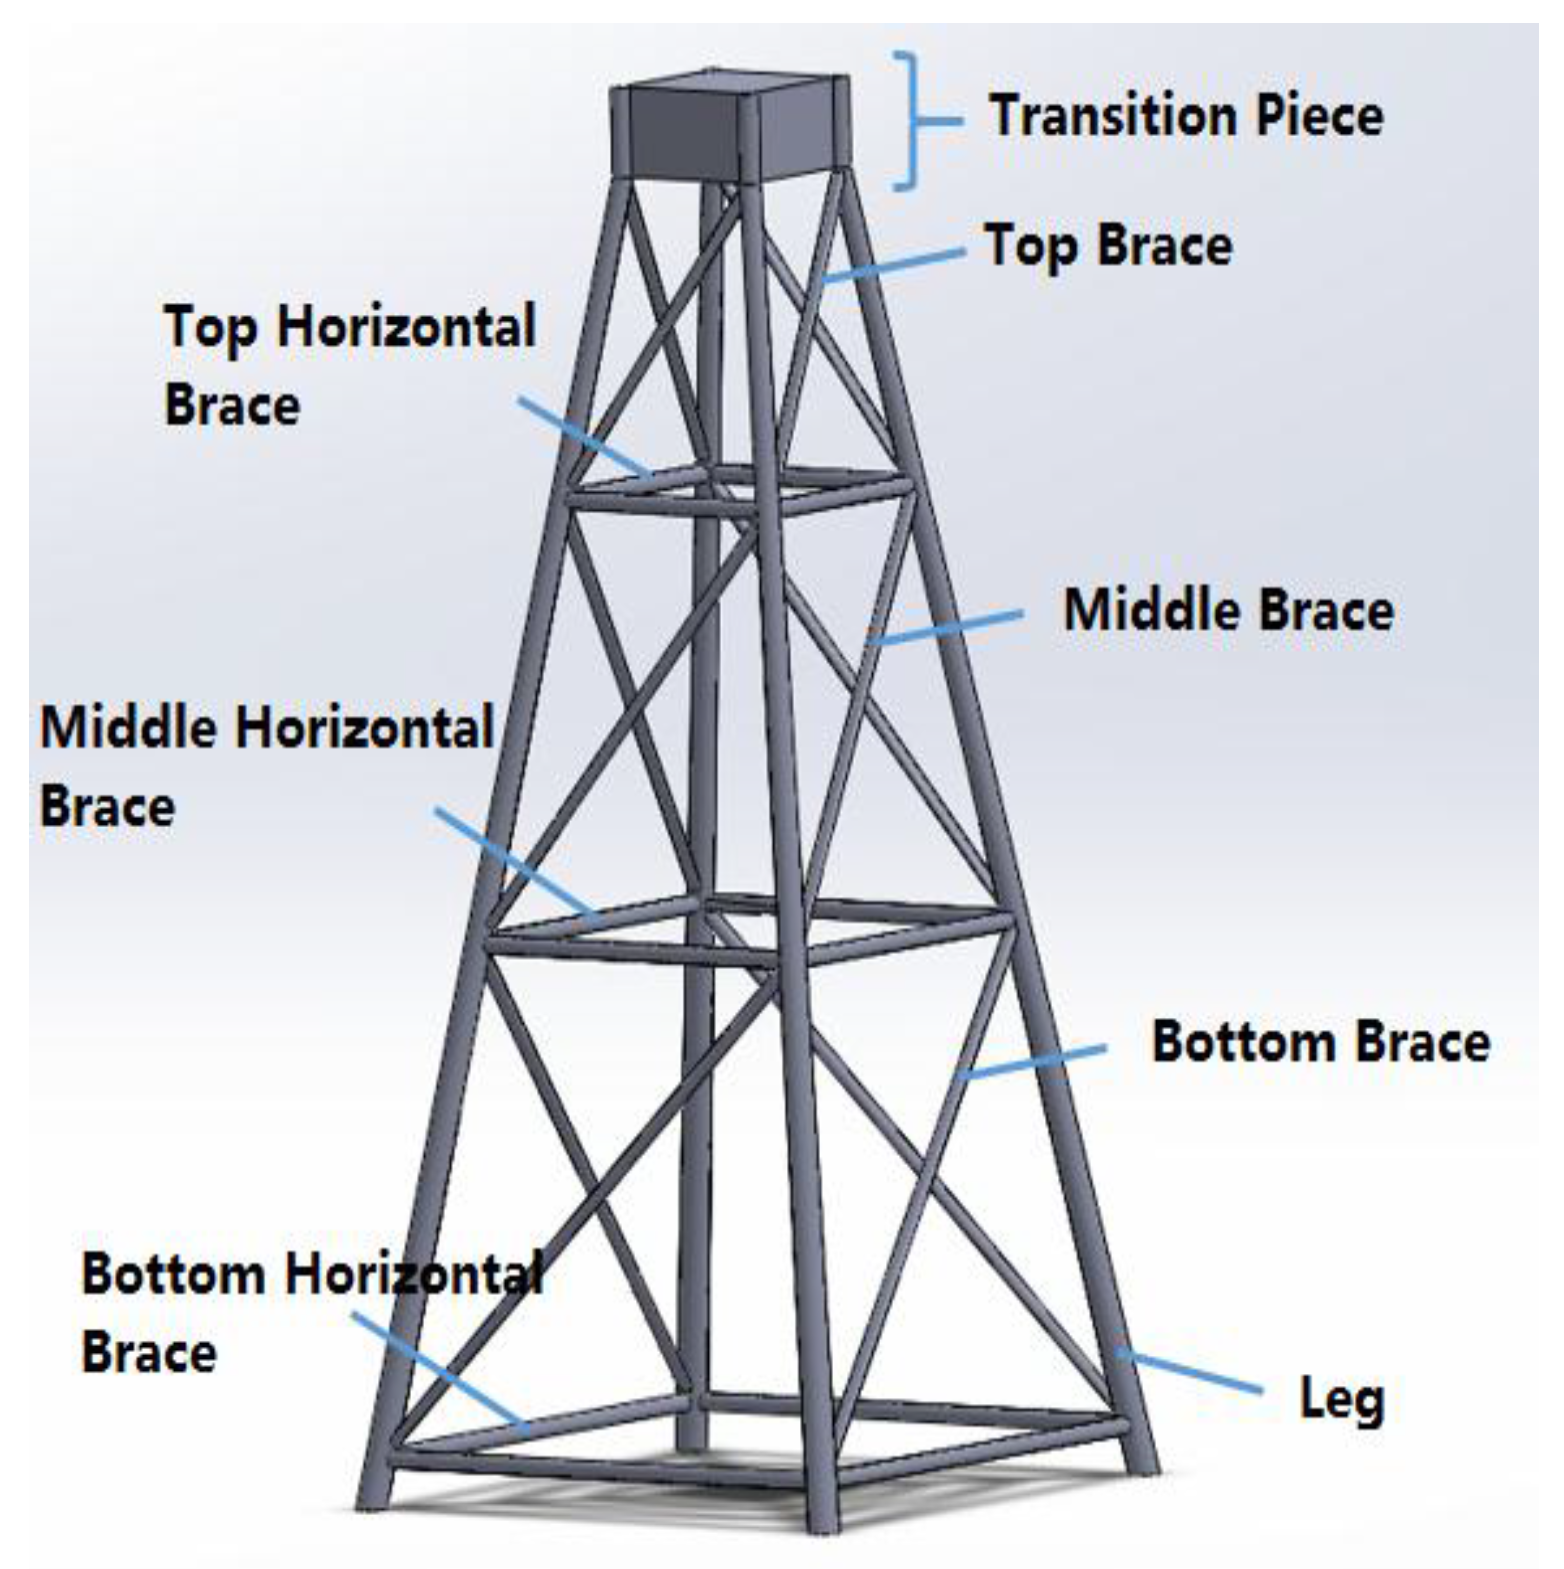
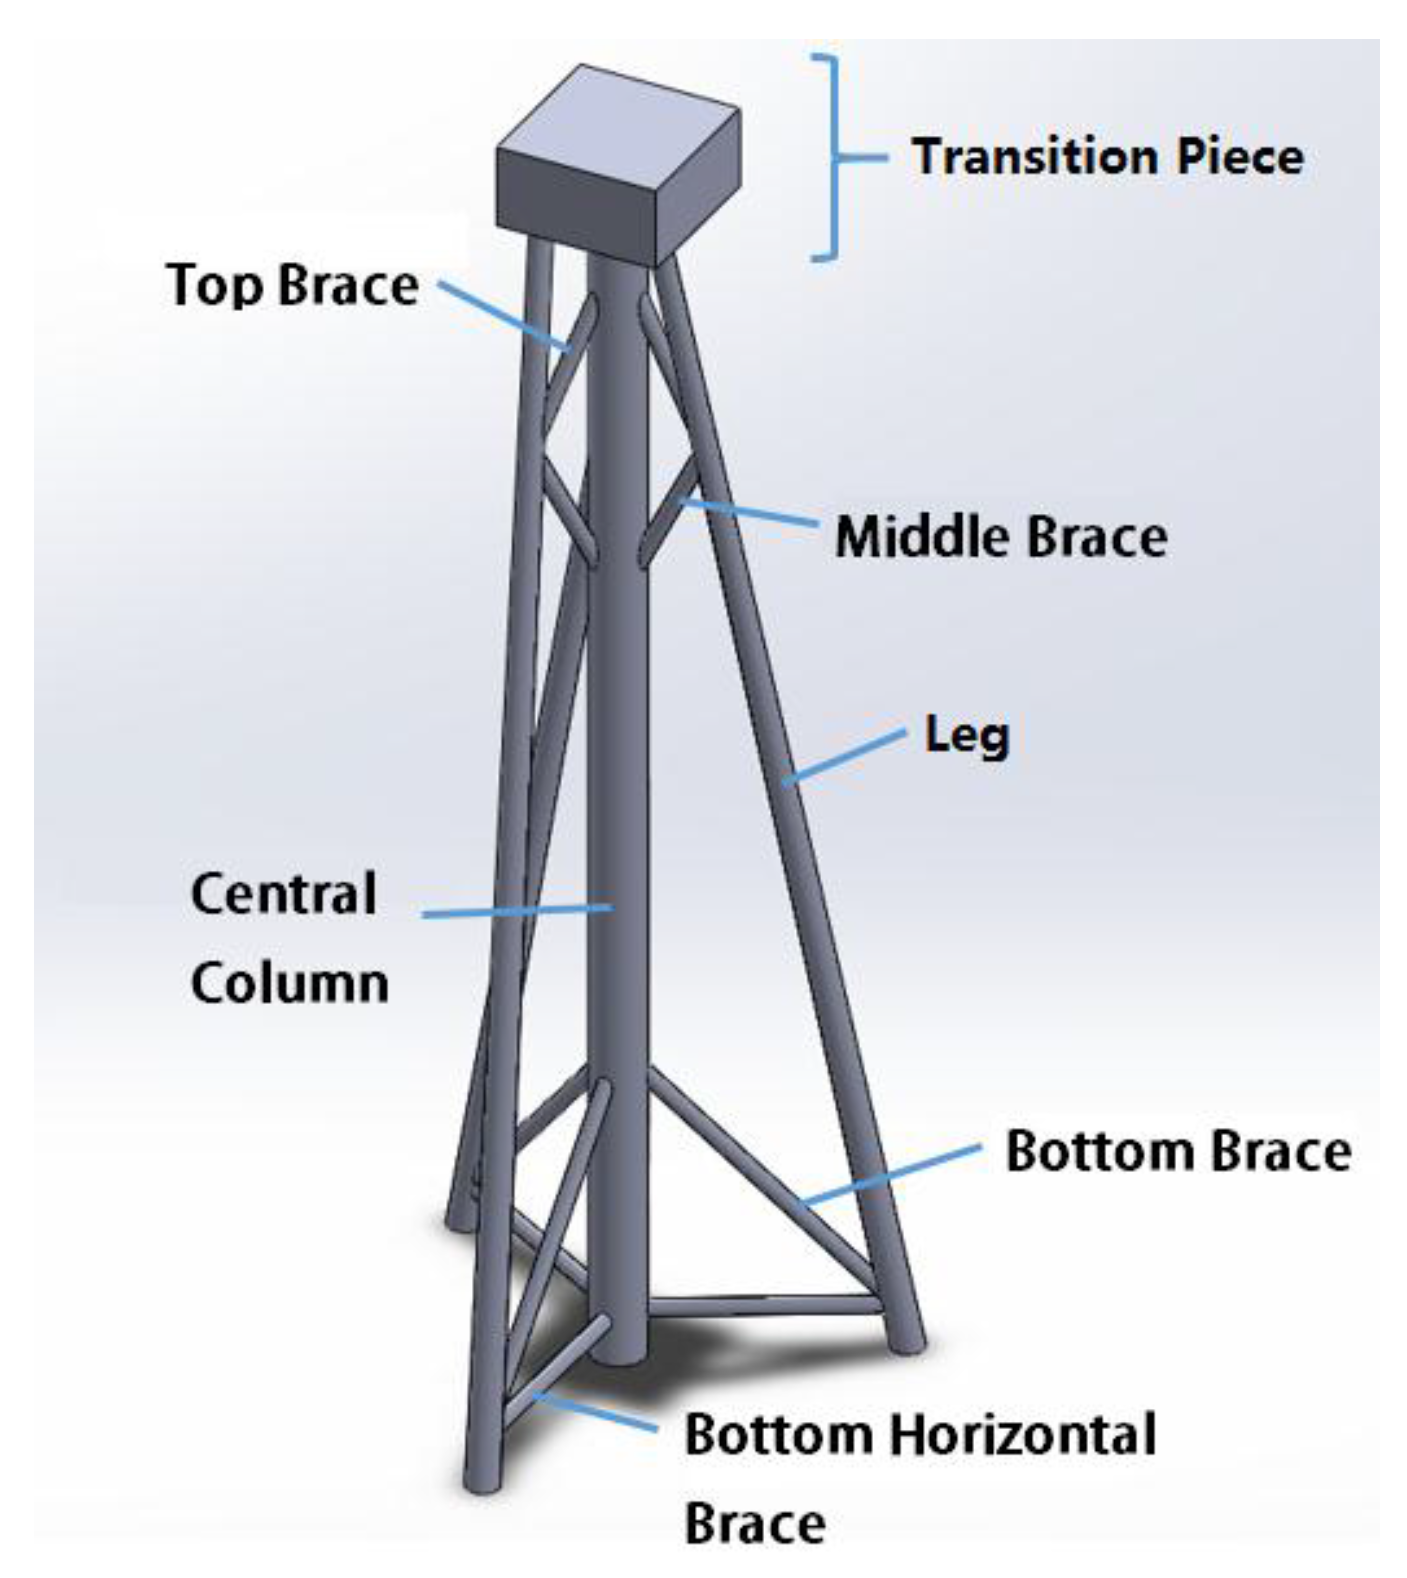
Appendix B. Definitions and Examples of the Terminology for Jacket Structural Members and Parts

Abbreviations were defined at four levels: (1) α , (2) β , (3) γ and (4) δ . Members and parts were termed in the order of α β γ , and the parts (location) of the members were termed α β γ δ (Table 1). Examples are given for all four types of substructures.
Abbreviations of the first two levels for all four types of substructures are shown in Figure A10, Figure A11, Figure A12 and Figure A13. For instance, “I” is the face normal to the positive x-axis, and others are defined accordingly in the clockwise manner; Level β is defined from top to bottom. A number of examples to abbreviate a member or a part of the structure are given in the figures, as well.
It is noted that because of their special design, the TJ-structures are given for a few specific abbreviations that are not used for other structures. For example, structural members and parts of the TJ-structures do not require an abbreviation for the three faces. Instead, the legs and central column require specific abbreviations at Level α . In addition, “U, I, D” are abbreviated for members at particular positions (Figure A11).
Figure A10. Four levels of abbreviations and examples used for J-structure members and parts.
Energies 09 00264 g017
Figure A11. Four levels of abbreviations and examples used for TJ-structure members and parts.
Energies 09 00264 g018
Figure A12. Four levels of abbreviations and examples used for PJ-structure members and parts.
Energies 09 00264 g019
Figure A13. Four levels of abbreviations and examples used for MJ-structure members and parts.
Energies 09 00264 g020

Appendix C. Detailed Description of Load Settings

C.1. General Information

The normal condition considered refers to local oceanographic data collected near Pescadores Islands (Penghu). Annual average wind speed, average wave height, average wave period and average speed of ocean currents were set to 7.5 m/s, 0.49 m, 7.5 s and 0.134 m/s, respectively, for the normal condition [32]. In this load combination, we simply assumed that the wind, wave and current loads act in the same horizontal direction and that the resultant forces and moment are solely in-plane (Figure A14). The extreme condition considered assumes the wind speed, wave height, wave period and speed of ocean currents equal to 70 m/s, 14.88 m, 12.47 s and 1.4 m/s, respectively.
Figure A14. Schematic showing the in-plane winds and waves in the same direction.
Energies 09 00264 g021

C.2. Wind Load

The wind forces on blades and on a unit height of a tower are expressed by F1 and f2, respectively (Figure A15a). The resulting base shear and the base overturning moment are given by Equations (A1) and (A2) [36].
F = F 1 + 0 H f 2 ( z ) d z = 1 2 ρ a i r U H 2 C f A + 0 H 1 2 ρ a i r U ( z ) 2 C D D ( z ) z d z
M = F 1 H + 0 H f 2 ( z ) z d z = 1 2 ρ a i r U H 2 C f A H + 0 H 1 2 ρ a i r U ( z ) 2 C D D ( z ) z d z
where H is the height from the ground to the center of the hub, ρ a i r is the air density, UH is the mean wind speed at the height, Cf is the wind force coefficient for the blades, CD is the drag force coefficient for the tower, A is the reference area for the blades, D(z) is the diameter of the tower and z is the height of the tower. In Equation (A1), the integrated thrust force acting on the complete rotor was considered (denoted F1), while the drag force acting on the tower was considered as a distributed force shown in the second term. The profile of the wind force on the tower can be assumed to be any function. In Equations (A1) and (A2), that is assumed to the same as the velocity pressure at the height z.
The governing equations to describe the airflow around a stationary wind turbine are described by the time-averaged continuity and momentum equations together with a k-ω turbulence model, where the flow solver StarCCM+ is employed to calculate the fully-three-dimensional flow around the wind turbine at the wind speed of 70 m/s. The corresponding wind loading is given in Table A5, where the coordinate system and the force/moment definition are depicted in Figure A15b.
Figure A15. (a) Schematic of planar wind forces on a wind turbine [36]; (b) schematic of 3D wind load settings.
Energies 09 00264 g022
Table A5. Comprehensive (3D) wind loads under the extreme condition.
Wind SpeedComponentFxFyFzQLoQLaQv
70 m/sBlade−38.948 kN−118.5 kN411.21 kN13.89 MN-m5.38 MN-m0.849 MN-m
Nacelle−5.177 kN−10.226 kN0.405 kN0.975 MN-m−0.454 MN-m6.556 kN-m
Tower261.2 MN−315.11 kN37.953 kN11.397 MN-m4.705 MN-m−1.354 kN-m

C.3. Wave and Current Loads

The sectional force dfN on a fixed slender structure in 2D flow normal to the member axis is given by Morison’s load formula [30,31]:
d f N ( t ) = ρ ( 1 + C A ) A v ˙ + 1 2 ρ C D D v | v |
where:
  • v = fluid particle (waves and/or current) velocity (m/s)
  • v ˙ = fluid particle acceleration (m/s2)
  • A = cross-sectional area (m2)
  • D = diameter or typical cross-sectional dimension (m)
  • ρ = mass density of fluid (kg/m3)
  • C A = added mass coefficient (with cross-sectional area as the reference area)
  • C D = drag coefficient
The mass coefficient is then defined as
 C M = 1 + C A . Wave and current loads for the simplified (2D) case were calculated using Morison’s equation and Airy’s linear theory and assumed in-plane motion as depicted in Figure A14. For the wave load, the drag force was neglected for simplicity, so that only the first term (the inertia force) on the right-hand side of Equation (A3) was taken into consideration. For the current load, on the other hand, the inertia force was neglected. For instance, the wave load is given by:
d f w a v e = ρ C M A v ˙
where the maximum magnitude of the sinusoidal fluid particle acceleration, v ˙ m a x = 4 π 2 a T 2 exp ( 4 π 2 g T 2 z ) , was considered in Equation (A4) for static analysis. The wave load therefore assumed the form:
d f w a v e ( z ) = ρ C M A 4 π 2 a T 2 exp ( 4 π 2 g T 2 z )
where z = 0 is the location at sea level, z = −Dw is at the sea bed, a is the wave height, T is the wave period and g is the gravitational acceleration.
The wave load was further assumed constant, for simplicity, from the sea level to the depth dc. The depth, dc, and the amplitude of the constant wave load, dfavg, were obtained, so that the resultant wave force of the constant load (equal to d f w a v e · d c ) is identical to that of the load from the linear theory. Hence:
d c 2 = D w a z · d f w a v e ( z ) d z D w a d f w a v e ( z ) d z
d f a v g = D w a d f w a v e ( z ) d z | d c |
The wave and current loads for the comprehensive (3D) case were calculated using Morison’s equation and the nonlinear immediate-depth fifth-order Stokes’ wave theory. For the three-legged structures (all structures, except J-structures), the wave and current loads were applied in the principal direction, whereas for the four-legged structures (J-structures in this study), these loads were applied in the diagonal direction. For comprehensive understanding of Morison’s equations for determining the wind, wave and current loads on circular cylindrical structural members of fixed offshore structures, the readers are referred to [37,38].

C.4. Calculated Loads for Simulations

Consider the mass density of the air to be 1.293 kg/m3, that of the water 1000 kg/m3, the drag coefficient 0.9 and the mass coefficient 1.0. The calculated simplified (2D) loads were as follows: the self-weight of the baseline wind turbine machine and tower is 1.859 MN; the side wind load is 16.644 kN; the wind load moment is 733.584 kN-m; the wind load is 32.73D N/m, the wave load 200.38A N/m and the current load 8.08D N/m (Figure A16), where D and A are the diameter and the cross-sectional area of the tubular structural members, respectively. Here, the wind, wave and current loads are distributed loads for the beam element models. Moreover, the comprehensive (3D) loads were as follow: the self-weight of the baseline wind turbine machine and tower is 1.859 MN; wind loads are given in Table A5; wave loads are complex and various at different locations, so they are not specified in the Appendix C.
Figure A16. Schematic of the simplified (2D) loads for jacket substructures.
Energies 09 00264 g023

References

  1. Li, K.; Bian, H.; Liu, C.; Zhang, D.; Yang, Y. Comparison of geothermal with solar and wind power generation systems. Renew. Sustain. Energy Rev. 2015, 42, 1464–1474. [Google Scholar] [CrossRef]
  2. Dai, K.; Bergot, A.; Liang, C.; Xiang, W.N.; Huang, Z. Environmental issues associated with wind energy—A review. Renew. Energy 2015, 75, 911–921. [Google Scholar] [CrossRef]
  3. Baker, C. Wind engineering—Past, present and future. J. Wind Eng. Ind. Aerodyn. 2007, 95, 843–870. [Google Scholar] [CrossRef]
  4. Kaldellis, J.K.; Zafirakis, D. The wind energy (r) evolution: A short review of a long history. Renew. Energy 2011, 36, 1887–1901. [Google Scholar] [CrossRef]
  5. Global Wind Energy Concil (GWEC). Global Wind Report—Annual Market Update 2014; Global Wind Energy Concil: Brussels, Belgium, 2015. [Google Scholar]
  6. The European Wind Energy Association (EWEA). The European Offshore Wind Industry—Key Trends and Statistics 1st half 2015; The European Wind Energy Association: Brussels, Belgium, 2015. [Google Scholar]
  7. Vries, W.E. Assessment of Bottom-Mounted Support Structure Types with Conventional Design Stiffness and Installation Techniques for Typical Deep Water Sites; Deliverable Report D4.2.1 (WP4: Offshore foundation and support structures); The European Wind Energy Association: Brussels, Belgium, 2007. [Google Scholar]
  8. Lesny, K.; Richwien, W. Design, Construction and Installation of Support Structures for Offshore. Wind Energy Systems Global Wind Report—Annual Market Update Optimising Design and Construction for Safe and Reliable Operation; Sørensen, J.D., Sørensen, J.N., Eds.; Woodhead Publishing Limited: Cambridge, UK, 2010. [Google Scholar]
  9. Golightly, C. Tilting of monopiles long, heavy and stiff; pushed beyond their limits. Available online: http://www.nce.co.uk/Journals/2014/06/03/z/h/d/GE-January-2014-Tilting-of-monopiles-Golightly.pdf (accessed on 17 January 2016).
  10. Kaldellis, J.K.; Zafirakis, D.P. Trends, prospects, and R&D directions in wind turbine technology. Compr. Renew. Energy 2012, 2, 671–724. [Google Scholar]
  11. Musial, W.; Butterfield, S.; Ram, B. Energy from offshore wind. In Proceedings of the Offshore Technology Conference (NREL/CP-500–39450), Houston, TX, USA, 1–4 May 2006.
  12. Pérez-Collazo, C.; Greaves, D.; Iglesias, G. A review of combined wave and offshore wind energy. Renew. Sustain. Energy Rev. 2015, 42, 141–153. [Google Scholar] [CrossRef]
  13. Moné, C.; Smith, A.; Maples, B.; Hand, M. 2013 Cost of Wind Energy Review; National Renewable Energy Laboratory (NREL): Golden, CO, USA, 2015.
  14. Gong, W. Lattice Tower Design of Offshore Wind Turbine Support Structures. Master’s Thesis, Norwegian University of Science and Technology, Trondheim, Norway, June 2011. [Google Scholar]
  15. Fenech, L.; Sant, T.; Muscat, M. Design and cost evaluation of a deep water support structure for a wind turbine in central mediterranean waters. In Proceedings of the European Wind Energy Conference, Brussels, Belgium, 14–17 March 2011.
  16. Shi, W.; Park, H.C.; Chung, C.W.; Kim, Y.C. Comparison of dynamic response of monopole, tripod and jacket foundation system for a 5-MW wind turbine. In Proceedings of the 21th International Offshore and Polar Engineering Conferenece, Maui, HI, USA, 19–24 June 2011.
  17. Seidel, M. Jacket substructures for the REpower 5M wind turbine. In Proceedings of the Conference European Offshore Wind 2007, Berlin, Germany, 4–6 December 2007.
  18. Shi, W.; Park, H.; Chung, C.; Baek, J.; Kim, Y.; Kim, C. Load analysis and comparison of different jacket foundations. Renew. Energy 2013, 54, 201–210. [Google Scholar] [CrossRef]
  19. Sun, X. Structure form selection of wind turbine towers. Sciencepaper Online, 2013. Available online: http://www.paper.edu.cn/download/downPaper/201302-190 (accessed on 14 January 2016).
  20. Shi, W.; Park, H.; Han, J.; Na, S.; Chang, W. A study on the effect of different modeling parameters on the dynamic response of a jacket-type offshore wind turbine in the Korean southwest sea. Renew. Energy 2013, 58, 50–59. [Google Scholar] [CrossRef]
  21. Alanjari, P.; Asgarian, B.; Bahaari, M.R.; Honarvar, M.R. On the energy dissipation of jacket type offshore platforms with different pile–leg interactions. Appl. Ocean Res. 2009, 31, 82–89. [Google Scholar] [CrossRef]
  22. Alanjari, P.; Asgarian, B.; Kia, M. Nonlinear joint flexibility element for the modeling of jacket-type offshore platforms. Appl. Ocean Res. 2011, 33, 147–157. [Google Scholar] [CrossRef]
  23. Hall, R.A.; Shaw, R.L. Offshore Structure Support. U.S. Patent 7,942,611 B2, 17 May 2011. [Google Scholar]
  24. Hall, R.A. Offshore Support Structure and Associated Method of Installing. U.S. Patent 8,511,940 B2, 20 August 2013. [Google Scholar]
  25. Keystone Keystone Engineering Inc., Inward Battered Guide Structure—The “Twisted Jacket”, Keystone Engineering IBGS brochure 2.0, 2015. Available online: http://issuu.com/keystoneengineering/docs/ibgs_brochure_2.0/5?e=0/10933386 (accessed on 9 January 2016).
  26. Li, P. Analysis and Design of Offshore Jacket Wind Turbine. Master’s Thesis, Norwegian University of Science and Technology, Trondheim, Norway, June 2010. [Google Scholar]
  27. Jonkman, J.M.; Butterfield, S.; Musial, W.; Scott, G. Definition of a 5-MW reference wind turbine for offshore system development. National Renewable Energy Laboratory 2009, 1. [Google Scholar] [CrossRef]
  28. Vries, W.D.; Vemula, N.K.; Passon, P.; Fischer, T.; Kaufer, D.; Matha, D. Support Structure Concepts for Deep Water Sites: Deliverable D4.2.8 (WP4: offshore foundations and support structures); The European Wind Energy Association: Brussels, Belgium, 2011. [Google Scholar]
  29. Chew, K.H.; Ng, E.Y.K.; Tai, K. Offshore wind turbine jacket substructure: A comparison study between four-legged and three-legged designs. J. Ocean Wind Energy 2014, 1, 77–81. [Google Scholar]
  30. Det Norske Veritas—Germanischer Lloyd (DNV GL). Recommended Practice DNV-OS-J101—Design of Offshore Wind Turbine Structures; DNV GL: Høvik, Norway, 2014. [Google Scholar]
  31. Det Norske Veritas—Germanischer Lloyd (DNV GL). Recommended Practice DNV-RP-C201—Environmental Conditions and Environmental Loads; DNV GL: Høvik, Norway, 2010. [Google Scholar]
  32. Su, C.H.; Liaw, C.T. Oceanographical Observation Data—Annual Report 2011 (Penghu Harbor); Harbor & Marine Technology Center: Taipei, Taiwan, 2013. [Google Scholar]
  33. Menter, F.R. Two-equation eddy-viscosity turbulence modeling for engineering applications. AIAA J. 1994, 32, 1598–1605. [Google Scholar] [CrossRef]
  34. Abaqus 6.14. Abaqus Analysis User’s Guide; Dassault Systèmes Simulia Corp.: Providence, RI, USA, 2015. [Google Scholar]
  35. N-004 Design of Steel Structures (Rev 3). Available online: https://www.standard.no/en/sectors/energi-og-klima/petroleum/norsok-standard-categories/n-structural/n-0042/ (accessed on 1 August 2015).
  36. Kawai, H.; Michishita, K.; Deguchi, A. Design Wind Loads on a Wind Turbine for Strong Wind, Proceedings of the BBAA VI International Colloquium on: Bluff Bodies Aerodynamics & Applications, Milano, Italy, 20–24 July 2008.
  37. Morison, J.R. The Force Distribution Exerted by Surface Waves on Piles; University of California: Berkeley, CA, USA, 1950. [Google Scholar]
  38. Faltinsen, O.M. Sea Loads on Ships and Offshore Structures, 1st ed.; Cambridge University Press: Cambridge, UK, 1990; pp. 174–256. [Google Scholar]
Figure 1. (a) Traditional jacket substructures (J-structures): Z-braces (JZ), K-braces (JK) and X-braces (JX); (b) twisted jacket substructures (TJ-structures): 0° twisted (TJ0), 30° twisted (TJ30), 60° twisted (TJ60) and 90° twisted (TJ90); (c) tripod jacket substructures (PJ-structures): Z-tripod (PJZ), K-tripod (PJK) and X-tripod (PJX); (d) twisted-tripod jacket substructures (modified jacket (MJ)-structures): 0° tripod (MJ0), 30° tripod (MJ30), 60° tripod (MJ60) and 90° tripod (MJ90).
Energies 09 00264 g001
Figure 2. (a) Schematic of a scaled-down test specimen of the MJ0-structure; (b) snapshot of the experimental setup.
Energies 09 00264 g002
Figure 3. After compression deformation patterns of the scaled-down (a) experimental test specimens and (b) the numerical model; (c) a diagram of the load-displacement test results from unstable collapse and postbuckling analysis.
Energies 09 00264 g003
Figure 4. Comparison charts of all 14 jacket structures showing: (a) maximum and critical loads, and; (b) the corresponding displacements under unstable collapse and postbuckling analysis.
Energies 09 00264 g004
Figure 5. A load-displacement diagram (of the JX-structure) showing the example of the maximum load with the corresponding vertical displacement on the top of the structure (119.5 MN, 142.0 mm) and the critical load with the corresponding vertical displacement (113.1 MN, 76.8 mm) defined for a full-scale model.
Energies 09 00264 g005
Figure 6. A bar chart showing the maximum criteria for 14 substructures using local buckling strength analysis under the extreme condition with comprehensive (3D) loads.
Energies 09 00264 g006
Figure 7. Comparison charts of all 14 jacket structures showing: (a) the ratio of the weight to height; (b) the number of joints; (c) the ratio of joint numbers to floor numbers.
Energies 09 00264 g007
Table 1. Abbreviations for jacket structure members and parts.
LevelAbbreviationDefinition
α I, II, III, IVFirst, second, third and fourth face
a, b, c, dLeg member
eCentral vertical member (for TJ-structures only)
β 1, 2, 3, 4First, second, third and fourth layer counting from the top
γ \ and /Oblique member with “\” and “/” orientation
-Horizontal member (“-“ orientation)
U, I, DUpper, middle and lower oblique member (for TJ-structures only)
NParticularly for leg members
δ T, B, M, R, LTop, bottom, middle, right and left part
Table 2. List of maximum von Mises stresses for 14 substructures under various load settings (denoted (0) and denoted (45)) represent the principal and diagonal directions, respectively).
Jacket Type (Wave, Current Directions)Normal Condition + 2DExtreme Condition + 3D
Max. von Mises Stress (MPa)LocationMax. von Mises Stress (MPa)Location
JZ (0)18.48a4NBN/AN/A
JK (0)19.81a4NBN/AN/A
JX (0)21.15a4NBN/AN/A
JZ (45)N/AN/A32.60II3/M
JK (45)N/AN/A32.05b4NB
JX (45)N/AN/A35.02III3\T and IIII3/T
TJ017.10a3NB32.84a3NB
TJ3018.53a3NB37.26a3NT
TJ6018.84a3NB37.59a2DB
TJ9019.31b3NB46.24a2IT
PJZ20.11a4NB39.55I3/M
PJK21.65a4NB39.30I3/B
PJX22.47a4NB32.71I3\T
MJ023.04a3NB45.30c2NM
MJ3030.19a2NT39.83a3NB
MJ6046.53I2-L41.79a2NM
MJ9034.62II2-L39.73a2NM

