Article

Energy Conservation and Emissions Reduction in China’s Power Sector: Alternative Scenarios Up to 2020

1
School of Economics and Management, North China Electric Power University, 2# Beinong Road, Changping District, Beijing 102206, China
2
School of Physics and Electrical Information Engineering, Ningxia University, 217# Wencui Road, Xixia District, Yinchuan 750021, Ningxia, China
3
School of Engineering and Applied Sciences, Harvard University, 29 Oxford St, Cambridge, MA 02138, USA
*
Authors to whom correspondence should be addressed.
Energies 2016, 9(4), 266; https://doi.org/10.3390/en9040266
Submission received: 8 January 2016 / Revised: 22 March 2016 / Accepted: 24 March 2016 / Published: 4 April 2016
(This article belongs to the Special Issue Energy Policy and Climate Change 2016)

Abstract

:
This paper discusses energy conservation and emissions reduction (ECER) in China’s power sector. To better understand China’s successes and failures on energy conservation in the electricity industry, first it is important to know the status of China’s power sector, and the key energy conservation actions, as well as the achievements in the past years. Second, two ECER scenarios are constructed to probe the 2020 energy conservation potential. Results show that the potential is estimated to be more than 240 million tons of coal equivalent (Mtce). Third, the improvement of coal power operations, structures and technologies, and ambitious deployment of energy conservation measures are proposed to fully explore the potential of China’s power industry. Fourth, great challenges for China’s ECER and some suggested policies are summed up. The lessons learnt from China will provide a valuable reference and useful inputs for other emerging economies.

1. Introduction

Due to the characteristics of China’s energy resource attributes, the current power generation mix dominated by coal leads to enormous emissions, which is a key concern for energy conservation and emissions reduction (ECER). There are some papers focused on China’s ECER. Liu et al. analyzed the impact of renewable energy generation in China of greenhouse gas (GHG) reduction [1], and Geng et al. calculated the reduction in polychlorinated dibenzo-p-dioxin and polychlorinated dibenzofuran (PCDD/FS) levels due to the closure of smaller power plants during 2006–2008 [2]. Wen et al. estimated the energy conservation and CO2 emissions abatement potential of China’s non-ferrous metals industry in 2010–2020 [3]. Peng et al. evaluated the energy-saving potential, energy cost savings and carbon dioxide emission reduction in the pulp and paper industry according to the Twelfth Five-year Plan (2011–2015) [4]. Kong et al. applied a conservation supply curve (CSC) method to assess the technical and economic aspects of energy conservation and to evaluate CO2 mitigation potentials in the Chinese pulp and paper industry [5]. Li and Lin calculated the energy saving potentials of four different energy carriers, namely coal, gasoline, diesel oil and electricity, for 27 manufacturing sectors during the period of 1998–2011 in China [6]. Zhao and Chen made a comparison between clean coal technologies (CCTs) with the average level of power generation technology in the potential of GHG reduction [7]. Liu et al. analyzed the effects of ECER on energy efficiency retrofits for existing residence buildings in the northern heating regions of China [8]. Xu et al. quantitatively evaluated the performance of energy conservation and CO2 emissions reduction in the Eleventh Five-Year Plan (2006–2010) [9]. Zhao et al. discussed China’s ECER challenges [10]. There are several papers on China’s ECER, and several papers on ECER in China’s power sector focused on the construction of an evolution indicator system [11,12,13] and policy and technology analyses [14,15,16]. However, detailed quantitative research measuring the energy conservation potential of China’s power sector is rare.
Thus, the purpose of this paper is to discuss the status quo of ECER and to probe the energy conservation potential in the power sector up to 2020. This paper presents the analyses from a global perspective and describes how China’s power sector is different or similar to its Western counterparts. The lessons learnt from China will provide a valuable reference and useful inputs for other emerging economies. The paper is organized as follows: Section 2 briefly presents the status quo on China’s power sector, and compares the situations between China and the U.S. Section 3 discusses the actions and achievements of energy conservation. Section 4 presents a business-as-usual (BAU) scenario and an alternative scenario to probe the energy conservation potential up to 2020. Section 5 concludes the paper with an overview of policy implications.

2. Current Situation of China’s Power Sector and Comparison with U.S.

2.1. The Current Situation of China’s Power Sector

With rapid economic growth, electricity consumption in China will continue to increase for the next 20 years. Now that China’s economy has developed into the “new normal” status, the economic growth is still quite high and the industrial structure is making quick adjustments, so the intense pace of the economy is expected to continue. The electricity elasticity coefficient (EEC) can provide a certain reference to justify the efficiency of economic development. The EEC is the ratio between power consumption growth and the national economy growth. It can be used as a macro parameter to measure whether the development of power industry is adapting to the development of the national economy or not. As many countries are committed to continuously improving their degree of electrification and people's living standards, the power industry development is often faster than the national economic development. Therefore, the EEC is generally larger than 1. However, if benefiting from economic structure transformation and the promotion of energy efficiency, it will be smaller than 1. As far as China is concerned, there is an EEC downturn in the long term, but recently it has been very unstable (Figure 1). Since 2009, with the rapid development of energy-intensive industries, power consumption went up, which caused an EEC greater than 1 during 2010–2011. Then in the second half of 2011, due to the adjustment of the economic structure, as China’s economy development focused more on “quality” rather than “quantity”, the EEC has mainly decreased. It has been down to 0.51 [17] in 2014 and 0.12 [18] in the first quarter of 2015. This indicates that energy saving measures have been effective.
In order to meet the growing electricity demand, the installed capacity dominated by thermal power is still growing in China and the capacity of clean energy is increasing year by year (Figure 2) [19,20,21,22]. The clean energy capacity in China was 30.82% [23] by the end of 2013 and in 2014 it was 32.59% [17]. On a company level, the China Power Group investment was the highest at 34.19%, while the Huadian Group comes second at 30.59% [24]. At the end of 2013, China had the largest power generation capacity in the world, dominated by thermal power, but including 890 TWh from hydro power, 140 TWh from wind power and 112 TWh from nuclear power (Figure 2). In 2015, the total power consumption growth was only 0.5% higher than that of 2014, in which the shares of wind power, nuclear power and hydro power all increased, but thermal power decreased. Despite the fact power consumption in the tertiary industry and residential sectors increased, it was down in the heavy industry sector, especially in several major energy-intensive industries, due to the saturated capacity and weak product demand, so the overall power demand increasing rate was reduced by three percentage points [25] in 2015 compared to 2014. This was the first time the power demand increasing rate actually decreased in the past forty years. Moreover, the average thermal efficiency of power plants improved by nearly five percent points [17,19,20,21,22,23,26] during 2008–2015 (Figure 3).
Though China’s power sector has made some progress in energy savings, coal consumption for power generation in China increased from 40% of coal consumed for all purposes in 2000 to 53% in 2012 (Figure 4) [27] which still leads to ever increasing GHG emissions and poses a great challenge to the ECER.

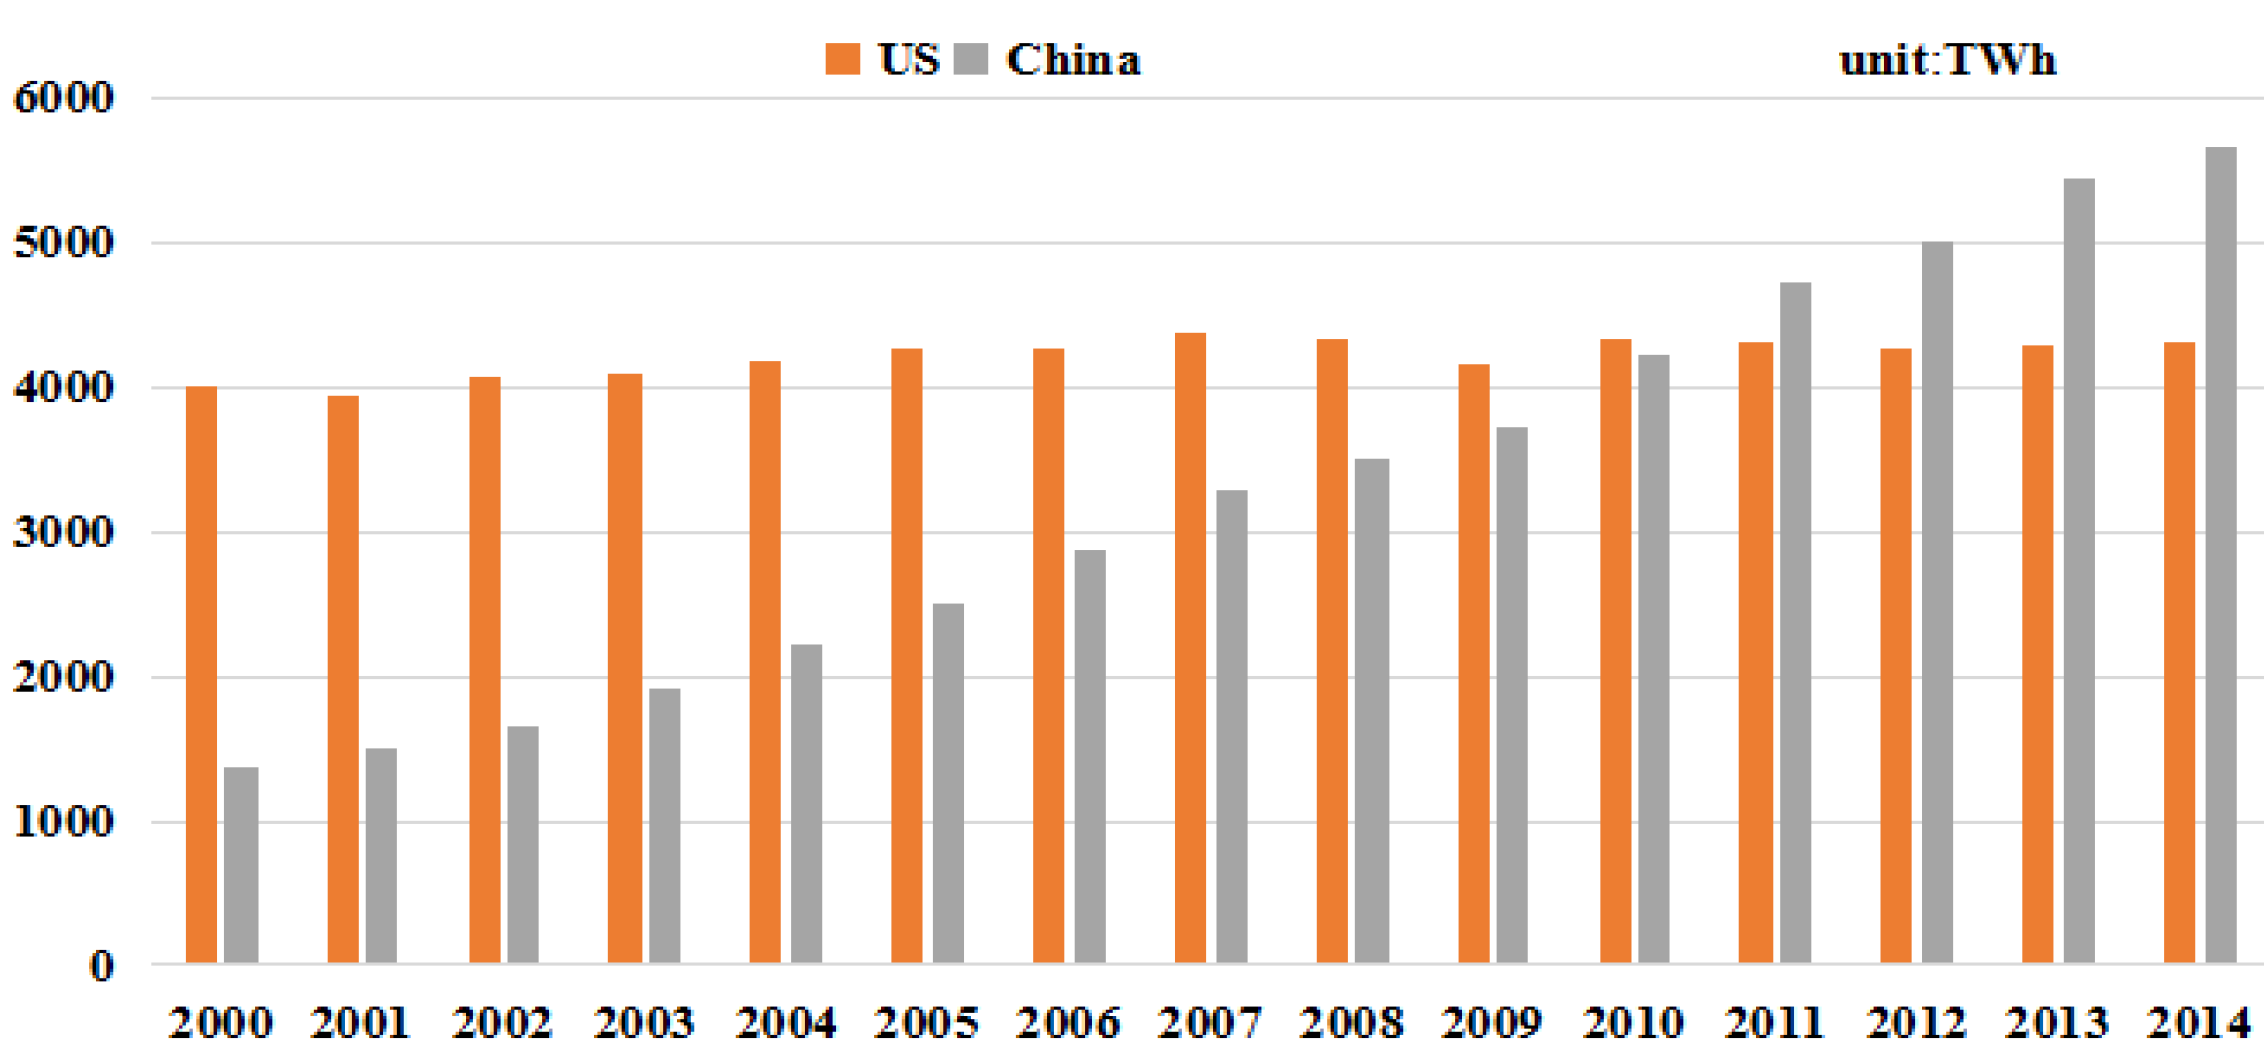
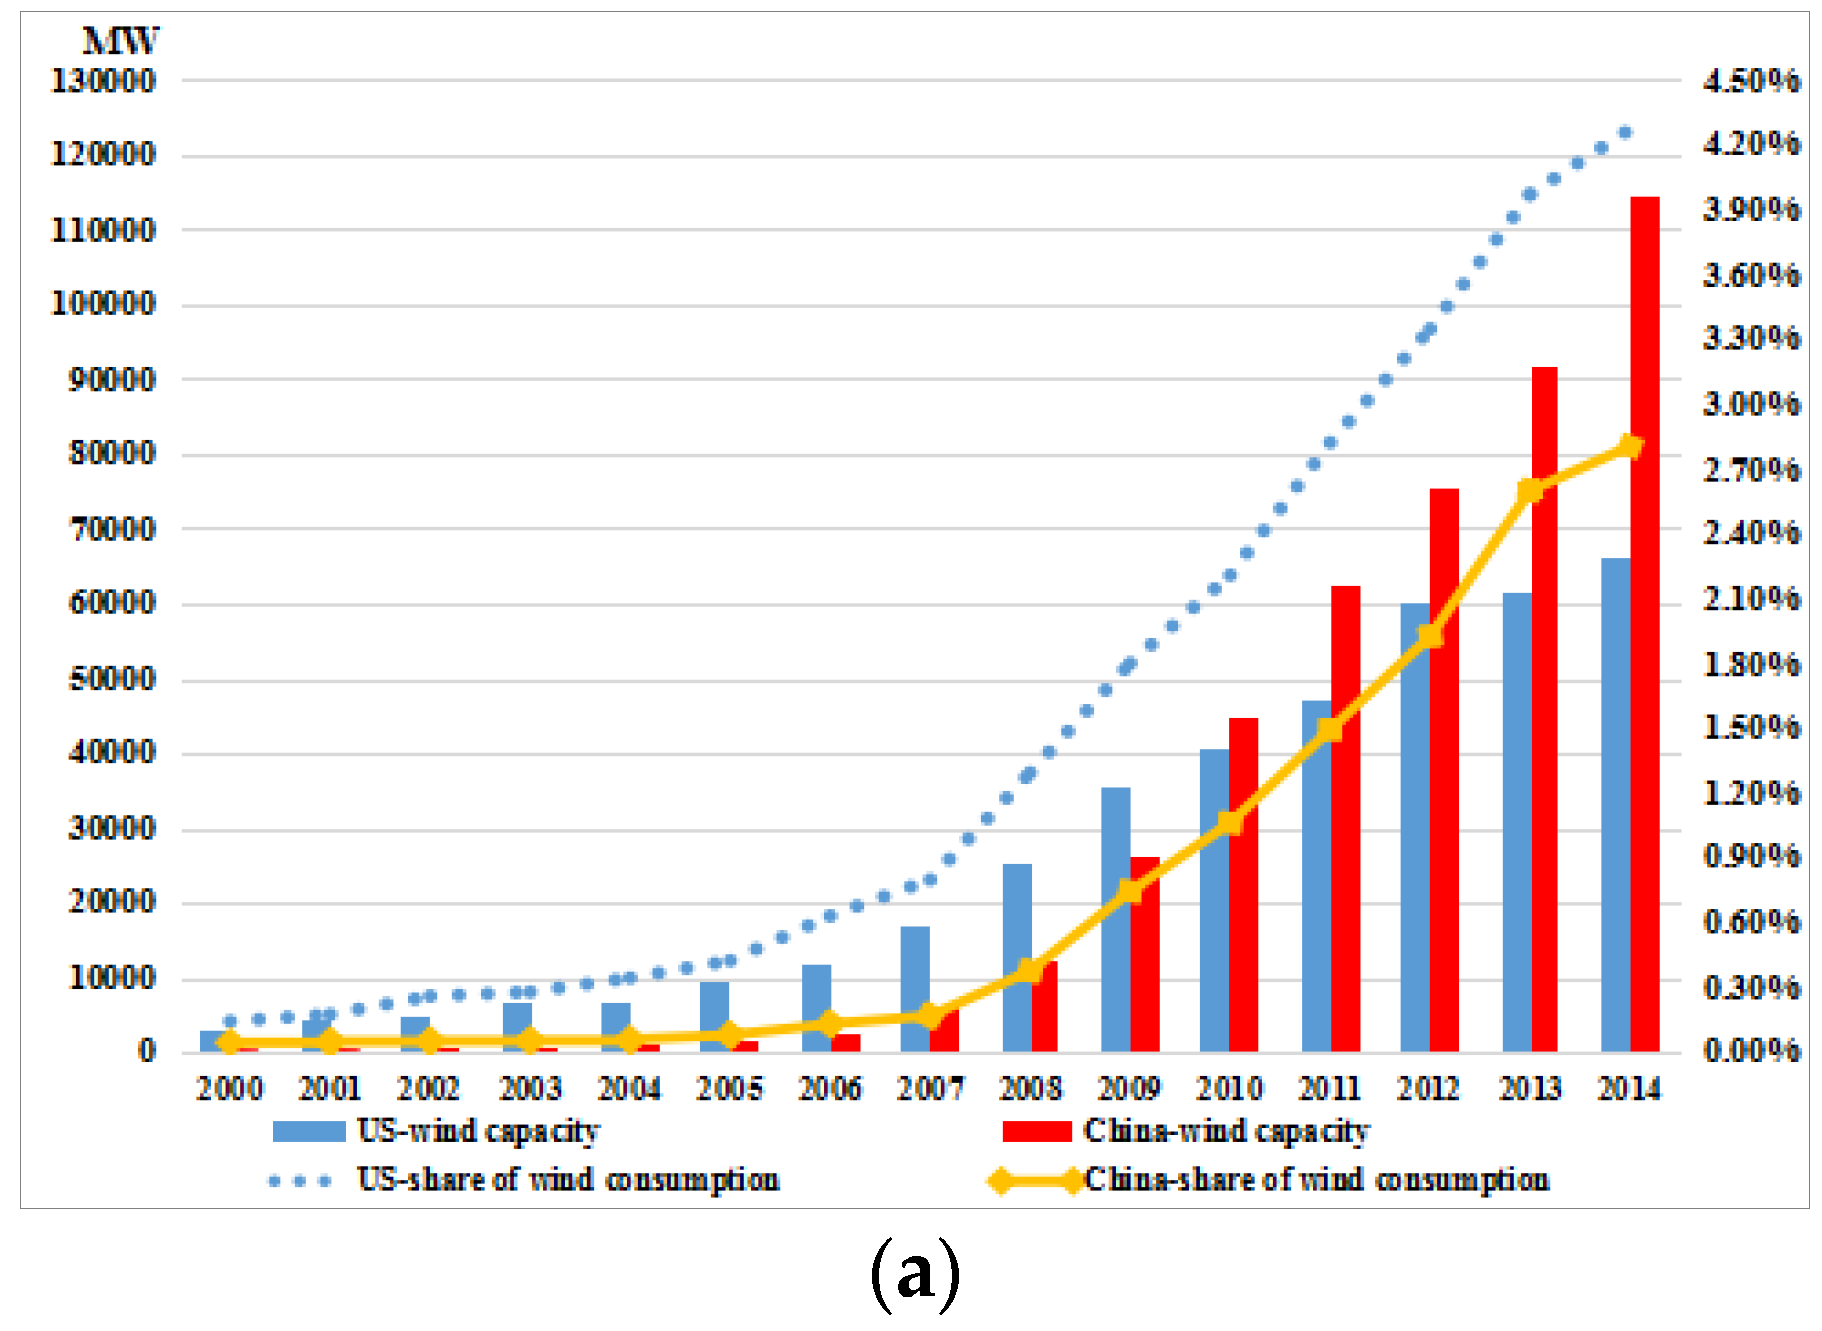
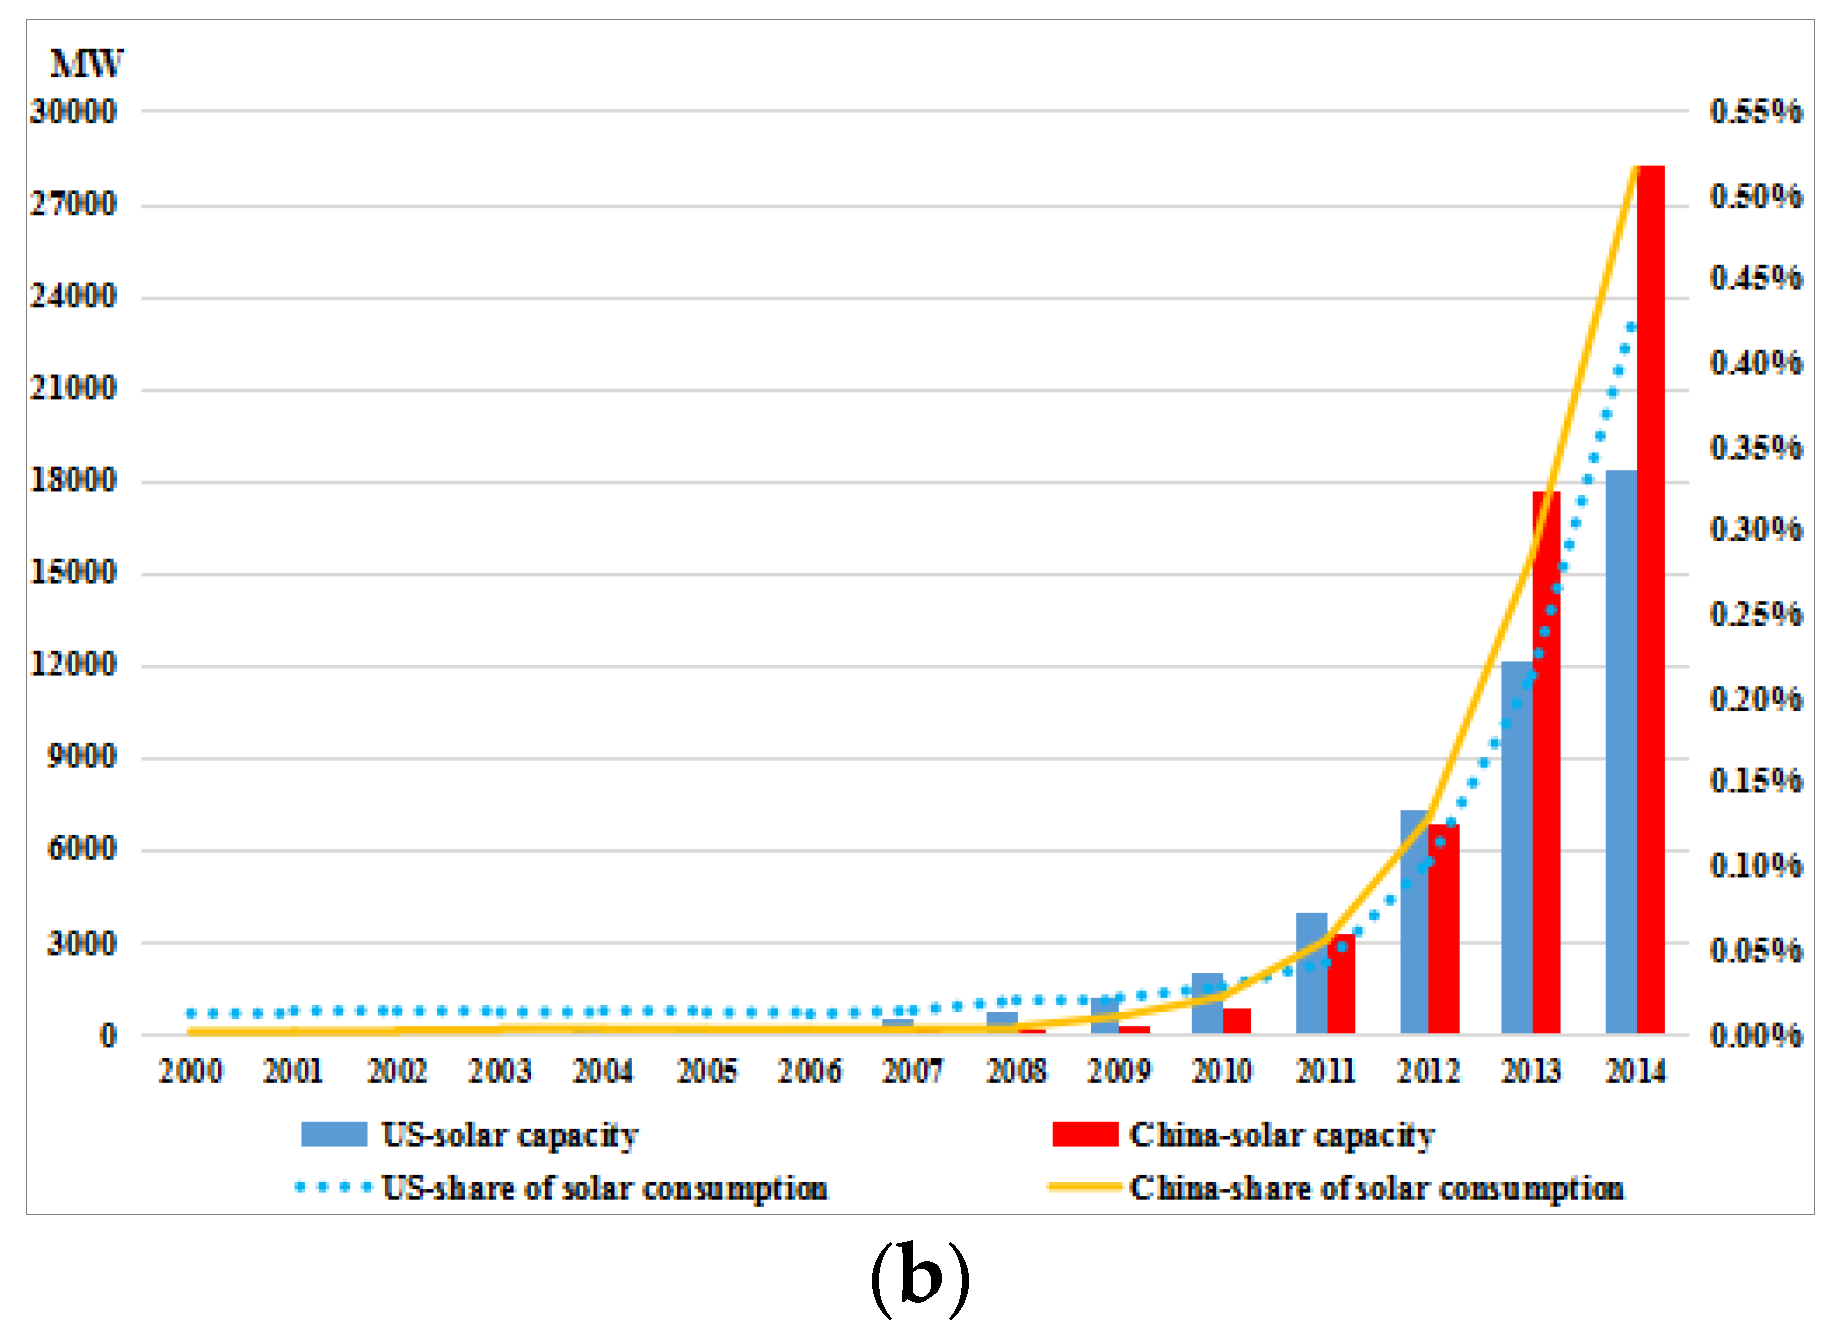
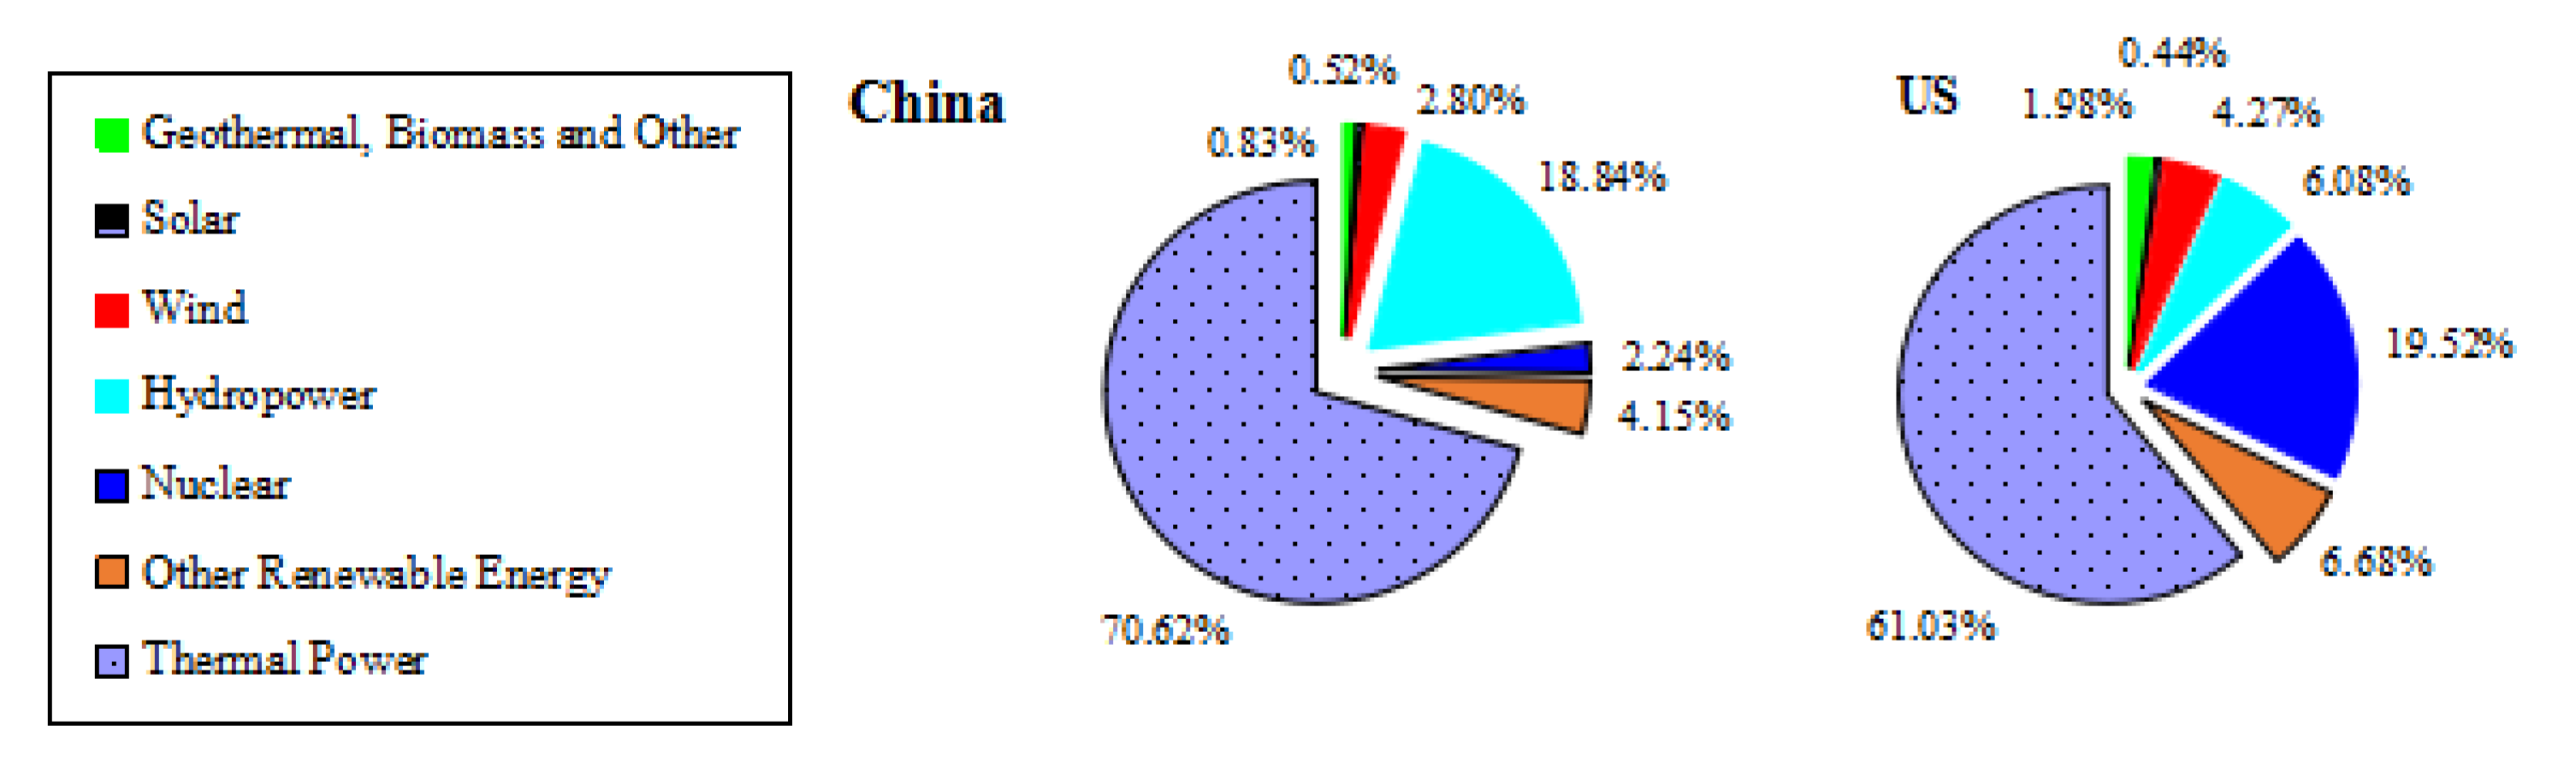
2.2. Power Sector Comparison between China and the U.S.

In order to explore the potential of ECER in China’s power sector, it is vital to investigate the similarities and differences between China and its Western counterparts. We regard the U.S. as a good comparison. Due to the different stages of their respective economic development, the power industry in China and the U.S. have differences in power demand structure, power load characteristics, electricity demand growth rate, power generation mix, power dispatch mode and other aspects [28]. China’s power sector has developed rapidly in recent years. In 2000, power generation in China was 1356 TWh, which is 34% of that in the U.S. (3991 TWh). By the end of 2014, however, China’s power generation was 5362 TWh, exceeding that of the US by 31% (Figure 5) [29].
However the power industry contributes the largest pollutant emissions in both countries and also attracts the most attention regarding global climate change, therefore the renewable energy sector has also developed rapidly in both countries. The growth of wind power in both countries is the fastest among all generation technologies. In 2013 China’s wind power capacity was 1.5 times of that in the US (Figure 6a [29]). However, the actual consumption share of wind power in China, restricted by an inefficient power dispatch mode and grid integration hurdles, was only 78% of that in the U.S. [29]. At the same time, the development of solar power in China was accelerated from 2011, but the consumption share was almost the same as the US (Figure 6b [29]). Figure 7 [29] compares the consumption share of renewable energy between China and the US in 2014. The share of renewable energy consumption in China was still 10% lower than that of the US. Therefore optimizing the power generation mix, increasing the consumption of renewable energy, reducing fossil fuel consumption is a feasible method for ECER in China.

3. Key Actions and Achievements of ECER in China’s Power Sector

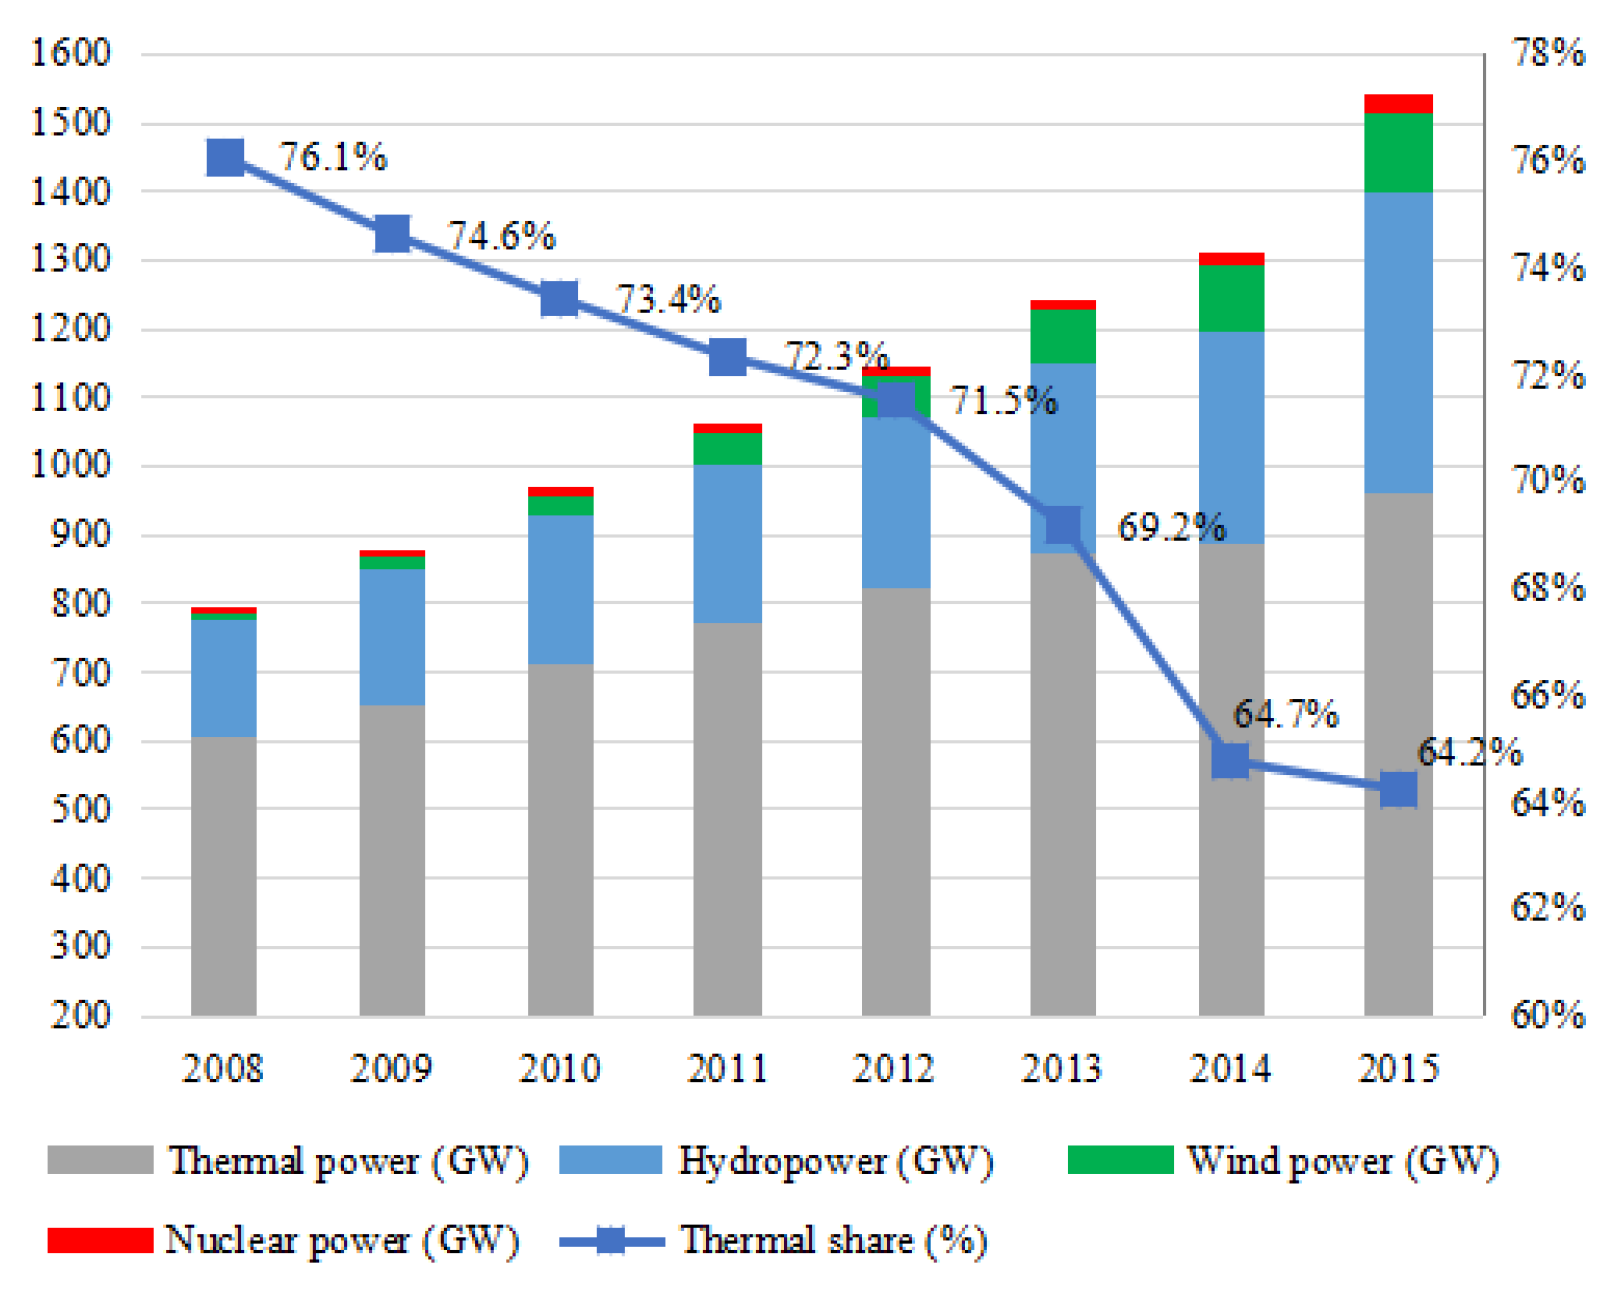
3.1. Actions and Achievements in Optimizing the Power Generation Mix

With the maturity of wind power and other clean energy generation technologies, China has benefited greatly for its willingness to adapt. In 2007, the State Electricity Regulatory Commission (SERC) released regulatory measures for integrating renewable energy into the power grid [30]. In order to support renewable energy generation, the National Development and Reform Commission (NDRC) and SERC formulated subsidy policies for renewable energy [31]. At the end of 2015, NDRC and National Energy Administration (NEA) jointly issued six new documents supportive of the power system reforms. Their theme is to optimize power economic dispatch mode and its core is that renewable energy should have priority in power generation [32].
In 2009, the grid-integrated wind power was 17.6 GW, with power generation of 27.62 TWh. In 2012, China contributed the largest newly-installed wind capacity (34.6%) in the world [27].
At the same time, the share of thermal power continues to decrease [17,26] (Figure 8). At the end of 2014, the total generation capacity was 1284 GW, among which 260 GW was hydro power, 89.3 GW was wind power and 18.8 GW was nuclear power [17].

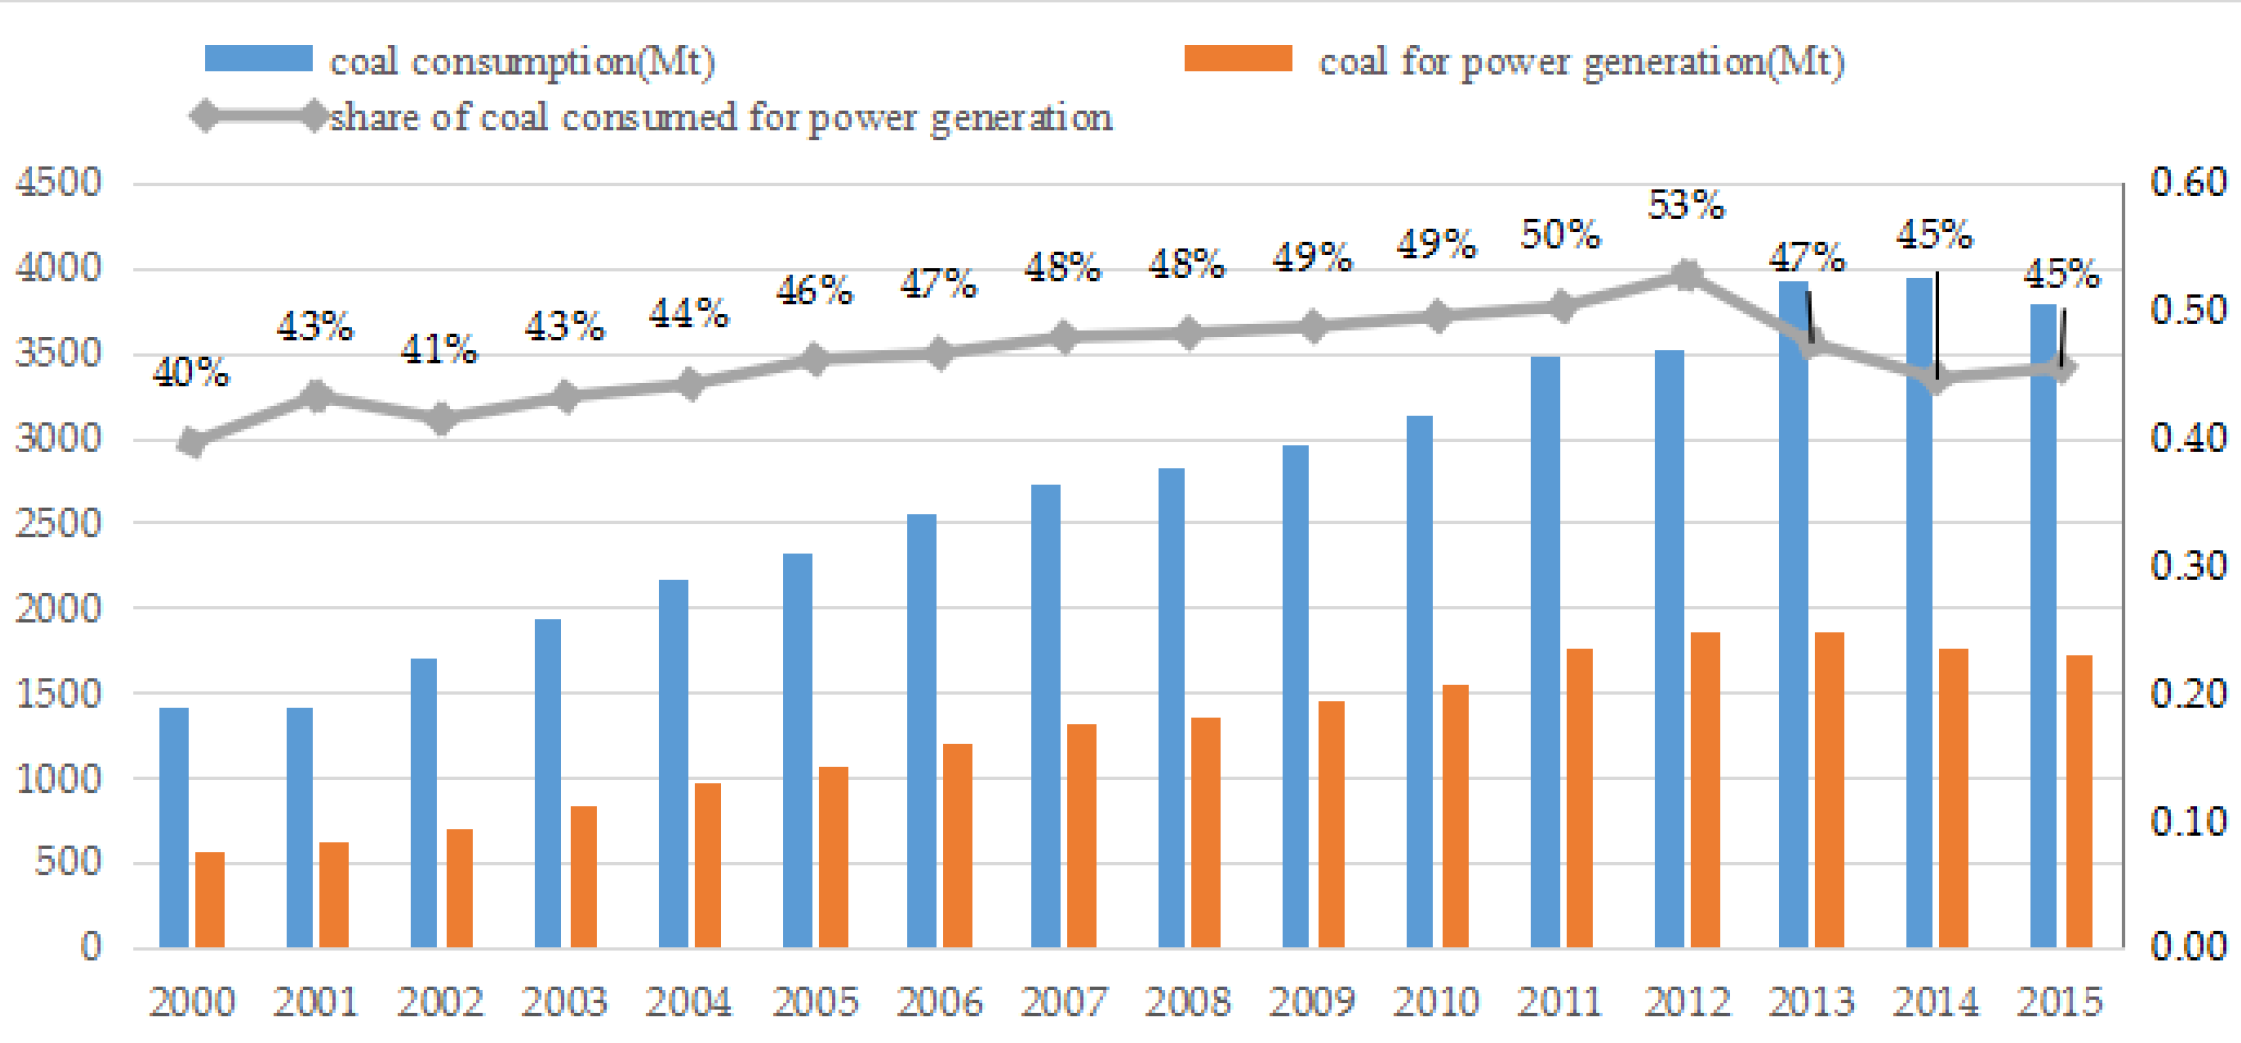
3.2. Actions and Achievements in Adjusting Coal Power Generation Mix

The heat rate of a large-scale high-efficiency coal power unit is usually 100–150 grams coal equivalent (gce)/kWh lower than that of the small and medium-sized unit [33]. It is generally agreed that substituting small units with larger and more efficient units can reduce coal consumption and promote the effects of ECER.
In 2007, the State Council of China (SCC) issued notice of the closure of small thermal units in China, calling for a ‘progressive’ shut down during the period of the Eleventh Five-Year-Plan [34]. Thanks to the economic incentives and other support measures, this policy plays a very important role in reducing GHG emissions. By the end of Eleventh Five-Year-Plan, China has shut down a total of 77.25 GW small coal units. By the end of 2013, an additional 14.08 GW thermal power units were shut down (Table 1 [17,21,22,23]).
In response state owned enterprise (SOE) generators committed to develop high-parameter and large-capacity thermal power units. Taking Guohua Electric Power Company as an example, in 2013, 600 MW and above units accounted for 83% of its coal power plant, much higher than that in the other SOE generators (e.g., 47.9% for Huaneng Group) [24].

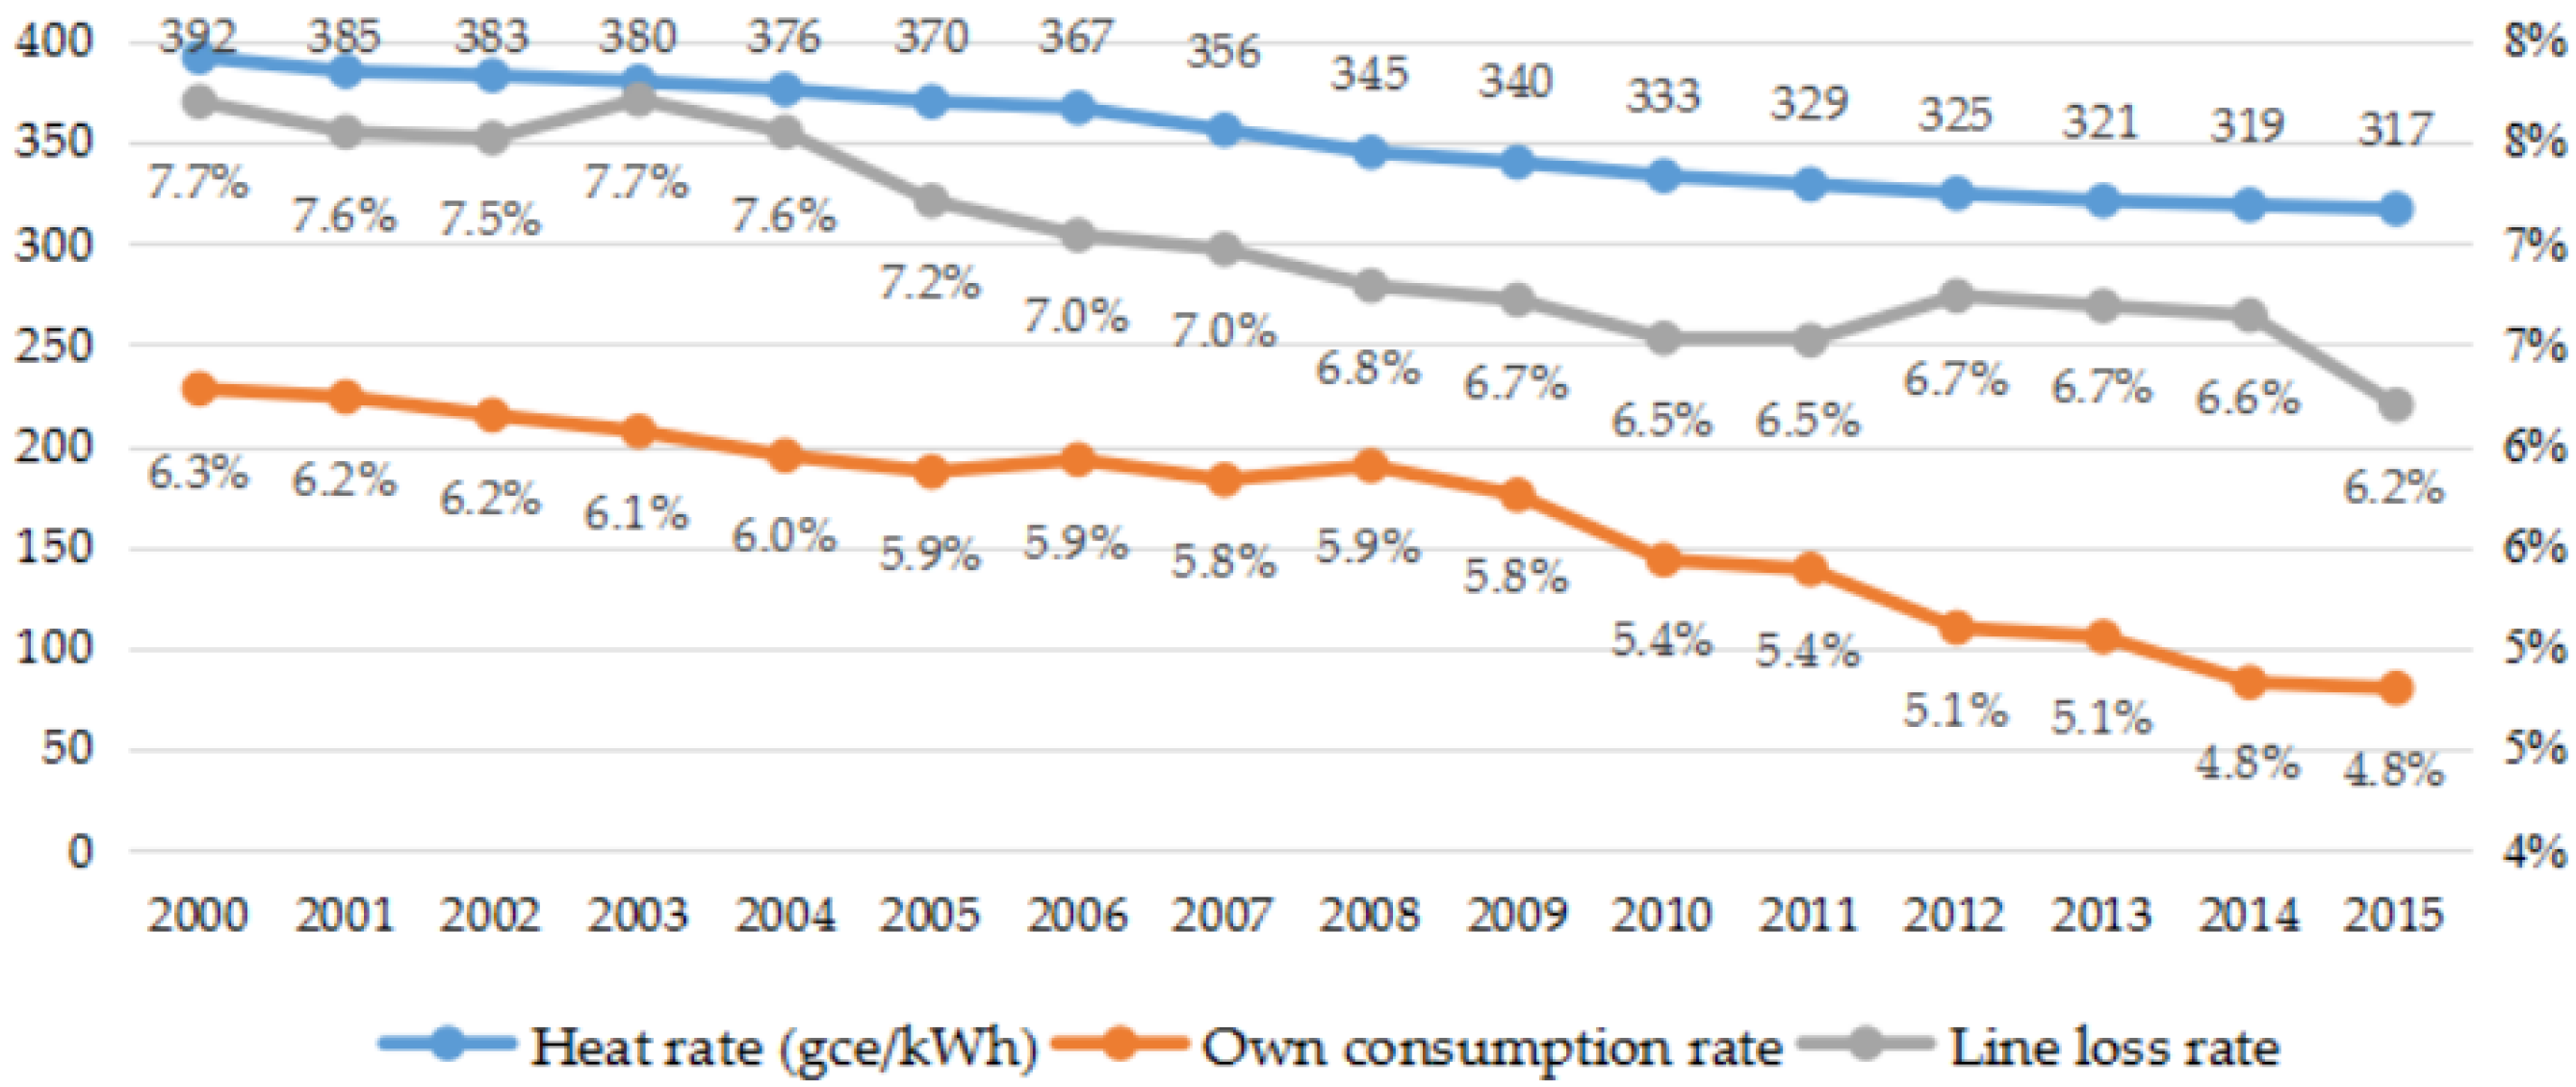
3.3. Actions and Achievements in Energy Efficiency Benchmarking

In 2007, the NDRC issued the policy document on energy efficiency benchmarking in power generators [35]. Authorized by the NDRC, the China Electricity Council (CEC) is responsible for implementing energy efficiency benchmarking. Due to the benchmarking efforts, the heat rate of power supply in coal power plants has declined in recent years, and the self-consumption rate of 2015 was also reduced by 0.9 percent points compared to that in 2008 (Figure 9 [17,26]).

3.4. Actions and Achievements in Transmission and Distribution (T&D) Network

There are two main approaches for energy conservation in T&D: reducing line losses and integrating renewable energy. By adjusting the layout of the power grid, it is possible to achieve active power line loss reduction, inactive power compensations, and trans-regional power exchange, etc. In 2010 the line loss rate decreased to 6.53% (Figure 9), which was a little higher than that of U.S. (6.1%), but lower than the level of U.K. (7.7%), France (7.2%) and Canada (10.5%) [36].
ECER can also be achieved by renewable-friendly dispatch. In 2007, the SCC issued a notice on energy-saving generation dispatch [37]. On the premise of reliable power supply, the new dispatch method can minimize fossil energy consumption and pollutant emissions. Five provinces, namely Jiangsu, Henan, Guangdong, Sichuan, and Guizhou, responded to initiate the pilot work in 2007.
Energy-saving generation dispatch has played a positive role in saving energy and reducing emissions. Guan et al. selected a typical day in 2010 to analyze the efficiency of two dispatch modes [38]. The practical data from the Jiangsu power grid indicates that the energy-saving dispatch mode is effective to reduce coal consumption in comparison with the existing dispatch mode. Jiangsu Province saved 1.64 Mtce with an annual electricity consumption of 246.9 TWh in 2010. According to the data provided by China Southern Power Grid company, energy-saving dispatch also resulted in considerable energy conservation effects in 2008 and 2009 [39].

3.5. Actions and Achievements in Developing Clean Coal Technologies (CCTs)

In order to guide power companies to increase capital investment and accelerate the progress of CCTs, the National Energy Administration (NEA) further elevated the technology threshold of coal power generation in China. At present, there are three main types of available CCTs, namely circulating fluidized bed (CFB) combustion, ultra-supercritical (USC), and integrated gasification combined cycle (IGCC). The performance comparison of different kinds of CCT is shown in Table 2 [33]. The maximum thermal efficiency of IGCC could reach 50%, while in terms of heat rate, the coal consumption of per kWh power supply is 100 gce less than that in a sub-critical (SBC) unit. The heat rate of 600-MW coal power USC generation unit is 40 gce less than that in SBC unit. Given an annual operation of 5500 hours, a 600-MW USC unit will consume 56.8 thousand tons coal equivalent (tce) less than that of a SBC unit, meanwhile, the emissions will be greatly reduced by using the USC unit. China has made significant progress in the development of CCTs. These mature or ready-to-mature CCTs will become the mainstream options of coal power installation in the future.

3.6. Actions and Achievements in Improving Energy Efficiency

Increasing terminal energy efficiency and saving electricity for ECER is the fundamental action for China. Green lighting, energy efficient appliances and other energy conservation actions have great energy conservation effects. According to a study by the China National Institute of Standardization [40], the mass application of 15 typical energy efficient appliances including motors, air conditioners and others resulted in electricity savings of 5.8 TWh, or 2.16 Mtce, but compared with industrialized countries, there exists a big gap in the deployment of Demand Side Management (DSM) or energy service in the power sector. In term of Gross Domestic Product (GDP) electricity intensity, the number was gradually decreased in China. However, GDP electricity intensity in China is still twice the OECD average [41] (Figure 10). Therefore learning from other industrialized countries in the deployment of DSM is vital for China’s ECER.

4. ECER in China’s Power Sector into 2020

This section refers Chinese Government’s official energy planning as a baseline scenario for the power sector. We also compile another ambitious scenario by considering the improved potential of energy efficiency, the installation potential of alternative energy resources and other reasons. The energy conservation potential in China’s power sector can be identified by comparing these two scenarios.

4.1. Baseline Scenario

China’s relatively rich coal endowment determines that coal-dominant energy supply structure will last for at least another ten years. According to the NDRC, NEA and CEC, in 2020 China’s total installation will reach 1943 GW, with 61.91% will be by thermal power (1203 GW) (Table 3).

4.2. ECER Scenario

4.2.1. Contribution from Technical and Operational Improvements

According to CEC, by 2020 the self-consumption rate will be 5.0%, the line loss rate will be 6.2%, and the heat rate of generation will be 310 gce/kWh. In 2014, the NDRC issued the Action Plan of Transformation and Upgrading of Coal Power for ECER (2014–2020) [46], which aims to achieve the target of a heat rate lower than 300 gce/kWh for newly constructed coal-fired units. According to the lower rate of self-consumption and line loss during 2008–2015, the self-consumption rate will drop to 4.18% and the line loss rate will drop to 5.7% by 2020. The average heat rate of power generation is assumed to be 307 gce/kWh (Table 4). Table 5 estimates the ECER contribution from technical and operational improvements. It is evident that the combined effects of reducing the self-consumption rate of power plants and the line loss rate of power grids can bring forth primary energy conservation of 25 Mtce and avoid 62 Mt of CO2 emissions.

4.2.2. Contribution from Improvements in Generation Mix

Structural Improvement of Coal Power

The efficiency improvement and the structural change of coal power can contribute to low-carbon development of the power sector. The structure of coal power plants and their major technical economy indexes according to CEC [47], are provided in Table 6. In 2012, the units above 300-MW accounted for 76% of total coal power plants, and small units (below 200-MW) still account for about 6%.
Currently the dominant technology is the SC coal-fired technology. Compared with the SC, the USC coal-fired technology performs better (2%–3% higher) in generation efficiency and the heat rate is less than 290 gce/kWh (Table 7).
Due to the superiority of the generation efficiency and environmental performance, the USC technology will lead the future direction of coal power generation. Suppose that most of the retired units below 300-MW will be substituted by 600-MW USC units; as the result, the share of 600-MW and above USC units will be no less than 54%. We also assume that the heat rate of SC and 1000-MW USC units could reach the theoretical level by 2020, which are 300 gce/kWh and 284 gce/kWh respectively, the potential by structural adjustment in coal power is estimated in Table 8. With radical substitution, the share of 600-MW and above units could be increased to 61% in 2020. After the structural adjustment and retrofitting, the total potential of energy conservation of coal power could reach 15 Mtce and the CO2 emissions abatement could reach more than 36 Mt (Table 8).

Ambitious Clean Generation

Extra energy conservation potential can be realized with ambitious clean energy development. The role of nuclear power in clean energy development has been highlighted by many countries. In many major energy consuming countries, the contribution of nuclear power is approximately 15%. For instance, in 2005 the share of nuclear in total power generation was 77.6% for France, 28.1% for Germany, 25% for Japan, 23.7% for the UK, 20% for the US and 16.5% for Russia. As the largest energy consumer in the world, China lags far behind in terms of nuclear power development. China has a good historic record in the operation of nuclear power and has abundant siting resources for nuclear power; while the proactive safety system of the third generation nuclear technology and the recycle system of nuclear fuel have provided a great platform for China’s nuclear development. In a more positive way, the installation of nuclear power can reach 65 GW, which is 15 GW higher than that in the BAU scenario.
Although China is the largest wind power developer in the world, its wind capacity is negligible relative to the abundant resource endowment. Now wind power has become economically competitive with coal power in Southern China where the price of coal power generation is high. It is evident that with further learning-curve improvements, wind power will become fully competitive in two to three years. Therefore, in the clean energy scenario, according to the development of wind power installed capacity in 2010–2015, wind power is expected to experience a rapid growth and it will reach 250 GW in 2020, which is 50 GW higher than that in the BAU scenario. However, at this stage the wind power curtailment is still serious—the curtailment rate was 19% in 2012 and decreased to 12% in 2013 [49]. In April of 2014, NEA released a policy document on wind power [50], and committed to solve the curtailment issue in two to three years. The situation did improve and the curtailment rate obviously decreased to 8% in 2014 [49]. Many industry experts think that the curtailment issue will be solved when the curtailment rate is less than 5%, so we set the curtailment rate in 2020 at 5% in the two scenarios.
In the BAU scenario, solar power is also very likely to take off in several years. According to the announced SCC notice, China will install 35 GW of solar power by 2015 [51]. In the clean energy scenario, solar capacity is expected to be 100 GW in 2020. Table 9 presents the estimation of the alternative power generation potential. It is estimated that 124 Mtce primary energy can be conserved.

4.2.3. Contribution from DSM

DSM was introduced in China since the 1990s. DSM is widely deployed in developed countries such as the UK, France, Japan and Denmark with great success under the market mechanism. Take California as an example, DSM has successfully decreased the peak load in the state by 12 GW in 30 years, approximating 15% of the total power load [52]. During 2000–2001, DSM effectively reduced 6% of the total power demand of California [53].
Assuming that China can utilize the market mechanism to implement DSM, we estimate that DSM can reduce at least 3% of the total electricity demand (or 243 TWh) in 2020, which is equivalent to 76 Mtce primary energy. The contribution is estimated in Table 10.

4.2.4. Total Potential of Energy Conservation Scenario

To sum up, a total of 240 Mtce primary energy consumption could be reduced with these energy conservation actions in China’s power sector in 2020 and a total of 590 Mt CO2 emissions could be avoided (Table 11). According to the study of Yuan et al. [54], China’s total CO2 emissions would be around 9000 Mt in 2020, given the assumption that China could achieved its target of reducing GDP CO2 intensity by 45% on the baseline of the 2005 levels. In China, power generation shares about 50% CO2 emissions. The power sector alone can contribute a significant portion of 13% to the CO2 abatement target under effective measures compared with the study of Yuan. And according to the forecasting of World Energy Outlook 2007, China’s CO2 emissions from energy related industries will be 8.35 billion tons in 2020 [55], meanwhile, according to the Green Book of Climate Change 2013, the peak volume of CO2 emissions will be 8.56 billion tons around 2025 [56]. The prediction means that if China’s power sector could achieve 590 Mt CO2 emissions abatement, the peak volume of CO2 emissions would reduce 7%. Therefore, ECER in China’s power sector is one of the vital ways to realize CO2 abatement target for global climate change.

5. Conclusions and Policy Implications

Inevitably, the development of China’s power industry will maintain a significant role in ECER amidst the tension between economic growth and environmental degradation. In this paper, the analysis shows the greatest energy conservation potential could be achieved by the active integration of renewable energy and improvement of terminal energy efficiency. Although China’s power sector has achieved certain progress in ECER, great challenges remain. First, closing down small coal units and substitution with larger SC or USC units will incur a huge investment cost. In light of the strong opposition from the generators, the actual implementation has proven to be very challenging. Second, the energy conservation potential from operation improvement and clean coal technology is limited in the near future, while the potential from renewable energy is increasing. Therefore, the high penetration of renewable energy calls for radical changes in grid infrastructure and operation. In turn it will lead to a systematic reform on the institutional arrangement in the power sector. Third, realizing the energy conservation potential from DSM calls for a transition in the deployment mechanism from currently command-and-control (CAC) one to the market-based one. In order to fully respond to the challenges faced by China’s power sector and fully explore the energy conservation potential the following policies are proposed:
1
Attracting both domestic and overseas capital to invest in developing high-efficient and low-emissions coal power generation; imposing emissions tax or fossil energy tax and pricing policies on coal power to improve the effectiveness of economic incentives for generation corporations.
2
Promoting energy-saving dispatch policies; expanding trans-regional transmissions; developing the technology of energy storage and forecasting to consume large amounts of renewable power, raising the proportion of renewable energy through the pricing policies in the power sector.
3
Improving the sense of enterprise and individual’s social responsibility and enthusiasm to change the way in using power and improve terminal energy efficiency; and conducting market reform (including pricing mechanism reform in particular) to further implement DSM measures.

Acknowledgments

The authors would like to thank the anonymous reviewers for their useful comments and suggestions. The work reported in the paper is funded by The United States Energy Foundation project (G-1409-22063) and Ningxia Nature Funds project (NZ15013) for 2015.

Author Contributions

Chunning Na and Jiahai Yuan conceived and designed the structure of the paper; Chunning Na analyzed the data and wrote the paper; Zheng Hu and Ping Li contributed to modify the paper.

Conflicts of Interest

The authors declare no conflict of interest. The founding sponsors had no role in the design of the study; in the collection, analyses, or interpretation of data; in the writing of the manuscript, and in the decision to publish the results.

Abbreviations

The following abbreviations are used in this manuscript:
BAU
business-as-usual
CCTs
clean coal technologies
ECER
energy conservation and emissions reduction
CEC
China Electricity Council
CFB
circulating fluidized bed combustion
DSM
Demand Side Management
EEC
electricity elastic coefficient
IGCC
integrated gasification combined cycle
NDRC
National Development and Reform Commission
NEA
National Energy Administration
SBC
sub-critical
SCC
State Council of China
SERC
State Electricity Regulatory Commission
SOE
state owned enterprise
T&D
transmission and distribution
USC
ultra-supercritical

References

  1. Liu, T.; Xu, G.; Cai, P.; Tian, L.H.; Huang, Q.L. Development forecast of renewable energy power generation in China and its influence on the GHG control strategy of the country. Renew. Energy 2011, 36, 1284–1292. [Google Scholar] [CrossRef]
  2. Geng, J.; Lu, Y.L.; Wang, T.Y.; Giesy, J.P.; Chen, C.L. Effects of energy conservation in major energy-intensive industrial sectors on emissions of polychlorinated dibenzo-p-dioxins and polychlorinated dibenzofurans in China. Energy Policy 2010, 38, 2346–2356. [Google Scholar] [CrossRef]
  3. Wen, Z.G.; Li, H.F. Analysis of potential energy conservation and CO2 emissions reduction in China’s non-ferrous metals industry from a technology perspective. Int. J. Greenh. Gas Control 2014, 28, 45–56. [Google Scholar] [CrossRef]
  4. Peng, L.H.; Zeng, X.L.; Wang, Y.J.; Hong, G.B. Analysis of energy efficiency and carbon dioxide reduction in the Chinese pulp and paper industry. Energy Policy 2015, 80, 65–75. [Google Scholar] [CrossRef]
  5. Kong, L.B.; Hasanbeigi, A.; Price, L.; Liu, H.B. Energy conservation and CO2 mitigation potentials in the Chinese pulp and paper industry. Resour. Conserv. Recycl. 2015. [Google Scholar] [CrossRef]
  6. Li, K.; Lin, B.Q. The efficiency improvement potential for coal, oil and electricity in China's manufacturing sectors. Energy 2015, 86, 403–413. [Google Scholar] [CrossRef]
  7. Zhao, G.L.; Chen, S. Greenhouse gas emissions reduction in China by cleaner coal technology towards 2020. Energy Strategy Rev. 2015, 7, 63–70. [Google Scholar] [CrossRef]
  8. Liu, Y.M.; Guo, W.J. Effects of energy conservation and emission reduction on energy efficiency retrofit for existing residence: A case from China. Energy Build. 2013, 61, 61–72. [Google Scholar] [CrossRef]
  9. Xu, J.H.; Fan, Y.; Yu, S.M. Energy conservation and CO2 emission reduction in China’s 11th Five-Year Plan: A performance evaluation. Energy Econ. 2014, 46, 348–359. [Google Scholar] [CrossRef]
  10. Zhao, Z.Y.; Chang, R.D.; Zillante, G. Challenges for China’s energy conservation and emissions reduction. Energy Policy 2014, 74, 709–713. [Google Scholar] [CrossRef]
  11. Gu, Y.; Li, C. Construction of evolution indicator system of energy conversation and emissions reduction in China’s power sector. J. Shenyang Technol. 2013, 01, 73–76. (In Chinese) [Google Scholar]
  12. Yang, Z.; Mao, Y. Energy conversation and emissions reduction and low-carbon economy in China’s power sector. J. Environ. Manag. Coll. China 2010, 01, 1–4. (In Chinese) [Google Scholar]
  13. Chen, Z.; Yu, W. Research on technologies and potential of energy conversation and emissions reduction in China’s power sector. Sci. Technol. Guangdong 2009, 12, 1–3. (In Chinese) [Google Scholar]
  14. Wu, X. Analysis on polices and technologies of energy conversation and emissions reduction in China’s power sector. Environ. Prot. Circ. Econ. 2008, 3, 23–24. (In Chinese) [Google Scholar]
  15. Li, L.; Tan, Z.F.; Wang, J.H.; Xu, J.; Cai, C.K.; Hou, Y. Energy conservation and emission reduction policies for the electric power industry in China. Energy Policy 2011, 39, 3669–3679. [Google Scholar] [CrossRef]
  16. Yuan, J.; Kang, J.; Yu, C.; Hu, Z.G. Energy conservation and emissions reduction in China—Progress and prospective. Renew. Sustain. Energy Rev. 2011, 15, 4334–4347. [Google Scholar] [CrossRef]
  17. Statistical Data for China’s Power Sector in 2014. Available online: http://www.cec.org.cn/guihuayutongji/tongjxinxi/niandushuju/2015-11-30/146012.html (accessed on 1 January 2016).
  18. Interpretation of Electrical Elasticity Coefficient in China since 2014. Available online: http://hvdc.chinapower.com.cn/news/1037/10378994.asp (accessed on 1 January 2016).
  19. Statistical Data for China’s Power Sector in 2009. Available online: http://www.cec.org.cn/guihuayutongji/tongjxinxi/niandushuju/2013-04-19/100587.html (accessed on 23 September 2013).
  20. Statistical Data for China’s Power Sector in 2010. Available online: http://www.cec.org.cn/guihuayutongji/tongjxinxi/niandushuju/2013-04-19/100588.html (accessed on 23 September 2013).
  21. Statistical Data for China’s Power Sector in 2011. Available online: http://www.cec.org.cn/guihuayutongji/tongjxinxi/niandushuju/2013-04-19/100589.html (accessed on 23 September 2013).
  22. Statistical Data for China’s Power Sector in 2012. Available online: http://www.cec.org.cn/guihuayutongji/tongjxinxi/ (accessed on 23 September 2013).
  23. Statistical Data for China’s Power Sector in 2013. Available online: http://www.cec.org.cn/guihuayutongji/tongjxinxi/yuedushuju/2014-01-26/116224.html (accessed on 23 September 2013).
  24. Main Economic and Technical Indicators of China’s Top Five SOE and Guohua Generators. Available online: http://www.cec.org.cn/yaowenkuaidi/2014-02-26/117351.html.(accessed on 23 September 2013).
  25. Report on Analysis and Forecasting of the Power Supply and Demand for 2016. Available online: http://www.cec.org.cn/yaowenkuaidi/2016-02-03/148763.html (accessed on 19 February 2016).
  26. Statistical Data for China’s Power Sector in 2015. Available online: http://www.cec.org.cn/guihuayutongji/tongjxinxi/yuedushuju/2015-12-17/146910.html (accessed on 1 January 2016).
  27. CESY (China Statistical Yearbook, 2015). Available online: http://www.stats.gov.cn/tjsj/ndsj/2015/indexch.htm (accessed on 1 January 2016).
  28. Hu, J.; Kahrl, F.; Ding, J. Comparison China’s power industry with the US for climate change. Chin. Mark. 2011, 07, 49–55. (In Chinese) [Google Scholar]
  29. BP Statistical Review of World Energy. Available online: http://www.bp.com/en/global/corporate/about-bp/energy-economics/statistical-review-of-world-energy-2015.html (accessed on 1 January 2016).
  30. Renewable energy integrated entirely by power grid. Available online: http://www.pinghe.gov.cn/cms/html/xzfwz/2010-08-13/1551147629.html (accessed on 23 September 2013).
  31. Notice on Renewable Energy Subsidies Price and Rationing Transaction. Available online: http://jgs.ndrc.gov.cn/zcfg/200709/t20070930_163465.html (accessed on 23 September 2013).
  32. How to Understand the New 6 Supporting Documents of the Power System Reform. Available online: http://www.ndrc.gov.cn/zcfb/jd/201512/t20151201_761159.html (accessed on 20 December 2015).
  33. Roadmap for High-Efficiency, Low-Emissions Coal-Fired Power Generation. Available online: http://www.iea.org/media/publications/HELE_roadmap_CN.pdf (accessed on 1 January 2014).
  34. Notice on the Closure of Small Thermal Units. Available online: http://bgt.ndrc.gov.cn/zcfb/200701/t20070131_498187.html (accessed on 23 September 2013).
  35. Notice on energy efficiency benchmarking for key energy-consuming enterprises. Available online: http://www.gdei.gov.cn/zwgk/tzgg/2007/200712/P020071224680245564760.doc (accessed on 23 September 2013).
  36. Notice on Energy Conservation and Emissions Abatement for 2010. Available online: http://www.serc.gov.cn/ywdd/201110/t20111026_15467.html (accessed on 22 September 2013).
  37. Rules on Energy Conservation Dispatch (Trial). Available online: http://www.ndrc.gov.cn/zcfb/zcfbqt/200708/t20070828_156042.html (accessed on 23 September 2013).
  38. Guan, Y.; Wang, G.; Zhao, C; Sun, R.; Li, Q. Analysis and solutions of energy-saving generation dispatch of Jiangsu power grid. Electr. Power 2011, 09, 4–9. (In Chinese) [Google Scholar]
  39. Great Achievement by China Southern Power Grid Company Using Energy-saving Generation Dispatch. Available online: http://www.chinapower.com.cn/newsarticle/1119/new1119728.asp (accessed on 15 March 2014).
  40. White Paper for the Energy Efficiency Status of China Energy-Use Products; China National Institute of Standardization (CNIS): Beijing, China, 2013; pp. 36–37. (In Chinese)
  41. OECD Statistics. Available online: http://www.oecd.org/statistics/ (accessed on 15 March 2014).
  42. Notice on the Medium-and-Long-term Plan for Renewable Energy Development. Available online: http://www.gov.cn/zwgk/2007-09/05/content_738243.htm (accessed on 23 September 2013).
  43. Notice on the Medium-and-Long-term Plan for Nuclear Energy Development. Available online: http://www.gov.cn/gzdt/att/att/site1/20071104/00123f3c4787089759a901.pdf (accessed on 23 September 2013).
  44. Power Sector Research Report for the 12th FYP Period. Available online: http://www.cec.org.cn/zhuanti/2011nianzhuantihuigu/dianlixingyeshierwuguihua/ (accessed on 23 September 2013).
  45. Renewable Energy Development Plan for the 12th FYP. Available online: http://www.nea.gov.cn/201208/08/c_131767651.htm (accessed on 23 September 2013).
  46. Action Plan of Transformation and Upgrading of Coal Power for Energy Conservation and Emissions Reduction 2014–2020. Available online: http://www.sdpc.gov.cn/zcfb/zcfbtz/201409/t20140919_626235.html (accessed on 16 October 2014).
  47. Annual Development Report of China’s Power Sector-2013; China Market Press: Beijing, China, 2014; p. 18. (In Chinese)
  48. Han, Z.; Liu, S.; Li, Z.; Liu, X.; Hong, Z. Comparison of power generation schemes using clean coal and traditional fuel coal. Therm. Power Gener. 2012, 02, 1–3. (In Chinese) [Google Scholar]
  49. Grid Access Wind Power and the Curtailment Rate. Available online: http://www.cpnn.com.cn/zdyw/201502/t20150212_783277.html (accessed on 14 February 2015).
  50. Notice on Grid Access Wind Power Consumption. Available online: http://zfxxgk.nea.gov.cn/auto87/201404/t20140414_1787.htm (accessed on 14 February 2015).
  51. Several Opinions on Promoting the Healthy Development of Photovoltaic Industry. Available online: http://www.gov.cn/zwgk/2013-07/15/content_2447814.htm (accessed on 30 March 2015).
  52. Baskette, C.; Horii, B.; Kollmanb, E.; Pricea, S. Avoided cost estimation and post-reform funding allocation for California’s energy efficiency programs. Energy 2006, 1, 1084–1099. [Google Scholar] [CrossRef]
  53. Energy Saving Management Experience for Foreign Countries. Available online: http://wenku.baidu.com/link?url=Cq2Y1RwwaB-bP3A_CROqcr3GiL1zpEb8SyoNEDwmuehTr9h6ZyzpFCNV8bkXZY2KbaW1fhKhlgWnwxL-Jo_aB7jGj2pYRtC8_jsSj77MKT7 (accessed on 23 September 2013).
  54. Yuan, J.H.; Xu, Y.; Zhang, X.P.; Hu, Z.; Xu, M. China’s 2020 clean energy target: Consistency, pathways and policy implications. Energy Policy 2014, 65, 692–700. [Google Scholar] [CrossRef]
  55. World Energy Outlook 2007—China and India Insights-Special Report Focus on China and India. Available online: http://www.iea.org/publications/freepublications/publication/weo_2007.pdf (accessed on 23 September 2014).
  56. Green Book of Climate Change: Annual Report on Actions to Address Climate Change (2013). Available online: http://www.cma.gov.cn/2011xzt/2013zhuant/20131107/ (accessed on 23 September 2014).
Figure 1. Elasticity coefficient of electricity consumption in China (1990–2015).
Energies 09 00266 g001
Figure 2. Power generation and the share of clean energy in China’s power sector (2008–2015).
Energies 09 00266 g002
Figure 3. Average thermal efficiency of power plants in China (2008–2015).
Energies 09 00266 g003
Figure 4. Total coal consumption and coal consumed for power generation in China (2000–2015).
Energies 09 00266 g004
Figure 5. Comparison of electricity generation between China and the US.
Energies 09 00266 g005
Figure 6. Comparison of (a) wind power and (b) solar power between China and the US.
Energies 09 00266 g006aEnergies 09 00266 g006b
Figure 7. Comparison of renewable energy consumption in 2014 between China and the US.
Energies 09 00266 g007
Figure 8. Power generation capacities and the share of thermal power in China, 2008–2015.
Energies 09 00266 g008
Figure 9. Heat rate of power supply and own consumption rate in China’s power sector.
Energies 09 00266 g009
Figure 10. Comparison of GDP electricity intensity
Energies 09 00266 g010
Table 1. Closure of small coal power generation during 2006–2014.
Year200620072008200920102011201220132014
Closed capacity (GW)3.1414.3616.6826.1716.903.466.164.479.09 1
1 The number is including retired units.
Table 2. Performance comparison of CCTs.
TechnologyThermal Efficiency (%)Coal Consumption (gce/kWh)Overnight Cost ($/kW)Emissions
CO2 (g/kWh)SO2 (mg/m3)NOx (mg/m3)
SBC<38%>380600–1980950–1080<60–280<330–420
SC42–43%340–380700–2310920–960<100–150<300–500
CFB38–40%----880–900<50–100<200
USC45%320–340800–2530740<20–100 (+FGD)<50–100 (+SCR)
IGCC45–50%290–3201100–2860670–740<20<30
Table 3. Installed capacity in related plans and the baseline power planning scenario in China in 2020 (GW).
Relevant PlansTime IssuedHydroWindNuclearSolarBiomassGasCoal
NDRC [42]2007.830030--1.830----
NDRC [43]2007.10----40--------
CEC [44]2012.333018080255431160
NEA [45]2012.8420200--50------
Baseline--420200405030431160
Table 4. Scenarios of China’s power sector to 2020.
ItemOwn Consumption RateLine LossHeat Rate
BAU scenario5%6.2%310 gce/kWh
ECER scenario4.18%5.7%307 gce/kWh
Table 5. Potential from technical and operational improvements.
ContributionPrimary Energy Conservation (Mtce)CO2 Abatement (Mt)SO2 Abatement (Mt)NOx Abatement (Mt)
Self-consumption (4.18%)15.6962.070.420.39
Line loss (5.7%)9.57
Total25.26
Table 6. Statistics on coal power plants in China’s main generators, 2012.
Capacity Type (MW)Subtotal (GW)Share (%)Annual Operation (h)Heat Rate (gce/kWh)
Unit ≥ 100058.379.315400292
600 ≤ unit < 1000247.2139.655122313
300 ≤ unit < 600238.9838.364525322
200 ≤ unit < 30042.046.744451342
Unit <20036.545.944713365
Table 7. Thermal efficiency and heat rate of various coal generation technologies [48].
TechnologySteam Temperature (°C)Steam Pressure (MPa)Thermal Efficiency (%)Heat Rate (gce/kWh)
Medium temperature & pressure4353524480
High temperature & pressure5009033390
Ultrahigh pressure5351335360
SBC5451738324
SC5662441300
USC6002743284
700 °C USC70035>46210
Table 8. Potential by structural adjustment and retrofitting of coal power in 2020.
Capacity Type (MW)Share (%)Subtotal (GW)Heat Rate (gce/kWh)Primary Energy Conservation (Mtce)Abatement (Mt)
CO2SO2NOx
Unit ≥10009.31108.00284(8)4.6736.560.250.23
600 ≤ unit < 100052.33607.03300(13)40.42
300 ≤ unit < 60038.36444.98322(−15)−30.20
Total1001160.00--14.88
Note: numbers in the brackets stand for improvement in heat rate by retrofitting.
Table 9. Potential of alternative power generation in the cleaner scenario in 2020.
ItemNuclearWindSolarTotalReduced Coal SharePrimary Energy Conservation (Mtce)Abatement (Mt)
CO2SO2NOx
BAU scenario share (%)2.069.782.5714.416.32123.52304.552.041.93
Cleaner scenario share (%)3.3512.235.1520.73
Table 10. Potential of ECER by DSM in 2020.
Electricity Supply (TWh)Avoided Demand (TWh)Primary Energy Conservation (Mtce)Emissions (Mt)
CO2SO2NOx
Without DSM8108.70243.2675.90186.461.251.18
With DSM7865.44
Table 11. Total potential of ECER scenario.
ContributionPrimary Energy Conservation (Mtce)Abatement (Mt)
CO2SO2NOx
Operation improvement25.2662.070.420.39
Coal power14.8836.560.250.23
Clean energy123.52304.552.041.93
DSM75.90186.461.251.18
Total239.56589.643.963.73

