Article

Synergistic Optimization of Thermoelectric Performance in P-Type Bi0.48Sb1.52Te3/Graphene Composite

1
Ningbo Institute of Materials Technology and Engineering, Chinese Academy of Sciences, Ningbo 315201, China
2
Nano Science and Technology Institute, University of Science and Technology of China, Suzhou 215123, China
*
Authors to whom correspondence should be addressed.
Energies 2016, 9(4), 236; https://doi.org/10.3390/en9040236
Submission received: 27 January 2016 / Revised: 6 March 2016 / Accepted: 14 March 2016 / Published: 25 March 2016
(This article belongs to the Special Issue Waste Energy Harvesting)

Abstract

:
We report the synergistic optimization of the thermoelectric properties in p-type Bi0.48Sb1.52Te3 by the additional graphene. Highly dense Bi0.48Sb1.52Te3 + graphene (x wt%, x = 0, 0.05, 0.1 and 0.15) composites have been synthesized by zone-melting followed by spark plasma sintering. With the help of scanning electron microscopy, the graphene has been clearly observed at the edge of the grain in the composites. Due to the additional graphene, the composites show an improved power factor of 4.8 × 10⁻³ Wm−1K−2 with modified carrier concentration and suppressed lattice thermal conductivity. Consequently, synergistic optimization in electrical and lattice properties by additional graphene leads to a great improvement in the figure of merit ZT (1.25 at 320 K).

1. Introduction

Thermoelectric (TE) materials, which can realize direct conversion between thermal energy and electrical energy, have attracted increasing attention [1,2,3,4]. The energy conversion efficiency of TE materials depends on the dimensionless figure of merit, which is defined as:
ZT = S2σT/κtot
where S is the Seebeck coefficient, σ is the electrical conductivity, κtot is the total thermal conductivity (including lattice thermal conductivity κlat and electrical thermal conductivity κele), and T is the absolute temperature, respectively. These parameters are correlated with each other and it is quite difficult to optimize all of them at the same time.
Bismuth telluride (Bi2Te3) based alloys are the best TE materials around room temperature and have widely been used for refrigeration applications and power generation [5,6,7]. Researchers have been making efforts to improve the TE performance of Bi2Te3-based alloys for further applications [8,9,10,11].
Nanocomposite has been suggested to be an effective approach to synergistically tune the electrical and the thermal properties by introducing second phase nanoparticles into the matrix [12,13,14,15,16,17,18]. Lots of materials, such as ZnAlO, WSe2 and silver, have been used as second phase nanoparticles to enhance the TE performance of Bi2Te3-based alloys [16,17,18,19]. Not all composites show synergistic optimization in TE performance, and some composites show decrease in the electrical properties [12,15,18,19]. Therefore, it is essential to select a proper second phase for Bi2Te3-based alloys.
Graphene has very high electrical conductivity, and has been explored to be an incorporated second phase in conventional thermoelectric materials, such as PbTe, CoSb3, etc., to increase electrical conductivity [20,21,22,23]. In spite of the high intrinsic κlat of graphene, some composites have been reported to exhibit lower κlat than that of the matrix, which may be due to the boundary scattering and great atom mass differences between the matrix and graphene.
For Bi2Te3 based materials, researchers have tried to optimize the TE performance with graphene [24,25,26,27,28]. A.H. Li et al. reported an enhanced ZT of ~0.45 at room temperature in graphene doped n-type Bi2Te3 [24]. Similar results were also reported by B.B. Liang et al. [25] and J.I. Kim et al. [26]. T. Zhang, et al. has tried to synthesize p-type graphene-BiSbTe composites by zone melting [27]. Even though a small enhancement in TE performance was achieved, they found some Te particles rather than graphene to be a second phase in the composite [27]. Recently, D. Suh et al. reported graphene-BiSbTe composites synthesized from nanoplates through the solvothermal method [28]. A promising ZT of 1.24 was obtained in spite of low relative densities of 93~95% which may lead to poor mechanical properties [28].
As Bi2Te3 based materials and graphene are all layered structures, the microstructure of graphene and matrix are very important to the overall TE performance. In this work, we have prepared the BiSbTe alloys with additional graphene using zone melting with the spark plasma sintering (SPS). We have clearly observed the graphene in the composites, which is in the BiSbTe grain boundaries and at the edge of BiSbTe grains. This graphene shows synergistic effects to enhance the power factor and overall figure of merit ZT.

2. Experimental Section

2.1. Synthesis of BiSbTe/Graphene Powders and Bulk Materials

Elements of bismuth (Bi, 99.999%), antimony (Sb, 99.999%), tellurium (Te, 99.999%), and graphene powders (XF NANO) were used for the preparation of the samples. All of the chemicals were used without further purification.
Stoichiometric amounts of Bi0.48Sb1.52Te3 + graphene (x wt%, x = 0, 0.05, 0.1, and 0.15) were weighted and charged into quartz tubes [29,30]. The quartz tubes were evacuated and sealed at high vacuum (below 10−2 Pa) by oxyacetylene flame, and then heated at 1023 K for 2 hours in a rocking furnace to ensure composition homogeneity. After naturally cooling to room temperature, the crystals were grown in a zone melting furnace at the temperature of 998 K with a growth speed of 25 mm/h. The ingots were then ground into fine powders. The prepared powders were loaded into a graphite die and compressed by spark plasma sintering (SPS). Cylindrical bulk materials (10 mm in diameter and ~10 mm in thickness) were fabricated at 693 K under 60 MPa for 10 min in a vacuum.

2.2. Materials Characterizations

The phase structures of the bulk samples were characterized by X-ray diffraction (XRD, Bruker AXS, Karlsruhe, Germany) using Cu Kα radiation (λ = 1.5406 Å). The density ρ of specimens was determined using the Archimedes principle. The relative density of samples was above 99%, indicating that all samples have compact structure and high density after SPS. Microstructure was characterized by the field emission scanning electron microscopy (FESEM) with the energy dispersive spectroscopy (EDS).

2.3 Thermoelectric Properties Measurements

In order to measure their thermoelectric properties, the samples were cut into 3 × 2 × 10 mm3 bars perpendicular to the pressure direction and Φ6 × 1.5 mm2 plates parallel to the pressure direction, respectively. The electrical conductivity and the Seebeck coefficients were measured simultaneously via the standard four-probe method using a ZEM-3 (ULVAC Technologies, Inc., Chigasaki, Japan) under a low-pressure helium atmosphere from room temperature to 550 K. Thermal conductivity was calculated from the specific heat Cp, the thermal diffusivity λ, and the density, using the equation κtot = Cpλρ [31]. The thermal diffusivity was measured by the laser flash method (NETZSCH, LFA-457, Selb, Germany). The Hall coefficient RH was measured by a physical properties measurement system (Quantum Design, PPMS-9, San Diego, CA, USA) in magnetic fields ranging from 0 to 5 T. The carrier concentration n and mobility μ were calculated by the relation n = 1/eRH and μ = σRH, where e is the electron charge.

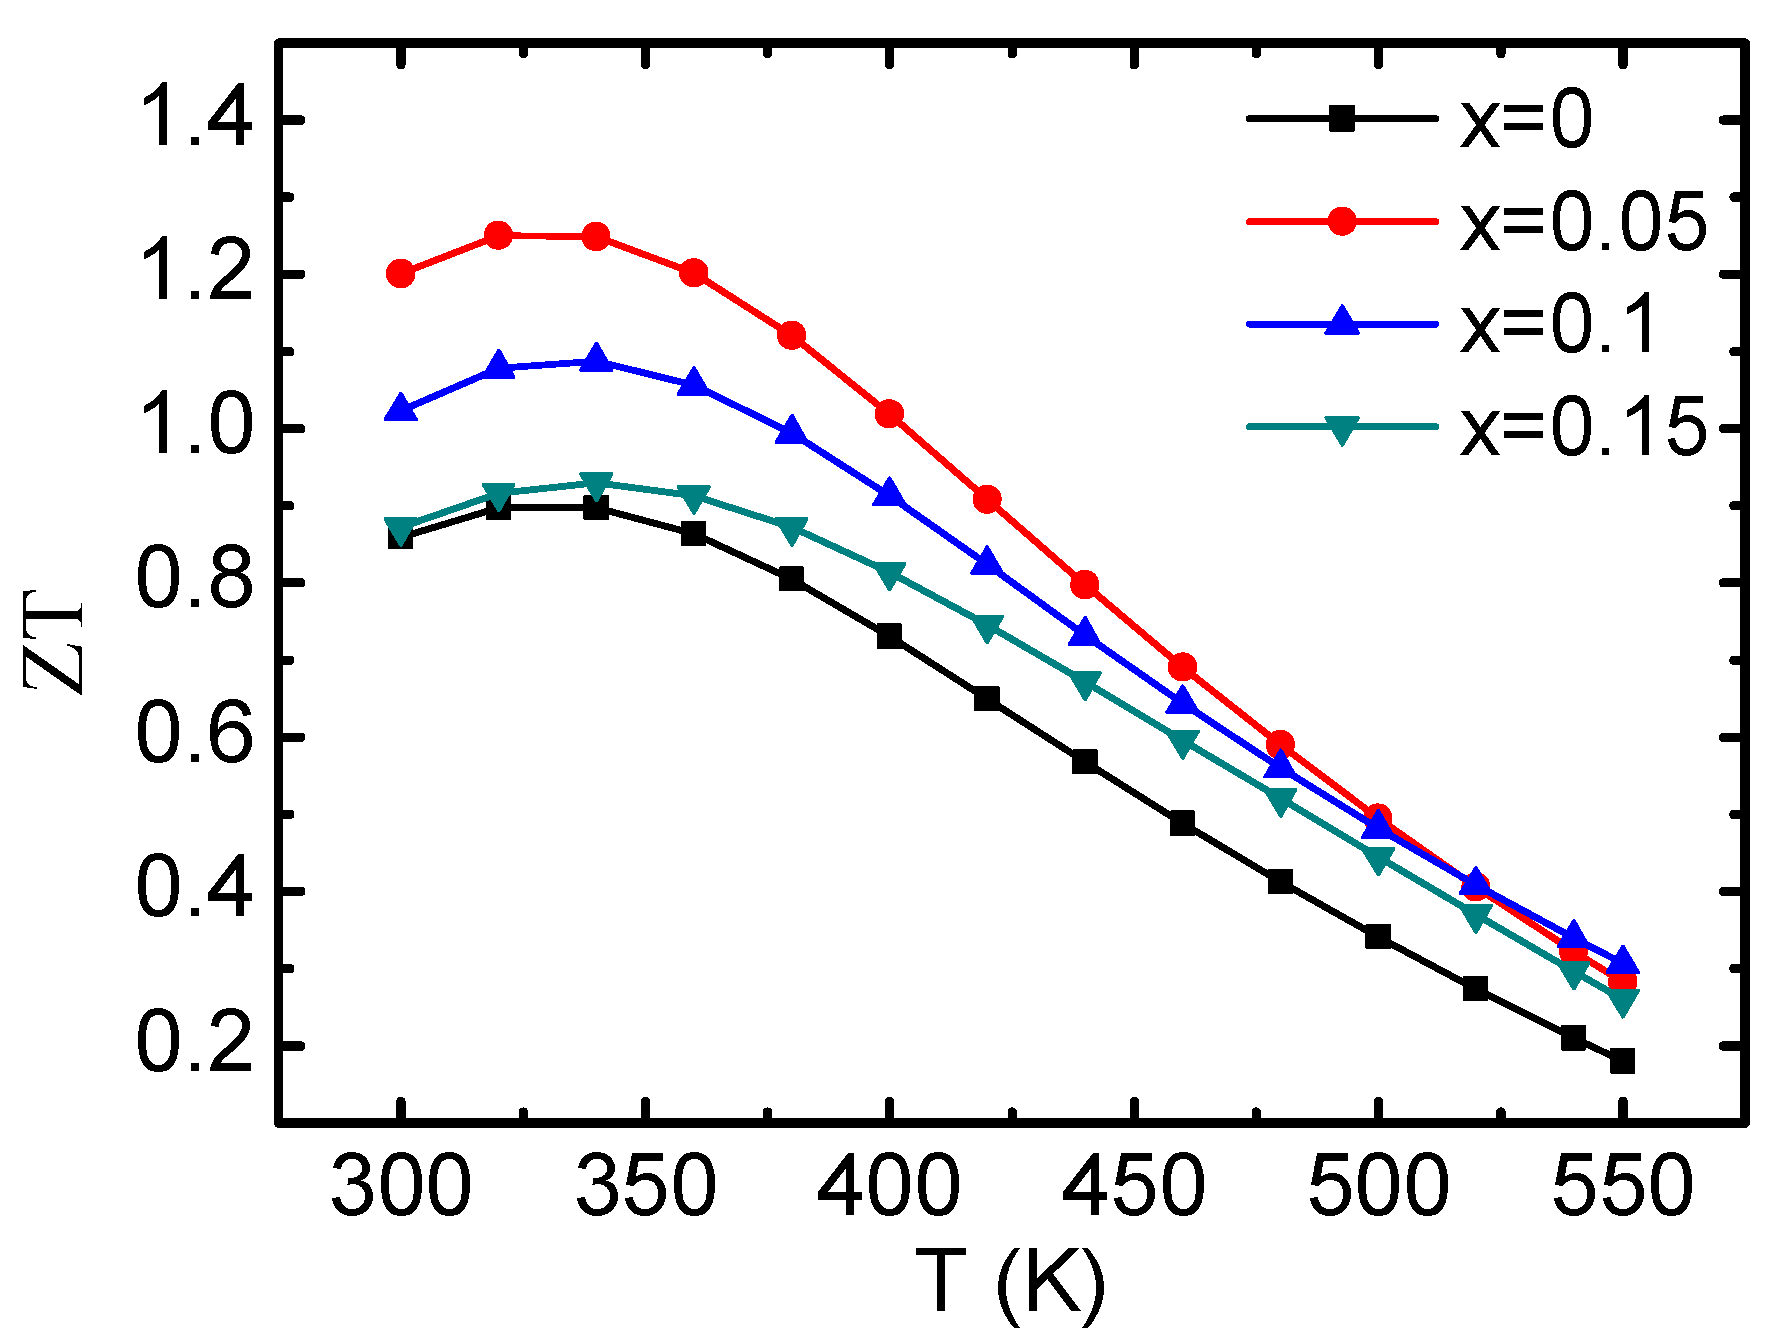
3. Results and Discussion

The XRD patterns of BiSbTe + graphene (x wt%, x = 0, 0.05, 0.1 and 0.15) bulk materials are shown in Figure 1a The diffraction peaks of all samples are indexed to the BiSbTe structure with the space group R3-m (JCPDS Card No. 49-1713). No obvious impurity peak of graphene is observed. This may be due to the fact that the low content of graphene is far below the detection limit.
To confirm the presence of graphene in the BiSbTe composites, Raman spectroscopy has been performed, as shown in Figure 1b. The Raman spectra of the graphene shows three bands at 1354, 1586, and 2893 cm−1, which are corresponding to the disordered (D) band, graphitic (G) band, and broad (2D) band, respectively [32]. The characteristic Raman peaks of the BiSbTe matrix are in the range of 55 cm−1 to 215 cm−1. For the Raman spectrum of the BiSbTe + graphene (x = 0.05) composite, both the characteristic peaks of the BiSbTe and graphene are detected. This result confirms the existence of graphene in the composite and suggests that the graphene does not change its form during the synthesis.
To further investigate the distribution of graphene in the composites, FESEM has been performed, and the images of the BiSbTe matrix, graphene, and one typical composite (x = 0.05) are shown in Figure 2. The layered structure of BiSbTe is evidently observed for all composites, as shown in Figure 2a–c. Some floccule, which is quite similar to the graphene (Figure 2d), has been observed in the grain boundary (Figure 2b) and at the edge of the grains (Figure 2c) in the sample with x = 0.05. The EDS results show that area A in Figure 2c has higher carbon concentration than area B, confirming that the floccule is graphene. The EDS results for other composites are similar to the one with x = 0.05 and the graphene homogeneously distributes in the composites.
The temperature-dependent (a) electrical conductivity, (b) Seebeck coefficient and (c) power factor (PF = S2σ) for BiSbTe + graphene (x wt%, x = 0, 0.05, 0.1 and 0.15) are plotted in Figure 3. As shown in Figure 3a, the electrical conductivity decreases with increasing temperature, showing a typical metallic behavior. The BiSbTe matrix shows typical electrical conductivity of 1.0 × 10⁵ S/m at room temperature. This value is slightly smaller than those of samples prepared by zone melting [16,17,27,33], but higher than those of samples prepared by SPS [28]. After introducing additional graphene, the electrical conductivity slightly enhances for x = 0.05, and then decreases with further increasing graphene content. Typical electrical conductivity for x = 0.05 in the work is 1.15 × 10⁵ S/m at room temperature, and 5 × 10⁴ S/m at 550 K.
The electrical conductivity is related to the carrier concentration and mobility, which can be expressed as σ = neμ. As shown in Table 1, the carrier concentration increases after alloying with graphene. On the other hand, the carrier mobility decreases gradually with increasing graphene, which may be due to the high specific surface area and possible aggregation of graphene. These two effects result in the complicated changes in electrical conductivity with graphene. It should be noticed that the carrier concentrations (2.66~3.09) × 1019 cm−3 of our samples are slightly higher than those of (1.4~2.0) × 1019 cm−3 in the previous report, but the mobility is larger than them, leading to much higher electrical conductivity [28]. This may benefit from the zone melting process before SPS.
As shown in Figure 3b, the Seebeck coefficients of all samples are positive in the whole temperature range, indicating p-type conduction. The Seebeck coefficients of all samples first increase and reach highest values at about 380 K. Then they begin to decrease with increasing temperature. The decrease can be understood as the thermal excitation of minority carriers across the band gap. Below 400 K, the Seebeck coefficients first decrease and then increase with increasing graphene, showing an opposite trend to the electrical conductivity. At high temperatures, the Seebeck coefficients increase with graphene content. The Seebeck coefficient value varies probably due to the n, which can be explained using the equation [34,35]:
S = 8 π 2 k B 3 e h 2 m * T ( π 3 n ) 2 3
where kB is the Boltzmann constant, m* represents the effective mass of carrier, h is the Planck’s constant. As shown in Table 1, after introducing graphene, the effective mass increases slightly. Such a phenomenon is also observed in the previous study [28].
The power factors decrease with increasing temperature, as shown in Figure 3c. The additional graphene slightly enhances the power factor of the composites, indicating that the electrical properties can be optimized by additional graphene. The sample with x = 0.05 exhibits higher power factor values than the BiSbTe matrix in the whole temperature range, and the ones with x = 0.10 and 0.15 show higher power factor above 370 K. The maximum power factor is found to be 4.8 × 10⁻³ Wm−1K−2 at 300 K for x = 0.05, which is much higher than that of ~3.2 × 10⁻³ Wm−1K−2 in the previous study [28].
Figure 4 displays the temperature dependence of the total thermal conductivity κtot (a) and lattice thermal conductivity κlat (b). The total thermal conductivity for all samples decreases from 300 K to 340 K and achieves the lowest value at this temperature. Then it starts to rise with the increasing temperature. It may be attributed to the ambipolar diffusion. The total thermal conductivity of the BiSbTe + graphene (x wt%, x = 0.05, 0.1, and 0.15) composites are lower than that of the pristine BiSbTe. But it shows an increasing tendency with increasing graphene. The lowest total thermal conductivity decreases from 1.51 Wm−1K−1 for x = 0 to 1.14 Wm−1K−1 for x = 0.05. The lattice thermal conductivity is calculated by using the equation, κlat = κtotκele. The electronic thermal conductivity can be obtained by the Wiedemann-Franz law, κele = LσT, where L is the Lorenz number. Here the Lorenz number is gained by using the calculated degenerated Fermi energy and scattering parameter in case of a single band model [36,37,38]. The changing tendency of the lattice thermal conductivity with graphene is consistent with the total thermal conductivity. The lattice thermal conductivity of all the composites (x = 0.05, 0.1 and 0.15) is lower than that of the matrix. The lowest lattice conductivity is found to be ~0.6 Wm−1K−1 for x = 0.05. The lower lattice thermal conductivity of the BiSbTe + graphene samples is due to the wide effective phase boundary phonon scattering. The graphene possesses ultrahigh specific surface area which would form more interfaces to scatter phonons to decrease the lattice thermal conductivity.
Figure 5 presents the temperature dependence of figure of merit (ZT) for all bulk samples. The graphene addition enhances the ZT values of composites, which is due to the synergistic optimization of graphene. Even though the power factors of our samples are much larger than those of the previous study, the higher thermal conductivity leads to a peak ZT value of 1.25 at 320 K in the BiSbTe composite with 0.05 wt% graphene additions, which is almost the same as in the previous study [28]. It should be emphasized that the larger power factors in our samples are of benefit to power generation [39].

4. Conclusions

P-type BiSbTe alloys with different mass ratio of graphene addition were prepared by zone melting combined with subsequent spark plasma sintering. The TE properties and micro-structure have been investigated. Addition of graphene into the BiSbTe matrix slightly ameliorates the electrical properties by increasing the carrier concentration and simultaneously reduces the lattice thermal conductivity by scattering the phonons. Consequently, both effects significantly increase the TE performance and a peak ZT value of 1.25 has been obtained at 320 K. These results indicate that the additional graphene can synergistically improve the TE performances of the BiSbTe system.

Acknowledgments

This work is supported by the National Nature Science Foundation of China (NSFC No. 11304327, 11404348, 11404350, and 11234012), Ningbo Municipal Natural Science Foundation (2014A610011), Ningbo Science and Technology Innovation Team (Grant No. 2014B82004), and Zhejiang Provincial Science Fund for Distinguished Young Scholars (LR16E020001).

Author Contributions

Dewen Xie performed the the experiments and prepared the manuscript. Jingtao Xu and Guoqiang Liu revised the manuscript. Zhu Liu assisted in experimental setup. Theoretical work and part of the numerical calculation was provided by Hezhu Shao and Xiaojian Tan. Jun Jiang and Haochuan Jiang provided the research train of thought and also proofread the manuscript.

Conflicts of Interest

The authors declare no conflict of interest.

References

  1. Goldsmid, H.J. Bismuth telluride and its alloys as materials for thermoelectric generation. Materials 2014, 7, 2577–2592. [Google Scholar] [CrossRef]
  2. Bell, L.E. Cooling, heating, generating power, and recovering waste heat with thermoelectric systems. Science 2008, 321, 1457–1461. [Google Scholar] [CrossRef] [PubMed]
  3. Chen, G.; Dresselhaus, M.S.; Dresselhaus, G.; Fleurial, J.P.; Caillat, T. Recent developments in thermoelectric materials. Int. Mater. Rev. 2003, 48, 45–66. [Google Scholar] [CrossRef]
  4. Rowe, D.M. CRC Handbook of Thermoelectrics; CRC Taylor and Francis: Boca Raton, FL, USA, 2012; pp. 16.1–16.33. [Google Scholar]
  5. Zhang, T.; Jiang, J.; Xiao, Y.; Zhai, Y.; Yang, S.; Xu, G. Enhanced thermoelectric figure of merit in p-type BiSbTeSe alloy with ZnSb addition. J. Mater. Chem. A 2013, 1, 966–969. [Google Scholar] [CrossRef]
  6. Poudel, B.; Hao, Q.; Ma, Y.; Lan, Y.; Minnich, A.; Yu, B.; Yan, X.; Wang, D.; Muto, A.; Vashaee, D.; et al. High-thermoelectric performance of nanostructured bismuth antimony telluride bulk alloys. Science 2008, 320, 634–638. [Google Scholar] [CrossRef] [PubMed]
  7. Ma, Y.; Hao, Q.; Poudel, B.; Lan, Y.; Yu, B.; Wang, D.; Chen, G.; Ren, Z. Enhanced thermoelectric figure-of-merit in p-type nanostructured bismuth antimony tellurium alloys made from elemental chunks. Nano Lett. 2008, 8, 2580–2584. [Google Scholar] [CrossRef] [PubMed]
  8. Medlin, D.L.; Ramasse, Q.M.; Spataru, C.D.; Yang, N.Y.C. Structure of the (0001) basal twin boundary in Bi2Te3. J. Appl. Phy. 2010, 108, 043517. [Google Scholar] [CrossRef]
  9. Heremans, J.P.; Jovovic, V.; Toberer, E.S.; Saramat, A.; Kurosaki, K.; Charoenphakdee, A.; Snyder, G.J. Enhancement of thermoelectric efficiency in PbTe by distortion of the electronic density of states. Science 2008, 321, 554–557. [Google Scholar] [CrossRef] [PubMed]
  10. Zhai, Y.; Zhang, T.; Xiao, Y.; Jiang, J.; Yang, S.; Xu, G. Enhanced thermoelectric performance in n-type Bi2Te2.994Cl0.006/In2Te3 composite. J. Alloy. Compd. 2013, 563, 285–288. [Google Scholar] [CrossRef]
  11. Venkatasubramanian, R.; Siivola, E.; Colpitts, T.; O'quinn, B. Thin-film thermoelectric devices with high room-temperature figures of merit. Nature 2001, 413, 597–602. [Google Scholar] [CrossRef] [PubMed]
  12. Wang, H.; LaLonde, A.D.; Pei, Y.; Snyder, G.J. The criteria for beneficial disorder in thermoelectric solid solutions. Adv. Funct. Mater. 2013, 23, 1586–1596. [Google Scholar] [CrossRef]
  13. Zhao, L.D.; Zhang, B.P.; Liu, W.S.; Li, J.F. Effect of mixed grain sizes on thermoelectric performance of Bi2Te3 compound. J. Appl. Phy. 2009, 105, 023704. [Google Scholar] [CrossRef]
  14. Lan, Y.; Poudel, B.; Ma, Y.; Wang, D.; Dresselhaus, M.S.; Chen, G.; Ren, Z. Structure study of bulk nanograined thermoelectric bismuth antimony telluride. Nano Lett. 2009, 9, 1419–1422. [Google Scholar] [CrossRef] [PubMed]
  15. Zhao, L.D.; Zhang, B.P.; Li, J.F.; Zhou, M.; Liu, W.S.; Liu, J. Thermoelectric and mechanical properties of nano-SiC-dispersed Bi2Te3 fabricated by mechanical alloying and spark plasma sintering. J. Alloy. Compd. 2008, 455, 259–264. [Google Scholar] [CrossRef]
  16. Zhang, T.; Zhang, Q.; Jiang, J.; Xiong, Z.; Chen, J.; Zhang, Y.; Li, W.; Xu, G. Enhanced thermoelectric performance in p-type BiSbTe bulk alloy with nanoinclusion of ZnAlO. Appl. Phy. Lett. 2011, 98, 022104. [Google Scholar] [CrossRef]
  17. Xiao, Y.; Chen, G.; Qin, H.; Wu, M.; Xiao, Z.; Jiang, J.; Xu, G. Enhanced thermoelectric figure of merit in p-type Bi0.48Sb1.52Te3 alloy with WSe2 addition. J. Mater. Chem. A 2014, 2, 8512–8516. [Google Scholar]
  18. Zhang, Q.; Ai, X.; Wang, L.; Chang, Y.; Luo, W.; Jiang, W.; Chen, L. Improved Thermoelectric Performance of Silver Nanoparticles-Dispersed Bi2Te3 Composites Deriving from Hierarchical Two-Phased Heterostructure. Adv. Funct. Mater. 2015, 25, 966–976. [Google Scholar] [CrossRef]
  19. Zhang, Q.; Ai, X.; Wang, W.; Wang, L.; Jiang, W. Preparation of 1-D/3-D structured AgNWs/Bi2Te3 nanocomposites with enhanced thermoelectric properties. Acta Mater. 2014, 73, 37–47. [Google Scholar] [CrossRef]
  20. Pasricha, R.; Gupta, S.; Srivastava, A.K. A Facile and Novel Synthesis of Ag–Graphene-Based Nanocomposites. Small 2009, 5, 2253–2259. [Google Scholar] [CrossRef] [PubMed]
  21. Dong, J.; Liu, W.; Li, H.; Su, X.; Tang, X.; Uher, C. In situ synthesis and thermoelectric properties of PbTe–graphene nanocomposites by utilizing a facile and novel wet chemical method. J. Mater. Chem. A 2013, 1, 12503–12511. [Google Scholar] [CrossRef]
  22. Feng, B.; Xie, J.; Cao, G.; Zhu, T.; Zhao, X. Enhanced thermoelectric properties of p-type CoSb3/graphene nanocomposite. J. Mater. Chem. A 2013, 1, 13111–13119. [Google Scholar] [CrossRef]
  23. Chen, H.; Yang, C.; Liu, H.; Zhang, G.; Wan, D.; Huang, F. Thermoelectric properties of CuInTe2/graphene composites. Cryst. Eng. Comm. 2013, 15, 6648–6651. [Google Scholar] [CrossRef]
  24. Li, A.H.; Shahbazi, M.; Zhou, S.H.; Wang, G.X.; Zhang, C.; Jood, P.; Peleckis, G.; Du, Y.; Cheng, Z.X.; Wang, X.L.; Kuo, Y.K. Electronic structure and thermoelectric properties of Bi2Te3 crystals and graphene-doped Bi2Te3. Thin Solid Films 2010, 518, e57–e60. [Google Scholar] [CrossRef]
  25. Liang, B.; Song, Z.; Wang, M.; Wang, L.; Jiang, W. Fabrication and Thermoelectric Properties of Graphene/Bi2Te3 Composite Materials. J. Nanomater. 2013, 6, 210767:1–210767:5. [Google Scholar]
  26. Kim, J.I.; Lee, E.S.; Kim, J.Y.; Choi, S.M.; Lee, K.H.; Seo, W.S. Thermoelectric properties of unoxidized graphene/Bi2Te2.7Se0.3 composites synthesized by exfoliation/re-assembly method. Phy. Status Solidi RRL 2014, 8, 357–361. [Google Scholar] [CrossRef]
  27. Zhang, T.; Jiang, J.; Xiao, Y.; Zhai, Y.; Yang, S.; Xu, G. In Situ Precipitation of Te Nanoparticles in p-Type BiSbTe and the Effect on Thermoelectric Performance. ACS Appl. Mater. Interfaces 2013, 5, 3071–3074. [Google Scholar] [CrossRef] [PubMed]
  28. Suh, D.; Lee, S.; Mun, H.; Park, S.H.; Lee, K. H.; Kim, S.W.; Choi, J.Y.; Baik, S. Enhanced thermoelectric performance of Bi0.5Sb1.5Te3-expanded graphene composites by simultaneous modulation of electronic and thermal carrier transport. Nano Energy 2015, 13, 67–76. [Google Scholar] [CrossRef]
  29. Jiang, J.; Chen, L.; Bai, S.; Yao, Q.; Wang, Q. Thermoelectric properties of p-type (Bi2Te3)x(Sb2Te3)1−x crystals prepared via zone melting. J. Cryst. Growth 2005, 277, 258–263. [Google Scholar] [CrossRef]
  30. Jiang, J.; Chen, L.; Yao, Q.; Wang, Q. Preparation and properties of p-type (Bi2Te3)x(Sb2Te3)1-x thermoelectric materials. Mater. Trans. 2005, 46, 959–962. [Google Scholar] [CrossRef]
  31. Kim, S.I.; Lee, K.H.; Mun, H.A.; Kim, H.S.; Hwang, S.W.; Roh, J.W.; Yang, D.J.; Shin, W.H.; Li, S.H.; Lee, Y.H.; et al. Dense dislocation arrays embedded in grain boundaries for high-performance bulk thermoelectrics. Science 2015, 348, 109–114. [Google Scholar] [CrossRef] [PubMed]
  32. Tuinstra, F.; Koenig, J.L. Raman spectrum of graphite. The Journal of Chemical Physics. 1970, 53, 1126–1130. [Google Scholar] [CrossRef]
  33. Zhang, T.; Jiang, J.; Xiao, Y.; Zhai, Y.; Yang, S.; Xu, G.; Ren, Z. Effect of dehydrated-attapulgite nanoinclusions on the thermoelectric properties of BiSbTe alloys. RSC Adv. 2013, 3, 4951–4953. [Google Scholar] [CrossRef]
  34. Snyder, G.J.; Toberer, E.S. Complex thermoelectric materials. Nat. mater. 2008, 7, 105–114. [Google Scholar] [CrossRef] [PubMed]
  35. Suh, D.; Lee, D.; Kang, C.; Shon, I.J.; Kim, W.; Baik, S. Enhanced thermoelectric properties of tungsten disulfide-multiwalled carbon nanotube composites. J. Mater. Chem. 2012, 22, 21376–21381. [Google Scholar] [CrossRef]
  36. Zhao, L.D.; He, J.; Hao, S.; Wu, C.I.; Hogan, T.P.; Wolverton, C.; Dravid, V.P.; Kanatzidis, M.G. Raising the thermoelectric performance of p-type PbS with endotaxial nanostructuring and valence-band offset engineering using CdS and ZnS. J. Am. Chem. Soc. 2012, 134, 16327–16336. [Google Scholar] [CrossRef] [PubMed]
  37. May, A.F.; Fleurial, J.P.; Snyder, G.J. Thermoelectric performance of lanthanum telluride produced via mechanical alloying. Phy. Rev. B 2008, 78, 125205. [Google Scholar] [CrossRef]
  38. Johnsen, S.; He, J.; Androulakis, J.; Dravid, V.P.; Todorov, I.; Chung, D.Y.; Kanatzidis, M.G. Nanostructures boost the thermoelectric performance of PbS. J. Am. Chem. Soc. 2011, 133, 3460–3470. [Google Scholar] [CrossRef] [PubMed]
  39. Zhang, Q.H.; Huang, X.Y.; Bai, S.Q.; Shi, X.; Uher, C.; Chen, L.D. Thermoelectric Devices for Power Generation: Recent Progress and Future Challenges. Adv. Eng. Mater. 2016, 18, 194–213. [Google Scholar] [CrossRef]
Figure 1. (a) X-ray diffraction (XRD) patterns for all samples and (b) the Raman spectra of graphene powders and BiSbTe + graphene (x wt%, x = 0 and 0.05) composites.
Energies 09 00236 g001
Figure 2. Field emission scanning electron microscopy (FESEM) images of (a) BiSbTe, (b,c) BiSbTe + 0.05 wt% graphene composites, and (d) graphene. The energy dispersive spectroscopy (EDS) results of area A and B are shown in (c).
Energies 09 00236 g002
Figure 3. Temperature dependence of thermoelectric properties for BiSbTe+ x wt% graphene (x = 0, 0.05, 0.1, and 0.15) composites and reference [28]: (a) electrical conductivity, (b) the Seebeck coefficient, and (c) power factor.
Energies 09 00236 g003
Figure 4. Thermoelectric properties as a function of temperature for BiSbTe + x wt% graphene samples: (a) total thermal conductivity; (b) lattice thermal conductivity.
Energies 09 00236 g004
Figure 5. Temperature dependence of ZT values for BiSbTe with different graphene contents.
Energies 09 00236 g005
Table 1. Seebeck coefficient (μV/K), Hall coefficient (cm3/C), electrical conductivity (105 S/m), carrier concentration (1019 cm−3), carrier mobility (cm2 V−1 s−1), and effective mass (m*) of all the BiSbTe + x wt% graphene samples at 300 K.
xSRHσnμm*
02110.2351.02.662350.85
0.052040.2021.153.092310.92
0.12060.1921.043.252030.96
0.152150.2150.952.912010.92

