
Performance Analysis of a Grid-connected High Concentrating Photovoltaic System under Practical Operation Conditions

 ,
,
Abstract
:1. Introduction
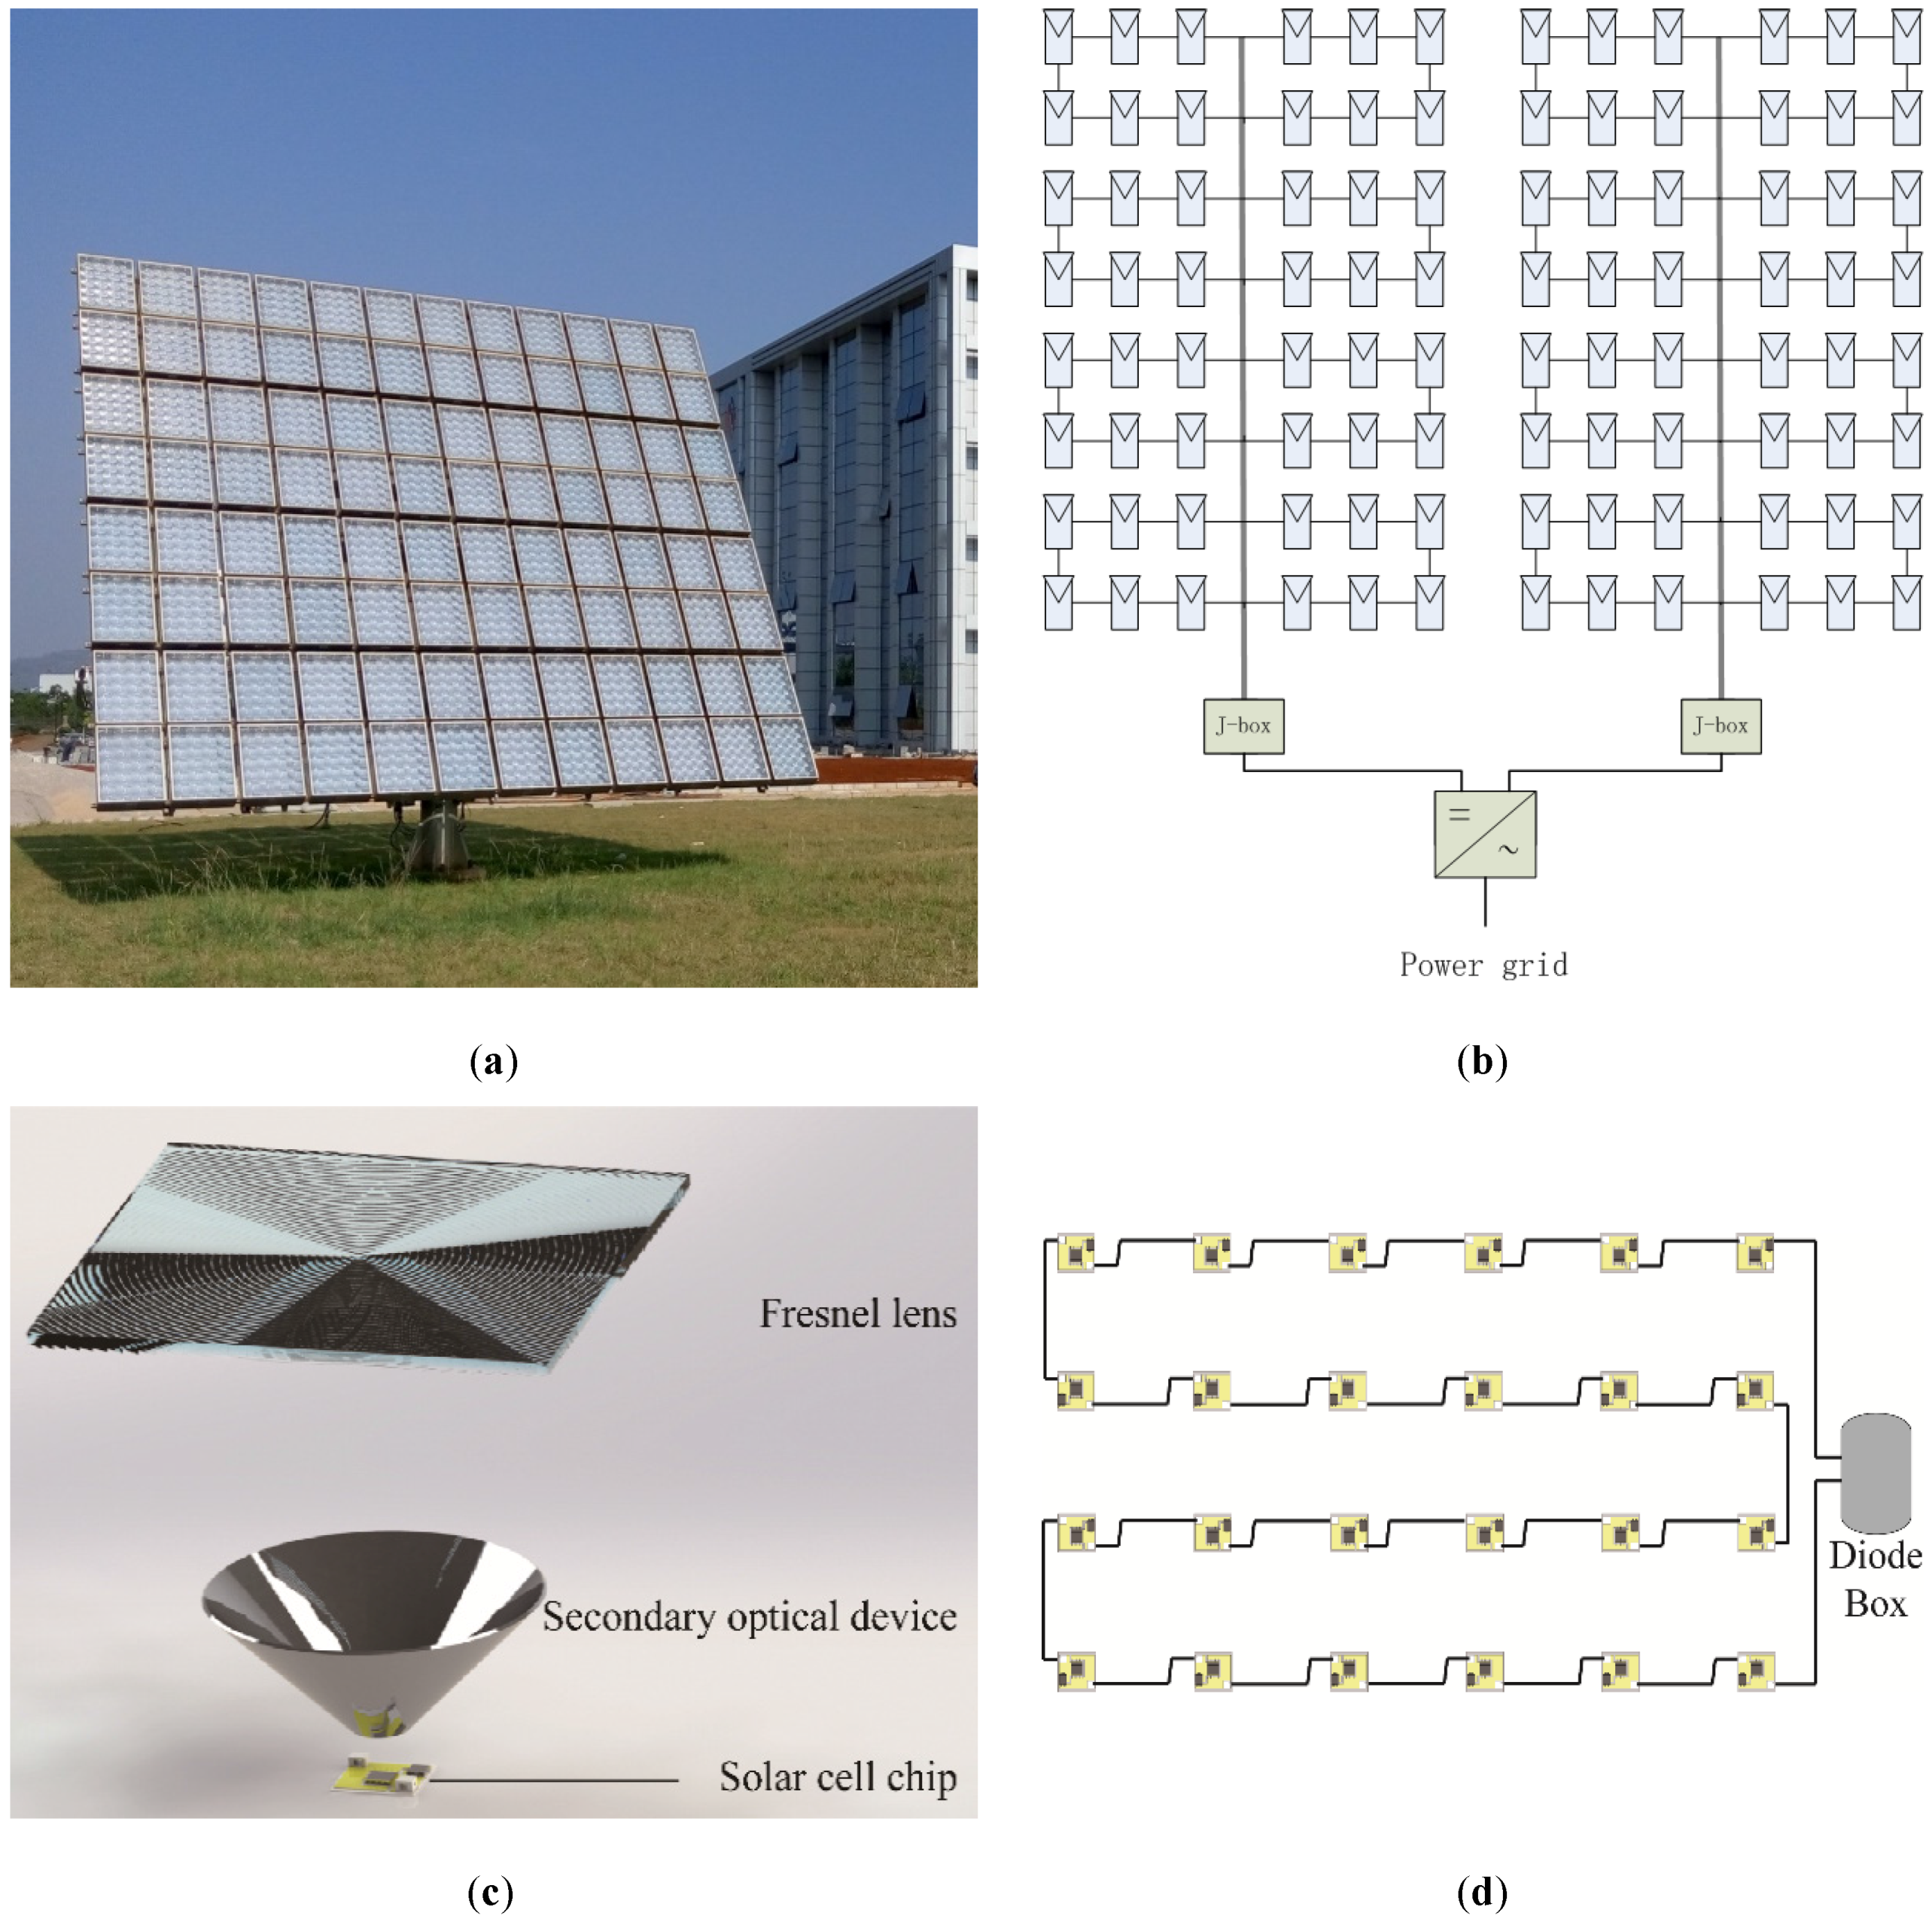
2. Experimental
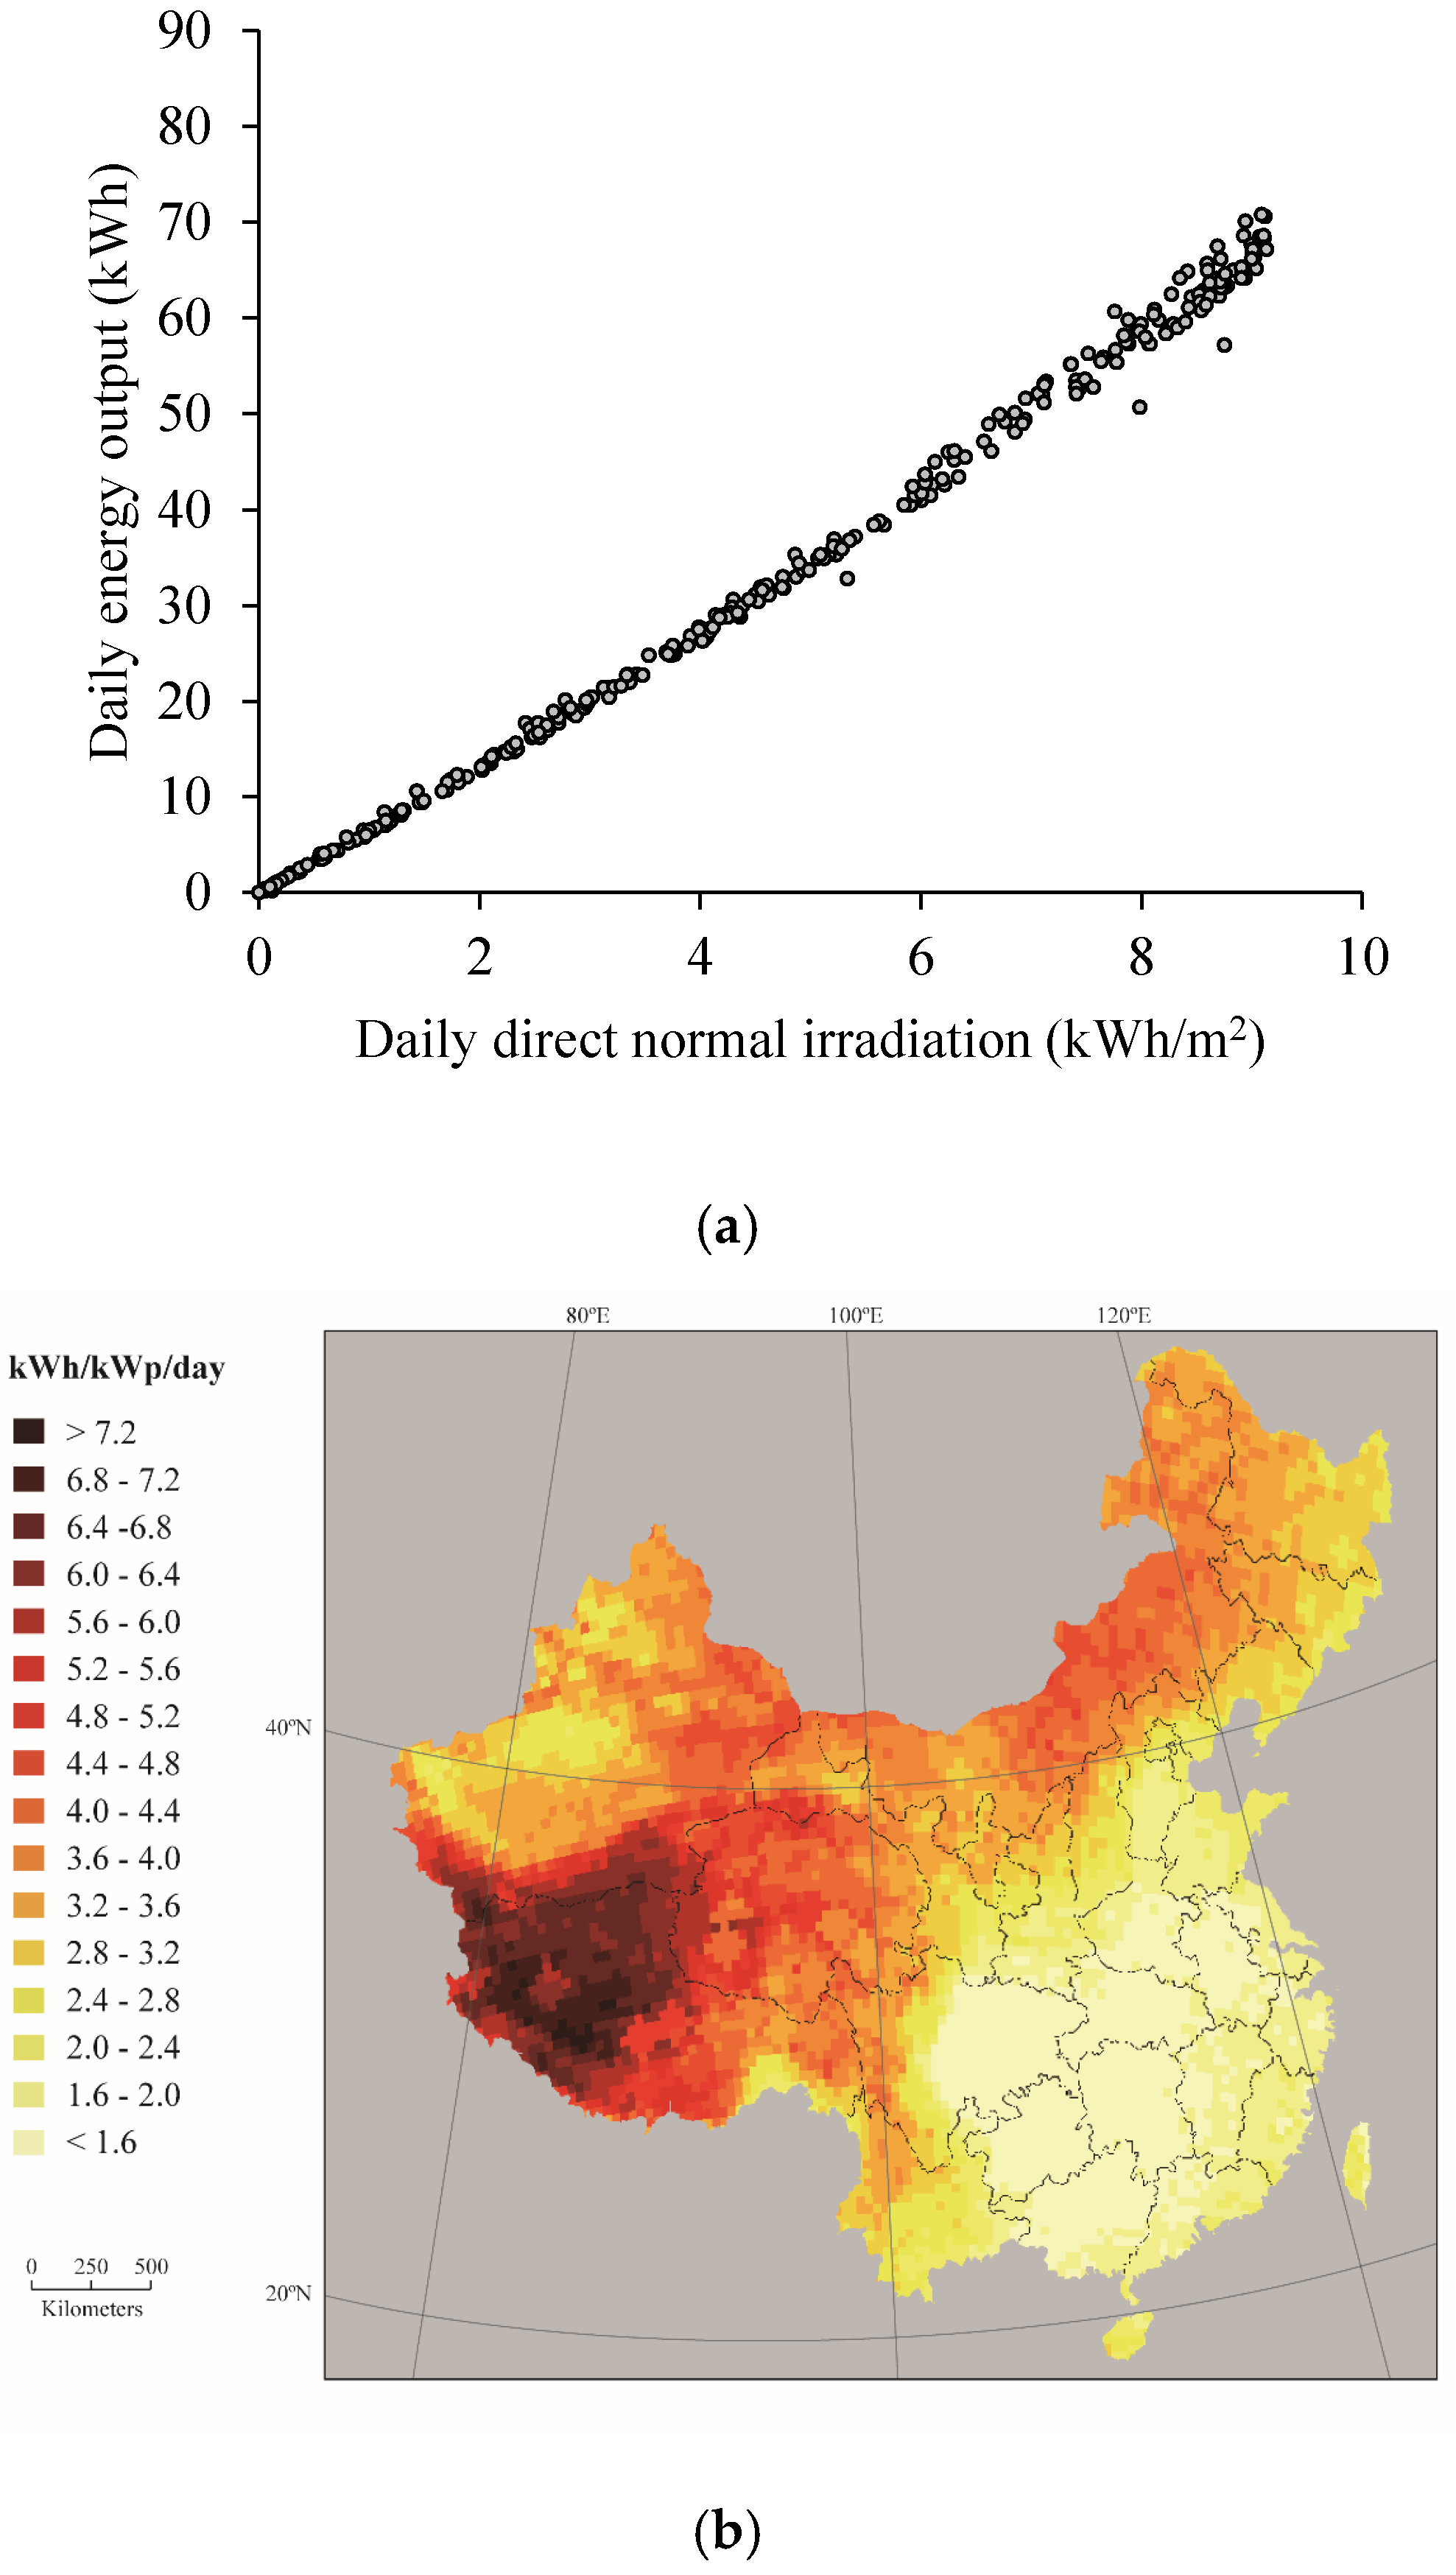
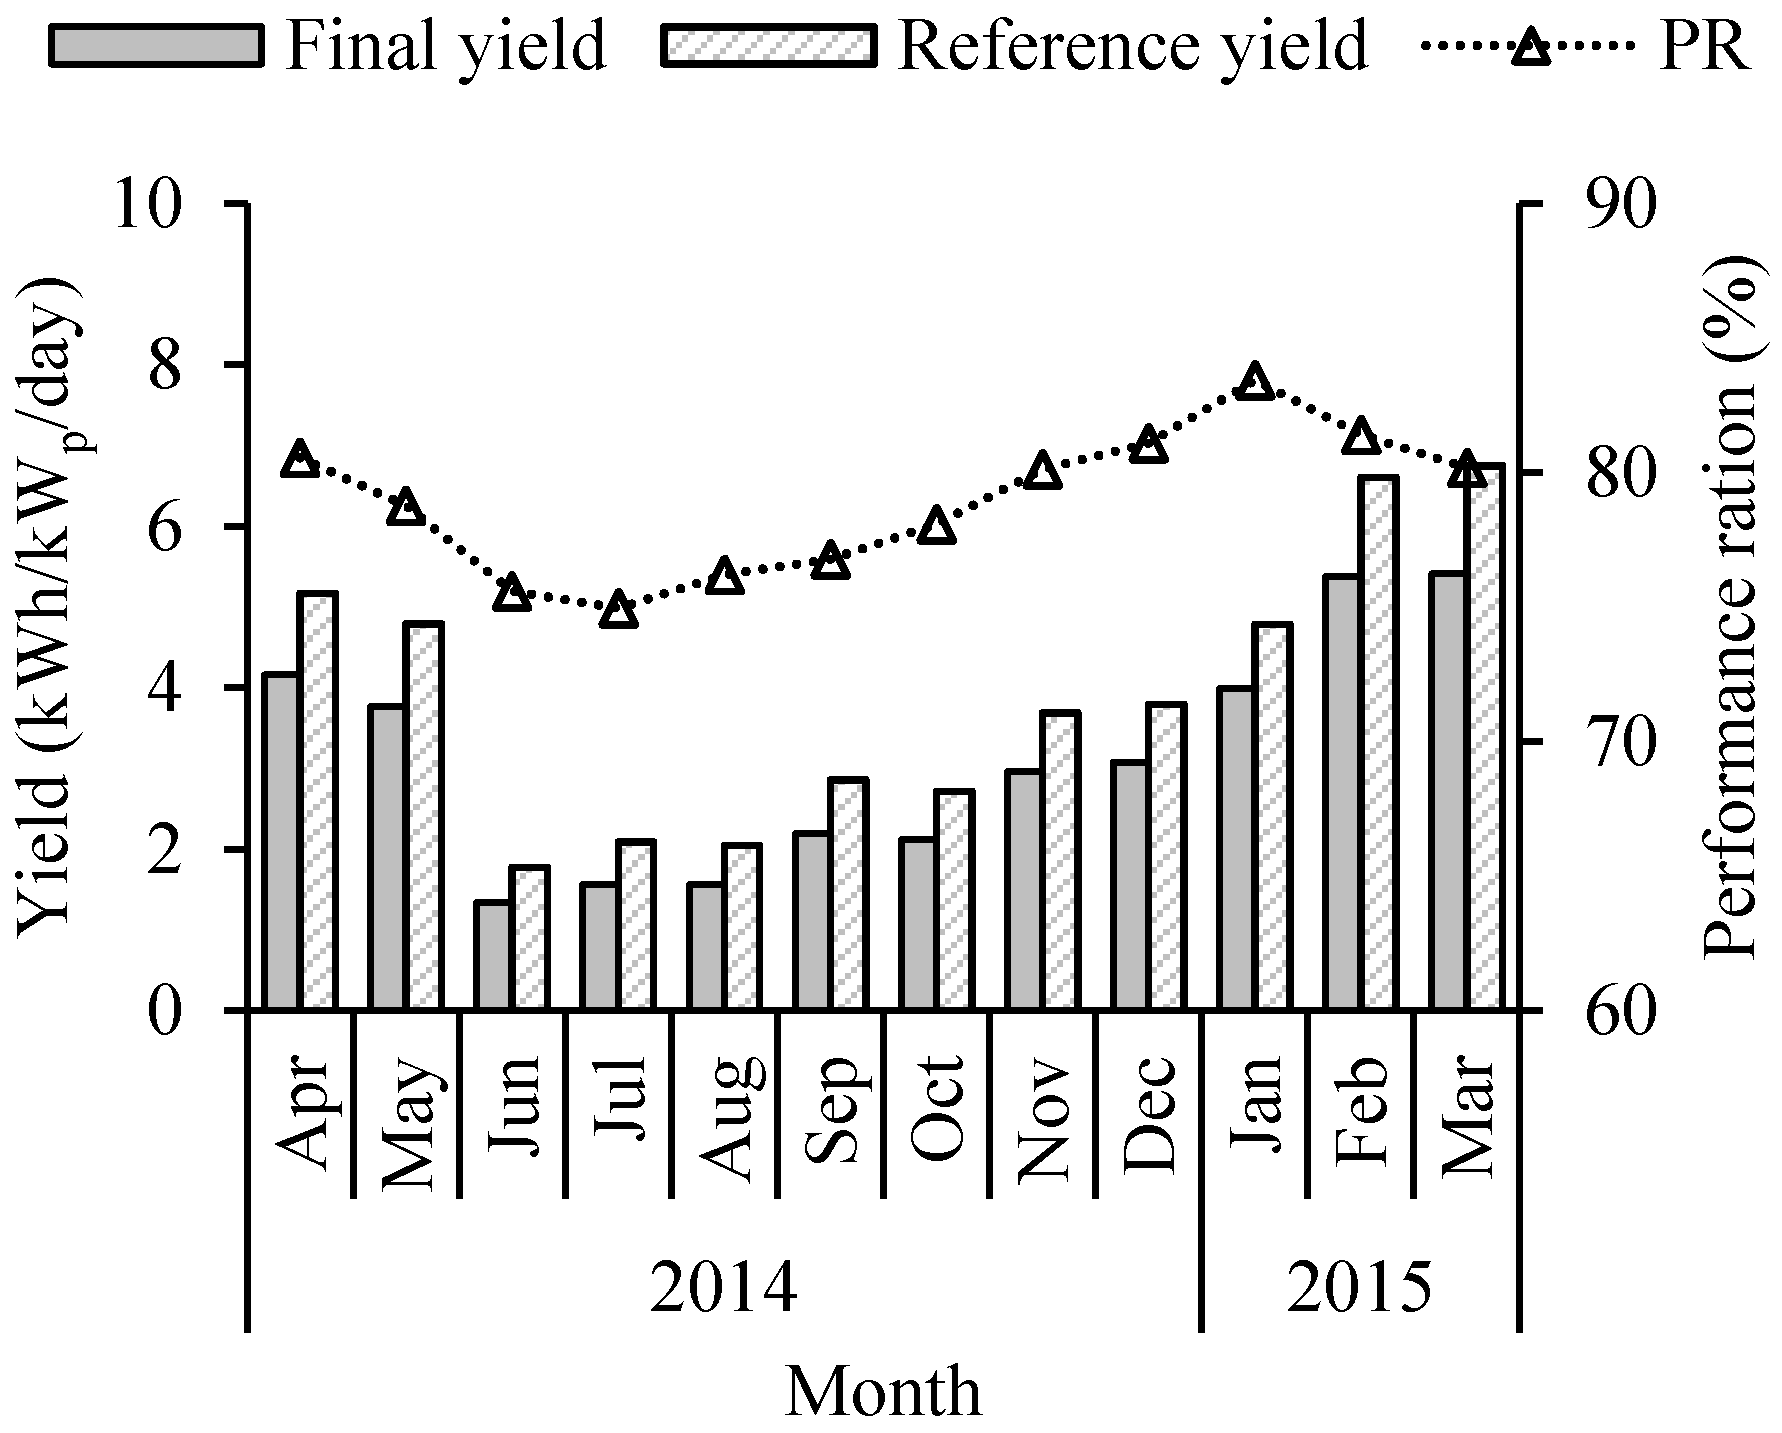
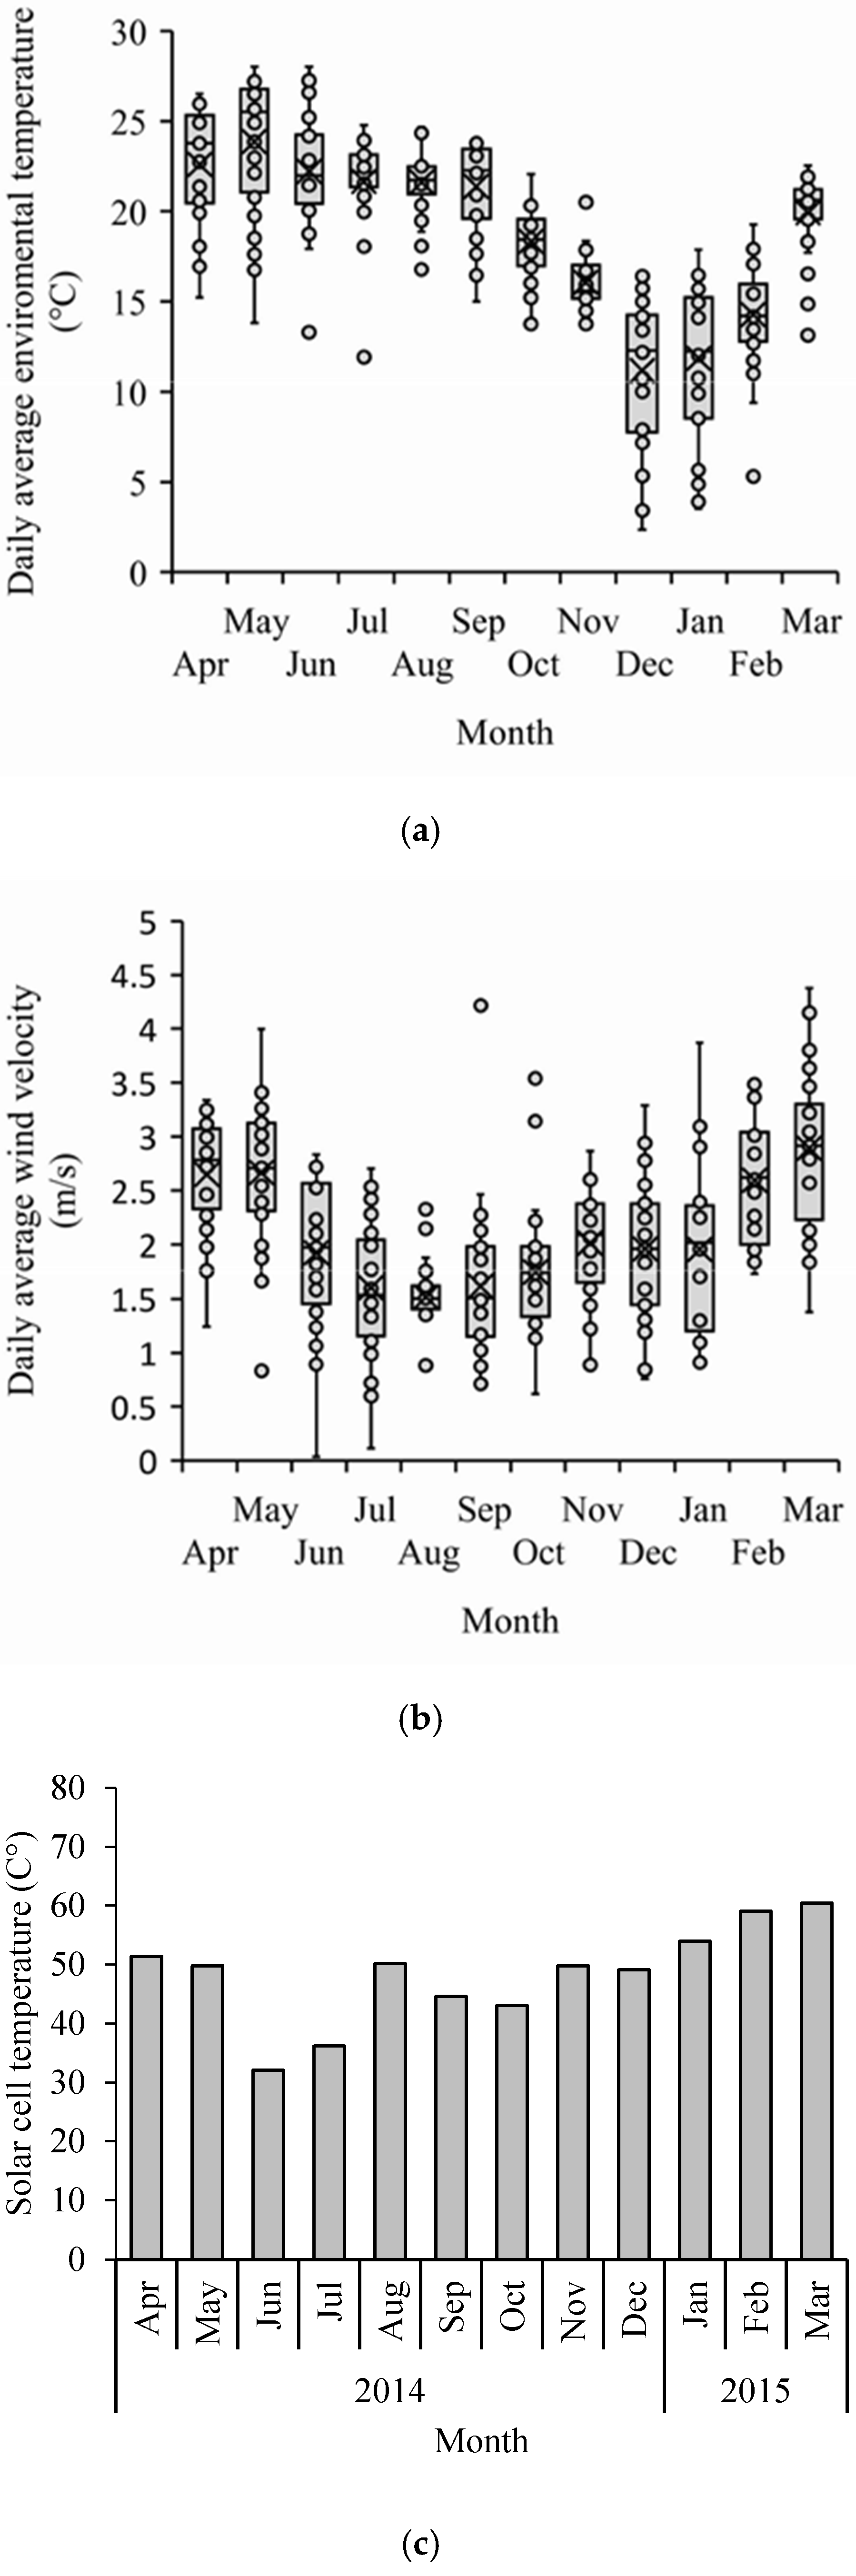
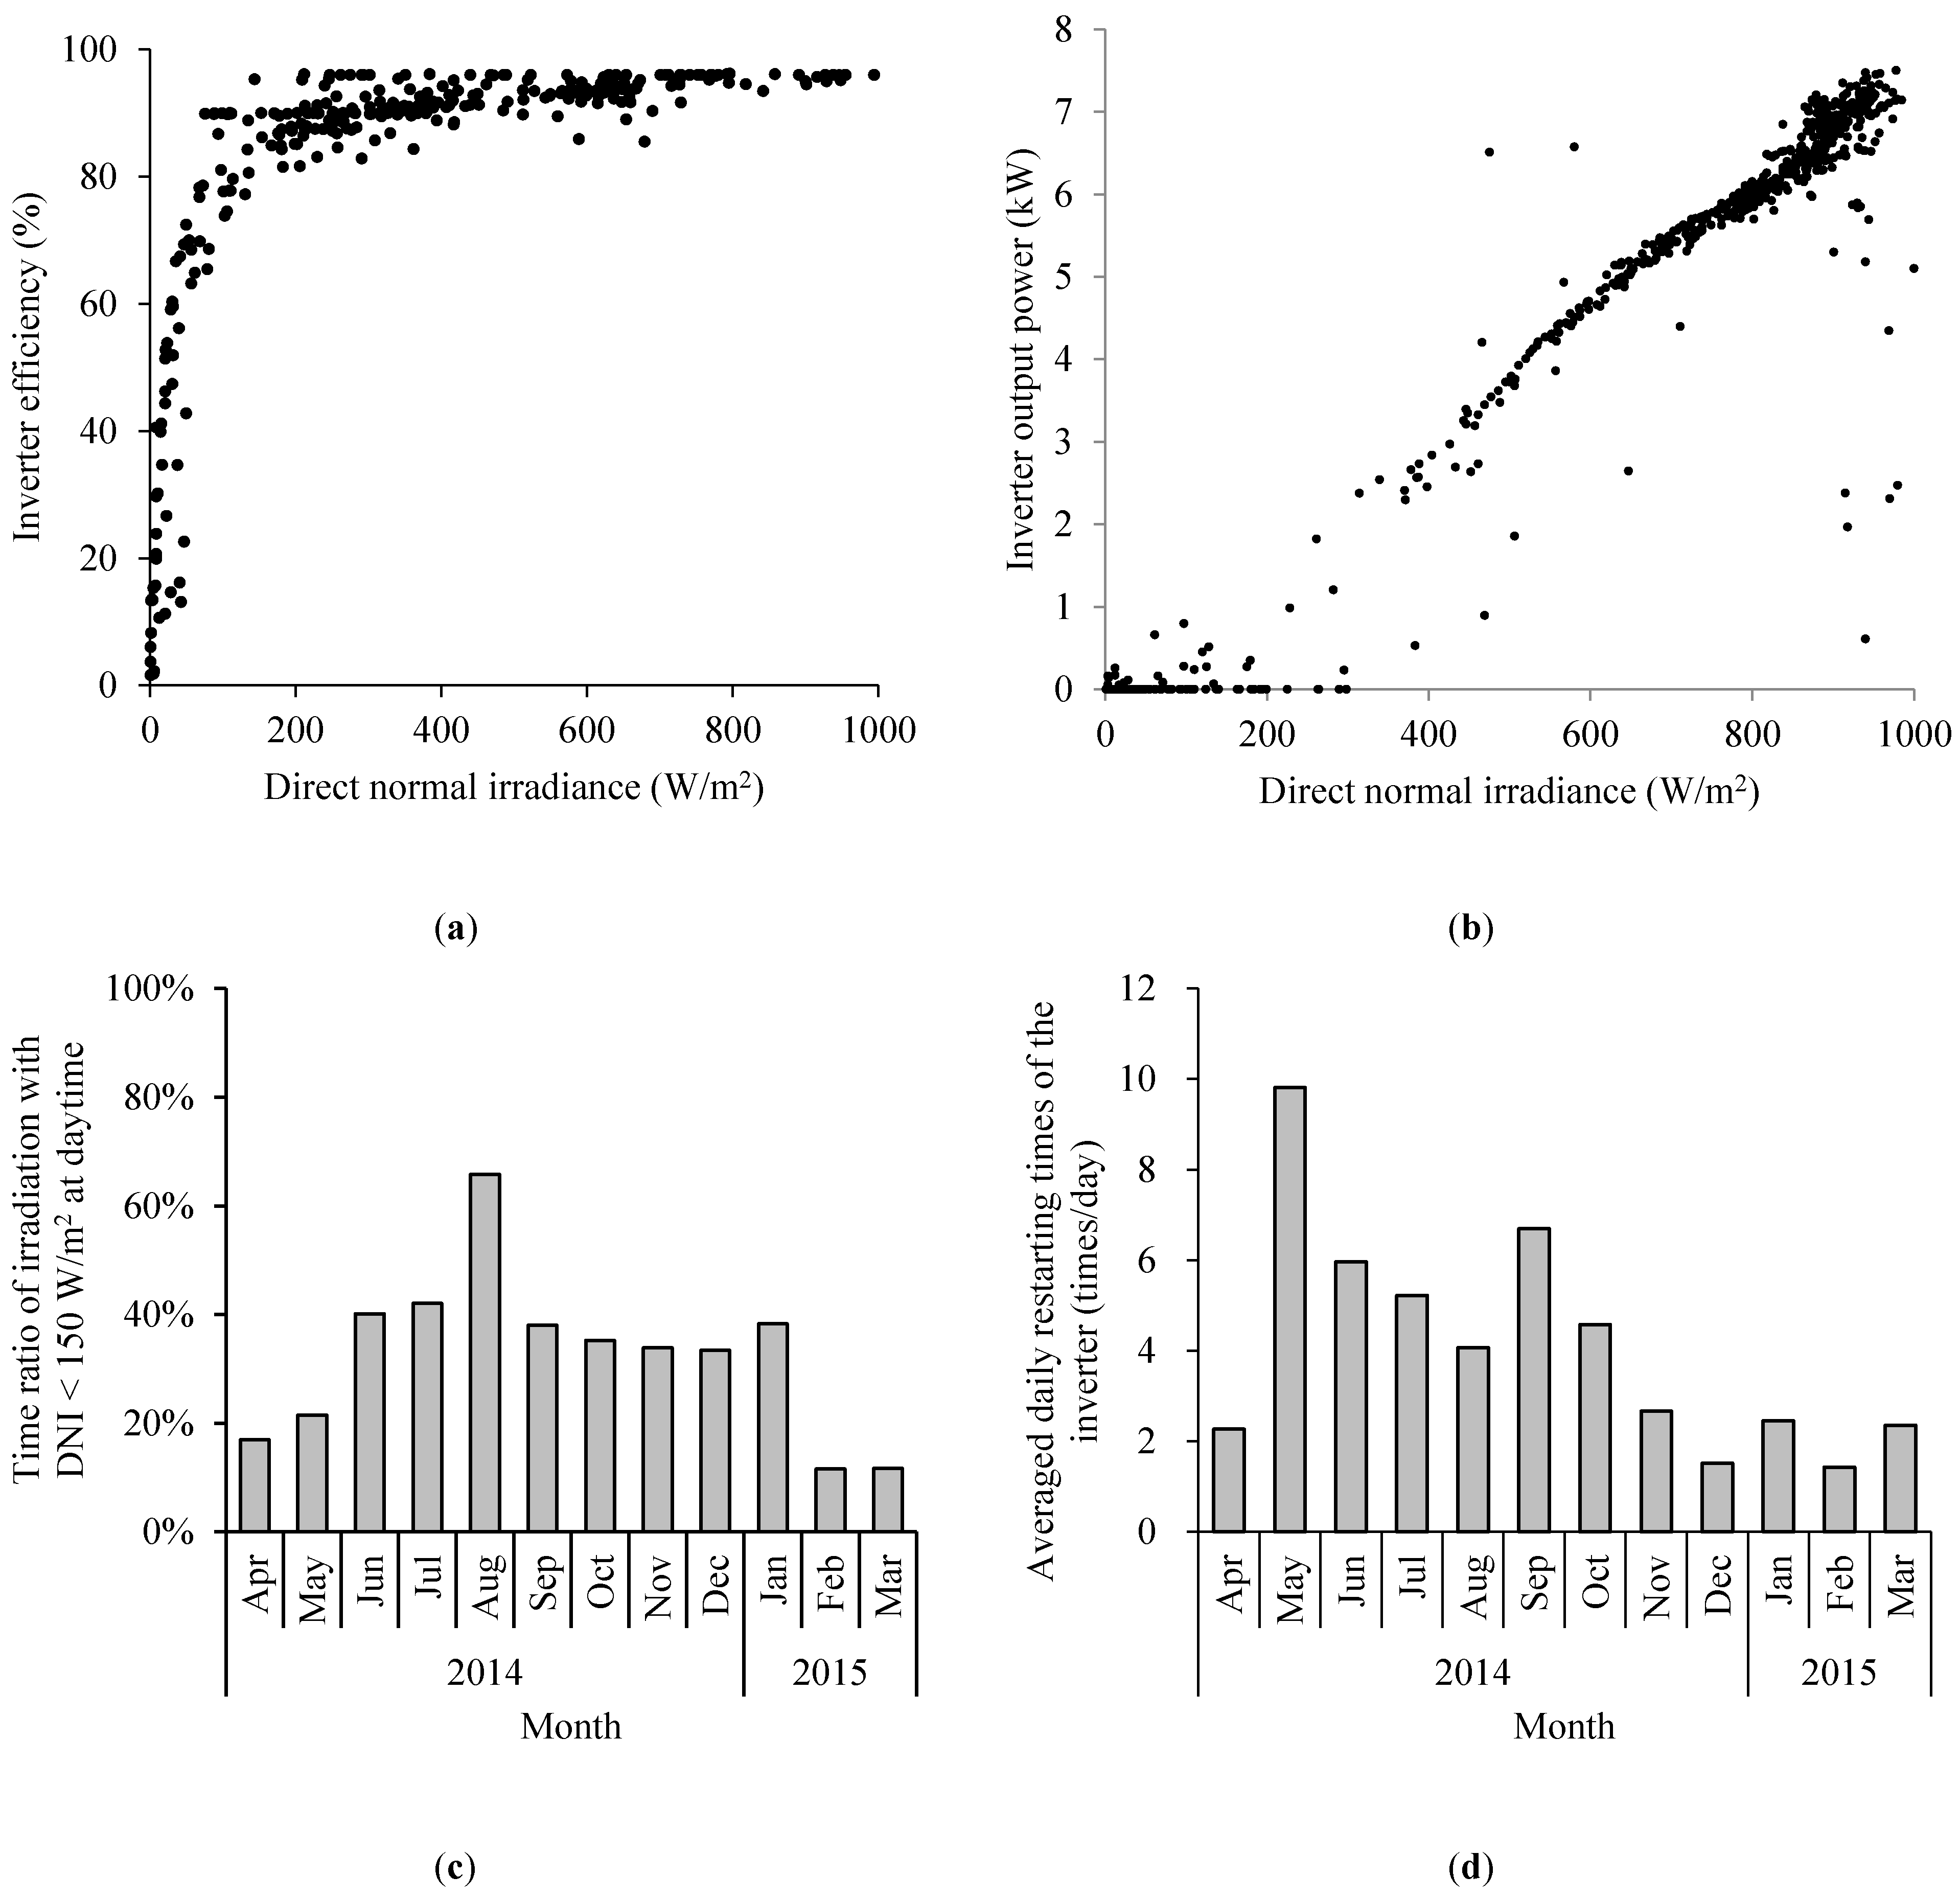
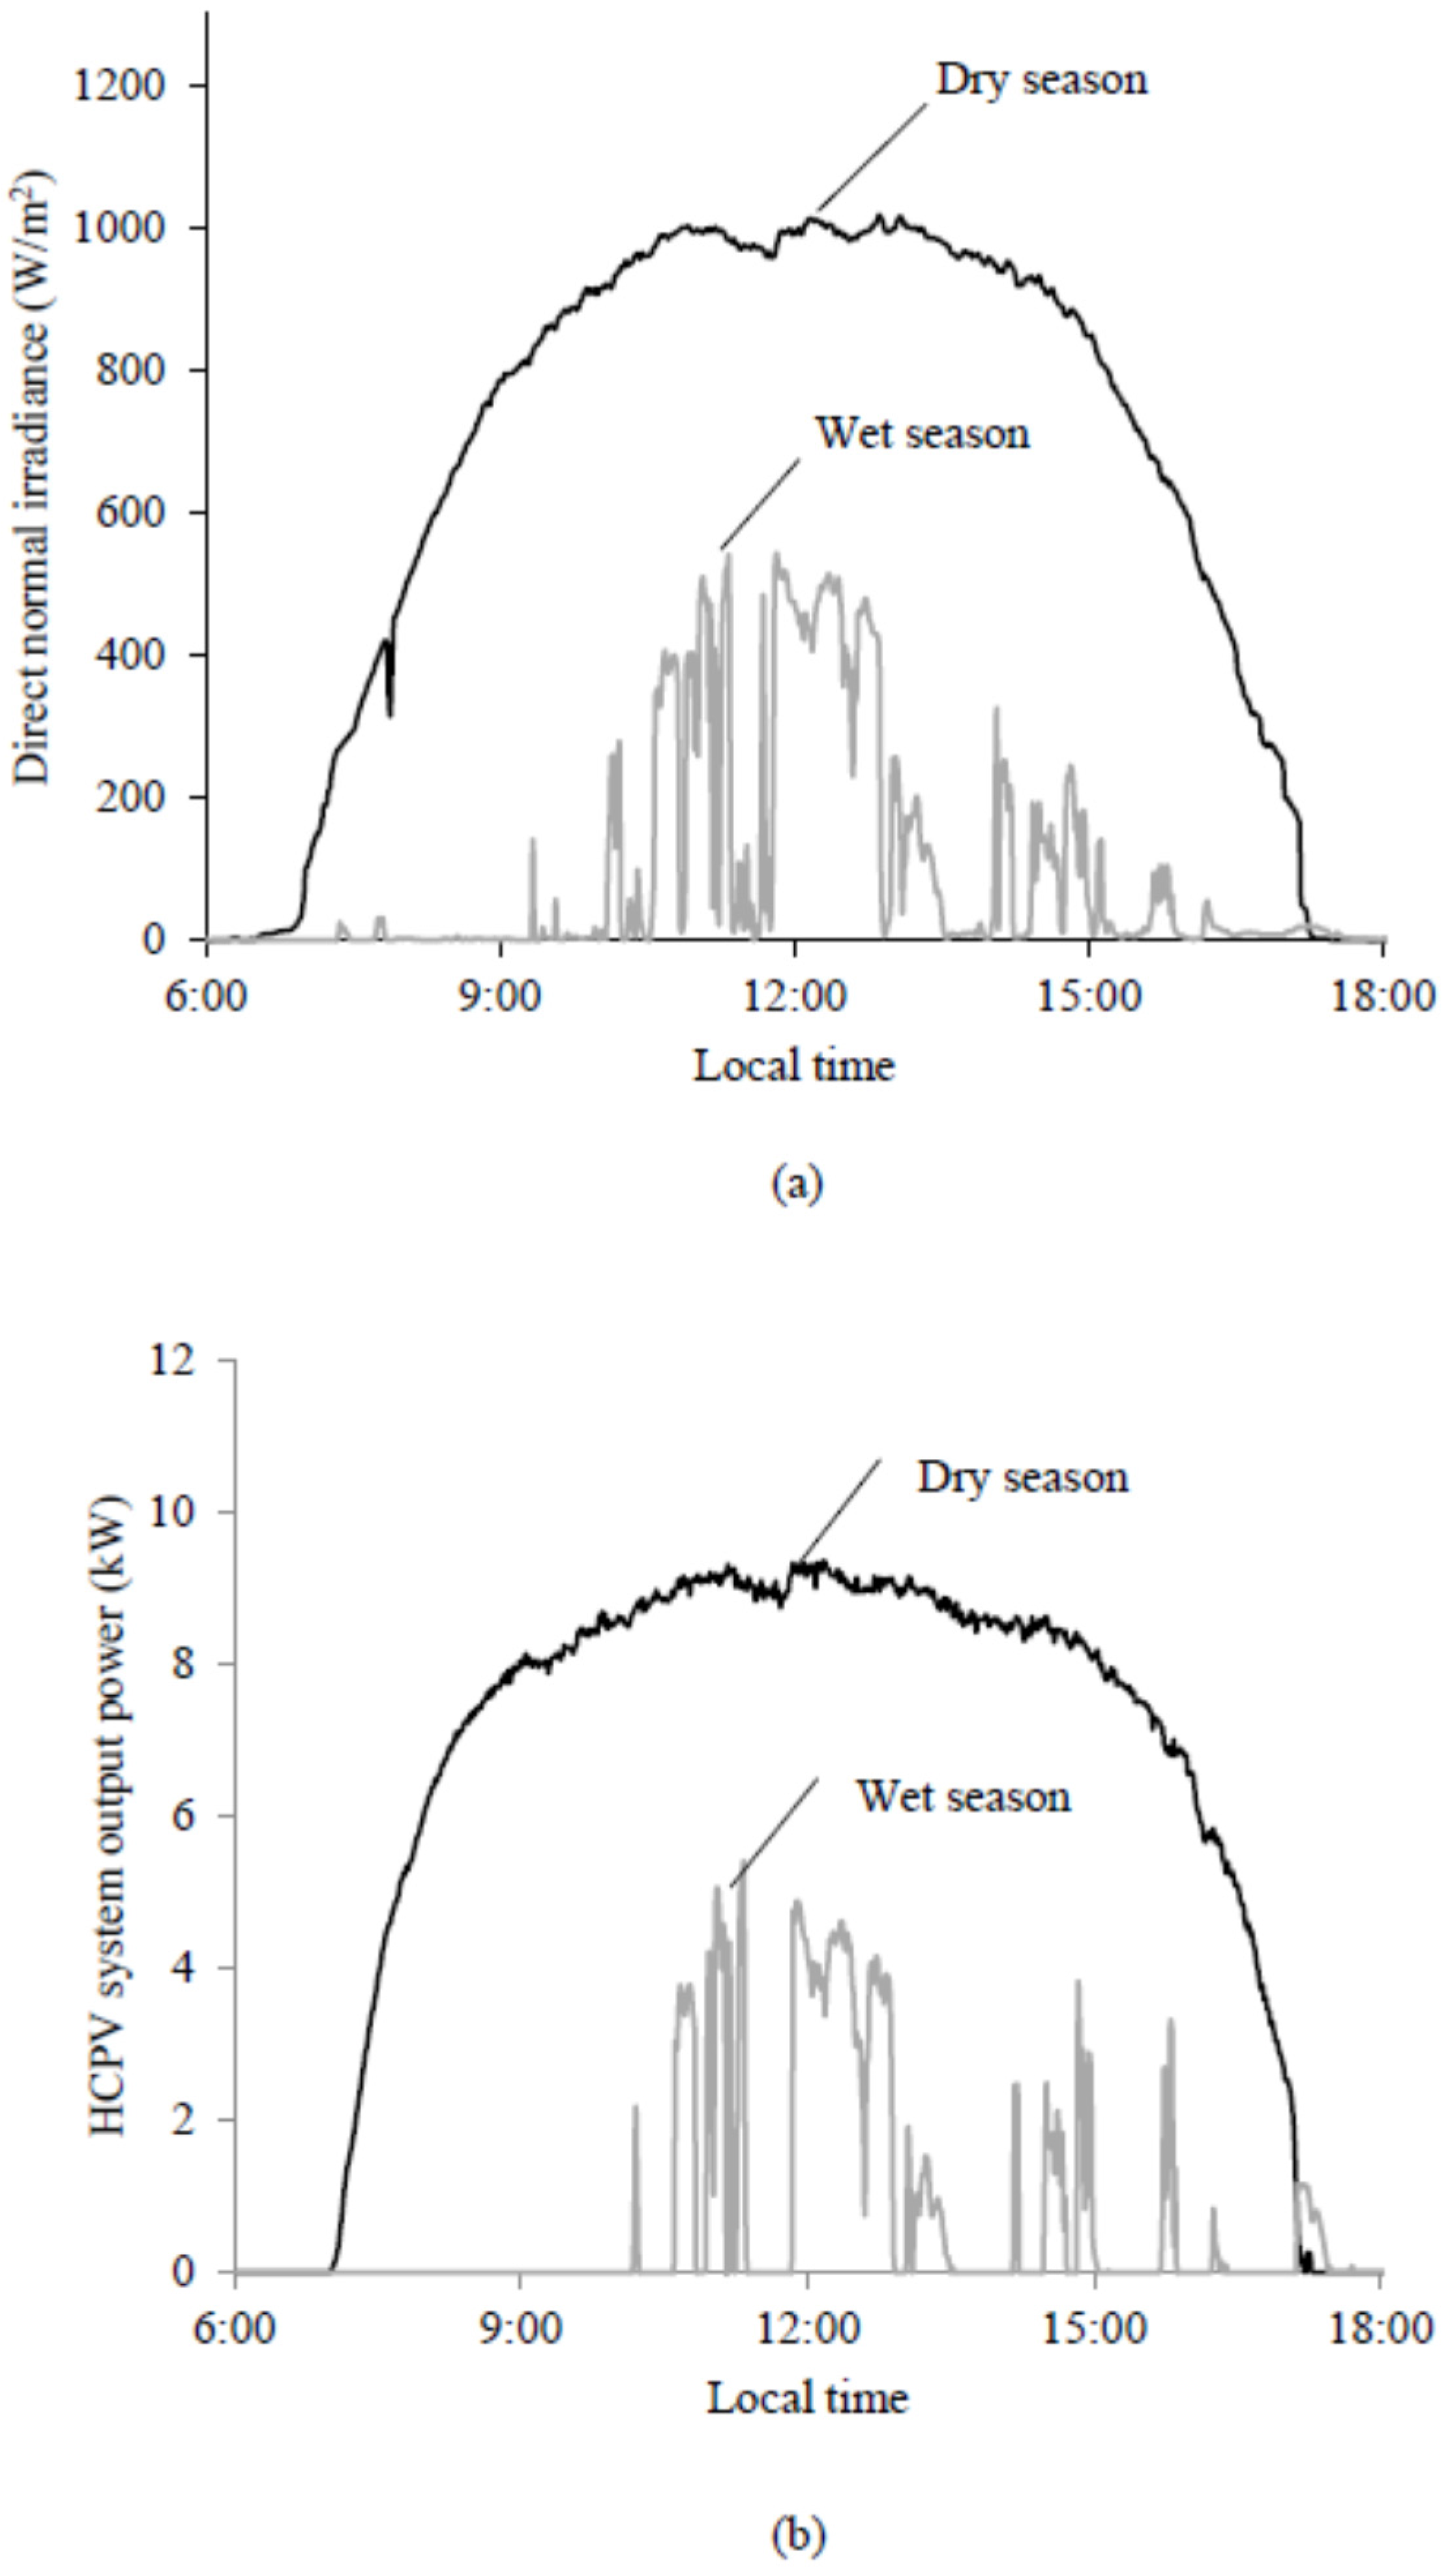
3. Results
4. Discussion
4.1. Influence on Energy Conversion by Environmental Parameters
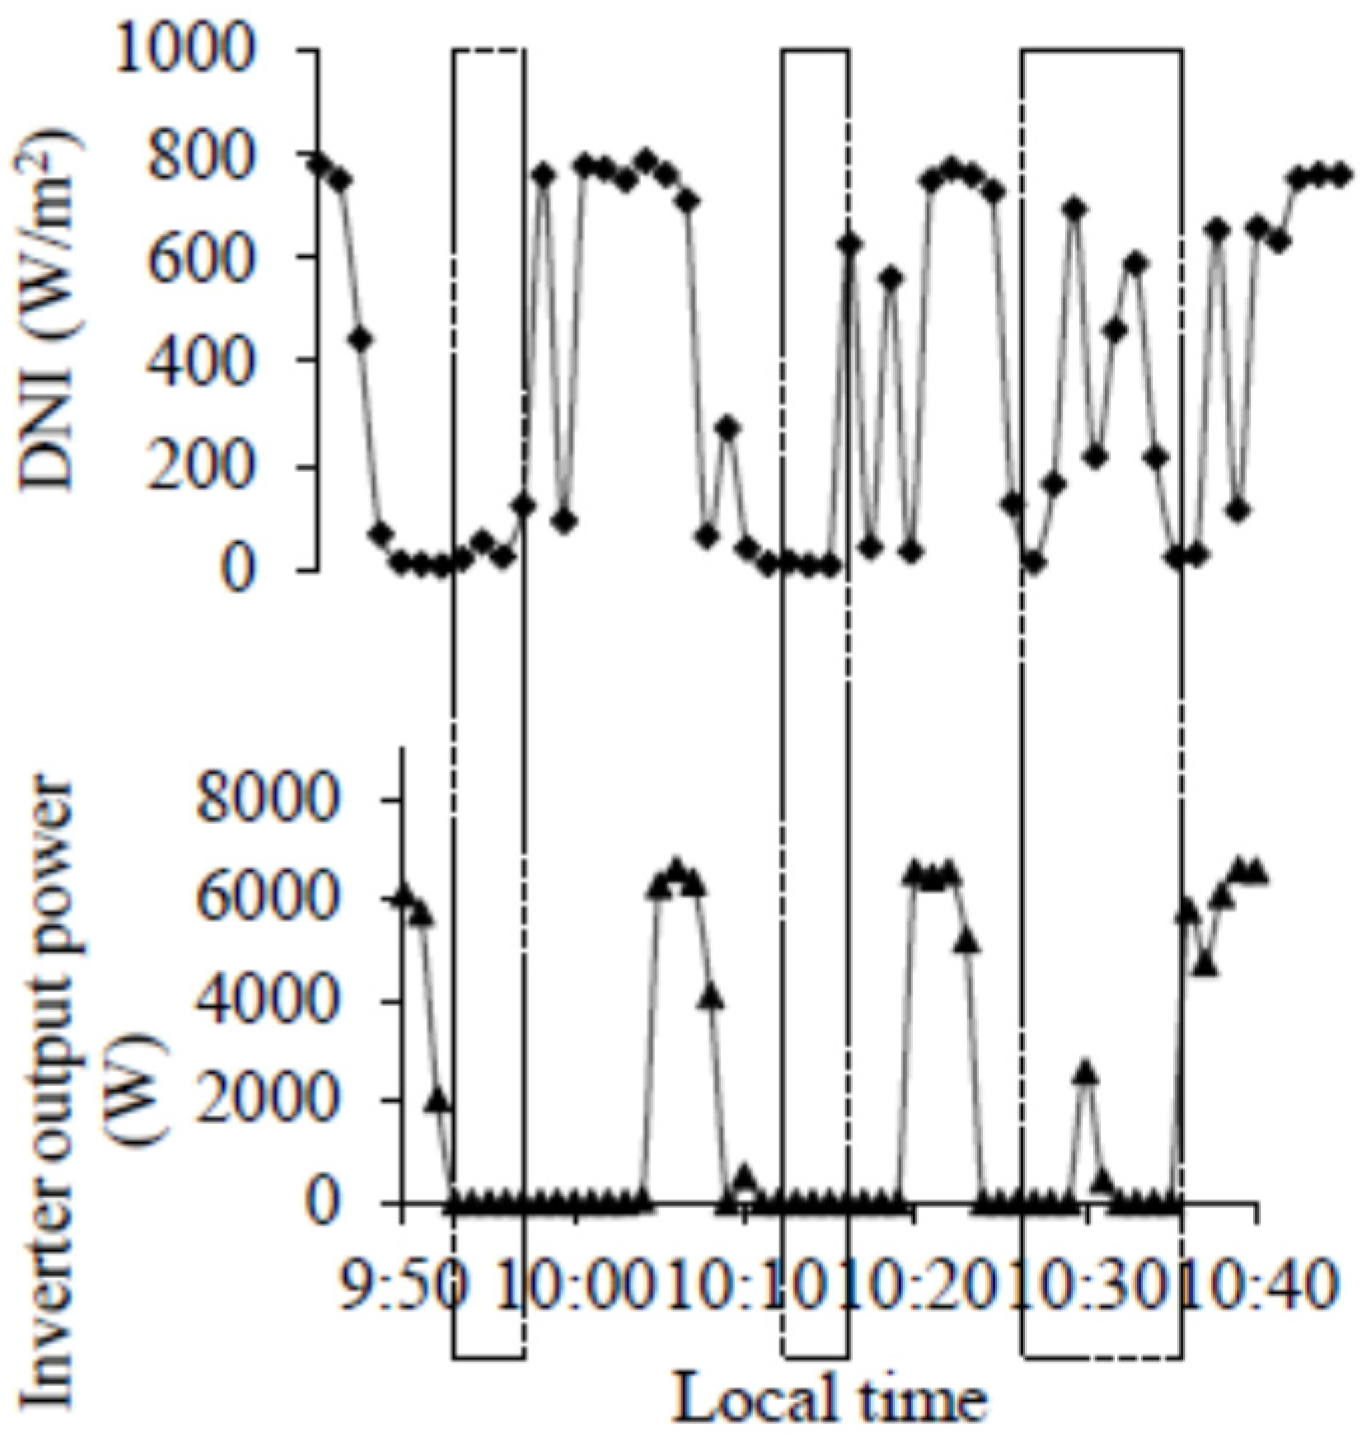
4.2. Influence on Power Inversion by Environmental Parameters
5. Conclusions
Acknowledgments
Author Contributions
Conflicts of Interest
Appendix

References
- Ren, P.S. Renewables 2015 Global Status Report; REN21 Secretariat: Paris, France, 2015. [Google Scholar]
- Foresi, J.; Babej, A.; Han, R.; Liao, T.; Wang, C. Characterization of Suncore’s uility-scale CPV power plants. In Proceedings of the 11st International Conference on Concentrator Photovoltaic Systems: CPV-11, Aix-les-Bains, France, 17 March 2015.
- Gerstmaier, T.; Zech, T.; Röttger, M.; Braun, C.; Gombert, A. Large-scale and long-term CPV power plant field results. In Proceedings of the 11st International Conference on Concentrator Photovoltaic Systems: CPV-11, Aix-les-Bains, France, 17 March 2015.
- Talavera, D.L.; Pérez-Higueras, P.; Ruíz-Arias, J.A.; Fernández, E.F. Levelised cost of electricity in high concentrated photovoltaic grid connected systems: Spatial analysis of Spain. Appl. Energy 2015, 151, 49–59. [Google Scholar] [CrossRef]
- Xie, W.T.; Dai, Y.J.; Wang, R.Z.; Sumathy, K. Concentrated solar energy applications using Fresnel lenses: A review. Renew. Sustain. Energy Rev. 2011, 15, 2588–2606. [Google Scholar] [CrossRef]
- Miller, D.C.; Kurtz, S.R. Durability of Fresnel lenses: A review specific to the concentrating photovoltaic application. Sol. Energy Mater. Sol. Cells 2011, 95, 2037–2068. [Google Scholar] [CrossRef]
- Fraunhofer ISE New World Record for Solar Cell Efficiency at 46% French-German Cooperation Confirms Competitive Advantage of European Photovoltaic Industry. Available online: http://www.ise.fraunhofer.de/en/press-and-media/press-releases/press-releases-2014/new-world-record-for-solar-cell-efficiency-at-46-percent (accessed on 9 August 2015).
- Araki, K. Performance of the 30 kW CPV system installed in coastal area in Japan. In Proceedings of the 6th International Conference on Concentrating Photovoltaic Systems: CPV-6, Freiburg, Germany, 7–9 April 2010.
- Gómez-Gil, F.J.; Wang, X.; Barnett, A.; Gómez-Gil, F.J.; Wang, X. Analysis and prediction of energy production in concentrating photovoltaic (CPV) installations. Energies 2012, 5, 770–789. [Google Scholar] [CrossRef]
- Terao, A.; Mulligan, W.P.; Daroczi, S.G.; Pujol, Ò.C.; Verlinden, P.J.; Swanson, R.M.; Minano, J.C.; Benitz, P.; Álvarez, J.L. A mirror-less design for micro-concentrator modules. In Proceedings of the Twenty-Eighth IEEE Photovoltaic Specialists Conference, Anchorage, AK, USA, 15–22 September 2000; pp. 1416–1419.
- Han, Y.M.; Wang, R.Z.; Dai, Y.J.; Xiong, A.H. Studies on the light permeance characteristic of a Fresnel lens group applied in high concentration solar energy. J. Opt. A Pure Appl. Opt. 2007, 9, 988–997. [Google Scholar] [CrossRef]
- Mousazadeh, H.; Keyhani, A.; Javadi, A.; Mobli, H.; Abrinia, K.; Sharifi, A. A review of principle and sun-tracking methods for maximizing solar systems output. Renew. Sustain. Energy Rev. 2009, 13, 1800–1818. [Google Scholar] [CrossRef]
- Zhang, Q.X.; Yu, H.Y.; Zhang, Q.Y.; Zhang, Z.Y.; Shao, C.H.; Yang, D. A solar automatic tracking system that generates power for lighting greenhouses. Energies 2015, 8, 7367–7380. [Google Scholar] [CrossRef]
- Bird, R.; Riordan, C. Simple solar spectral model for direct and diffuse irradiance on horizontal and tilted planes at the earth’s surface for cloudless atmospheres. J. Appl. Meteorol. 1986, 25, 87–97. [Google Scholar] [CrossRef]
- Perez, R.; Seals, R.; Ineichen, P.; Stewart, R.; Menicucci, D. A new simplified version of the perez diffuse irradiance model for tilted surfaces. Sol. Energy 1987, 39, 221–231. [Google Scholar] [CrossRef]
- Fernández, E.F.; Pérez-Higueras, P.; Almonacid, F.; Ruiz-Arias, J.A.; Rodrigo, P.; Fernandez, J.I.; Luque-Heredia, I. Model for estimating the energy yield of a high concentrator photovoltaic system. Energy 2015, 87, 77–85. [Google Scholar] [CrossRef]
- Chan, N.L.A.; Brindley, H.E.; John, E.D.N. Impact of individual atmospheric parameters on CPV system power, energy yield and cost of energy. Prog. Photovolt. Res. Appl. 2013, 22, 1080–1095. [Google Scholar] [CrossRef]
- Almonacid, F.; Pérez-Higueras, P.J.; Fernández, E.F.; Rodrigo, P. Relation between the cell temperature of a HCPV module and atmospheric parameters. Sol. Energy Mater. Sol. Cells 2012, 105, 322–327. [Google Scholar] [CrossRef]
- Or, A.B.; Appelbaum, J. Dependence of multi-junction solar cells parameters on concentration and temperature. Sol. Energy Mater. Sol. Cells 2014, 130, 234–240. [Google Scholar]
- CWA Space Distribution of Global Horizontal Radiation from 1978 to 2007 in China. Available online: http://cwera.cma.gov.cn/Website/index.php?ChannelID=121&NewsID=1988 (accessed on 10 August 2014).
- Bai, Y. GaAs Based Solar Cells and Key Problems in Concentrators. Ph.D. Thesis, Chinese Academy Sciences, Beijing, China, 2007. [Google Scholar]
- International Electrotechnical Commission (IEC). Photovoltaic System Performance Monitoring—Guidelines for Measurement, Data Exchange and Analysis; IEC Standard 61724; IEC: Geneva, Switzerland, 1998. [Google Scholar]
- Okello, D.; van Dyk, E.E.; Vorster, F.J. Analysis of measured and simulated performance data of a 3.2 kWp grid-connected PV system in Port Elizabeth, South Africa. Energy Convers. Manag. 2015, 100, 10–15. [Google Scholar]
- Ghiani, E.; Pilo, F.; Cossu, S. Evaluation of photovoltaic installations performances in Sardinia. Energy Convers. Manag. 2013, 76, 1134–1142. [Google Scholar] [CrossRef]
- King, B.; Riley, D.; Hansen, C.; Erdman, M.; Gabriel, J.; Ghosal, K. HCPV characterization: Analysis of fielded system data. In Proceedings of the AIP 2014: Australian Institute of Physics Congress, Canberra, Australia, 7–12 December 2014; pp. 276–279.
- Wu, X.; Liu, Y.; Xu, J.; Lei, W.; Si, X.; Du, W.; Zhao, C.; Zhong, Y.; Peng, L.; Lin, J. Monitoring the performance of the building attached photovoltaic (BAPV) system in Shanghai. Energy Build. 2015, 88, 174–182. [Google Scholar] [CrossRef]
- Ayompe, L.M.; Duffy, A.; McCormack, S.J.; Conlon, M. Measured performance of a 1.72 kW rooftop grid connected photovoltaic system in Ireland. Energy Convers. Manag. 2011, 52, 816–825. [Google Scholar]
- Pu, S.; Lin, W. Correlations to estimate monthly total solar radiation on horizontal surfaces at Kunming, China. Energy Convers. Manag. 2000, 41, 367–374. [Google Scholar] [CrossRef]
- Tripathi, B.; Yadav, P.; Rathod, S.; Kumar, M. Performance analysis and comparison of two silicon material based photovoltaic technologies under actual climatic conditions in Western India. Energy Convers. Manag. 2014, 80, 97–102. [Google Scholar] [CrossRef]
- Al-Otaibi, A.; Al-Qattan, A.; Fairouz, F.; Al-Mulla, A. Performance evaluation of photovoltaic systems on Kuwaiti schools’ rooftop. Energy Convers. Manag. 2015, 95, 110–119. [Google Scholar] [CrossRef]
- Fernández, E.F.; Pérez-Higueras, P.; Almonacid, F.; García Loureiro, A.J.; Fernández, J.I.; Rodrigo, P.; Vidal, P.G.; Almonacid, G. Quantifying the effect of air temperature in CPV modules under outdoor conditions. In Proceedings of the 8th International Conference on Concentrating Photovoltaic Systems, Toledo, Spain, 16–18 April 2012; pp. 194–197.


| Location | Latitude | PV type | Prate (kWp) | Final yield (kWh/kWp/d) | PR (%) | System η (%) | Reference |
|---|---|---|---|---|---|---|---|
| Shanghai, China | 31°12′ N | Multi-Si | 2.99 | 2.86 | 80.7 | 10.7 | [26] |
| Gujarat, India | 23.22° N | a-Si | 500 | 3.99 | 70.8 | 6.1 | [29] |
| Dublin, Ireland | 53.4° N | Mono-/a-Si | 1.72 | 2.41 | 81.5 | 12.6 | [27] |
| Kuwait City | 29°2′ N | CIGS | 85.05 | 4.5 | 70–85 | 11.1 | [30] |
| Jaen, Spain | 37°27′ N | HCPV | 1.35 | 5.24 | 86.4 | 18.8 | [16] |
| Kunming, China | 24°47′ N | HCPV | 9 | 3.11 | 79.7 | 18.9 | Present work |
© 2016 by the authors; licensee MDPI, Basel, Switzerland. This article is an open access article distributed under the terms and conditions of the Creative Commons by Attribution (CC-BY) license (http://creativecommons.org/licenses/by/4.0/).
Share and Cite
Mi, Z.; Chen, J.; Chen, N.; Bai, Y.; Wu, W.; Fu, R.; Liu, H. Performance Analysis of a Grid-connected High Concentrating Photovoltaic System under Practical Operation Conditions. Energies 2016, 9, 117. https://doi.org/10.3390/en9020117
Mi Z, Chen J, Chen N, Bai Y, Wu W, Fu R, Liu H. Performance Analysis of a Grid-connected High Concentrating Photovoltaic System under Practical Operation Conditions. Energies. 2016; 9(2):117. https://doi.org/10.3390/en9020117
Chicago/Turabian StyleMi, Zhe, Jikun Chen, Nuofu Chen, Yiming Bai, Wenwang Wu, Rui Fu, and Hu Liu. 2016. "Performance Analysis of a Grid-connected High Concentrating Photovoltaic System under Practical Operation Conditions" Energies 9, no. 2: 117. https://doi.org/10.3390/en9020117