1. Introduction
Advances in science and technology have brought economic growth, as well as great consumption of many resources, oil shortage, and greenhouse effect. Development of new clean energy and relevant technologies is thus urgent. The topic of develop a new green energy is important for the world in recent years. The generator-based exercise equipment (GBEE) are CO
2 emission free, inexhaustible and the cleanest of all green energy, have become a topical subject. The GBEE considered here consists of a brushless direct current (DC) generator (BLDCG), three phase bridge rectifiers, power converters,
etc. The GBEE converts kinetic energy into electrical energy through a BLDCG. Next, alternating current (AC) power is converted by a rectifier to DC. The DC voltage is transformed and exported by the DC converter which is aboost device that can be used for the conversion of electrical energy from different permanent magnet BLDCG systems. Comparisons with the various BLDCG electric energy conversions are available in the literature [
1,
2,
3,
4,
5].
GBEE irregular operation may result in unstable power output. Different characteristic curves have different optimal operating points; the optimal operating point is the maximum power point (MPP). The differences in the new energy source, when compared to traditional maximum power point tracking (MPPT) control, are in the methods common to the perturb and observe algorithm (P&O) [
6], extremum seeking control (ESC) [
7],
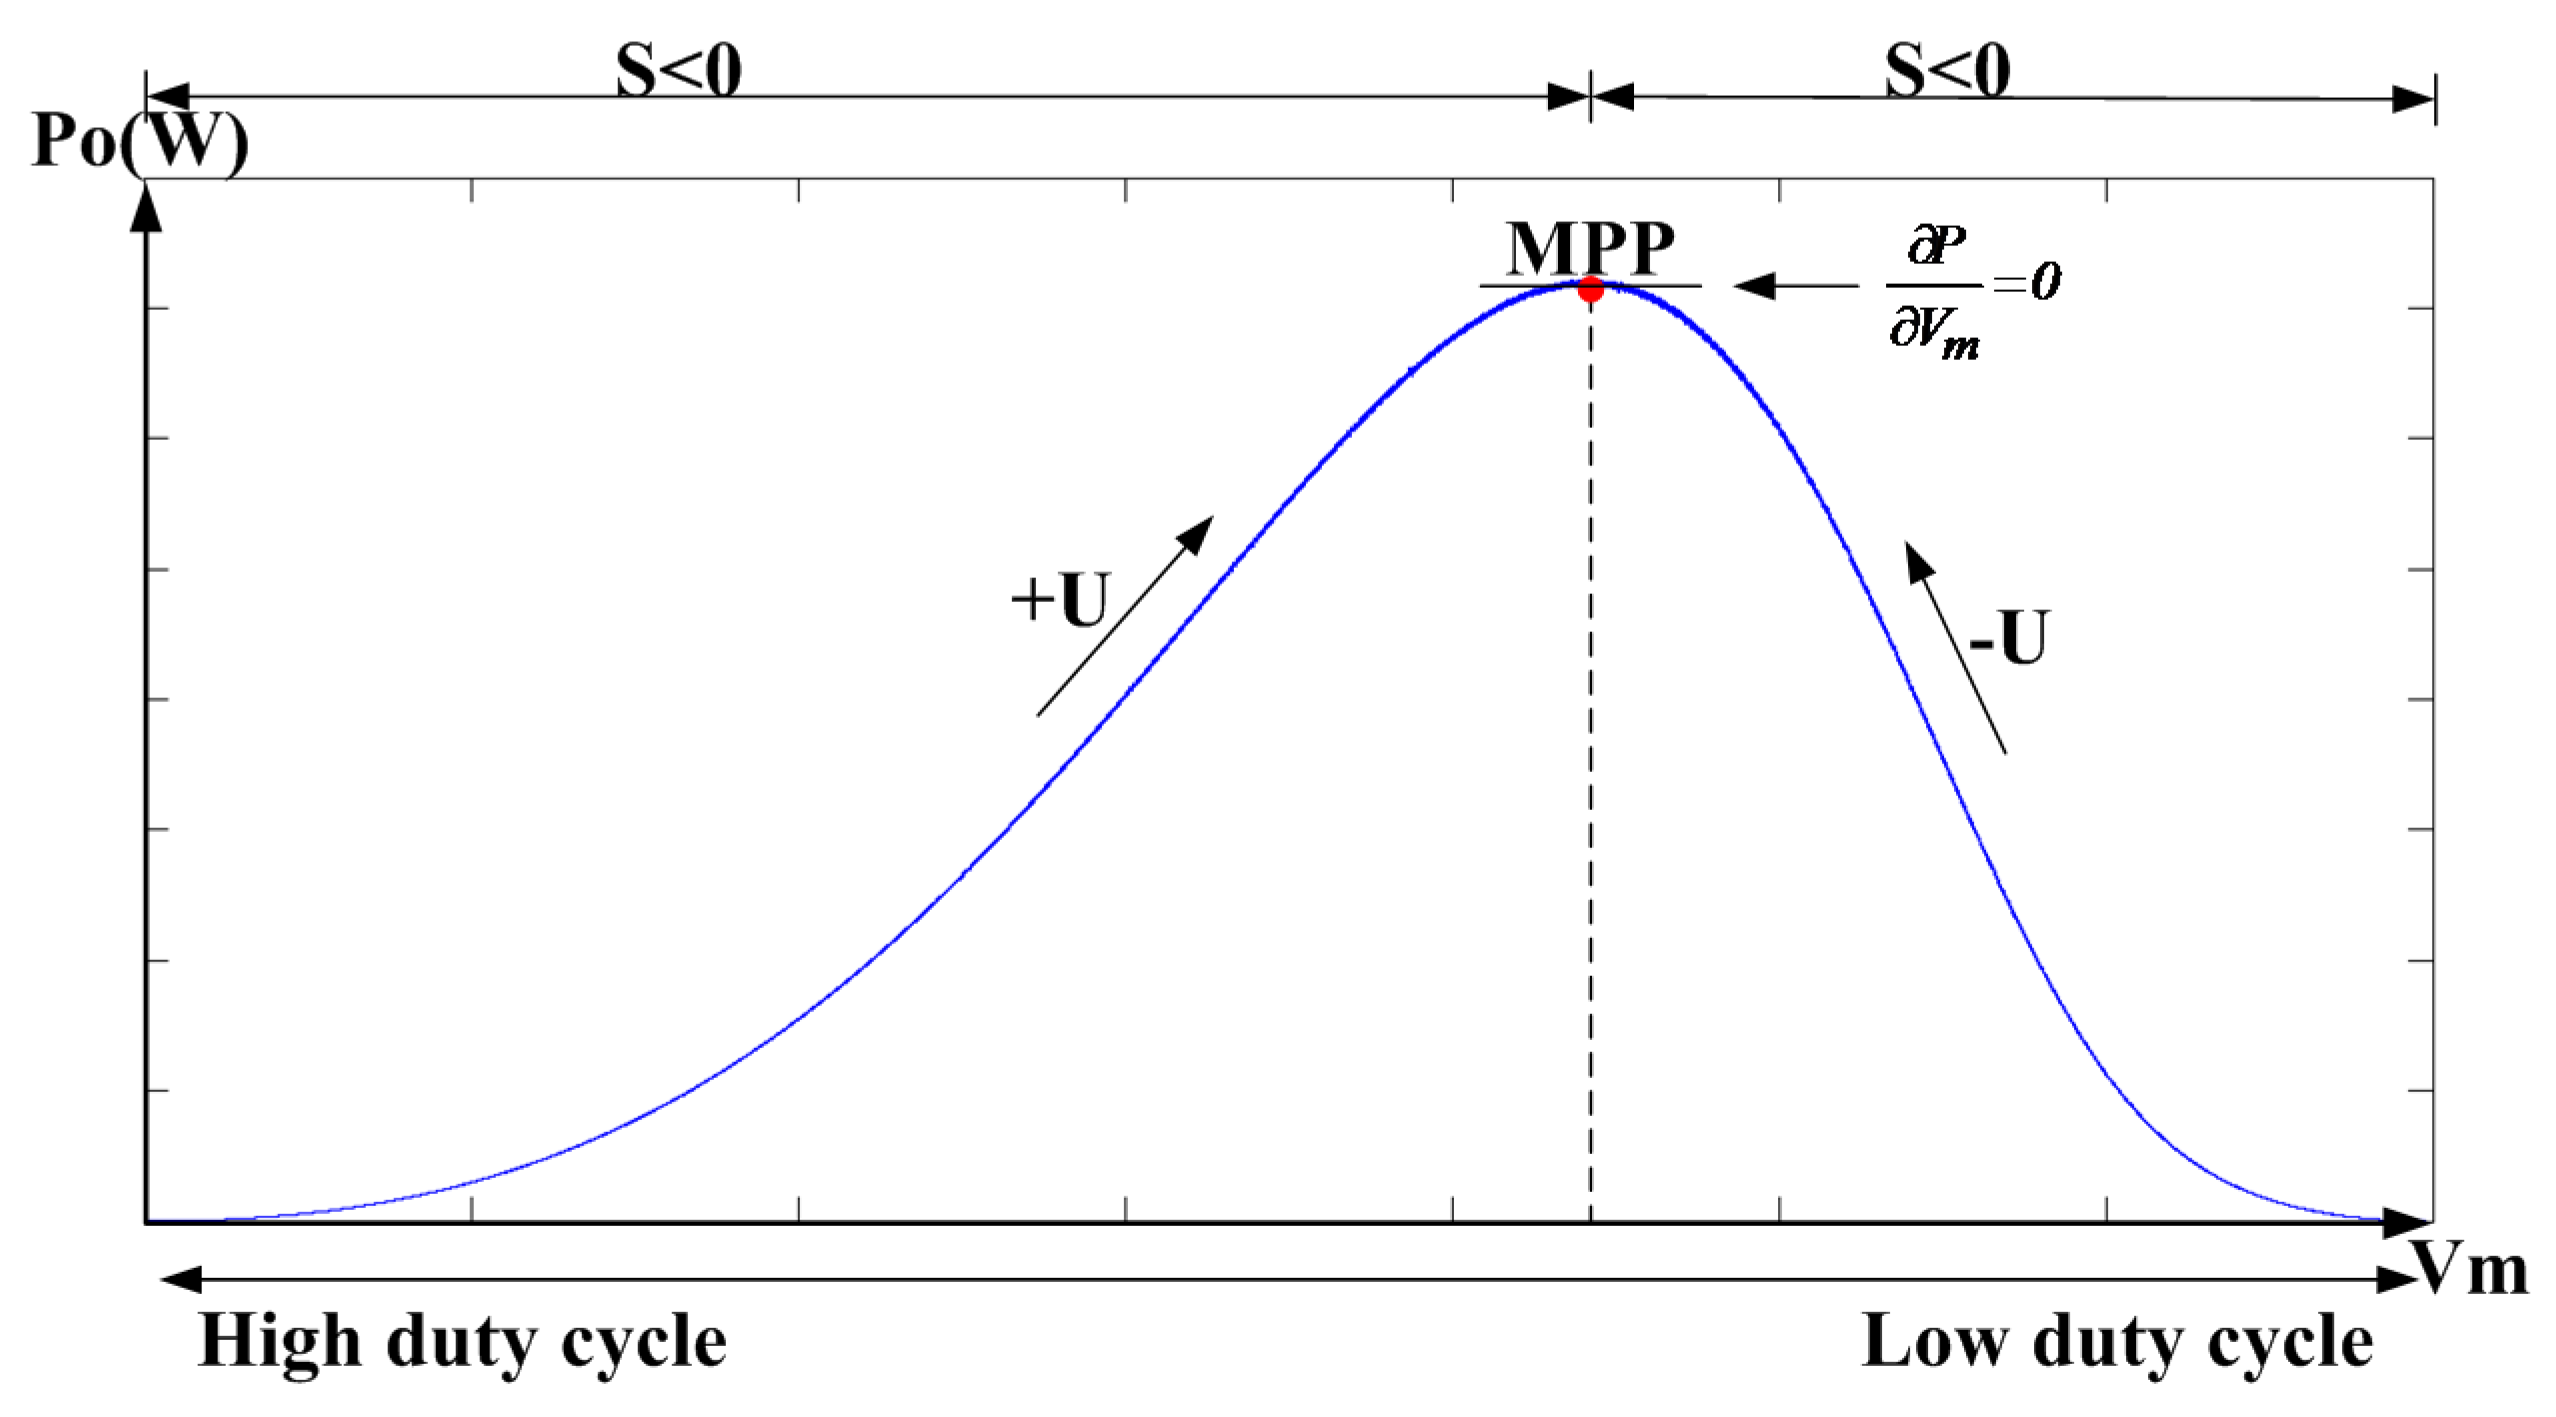
etc. These methods are easier and have lower costs, but they do not have robustness of control. At the steady state these methods reach, the MPP is proportional to the disturbance. To overcome the above drawbacks, another method of sliding mode control (SMC) for the GBEE is proposed. SMC is based on a nonlinear
P-
V characteristic curve, defined as: ∂
P/∂
V = 0 of the generator. SMC is caused by two pattern methods for robustness control: approaching and sliding conditions, respectively. Approaching conditions let the system's trajectory reach the sliding surface at the effective time, and sliding conditions limit it to the sliding surface on the system. The final approach to the target is the MPP. If the operating point falls in the MPP of the left or right, it will move in the opposite direction toward the MPP. But SMC allows for an infinite high-frequency switching of the sign function. When the sign function is used to switch the converter, it causes the converter and switch life to be cut short and also to create high frequency noise. Therefore, many scholars have suggested that an intelligent control method for reducing sign function is needed. Fuzzy theory [
8], extension theory [
9],
etc., have frequently been used when searching for an intelligent control method.
This paper proposes an extension SMC (ESMC) that effectively reduces the high frequency switching sign function and effectively reduces the harmonic component of input current. By applying the extension method, the gain constant σ could be adjusted to avoid converter component failure from high speed switching as well as high frequency noise interference to the system. The power harmonic component appears when the input of a three-phase bridge rectifier is connected to the generator AC power line. While the DC voltage is hard on the capacitor, it allows high frequency switching on the DC converter output to the load. Finally, this paper uses the power simulation (PSIM) software to simulate the proposed control method and compare the different control methods in the GBEE. Simulation and experimental results indicate that the proposed ESMC more effectively reduces the harmonic components of generator output.
2. Brushless Direct Current Generator Dynamic Modeling
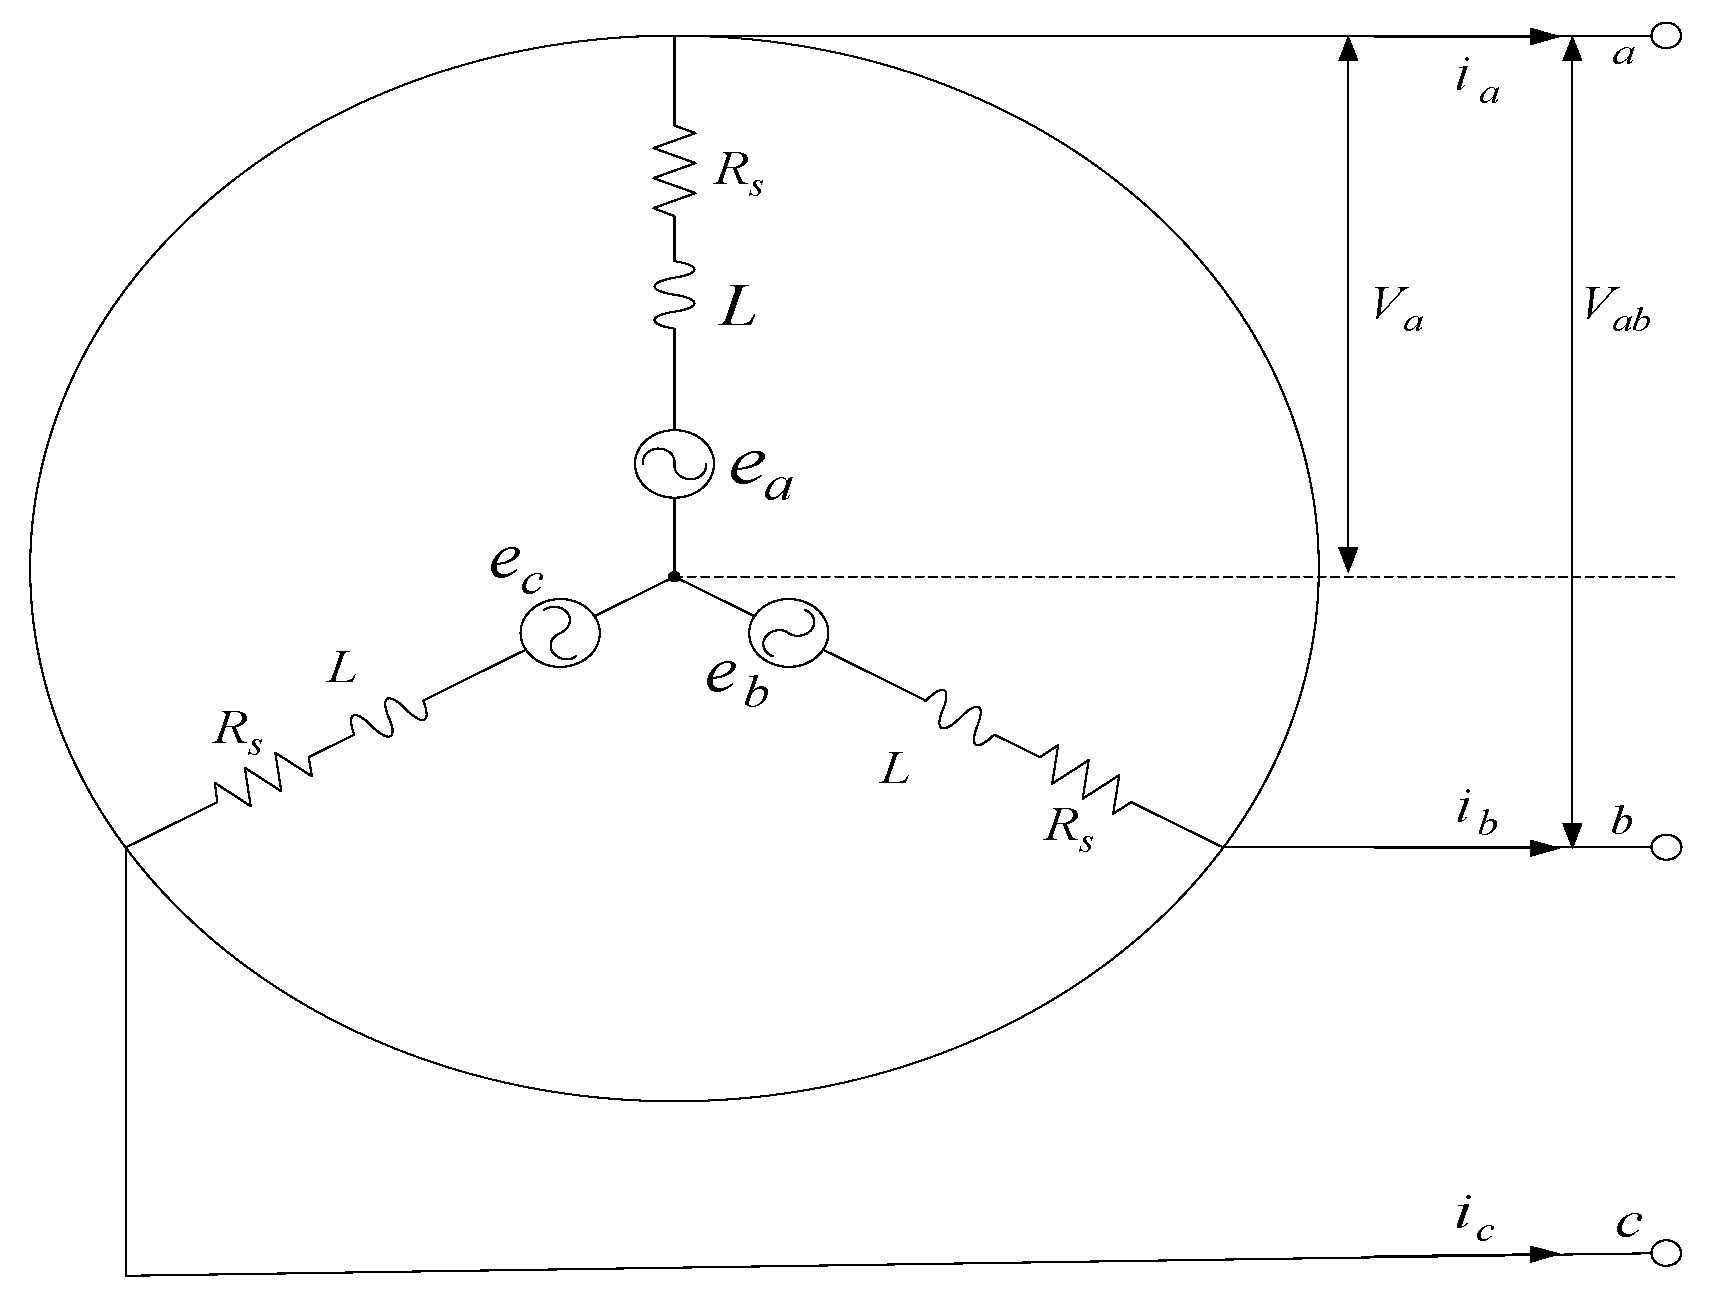
The GBEE uses a three-phase BLDCG. The BLDCG equivalent circuit is given in
Figure 1. The
Rs is the resistance of the coil;
L is the self-inductance of the coil;
ea,
eb, and
ec represent armature reaction electromotives;
ia,
ib, and
ic are the phase currents; and
Va,
Vb, and
Vc are the terminal voltages, and
Vab is the line to line voltage between a-phase and b-phase. The BLDCG equation of state is represented as follows [
10]:
Figure 1.
Generator equivalent circuit.
Figure 1.
Generator equivalent circuit.
The relationship between generator internal electromotive b and current of the converter control defines a three-phase commutation function
,
, and
as Equations (2)–(4) [
11]:
In Equations (2)–(4),
u(
t) is expressed as a unit step function, and
n is an integer,
is angular velocity of generator rotor. Equation (5) is to define the equivalent generator DC armature current
ieq(
t) observing the distribution of three-phase current as follows:
According to the commutation function, armature voltage
and voltage across
of BLDC generator are expressed in Equations (6) and (7), respectively:
The equivalent DC dynamics equation of the BLDCG can be obtained by Equation (8):
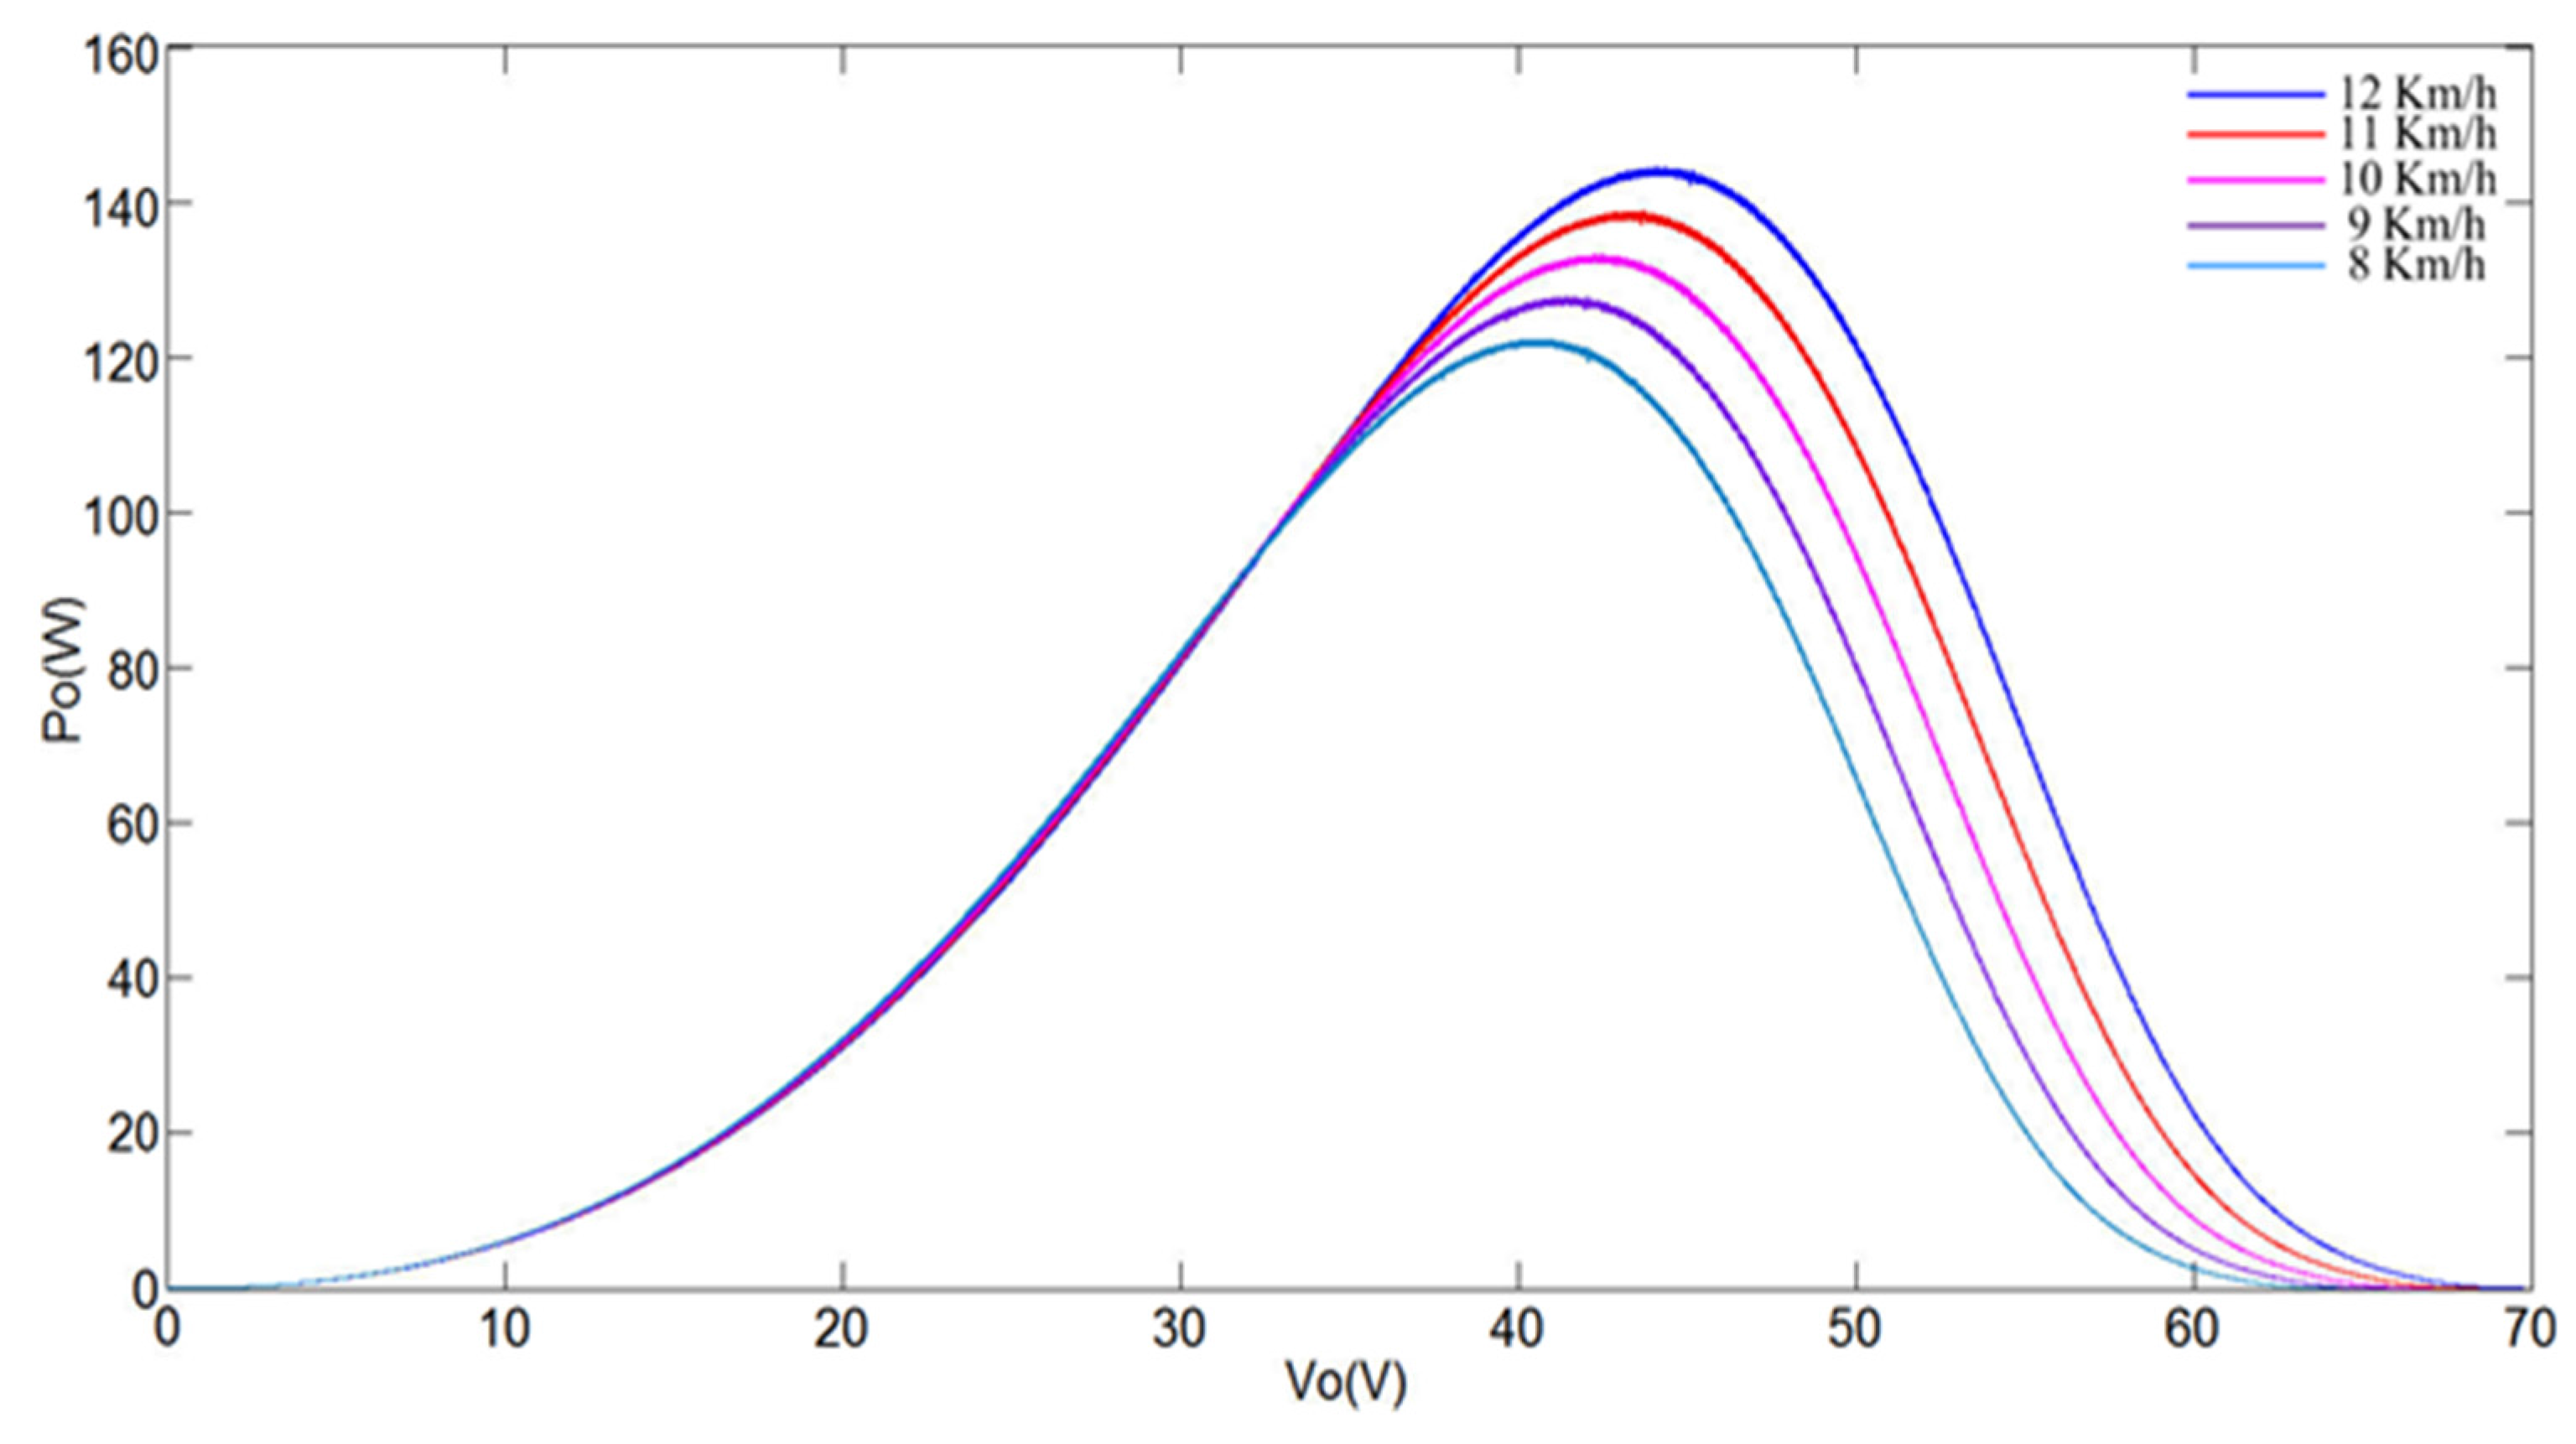
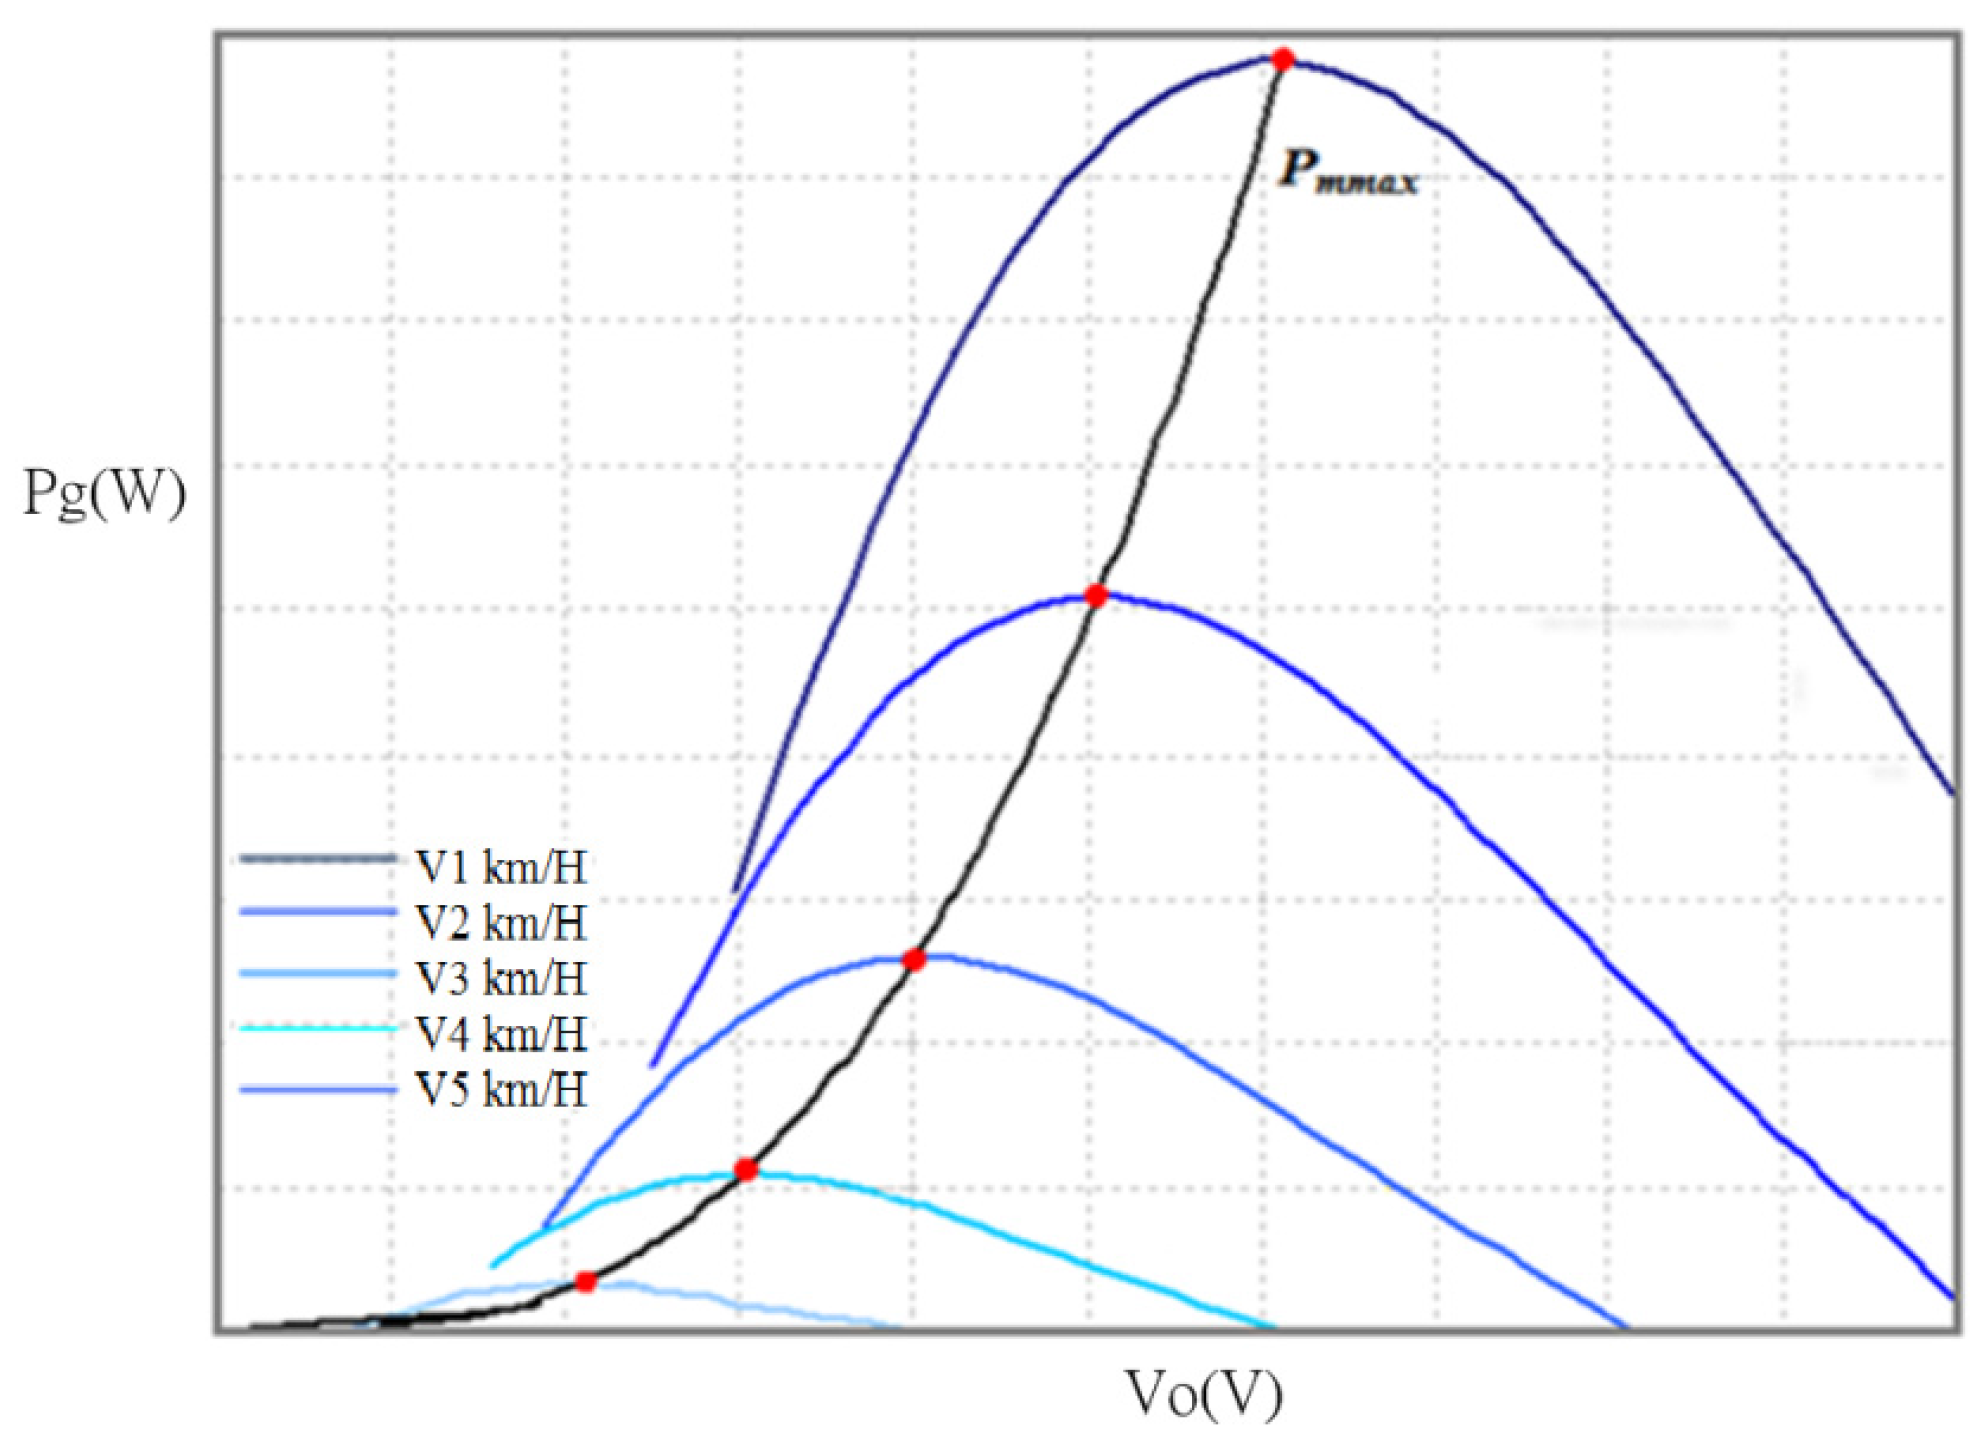
According to dynamic modeling provided above, The
P-
V curves of the GBEE can be shown in
Figure 2.
Figure 2 shows the
P-
V characteristic curve at different speeds and the human power generation produces different MPPs with respect to different speeds.
Figure 2.
The P-V curves of generator-based exercise equipment (GBEE).
Figure 2.
The P-V curves of generator-based exercise equipment (GBEE).
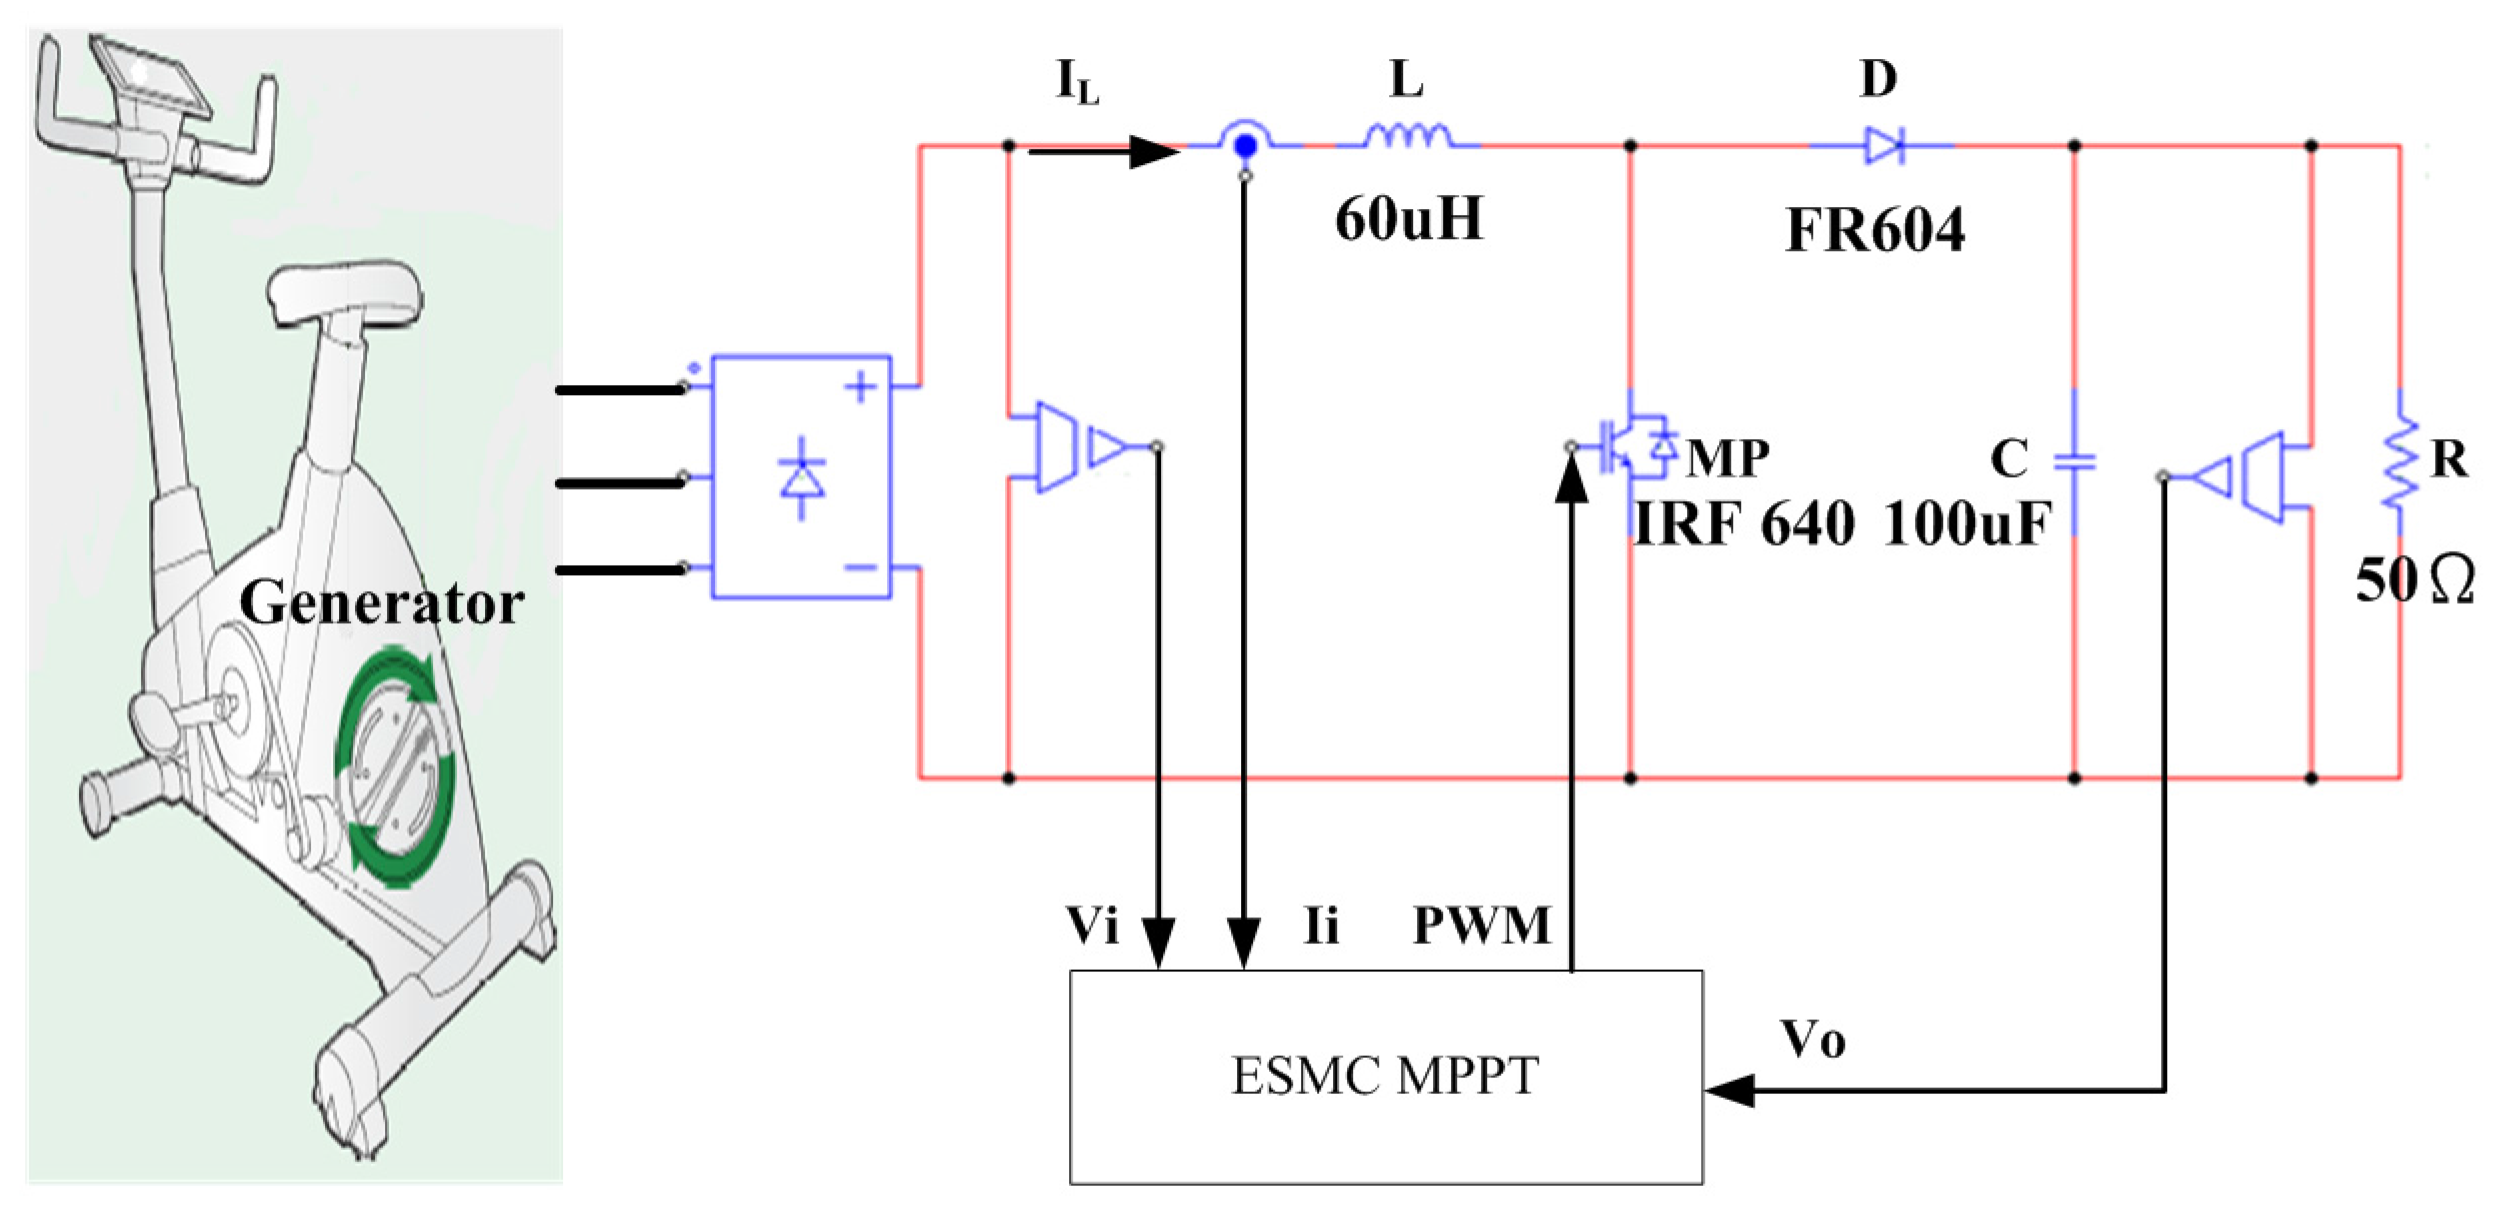
3. Boost Converter Design
The power converter of GBEE is a boost converter. The converter is composed of inductors and capacitors, diodes, switches,
etc. The boost converter architecture is shown in
Figure 3 [
12].
Figure 3.
The boost converter architecture for GBEE.
Figure 3.
The boost converter architecture for GBEE.
Figure 4 shows the time variation of one cycle switching voltage and inductance current duty cycle ratio.
Figure 4 assumes that the current is kept constant in steady state, and the diode and switch have no voltage drop. Therefore, when the switch is on, the switch terminal voltage is
, the switch off terminal voltage is
,
is the input voltage of generator terminal voltage after three-phase bridge rectification, and
. The output voltage is expressed as Equation (9), where
is turned on,
is turned off, one cycle time
, then Equation (9) is obtained:
Figure 4.
Switching voltage and duty cycle.
Figure 4.
Switching voltage and duty cycle.
By rearrangement of Equation (9), the output voltage and input voltage duty cycle can be rewritten as Equation (10):
The boost converter has two states according to the switch on state in
Figure 3:
State 1:
In
Figure 3, when the switch
MP is turned on, the diode
D is turned off, the input voltage flows through the inductor
L directly. The inductance current
rises, and the output end depends on capacitor
C which supplies energy to the load
R. The current
flows through the switch to form a loop. The voltage and current equations are expressed as Equations (11) and (12):
Equation (15) represents the dynamic system is
. By setting the duty cycle is
U of the switch by PWM, and substituting Equations (13) and (14) to Equation (15) based on state space averaging method, we have Equations (16) and (17):
where
,
and duty ratio
U. Thus the resultant state equations are as follow:
Where the duty ratio denotes the control input. Neglecting the inductors as well as resistors, and assuming
IL as the human power generation current, a non-linear time invariant system is achieved as:
5. Harmonic Sources and Harmonic Analysis
The massive use of power semiconductors in the early 1990s demonstrated that harmonic current through a rectifier and line impedance will generate harmonic voltage drops and create a supply voltage harmonic component. Nonlinear load harmonic is generally determined using an analytical method, simulation, or measurement method. The measurement method is loaded using the analyzer measurements to directly load the current waveform, which is a fast Fourier transform (FFT) direct read out load current spectrum analysis. The simulation method uses software in the load circuits that simulates and calculates the load current waveform and spectrum analysis with computers. The analytical method uses mathematics as a tool for analysis of harmonic current components and effects.
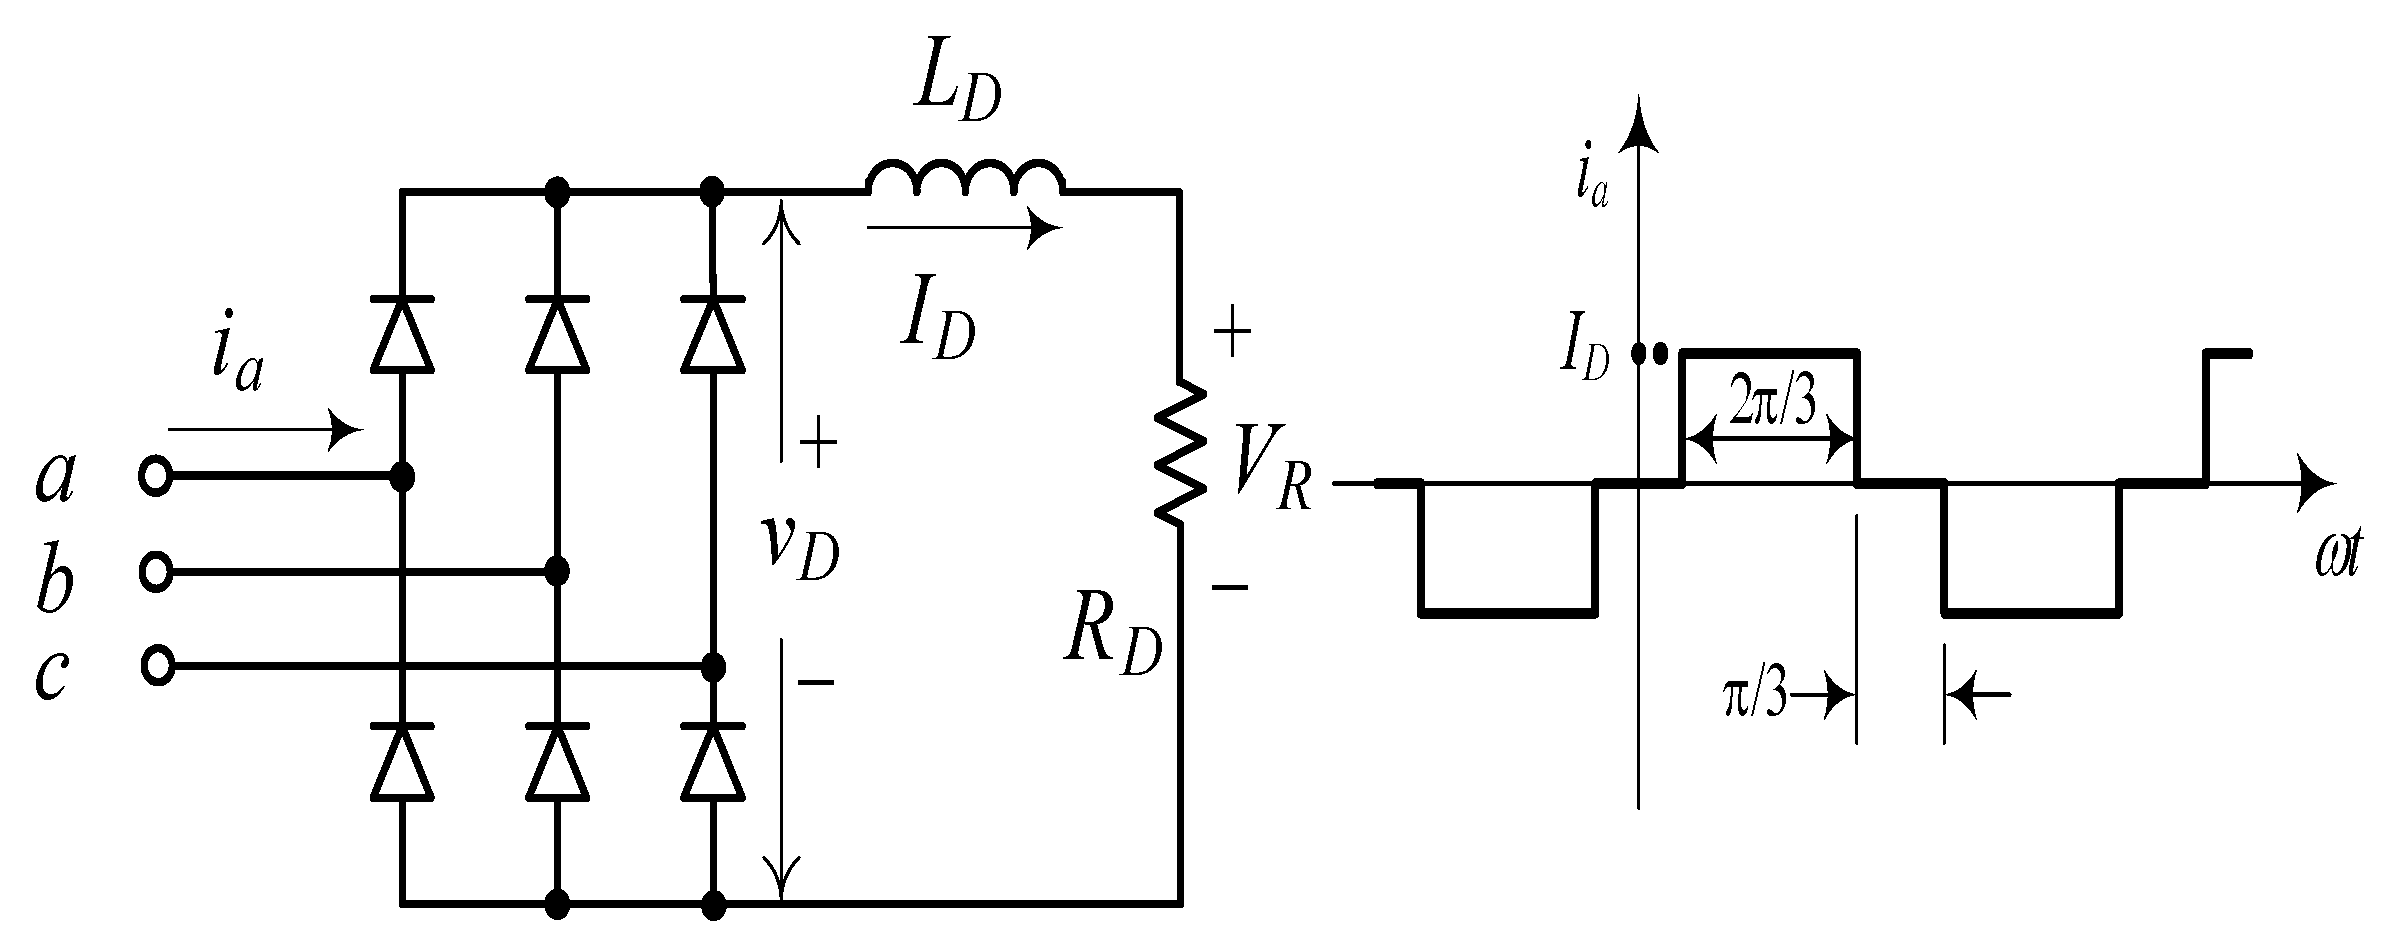
Figure 6 shows the generator terminal harmonic current analysis.
According to
Figure 6, showing the current waveform of Fourier analysis,
ia current waveform is Fourier series as Equation (35):
Figure 6.
Generator terminal harmonic current analysis.
Figure 6.
Generator terminal harmonic current analysis.
The definition of total harmonic distortion (THD) rate and THD is composed of multiple harmonic constituents cases, expressed as a percentage of the mean-square value of the harmonic and fundamental frequency ratio of the value effective value. THD of current is defined in Equation (36). ia is RMS value of fundamental wave current.
6. Simulation
Table 1 shows the generator specifications of the GBEE. This study uses three control methods with simulation and implementation of the generator specifications in
Table 2.
Table 1.
GBEE specifications.
Table 1.
GBEE specifications.
| Items | Specifications | Unit |
|---|
| Voltage specification | 220 | V |
| Rated power | 200 | W |
| Peak power | 500 | W |
| Rated speed | 1500 | rpm |
| Alternator efficiency | ≥90% | - |
| Pole P | 4 | P |
| Armature winding Ra | 6.26 | Ω |
| Coil inductance Lm | 0.04 | mH |
Table 2.
Testing results of the proposed control method with different control method. Perturb and observe algorithm: P&O; sliding mode control: SMC; extension SMC: ESMC.
Table 2.
Testing results of the proposed control method with different control method. Perturb and observe algorithm: P&O; sliding mode control: SMC; extension SMC: ESMC.
| Specifications | P&O | SMC | ESMC |
|---|
| Switching frequency | 100 kHz | 100 kHz | 100 kHz |
| Duty cycle | 0.1–0.9 | 0.1–0.9 | 0.1–0.9 |
| Step size | 0.01 | N/a | N/a |
| Gain value(σ) | N/a | 0.5 | 1–0.2 |
PSIM simulates output power and generator voltage characteristic curves for different speeds of GBEE, as in
Figure 7.
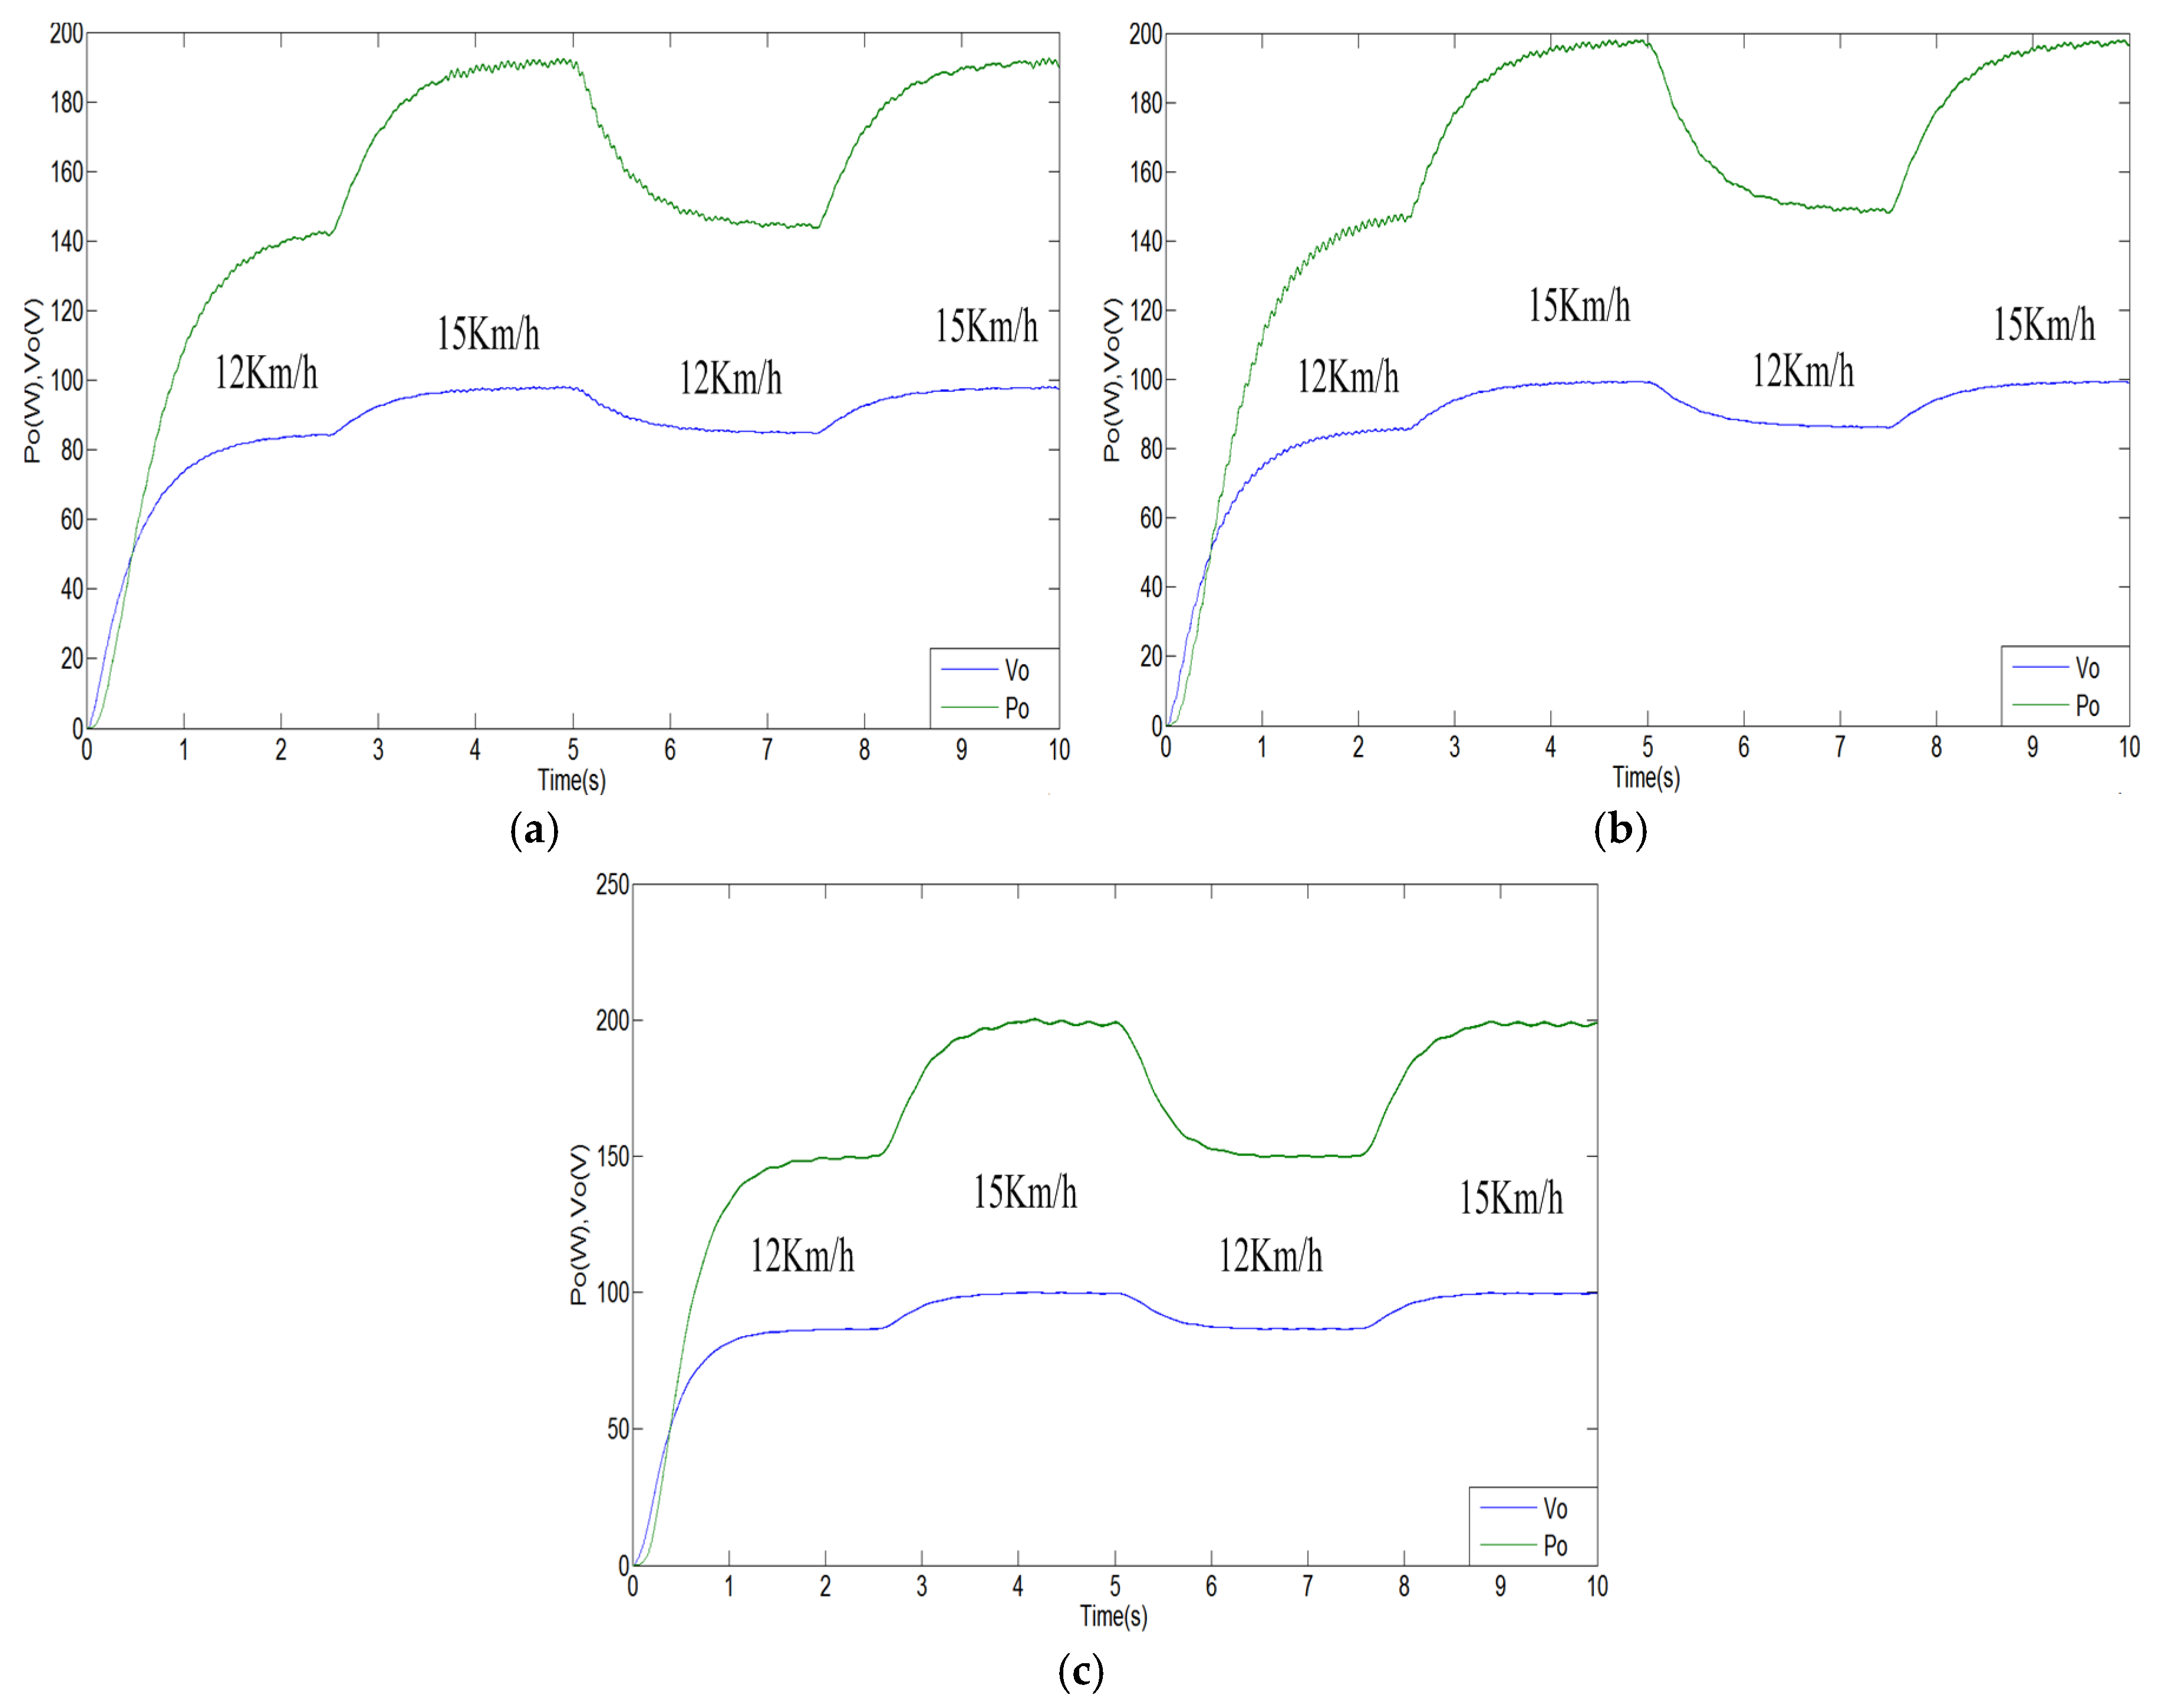
Figure 8a–c illustrates that the simulation results for output power and voltage waveform at the speed of change are 12–15 km/h for P&O, SMC, and ESMC, respectively. At speed 7.5 km/h, as in
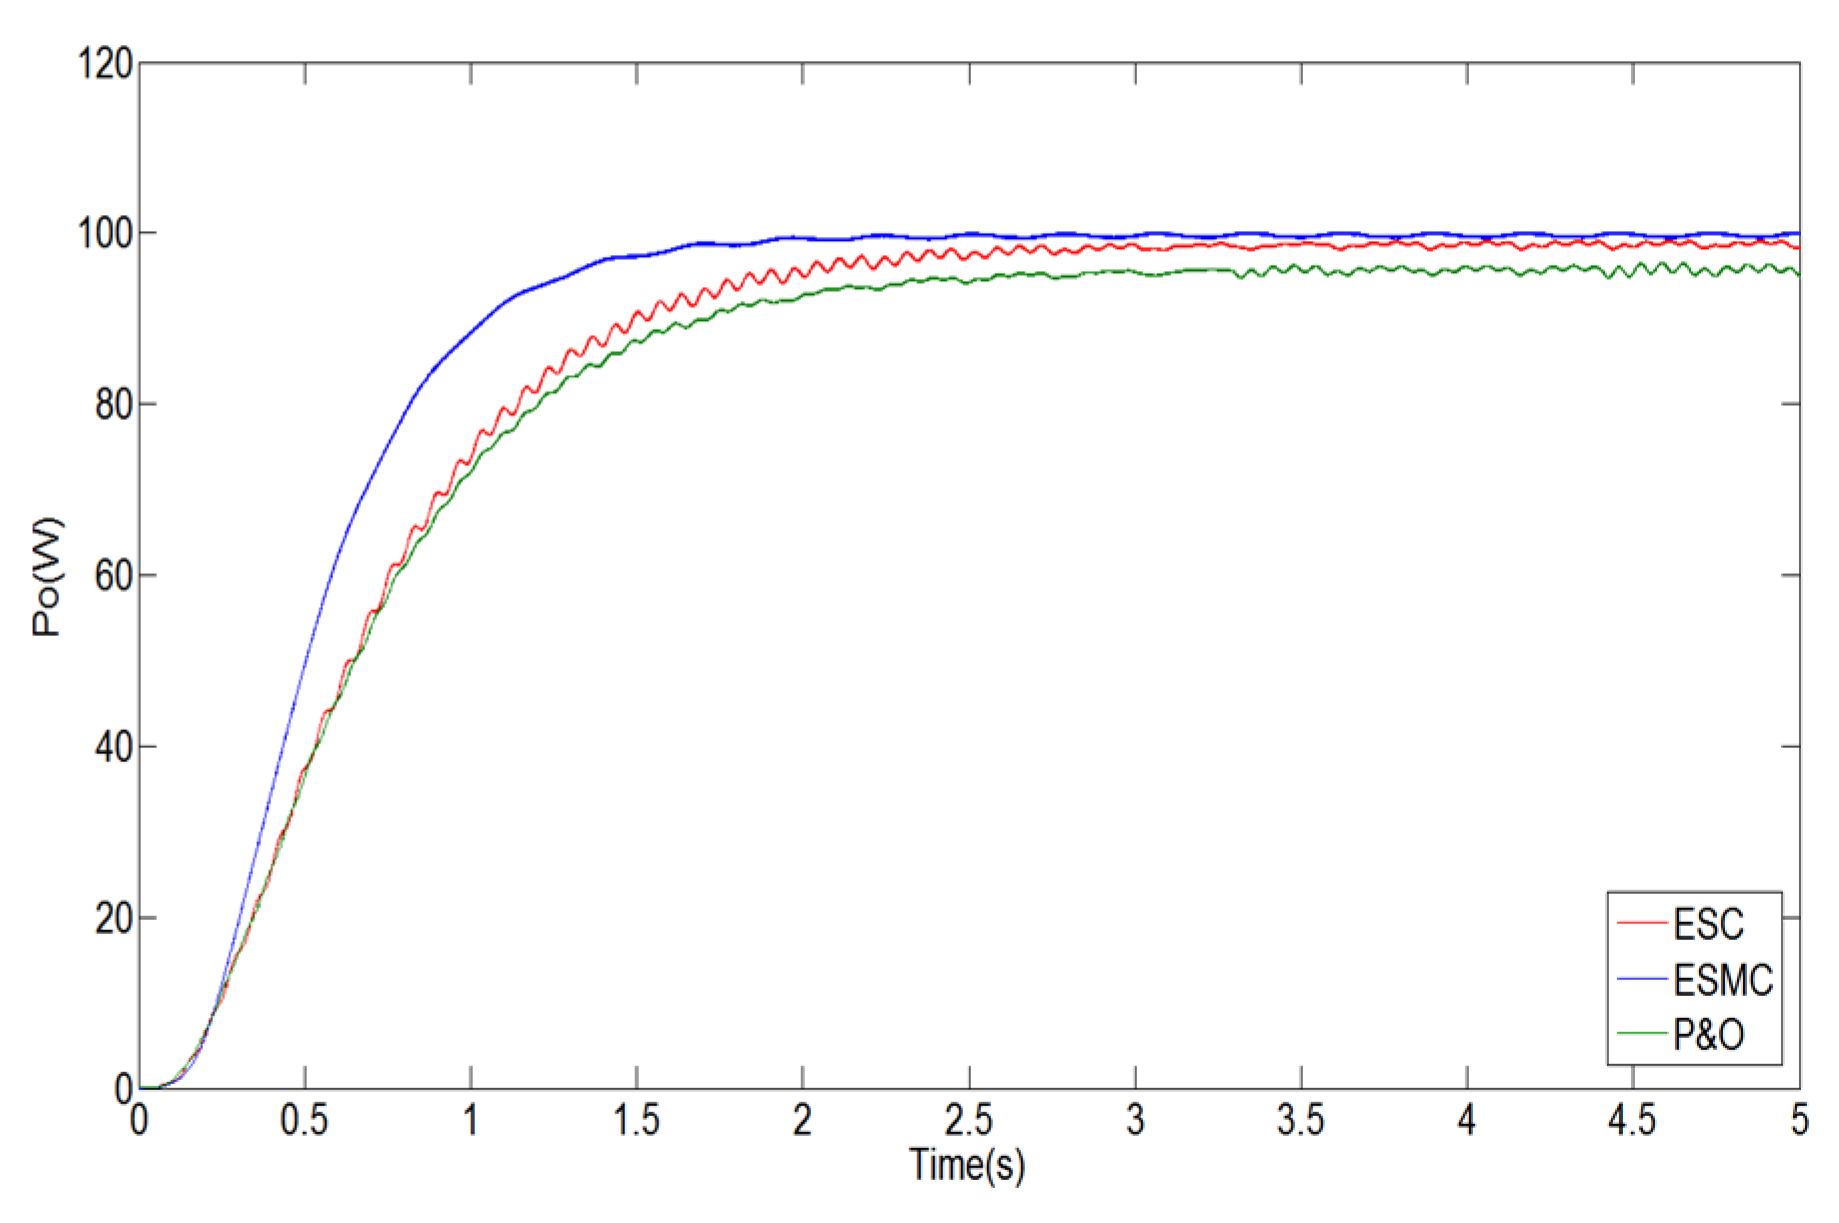
Figure 9, ESMC possesses the fastest response and highest power output.
Table 1 records the simulation results for power output and response speed.
Figure 7.
GBEE characteristic curves under different speed.
Figure 7.
GBEE characteristic curves under different speed.
In this paper, three kinds of control methods are applied to the PSIM simulation of the GBEE. They are the P&O, ESC, and the ESMC. Generator characteristic curve and maximum power output of the system are observed.
Figure 7 is the characteristic curve diagram of the power output and generator output voltages generated by human power generation at different speeds in the PSIM simulation.
Figure 8a–c illustrates the output power and voltage waveforms of the P&O, ESC, and the ESMC, respectively. Where the speed changes of 12–15 km/H during 2.5 s and 7.5 s and 15–12 km/H during 5 s.
Figure 9 shows the comparison of the output power of the three kinds of control methods at the speed of 7.5 km/H.
Figure 9 verifies that the ESMC proposed in this paper possesses the fastest response and highest power output.
Table 2 is a comparison of the output power response speed and efficiency of the three kinds of control methods based on
Figure 9.
Figure 8.
Simulation results of different control method: (a) P&O; (b) extremum seeking control (ESC); and (c) ESMC.
Figure 8.
Simulation results of different control method: (a) P&O; (b) extremum seeking control (ESC); and (c) ESMC.
Figure 9.
Comparisons of the output power of three control methods.
Figure 9.
Comparisons of the output power of three control methods.
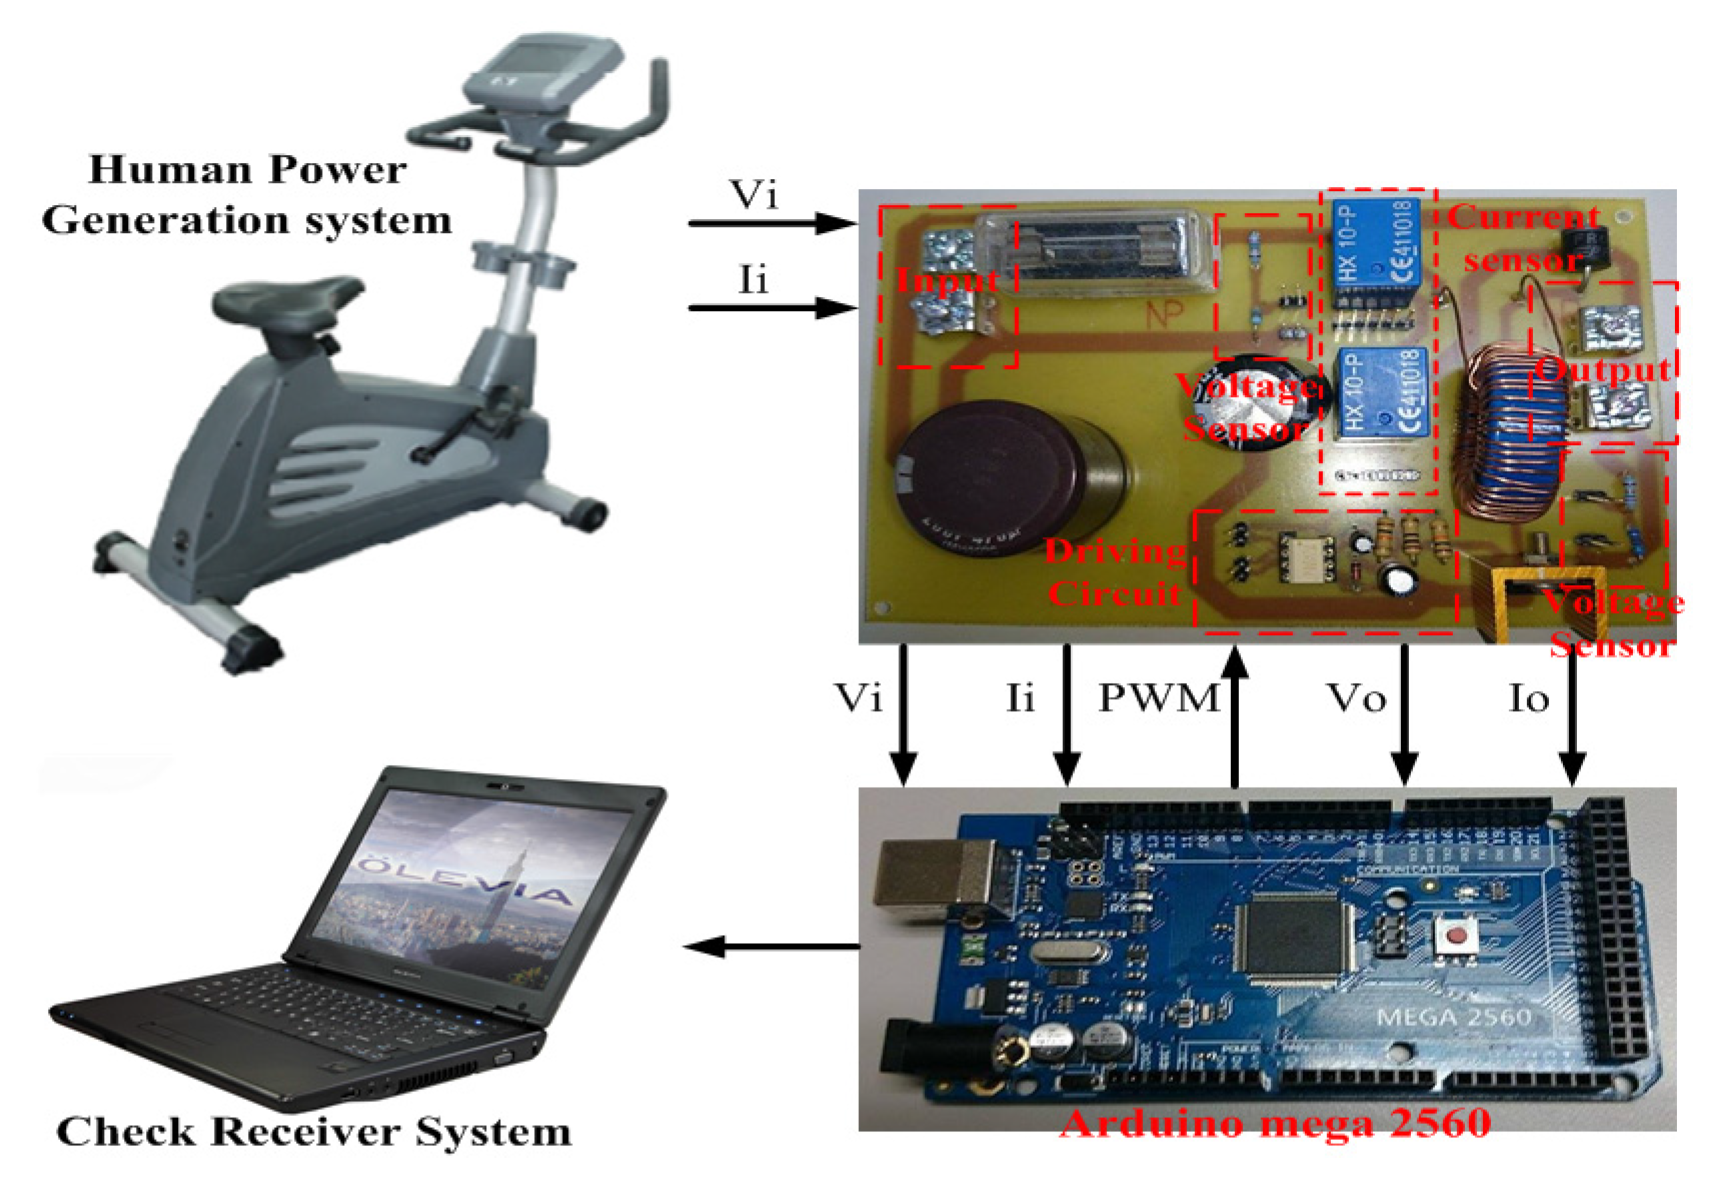
Figure 10 is the structural diagram of the actual application. In this paper, Arduino mega 2560 microcomputer control chips were used to apply the ESMC, the P&O, and the ESC. Arduino I/O pins were used to read the input voltage
Vi, output voltage
Vo, input current
Ii, and output current
Io. They were also used to calculate the MPP of the GBEE system. Digital pins of Arduino were used to output PWM signals to the boost converter for conversion, and Arduino was used as the real-time monitoring system to observe the waveform.
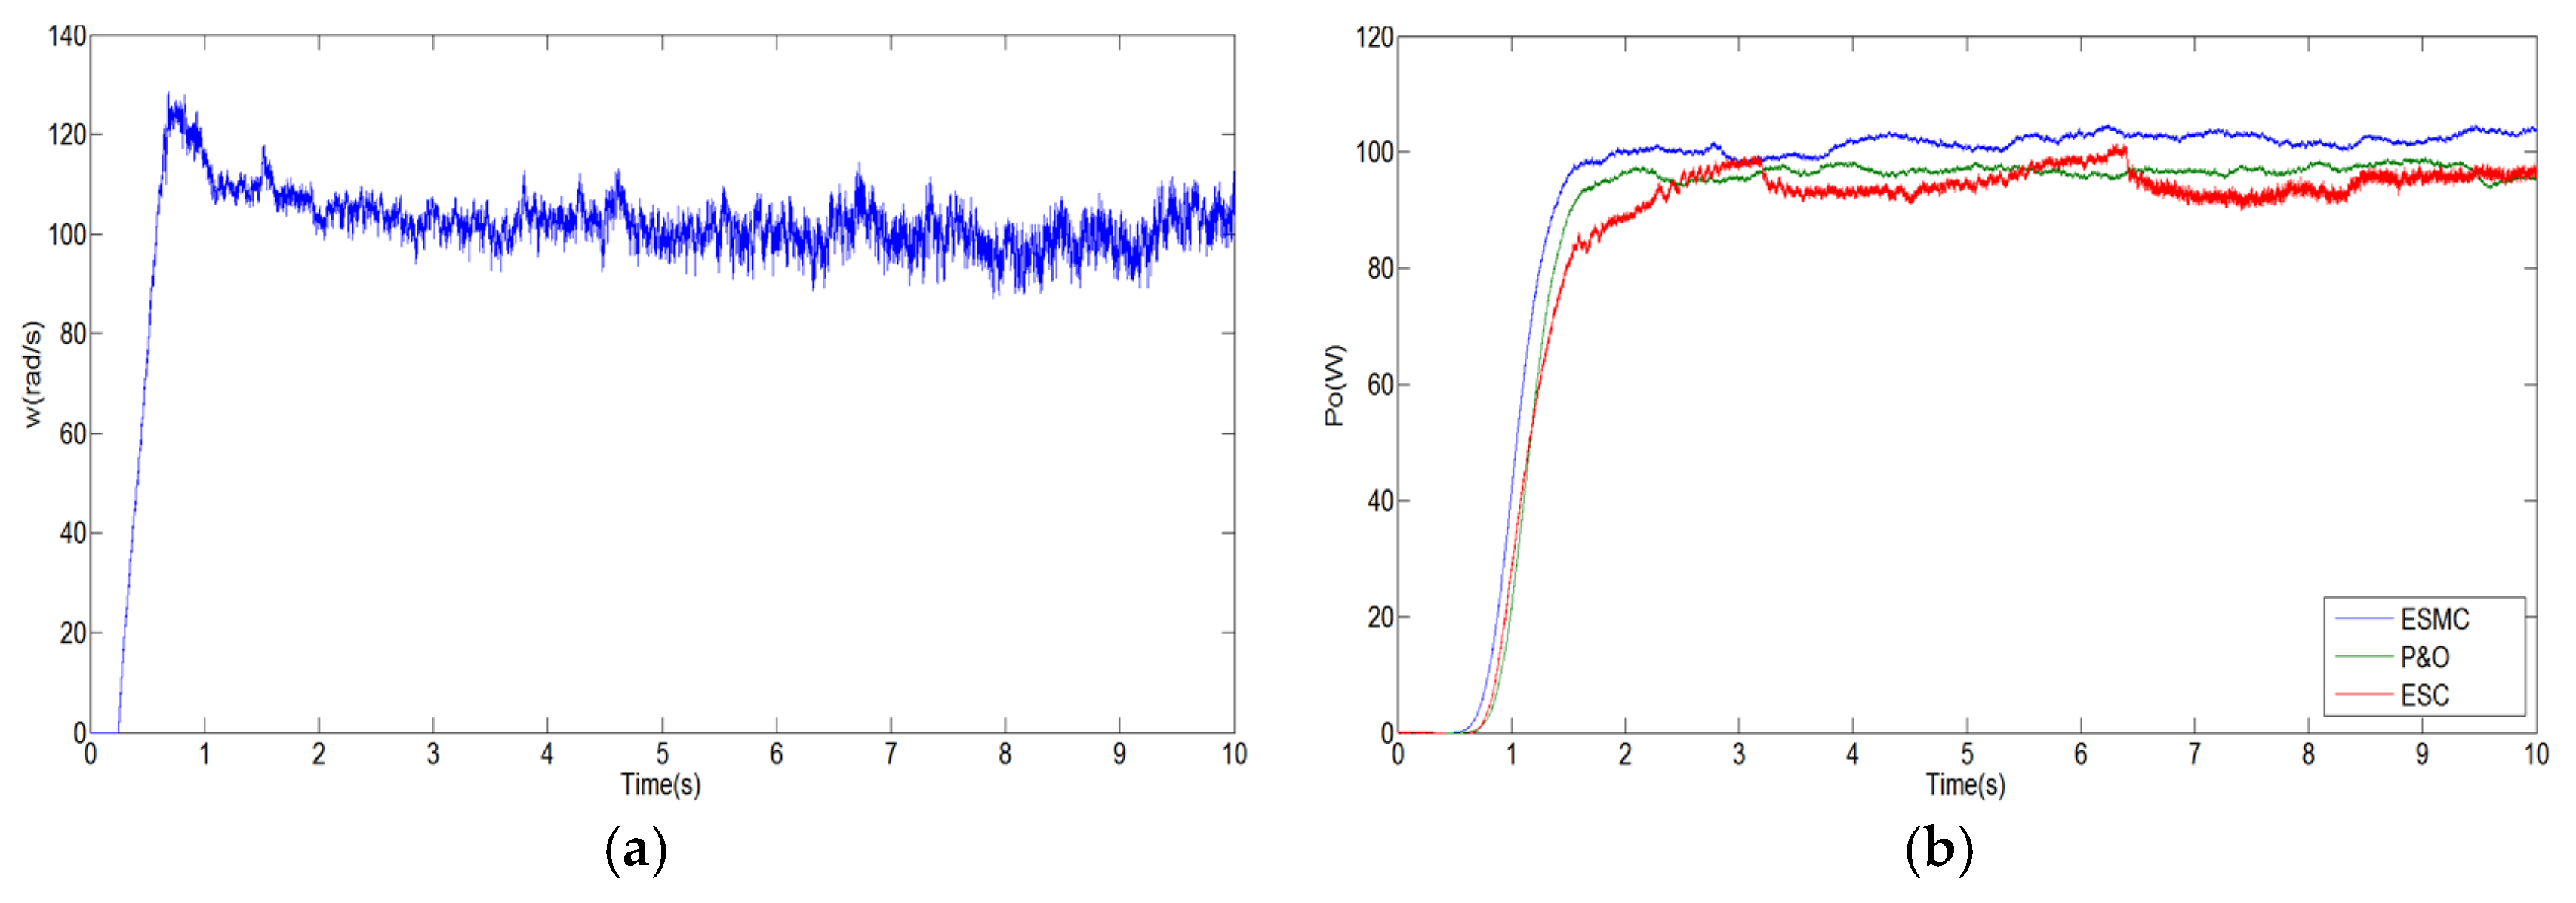
Figure 11a shows the pedaling speed waveform ω of GBEE.
Figure 11b is a comparison of the output power Po for the three control methods. Of the three, the ESMC has the best output power Po and response speed.
Figure 10.
The structural diagram of the actual hardware.
Figure 10.
The structural diagram of the actual hardware.
Figure 11.
(a) Pedaling speed waveform ω (rad/s); and (b) comparison of the three control methods.
Figure 11.
(a) Pedaling speed waveform ω (rad/s); and (b) comparison of the three control methods.
PSIM is used to simulate the input current
ia waveform, and the FFT spectrum analysis of PSIM is applied to the harmonic components of generator input current
ia. FFT spectrum analysis of PSIM is applied after the current
ia is obtained. Thus, the FFT spectrum analysis of the voltage regulation control on generator input current
ia can be obtained. Simulate the three control methods of P&O, ESC, and ESMC with PSIM, respectively, by following the aforementioned method [
18]. In this way, the generator input currents
ia of the three control methods can be obtained.
Figure 12a shows the relationship between the three control methods and the generator input current
ia. Finally, a comparison is made using the FFT spectrum analysis function of PSIM.
Figure 12b shows the FFT spectrum analysis of the generator input currents
ia of the three control methods. It can be observed from
Figure 12b that the result of ESC is the poorest for the first harmonic component, but the highest for the ESMC and the P&O in the fifth and seventh harmonic components, respectively. It can also be observed from
Figure 12b that the harmonic component of the ESMC proposed in this paper is lower than that for both P&O and ESC. In this paper, the THD is also simulated by PSIM [
19].
Figure 12.
(a) Three control methods and the generator input current ia; and (b) fast Fourier transform (FFT) spectrum analysis of the generator input currents ia of the three control methods.
Figure 12.
(a) Three control methods and the generator input current ia; and (b) fast Fourier transform (FFT) spectrum analysis of the generator input currents ia of the three control methods.
Table 3 shows the THD results for different speeds of the three control methods. The THD of the proposed ESMC is also lower than that for both P&O and ESC.
Table 3.
Total harmonic distortion (THD) results for different speeds of the three control methods.
Table 3.
Total harmonic distortion (THD) results for different speeds of the three control methods.
| Controller Method | Speed | THD% |
|---|
| ESMC | V = 12 km/H | 0.895% |
| ESMC | V = 15 km/H | 0.895% |
| ESC | V = 12 km/H | 0.9487% |
| ESC | V = 15 km/H | 0.9487% |
| P&O | V = 12 km/H | 0.9327% |
| P&O | V = 15 km/H | 0.9327% |


