Article

Mechanical Properties of Longmaxi Black Organic-Rich Shale Samples from South China under Uniaxial and Triaxial Compression States

1
Key Laboratory of Shale Gas and Geoengineering, Institute of Geology and Geophysics, Chinese Academy of Sciences, Beijing 100029, China
2
College of Earth Science, University of Chinese Academy of Sciences, Beijing 100049, China
*
Author to whom correspondence should be addressed.
Energies 2016, 9(12), 1088; https://doi.org/10.3390/en9121088
Submission received: 27 July 2016 / Revised: 5 December 2016 / Accepted: 12 December 2016 / Published: 20 December 2016

Abstract

:
With the exploitation of shale gas booming all over the world, more and more studies are focused on the core technology, hydraulic fracturing, to improve commercial exploitation. Shale gas resources in China are enormous. In this research, a series of tests were carried out with samples of black organic-rich shale from the Lower Silurian Longmaxi formation, south China. Samples were drilled from different directions and were subjected to uniaxial and triaxial condition with various confining pressures, aiming at studying its rock mechanics properties, so as to provide basis for research and breakthrough of hydraulic fracturing technology. According to the results of the study, the development and distribution of shale’s bedding planes significantly impact its mechanical properties. Shale samples show obvious brittle characteristics under low confining pressure, and its mechanical behavior begins to transform from brittle to plastic characteristics with increasing confining pressure. Shale samples with different inclinations (β) have different sensitivities to the confining pressure. As a result, samples with 45° inclinations (β) are least sensitive. The strength of bedding planes is significantly lower than that of shale matrix, and tensile failure and shear failure generally tend to occur along the bedding planes. When hydraulic fracturing was conducted in shale formation with depth less than 2.25 km, corresponding to original in-situ of 60 MPa, cracks will preferably occur at first along the inclination (β) angle of 45° from the maximum principal stress, and the failure mode is most likely to be shear failure without volumetric strain. And, different modes of failure will occur at different locations in the reservoir, depending on the orientation of bedding inclined from the principle stress, which can probably explain the phenomenon why there are fractures along and cross the bedding planes during hydraulic fracturing treatment. When hydraulic fracturing was conducted in shale formation with depth greater than 2.25 km, hydraulic fractures may not crack along the bedding surfaces to some extent.

1. Introduction

Shale has received much attention in recent years due to its gas bearing properties, which offer important economic benefits [1,2,3]. Shale gas extraction requires the use of hydraulic fracturing technology [4], a technology that can benefit from understanding the mechanical properties [5,6]. Shales generally exhibit low porosity and permeability [7,8,9,10]. Better grasp of these characteristics helps to improve the fracturing process. The most direct method to investigate mechanical behavior of rock is to develop a series of laboratory tests, such as uniaxial compression tests and triaxial compression tests. Donath made an experimental study to determine the effect of primary and secondary foliation on the strength and failure characteristics of certain common rocks [11]. Chenevert et al. studied the effects of bedding plane orientation on the elastic constants and the yield strengths of three laminated rocks and one isotropic rock [12]. McLamore et al. determined the compressive strength as a function of confining pressure and sample orientation for three anisotropic sedimentary rocks [13]. Smith et al. combined a three-dimensional, transversely isotropic yield condition with a plane of weakness to describe the initial yield limit for Green River Shale [14]. Swan et al. presented evidence for a great rate effect as seen in triaxial compression tests on comparatively soft, saturated shale from Kimmeridge Bay, Dorset, UK. [15]. Ibanez et al. investigated the mechanical properties and deformation mechanisms of illite-rich shale in triaxial compression experiments at varying confining pressures, temperatures and strain rates [16]. Kwon et al. investigated mechanical and fluid transport properties of brine-saturated illite shale from the Wilcox Formation to examine the effects of strain rate on fracture strength and to determine the conditions over which rates of deformation and internal fluid flow compete [17]. From experiments performed with outcrop and overburden shales, Martin et al. observed that dynamic elastic moduli measured at ultrasonic frequencies by far exceed static moduli. The data indicate a relation between static and dynamic moduli [18]. Cho et al. investigated the comprehensive experimental results of deformability and strength properties of anisotropic rocks in Korea, and demonstrated the applicability of the transversely isotropic model for the rocks chosen in this study, which belong to metamorphic and sedimentary rocks. They investigated the dependency of the determined elastic constants on the number of strain measurements [19]. Tan et al. reported on the mineralogy, lithofacies, petrophysics, and rock mechanics of samples collected from the Ediacaran (Upper Sinian), Lower Cambrian, and Lower Silurian black shale intervals [20]. Many tests have been conducted on shale and slate to investigate the mechanical properties. However, there are few studies on the Longmaxi shale of shale gas block in China. And, the anisotropy of rock mechanics and anisotropic elastic parameters could not be defined based on these test results because these had not been obtained utilizing the specific criteria for anisotropy testing sample selection. In addition, samples from previous testing programs mostly have a limited range of sample foliation angles. Moreover, the confining pressures used in previous experimental studies are relatively low, which is not conformity with the actual situation of shale gas reservoirs in China. In this research, a large number of tests were carried out for Longmaxi shale, aiming at exploring the rock mechanical properties of shale reservoir in China. Shale blocks used in this paper were excavated from outcrops of a marine shale gas field in South China. Standard core samples of different sizes were drilled for various rock mechanics tests, coring samples with different bedding. During the drilling of cores, a special method was used to obtain samples with different inclinations (β). A series of laboratory experiments, e.g., uniaxial compression test, triaxial compression tests, were performed with the principal compression direction at varying angles to bedding. Stress-strain curves, ultimate strengths and mechanical parameters obtained from the tests were analyzed and compared with others’ work.

2. Materials and Methods

2.1. Studying Idea

To study the hydraulic fracturing mechanism of shale rock, it is necessary to first understand its basic mechanical properties. Thus, in this study, we performed a series of basic mechanical experiments on shale samples. First, the spacing and distribution of fractures on the sample surfaces were observed and statistically analyzed using a high-precision electron microscope to determine their integrity. The electron microscope was a kind of microscope with a USB connector, and could be controlled by the computer through specialized software. Then, a series of uniaxial and triaxial compression tests were carried out using an electro-hydraulic servo tester to explore the deformation and failure characteristics of shale samples subject to true underground stresses, so as to explore the impacts of shale’s bedding plane heterogeneity and further study its mechanical properties. Figure 1 shows the schematics of physical simulation experiments.

2.2. Sample Preparation

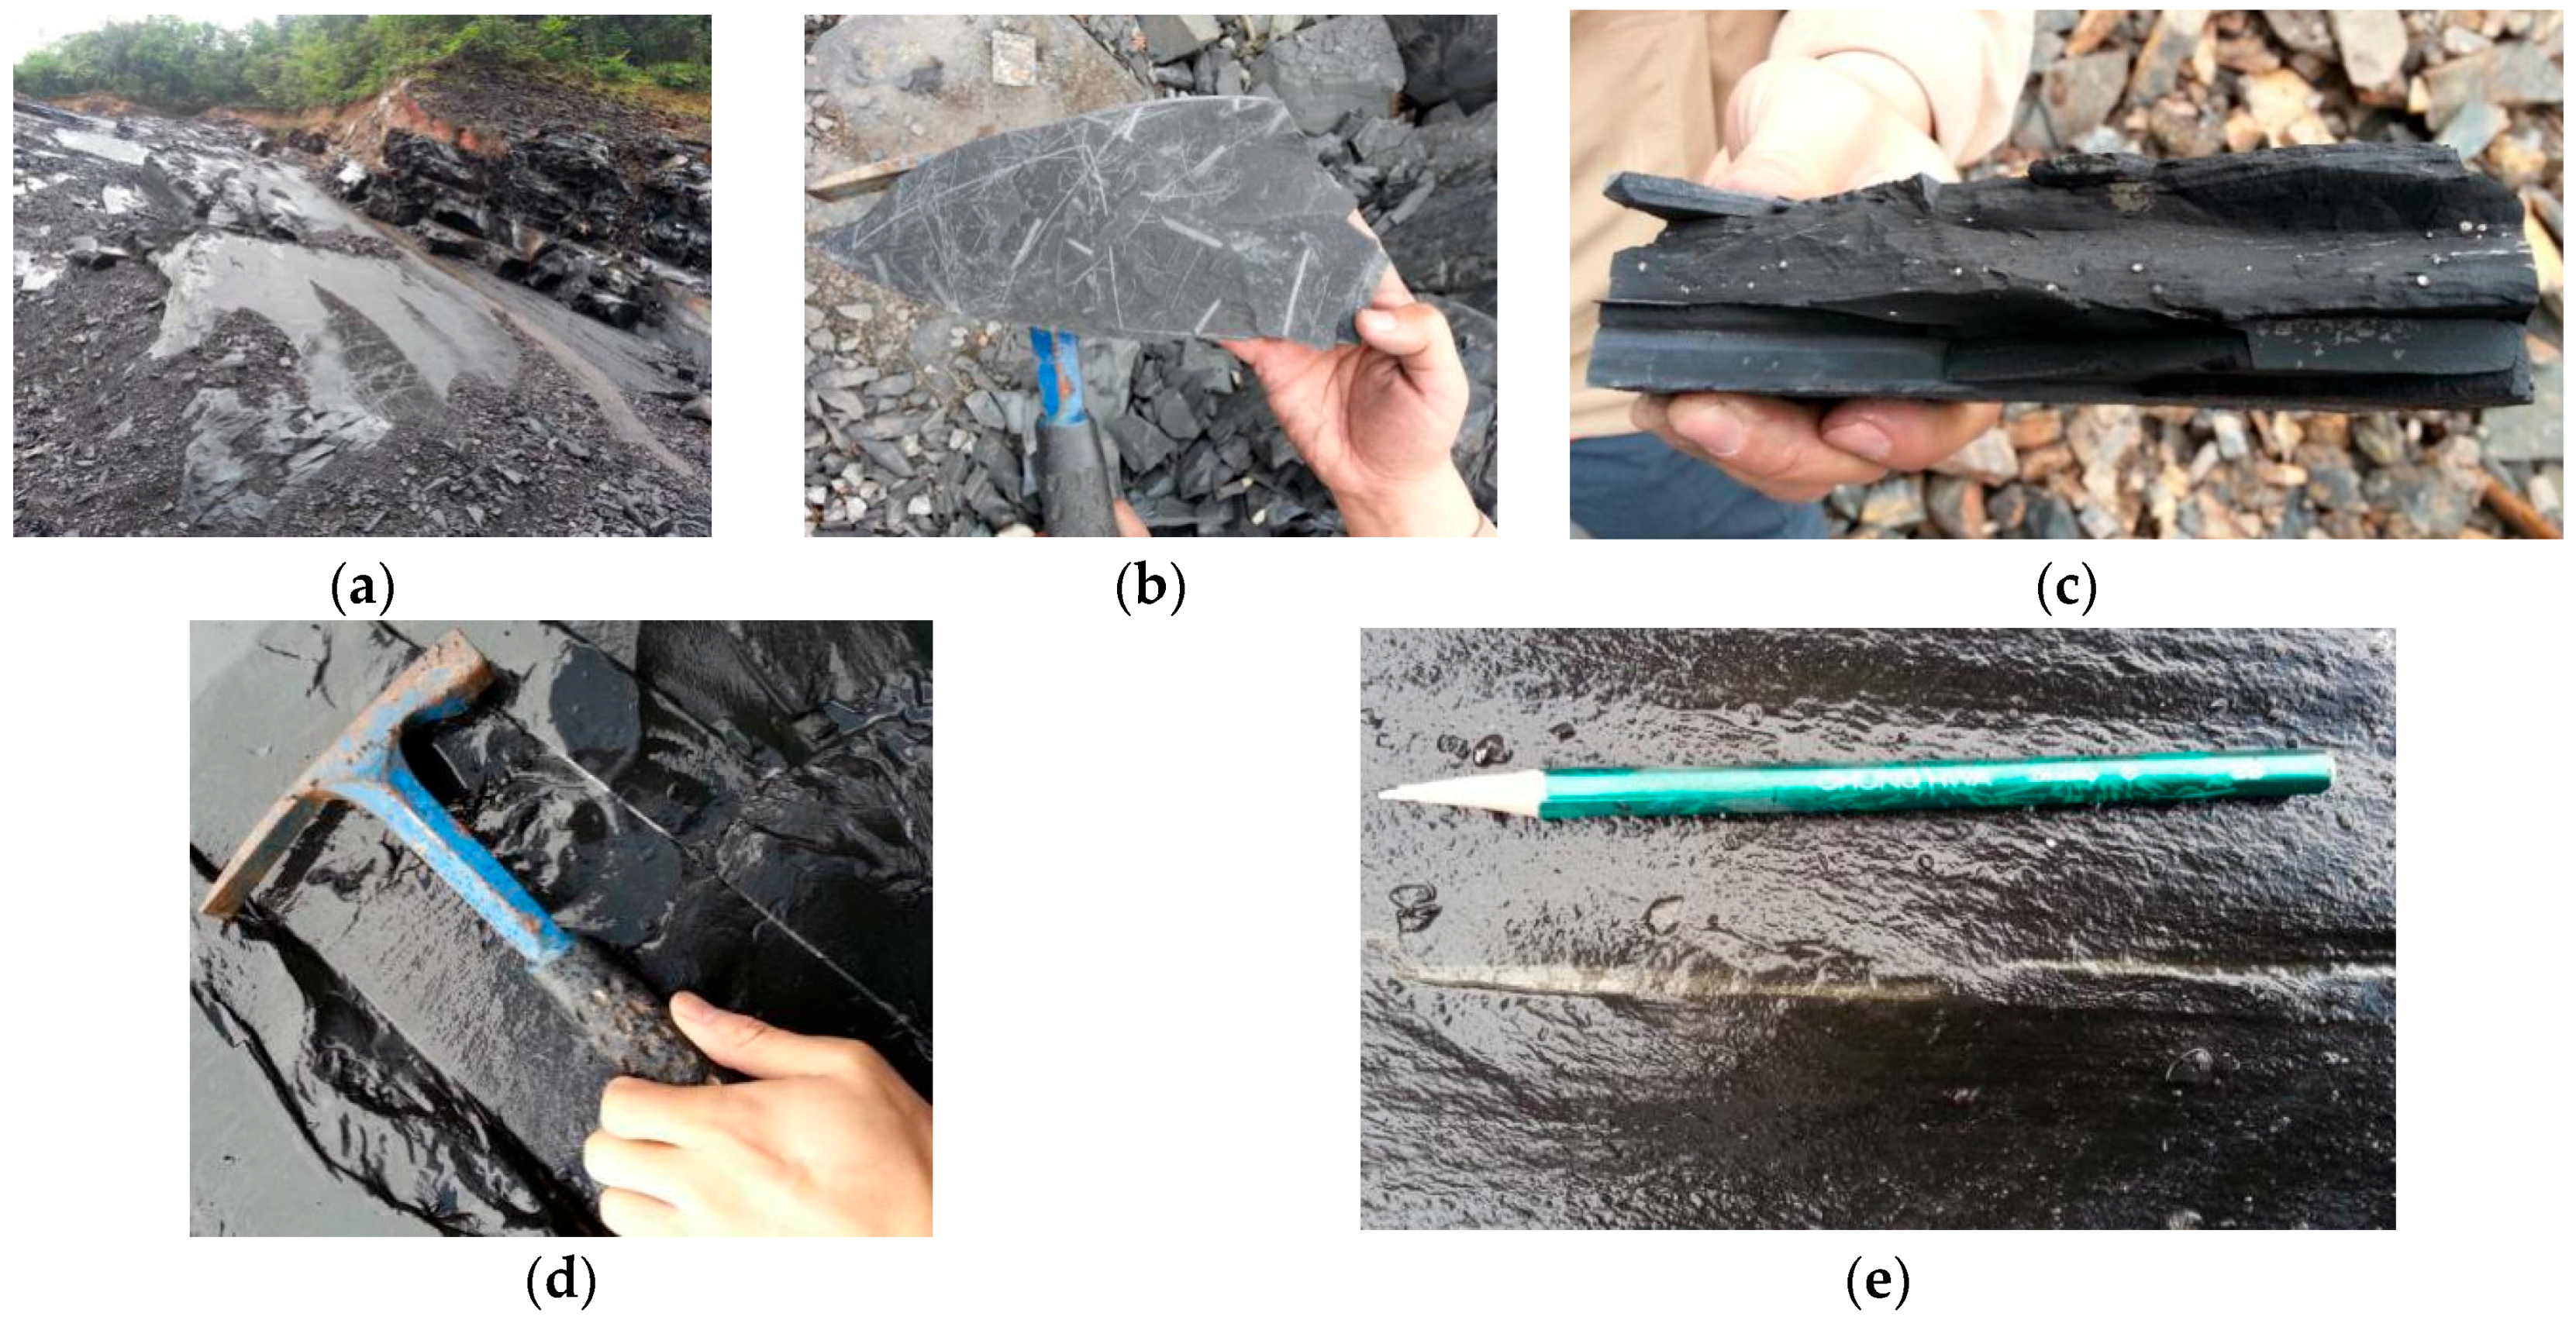
2.2.1. Description of the Studied Shale

Black shale samples were extracted from outcrops of marine Silurian Longmaxi Formation in Shizhu County, which constitutes the Chongqing Jiaoshiba shale gas block reservoirs. Longmaxi formation from the Lower Silurian is composed of high proportion of quartz, low content of clay, and rare or nonexistent content of carbonates [20]. According to Tan’s research, the Lower Silurian shales were deposited in a restricted marine basin environment and were formed during bottom water anoxic conditions; therefore, they were rarely influenced by bioturbation. Lithologically, laminated and nonlaminated siliceous shale predominate, with minor contributions of other lithotypes. Pores generally have diameters in the nanometer (nm) to micrometer (μm) range, and numerous pores occur in organic matter. Most of the measured samples have porosities less than 4%, although a few samples show porosity in excess of 10%. Especially, minerals typical of siliciclastic sediments (quartz, feldspar, and pyrite) dominate in the Longmaxi formations. And, laminated and nonlaminated siliceous shale predominate, and there are minor contributions from calcareous shale-mudstone and others, observed by lithofacies analysis by Tan et al. By using X-ray powder diffraction technique, Xu et al. analyzed the mineral components of specimens from Longmaxi shale outcrops in Shizhu Country [21]. Results are presented in Table 1. It could be learned from Table 1 that the content of quartz of shale cores of Qiliao outcrops was between 27.33% and 31.39%, with an average of 28.62%. Illite and chlorite dominated the clay mineral, accounting for the total content of 43.52% to 50.32%. The average content of illite was 41.47%, and that of chlorite was 5.88%. The other components were albite, potash feldspar, calcite, and pyrite. The content of illite accounted for 87.6% of the total content of clay mineral. The high and stable content of illite showed that the Longmaxi formation had experienced late diagenesis stage. The fracture development and pore structure characteristics of shale outcrop were studied through non-destructive scanning technology of large scale industrial computed tomography (CT) and scanning electron microscope (SEM) by Xu et al. They found that large size shale specimens had developed pore structures, and that pyrite bands and micro-cracks with different depths paralleled to part of the bedding surface. According to Figure 2c in this study, we can learn that pyrite also occurs as isolated framboidal clusters. Clay minerals were oriented under sedimentary compaction, forming the bedding surface obviously. Minerals like quartz, feldspar, and calcite consisted to interlayer support. As mineral particles were very small, they cemented very well with each other, with no obvious existence of large pores. In addition, the total organic carbon (TOC) of shale outcrop was between 1.5% and 6.5%, with an average of 2.5% [21,22].
Figure 2 shows the Longmaxi Formation black organic-rich shale outcrops. From the figure it can be seen that (1) black shale stratum outcrops with continuous, thick, multi-layered structure, and steady bedding deposition (Figure 2a); (2) bedding planes exhibit graptolite and radiolarite fossils (Figure 2b); (3) oolitic pyrite (Figure 2c); (4) quartz and pyrite veins along some bedding planes (Figure 2d,e); and (5) orthogonal joints parallel and perpendicular to the bedding planes with the joint spacing of 5–50 cm.
The Longmaxi Formation has long been known to be the principal source rock for conventional petroleum reservoirs [23]. The formation has recently become the target of unconventional shale gas exploration and development. Ma et al. found that the accumulation of organic matter was determined by high paleoproductivity and anoxic water conditions. The Lower Silurian black organic-rich shale of the Longmaxi Formation is encountered throughout the upper Yangtze craton in southwestern China. Recent advances using microscopic techniques have allowed significant progress in understanding black organic-rich shale heterogeneity and the underlying depositional processes that form fine-grained sedimentary rocks. Their results show that biogenic quartz is abundant, and TOC are well correlated to quartz content and nondetrital trace element proxies (Vxs, Uxs, Nixs and Cuxs), suggesting the enrichment of organic matter in the Long-1 Member was controlled by changing paleoproductivity and bottom water redox conditions in a periodically stratified marine basin [24]. Depositional processes, productivity, and bottom water redox conditions have a profound control on the basin-wide distribution of lithofacies as well as the amount and quality of organic matter [25,26,27,28,29,30,31,32,33]. The Sichuan Basin developed on the Precambrian metamorphic basement of the upper Yangtze craton [34]. The accumulation of basinal, Lower Paleozoic strata was significantly influenced by several important tectonic events during the Sinian to Silurian [35]. By the Early Silurian, tectonics had formed several Kwangsian paleohighs surrounding the Sichuan Basin, including the Chuanzhong uplift in the west, the Xuefeng uplift in the east, and the Qianzhong uplift in the south of the basin [36,37]. The Lower Silurian Longmaxi Formation is widespread in the Sichuan Basin, and pinches out toward the Chuanzhong uplift [38,39]. The formation is dominantly composed of black organic-rich shale that were deposited during a major marine transgression after the Early Silurian global glacial ablation [36,40,41]. In Fuling County, the Longmaxi Formation is conformably overlain by the Silurian Xiaoheba Formation and is underlain by the Ordovician Wufeng Formation [42]. The Longmaxi Formation is divided into three members which are, from bottom to top, including the Long-1 Member, which is composed of black shale and argillaceous siltstone; the Long-2 Member, which consists of light gray argillaceous siltstone and fine-grained sandstone; and the Long-3 Member dominated by gray shale [43].

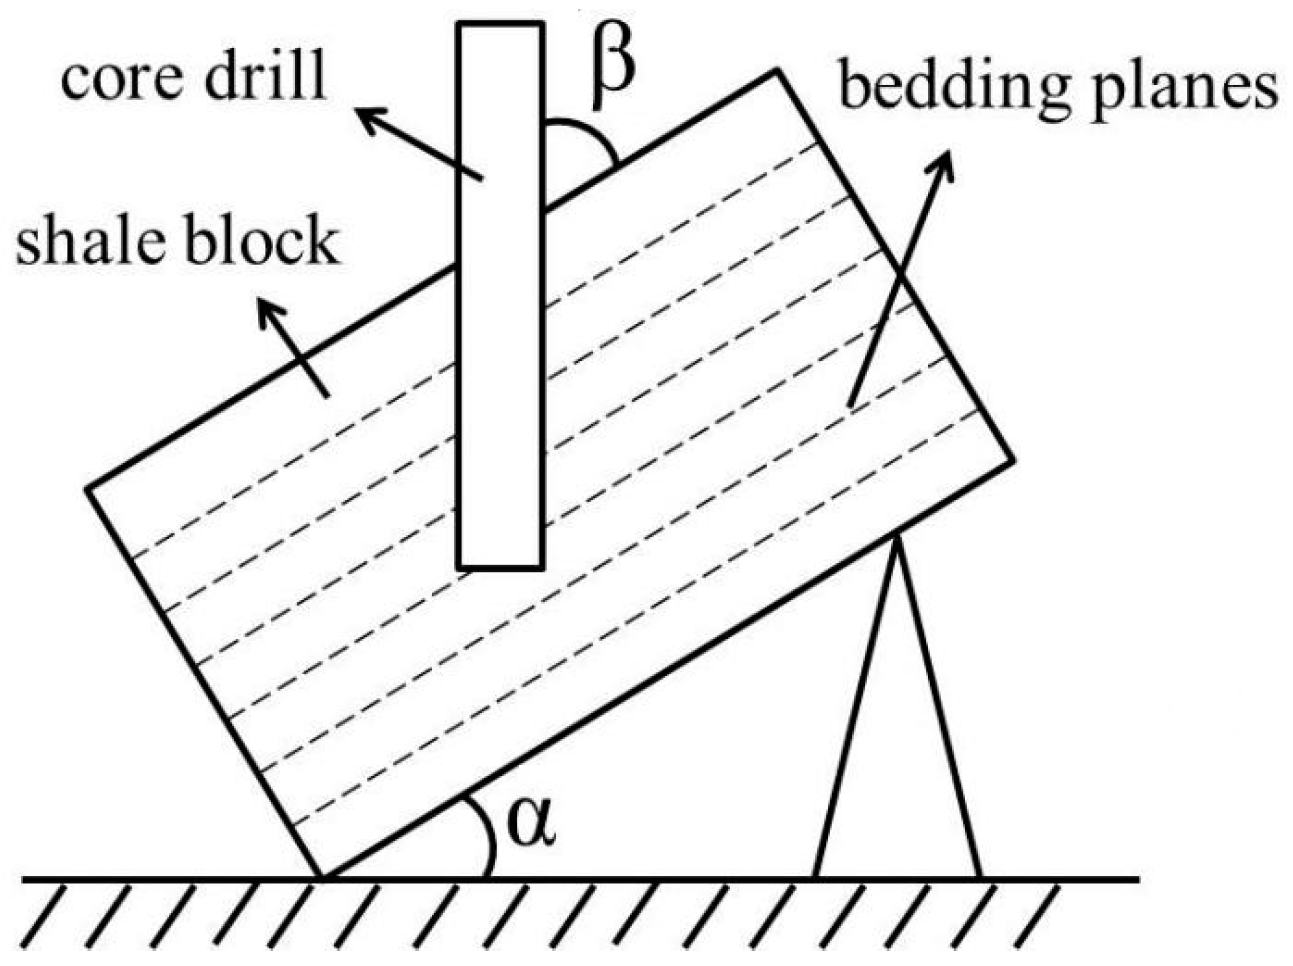
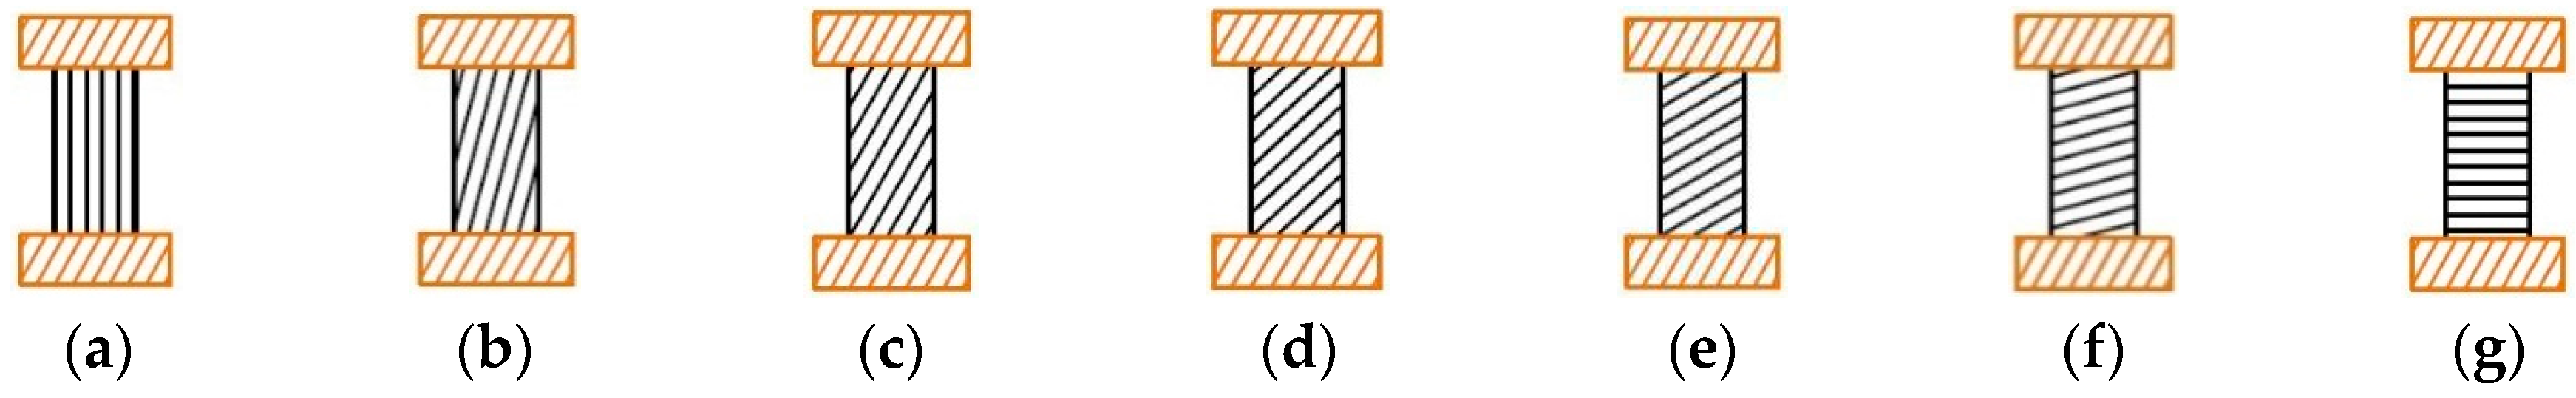
2.2.2. Shale Sample Preparation

The large shale block extracted from the outcrop was cored according to different angles between the bedding plane and the drilling direction. The coring angle β was separately set at 0°, 15°, 30°, 45°, 60°, 75° and 90°, as shown in Figure 3. The coring angle β was also called as the inclination angle (β), as shown in Figure 4. The post-cored samples were processed into the standard samples with 50 mm in diameter and 100 mm in height in accordance with the specification, as shown in Figure 5. The non-parallelism error of the two end surfaces was less than 0.05 mm, the diameter error along the sample height was less than 0.3 mm and the maximum deviation of the end surface perpendicular to the sample axis was less than 0.25°.

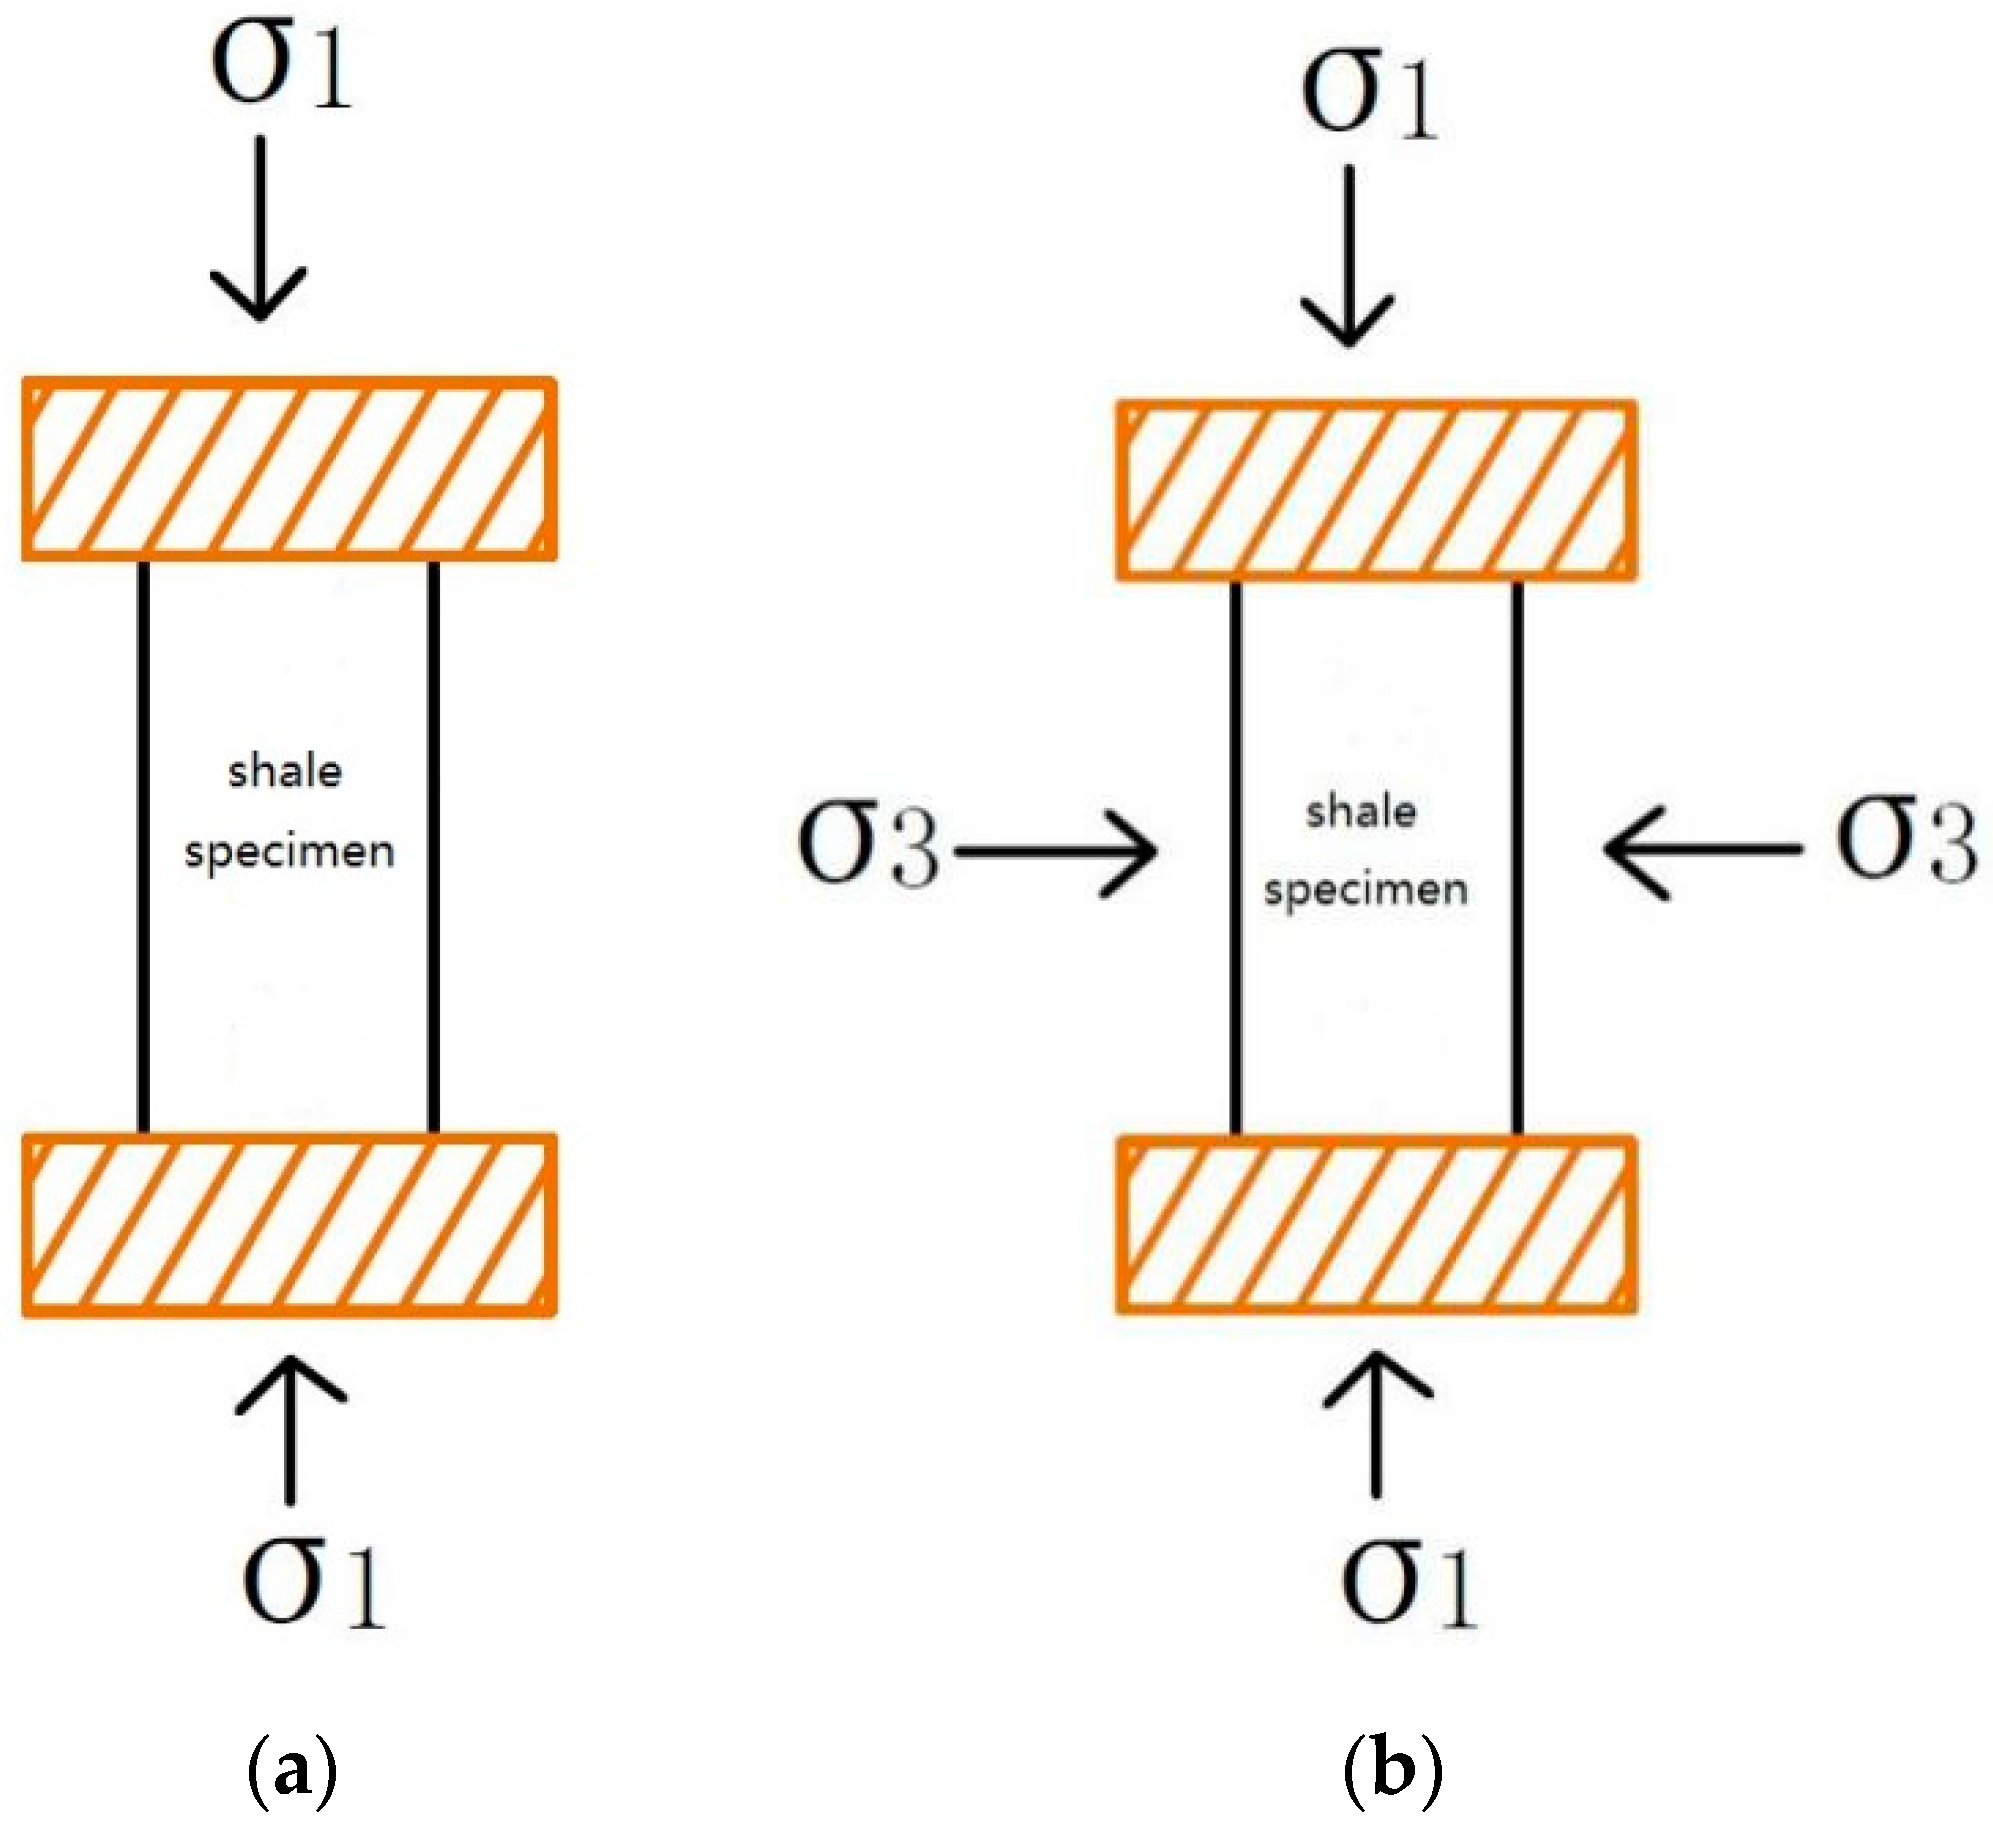
2.3. Experimental Process

Samples were further examined for their micro-fissures development using an electron microscope. Those with more than 3 cracks and with wide cracks were discarded. Samples were selected if they had: (1) small amount of micro-fissures with width of 30–50 μm; (2) low fissure connectivity; and (3) good sample integrity.
Samples were subjected to a uniaxial compression deformation test and a triaxial compression deformation test. According to the difference in inclination (β) of shale samples, a total of 7 groups of experiments were set for each test. For the former, samples in each group were subjected to three parallel experiments with the same dip. For the latter, samples in each group were subjected to three variable confining pressure experiments with the same dip. During the tests, their longitudinal strain, transverse strain, axial stress and confining pressure (in the triaxial case) were real-timely measured and recorded using a computer. The machine was equipped with external digital controller (EDC) of full digital servo controller, with the control accuracy of axial stress of ±0.1%, the control accuracy of confining pressure of ±0.05%. In particular, axial strains and radial strains were measured by strain gauges directly attached to shale samples. The strain gauges are consists of two separate parts, which can independently measure axial strains and radial strains of the samples, with a measuring accuracy of ±1%.

3. Experimental Results and Analysis

3.1. Analysis of Shale Stress-Strain Curves

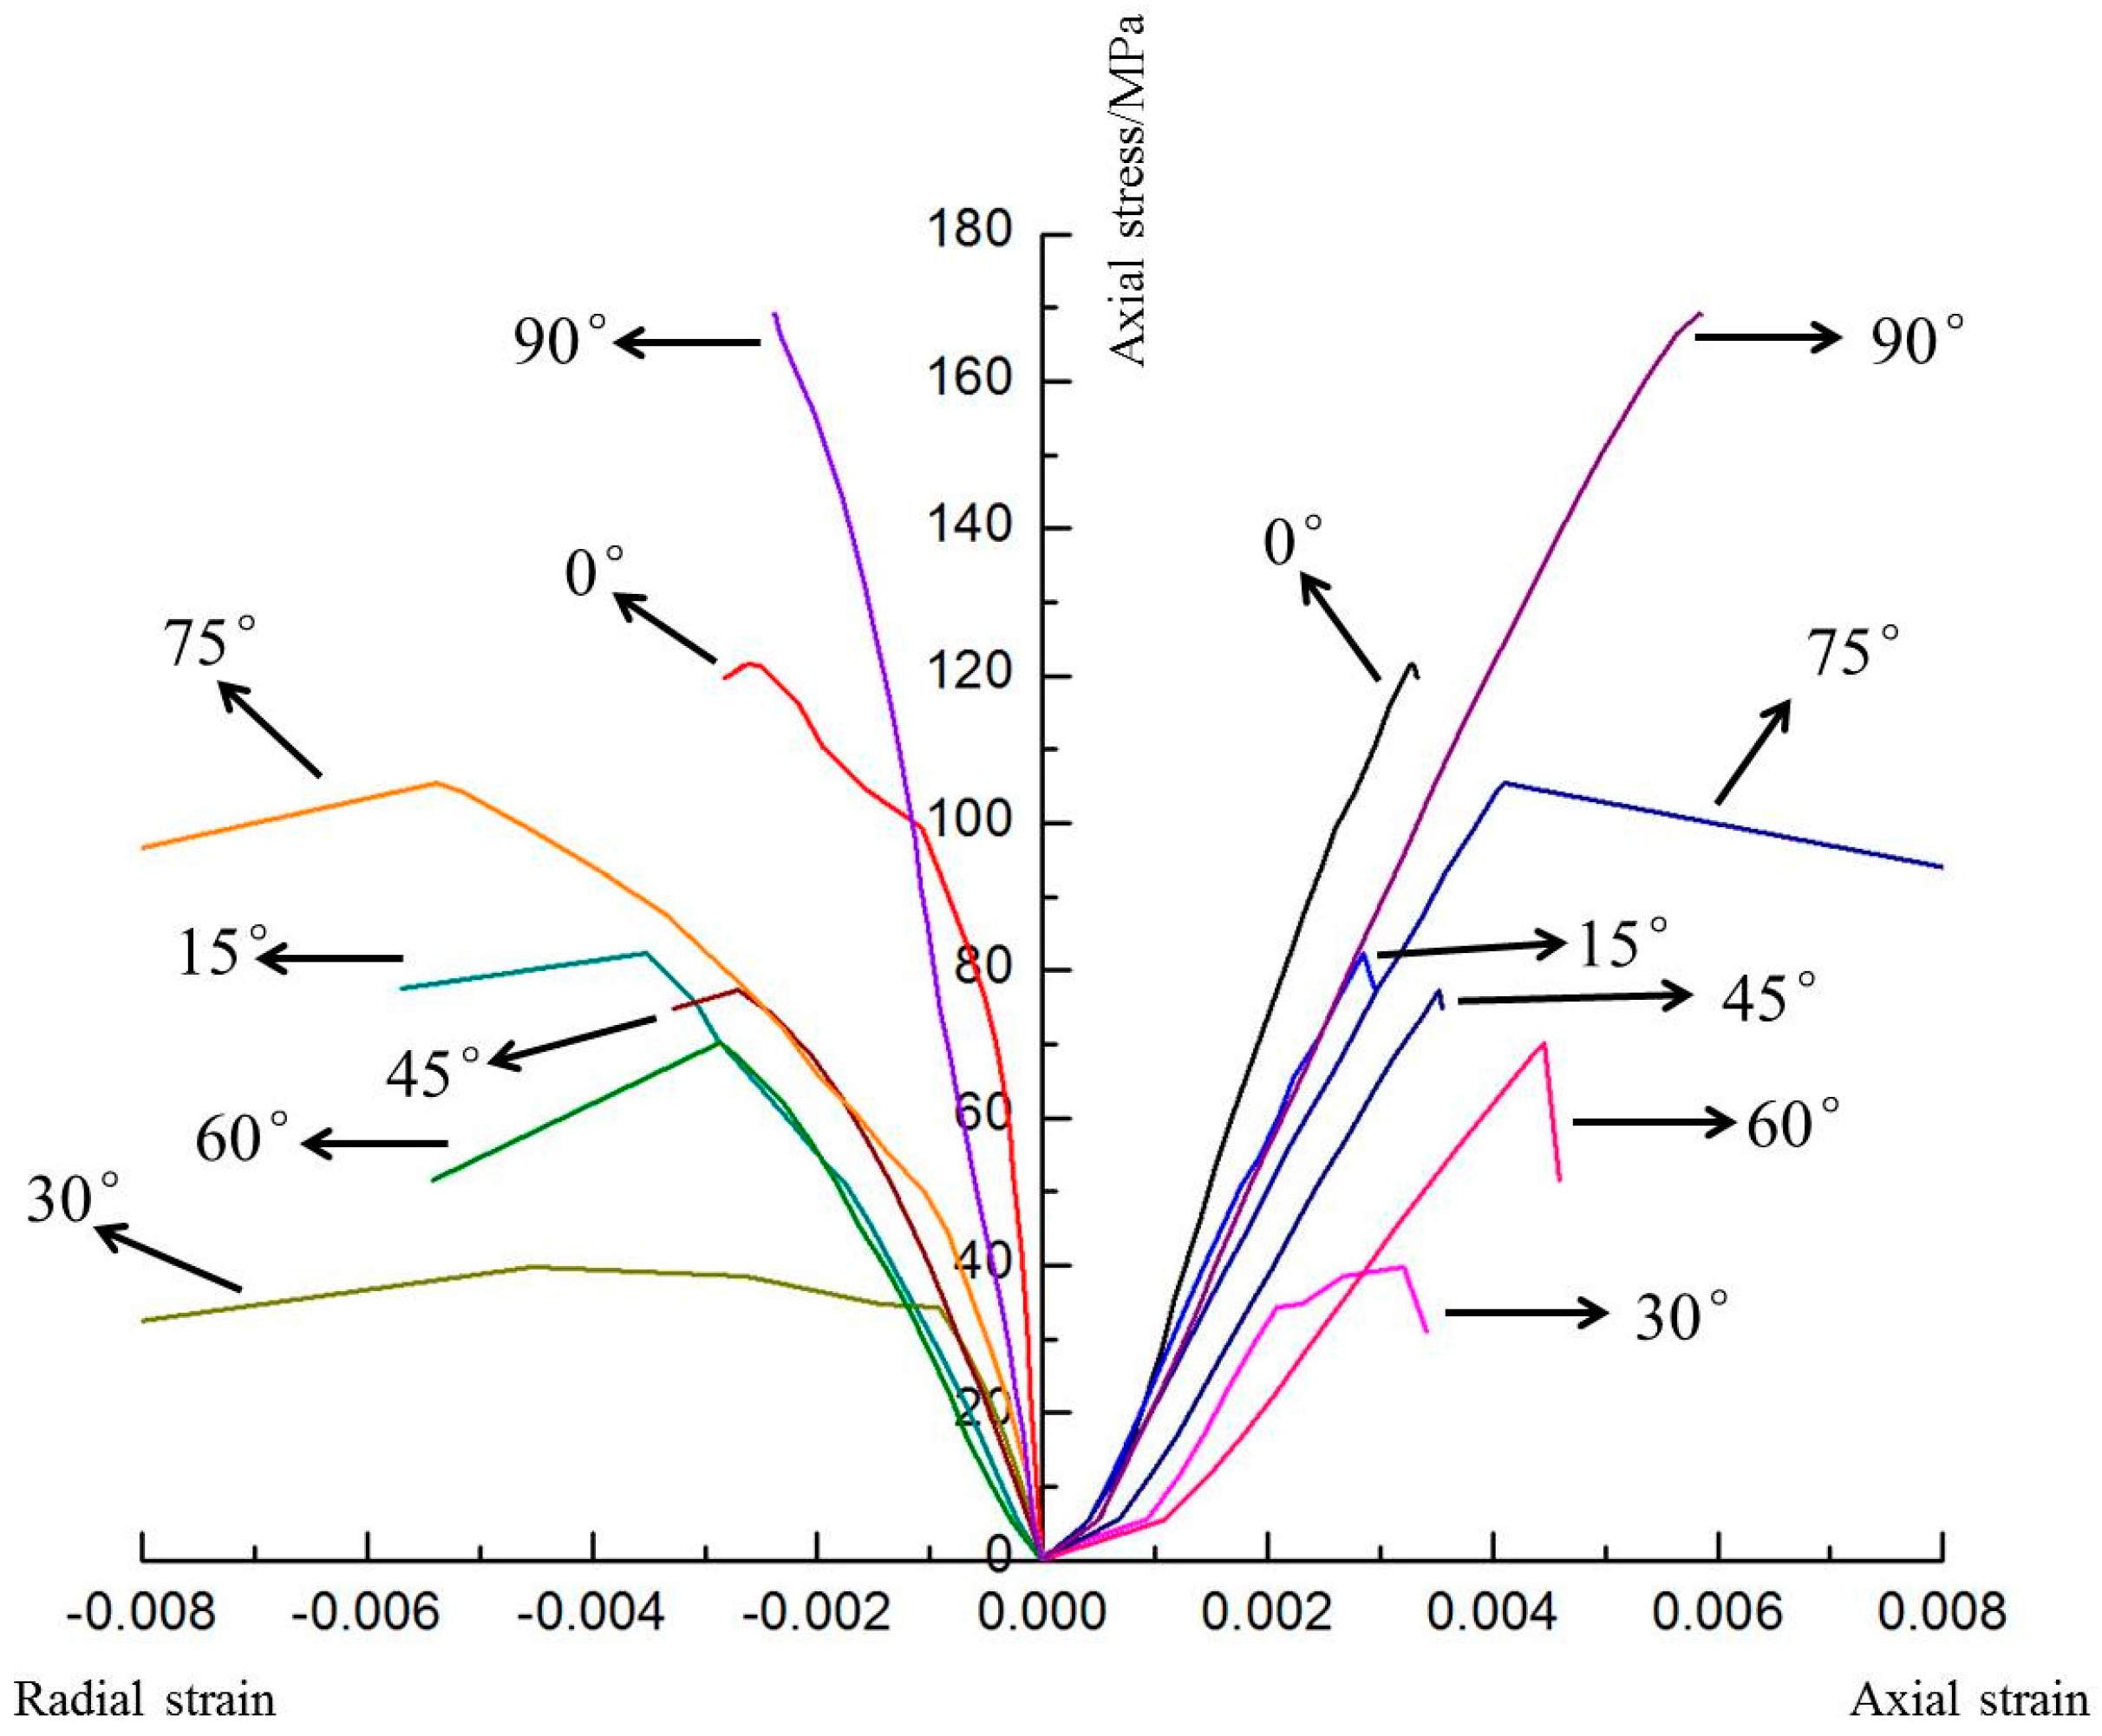
3.1.1. Uniaxial Compression Tests

Figure 6 shows the stress-strain curves for shale samples subject to uniaxial compression. The development of stress-strain curves of uniaxial compression tests were divided into five stages, which were elastic deformation stage including crack closure, linear elastic deformation stage, plastic deformation stage with stable crack growth, plastic deformation stage with unstable crack growth, and post peak stage, respectively. From the figure it is clear that the shale sample deforms less during uniaxial compression, showing less than 1% deformation at different inclinations (β). Before the peak stress, they undergo mostly elastic deformation, showing little plastic deformation. After the peak stress, they exhibit sudden unloading, showing no residual strength. The results indicate that the shale belongs to typical brittle rock.

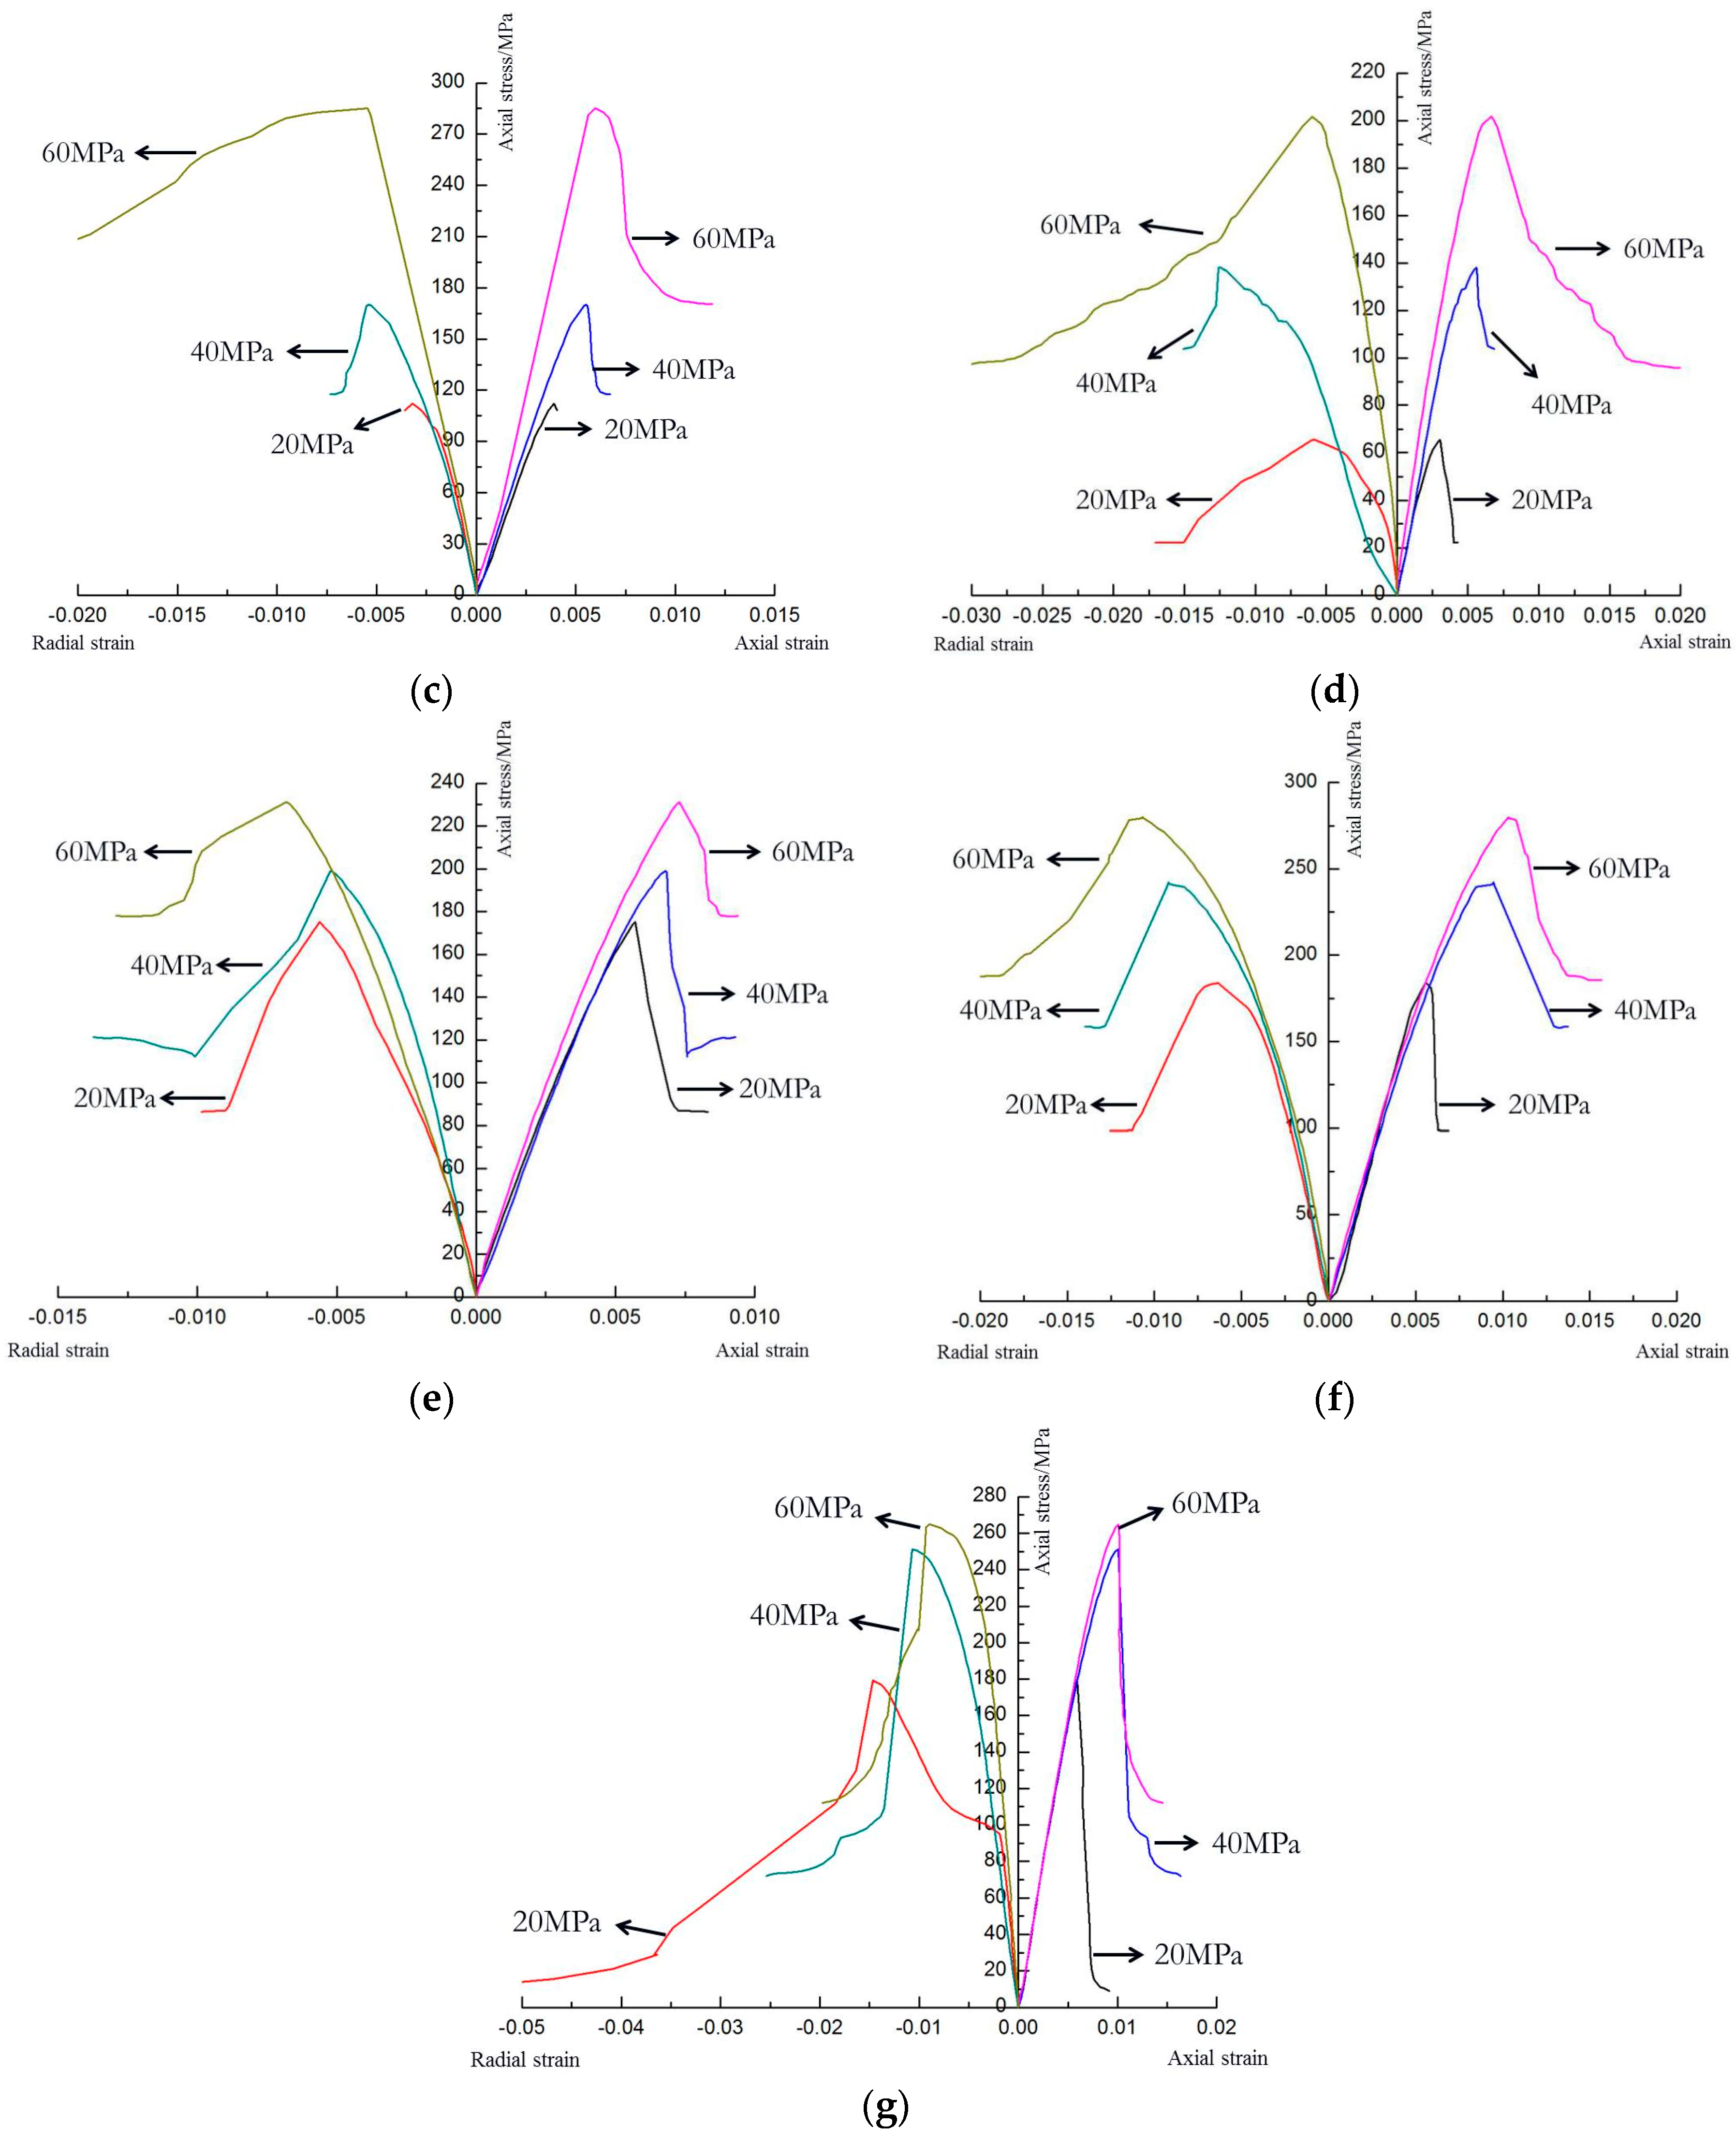
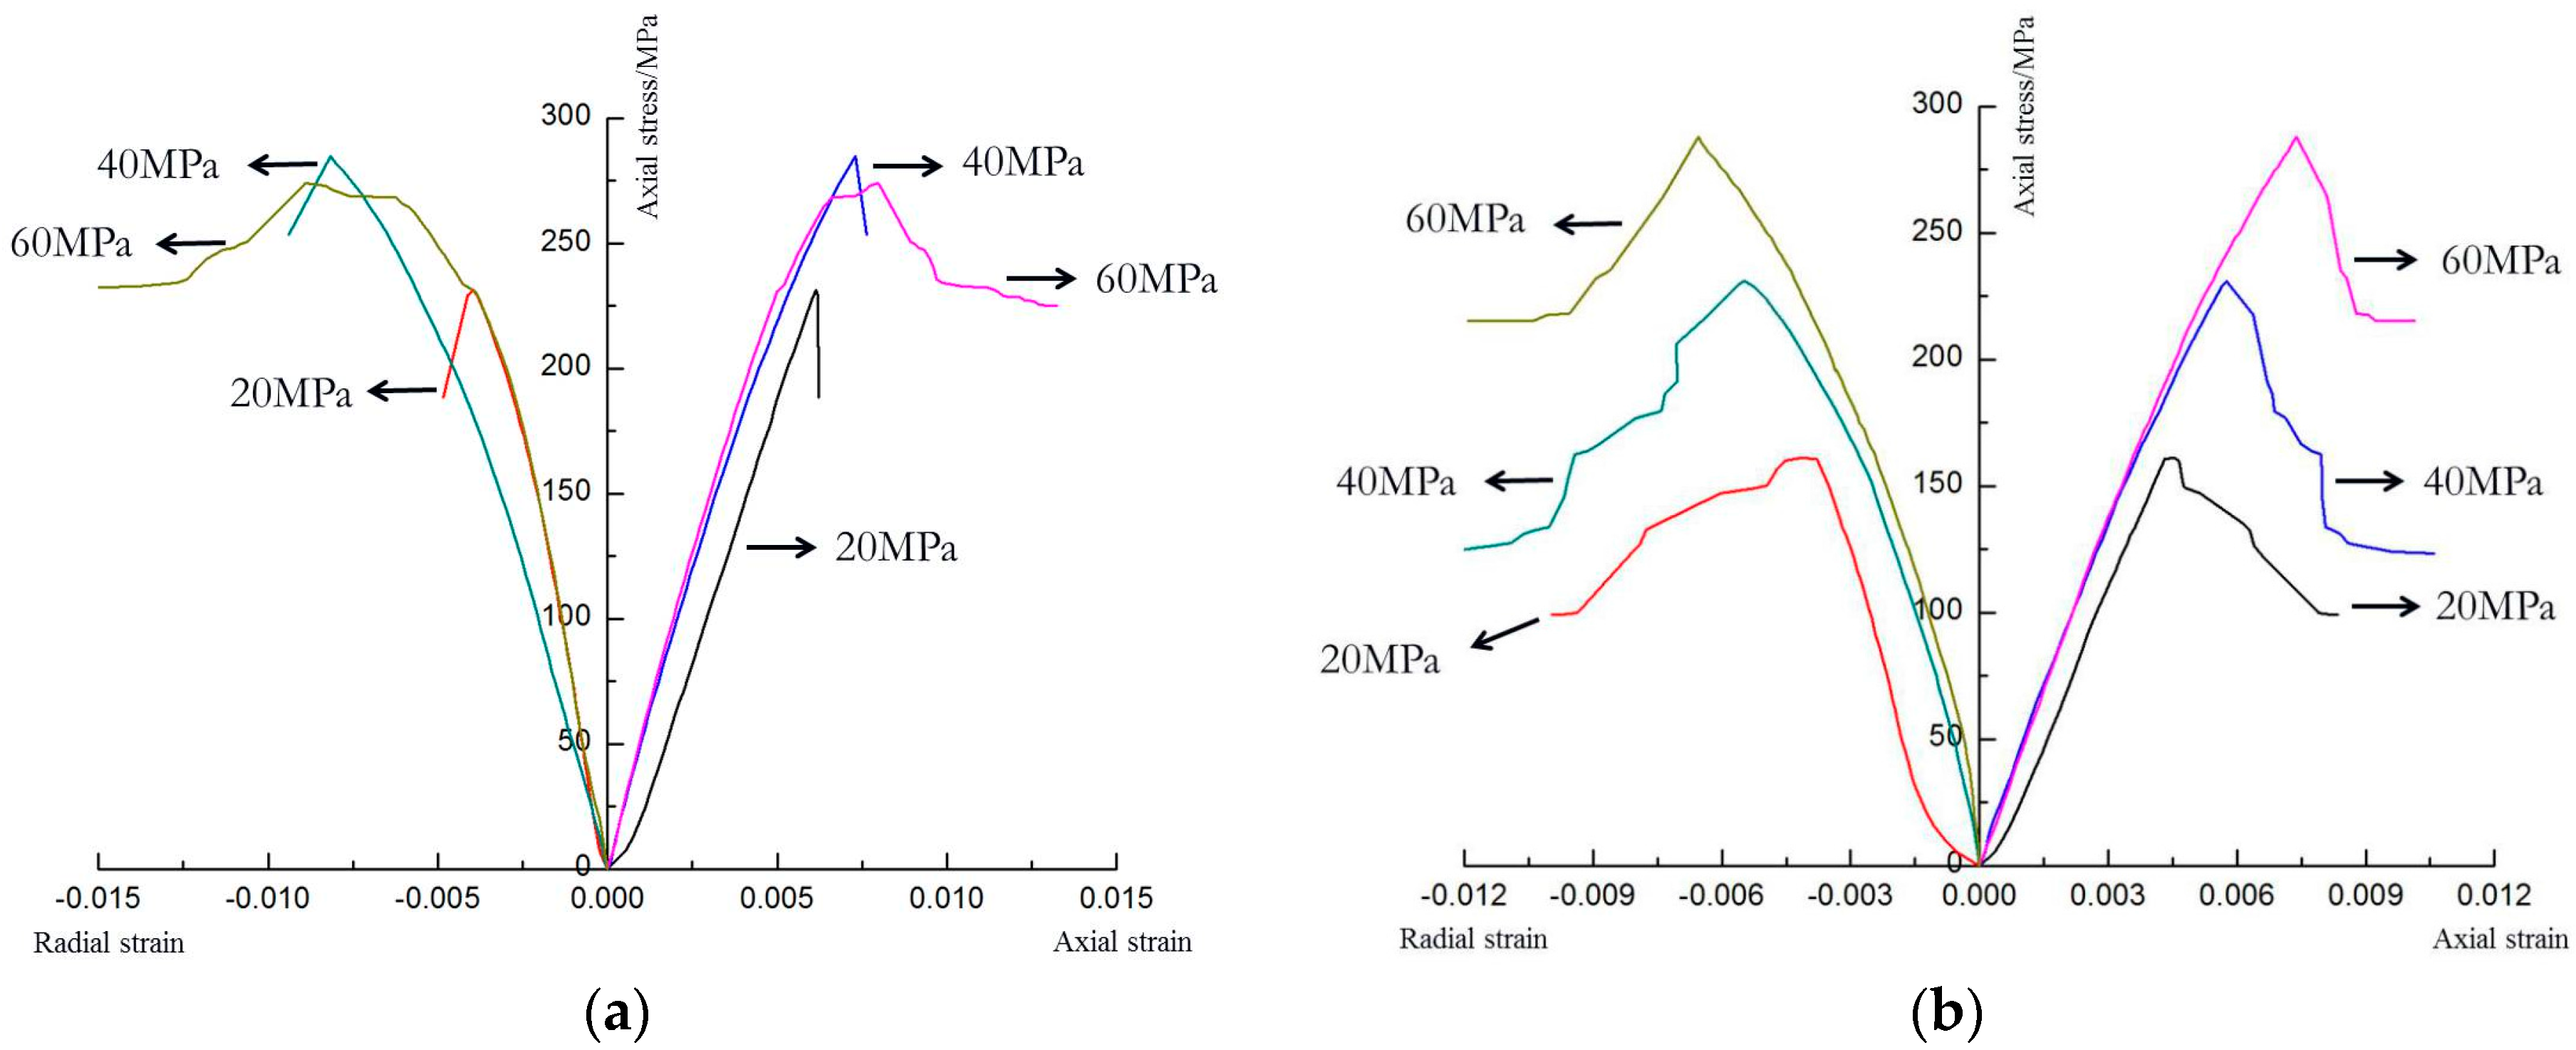
3.1.2. Triaxial Compression Tests

Figure 7 shows the stress-strain curves of shale samples subject to triaxial compression test. The development of stress-strain curves of triaxial compression tests were also divided into several stages, but there were some differences in the shape of the curves, compared with curves of uniaxial tests. From the figure it can be seen that in the same inclination angle (β) condition and with the confining pressure increasing, the mechanical characteristics of shale samples changes from brittle to plastic behavior. In detail, before the compressive stress reaches the peak, shale samples show a short segment of plastic deformation, and after shale failure, the stress is not suddenly unloaded but rather gradually falls approaching a non-zero stress. This phenomenon becomes more obvious at higher confining pressures; the larger the confining pressure, the larger is the residual strength.
However, the shale samples of different bedding inclination angle (β) show differing mechanical characteristics. For samples with 0° and 90° inclinations (β), their residual strengths are difficult to quantify, because that the post-peak stress-strain curves show no clearly horizontal and straight lines; while for samples with other inclination angles (β), their residual strengths are easy to identify, since the post-peak stress-strain curves eventually approach constant stress values.
The stress-strain curve of the samples of 90° inclination (β) does not have a concave shape, suggesting that these samples do not compact significantly. In contrast, the stress-strain curves of samples of all other inclinations (β) show concaves at lower pressures, revealing that: (1) all these shale samples have natural fissures and weak-strength planes; and (2) these weak planes have greater effect on the experimental results of triaxial compression test under low confining pressures, but not under high confining pressures.

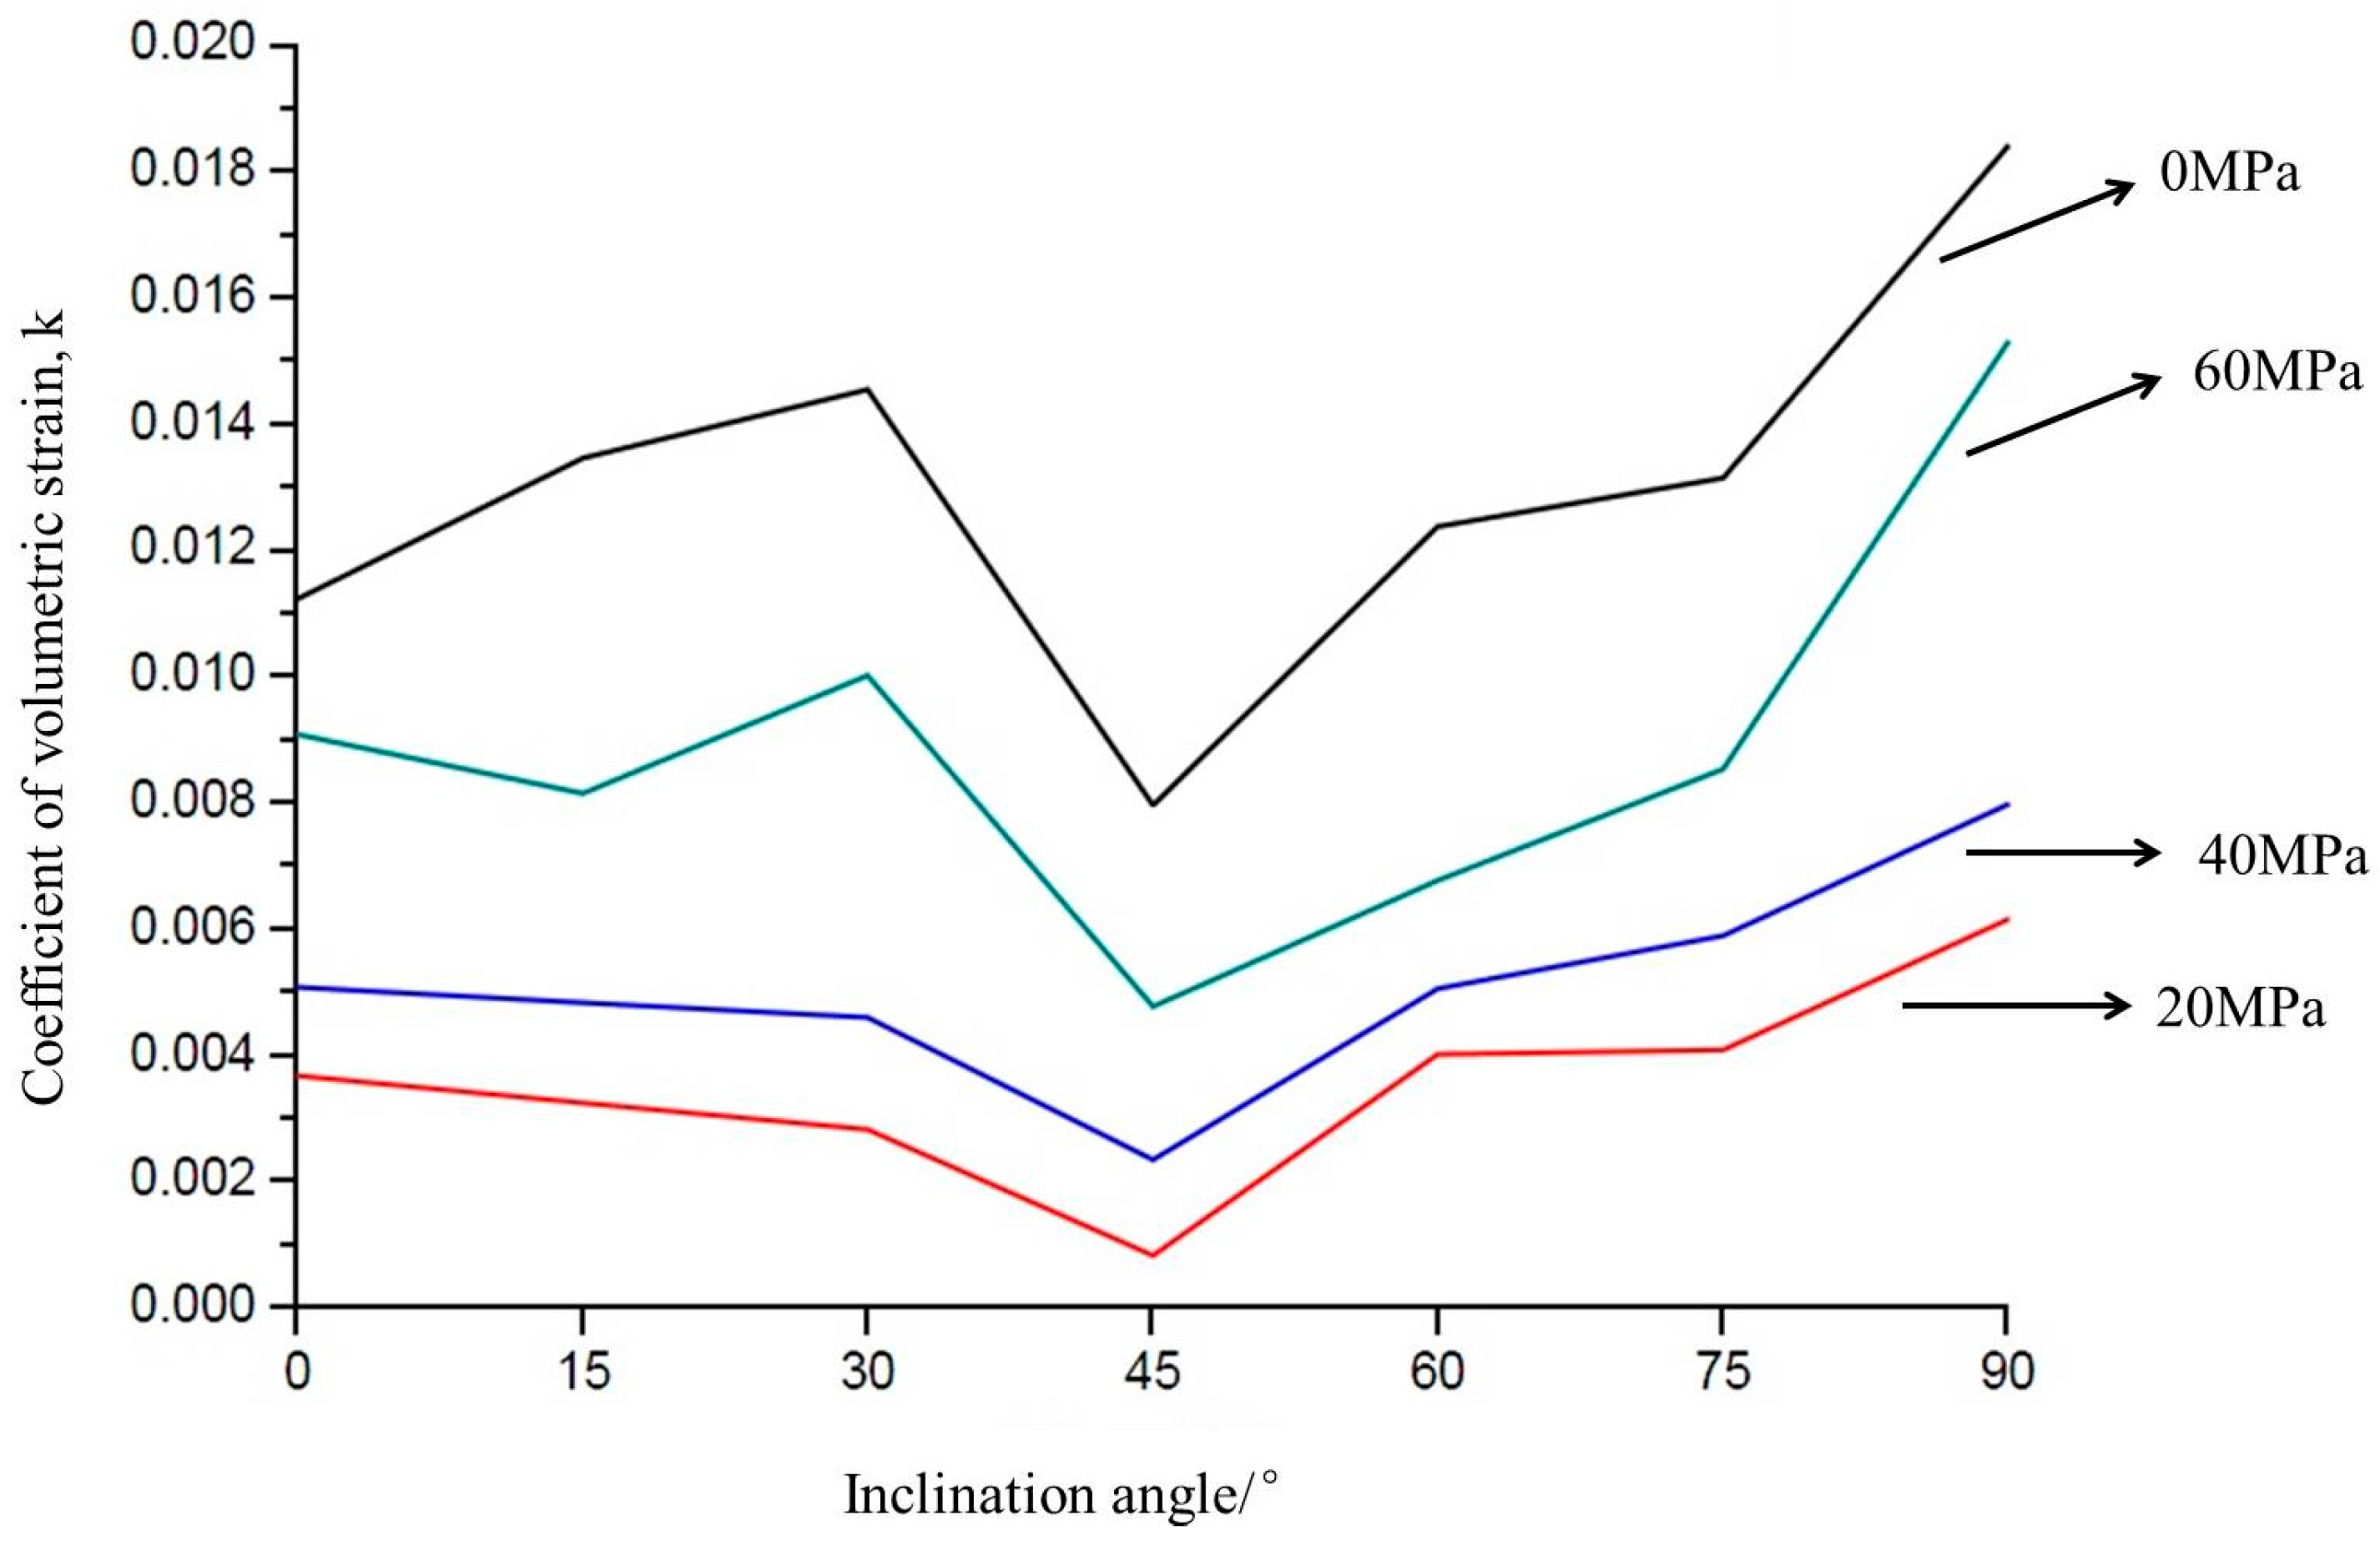
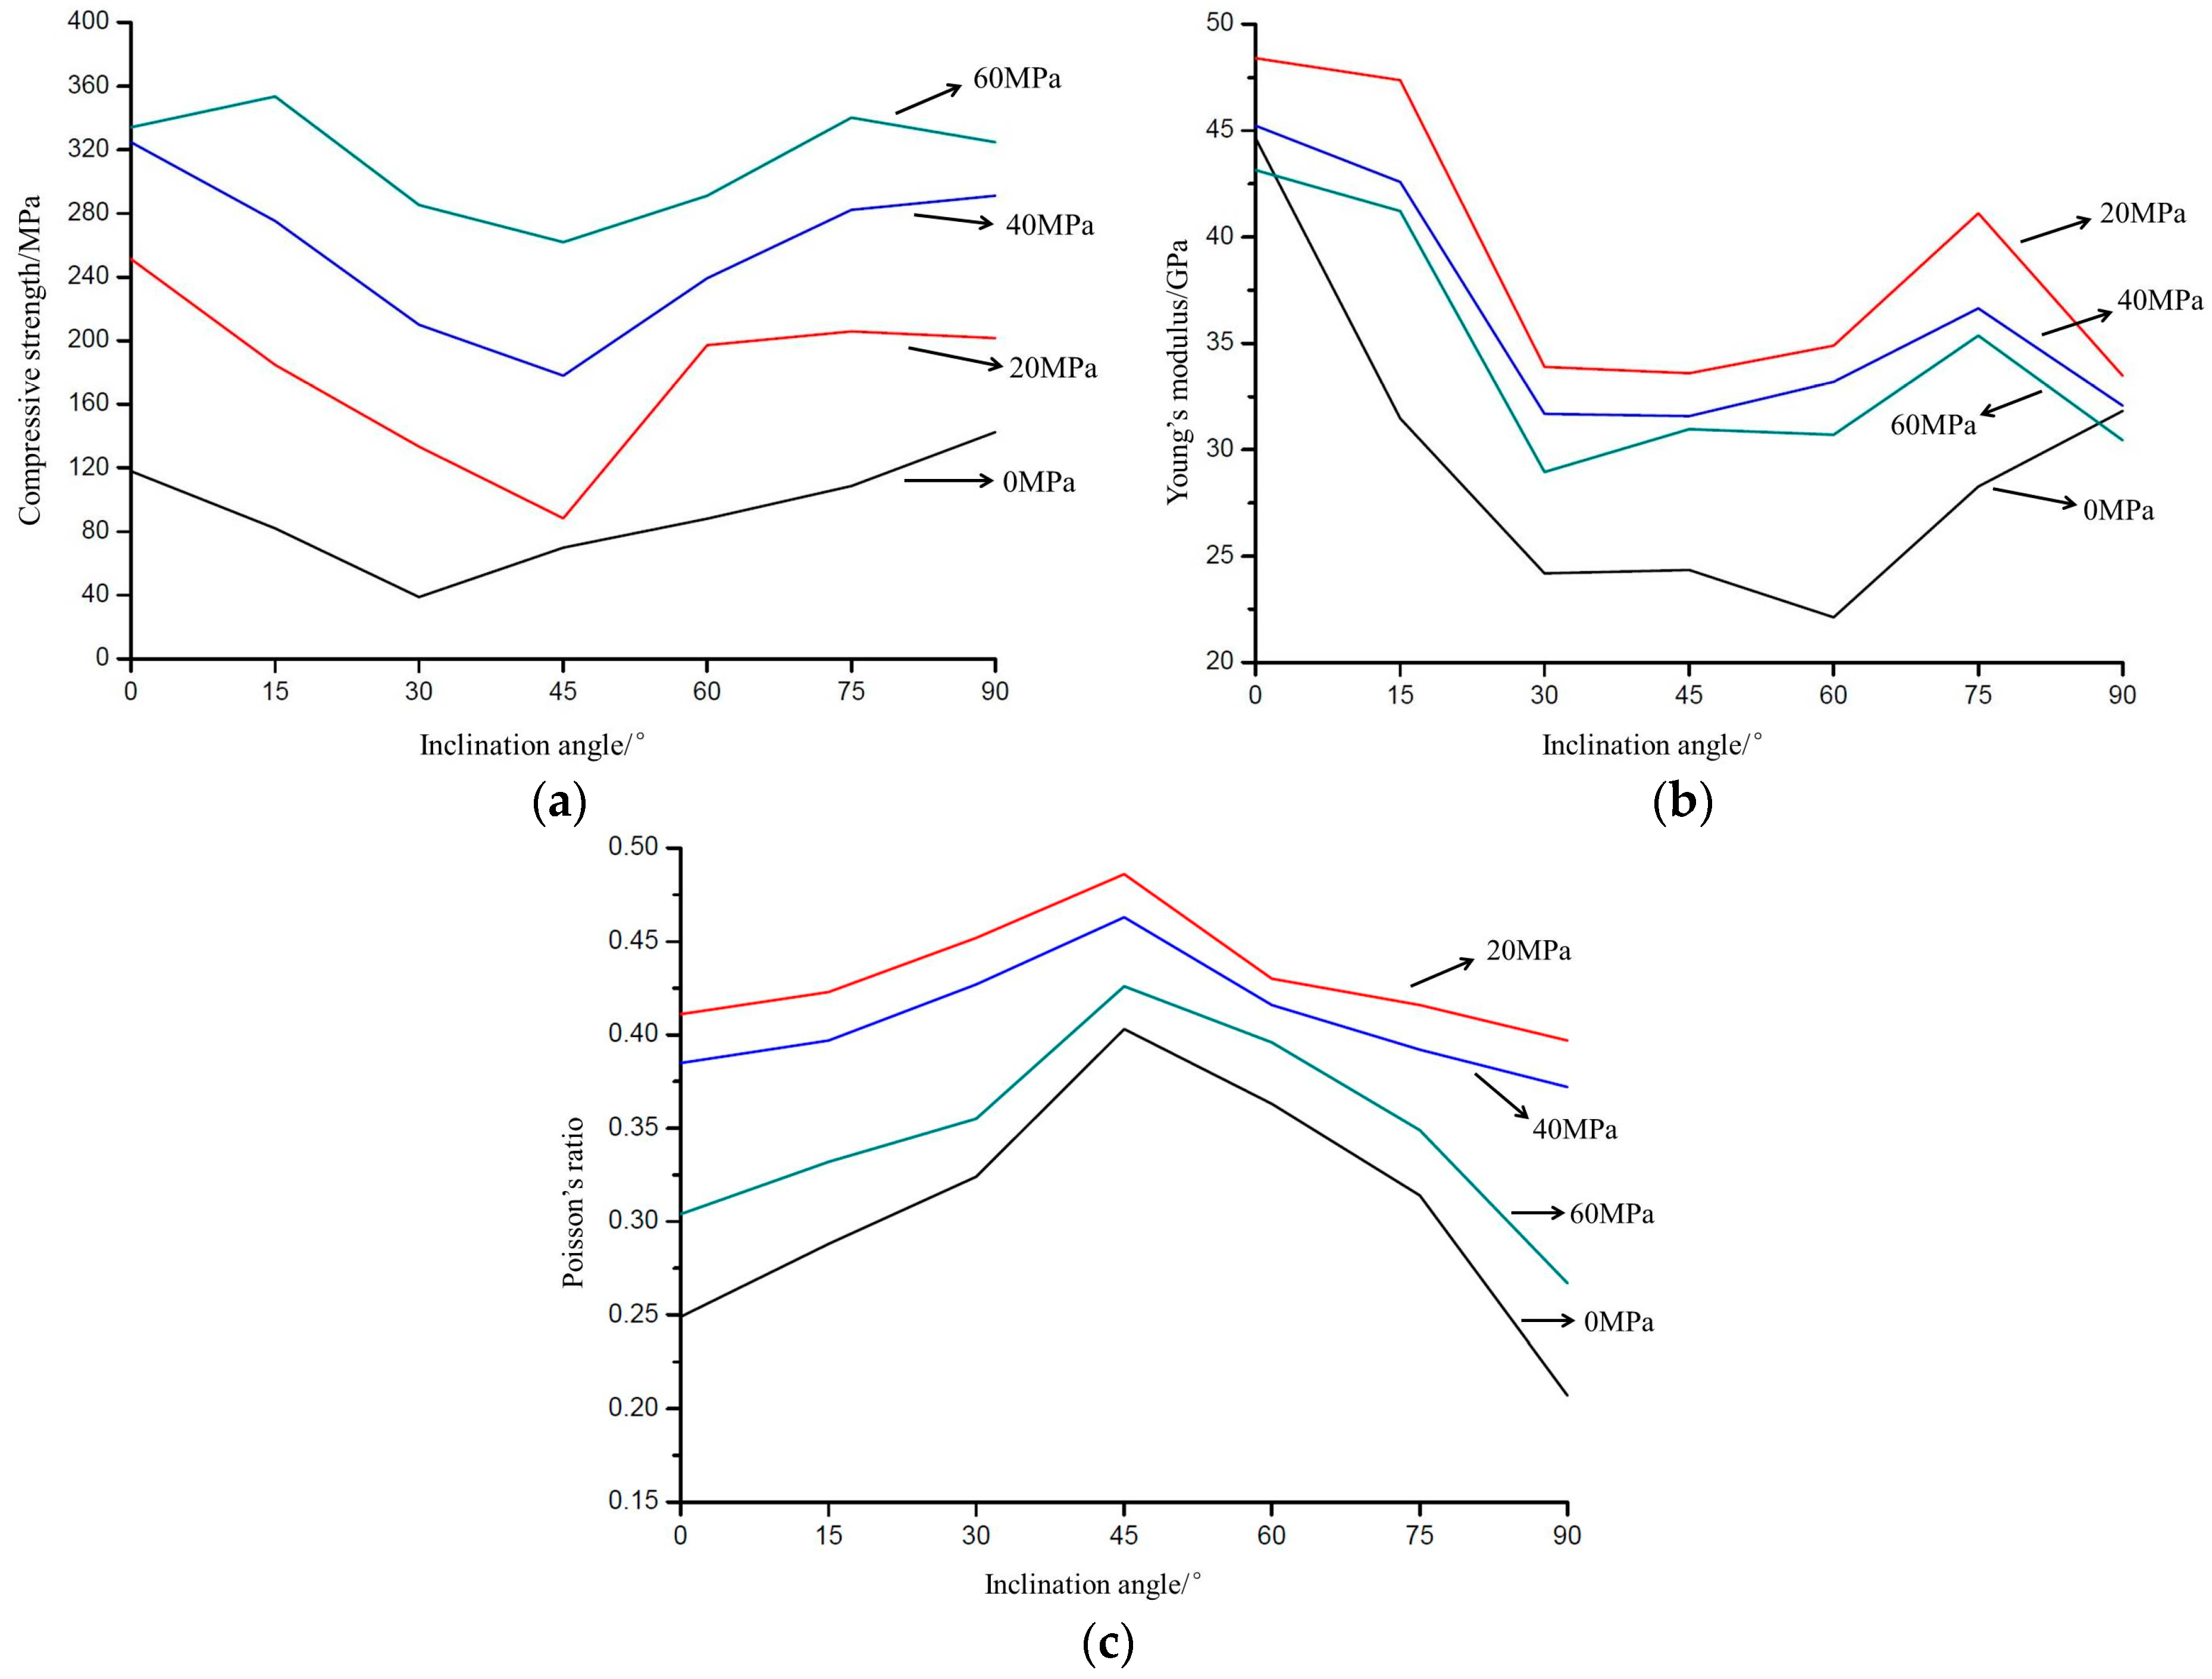
3.2. Varying Characteristics of Shale Strength and Mechanical Parameters

Figure 8 shows a number of mechanical parameters of shale samples as a function of bedding orientation and confining pressure, including the compressive strength, Young’s modulus and Poisson’s ratio.
The shale samples of 0° and 90° inclinations (β) have the maximum compressive strengths, while the sample of 45° inclination (β) has the minimum compressive strength, indicating that the bedding planes of shale samples mostly are weakly cemented planes and have low strengths, thus they have greater impacts on the extension of hydraulic fracturing (Figure 8a).
In addition, according to reports by Zoback [44], the uniaxial compressive strength of a sample is usually not directly obtained from uniaxial compression tests. It is often obtained by: (1) finding its triaxial compression tests at different confining pressures (Pc = σ 3 ); (2) selecting a series of points on the σ 1 σ 3 curve, among which the abscissa of each point represents its confining pressure under triaxial compression tests and the ordinate represents its triaxial compression strength under the confining pressure; and (3) connecting these points to draw an approximate straight line and find the intercept of the line in the longitudinal axis ( σ 1 -axis). The method, compared with those directly obtaining the uniaxial compressive strength of a sample, is less sensitive to the existence of weak fracture planes, thus its results are closer to the real uniaxial compressive strength of the sample.
Young’s modulus and Poisson’s ratio vary with the inclination angles (β) (Figure 8b,c). The Young’s modulus, as an index to measure the difficultness of a sample to generate elastic deformation, shows a significant variation law with different inclination angles (β). In detail, samples with inclination (β) of 0°, 15°, 75°, and 90°, have greater Young’s modulus, indicating that at these dips, shale samples are difficult to generate elastic deformation. When shale samples are cored along inclinations (β) of 30°, 45°, and 60°, the measured elastic moduli are smaller, indicating that the shale samples of these dips are more prone to elastic deformation and weak bedding planes have more obvious impacts on their rigidity. It can be seen from stress-strain curves that the slopes of curves in elastic stage of samples of 0°, 15°, 75°, and 90° are larger than that of samples of 30°, 45°, and 60°. The variation of Poisson’s ratio, which is an elastic constant reflecting the lateral deformation of a material, shows an opposite trend with the variation of the Young’s modulus. Under the same confining pressure, Poisson’s ratio increases with the inclination angles (β) and shows a trend of first increase then decline. Among them, the ratio is lower when inclination (β) is 0°, 90°, 15°, and 75°, but higher when inclination (β) is 30°, 45°, and 60°.
Young’s modulus and Poisson’s ratio also change with confining pressure. In uniaxial compression tests, the minimum value of Young’s modulus is only 50% of the maximum value. However, in triaxial compression tests under the confining pressure of 60 MPa, the minimum value of Young’s modulus is approximately 68% of the maximum value. Similarly, the minimum value of Poisson’s ratio is only 50% of the maximum value in uniaxial compression tests, while 83% of that in triaxial condition at 20 MPa.

3.3. Deformation and Failure Characteristics of Shale Subjected to Uniaxial and Triaxial Compression

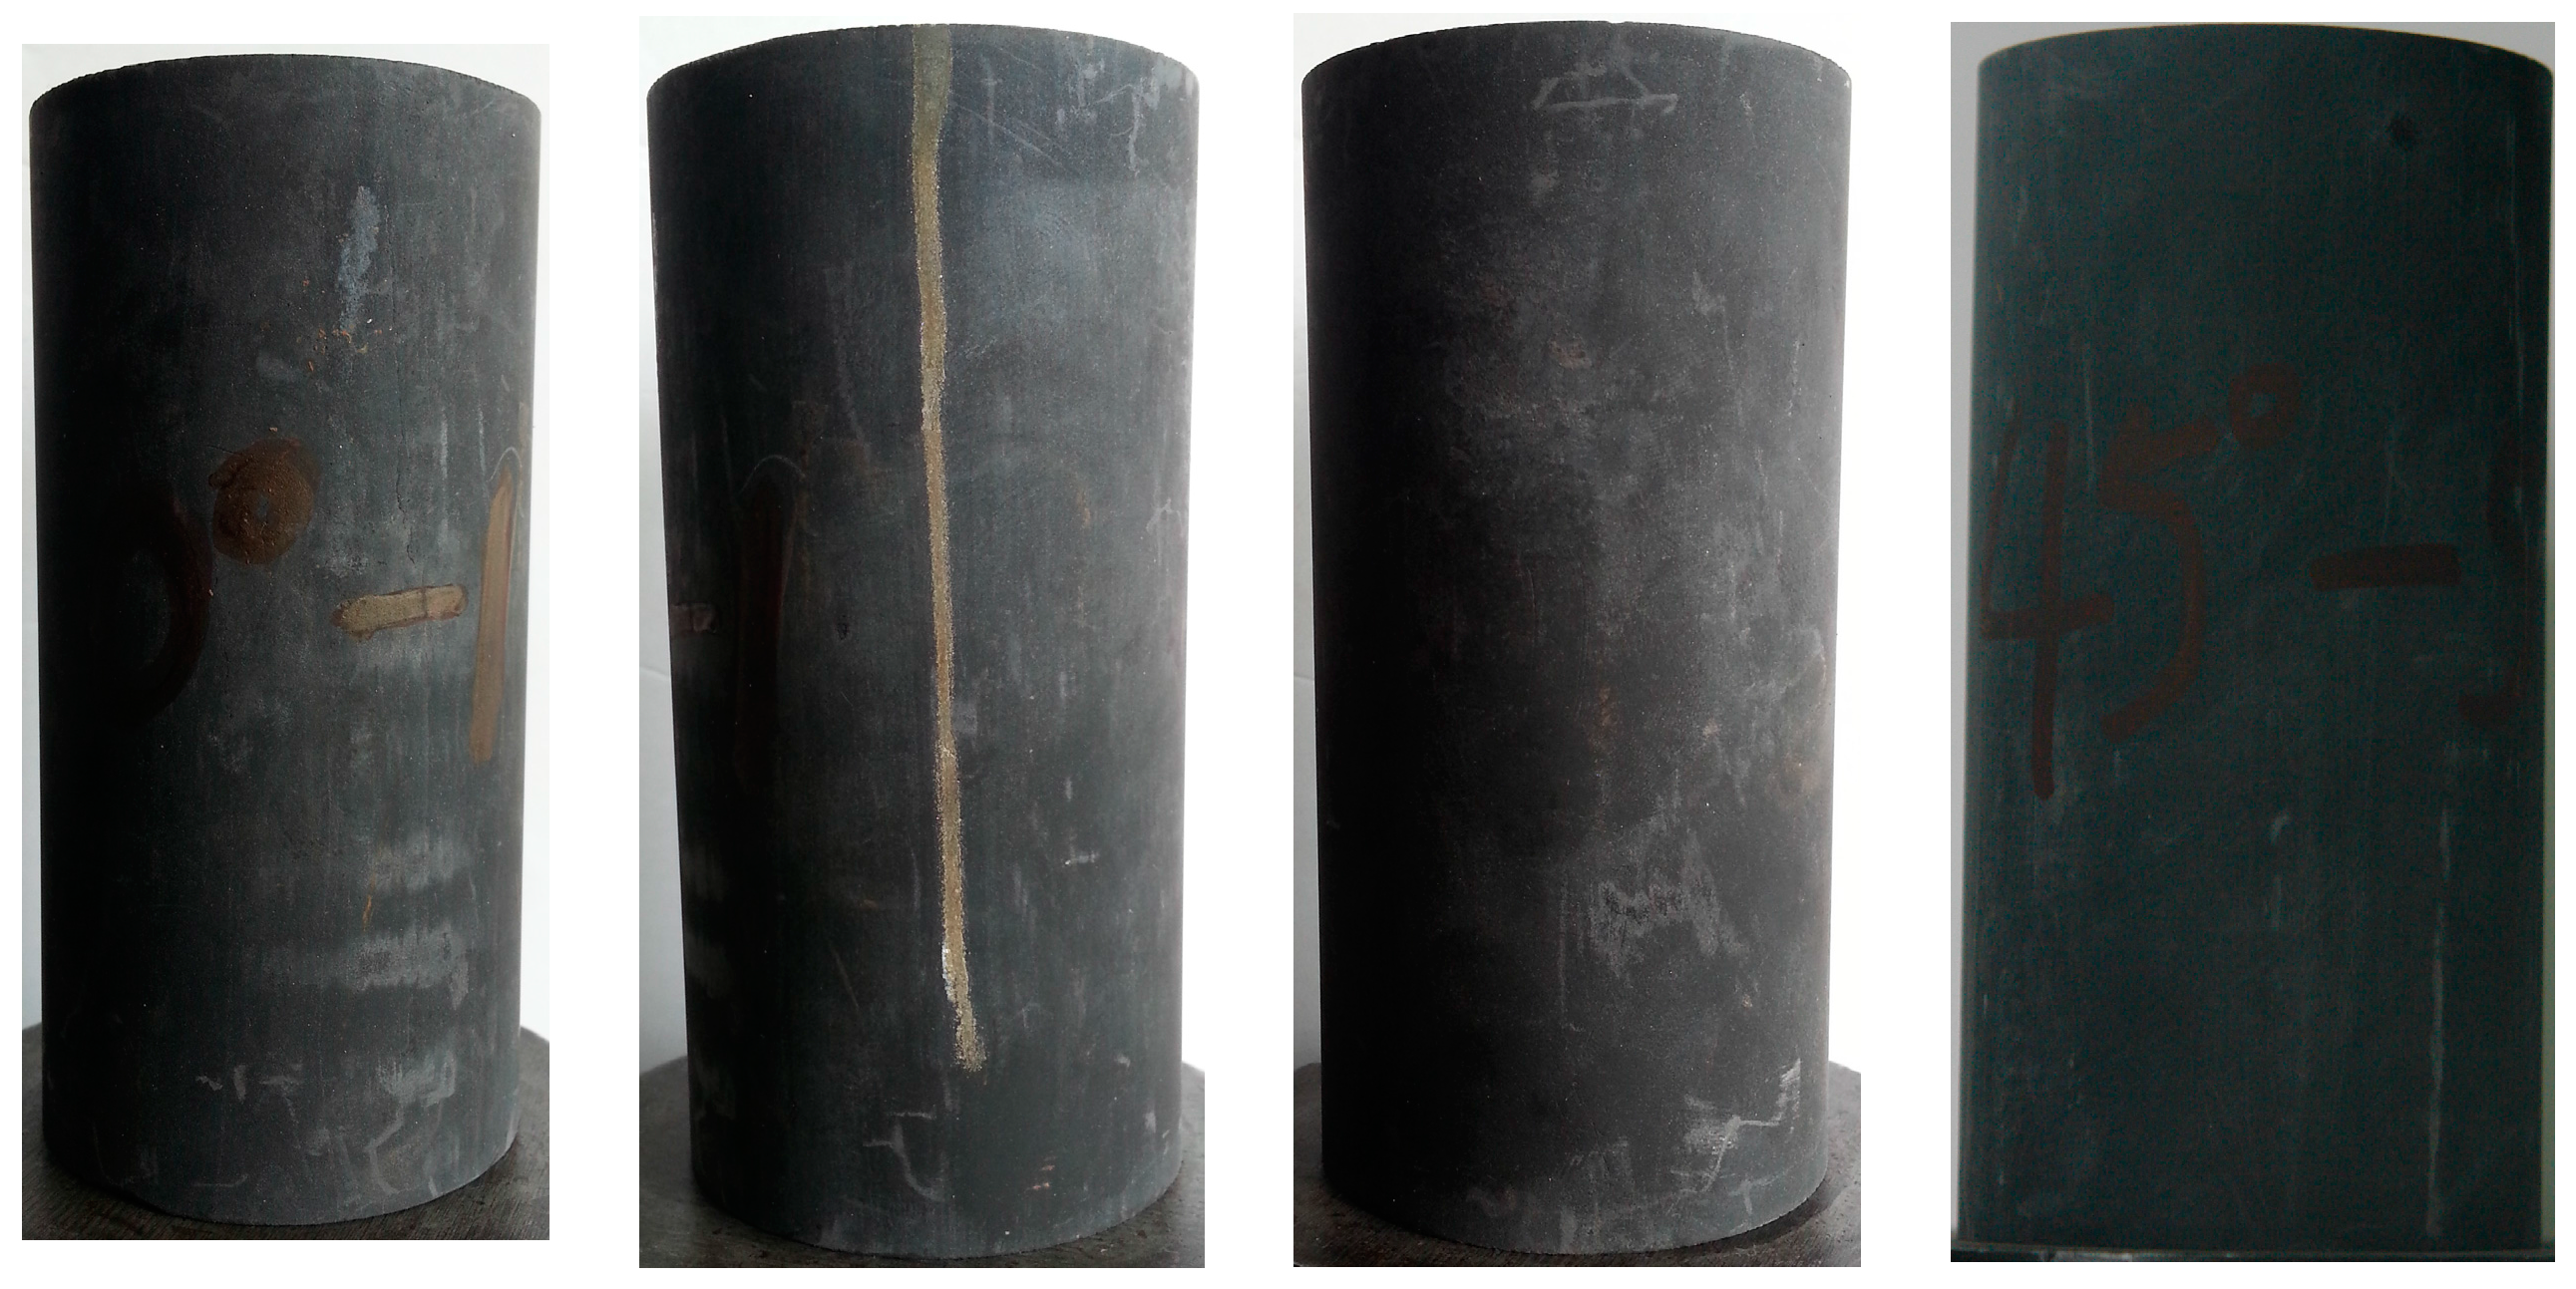
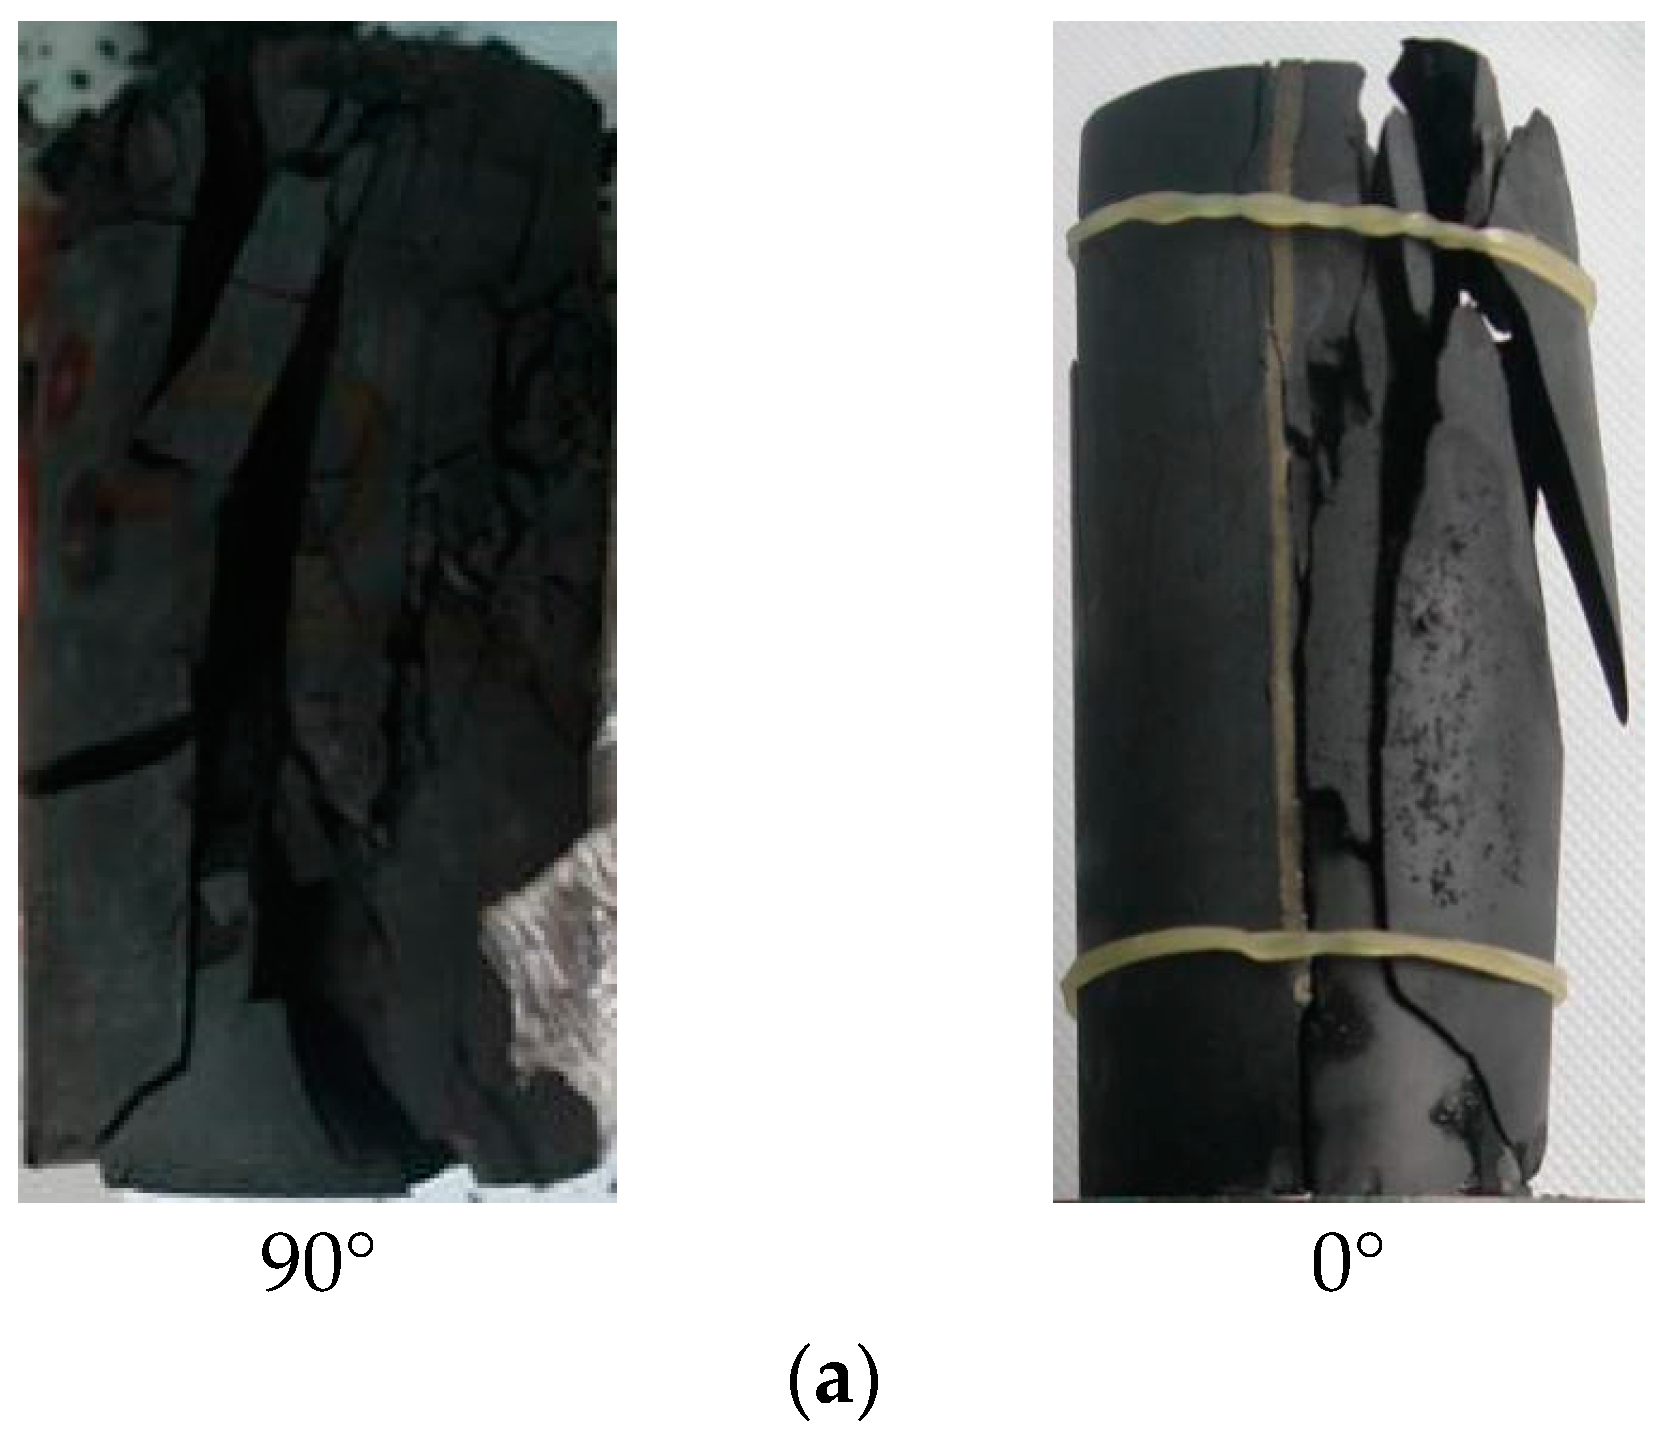
3.3.1. Failure Characteristics of Samples Subjected to Uniaxial Compression

Figure 9 shows the failure morphology of shale samples subjected to uniaxial compression. Shale samples after uniaxial compression showed different deformation and failure morphology with different inclinations (β). According to different fracture patterns, the samples can be divided into three groups. In group (a), at 0° and 90° inclinations (β), the failure fractures are mostly along the axis and the failure types mostly belong to splitting failure; In group (b), at 15° and 75° inclinations (β), the failure fractures have two types: one parallel to the direction of bedding planes and the other parallel to the axis, but the majority are the latter; In group (c), at 30°–60° inclinations (β), the fractures are mostly along the direction parallel to the bedding planes, and most fracture planes are not mutually independent, but connected by longitudinal fractures parallel to the axis direction.

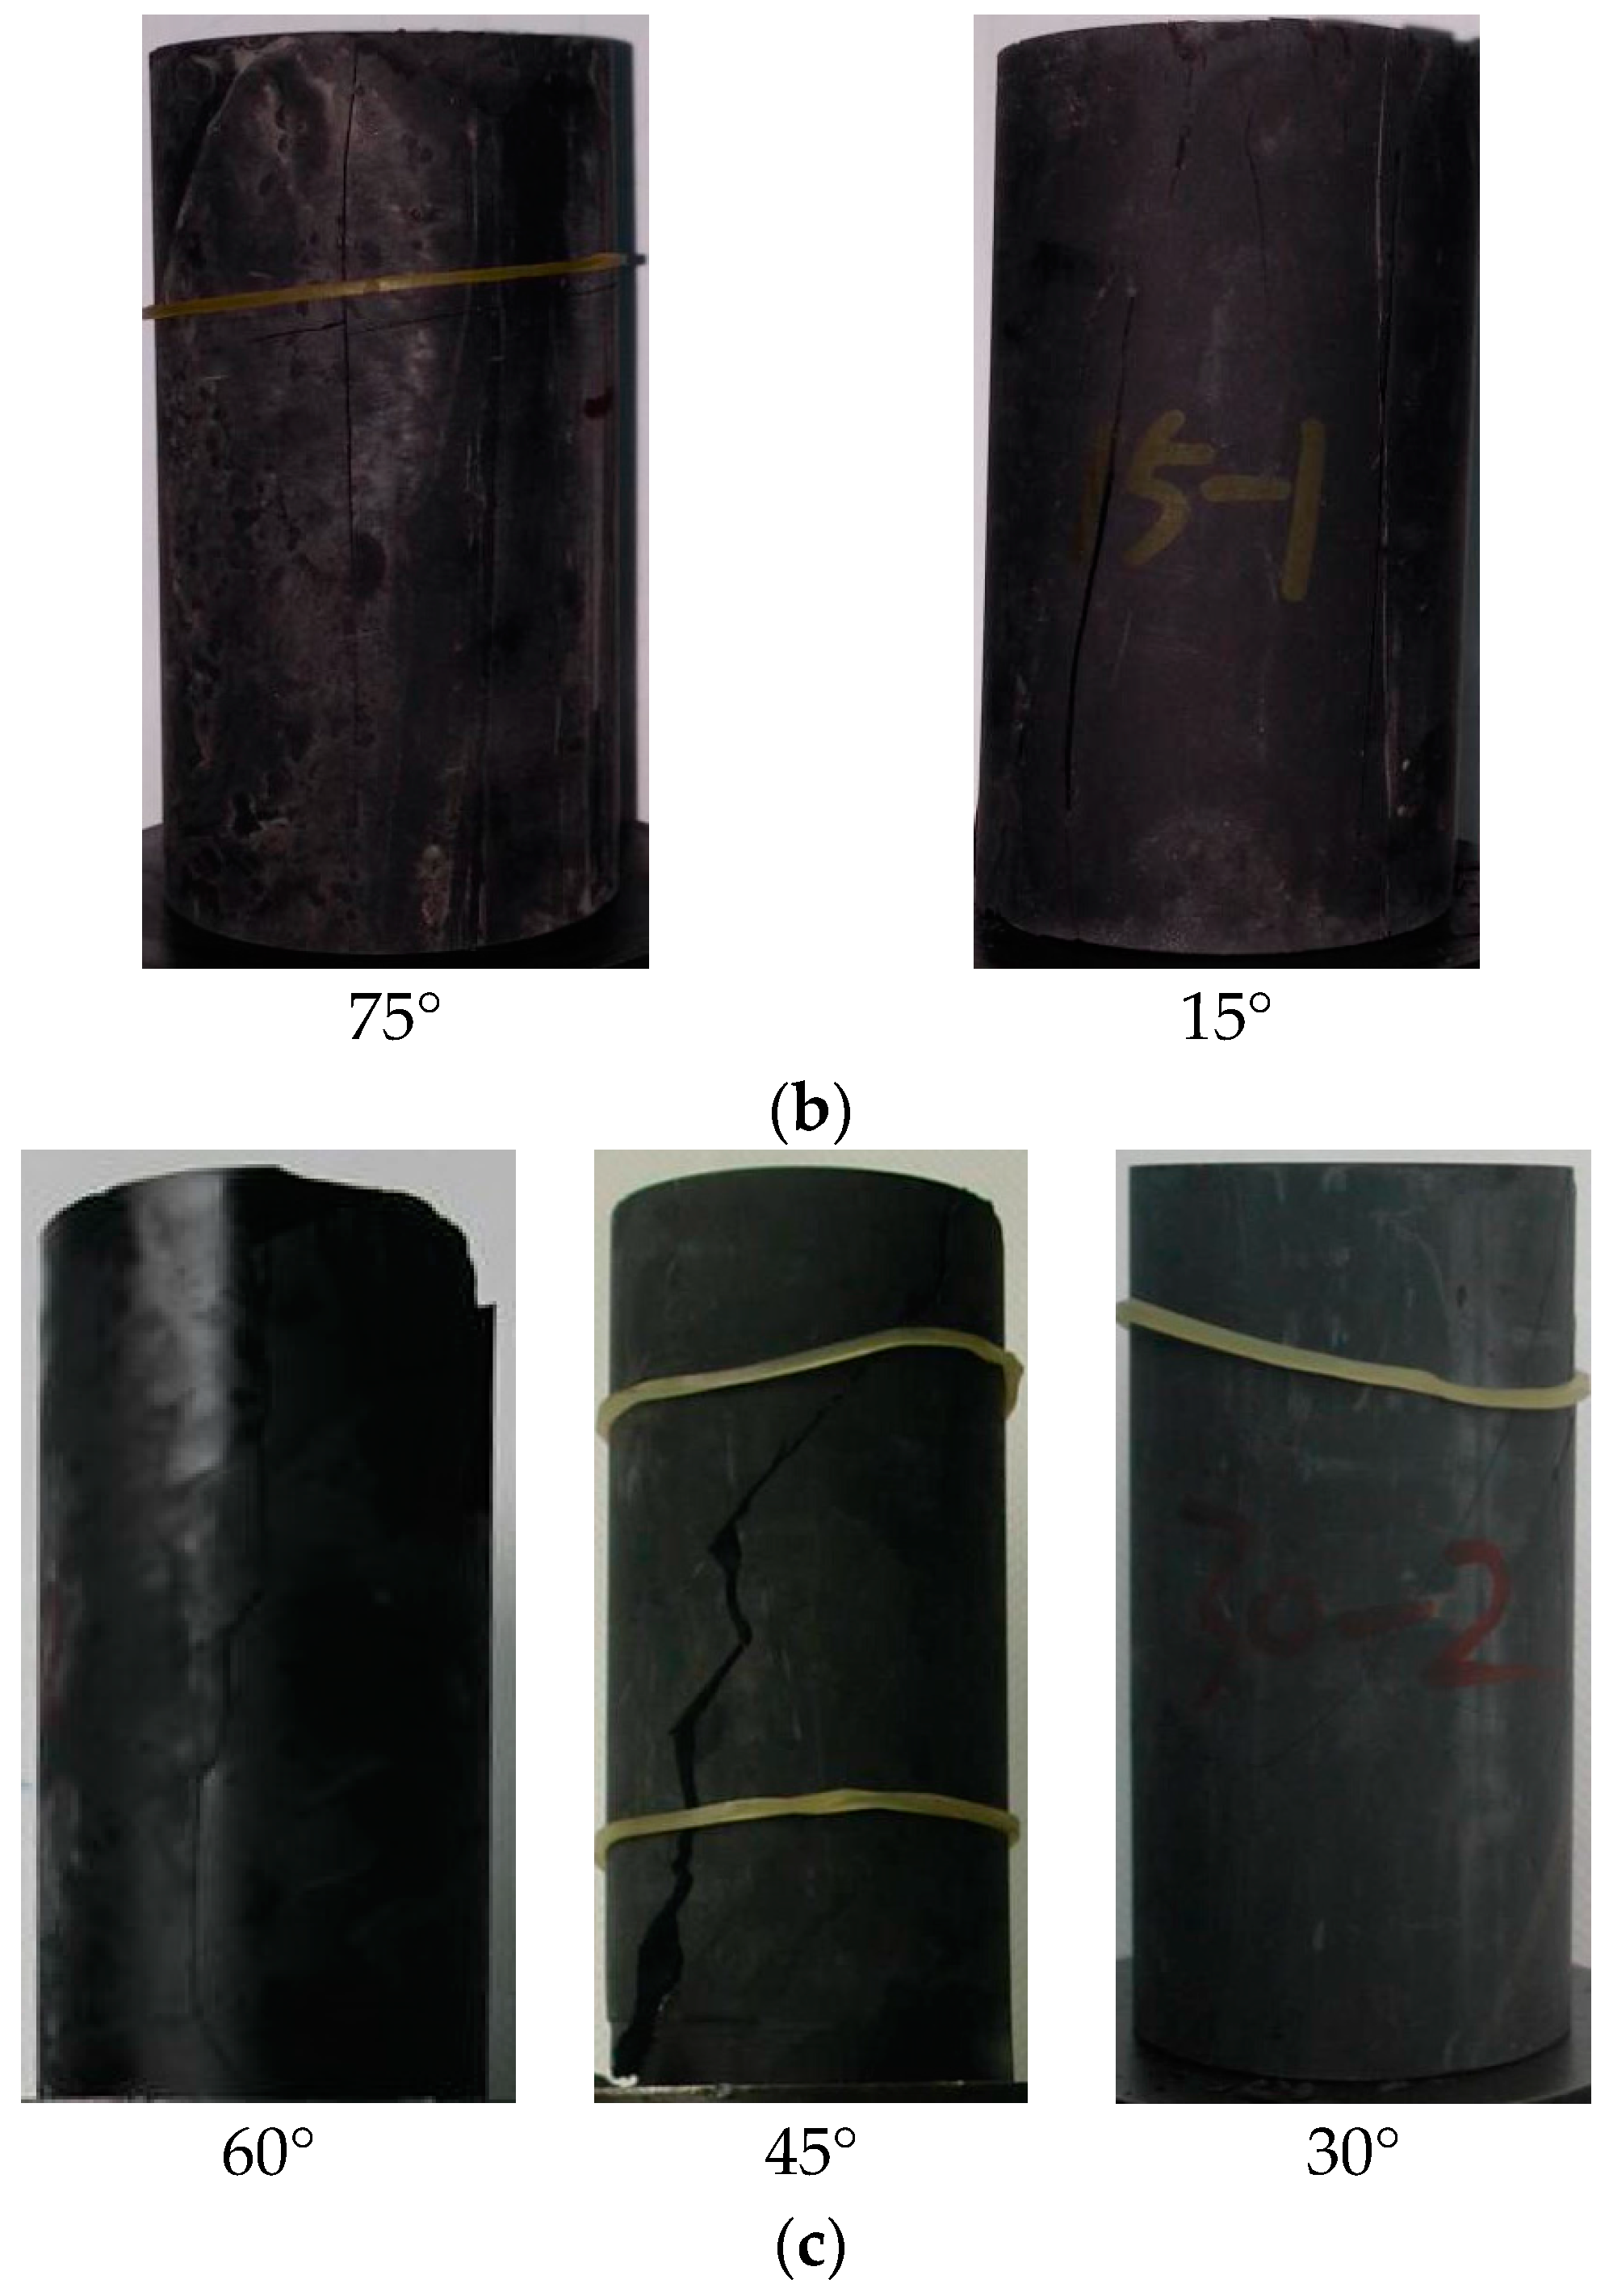
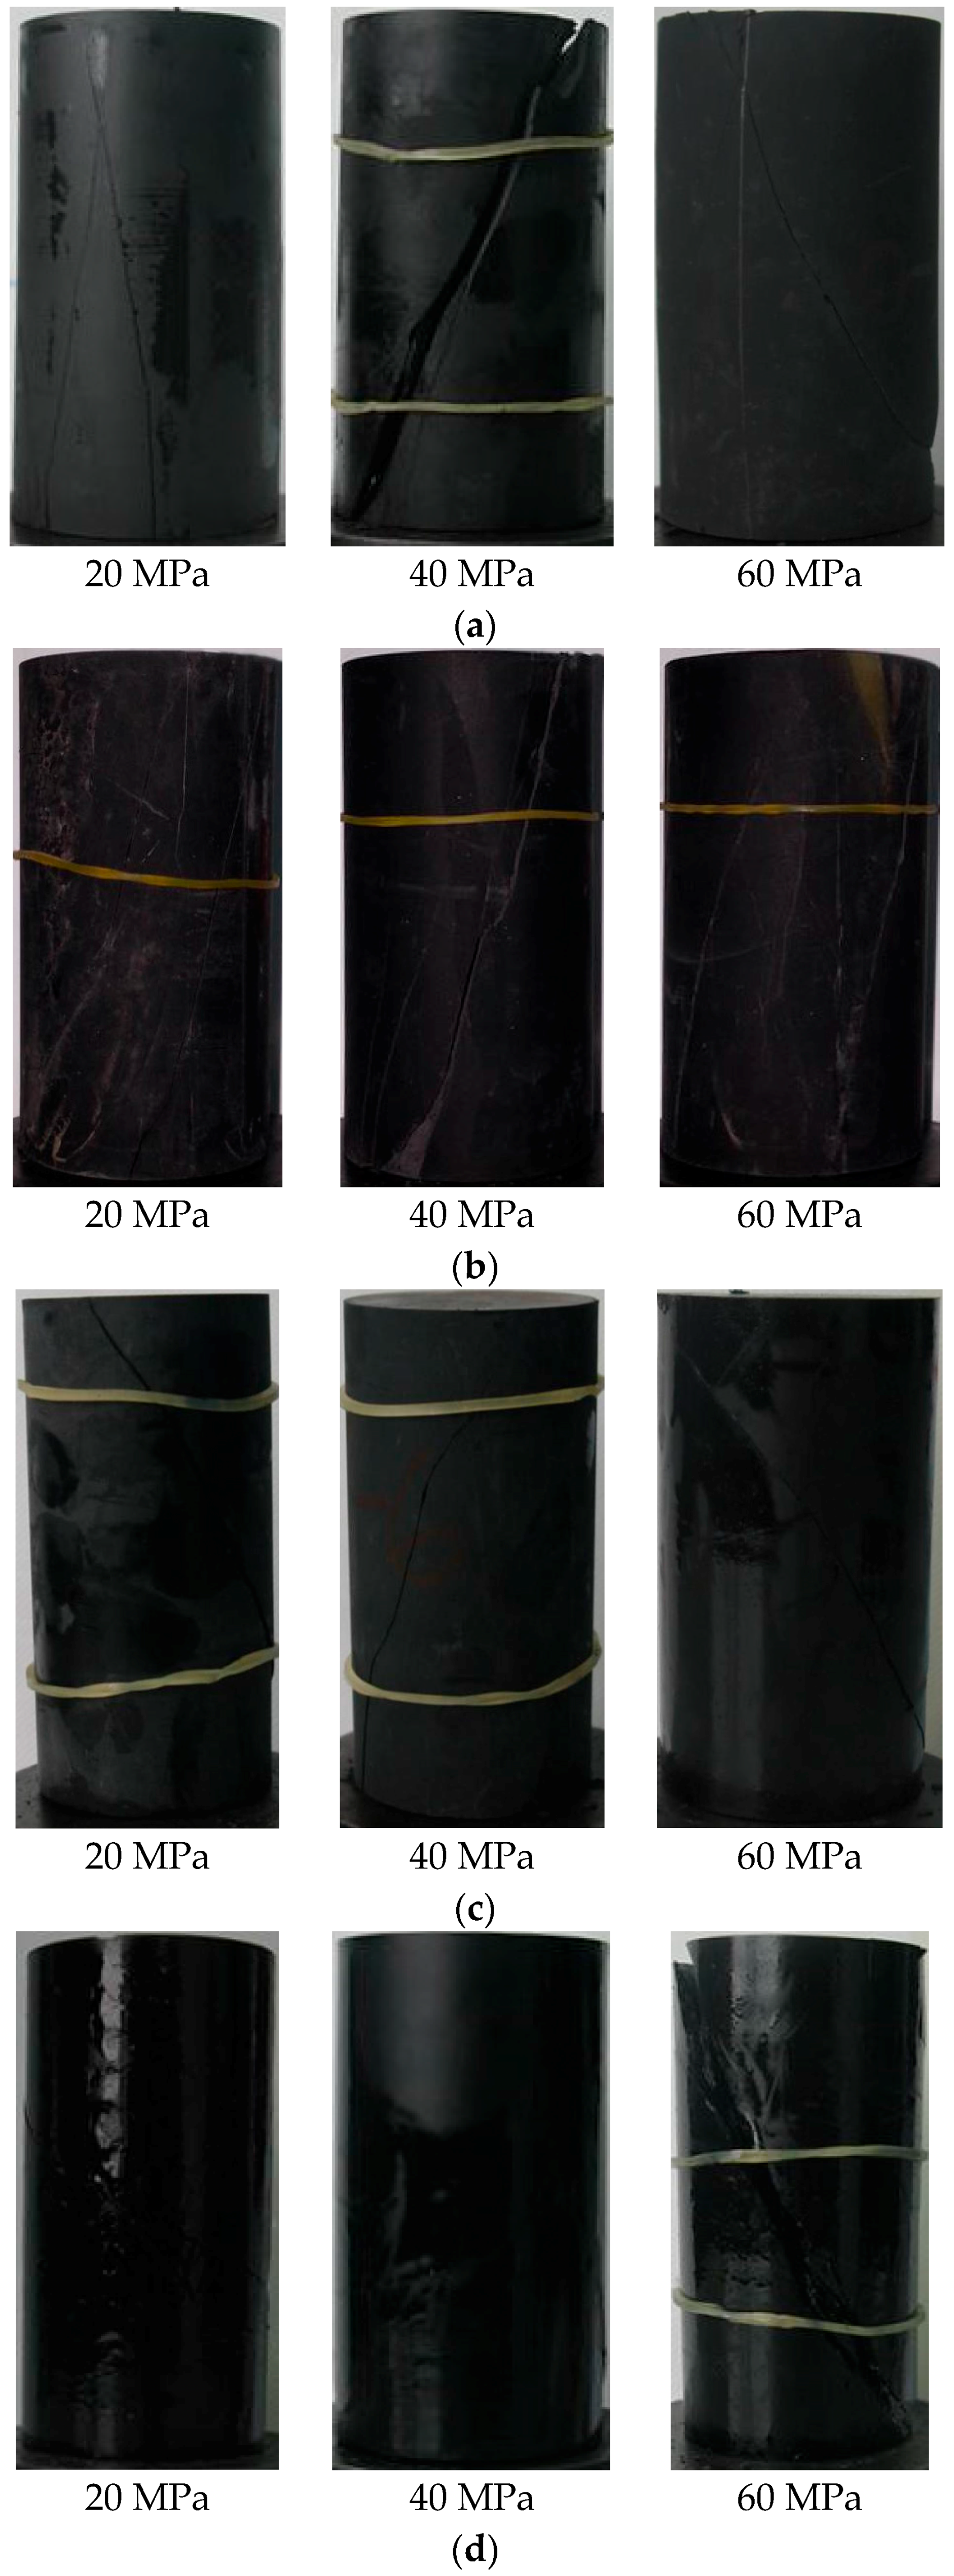
3.3.2. Failure Characteristics of Samples Subjected to Triaxial Compression
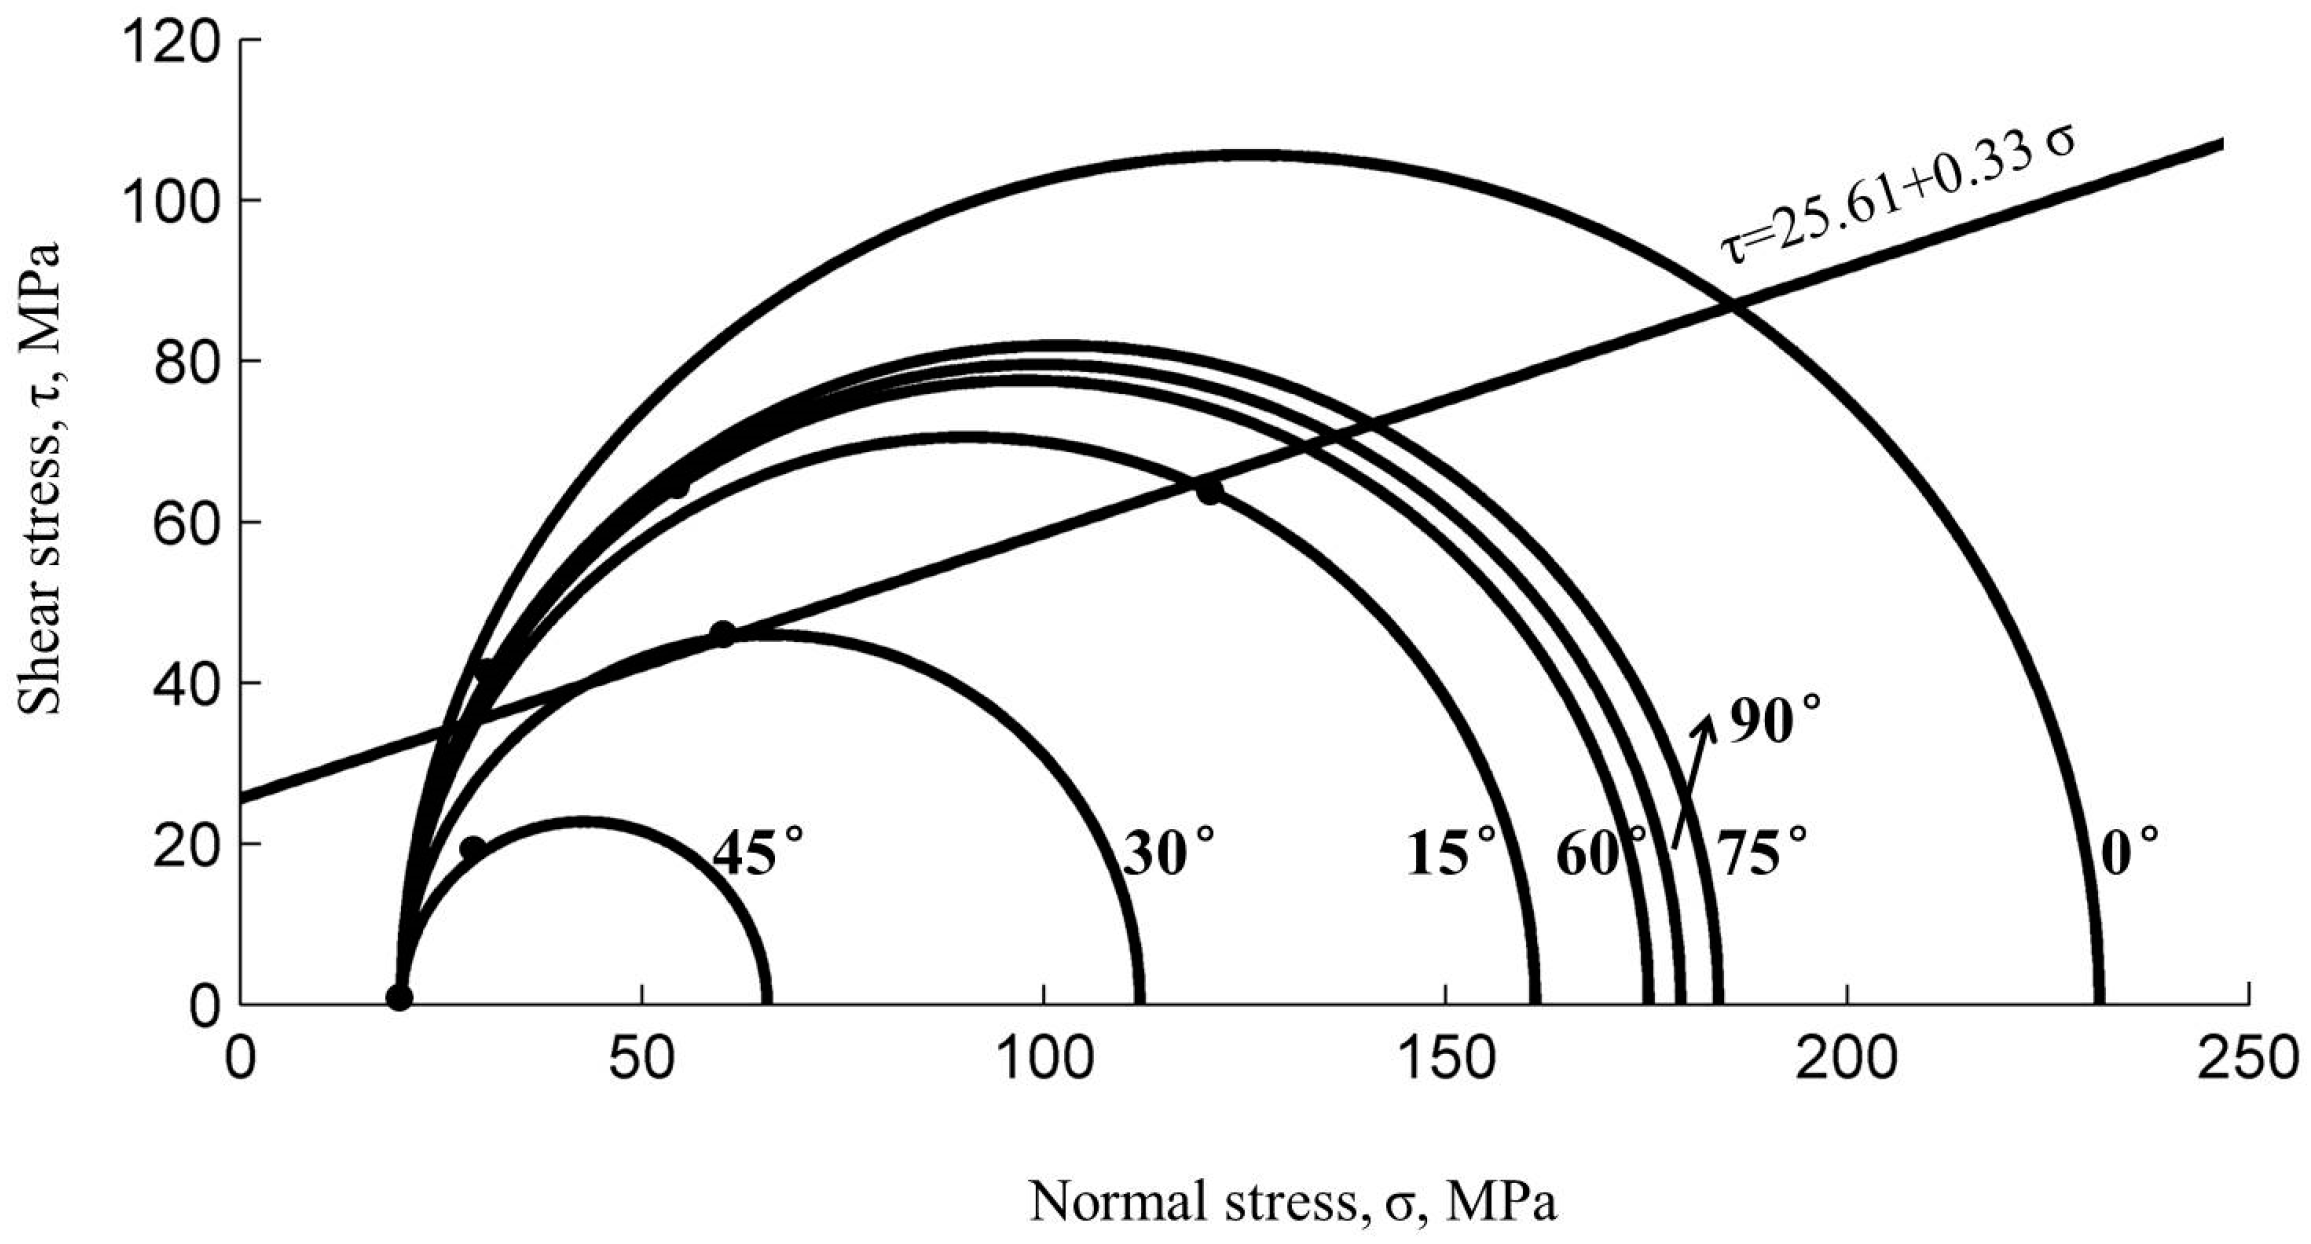
Figure 10 shows the morphology of failure planes of shale samples subjected to different confining pressures in triaxial compression tests at different inclinations (β). From the figure, it can be seen that the morphology of failure planes of shale samples under triaxial compression have their own features corresponding to their inclinations (β). Under low confining pressure (20 MPa), the failure plane is: (1) parallel to its axis for samples with 90° inclination (β); (2) a X-shaped conjugate shear plane for sample with 0° inclination (β); (3) mainly along their bedding planes for samples with 15°, 30°, 45°, and 75° inclinations (β); and (4) a single large angle shear plane rather than parallel to the bedding plan direction for samples with 60° dip. When the confining pressure is 40 MPa, the impact of the bedding plane on the failure plane is weakened, the morphology of failure planes of samples with different inclinations (β) are roughly the same, all showing a single shear fracture plane and the inclination (β) of fracture surface parallel to the bedding plane. When the confining pressure reaches 60 MPa, (1) all samples show obvious plastic characteristics; (2) the morphology of failure planes trend to be consist, showing a shear fracture running through the diagonal line of both end surfaces of the sample; and (3) the inclination (β) of failure planes is not affected by the inclination (β) and some even not related to bedding planes.
Table 2 depicts the fracture morphology of shale samples with various inclination angles (β) under different confining pressure. Samples deformed in uniaxial compression (0 MPa) or at low confining pressure (triaxial compression) show significant anisotropy and brittle failure. Their mechanical properties are significantly affected by the inclination (β) and the failure face morphology changes with inclination (β). With the confining pressure increasing, mechanical properties of shale samples are less affected by their inclinations (β). The failure morphology tends to be consistent and samples show more plasticity. Among them, samples with 45° and 30° inclination angles (β) are least sensitive to the confining pressure; while samples with 60° inclination angle (β) are most sensitive to the confining pressure. When the confining pressure reaches a certain high level (such as 60 MPa), the mechanical behavior of shale samples is almost completely isotropic; the mechanical properties and failure morphology of samples are barely related to their inclinations (β), showing significant plastic behaviors.
In particular, it can be observed directly from sketches of failure morphology in Table 2 that shear fractures occur along the bedding planes with inclination angles (β) of 15°, 30° and 45° at the confining pressure of 20 MPa. According to the criterion of Mohr–Coulomb considering a set of parallel weak planes, we can obtain the stress state on the fracture surface,
τ = 25.61 + 0.33 σ
where τ and σ are the shear stress and normal stress in the fractured bedding planes, respectively, and the cohesive strength and internal friction angle in the fractured bedding planes are 25.61 MPa and 18.26°, respectively.
Figure 11 shows the Mohr circles of Longmaxi shale samples at 20 MPa confining pressure, along with the line (1) representing the criterion for failure parallel to bedding surfaces. Data points reflecting the stress state where shear fracture occurred of each sample under confining pressure of 20 MPa were drawn on the Mohr circles in Figure 11. From the figure we are able to observe that data points of 15°, 30° and 45° were plotted on the line (1), while the other data points were on the Mohr circles.

4. Discussion

In this paper, rock mechanics characteristics of Longmaxi shale reservoir of China were investigated through a series of laboratory tests with samples drilled from an outcrop with respect to various inclination angles (β). Finally, lots of available information and data were obtained and processed, including stress-strain curves, variation features of strength and mechanical parameters, deformation and failure characteristics of shale.
To make direct comparisons of the anisotropies expressed by the Longmaxi shale and other shales and slates, here we define a parameter f, reflecting the coefficient of anisotropy of strength,
f = σ 1 , m a x σ 1 , m i n σ 1 , m a x
where σ 1 , m a x and σ 1 , m i n are the maximum and the minimum compressive strengths under the same confining pressure, respectively. Furthermore, the coefficient of anisotropy of strength of Longmaxi shale under confining pressure of 40 MPa, f is 0.45. The coefficient of anisotropy of strength of Martinsburg slate under confining pressure of 35 MPa is 0.72 [11]. So, the anisotropy of the Longmaxi shale is not as strong as that of the Martinsburg slate, obviously. This may be attributed to that the cohesion and internal friction angle of the Longmaxi shale are both lower than that of the Martinsburg slate because of the existence of clay minerals in Longmaxi shale. According to the experimental data of Chenevert et al. [12], the coefficients of anisotropy of strength of Green River shale and Permian shale can be obtained, which are 0.25 and 0.14 respectively. As a result, the anisotropy of the Longmaxi shale is stronger than that expressed by the Green River shale and the Permian shale. McLamore et al. carried out tests with slate and Green River shale to investigate the mechanical behavior of anisotropic sedimentary rocks [13]. We can learn from their research that the coefficients of anisotropy of slate and Green River shale are 0.5 and 0.24, respectively. Therefore, the anisotropy of the Longmaxi shale is a little lower than that of the fine-grained black slate used in McLamore’s experiments, but stronger than that of the Green River shale. Wilcox shale was investigated by Ibanez et al. to find its mechanical properties and microstructural indicators of mechanisms [16]. The coefficient of anisotropy of strength of Wilcox shale is approximate to 0.14, showing that the anisotropy of the Longmaxi shale is much stronger than that expressed by the Wilcox shale. Cho et al. conducted a series of uniaxial compression tests with Boryeong shale and other rocks to explore the deformation and strength anisotropy. With the results by Cho et al. [19], we are able to know that the coefficient of anisotropy of strength of Boryeong shale is 0.58, reflecting that the anisotropy of the Boryeong shale is a little stronger than that of the Longmaxi shale. Overall, compared with other shale and slate, the anisotropy of the Longmaxi shale is relatively obvious. The next will be discussed in detail from several aspects as below.
In the first stage of uniaxial compression tests, i.e., elastic deformation stage including crack closure, the shapes of stress-strain curves rose up very slowly at 30° and 60°, which means there were a lot of natural fractures being compacted. Curves of samples with inclination angles (β) of 45° were a little steeper, showing fractures in samples not very easy to be compressed. The compaction stages were short and steep for samples compressed with inclination angles (β) of 0°, 15°, 75° and 90°, indicating that natural fractures or bedding planes were difficult to compact when compressed in these orientations relative to bedding. Comparing the test results with other people’s research, some similarities and differences were found. Chenevert et al. [12] conducted rock mechanics experiments with Green River shale. However, even the confining pressure was up to 83 MPa, the shale samples still underwent brittle failure, unlike the Longmaxi shale sample, failing in a ductile mode under confining pressure of 60 MPa. In the study of McLamore et al. [13], the stress-strain curves for slate show no compaction stages as Longmaxi shale. The stress-strain curves of Green River shale by Smith et al. were much similar to that of Longmaxi shale [14]. The uniaxial compression tests conducted by Hakala et al. [45] with the Olkiluoto mica gneiss showed that, samples with respect to inclination angle (β) of 90° had the gentlest stress-strain curves at the first stage, in fact, the incline degree of curves at this stage increased with inclination angles (β). It can be obtained from Hakala’s research that the uniaxial strength reached its minimum value at inclination angle (β) of 45° between its foliation and axial stress, so the foliation can be considered as the anisotropy plane like bedding of shale. Nasseri et al. [46] conducted a series of uniaxial compression tests with Himalayan schists, and change rule of the first stage of the stress-strain curves consisted quite well with that in this paper. In addition, the triaxial strengths vary with inclination angles (β) between foliation and axial stress in some types of schist, so the foliation of schist can be seen as a kind of anisotropy plane like bedding of shale, and foliation of gneiss. In the second stage of uniaxial compression tests, i.e., linear elastic deformation stage, stress-strain curves maintained a stable linear growth under each inclination angles (β), which consisted of both mica gneiss and schists [45,46]. In the third stage of uniaxial compression tests, at which plastic deformation occurred with stable crack growth, the curves showed a shape of slightly upward bulges. However, the bulges were not obvious under any inclination angle (β), as well as the curves obtained by Hakala et al. [45] and by Nasseri et al. [46]. These phenomena showed that the plastic deformation at this stage was relatively little. In the fourth stage, i.e., plastic deformation stage with unstable crack growth, the density and initiation speed of cracks increased rapidly and eventually led to failure of the samples. In this paper, this phenomenon is most obvious in curves of samples with inclination angle of 30°. Under this angle, the stress-strain curves showed broken line shapes, which was relatively flat and lasted for a period of time. At the inclination angle (β) of 15°, curves at the fourth stage fluctuated for a rather long time. As to other angles, there was no obvious phenomenon in curves at this stage. In the research of Hakala et al. [45], and of Nasseri et al. [46], curves were smooth and continuous at the fourth stage. In the fifth stage, i.e., post peak stage, micro cracks gradually connected with each other and eventually lead to failure of the specimen. Some process continued to be very long, such as samples with inclination angle (β) of 30°, 60° and 75°. Curves at this stage under other inclination angles (β) dropped extremely fast, which were in accordance with the results of Hakala et al. [45], and of Nasseri et al. [46] at each inclination angle (β).
In triaxial compression tests, stress-strain curves had different laws of variation. There were no horizontal sections of shape of curves in the first stage, except at 0°, 15°, and 75° in relatively low confining pressure. In the fourth stage, micro cracks gradually connected with each other at each inclination angle (β), as in the uniaxial tests. Finally, in the fifth stage, when the axial stress reduced to a certain degree, the residual strength was reached, and the residual strength increased with the confining pressure, except that of samples with inclination angles (β) of 0° and 45°. Ibanez and Kwon investigated the mechanical properties and deformation mechanisms of illite-rich shale in triaxial compression experiments, respectively [16,17]. The results indicated that differential stresses varied with strain rates under certain conditions. In research of Swan et al. [15], more obvious evidence was presented for a much greater rate effect as seen in triaxial compression tests on comparatively soft, saturated shale from Kimmeridge Bay, Dorset, UK. However, the tests in this paper did not take the effect of strain rates into account.
The change law of uniaxial compressive strength was very clear. With the increase of the angle of bedding, the compressive strength decreased first and then increased when the angle reached 30°. In other words, the uniaxial compressive strength reached its peak value at 0° and 90°, and the lowest value at 30°. Moreover, the uniaxial strength at 90° is larger than that at 0°. In Figure 11, data points of 15°, 30° and 45° plotted on line (1) reflecting that samples broke along these planes of anisotropy. While data points of 60° and 75° fell on the Mohr circles representing that these orientations had less effect of anisotropy on rock mechanical properties of shale samples. As to data points of 0° and 90°, since that there were no shear stress exists on planes parallel and perpendicular to the maximum compression stress, samples would impossibly fail by shearing. These interpretations were consistent well with the sketches of failure morphology in Table 2. Similar phenomenon is also observed in tests carried out with Martinsburg slate by Donath [11]. However, there is a little difference between the two kinds of rocks in triaxial compression condition. In shale from Longmaxi formation, triaxial compressive strengths reach their minimum values at 45° at confining pressure range from 20 to 60 MPa, while the triaxial compressive strength of Martinsburg slate reach the minimum values at 30° at confining range from 3.5 to 35 MPa. This is affected appreciably by the nature of the anisotropy and by the ductility of the rocks under the conditions imposed. Another difference was found in the curves of maximum principal stress to β between this paper and Donath’s research. The curves representing maximum stress of slate at failure as a function of β tended to be concave upward and roughly parabolic in form, and reached their minimum value at inclination angle (β) of 30°. Furthermore, the values of the maximum stress at 90° were one and a half times larger than those at 0° under triaxial conditions. While in triaxial compression tests of shale in this paper, although the shapes of curves were approximately like parabolas, each curve reached its minimum value at 45°, and these curves appeared to be symmetrical in shape. In other words, the value of maximum stress at 90° was close to that at 0°. The reason for this phenomenon may probably be that the slate showed a stronger anisotropy when compressed parallel and perpendicular to the cleavage. Chenevert and Gatlin studied the effects of bedding plane orientation on the elastic constants and the yield strengths of three laminated rocks (one sandstone sample and two shales) and one isotropic rock (a limestone) [12]. This work showed that bedded formations exhibited sizable directional variations in both their elastic constants and yield strengths. They also found that the compressive yield strength of laminated rocks was expected to be higher for specimens cored parallel rather than perpendicular to bedding, as explained from a mechanistic point of view. Furthermore, this strength increase was possibly caused by an increase in the coefficient of friction which arose from the interlocking of individual lamina as the failure surfaces slid along each other. However, in this research, the effect of coefficient of friction was not that significant. McLamore and Gray carried out experiments of compression with three anisotropic sedimentary rocks under various confining pressure [13]. An interesting observation was that the differential stress of slate reached its minimum value at inclination angle (β) of 30° at confining pressure of 34 MPa and 69 MPa, while reached its minimum value at inclination angle (β) of 45° at confining pressure above 138 MPa. Compared with the curves in McLamore and Gray’s research, curves of compressive strength of Longmaxi shale have the similar laws changing with confining pressure. This difference accounts for the shift of the minimum strength orientation as pressure increases, and the locus of minimum strength value was predicted by the variable τ 0 and tanφ theory showed in the former curves. In the research of Tan et al., the uniaxial strength of Longmaxi black shale was affected by both the sample composition and the porosity, and brittle character was also revealed by triaxial compression test with confining pressure increasing up to 36 MPa [20].
In the case of uniaxial compression, the shape of the curve representing the variation of Young’s modulus as a function of the angle of inclination (β) was concave. According to the physical meaning of Young’s modulus, we can learn from the curve that shale samples are not easy to deform when loading direction is parallel or perpendicular to bedding planes, which means that the stiffness of shale samples is relatively large. Furthermore, sample deformation will be relatively large when the load direction deviates from the bedding planes, indicating that shale has a lower stiffness under these anisotropy angles. A paper from Cho et al. [19] reported the experimental investigation of deformation and strength anisotropy of Asan gneiss, Boryeong shale and Yeoncheon schist in Korea which have clear evidence of transverse isotropy. From the paper we learned that the change laws of Young’s modulus with the angle of anisotropy of various layered rock are of great difference. However, there are still similarities between the curves in this research and in Cho’s. Curves in triaxial compression have the similar trends, indicating that confining pressure has a little effect on the change of Young’s modulus, i.e., the influence of inclination (β) on Young’s modulus is greater than that of confining pressure. Similar studies are as follows. Hakala et al. [45] estimated the properties of mica gneiss in uniaxial compression state, and obtained the variation rule of Young’s modulus under each inclination (β) with the interval of 75°. Nasseri et al. [46] studied the transverse anisotropic behavior of schists in terms of compressive strength and deformational responses in uniaxial and in triaxial compression up to high confining pressures. By comparing the results of other people’s tests, we learned that the anisotropy of Young’s modulus of shale is more obvious than other types of layered rock.
Under the conditions of uniaxial and triaxial compression, the variation of Poisson’s ratio showed a trend with compression direction of increasing first for 0° to 45°, and then decreasing for 45° to 90°, with the peak value expressed at 45°. The maximum value of Poisson’s ratio at 45° and confining pressure of 20 MPa is up to almost 0.5. In the research of Hakala et al. [45], curves of Poisson’s ratio of mica gneiss has the similar change law with the curves in this paper, both showing an inverted cone in shape. While in Nasseri’s research [46,47], the variation of Poisson’s ratio with anisotropic angle is complex, unlike the curves in this research. Depending on the change law of Poisson’s ratio, we are able to analyze the variation of the volumetric strain of shale samples. Since the elastic parameters such as Young’s modulus ( E ) and Poisson’s ratio ( ν ) were measured in the elastic stage, the volumetric strain ε V and the elastic volumetric ε V , e strain under triaxial conditions can be calculated according to the generalized Hooke’s law,
ε V = 1 2 ν E ( σ 1 2 σ 3 )
ε V , e = 1 2 ν E ( σ 1 σ 3 )
Furthermore, the crack volumetric strain ε V , c r is calculated by subtracting the elastic deformations ( ε V , e ) of the rock matrix from the total volumetric strain ( ε V ),
ε V , c r = ε V ε V , e
While under uniaxial condition, the volumetric strain ε V can be calculated according to the generalized Hooke’s law,
ε V = 1 2 ν E σ 1
In elastic mechanics, the modulus of volume elasticity, K , is defined as,
K = E 3 ( 1 2 ν )
In order to simplify the formulas, here we define a coefficient of volumetric strain, which is called k,
k = 1 2 ν E
The relationship between k and K is easily obtained from Equations (7) and (8),
k = 1 3 K
Thus, the coefficient of volumetric strain, k, can be considered as a physical parameter to describe the elastic deformation of volume. Therefore, Equations (3)–(6) can be simplified as,
ε V = k ( σ 1 2 σ 3 )
ε V , e = k ( σ 1 σ 3 )
ε V , c r = k σ 3
ε V = k σ 1
The variation of the coefficient of volumetric strain k with the inclination angle is shown in Figure 12. When shale reservoirs are compressed in the same depth under the ground, which means that the vertical stress and confining pressure are the same, the volumetric strain ε V , the elastic volumetric ε V , e strain, and the crack volumetric strain ε V , c r of shale are positively correlated with the coefficient of volumetric strain, k. Take the volumetric strain ε V for example. Samples usually have the largest Poisson’s ratio (close to 0.5) at inclination angle (β) of 45°, corresponding to the volumetric strain close to 0, which means that volume of the sample does not change. Volumetric strains are 0, either because pores and cracks do not open or close, or if opening is exactly compensated by closure. This reflects that samples at inclination angle (β) of 45° mostly undergo shear failure more close to constant volume. Especially, Poisson’s ratios reach their maximum value, close to 0.5, at inclination angle (β) of 45° under each confining pressure, meaning that shale samples at inclination angle (β) of 45° undergo deformation more close to constant volume as the boundary conditions change from uniaxial compression to triaxial compression with confining pressure of 60 MPa, 40 MPa, and 20 MPa, successively. Samples have the lowest Poisson’s ratio at 0° and 90°, corresponding to the largest volumetric strain, which means that the volumes of samples have changed a lot. This may be due to the opening or closing of the pores or cracks of the samples, which is consistent with the fact that samples compressed parallel and perpendicular to bedding are the strongest and show more fracture on bedding. While samples at angles of 30°–60° to bedding have larger value of Poisson’s ratio, which are also characteristic of deformation mechanisms that involve shear and are less dependent on mean stress. This reflects that samples compressed at these angles should involve less fracture opening and more non-volumetric shear on weak bedding planes. This is consistent with the fact that samples fail along a few weak bedding, reflecting that the failure process of the specimens mostly contain shear failure.
When the inclination angle (β) remains constant, Poisson’s ratios under uniaxial compression are generally lower than those under triaxial compression, resulting in volumetric strain under uniaxial compression that is larger than measured under triaxial conditions. Under the condition of triaxial compression, the Poisson’s ratio decreases with the increase of confining pressure, reflecting that volumetric strain increases with confining pressure. This is because shale samples exhibit brittle properties with small volumetric strain under low confining pressure, and gradually exhibit the characteristic of ductility with large volumetric strain with the increase of confining pressure.
From Table 2 we can see that the angle of compression has an influence on the fracture morphology of shale samples. There is a great difference in the fracture morphology of the samples, when other conditions are exactly the same. For example, shale samples fractured along completely different directions with 20 MPa confining pressure. Similar phenomena of mechanical anisotropy were found in slate by Donath et al. in 1961 [11]. In Donath’s tests, curves of differential stress at rupture versus inclination (β) of anisotropy are concave upward and parabolic in form. In slate, cores cut at 90° to the cleavage show the greatest breaking strength—approximately 300 MPa at 35 MPa confining pressure; cores cut at 30° show the least breaking strength. However, there is a little difference between the curves of two kinds of rock. For the black organic-rich shale in this research, the curves of strength vs. inclination (β) of bedding reach their minimum strength value at 45° in triaxial condition, while the curves of slate reach their minimum strength value of 30°. This may be attributed to the effect of the coefficient of internal friction. Results of experiments conducted with gneiss by Gottschalk et al. in 1990 also showed the same trends of variation [48]. Mechanisms of deformation and sources of anisotropy of gneiss were identified by examining microstructures developed in deformed specimens and observing their relationships to those fabric elements initially present in the starting material. This might be a helpful indication for our further work, to clarify the mechanisms of deformation and sources of anisotropy of black organic-rich shale from Longmaxi formation of the Lower Silurian.
In addition, we can see that confining pressure has a significant effect on the failure modes of the specimens. When confining pressure is 20 MPa, corresponding to depth of 0.74 km, fractures usually occur along the bedding planes. When confining pressure increases to 40 MPa, corresponding to depth of 1.5 km, fractures of samples with several inclination angles (β) do not propagate along the bedding surfaces. When confining pressure reaches 60 MPa, corresponding to depth of 2.22 km, specimens no longer fail along bedding planes except when bedding is inclined at 30°. These results are consistent with Donath’s tests [11]. In Donath’s research, increased confining pressure produced a noticeable upward shift of the curves. When confining pressure increased to 35 MPa, fractures tended to occurred along an angle of 30° inclined from the axial stress. The “strike” of the shear fracture of black organic-rich shale under 60 MPa confining pressure was not always parallel to that of the bedding. Similar phenomenon was found in slate with cleavage. Moreover, both types of rock show the same law with reduced anisotropy of shear fracture at higher pressures. We can probably use a model proposed by Smith and Cheatham [14] to explain the variation of fracture morphology in this research. A three-dimensional, transversely isotropic yield condition is combined with a plane of weakness to describe the initial yield limit for Green River Shale in Smith’s research. The theory correctly predicted a decrease in anisotropic behavior with increasing mean stress.
In contrast to the mechanical anisotropies of other rocks, the Longmaxi shale shows the lowest strengths and extreme values of elastic properties when compressed at 45° to bedding. This anisotropy has practical implications for shale hydrofracture applications. Shale samples with different inclinations (β) have different sensitivities to the confining pressure, which can be interpreted as, different modes of failure will occur at different locations in the reservoir. For example, the in-situ stress around the wellbore may be gradually increased with the development of hydraulic fracturing. Meanwhile, because the inclination angle (β) between bedding and the maximum principal stress show a different distribution, each location point follows respective criterion of failure, that is, different failure modes may occur once reaching the ultimate strength at various location in the reservoir. This can probably explain the phenomenon why there are fractures along and cross the bedding plane during hydraulic fracturing treatment.
Although we’ve had a certain awareness of the mechanical properties of shale, there are still a lot of researches to be carried out for further understanding of shale. For example, the rock mechanical properties may be affected by other factors. As the study carried out by Shea et al. [49], the influence of micas on the strength and anisotropy of foliated rocks turned out to be very obvious. In fact, the failure mode of foliated rocks could be brittle, transitional and ductile shear according to varied mica contents.

5. Conclusions

Longmaxi marine shale was used to drill along different angles and conduct tests under various confining pressures. The stress-strain curves, basic physical quantities and characteristics of deformation and failure at each inclination (β) were obtained and further analyzed. Based on the results, a series of curves were drawn to reveal the change laws of physical quantities, such as compressive strength, Young’s modulus, Poisson’s ratio and coefficient of volumetric strain, with various inclinations (β), which contribute to have a better understanding of rock mechanics properties of southern marine black organic-rich shale Longmaxi. The results indicated that shale is a kind of rock with significant anisotropy, which was determined by its layered structure and cementing strength between beddings. Moreover, some implications for hydraulic fracturing are discussed based on the analysis of the results.
The study reaches the following conclusions:
  • The development and distribution of shale’s bedding planes significantly impact its mechanical properties. Shale samples with different inclinations (β) show greater differences in uniaxial compressive strength, triaxial compressive strength, as well as deformation and failure characteristics.
  • Under low confining pressure, shale samples show obvious brittle characteristics. With the confining pressure increasing, its mechanical behavior begins to transform from brittle to plastic characteristics. When the confining pressure reaches a certain value, shale samples show obvious plastic characteristics.
  • Shale samples with different inclinations (β) have different sensitivities to the confining pressure, i.e., the critical confining pressures transforming from brittle to plastic under each inclination (β) are different. The samples with 45° inclinations (β) are least sensitive that is, the highest confining pressure is required for transformation from brittle to plastic characteristics; the sample with 60° inclination (β) are most sensitive to the confining pressure, that is, the lowest confining pressure is required for the sample to transform from brittle to plastic characteristics.
  • Shale samples with different inclinations (β) have different compressive strengths, indicating that the strength of bedding planes is significantly lower than that of shale matrix, or the bedding planes are weakly cemented ones; splitting and shear planes fracture mostly along the bedding plane, revealing that tensile failure and shear failure generally tend to occur along the bedding planes.
  • When hydraulic fracturing was conducted in shale formation with depth less than 2.25 km, different modes of failure will occur at different locations in the reservoir, depending on the orientation of bedding inclined from the principle stress, which can probably explain the phenomenon why there are fractures along and cross the bedding planes during hydraulic fracturing treatment.
  • When hydraulic fracturing was conducted in shale formation with depth greater than 2.25 km, however, hydraulic fractures may not crack along the bedding surfaces to some extent.

Acknowledgments

The authors would like to thank the Editors and the anonymous reviewers for their helpful and constructive comments. This work was supported by the National Natural Science Foundation of China (Grants Nos. 41227901 and 41572310) and the Strategic Priority Research Program of the Chinese Academy of Sciences (Grants Nos. XDB10030000, XDB10030300, and XDB10050400).

Author Contributions

Xiao Li and Yusong Wu conceived and designed the experiments; Yusong Wu performed the experiments; Yusong Wu analyzed the data; Yusong Wu and Jianming He prepared the shale samples; Bo Zheng contributed to mend the machine; and Yusong Wu wrote the paper.

Conflicts of Interest

The authors declare no conflict of interest.

References

  1. Geng, J.B.; Ji, Q.; Fan, Y. The impact of the North American shale gas revolution on regional natural gas markets: Evidence from the regime-switching model. Energy Policy 2016, 96, 167–178. [Google Scholar] [CrossRef]
  2. Aruga, K. The U.S. shale gas revolution and its effect on international gas markets. J. Unconv. Oil Gas Resour. 2016, 14, 1–5. [Google Scholar] [CrossRef]
  3. Hu, D.S.; Xu, S.Q. Opportunity, challenges and policy choices for China on the development of shale gas. Energy Policy 2013, 60, 21–26. [Google Scholar] [CrossRef]
  4. Guo, T.K.; Zhang, S.C.; Qu, Z.Q.; Zhou, T.; Xiao, Y.S.; Gao, J. Experimental study of hydraulic fracturing for shale by stimulated reservoir volume. Fuel 2014, 128, 373–380. [Google Scholar] [CrossRef]
  5. Hou, P.; Gao, F.; Yang, Y.G.; Zhang, X.X.; Zhang, Z.Z. Effect of the layer orientation on mechanics and energy evolution characteristics of shales under uniaxial loading. Int. J. Min. Sci. Technol. 2016, 26, 857–862. [Google Scholar] [CrossRef]
  6. Chen, P.; Han, Q.; Ma, T.S.; Lin, D. The mechanical properties of shale based on micro-indentation test. Petrol. Explor. Dev. 2015, 42, 723–732. [Google Scholar] [CrossRef]
  7. Ma, Y.; Pan, Z.J.; Zhong, N.N.; Connell, L.D.; Down, D.I.; Lin, W.L.; Zhang, Y. Experimental study of anisotropic gas permeability and its relationship with fracture structure of Longmaxi Shales, Sichuan Basin, China. Fuel 2016, 180, 106–115. [Google Scholar] [CrossRef]
  8. Rybacki, E.; Reinicke, A.; Meier, T.; Makasi, M.; Dresen, G. What controls the mechanical properties of shale rocks?—Part I: Strength and Young’s modulus. J. Pet. Sci. Eng. 2015, 135, 702–722. [Google Scholar] [CrossRef]
  9. Rybacki, E.; Meier, T.; Dresen, G. What controls the mechanical properties of shale rocks?—Part II: Brittleness. J. Pet. Sci. Eng. 2016, 144, 39–58. [Google Scholar] [CrossRef]
  10. Holt, R.M.; Fjær, E.; Stenebraten, J.F.; Nes, O.M. Brittleness of shales: Relevance to borehole collapse and hydraulic fracturing. J. Pet. Sci. Eng. 2015, 131, 200–209. [Google Scholar] [CrossRef]
  11. Donath, F.A. Experimental study of shear failure in anisotropic rocks. Geol. Soc. Am. Bull. 1961, 72, 985–990. [Google Scholar] [CrossRef]
  12. Chenevert, M.E.; Gatlin, C. Mechanical anisotropies of laminated sedimentary rocks. J. Soc. Pet. Eng. 1965, 5, 67–77. [Google Scholar] [CrossRef]
  13. McLamore, R.; Gray, K.E. The mechanical behavior of anisotropic sedimentary rocks. J. Eng. Ind. Res. 1967, 89, 62–76. [Google Scholar] [CrossRef]
  14. Smith, M.B.; Cheatham, J.B. A three-dimensional anisotropic yield condition for Green River shale. J. Energy Res. 1980, 102, 184–189. [Google Scholar] [CrossRef]
  15. Swan, G.; Cook, J.; Bruce, S.; Meehan, R. Strain rate effects in Kimmeridge Bay shale. Int. J. Rock Mech. Min. Sci. Geomech. Abstr. 1989, 26, 135–149. [Google Scholar] [CrossRef]
  16. Ibanez, W.D.; Kronenberg, A.K. Experimental deformation of shale: Mechanical properties and microstructural indicators of mechanisms. Int. J. Rock Mech. Min. Sci. Geomech. Abstr. 1993, 30, 723–734. [Google Scholar] [CrossRef]
  17. Kwon, O.; Kronenberg, A.K. Deformation of Wilcox shale: Undrained strengths and effects of strain rate. In Proceedings of the 1st North American Rock Mechanics Symposium, Austin, TX, USA, 1–3 June 1994; American Rock Mechanics Association: Alexandria, VA, USA, 1994; pp. 757–765. [Google Scholar]
  18. Martin, H.R.; Jørn, S.; Erling, F. Static vs. Dynamic Behavior of Shale. In Proceedings of the 46th US Rock Mechanics/Geomechanics Symposium, Chicago, IL, USA, 24–27 June 2012.
  19. Cho, J.W.; Kim, H.; Jeon, S.; Min, K.B. Deformation and strength anisotropy of Asan gneiss, Boryeong shale, and Yeoncheon schist. Int. J. Rock Mech. Min. 2012, 50, 158–169. [Google Scholar] [CrossRef]
  20. Tan, J.Q.; Horsfield, B.; Frank, R.; Krooss, B.; Schulz, H.M.; Rybacki, E.; Zhang, J.C.; Boreham, C.J.; Graas, G.V.; Tocher, B.A. Shale gas potential of the major marine shale formations in the Upper Yangtze Platform, south China, Part III: Mineralogical, lithofacial, petrophysical, and rock mechanical properties. Energy Fuel 2014, 28, 2322–2342. [Google Scholar] [CrossRef]
  21. Xu, J.B. Experimental Study on the Hydraulic Fracturing of Shale. Master’s Thesis, Chinese Academy of Sciences, Wuhan, China, 2012. [Google Scholar]
  22. Chen, S.B.; Zhu, Y.M.; Wang, H.Y.; Liu, H.L.; Wei, W.; Fang, J.H. Characteristics and significance of mineral compositions of Lower Silurian Longmaxi Formation shale gas reservoir in the southern margin of Sichuan Basin. Acta Pet. Sin. 2011, 32, 775–782. [Google Scholar]
  23. Zhang, J.P.; Tang, S.H.; Guo, D.X. Shale gas favorable area prediction of the Qiongzhusi Formation and Longmaxi Formation of Lower Palaeozoic in Sichuan Basin, China. Geol. Bull. China 2011, 30, 357–363. [Google Scholar]
  24. Ma, Y.Q.; Fan, M.J.; Lu, Y.C.; Guo, X.S.; Hu, H.Y.; Chen, L.; Wang, C.; Liu, X.C. Geochemistry and sedimentology of the Lower Silurian Longmaxi mudstone in southwestern China: Implications for depositional controls on organic matter accumulation. Mar. Pet. Geol. 2016, 75, 291–309. [Google Scholar] [CrossRef]
  25. Pedersen, D.K. Thin, fine-grained storm layers in a muddy shelf sequence: An example from the Lower Jurassic in the Stenlille 1 well, Denmark. J. Geol. Soc. 1985, 142, 357–374. [Google Scholar] [CrossRef]
  26. Wignall, P.B. Sedimentary dynamics of the Kimmeridge Clay: Tempests and earthquakes. J. Geol. Soc. 1989, 146, 273–284. [Google Scholar] [CrossRef]
  27. Macquaker, J.H.S. A lithofacies study of the Peterborough Member, Oxford Clay Formation (Jurassic), UK: An example of sediment bypass in a mudstone succession. J. Geol. Soc. 1994, 151, 161–172. [Google Scholar] [CrossRef]
  28. Macquaker, J.H.; Keller, M.A.; Davies, S.J. Algal blooms and “marine snow”: Mechanisms that enhance preservation of organic carbon in ancient finegrained sediments. J. Sediment. Res. 2010, 80, 934–942. [Google Scholar] [CrossRef]
  29. Bowker, K.A. Barnett shale gas production, Fort Worth Basin: Issues and discussion. AAPG Bull. 2007, 91, 523–533. [Google Scholar] [CrossRef]
  30. Hickey, J.; Henk, B. Lithofacies summary of the Mississippian Barnett shale, Mitchell 2 TP Sims well, Wise County, Texas. AAPG Bull. 2007, 91, 437–443. [Google Scholar] [CrossRef]
  31. Loucks, R.G.; Ruppel, S.C. Mississippian Barnett Shale: Lithofacies and depositional setting of a deep-water shale-gas succession in the Fort Worth Basin, Texas. AAPG Bull. 2007, 91, 579–601. [Google Scholar] [CrossRef]
  32. Schieber, J.; Sur, S.; Banerjee, S. Benthic microbial mats in black shale units from the Vindhyan Supergroup, Middle Proterozoic of India: The challenges of recognizing the genuine article. In Atlas of Microbial Mat Features Preserved within the Clastic Rock Record; Schieber, J., Bose, P.K., Eriksson, P.G., Banerjee, S., Sarkar, S., Altermann, W., Catuneau, O., Eds.; Elsevier: Amsterdam, The Netherlands, 2007; pp. 189–197. [Google Scholar]
  33. Konitzer, S.F.; Davies, S.J.; Stephenson, M.H.; Leng, M.J. Depositional controls on mudstone lithofacies in a basinal setting: Implications for the delivery of sedimentary organic matter. J. Sediment. Res. 2014, 84, 198–214. [Google Scholar] [CrossRef]
  34. Zhang, B.; Zhang, J.J.; Yan, S.Y.; Gu, Z.D.; Wang, X.X. Detrital quartz and quartz cement in Upper Triassic reservoir sandstones of the Sichuan Basin: Characteristics and mechanisms of formation based on cathodoluminescence and electron backscatter diffraction analysis. Sediment. Geol. 2012, 267, 104–114. [Google Scholar] [CrossRef]
  35. Chen, X.; Bergstrom, S.M.; Zhang, Y.D.; Wang, Z.H. A regional tectonic event of Katian (Late Ordovician) age across three major blocks of China. Chin. Sci. Bull. 2013, 58, 4292–4299. [Google Scholar] [CrossRef]
  36. Wang, H.; Mo, X. An outline of the tectonic development of China. Episodes 1995, 18, 1–11. [Google Scholar]
  37. Chen, X.; Rong, J.Y.; Fan, J.X.; Zhan, R.B.; Mitchell, C.E.; Harper, D.A.T.; Melchin, M.J.; Peng, P.A.; Finney, S.C.; Wang, X.F. The global boundary stratotype section and point (GSSP) for the base of the Hirnantian stage (the uppermost of the Ordovician system). Episodes 2006, 29, 183–196. [Google Scholar]
  38. Guo, T.L. Evaluation of highly thermally mature shale-gas reservoirs in complex structural parts of the Sichuan Basin. J. Earth Sci. 2013, 24, 863–873. [Google Scholar] [CrossRef]
  39. Guo, T.L.; Zhang, H.R. Formation and enrichment mode of Jiaoshiba shale gas field, Sichuan Basin. Pet. Explor. Dev. 2014, 41, 31–40. [Google Scholar] [CrossRef]
  40. Mu, E.Z.; Li, J.J.; Ge, M.Y.; Chen, X.; Ni, Y.N.; Lin, Y.K. The late Ordovician palaeogeographical map in central China and its synopsis. J. Stratigr. 1981, 5, 165–170. [Google Scholar]
  41. Chen, X.; Rong, J.Y.; Li, Y.; Boucot, A.J. Facies patterns and geography of the Yangtze region, south China, through the Ordovician and Silurian transition. Palaeogeogr. Palaeocl. 2004, 204, 353–372. [Google Scholar]
  42. Guo, T.L.; Liu, R.B. Implications from marine shale gas exploration breakthrough in complicated structural area at high thermal stage: Taking Longmaxi Formation in Well JY1 as an example. Nat. Gas. Geosci. 2013, 24, 643–651. (In Chinese) [Google Scholar]
  43. Chen, Z.Q. Quantitative seismic prediction technique of marine shale TOC and its application: A case from the Longmaxi Shale Play in the Jiaoshiba area, Sichuan Basin. Nat. Gas Ind. 2014, 34, 24–29. [Google Scholar]
  44. Zoback, M.D. Reservoir Geomechanics, 1st ed.; Petroleum Industry Press: Beijing, China, 2012; pp. 58–61. [Google Scholar]
  45. Hakala, M.; Kuula, H.; Hudson, J.A. Estimating the transversely isotropic elastic intact rock properties for in situ stress measurement data reduction: A case study of the Olkiluoto mica gneiss, Finland. Int. J. Rock Mech. Min. 2007, 44, 14–46. [Google Scholar] [CrossRef]
  46. Nasseri, M.H.B.; Rao, K.S.; Ramamurthy, T. Anisotropic strength and deformational behavior of Himalayan schists. Int. J. Rock Mech. Min. 2003, 40, 3–23. [Google Scholar] [CrossRef]
  47. Nasseri, M.H.N.; Rao, K.S.; Ramamurthy, T. Failure mechanism in schistose rocks. Int. J. Rock Mech. Min. 1997, 34, 219.e1–219.e15. [Google Scholar] [CrossRef]
  48. Gottschalk, R.R.; Kronenberg, A.K.; Russell, J.E.; Handin, J. Mechanical anisotropy of gneiss: Failure criterion and textural sources of directional behavior. J. Geophys. Res. 1990, 95, 21613–21634. [Google Scholar] [CrossRef]
  49. Shea, W.T.; Kronenberg, A.K. Strength and anisotropy of foliated rocks with varied mica contents. J. Struct. Geol. 1993, 15, 1097–1121. [Google Scholar] [CrossRef]
Figure 1. Schematic of shale sample subject to (a) uniaxial and (b) triaxial compression.
Energies 09 01088 g001
Figure 2. Longmaxi Formation shale outcrops and various mineralogic components: (a) Shale outcrops; (b) Graptolite and radiolarian fossil; (c) Oolitic pyrite; (d) Interbedding developed quartz veins; and (e) Interbedding developed pyritic veins.
Energies 09 01088 g002
Figure 3. Core-drilling schematic diagram.
Energies 09 01088 g003
Figure 4. Schematic of standard shale samples with their inclination angles (β) corresponding to: (a) 0°; (b) 15°; (c) 30°; (d) 45°; (e) 60°; (f) 75°; and (g) 90°, respectively.
Energies 09 01088 g004
Figure 5. Standard shale samples after processing.
Energies 09 01088 g005
Figure 6. Stress-strain curves for shale subject to uniaxial compression.
Energies 09 01088 g006
Figure 7. Stress-strain curves for shale subject to triaxial compression corresponding to: (a) 0°; (b) 15°; (c) 30°; (d) 45°; (e) 60°; (f) 75°; and (g) 90°, respectively.
Energies 09 01088 g007aEnergies 09 01088 g007b
Figure 8. Relationships of (a) compressive strength, (b) Young’s modulus, and (c) Poison’s ratio of shale samples to inclination (β).
Energies 09 01088 g008
Figure 9. Shale samples were divided into three groups according to different fracture patterns corresponding to each inclinations (β). (a) at 0° and 90° inclinations (β), the failure fractures are mostly along the axis; (b) at 15° and 75° inclinations (β), the failure fractures have two types: one parallel to the direction of bedding planes and the other parallel to the axis; (c) at 30°–60° inclinations (β), the fractures are mostly along the direction parallel to the bedding planes.
Energies 09 01088 g009aEnergies 09 01088 g009b
Figure 10. Failure morphology of samples with inclination angles (β) of: (a) 0°; (b) 15°; (c) 30°; (d) 45°; (e) 60°; (f) 75°; and (g) 90° of shale samples subjected to different confining pressures in triaxial compression.
Energies 09 01088 g010aEnergies 09 01088 g010b
Figure 11. Mohr circles at failure for a typical run of Longmaxi shale with the criterion for failure in the plane of bedding.
Energies 09 01088 g011
Figure 12. The variation of coefficient of volumetric, k, with the inclination angle (β).
Energies 09 01088 g012
Table 1. Result of X-ray powder diffraction of Longmaxi shale from Shizhu Country (by Xu et al. [21]).
NumberQuartz/%Albite/%Potash Feldspar/%Calcite/%Chlorite/%Illite/%Pyrite/%
Sample-127.3311.9611.511.036.0237.504.65
Sample-231.3910.016.061.896.5240.323.80
Sample-327.8011.857.110.833.4345.303.7
Sample-427.9512.235.42-7.5642.764.09
Table 2. Sketches of failure morphology of shale samples under various confining pressure corresponding to different inclination angles (β).
0 MPa20 MPa40 MPa60 MPa
Energies 09 01088 i001 Energies 09 01088 i002 Energies 09 01088 i003 Energies 09 01088 i004
15° Energies 09 01088 i005 Energies 09 01088 i006 Energies 09 01088 i007 Energies 09 01088 i008
30° Energies 09 01088 i009 Energies 09 01088 i010 Energies 09 01088 i011 Energies 09 01088 i012
45° Energies 09 01088 i013 Energies 09 01088 i014 Energies 09 01088 i015 Energies 09 01088 i016
60° Energies 09 01088 i017 Energies 09 01088 i018 Energies 09 01088 i019 Energies 09 01088 i020
75° Energies 09 01088 i021 Energies 09 01088 i022 Energies 09 01088 i023 Energies 09 01088 i024
90° Energies 09 01088 i025 Energies 09 01088 i026 Energies 09 01088 i027 Energies 09 01088 i028

