Article

Experimental Investigation of Thermal Behaviors in Window Systems by Monitoring of Surface Condensation Using Full-Scale Measurements and Simulation Tools

1
Department of Architectural Engineering, Yonsei University, 50 Yonsei Street, Seodaemun-gu, Seoul 03722, Korea
2
Architectural Engineering Department, King Fahd University of Petroleum and Minerals, Dhahran 31261, Saudi Arabia
*
Author to whom correspondence should be addressed.
Energies 2016, 9(11), 979; https://doi.org/10.3390/en9110979
Submission received: 21 September 2016 / Revised: 2 November 2016 / Accepted: 17 November 2016 / Published: 22 November 2016
(This article belongs to the Special Issue Advanced Heating and Cooling Techniques)

Abstract

:
The aim of the present study was to investigate the thermal performance of window systems using full-scale measurements and simulation tools. A chamber was installed on the balcony of an apartment to control the temperatures which can create condensation on the interior surfaces of window systems. The condensation process on the window was carefully scrutinized when outdoor and indoor temperature and indoor relative humidity ranged from −15 °C to −20 °C, 23 °C to 24 °C, and 50% to 65%, respectively. The results of these investigations were analyzed to determine how the moisture is influenced by changing temperatures. It appears that the glass-edge was highly susceptible to the temperature variations and the lowest temperature on the glass edge was caused by the heat transfer through the spacer, between the two glass panels of the window. The results from the simulation used in this study confirm that the thermal performance of window systems can be improved the use of super insulated or thermally broken spacers. If the values of the indoor humidity and temperature are given, then the outdoor temperature when condensation forms can be obtained by using Temperature Difference Ratio (TDR). This methodology can be employed to predict the possible occurrence of condensation.

1. Introduction

Window systems in buildings have an impact on the occupants’ thermal comfort [1]. The energy flow by solar radiation primarily occurs through windows and the solar heat gain strongly affects the building heating and cooling demand [2,3]. In addition, window systems have negative effects on the thermal behaviors in building envelopes because of their poor thermal insulation performance [4]. The insulation performance of window systems is influenced by many factors such as glass type, the thermal breaker in the frame, the spacer types, etc. [5,6,7,8,9]. As a result, they are susceptible to heat transitions, which increases the risk of inside surface condensation. This inside surface condensation problem in window systems causes issues such as view obstruction, damage to the interior finish, freezing in a colder climate, mold growth risks, etc. [10,11,12,13,14].
In South Korea, apartment buildings account for more than 58% of the total residential buildings and, in most of the units of these apartment buildings, the living room area has been expanded to include the balcony space. This causes thermal discomfort and a demand for heating and cooling energy. Window condensation problems have also often been reported in apartment buildings in the winter [15,16,17,18].
Heat and moisture transfers in the building envelopes are complex issues. Many studies have conducted investigations using software and experiments in order to understand the thermal performance of building envelopes. Bellia and Minichiello [14] investigated the thermal and moisture performance of building exterior walls using a software tool. They found that condensation in building components such as fibrous materials is influenced by the outdoor climatic conditions and indoor moisture production. In addition, Ge et al. [19] investigated thermal performance in the building envelope using simulation tools such as THERM and eQUEST. Koci et al. [20] also conducted a computational analysis to investigate the thermal insulation for building envelopes under various climatic conditions of Europe. In another study [21], experimental studies were carried out on heat, air, and moisture transfer through a full scale building envelope wall under atmospheric conditions. Harrestrup and Svendsen [22] conducted full-scale post-renovation measurements of a heritage building, focusing on energy savings and moisture reduction. The obtained data were also validated with numerical simulations. These studies revealed that factors such as ambient air condition and building envelope systems affect the thermal and moisture behavior and cause heat and moisture transfer through building envelope systems. The negative effects such as condensation were caused by this heat and moisture transfer, which worsens the indoor environmental qualities in buildings. With regard to this condensation issue, these above studies have attempted to reduce the moisture formation in buildings using superinsulation, extreme air tightness, high performance windows, etc.
Some studies have investigated surface condensation problems in window systems. Glaser and Ulrich [23] identified the key parameters influencing the condensation on the outdoor surface of window glazing in buildings. They concluded that weather resistant low-e coatings can prevent frost and dew occurrence on the outdoor surface of glazing. Experiments were conducted by Werner and Roos with glass samples of three different thermal emissivity values in order to recognize the condensation patterns on the different thermal emissivities [24]. In the experiments, they found that the surface coating can strongly influence the formation of water condensation on the glass surface. Moreover, a double window system with improved thermal performance and ventilation slits was investigated in order to overcome the window surface condensation problems in apartment buildings [15]. It was demonstrated that the double window system can reduce the frequency of condensation occurrence. Another study by Ge et al. [19] investigated the impact of thermal bridges in residential buildings, which increases the risk of condensation and mold growth.
The aim of this current paper is to investigate the thermal performance of window systems using full-scale measurements and building simulation tools. The building simulations such as THERM and WINDOW were used to determine the temperature distributions on the window system and full-scale field measurements were conducted in order to observe the dew occurrence in an apartment building. In the balcony of the apartment, a chamber was installed to control the temperatures which can create condensation on the interior surfaces of window systems. This paper describes the experimental results, focusing on surface temperature distributions for interior window systems. The results of these investigations were analyzed to determine how the moisture is influenced by changing temperatures.

2. Field Measurements

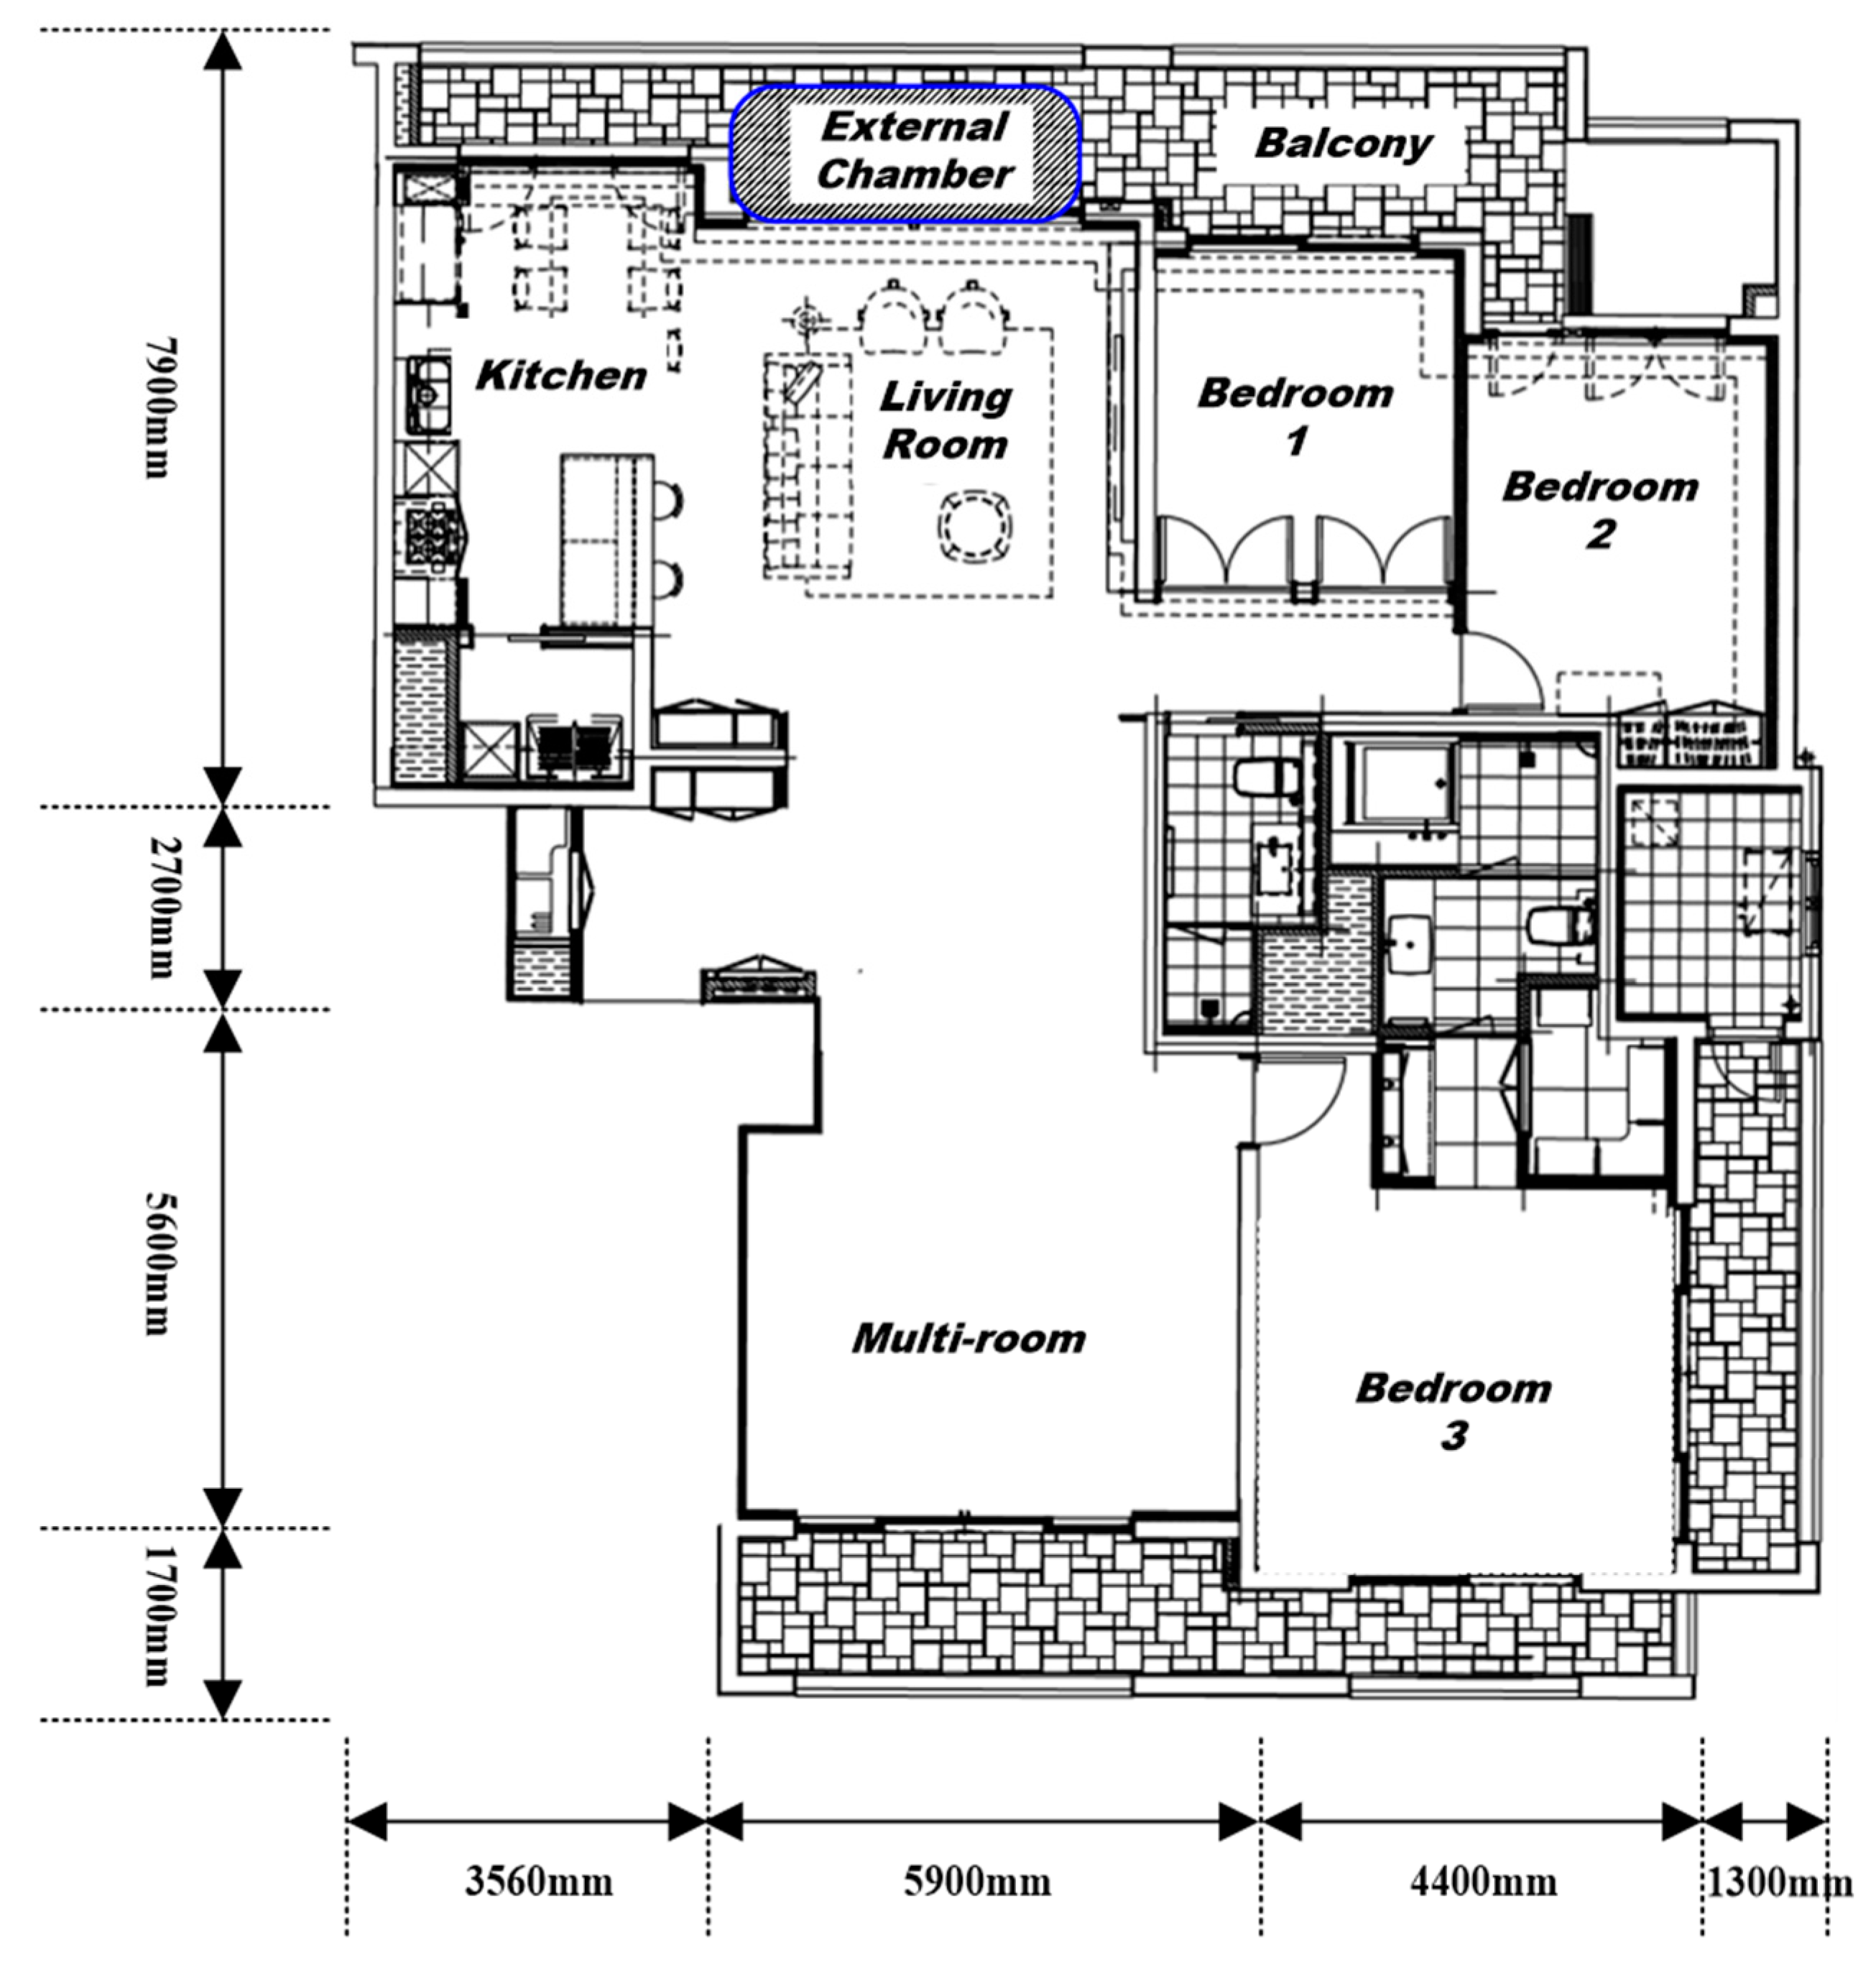
2.1. The Study Building
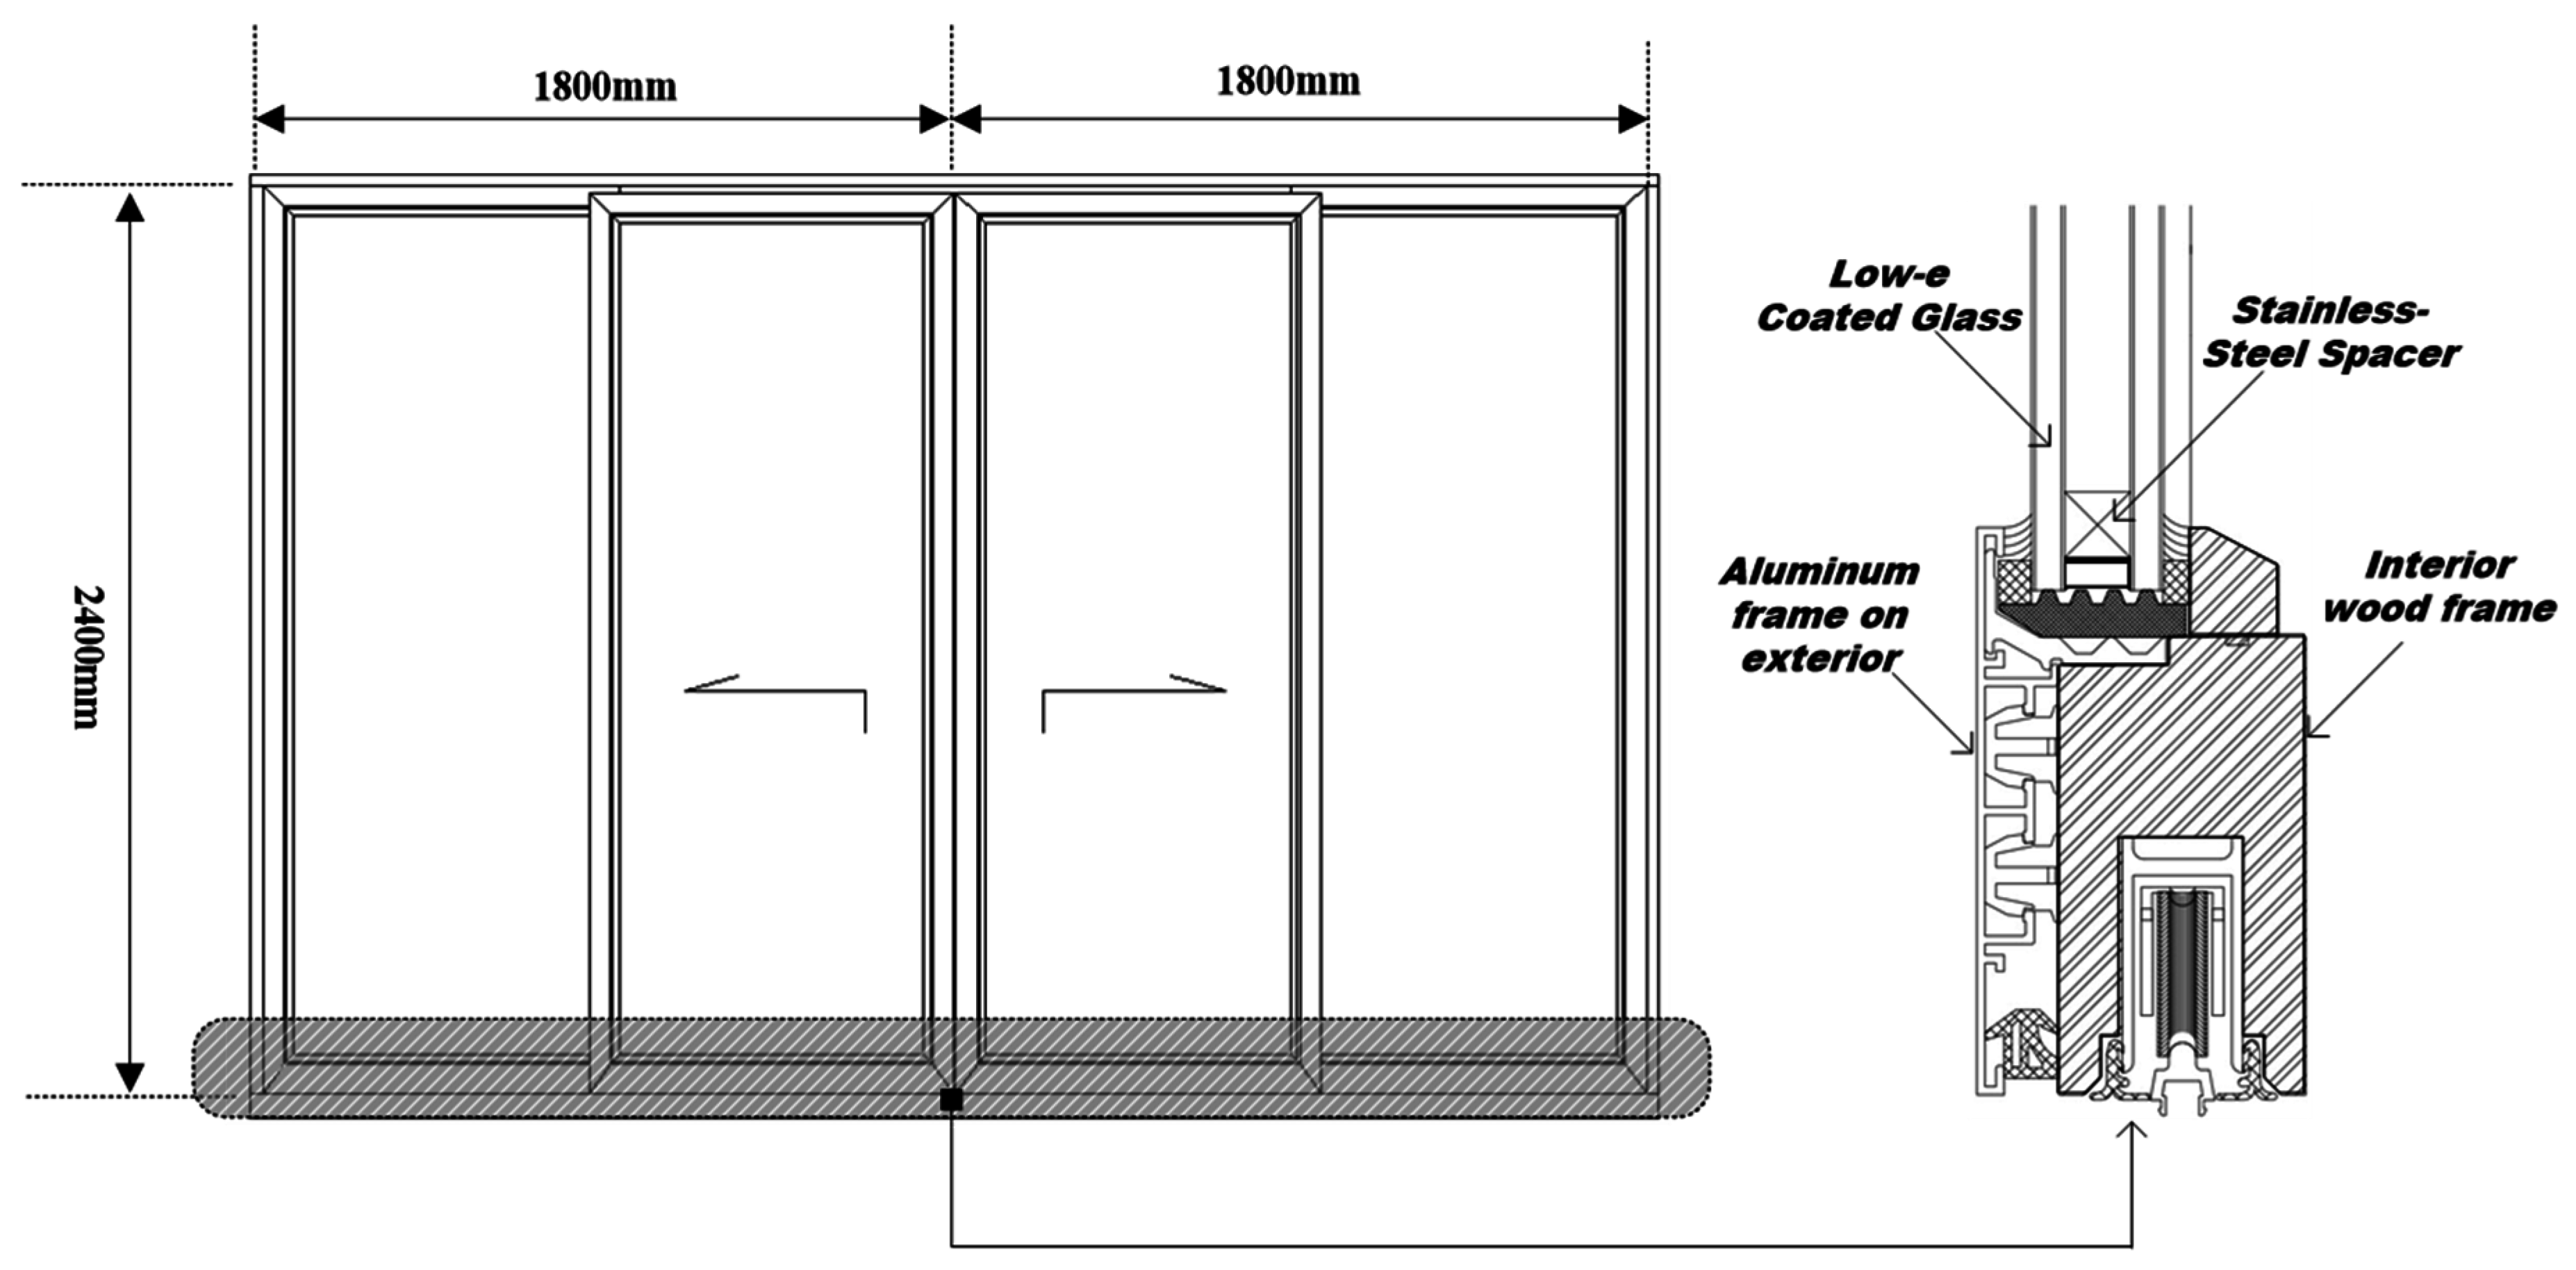
Full scale measurements of thermal performance were taken at an apartment building in South Korea. The apartment building is a seven-story reinforced concrete building, constructed in 2013. The building has a rectangular floor plan and its area is 180 m2, with a 3 m floor height. The apartments comprise three bedrooms, two living rooms, a kitchen, and two bathrooms. A plan of the apartment building used for the measurements is shown in Figure 1. The thermal performance measurements were taken over five days from 1 to 5 November. During this period, the outdoor temperature and relative humidity ranged from 7 °C to −20 °C and 27% to 70%, respectively.
The Ministry of Land Infrastructure and Transport of South Korea has set a design standard to prevent condensation on window systems. According to the standard, the condition of the outdoor temperature must be −20 °C, and the indoor relative humidity should be 50%. Generally, the humidity levels in residential buildings vary according to the activities of the occupants. Although the humidity level may be set to 50% in order to prevent condensation, the housing can have higher humidity levels. The indoor humidity levels ranged from 50% to 65% and thus, the occurrence of condensation was observed during the experiment in this study.

2.2. Window System

The window system used for this study was positioned in the main living room (Figure 1). This window system has four windows and each window is rectangular in shape, with dimensions of 2.4 m height × 0.9 m width as shown in Figure 2. The interior frame of the window system is wood and the exterior frame is aluminum. The glass panels consist of a double glazing system with 13 mm Argon between the glass panels, where the external glazing is 6 mm low-e coated glass and the internal glazing is 6 mm clear glass. Between the glass panels, a thin-walled stainless-steel spacer was used to tightly seal the argon gas. Thermal properties and other relative parameters are presented in Table 1.

2.3. Measurement Setup

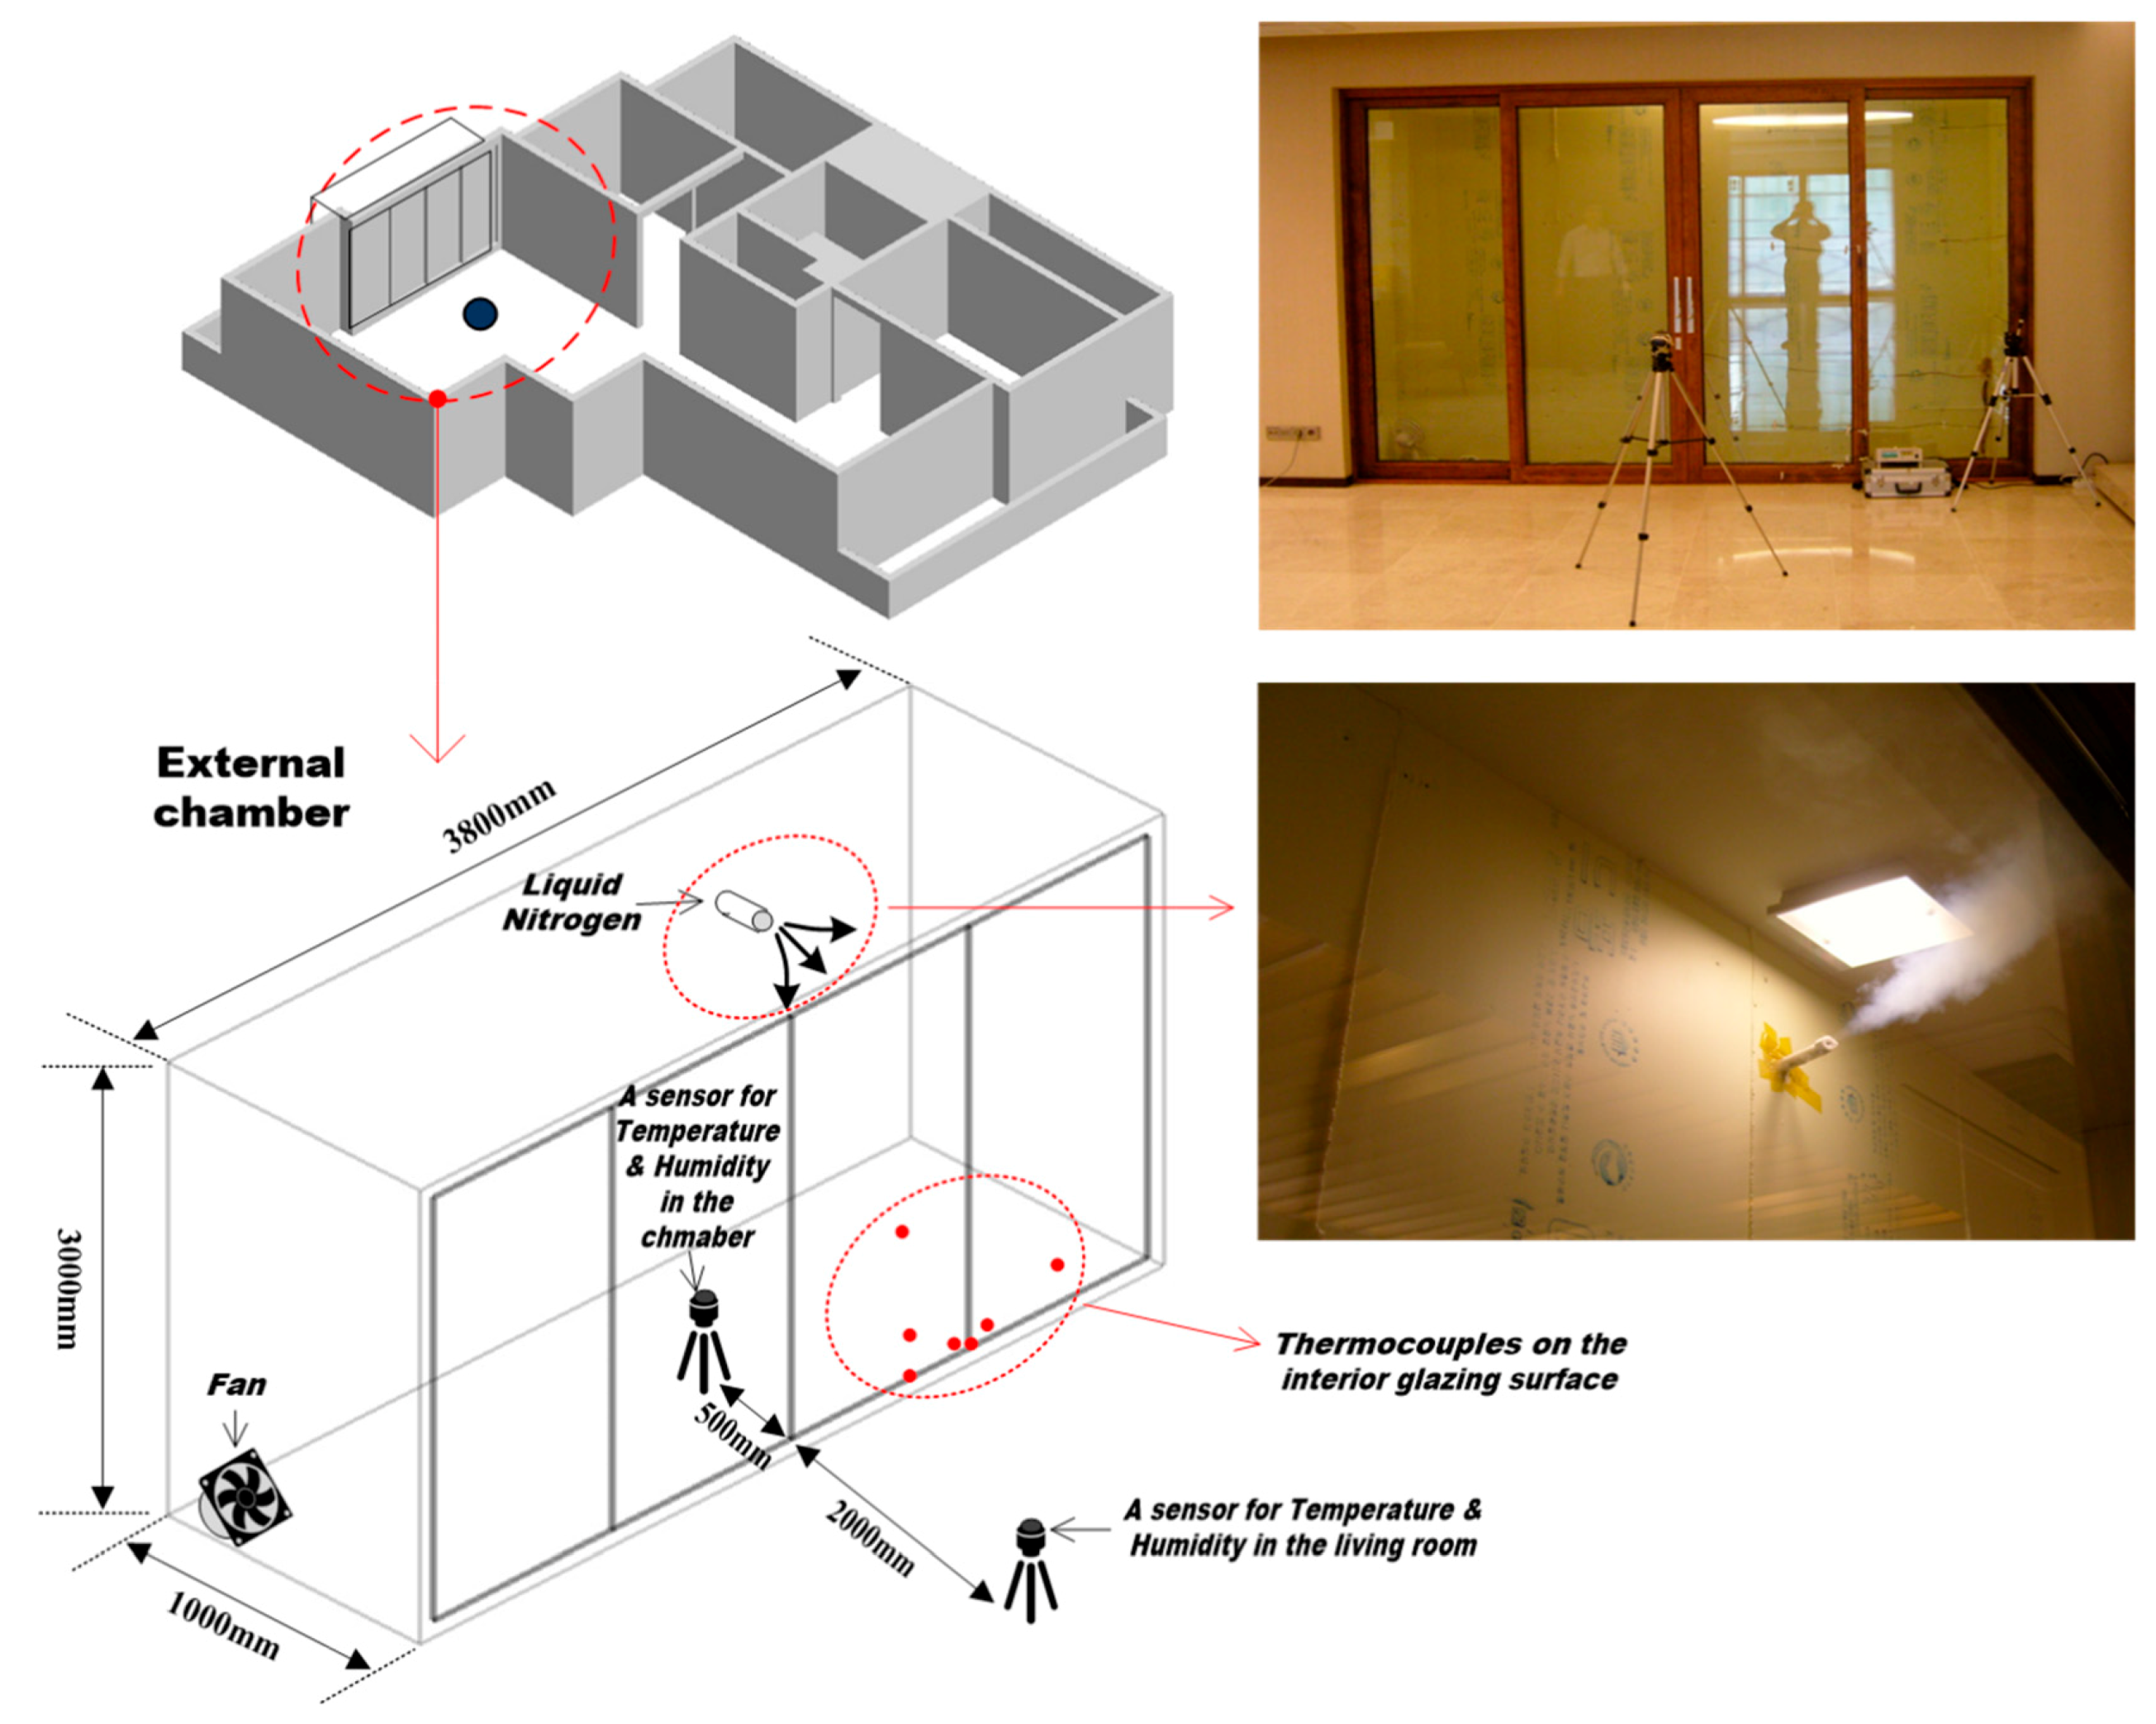
2.3.1. External Chamber

In the study, particular attention was paid to the control of the environment of the window system by varying the temperature from −15 °C to −20 °C in an external chamber system. To this aim, an external chamber was installed in the balcony space (Figure 3). The chamber, with dimensions of 1 m width, 3.8 m length, and 3.0 m height was tightly lined with 12.5 mm gypsum board and a 65 mm layer of insulation. In the chamber, the temperature in the balcony space was controlled using liquid nitrogen. Liquid nitrogen was set to be released in order to decrease the temperature by 10 °C every hour. By using liquid nitrogen, the temperature was determined so that condensation on the inside surface of the window system would occur in a steady state condition. During the measurement period, three 200 L cylinders of liquid nitrogen were used and each lasted approximately 4 h. A small fan was installed to mix the nitrogen gas with the air in the chamber.

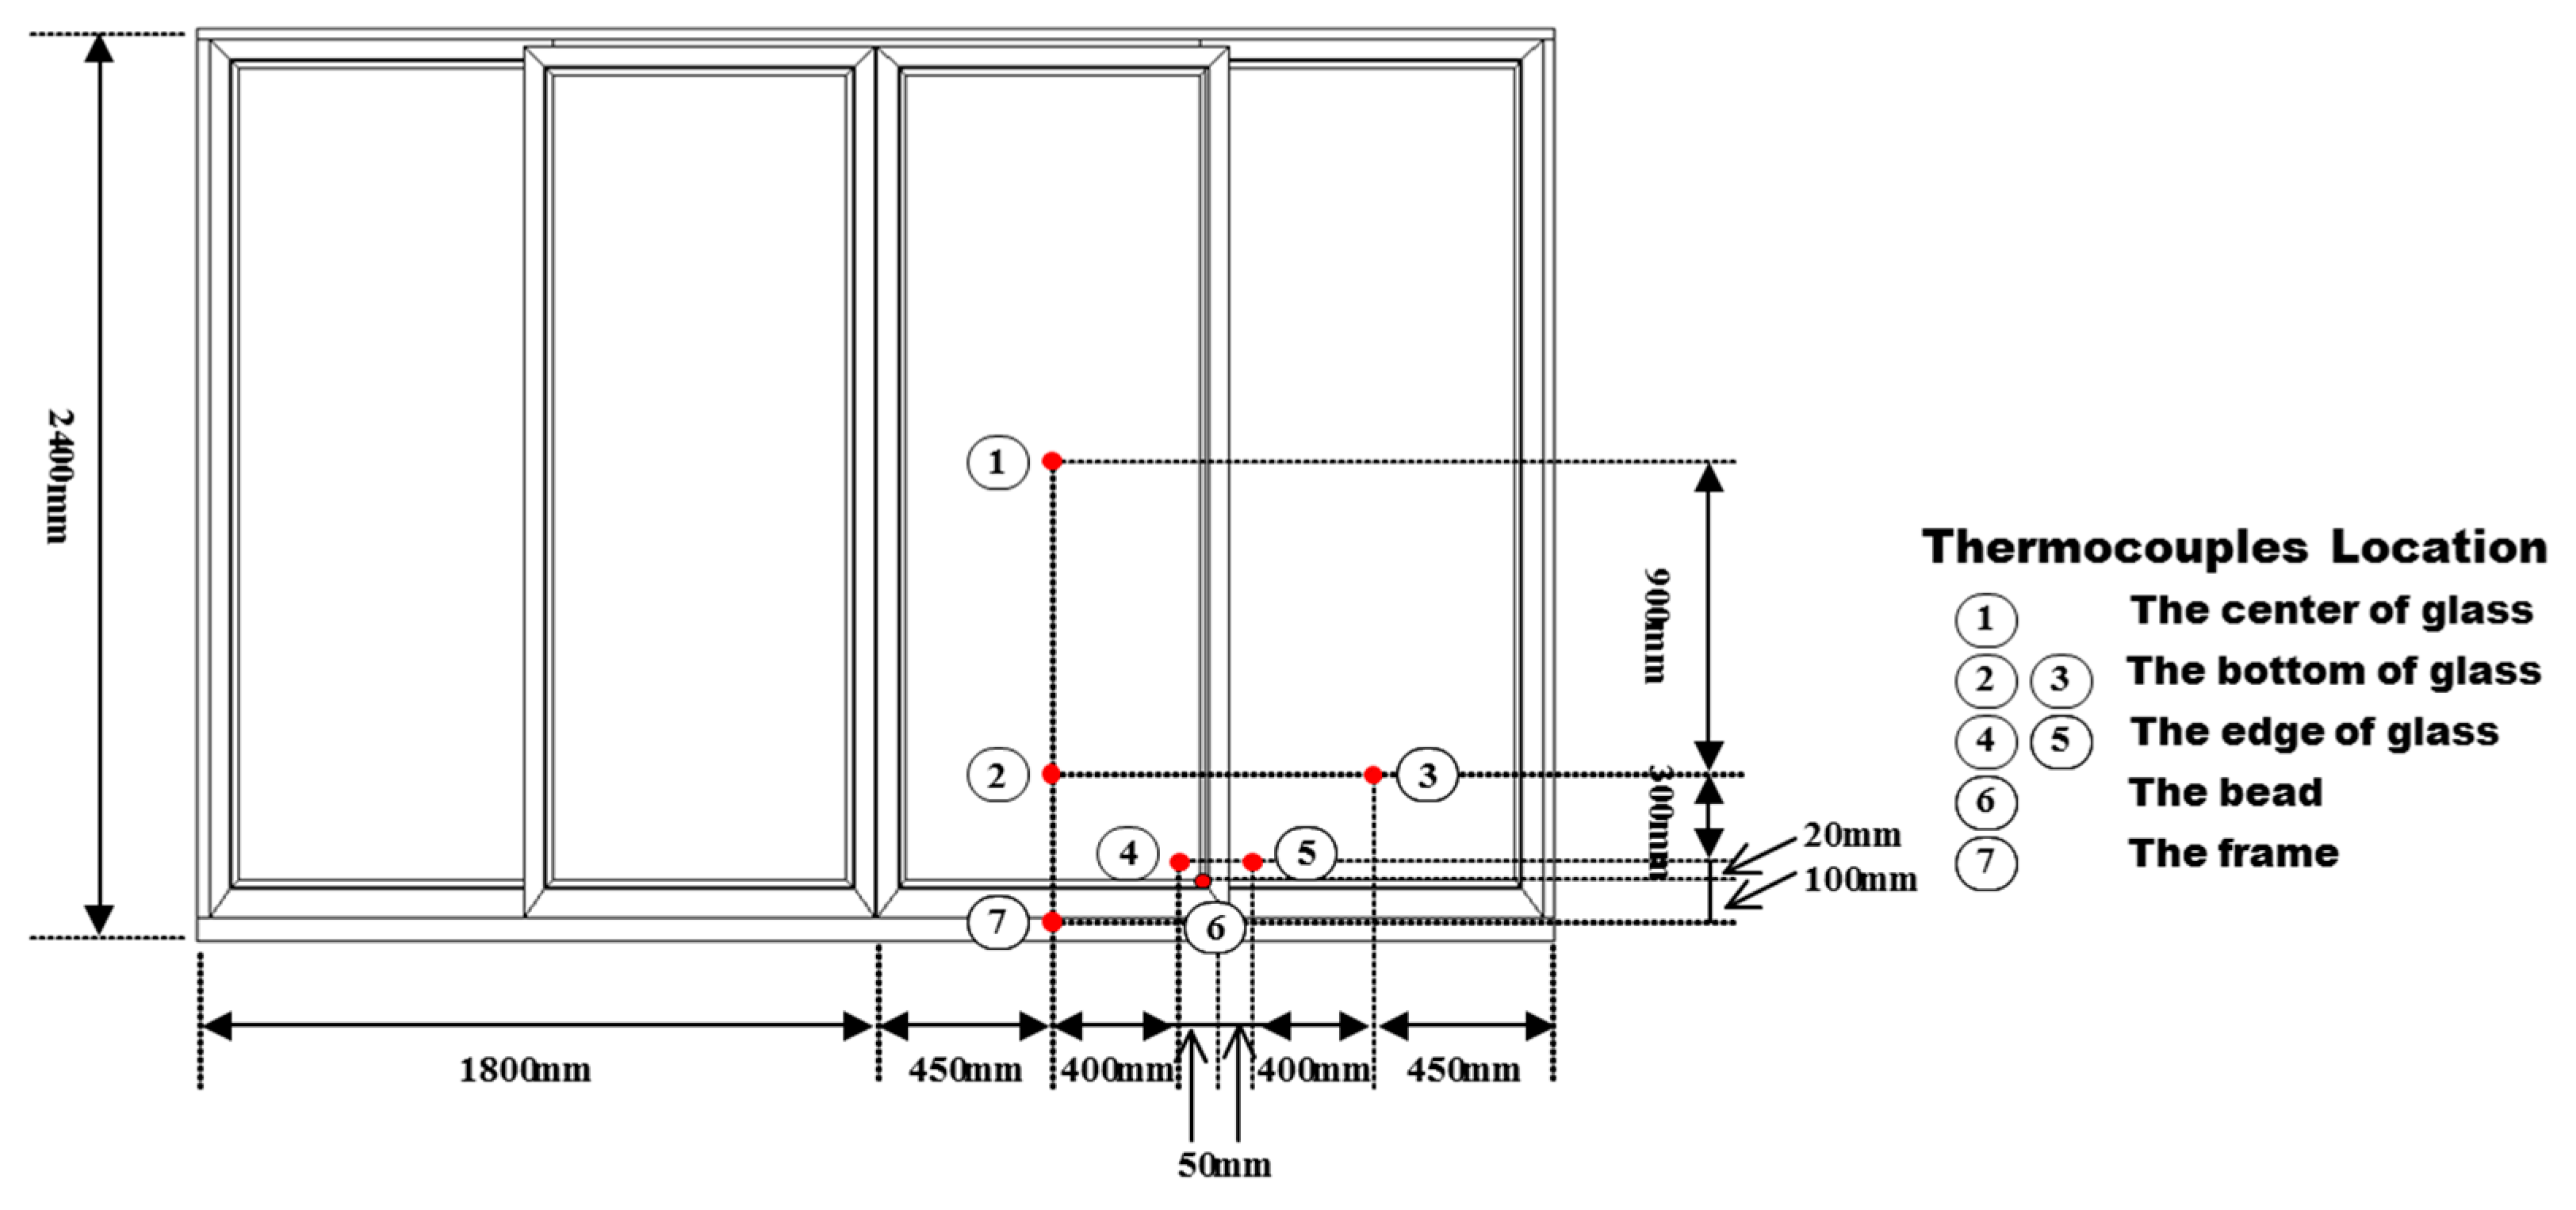
2.3.2. The Location of Sensors

As shown in Figure 3, two hygro-thermometers were located in the living room and the chamber to measure the air temperature and humidity. For the window system, 14 thermocouples were used and each of the seven sensors was located in the same position of the exterior and interior surfaces of the window system (Figure 4). On each surface of the glass, five sensors (sensors 1 to 5) were mounted on the glass and two sensors (sensors 6 and 7) were located on the glass bead and frame, respectively. These measurements were taken every 5 min.

2.4. Other Measurement Conditions

As can be seen in the Table 2, three small humidifiers were located to control the indoor relative humidity by 50%–65% and the indoor temperature was maintained at 23 °C to 24 °C during the measurement period in the living room and kitchen. In the chamber, the temperature was decreased to −8 °C on the second day of the measurement and was decreased to −15 °C, −18 °C, and −20 °C on the third day. On the fourth day, the temperature of −18 °C to −20 °C was maintained and the indoor humidity was increased to observe the condensation on the interior surface of the window system.

2.5. Simulation for the Thermal Performance of Window Systems

Before the field measurements were taken, the surface temperatures of the window systems were obtained from WINDOW and THERM, according to the changing outdoor temperatures. THERM is an analysis tool for measuring the two-dimensional (2D) heat transfer effects in building components under steady-state and WINDOW is used for calculating window thermal performance [4,19,25]. Both tools were developed at the Lawrence Berkeley National Laboratory. In this study, the frame was represented in THERM by adding glazing layers created by WINDOW simulation. The interior and exterior boundary conditions are specified in Table 3.

3. Results and Discussion

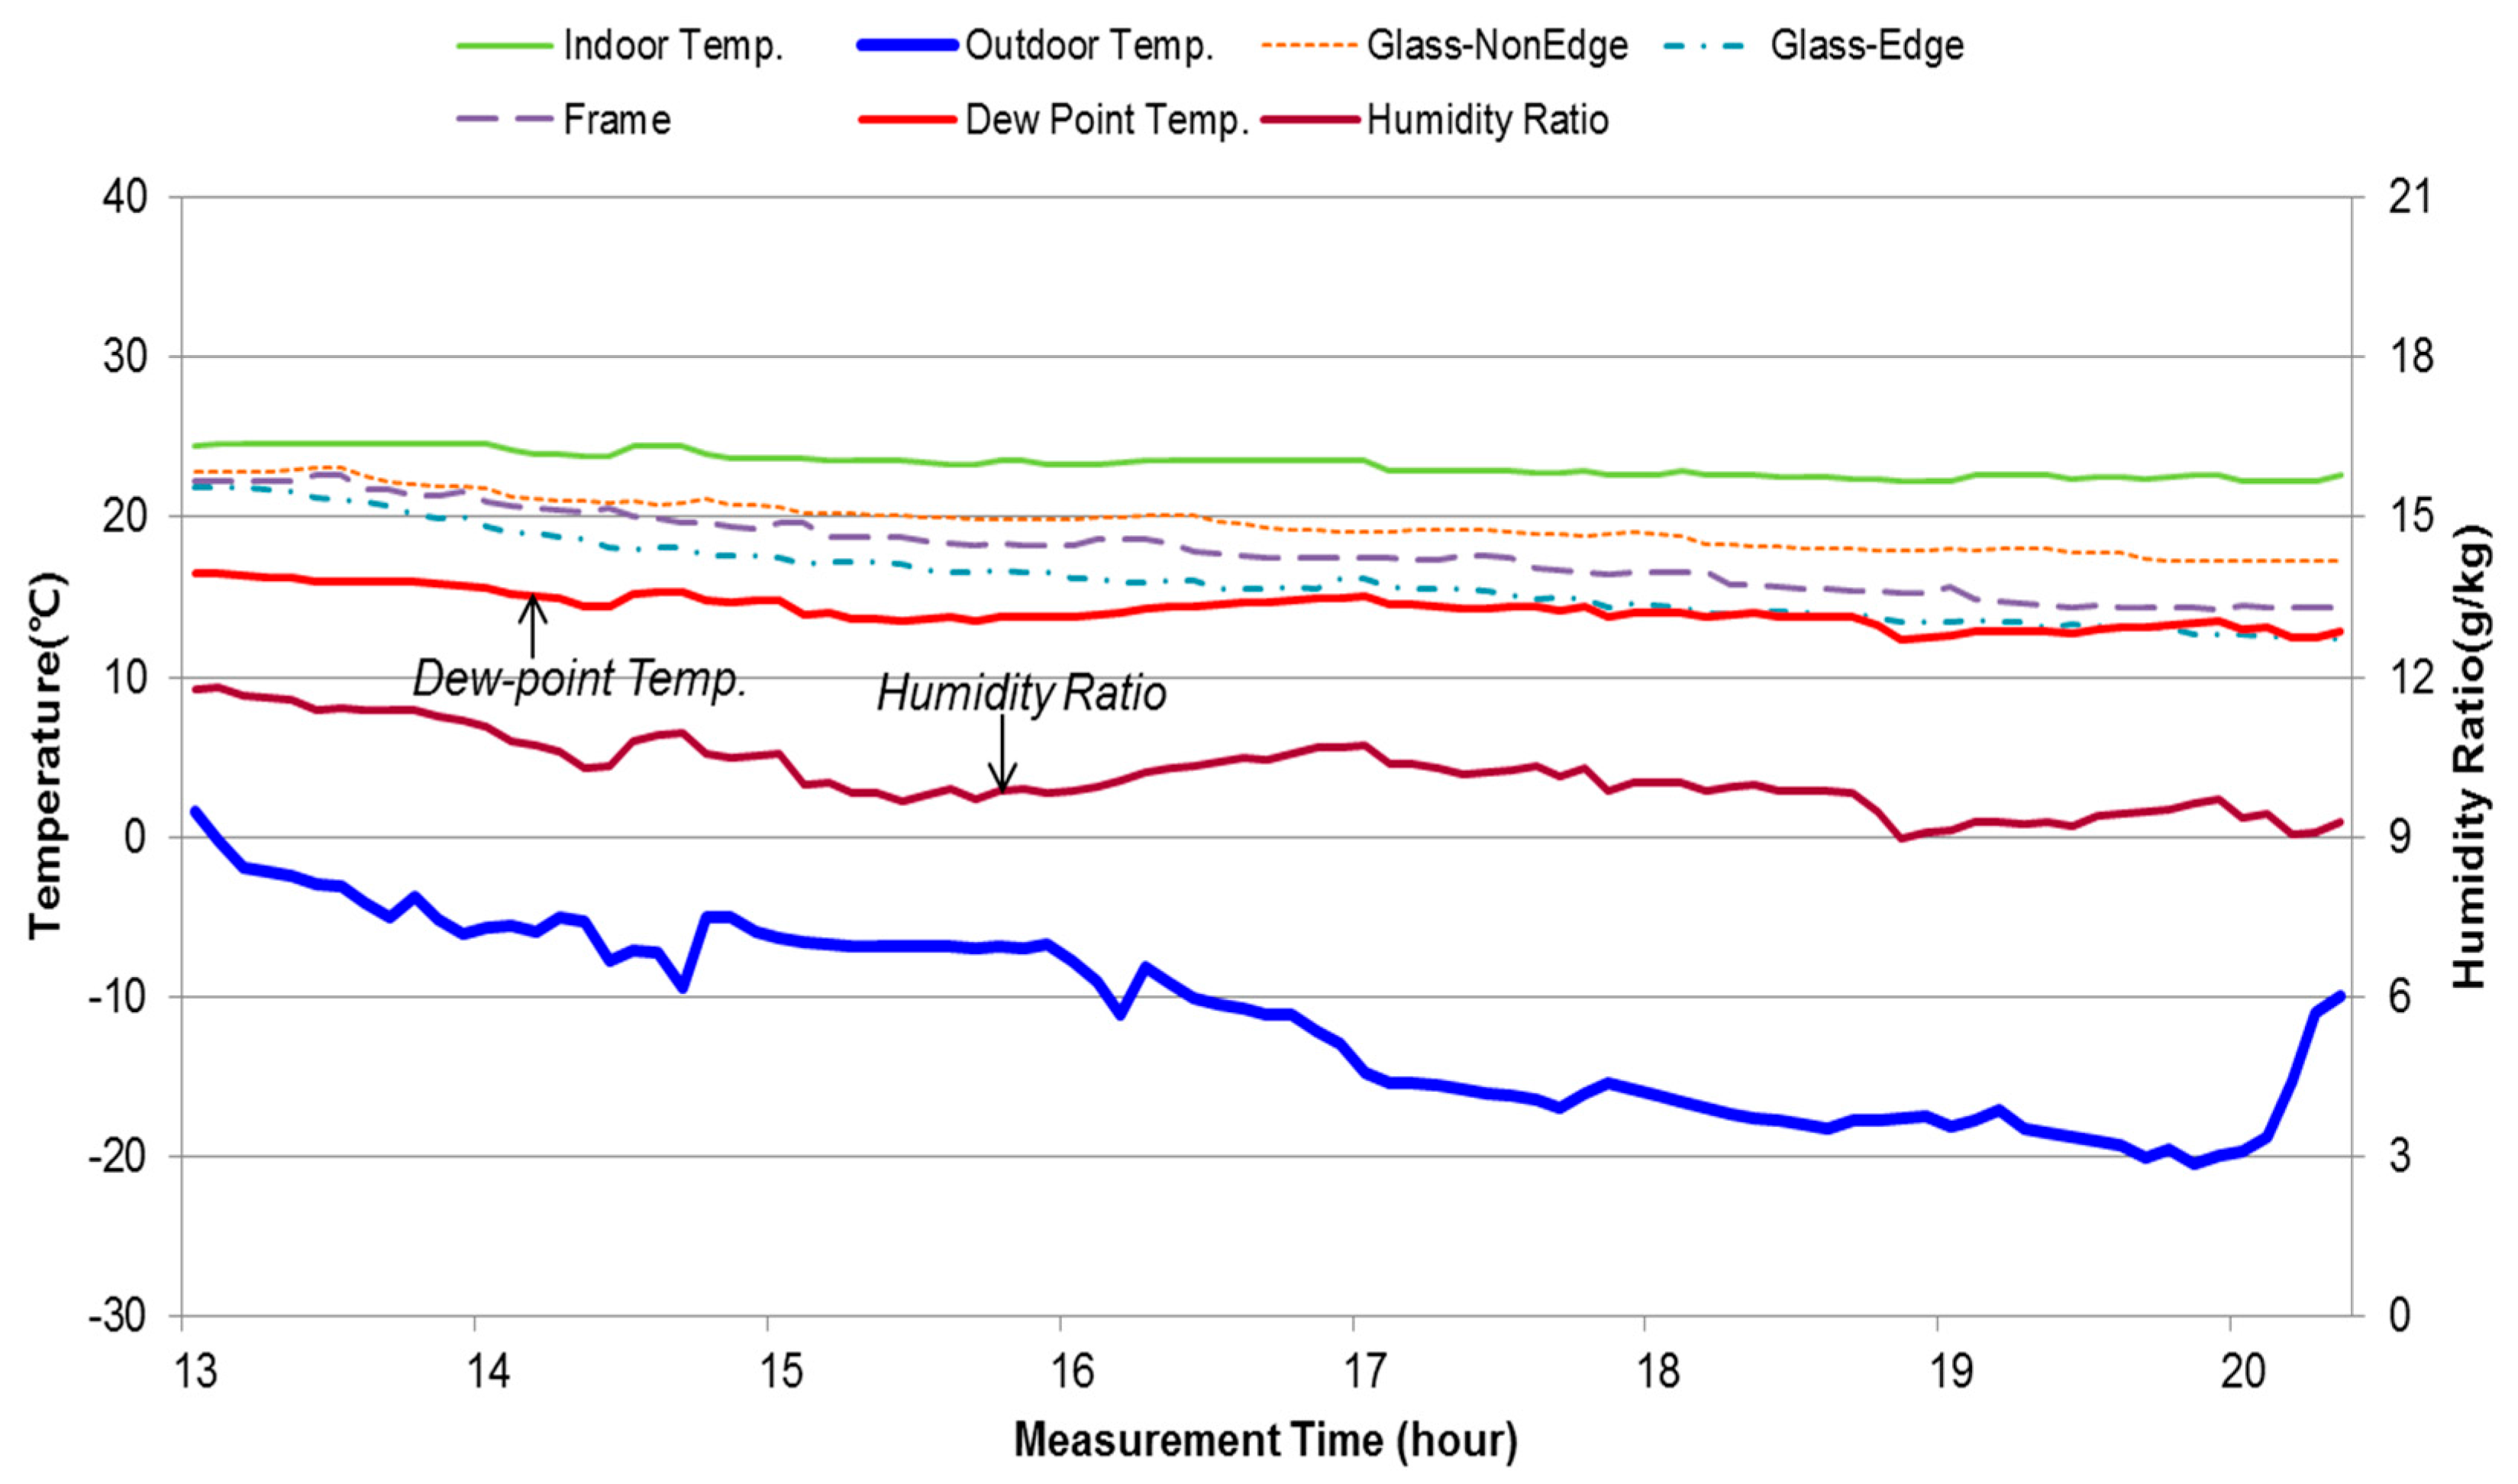
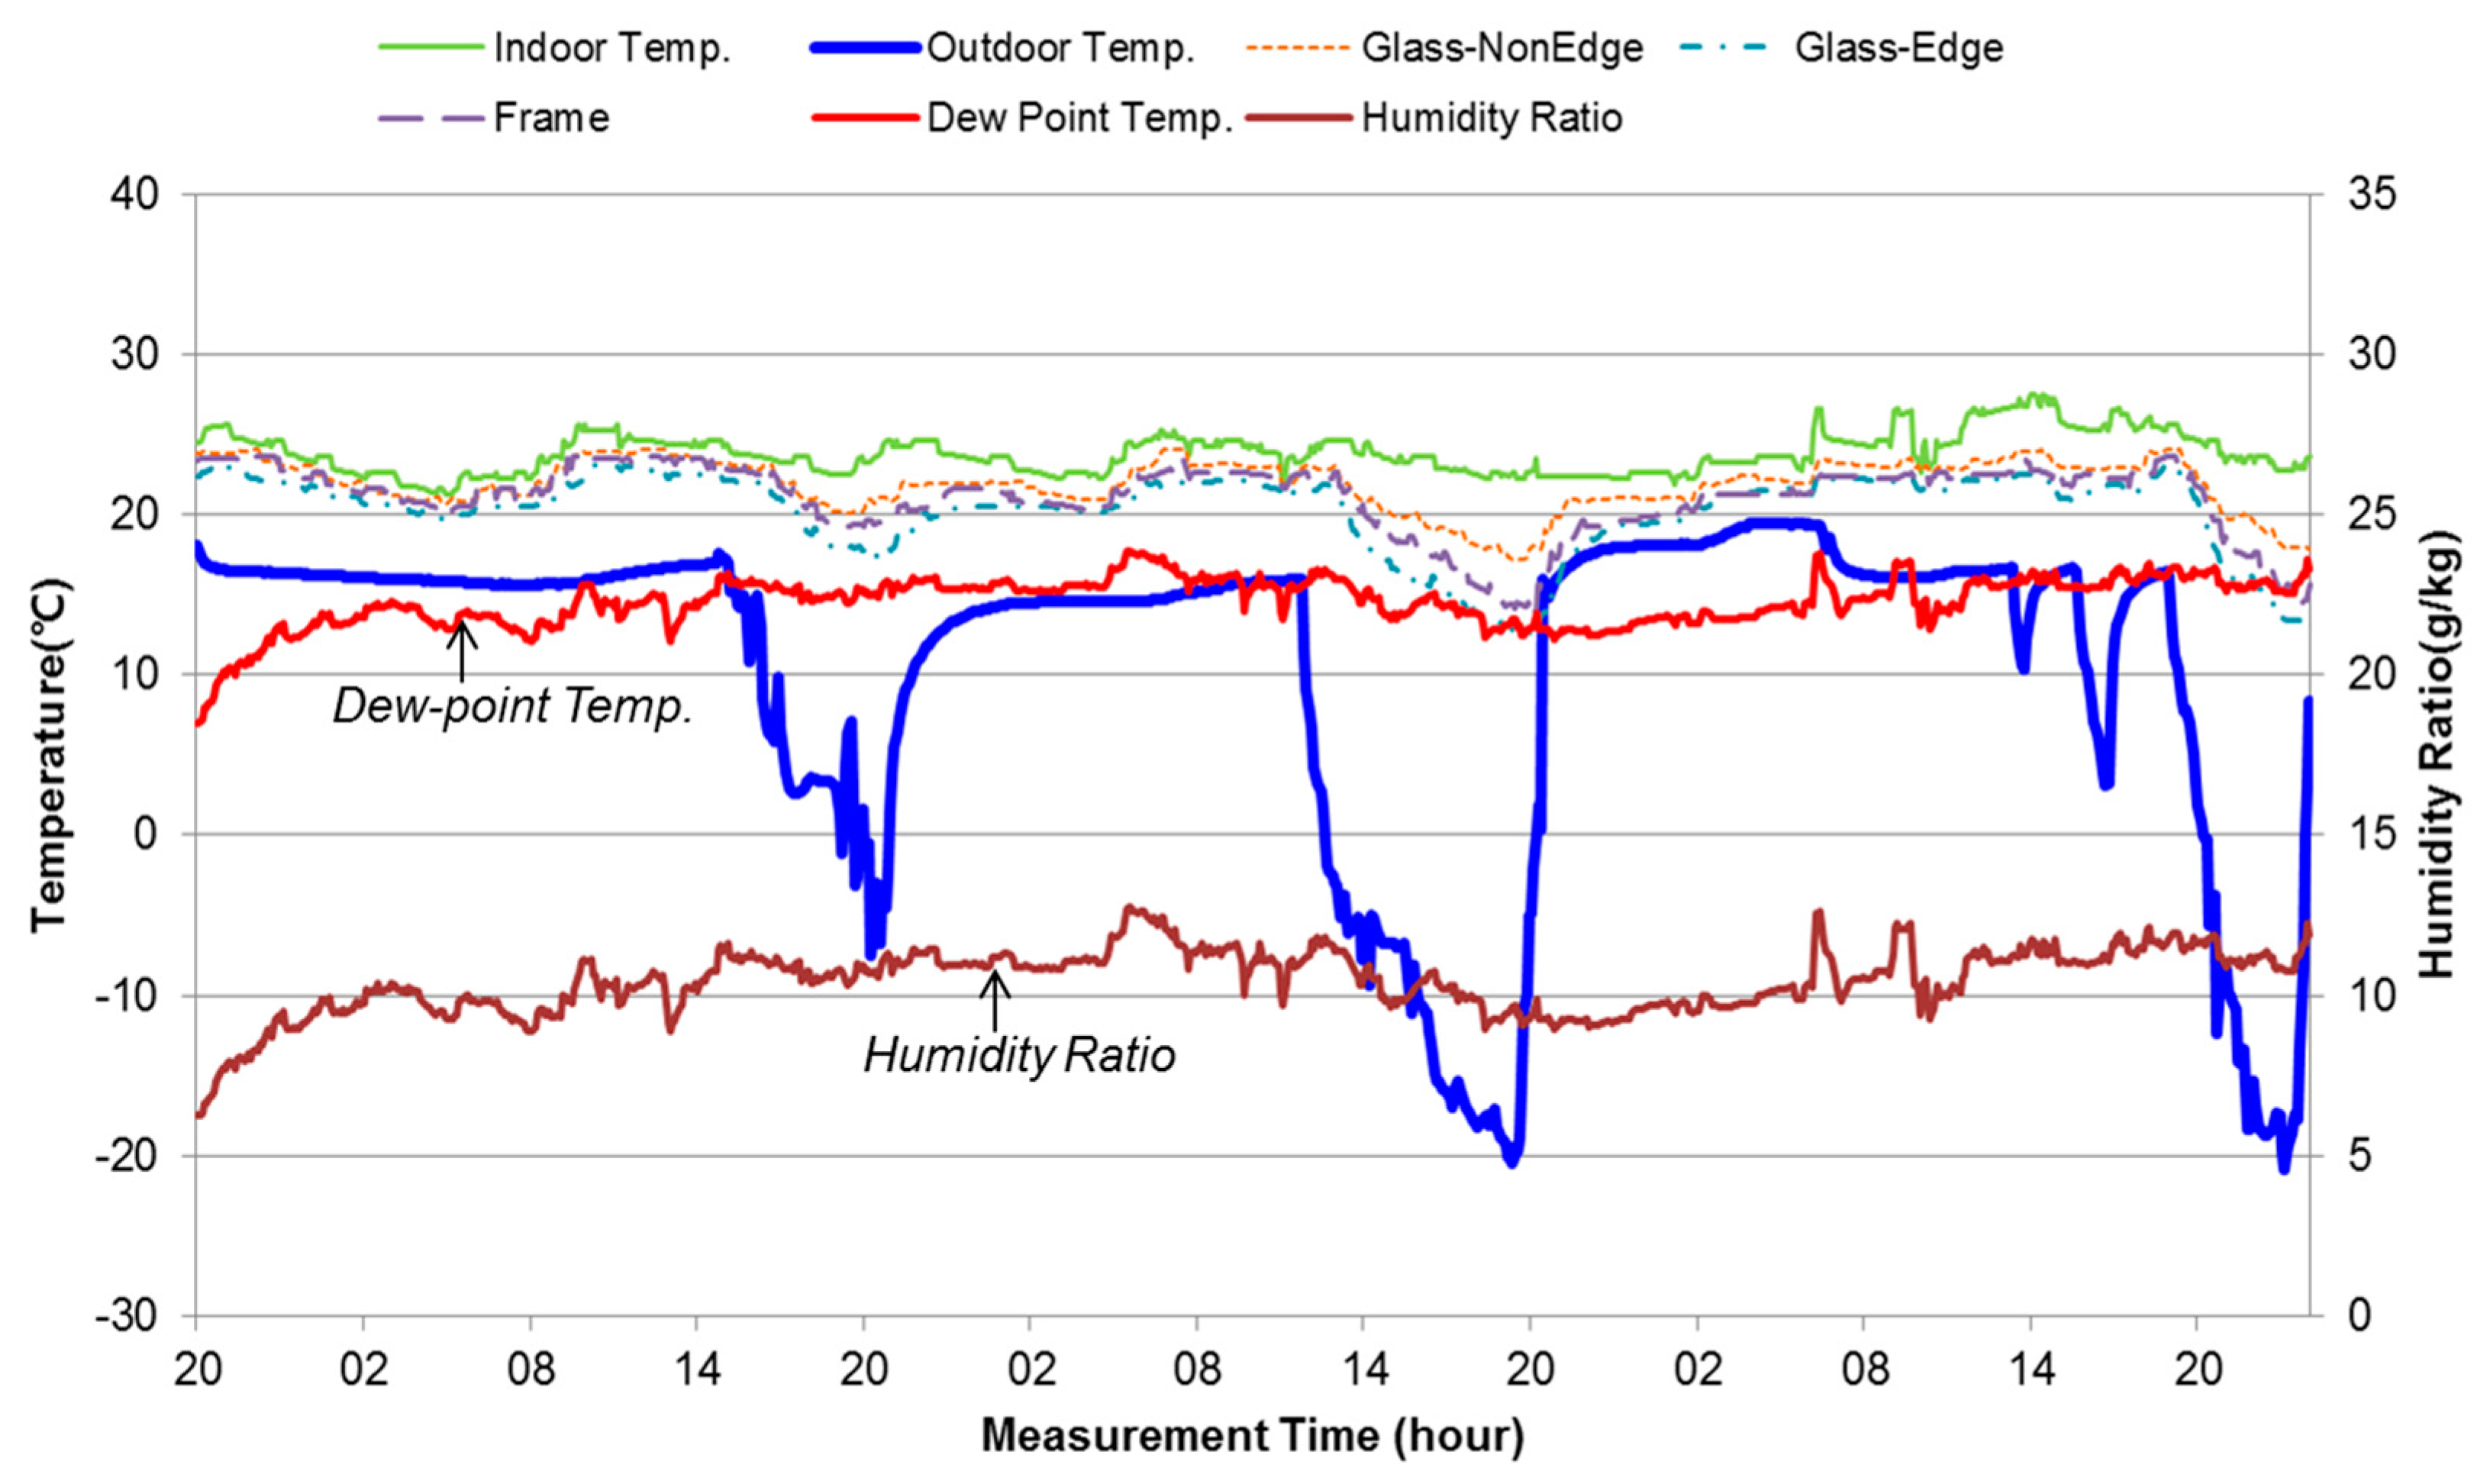
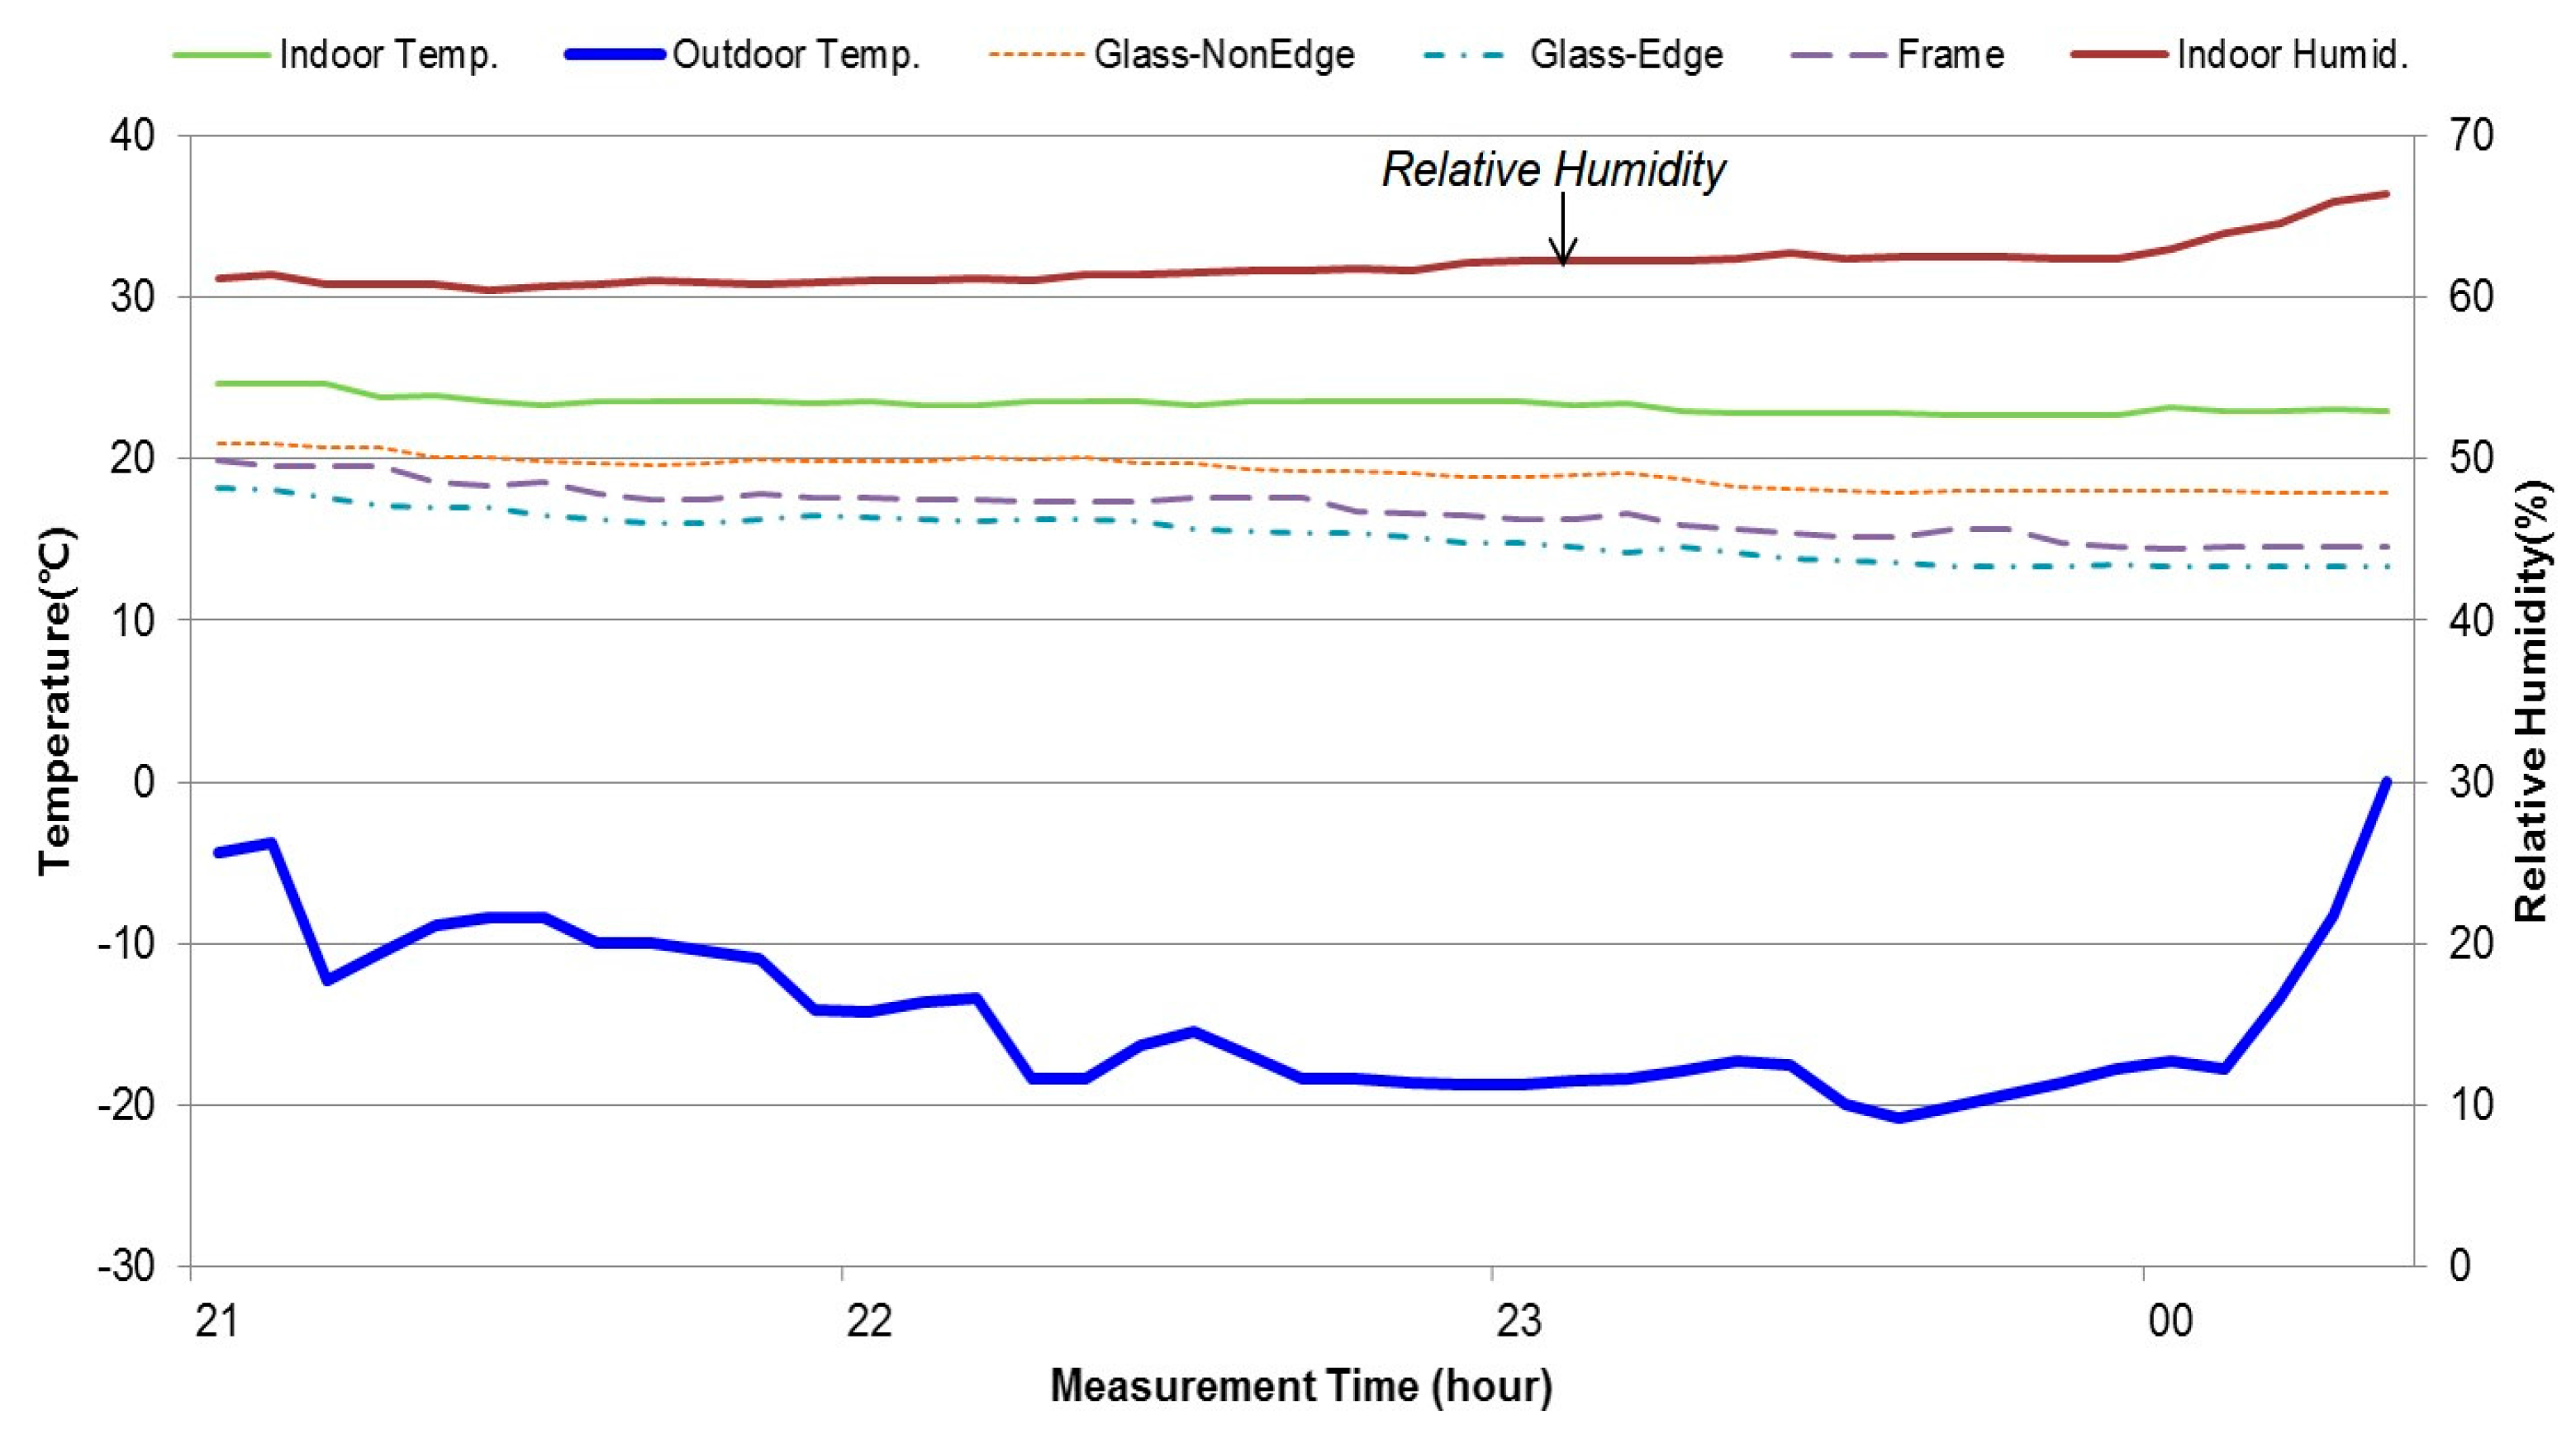
3.1. Measured Temperature and Relative Humidity

The measured time responses of temperature and humidity in the living room of the full-scale apartment building are presented in Figure 5. In addition, the temperatures of the chamber in the balcony were plotted.
Note that the initial levels of humidity and temperature in the living room were 6.2 gw/kgda and 22 °C, respectively, and the temperature in the chamber was 15 °C on the first day of measurement. On the second day, the temperature in the living room was maintained at 23.5 °C and the humidity level was increased using small humidifiers and was maintained within the range from 6.2 to 12.6 gw/kgda. For the chamber, the temperature was decreased gradually and reached −9 °C by releasing liquid nitrogen on the second day. On the third day, the condensation on the interior surface was observed, which decreased the temperature in the chamber from −9 °C to −20 °C from 16 h to 21 h. Moreover, increasing the humidity level in the living room, the occurrence of condensation on the interior glass was monitored from 23 h to 24 h in the fourth day of measurement.

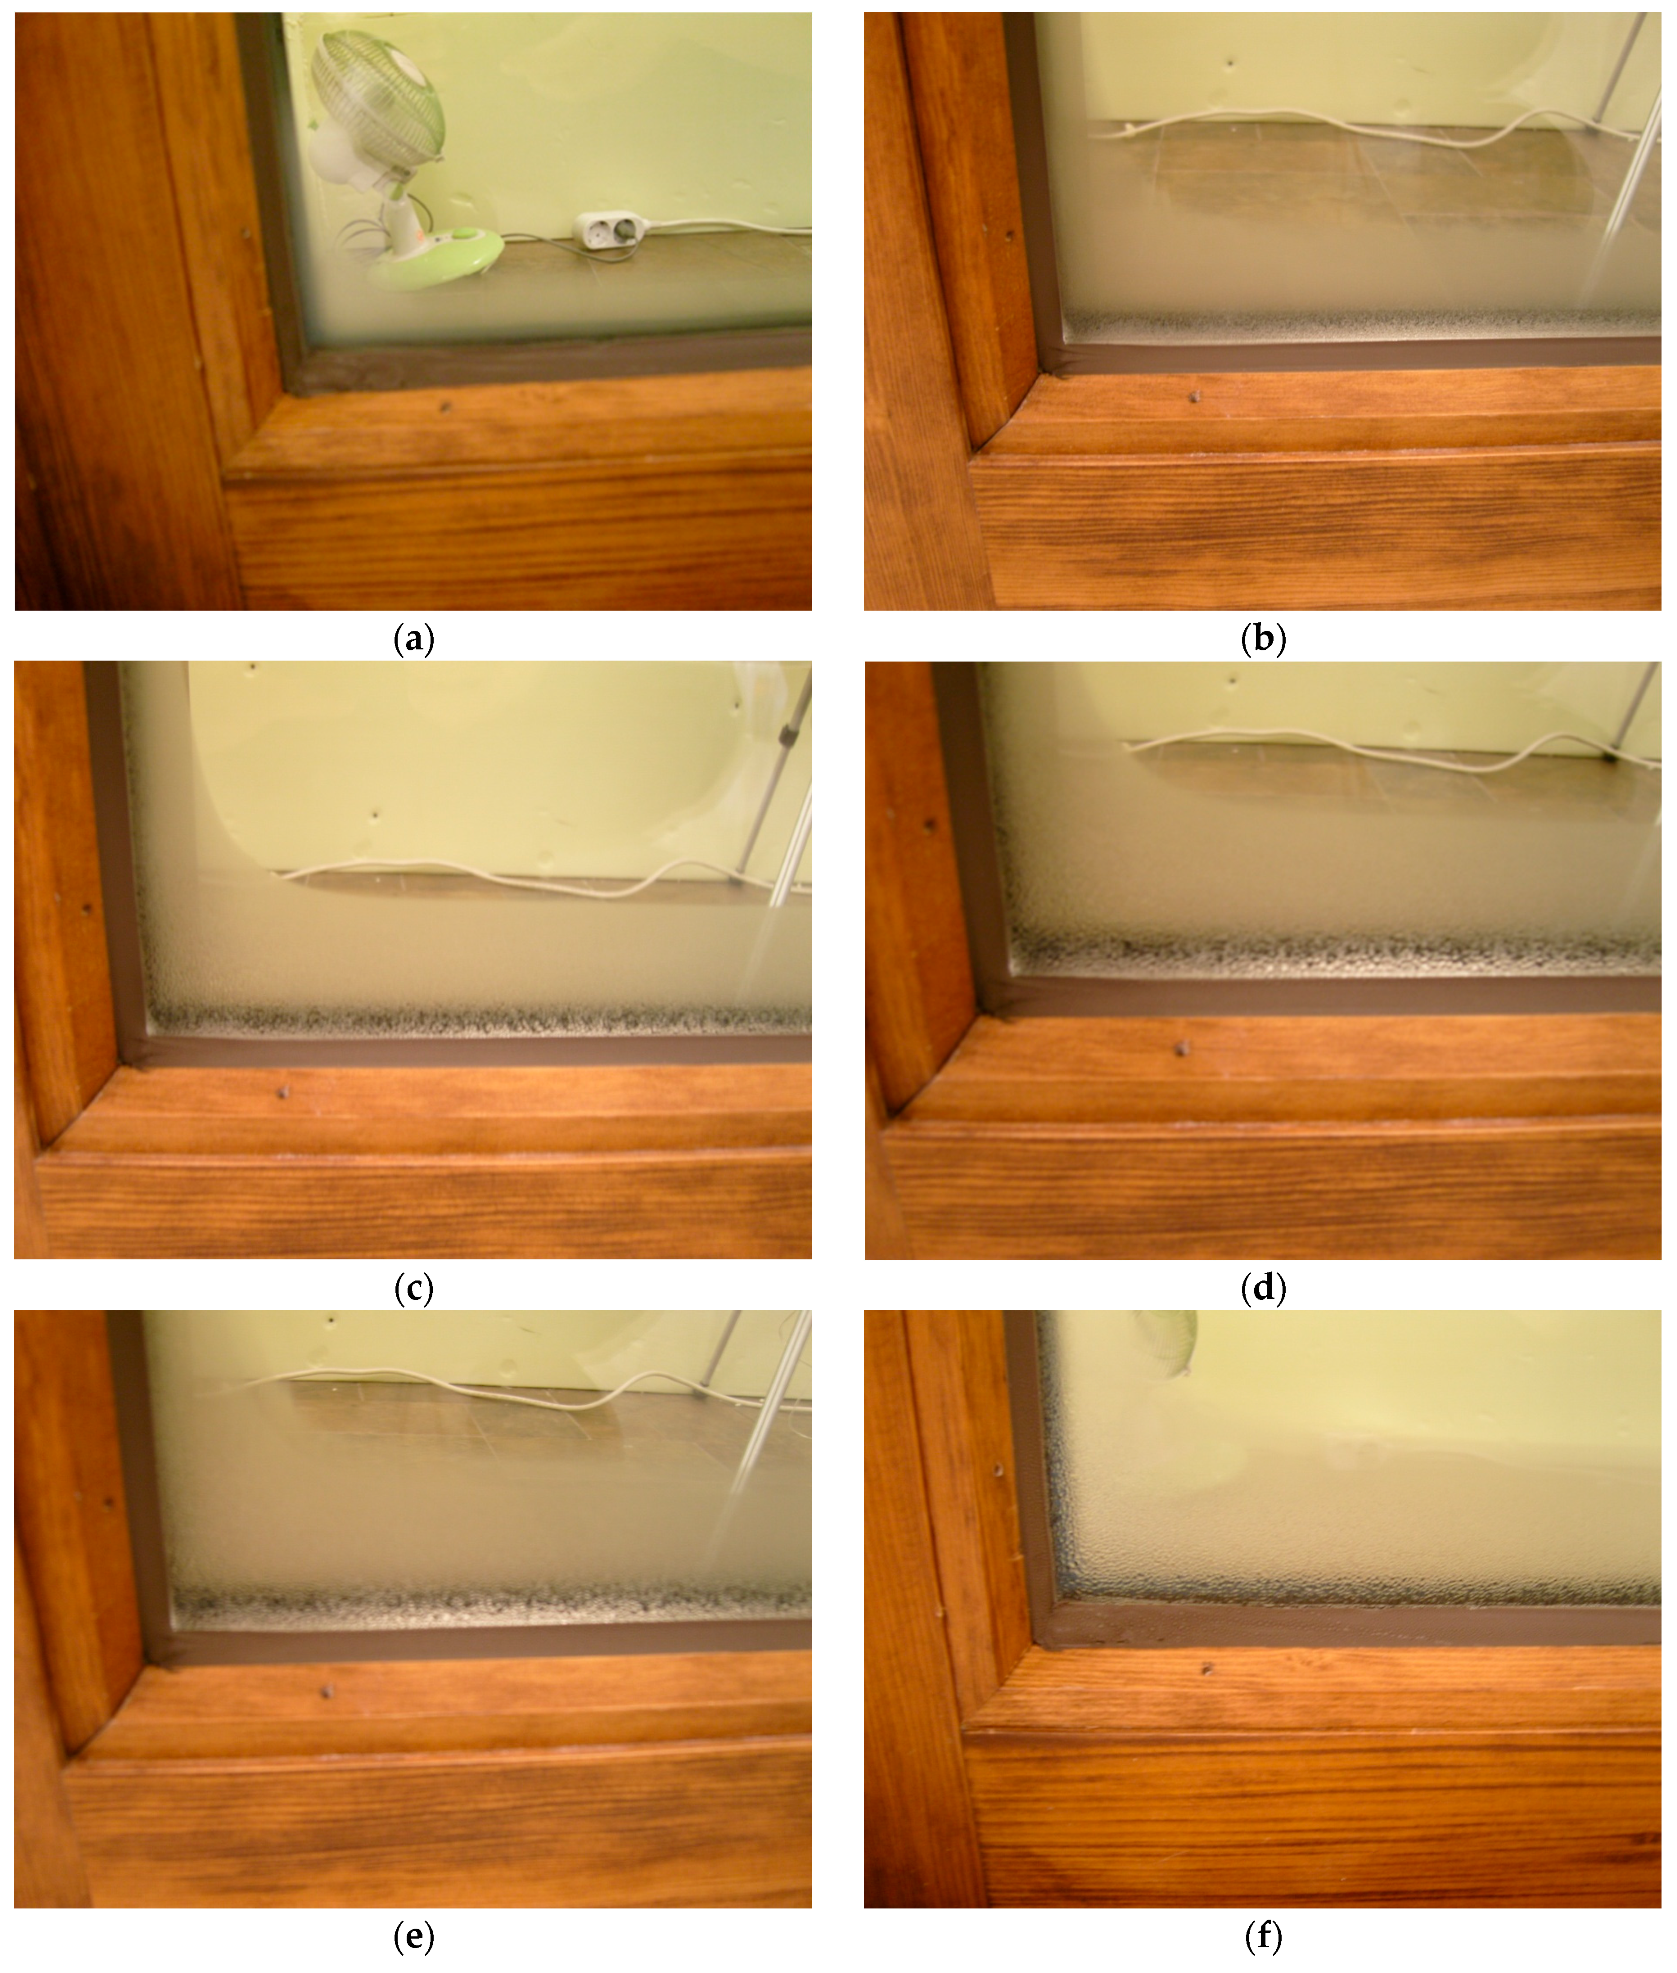
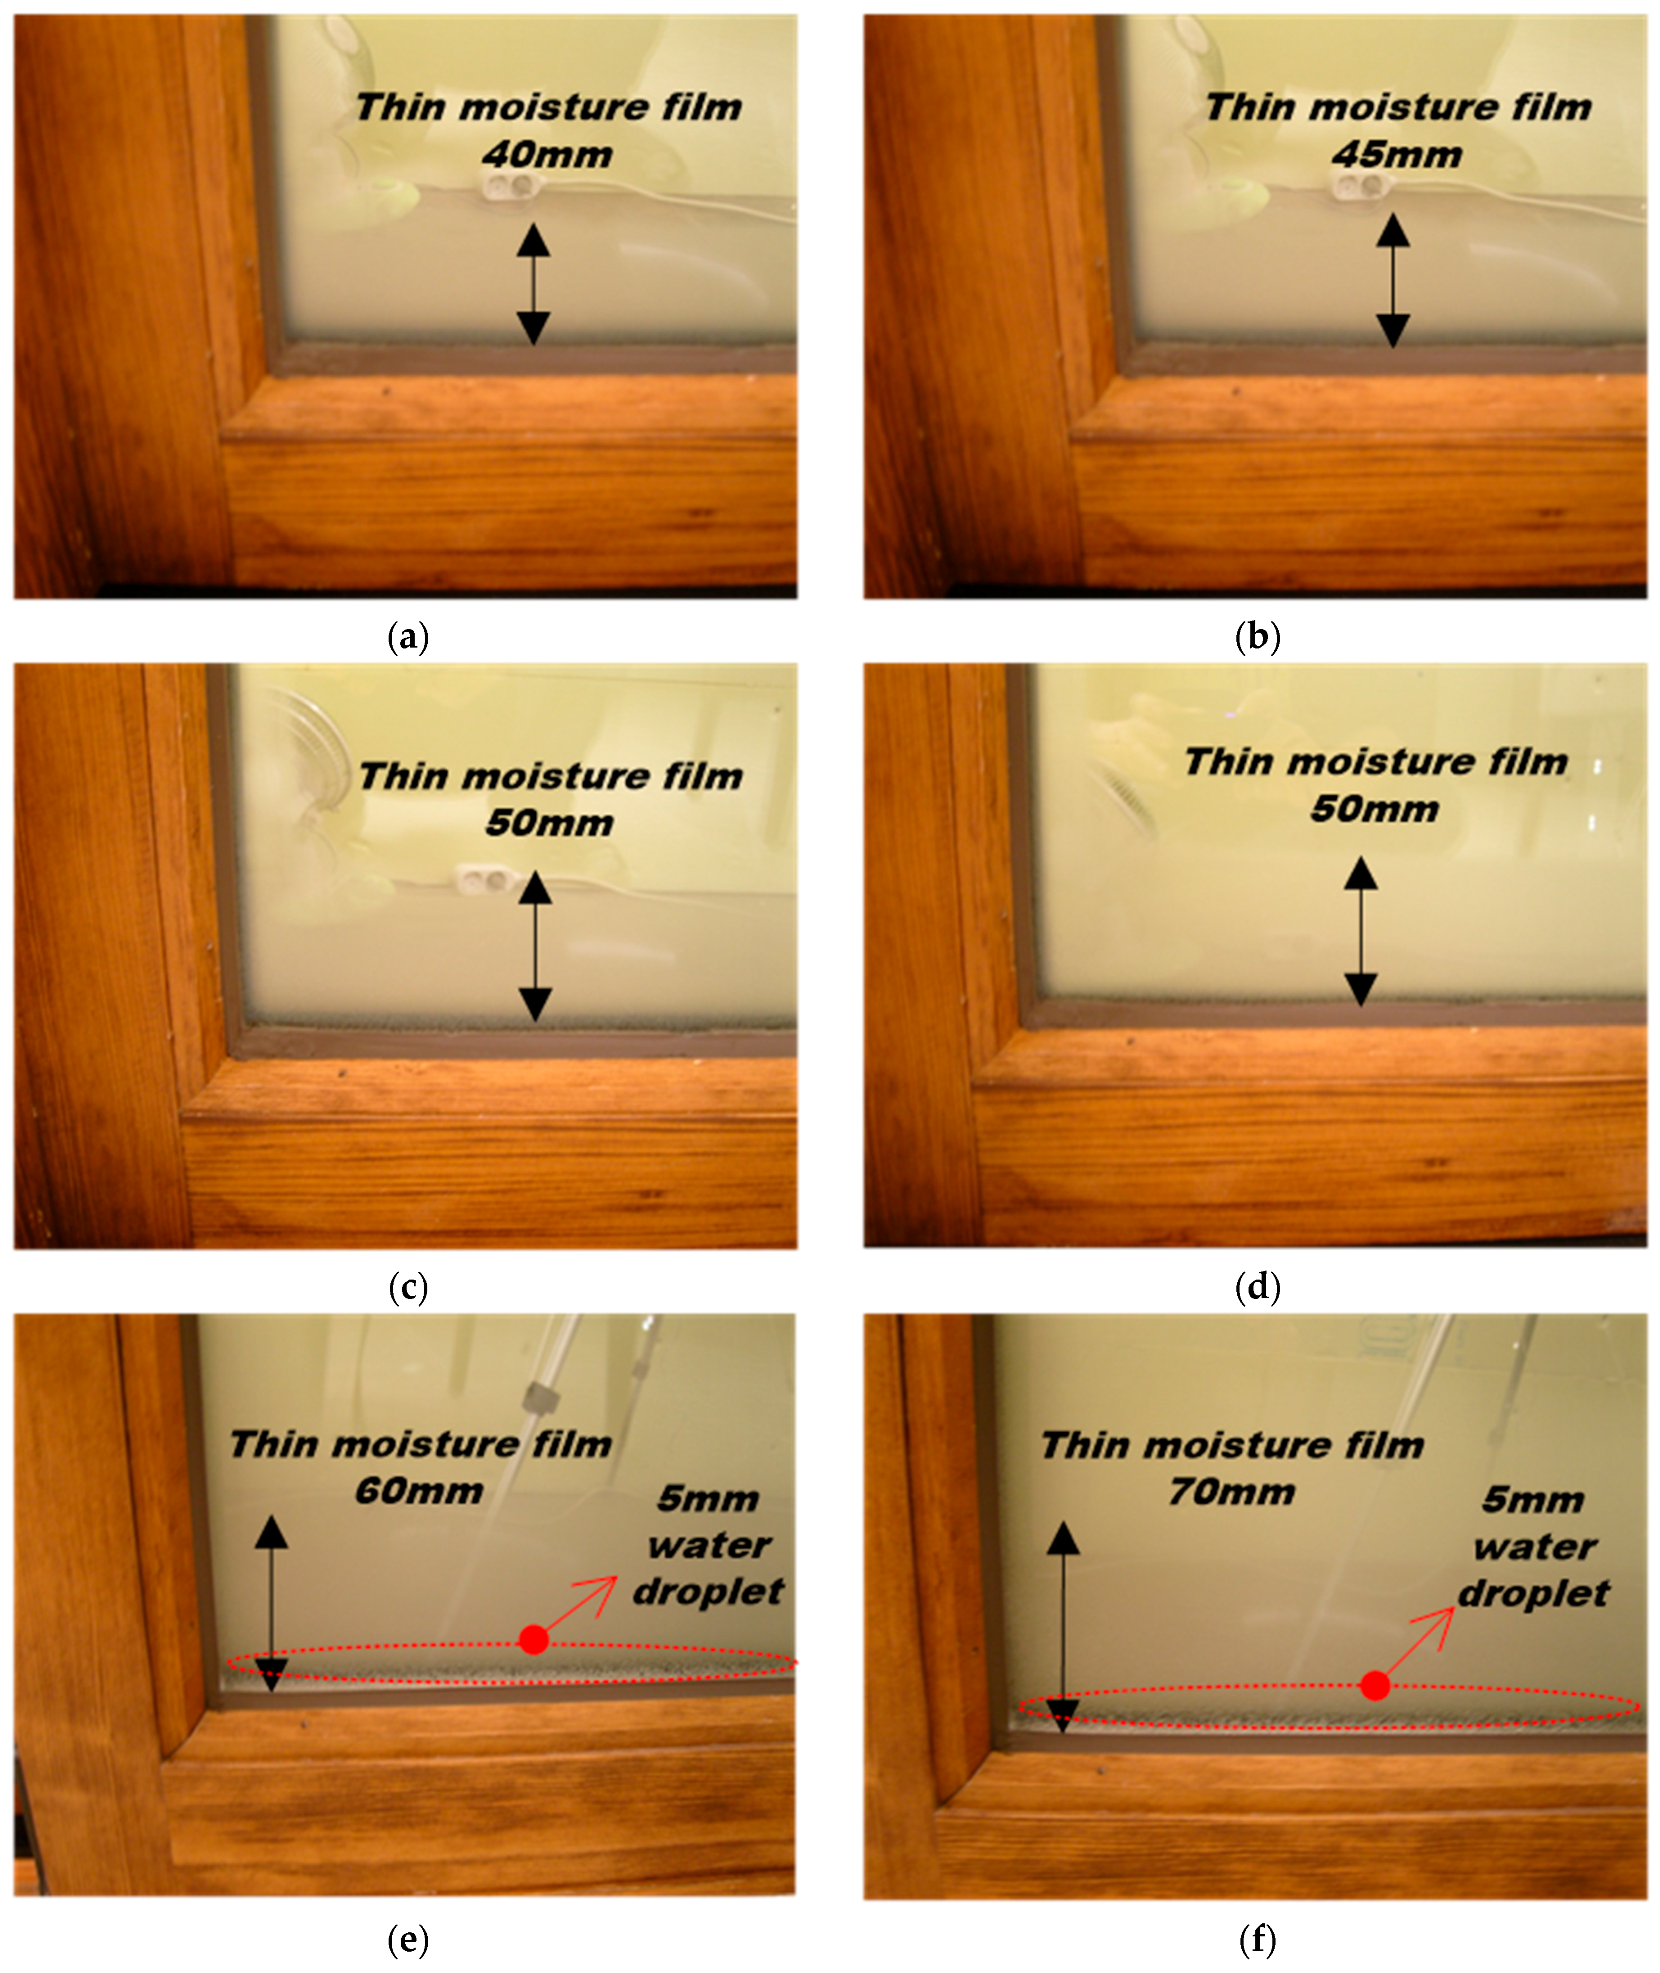
3.2. Occurrence of Condensation under the Various Temperature Conditions in the Chamber

As can be seen in Figure 6, the temperature in the chamber was decreased gradually from −5 °C at 14 h to −9 °C at 16 h and it reached −15 °C at approximately 17 h. In the living room, the temperature was set at 23.5 °C but it was decreased to 1 °C as the temperature in the chamber was decreased.
Table 4 shows the interior surface temperature on the glass according to the variation of the temperature in the chamber. It can be seen that the temperature on the glass-edge was the lowest among the three surface temperatures on the interior surface of the window, when the temperature in the chamber was approximately −20 °C. The temperature on the glass was 2 °C to 3 °C higher than that on the frame and 4 °C to 5 °C higher than that on the glass-edge.
The occurrence of condensation on the interior surface of the glass was observed at −15 °C, −18 °C, and −20 °C and each temperature was maintained for at least an hour. Figure 7 presents the pictures taken during the experiment of the occurrence of condensation on the interior surface of the window through the effect of the temperature variations in the chamber. As shown in Figure 7a, the moisture started to condense when the temperatures of the glass edge and living room were 14.6 °C and 23.2 °C, respectively, and the humidity of the living room was 57%.
From the glass edge, a thin moisture film was formed and the length of the film is approximately 15 mm. As the temperature of the chamber was decreased from −15 °C to −15.6 °C, the moisture turned into water droplets from 18 h. In addition, Figure 7c,d clearly show water drops on the interior glass surface when the temperature of the chamber was maintained at −18 °C from 19 h to 20 h, while the temperature and humidity in the living room remained in the range of 22.5 °C to 22.6 °C and 55% to 57%, respectively. When the temperature of the chamber decreased to −20 °C, water droplets of approximately 10 mm in length were clearly observed on the interior glass surface and the length of the thin moisture film increased to 40 mm (Figure 7e,f).

3.3. Occurrence of Condensation with the Increased Indoor Humidity

From 21 h to 24 h on the last day of measurement (Figure 8), the temperature in the living room was maintained to within the range of from 23 °C to 23.5 °C with the increase of humidity from 61% to 63%. In addition, the temperature ranges on the glass, the glass-edge, and the frame were 18 °C to 19 °C, 12.5 °C to 13.5 °C, and 14.6 °C to 16.6 °C, respectively, while the temperature in the chamber was maintained to below −18 °C. The occurrence of condensation on the interior glass surface was observed when the temperature of −18 °C was maintained in the chamber for 2 h from 22 h.
Figure 9 shows the occurrences of condensation on the interior glass surface every 15 min from 23 h. As can be seen in Figure 9a, a thin moisture film on the interior glass surface was also created when the temperature of the chamber was −17.7 °C and the temperature and humidity in the living room were 23.4 °C and 61%, respectively. The length of the thin moisture film from the glass-edge was approximately 40 mm. As the temperature in the chamber falls to −18 °C, the length of the thin moisture film from the glass-edge increased to 50 mm (Figure 9c). The water droplets begin to form on the interior surface at approximately 24 h, as shown in Figure 9e.

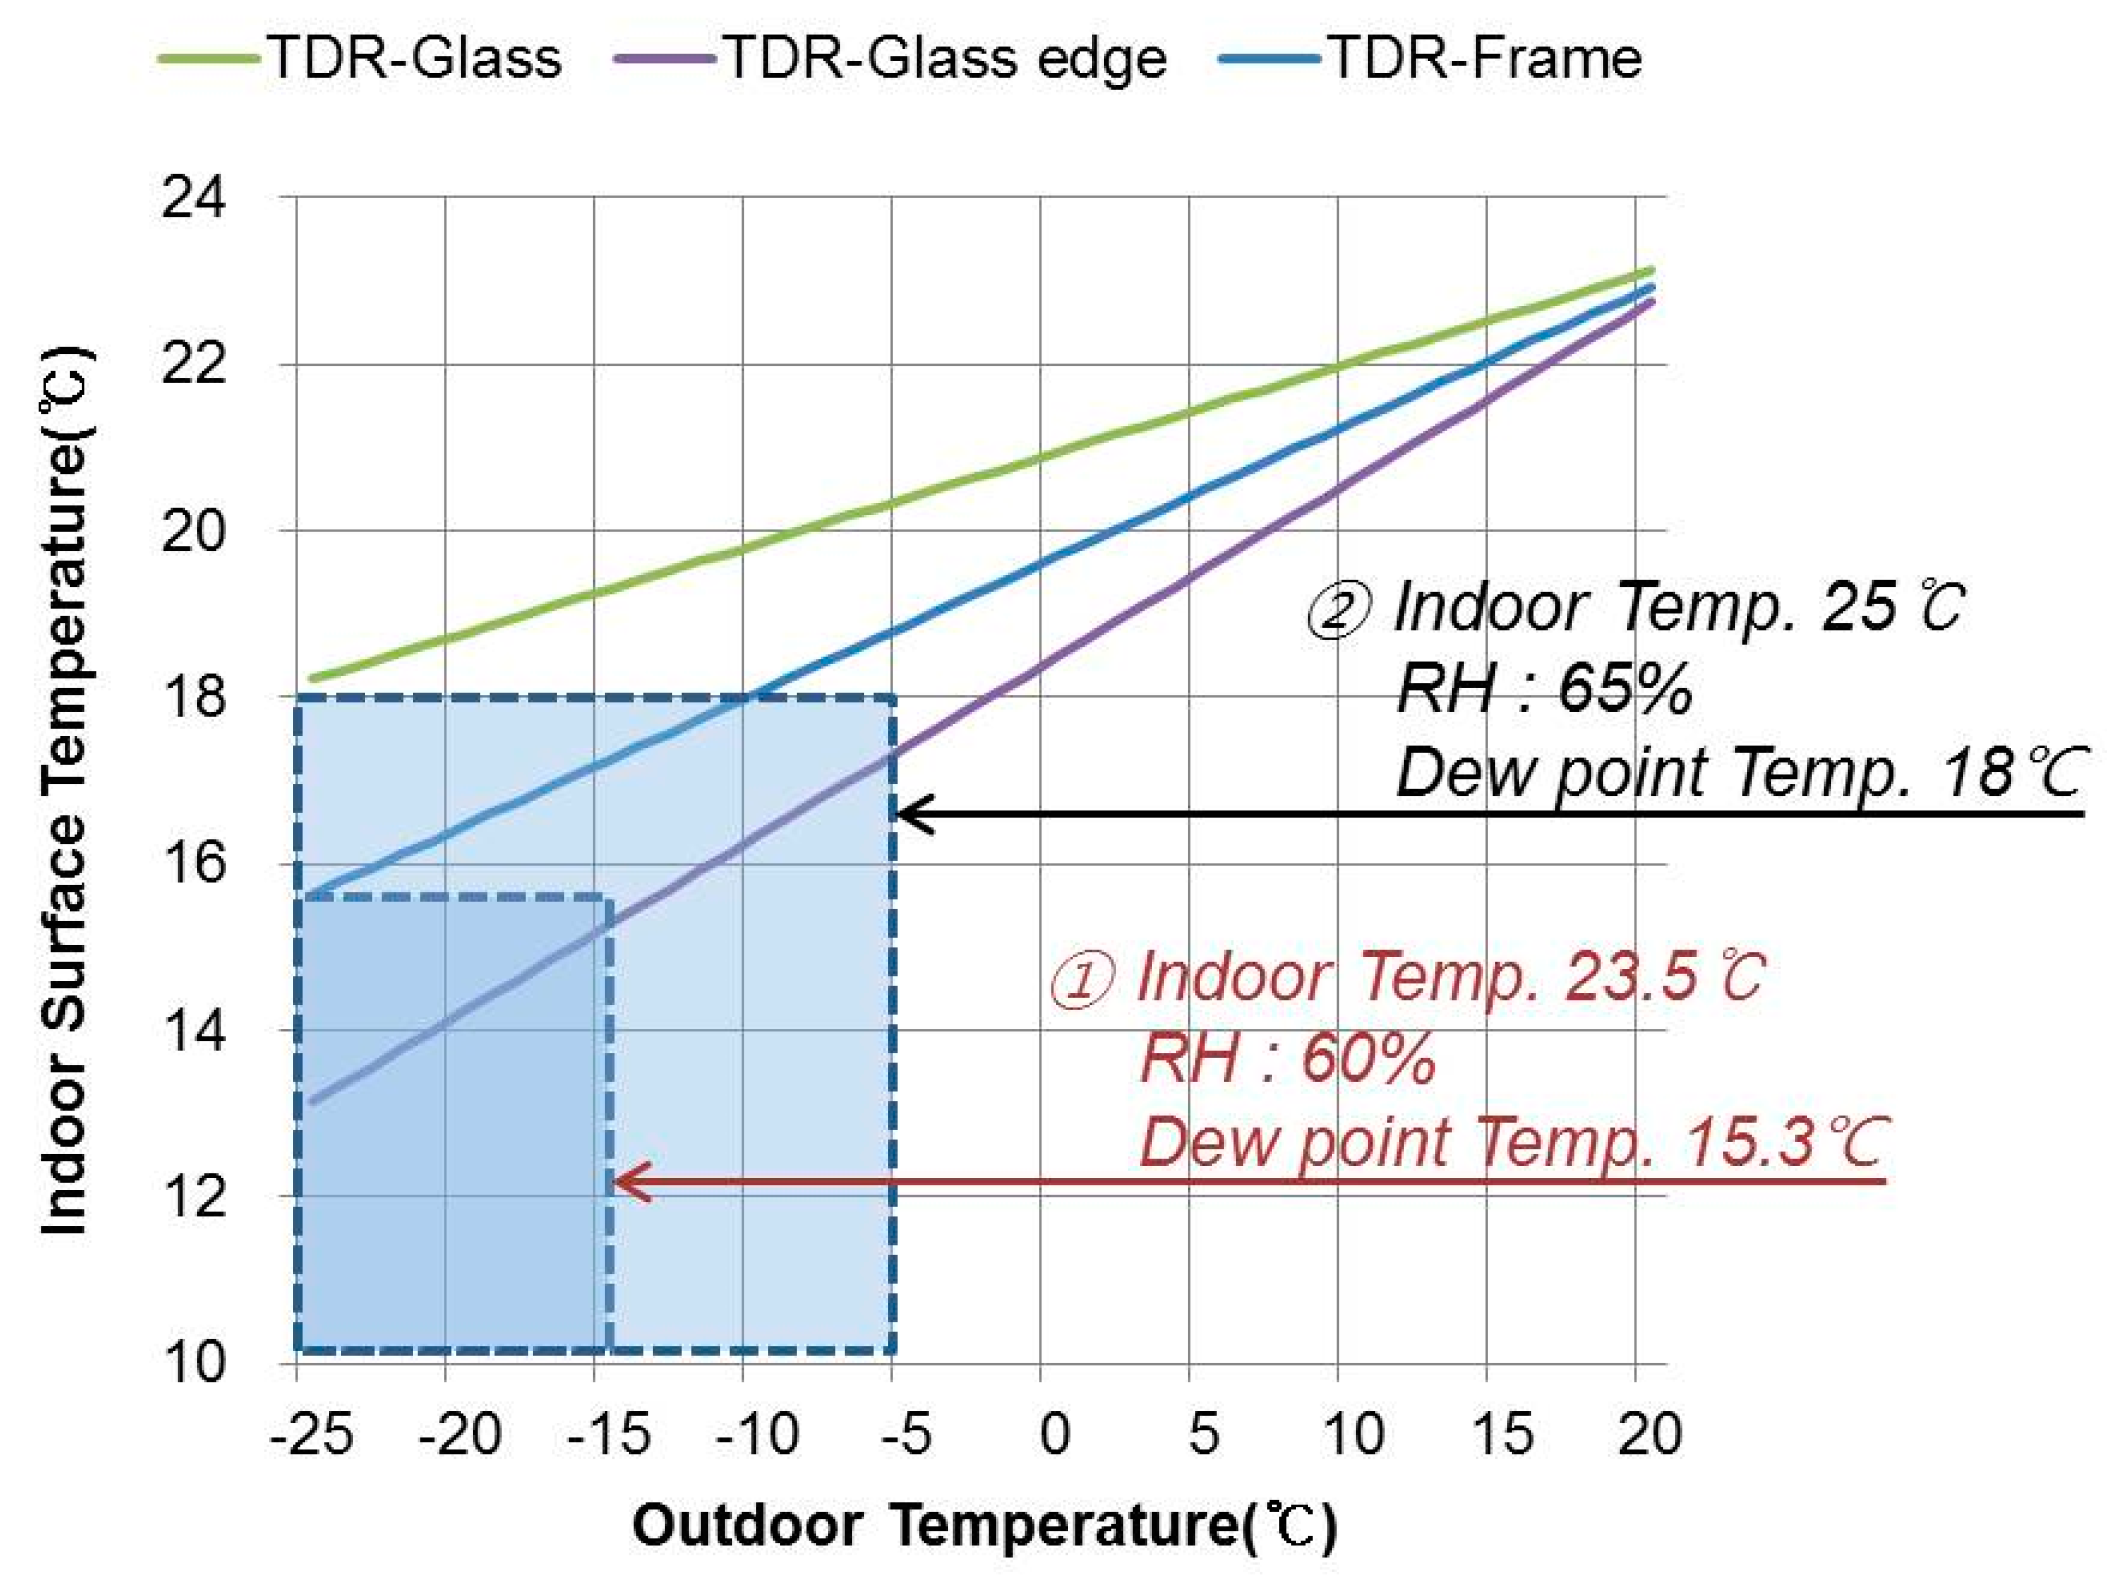
3.4. Estimation of the Occurrence of Condensation through TDR Analysis

The Temperature Difference Ratio (TDR), a ratio of the temperature difference between the indoor and indoor surfaces to the temperature difference between the indoor and outdoor, is a dimensionless number and the value of TDR is obtained from 0 to 1. Note that the thermal resistance of the glazing is increased, where the value of TDR is close to 0. On the other hand, the thermal resistance can be decreased, where the TDR reaches 1. TDR can be calculated using the following Equation (1):
TDR = T i T i s T i T o
where TDR = temperature difference ratio; Ti = indoor temperature (°C); To = outdoor temperature (°C); Tis = indoor surface temperature (°C).
In this study, the values of TDR were obtained using the measurement temperature data on the glass, glass-edge, and frame as shown in Figure 10 during the third day of measurement. Thus, the average values of TDR on the glass, glass-edge, and the frame were 0.11, 0.21, and 0.16 for various temperatures in the chamber.
Figure 11 shows the indoor surface temperature and the outdoor temperature through the average values of TDR for the three locations, whereby condensation occurs when the indoor humidity and temperature change. Note that the dew-point temperature was 15.3 °C, where the indoor temperature and humidity were 23.5 °C and 60%, respectively. In the case 1, the temperature on the glass-edge was below 15.3 °C and the condensation on the glass-edge occurs when the temperature in the chamber was below −14.5 °C. In addition to the case 2, the condensation occurs where the indoor surface temperature drops below 18°C with indoor temperature of 25 °C and relative humidity of 60%. In this case, the condensation occurs on the frame and the glass-edge if outdoor temperature falls below −10 °C and −5 °C, respectively, while this temperature condition cannot create the condensation on the glass. Therefore, the results achieved from the TDR calculations showed the interactions between indoor and outdoor thermal conditions and can predict the occurrence of condensation on a window system.

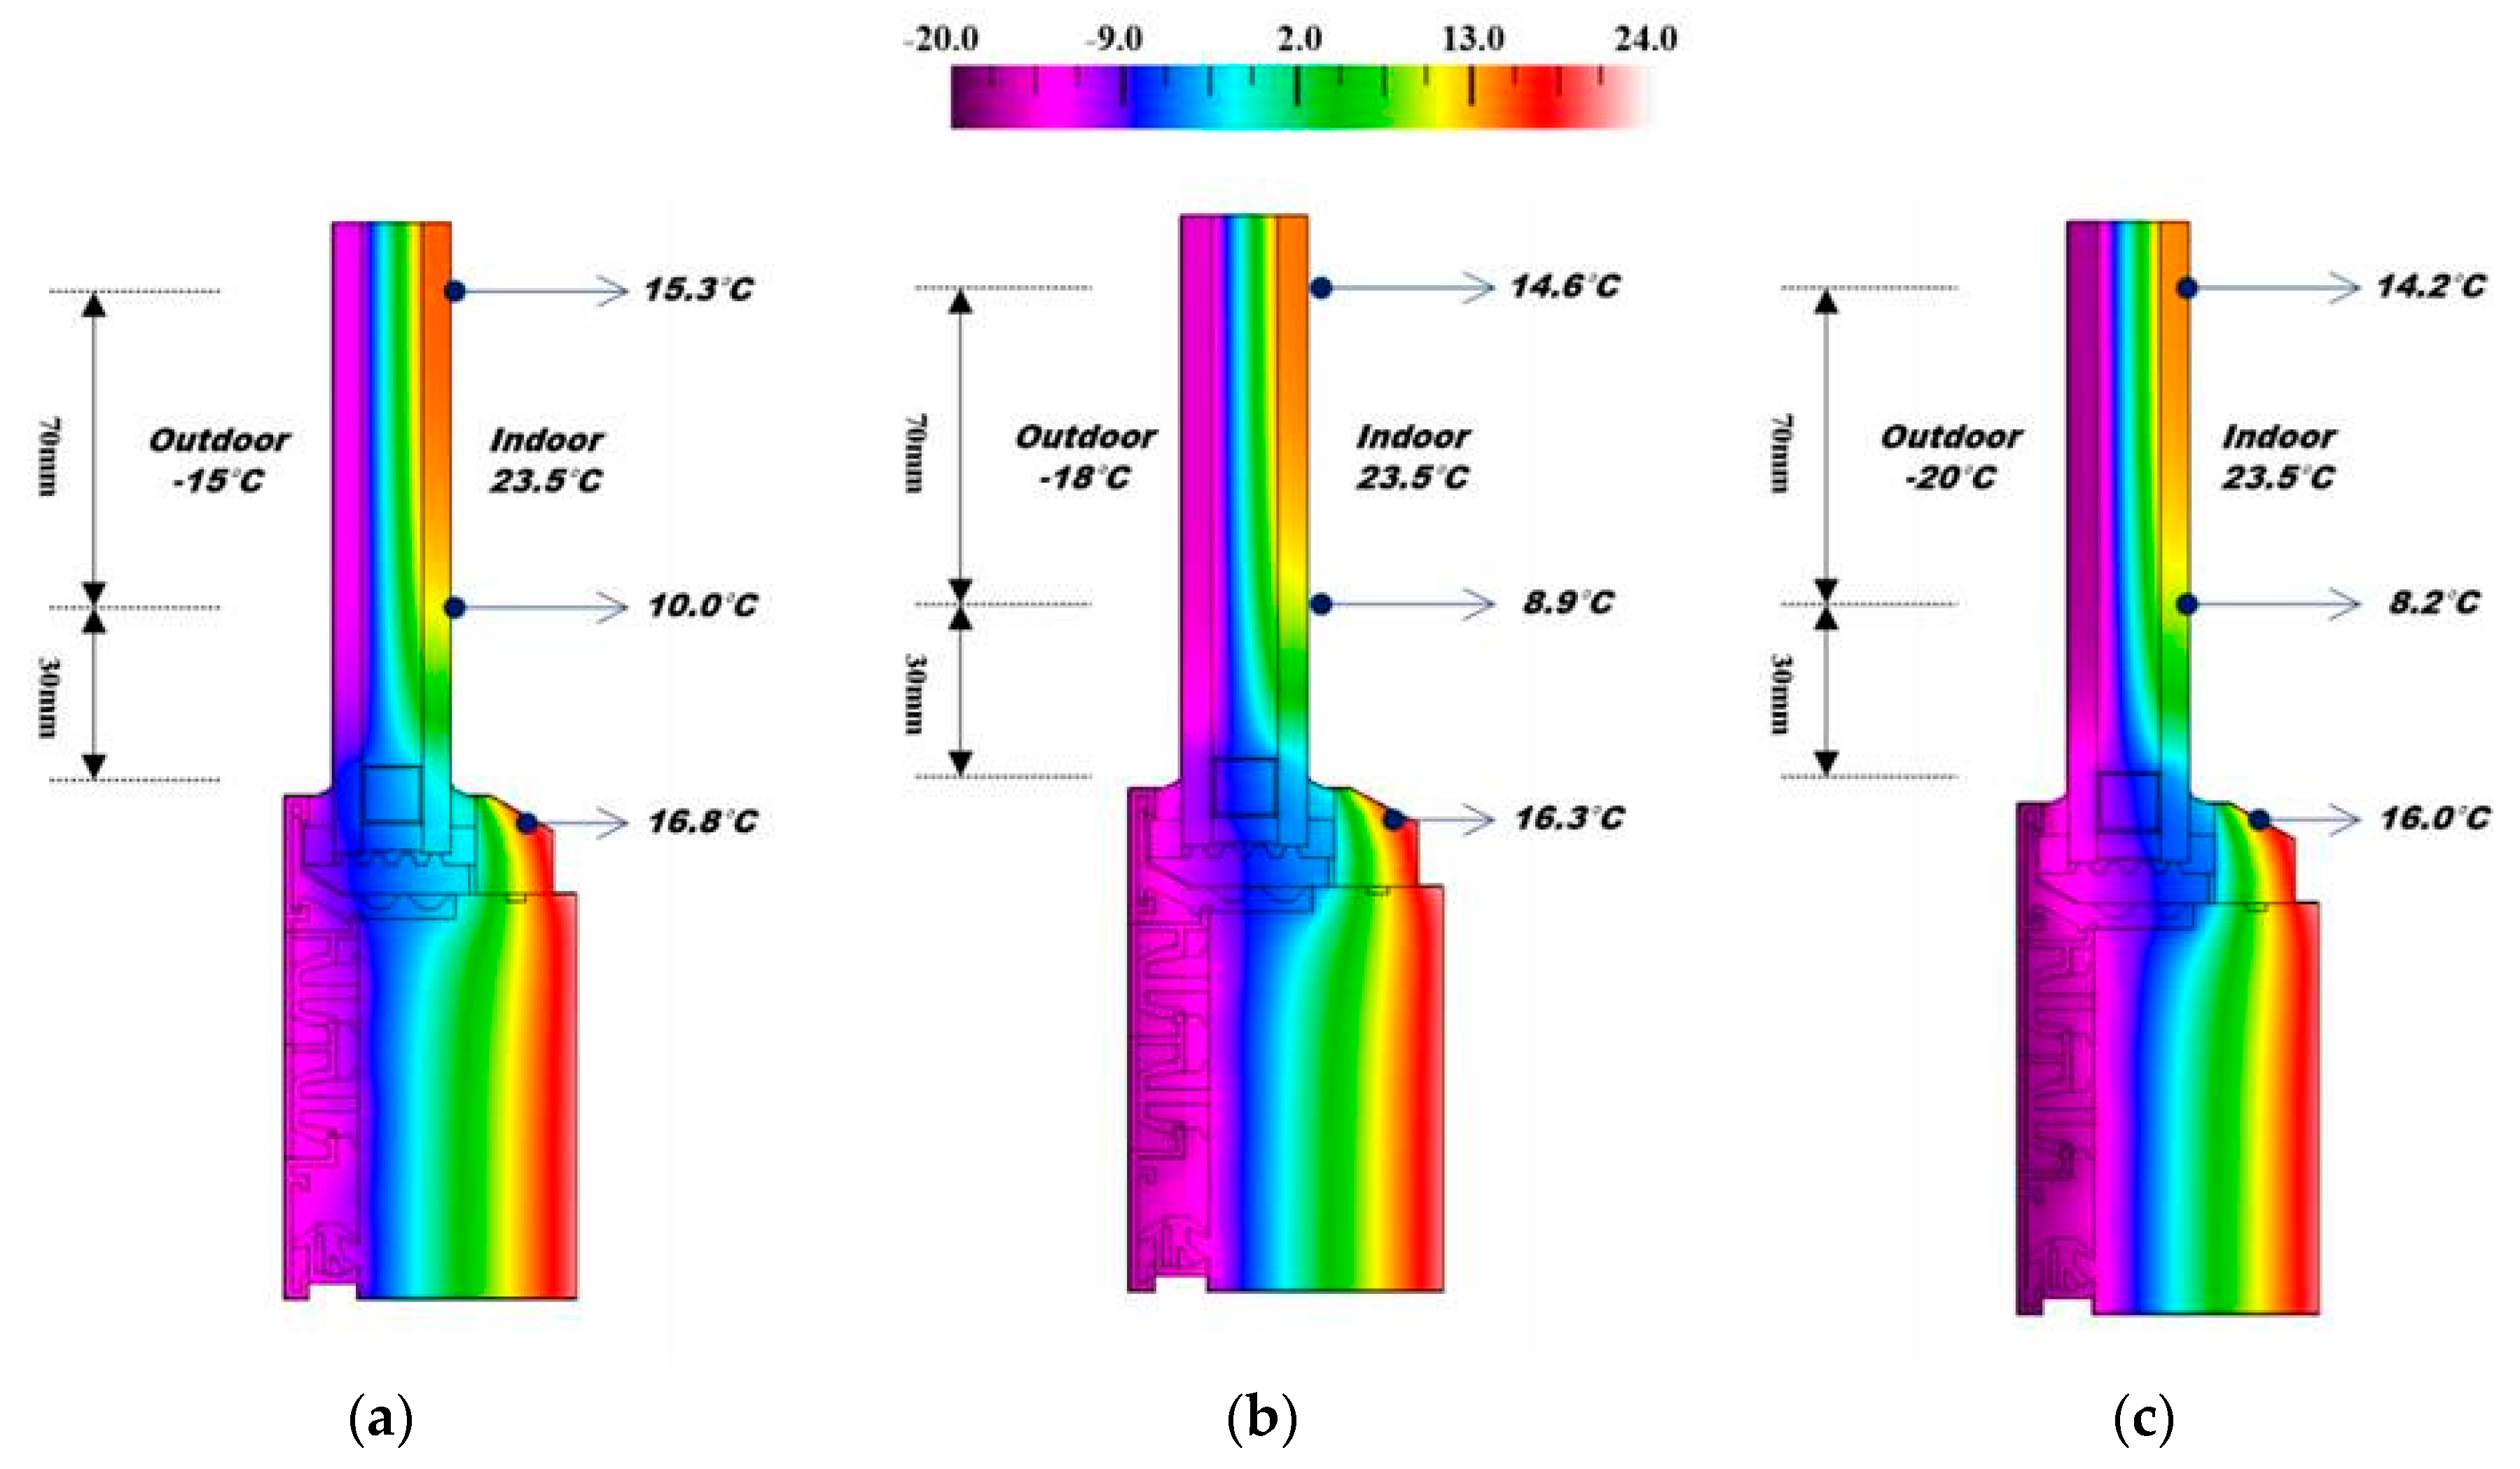
3.5. Simulation Results with the Window System and Various Spacers

Figure 12 presents the temperature distributions on the interior surface of the window systems with various outdoor temperatures of −15 °C, −18 °C, and −20 °C. At the interior glass surface, the temperatures on the glass, glass edge, and frame were observed. The interior temperatures on the glass were measured as 15.3 °C, 14.6 °C, and 14.2 °C when the outdoor temperatures were −15 °C, −18 °C, and −20 °C, respectively. The temperatures at the frame were 16.8 °C, 16.3 °C, and 16.0 °C when the outdoor temperatures were −15 °C, −18 °C, and −20 °C, respectively. At the glass edge, the lowest temperatures were observed among these three locations. With the outdoor temperature of −20 °C, the interior temperature on the edge reached 8.2 °C. The other two cases were 10 °C and 8.9 °C with the outdoor temperatures of −15 °C and −18 °C, respectively. The comparisons of measured and simulated data are presented in Table 5.
According to Table 5, it showed the large temperature difference on the glass-edge between the full-scale measurements and the simulation since it was difficult to maintain the target temperature constantly in the chamber. In addition, this temperature difference was led by the data created from the steady-state simulation conditions and the relatively short period of measurements. While heat was easily transferred through the aluminum frame, the double glazing filled with argon gas delayed heat transfer. In addition, it is clear that the temperature on the glass-edge was the lowest among three locations, where the condensation can be first occurred based on the results of the full-scale measurements and the simulation. A thin moisture film was first created on the glass-edge and it began to form water droplets as the temperature in the chamber was decreased. It can be seen that the glass-edge was highly susceptible to the temperature variations and the lowest temperature on the glass edge was caused by the heat transfer through the spacer, between the two glass panels of the window [26,27].
A previous study was performed for the evaluation of surface condensation with various spacers [4], in which the thermal performances of two insulation spacers were compared with conventional aluminum spacers. The results showed that these insulation spacers were able to prevent inside surface condensation. In the current study, the thermal performances of a conventional aluminum spacer, a thermally broken aluminum spacer, and a thick-walled plastic spacer were compared with that of a stainless-steel spacer by using THERM. The thermal conductivity of the spacers is specified in Table 6.
Figure 13 shows the simulation results of the three spacers under the indoor and outdoor temperature of 23.5 °C and −15 °C and the boundary conditions were shown in Table 3 and Table 6. For the result of the aluminum spacer in Figure 13, the temperature on the glass-edge, the glass, and the frame were 9.1 °C, 15.2 °C and 16.4 °C, respectively. It can be seen that the low temperature on the outside had an influence on the indoor glass-edge and the frame through the aluminum spacer. In the case of the thermally broken aluminum spacer, the temperature on the glass-edge was 3.4 °C greater than that for the aluminum spacer. The temperature on the glass-edge and the frame of the thermally broken aluminum spacer were 12.5 °C and 18.2 °C, respectively. Moreover, the temperature distribution of the thick-walled plastic spacer showed little difference with the thermally broken aluminum spacer. The temperature on the glass-edge and the frame of the thick-walled plastic spacer were 12.6 °C and 18.3 °C, respectively.

4. Conclusions

In this paper, the occurrence of condensation on a window system was observed during field measurements in an apartment building. In order to create the condensation, the thermal performance of the window system was fully controlled in a chamber installed in the balcony of the residential building, while other studies have conducted measurements in the chamber in experimental facility or in buildings under their climatic conditions. By varying the temperatures between −15 °C, −18 °C and −20 °C in the chamber, the occurrence of condensation was observed. A thin moisture film on the glass-edge was formed and turned into water droplets as the temperature in the chamber decreased. When the temperature in the chamber was −15 °C, −18 °C and −20 °C, the temperature on the glass-edge was 14 °C, 12.7 °C and 11.7 °C, respectively. From the analysis of the measurements, it can be seen that the glass-edge is the most susceptible to heat transfer among the other locations including glass and frame. Moreover, this paper also reveals the conditions for the occurrence of condensation in the window system through the TDR analysis under various indoor temperatures, humidity levels, and outdoor temperature conditions. This methodology can be employed to predict the possible occurrence of condensation when the information about outdoor temperature, indoor temperature, and humidity is given. Furthermore, various spacers under the same conditions were investigated using THERM simulation to improve the thermal performance on the window systems. In order to avoid the occurrence of condensation, it is worth investigating and developing super insulated or thermally broken spacers for the control of condensation.

Acknowledgments

We would like to acknowledge the full support provided by Ssangyong Engineering & Construction Co. Ltd of the field measurements, particularly the support by the manager Dukbae Jang and the researcher, Hyundo Jeon. This research was supported by Basic Science Research Program through the National Research Foundation of Korea (NRF) funded by the Ministry of Education (NRF-2015R1D1A1A01057928).

Author Contributions

Goopyo Hong designed and performed the experiments and simulation. Daeung Dany Kim wrote the manuscript. Byungseon Sean Kim supervised the study and provided advice on the data analysis.

Conflicts of Interest

The authors declare no conflict of interest.

References

  1. Manz, H. Total solar energy transmittance of glass double façades with free convection. Energy Build. 2004, 36, 127–136. [Google Scholar] [CrossRef]
  2. Goia, F.; Time, B.; Gustavsen, A. Impact of Opaque Building Envelope Configuration on the Heating and Cooling Energy Need of a Single Family House in Cold Climates. Energy Procedia 2015, 78, 2626–2631. [Google Scholar] [CrossRef] [Green Version]
  3. Ferdyn-Grygierek, J. Indoor environment quality in the museum building and its effect on heating and cooling demand. Energy Build. 2014, 85, 32–44. [Google Scholar] [CrossRef]
  4. Song, S.-Y.; Jo, J.-H.; Yeo, M.-S.; Kim, Y.-D.; Song, K.-D. Evaluation of inside surface condensation in double glazing window system with insulation spacer: A case study of residential complex. Build. Environ. 2007, 42, 940–950. [Google Scholar] [CrossRef]
  5. Yoo, S.; Jeong, H.; Ahn, B.-L.; Han, H.; Seo, D.; Lee, J.; Jang, C.-Y. Thermal transmittance of window systems and effects on building heating energy use and energy efficiency ratings in South Korea. Energy Build. 2013, 67, 236–244. [Google Scholar] [CrossRef]
  6. Li, C.; Tan, J.; Chow, T.-T.; Qiu, Z. Experimental and theoretical study on the effect of window films on building energy consumption. Energy Build. 2015, 102, 129–138. [Google Scholar] [CrossRef]
  7. Kucukpinar, E.; Miesbauer, O.; Carmi, Y.; Fricke, M.; Gullberg, L.; Erkey, C.; Caps, R.; Rochefort, M.; Moreno, A.G.; Delgado, C.; et al. Development of Transparent and Opaque Vacuum Insulation Panels for Energy Efficient Buildings. Energy Procedia 2015, 78, 412–417. [Google Scholar] [CrossRef]
  8. Lolli, N.; Andresen, I. Aerogel vs. argon insulation in windows: A greenhouse gas emissions analysis. Build. Environ. 2016, 101, 64–76. [Google Scholar] [CrossRef]
  9. Kim, S.-H.; Kim, S.-S.; Kim, K.-W.; Cho, Y.-H. A study on the proposes of energy analysis indicator by the window elements of office buildings in Korea. Energy Build. 2014, 73, 153–165. [Google Scholar] [CrossRef]
  10. Hassouneh, K.; Alshboul, A.; Al-Salaymeh, A. Influence of windows on the energy balance of apartment buildings in Amman. Energy Convers. Manag. 2010, 51, 1583–1591. [Google Scholar] [CrossRef]
  11. Alawadhi, E.M. Effect of an incompletely closed window shutter on indoor illuminance level and heat gain. Energy Build. 2016, 110, 112–119. [Google Scholar] [CrossRef]
  12. Gao, T.; Ihara, T.; Grynning, S.; Jelle, B.P.; Lien, A.G. Perspective of aerogel glazings in energy efficient buildings. Build. Environ. 2016, 95, 405–413. [Google Scholar] [CrossRef]
  13. Moon, H.J.; Ryu, S.H.; Kim, J.T. The effect of moisture transportation on energy efficiency and IAQ in residential buildings. Energy Build. 2014, 75, 439–446. [Google Scholar] [CrossRef]
  14. Bellia, L.; Minichiello, F. A simple evaluator of building envelope moisture condensation according to an European Standard. Build. Environ. 2003, 38, 457–468. [Google Scholar] [CrossRef]
  15. Kim, J.; Kim, T.; Leigh, S.-B. Double window system with ventilation slits to prevent window surface condensation in residential buildings. Energy Build. 2011, 43, 3120–3130. [Google Scholar] [CrossRef]
  16. Park, S.H.; Chung, W.J.; Yeo, M.S.; Kim, K.W. Evaluation of the thermal performance of a Thermally Activated Building System (TABS) according to the thermal load in a residential building. Energy Build. 2014, 73, 69–82. [Google Scholar] [CrossRef]
  17. Lim, J.-H.; Song, J.-H.; Song, S.-Y. Development of operational guidelines for thermally activated building system according to heating and cooling load characteristics. Appl. Energy 2014, 126, 123–135. [Google Scholar] [CrossRef]
  18. Choi, J.; Chun, C.; Sun, Y.; Choi, Y.; Kwon, S.; Bornehag, C.G.; Sundell, J. Associations between building characteristics and children’s allergic symptoms—A cross-sectional study on child's health and home in Seoul, South Korea. Build. Environ. 2014, 75, 176–181. [Google Scholar] [CrossRef]
  19. Ge, H.; McClung, V.R.; Zhang, S. Impact of balcony thermal bridges on the overall thermal performance of multi-unit residential buildings: A case study. Energy Build. 2013, 60, 163–173. [Google Scholar] [CrossRef]
  20. Kočí, V.; Maděra, J.; Černý, R. Exterior thermal insulation systems for AAC building envelopes: Computational analysis aimed at increasing service life. Energy Build. 2012, 47, 84–90. [Google Scholar] [CrossRef]
  21. Desta, T.Z.; Langmans, J.; Roels, S. Experimental data set for validation of heat, air and moisture transport models of building envelopes. Build. Environ. 2011, 46, 1038–1046. [Google Scholar] [CrossRef]
  22. Harrestrup, M.; Svendsen, S. Full-scale test of an old heritage multi-storey building undergoing energy retrofitting with focus on internal insulation and moisture. Build. Environ. 2015, 85, 123–133. [Google Scholar] [CrossRef]
  23. Gläser, H.J.; Ulrich, S. Condensation on the outdoor surface of window glazing—Calculation methods, key parameters and prevention with low-emissivity coatings. Thin Solid Films 2013, 532, 127–131. [Google Scholar] [CrossRef]
  24. Werner, A.; Roos, A. Condensation tests on glass samples for energy efficient windows. Sol. Energy Mater. Sol. Cells 2007, 91, 609–615. [Google Scholar] [CrossRef]
  25. Van Den Bossche, N.; Buffel, L.; Janssens, A. Thermal Optimization of Window Frames. Energy Procedia 2015, 78, 2500–2505. [Google Scholar] [CrossRef]
  26. Van Den Bergh, S.; Hart, R.; Jelle, B.P.; Gustavsen, A. Window spacers and edge seals in insulating glass units: A state-of-the-art review and future perspectives. Energy Build. 2013, 58, 263–280. [Google Scholar] [CrossRef]
  27. Mankibi, M.E.; Cantin, R.; Zoubir, A. Contribution to the Thermal Renovation of Old Buildings: Numerical and Experimental Approach for Characterizing a Double Window. Energy Procedia 2015, 78, 2470–2475. [Google Scholar] [CrossRef]
Figure 1. Plan of the apartment building and the location of the external chamber.
Energies 09 00979 g001
Figure 2. An elevation and section of the window system.
Energies 09 00979 g002
Figure 3. Chamber and pictures of the measurement setup.
Energies 09 00979 g003
Figure 4. Location of thermocouples on the window system.
Energies 09 00979 g004
Figure 5. Indoor temperature and humidity under various outdoor temperature conditions in the chamber.
Energies 09 00979 g005
Figure 6. Indoor surface temperature under various outdoor temperature conditions in the chamber on the third day of measurement.
Energies 09 00979 g006
Figure 7. Occurrence of condensation on the glazing under various outdoor temperatures. (a) Chamber −15 °C, Indoor 23.2 °C/57%, Glass edge 14.6 °C (17:45 on the third day); (b) Chamber −15.6 °C, Indoor 23.2 °C/57%, Glass edge 13.2 °C (18:15 on the third day); (c) Chamber −17.1 °C, Indoor 22.6 °C/55%, Glass edge 12.8 °C (19:30 on the third day); (d) Chamber −19.1 °C, Indoor 22.5 °C/57%, Glass edge 12.6 °C (19:45 on the third day); (e) Chamber −19.9 °C, Indoor 22.6 °C/57%, Glass edge 11.8 °C (20:00 on the third day); (f) Chamber −20.5 °C, Indoor 22.8 °C/57%, Glass edge 11.7 °C (20:15 on the third day).
Energies 09 00979 g007
Figure 8. Temperature distribution on the glazing with the increased indoor humidity.
Energies 09 00979 g008
Figure 9. Occurrence of condensation on the glazing with the increased indoor humidity from 23 h to 24 h on the fourth day of measurement. (a) Chamber −17.7 °C, Indoor 23.4 °C/61%, Glass edge 13.4 °C (23:00 on the fourth day). Length of thin moisture film: 40 mm; (b) Chamber −18.7 °C, Indoor 23.3 °C/62%, Glass edge 12.8 °C (23:15 on the fourth day). Length of thin moisture film: 45 mm; (c) Chamber −17.9 °C, Indoor 23.2 °C/62%, Glass edge 12.5 °C (23:30 on the fourth day). Length of thin moisture film: 50 mm; (d) Chamber −20.6 °C, Indoor 23.2 °C/62%, Glass edge 12.2 °C (23:45 on the fourth day). Length of thin moisture film: 50 mm; (e) Chamber −19.1 °C, Indoor 23.3 °C/63%, Glass edge 12.2 °C (24:00 on the fourth day). Length of thin moisture film: 60 mm, water droplets: 5 mm; (f) Chamber −17.8 °C, Indoor 23.4 °C/63%, Glass edge 12.2 °C (24:15 on the fourth day). Length of thin moisture film: 70 mm, water droplets: 5 mm.
Energies 09 00979 g009
Figure 10. TDR calculation results during the measurements.
Energies 09 00979 g010
Figure 11. Outdoor and indoor surface temperature distributions of locations for the occurrence of condensation through TDR analysis.
Energies 09 00979 g011
Figure 12. Indoor surface temperature on the window under the various outdoor temperatures using the simulation. (a) Outdoor temperature: −15 °C; (b) Outdoor temperature: −18 °C; (c) Outdoor temperature: −20 °C.
Energies 09 00979 g012
Figure 13. THERM simulation results of various spacers. (a) Aluminum spacer; (b) Thermally broken aluminum spacer; (c) Thick-walled plastic spacer.
Energies 09 00979 g013
Table 1. Thermal properties of the window system and other relevant parameters.
The Window SystemValues
U-factor of the window (W/m2·K)1.90
Area of glazing (m2)7.28
Area of frame (m2)1.36
U-factor of the double glazing with low-e coating (W/m2·K)1.56
Solar heat gain coefficient (SHGC)0.65
Shading coefficient (SC)0.75
Visible light transmission (VLT) (%)77.6
Table 2. Measurement conditions.
ConditionFirst DaySecond DayThird DayFourth Day
Indoor22 °C
30%
23 °C–24 °C
50%–60%
23 °C–24 °C
55%–60%
23 °C–24 °C
60%–65%
Chamber (Outdoor)15 °C−8 °C−15 °C, −18 °C, −20 °C−18 °C to −20 °C
Table 3. Boundary conditions for THERM.
PartConditions
Indoor Temperature23.5 °C
Inside Film Coefficient3.0 W/m2·K
Outdoor Temperature−15 °C, −18 °C, −20 °C
Outside Film Coefficient24.0 W/m2·K
Glass cutting planeAdiabatic
SpacerStainless steel
Table 4. Temperature on the interior surface of the window system with varying temperatures in the chamber.
Outdoor Temp. (°C)−15−18−20
Glass-edge (°C)14.4–15.613.5–14.112.5–13.5
Glass (°C)18.8–19.117.9–18.317.2–17.8
Frame (°C)16.6–17.614.8–15.814.4–14.6
Table 5. Comparison between measured and simulated data.
Outdoor Temp. (°C)−15−18−20
MeasuredSimulatedMeasuredSimulatedMeasuredSimulated
Glass-edge (°C)14.4–15.610.013.5–14.18.912.5–13.58.2
Glass (°C)18.8–19.115.317.9–18.314.617.2–17.814.2
Frame (°C)16.6–17.616.814.8–15.816.314.4–14.616.0
Table 6. Thermal property of spacers.
SpacerValue (W/m·K)
Steel-Stainless17
Aluminum160
Thermally broken0.20
Thick-walled plastic0.16

