1. Introduction
A microgrid is operated either in connection with a commercial power grid or in a stand-alone manner where a commercial power grid is not available. A diesel engine generator (EG) has been widely used to supply power to consumers on remote islands. However, a stand-alone microgrid has gradually been spreading in recent years due to oil costs and environmental concerns [
1,
2,
3,
4].
A DC microgrid only requires voltage control and one-step power conversion, which offers advantages in cost and loss [
5,
6,
7,
8,
9]. Therefore, a stand-alone DC microgrid is expected to propagate if photovoltaic (PV) panels and battery energy storage system (BESS) are widely deployed on remote islands.
DC voltage control in the stand-alone DC microgrid is closely related to maintaining the equilibrium of power production, storage, and consumption. Thus, the power of distributed generations, BESS, and load is detected in real-time through a communication link to implement the DC voltage control [
10]. To address this issue, droop control has been proposed, in which the output voltage of the BESS is properly adjusted according to the power flow [
11,
12,
13,
14,
15].
The existing droop control determines the DC grid voltage in proportional to the DC output current of the BESS. The virtual resistance of the BESS is considered to calculate the reference of the DC grid voltage. Different values of virtual resistance are selected depending on the state of charge (SoC) of the battery to protect the battery [
16,
17,
18]. Since the droop control determines the DC grid voltage in proportion to the DC output current, the DC grid voltage is sensitive to the variation of DC output current. Furthermore, the DC grid voltage might be unstable in transient conditions due to the variation of virtual resistance according to the operation range of SoC.
Recently, an adaptive droop control for the distributed BESS was proposed in [
19,
20], where the droop coefficient is determined by the initial droop coefficient and the inverse
nth order of the SoC. The proposed droop control offers the power-sharing scheme among two or more BESSs by adjusting the initial droop coefficient and the SoC-balancing speed coefficient n. Since the size of the droop coefficient is a tradeoff for the stability and the voltage regulation, a detail stability analysis is required for the proposed droop control. Additionally, the proposed method is concentrated on the adjustment of the droop coefficient according to the SoC. It does not directly use the SoC as the input variable for the droop control.
This paper proposes a new scheme of the DC grid voltage control for the BESS using the battery SoC, instead of using the DC output current in the conventional droop control. The performance of the proposed DC grid voltage control was verified by computer simulations. A hardware scale model was built in the lab and experiments were conducted to confirm the applicability of the proposed control scheme for a stand-alone DC microgrid on remote islands.
2. Droop Voltage Control
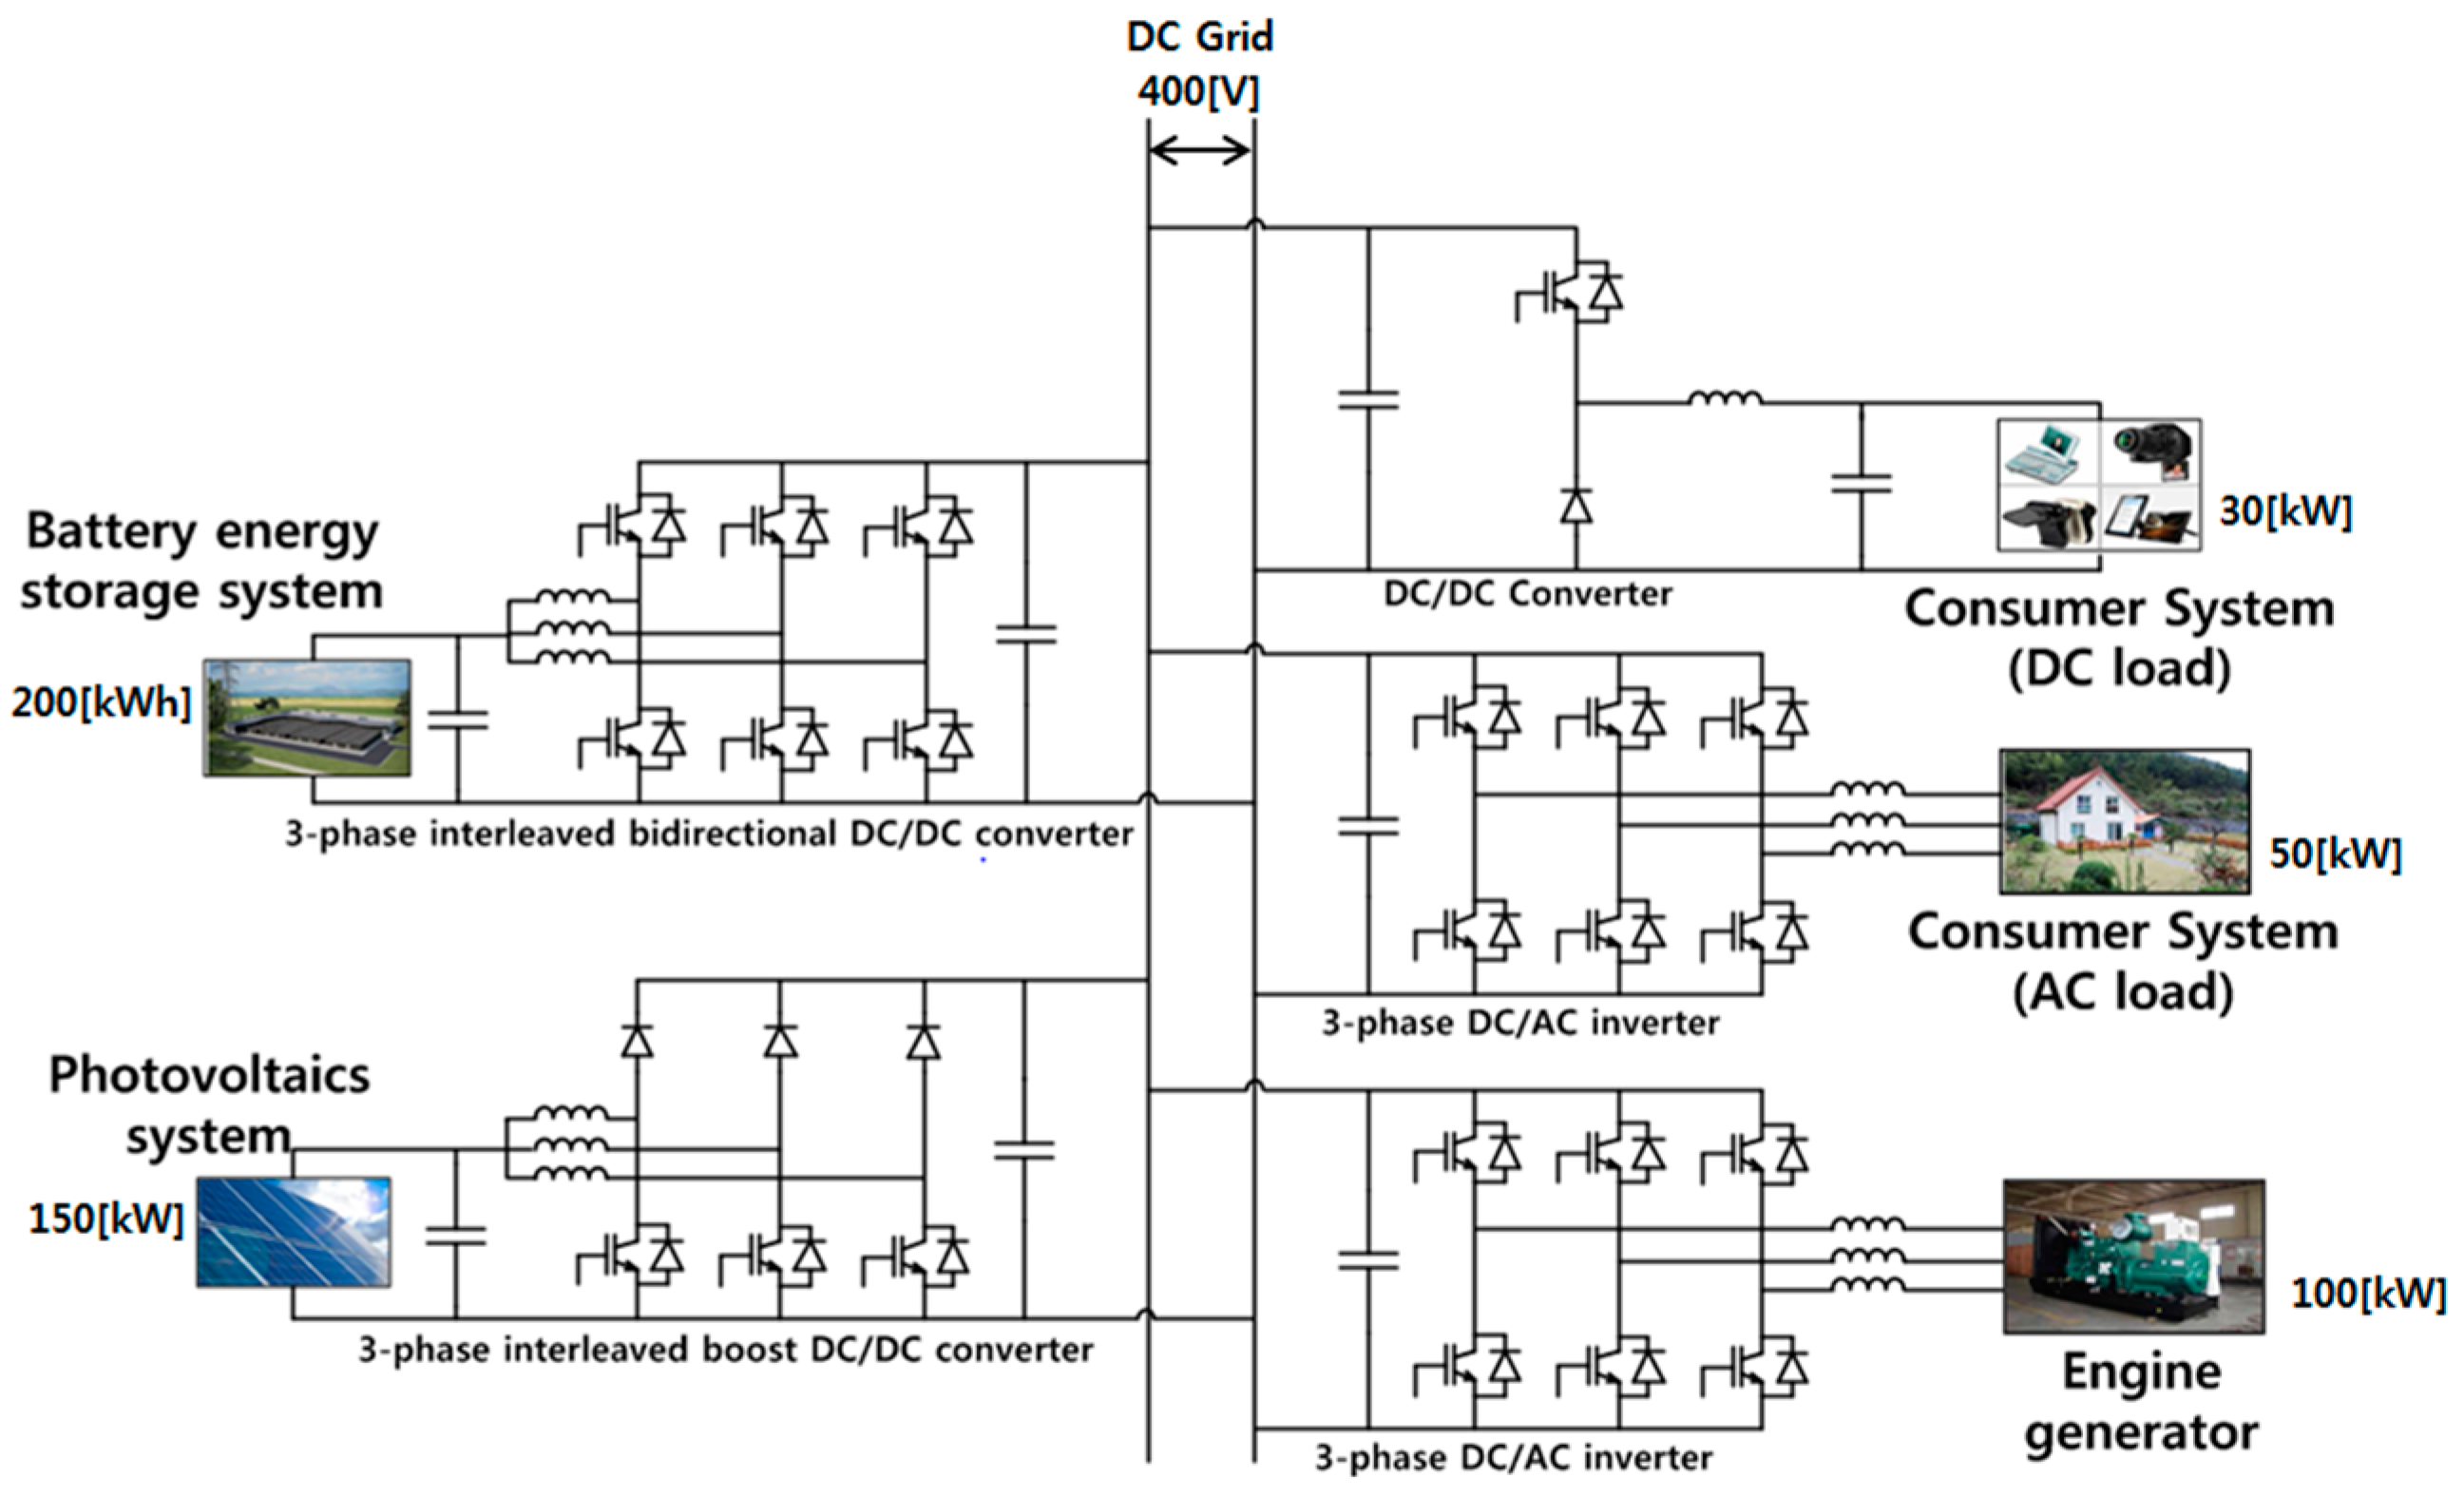
Figure 1 shows a configuration and circuit diagram of a stand-alone DC microgrid installed on remote islands. A BESS is required for a PV generator to supply stable power to consumers because the generated power from PV panels varies according to weather conditions. In addition, a diesel engine generator (EG) was added to make preparations for insufficient power from the PV generator.
The output voltage of the PV generator was raised up to the operating voltage of the DC grid by a three-phase interleaved boost DC/DC converter that operates at maximum power point tracking (MPPT). The battery output voltage is raised up to the DC grid voltage during discharging and the DC grid voltage is lowered down to the battery input voltage during charging through a three-phase interleaved bidirectional DC/DC converter [
21]. The diesel EG was connected to the DC grid through a three-phase AC/DC converter. The AC load receives power through a three-phase DC/AC converter, whereas the DC load receives power directly from the DC grid or through the DC/DC converter, depending on the operating voltage.
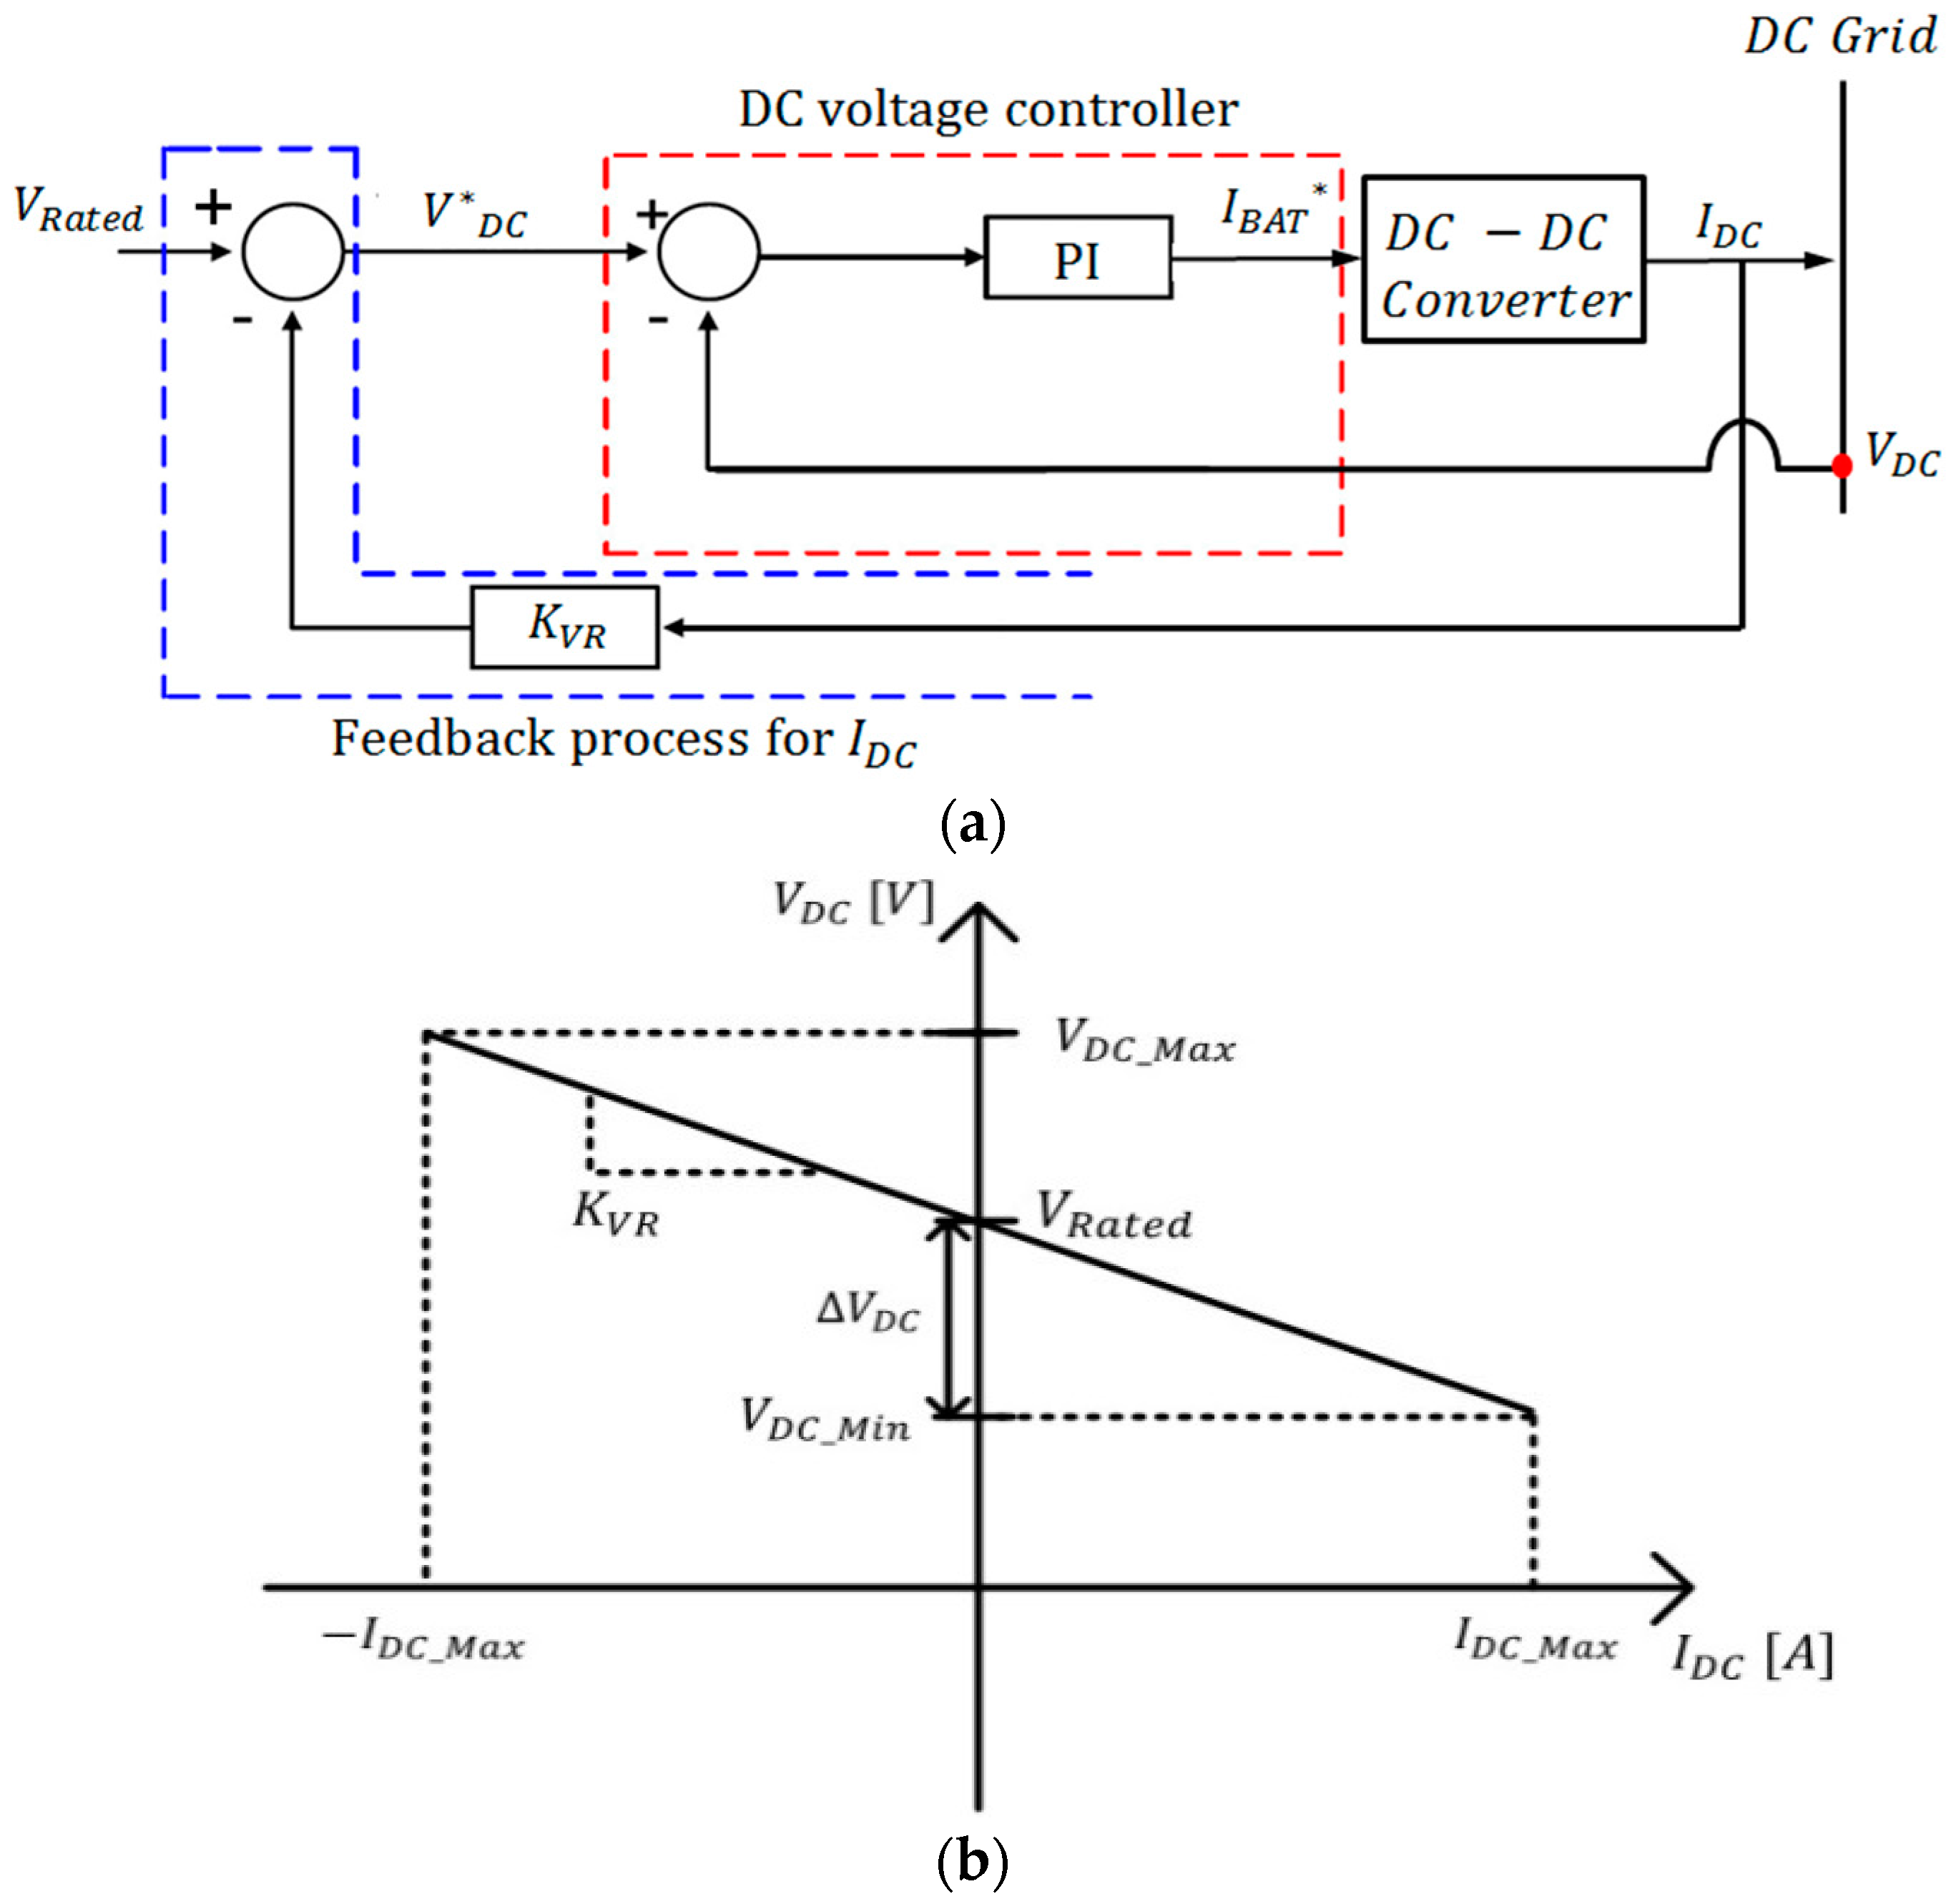
Stand-alone DC microgrids generally use droop control, which maintains the voltage of the DC grid by autonomously controlling the output power of the BESS. As shown in
Figure 2, the conventional droop control measures the output DC current of the BESS, multiplies it by the constant
, which indicates the current-voltage characteristics of the BESS, and adds it to the rating value of the DC grid voltage to determine the reference value of the droop voltage, as shown in Equation (1):
where
is the equivalent resistance and
is the BESS output current.
If the DC grid voltage is set at
,
can be determined by Equation (2), using the voltage regulation
, the minimum voltage
, and the rated capacity of BESS
:
For the BESS, three operation cases are defined according to the SoC values for battery protection: the case where the SoC is within the operation range, and the cases where it reaches the upper or the lower limit. Therefore, this droop control is performed by changing the virtual resistance according to each range.
When the battery SoC reaches the upper or lower limit, the value of the virtual resistance should be changed for the battery’s protection. This brings about a sudden transient to the DC voltage reference value, which can make system operation unstable. Additionally, a sudden change of the DC current causes a sudden change of the DC voltage because this droop control uses the DC current as a control variable. This sudden change of the DC voltage causes voltage stress to the converters connected to the DC grid.
3. Proposed Voltage Control
In case of lithium-ion (Li-ion) battery, the terminal voltage is almost proportional to the SoC values between 20%–90%, as in
Figure 3 [
22,
23,
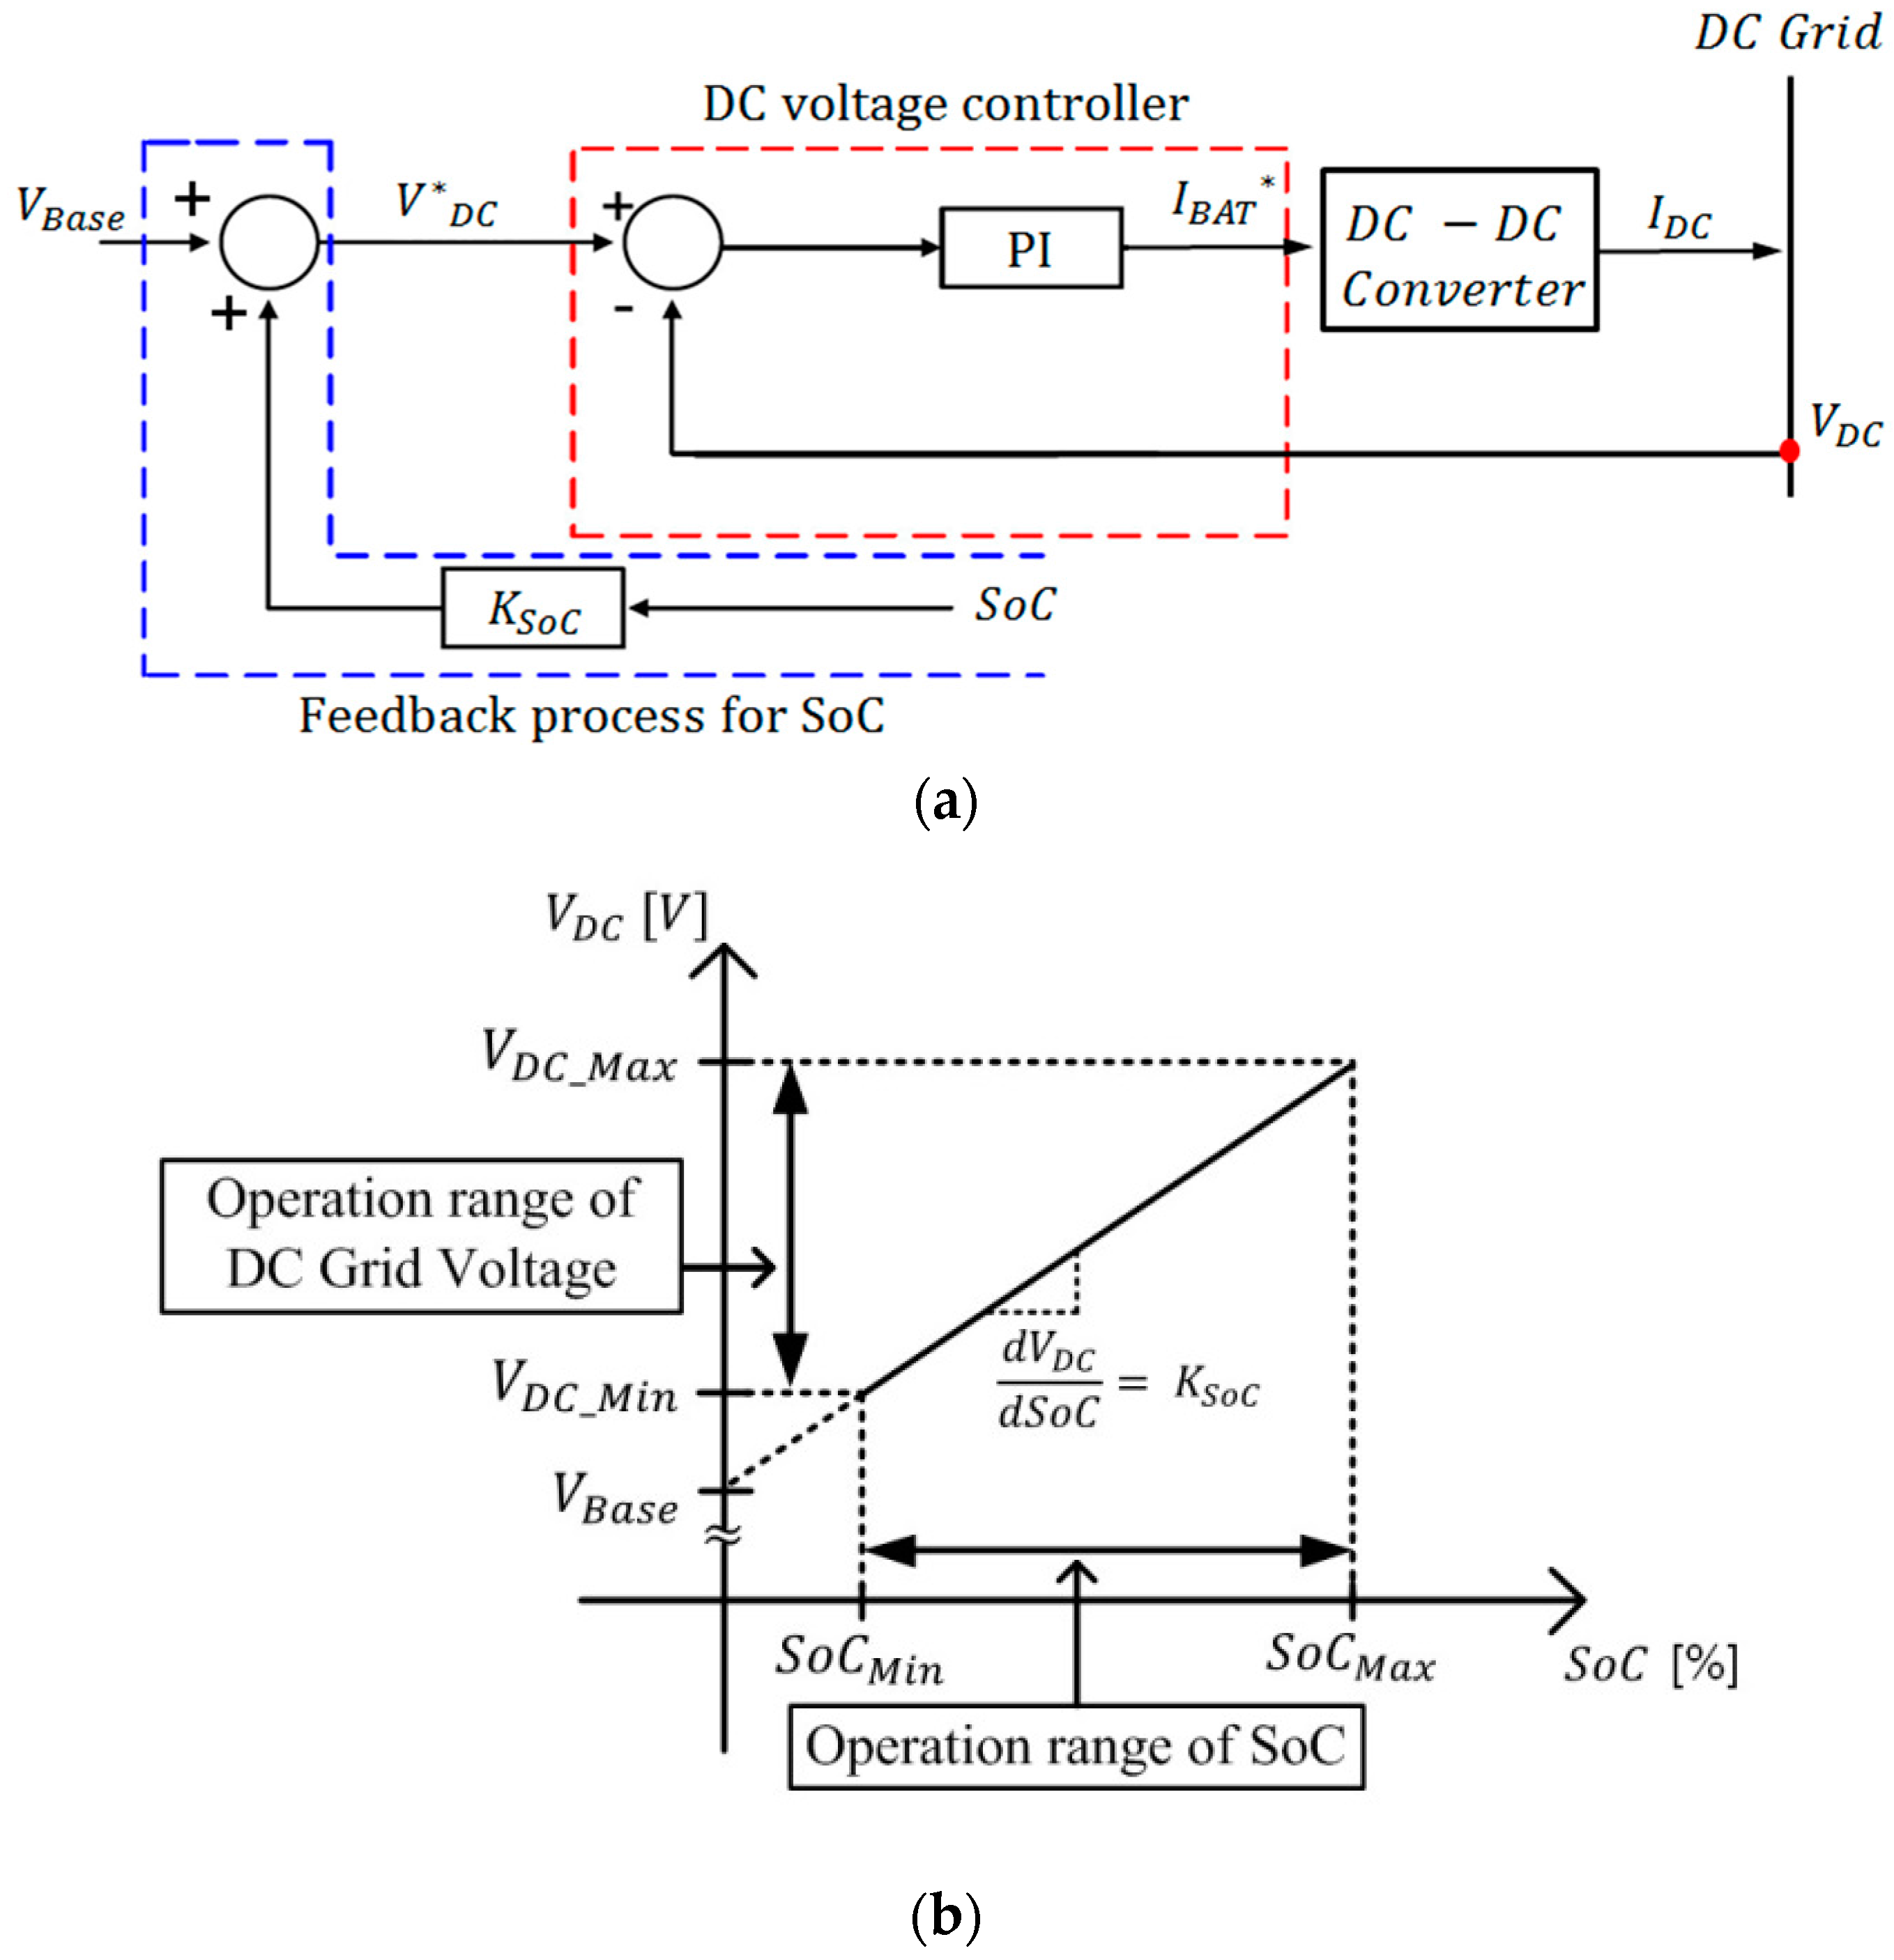
24]. Thus, the reference value of the DC grid voltage is determined by adding the voltage variation due to the SoC value to the base voltage. The voltage variation is calculated with multiplying the SoC value by the proportional gain
as represented in Equation (3) and shown in
Figure 4.
To draw the proportional gain and the base voltage, the operational range of the SoC and the operational range of the DC grid voltage are used. The DC grid voltage is highest when the battery SoC is at the maximum, as expressed in Equation (4). The DC grid voltage is lowest when the battery SoC is at the minimum, as expressed in Equation (5). Combining Equations (4) and (5), Equation (6) can be obtained. Therefore, the base voltage
and the gain value
can be drawn if the operational range of the DC grid voltage and the operational range of SoC are known:
If the rated voltage of the DC grid is 400 V and the voltage regulation is 5%, the maximum and minimum values of the DC grid voltage are 420 and 380 V, respectively. Furthermore, if the operational range of the battery SoC is assumed to be 20%–90%, the voltage control equation can be represented by Equation (7):
As the reference of the DC grid voltage is calculated by directly using the estimated SoC as a variable, there are few transient phenomena.
To determine the SoC value required in the proposed control, the battery SoC is estimated by using the current integration method as shown in Equation (8).
where
denotes the initial SoC,
denotes the total capacity of the battery, and
denotes the battery discharging current.
4. Control Stability Analysis
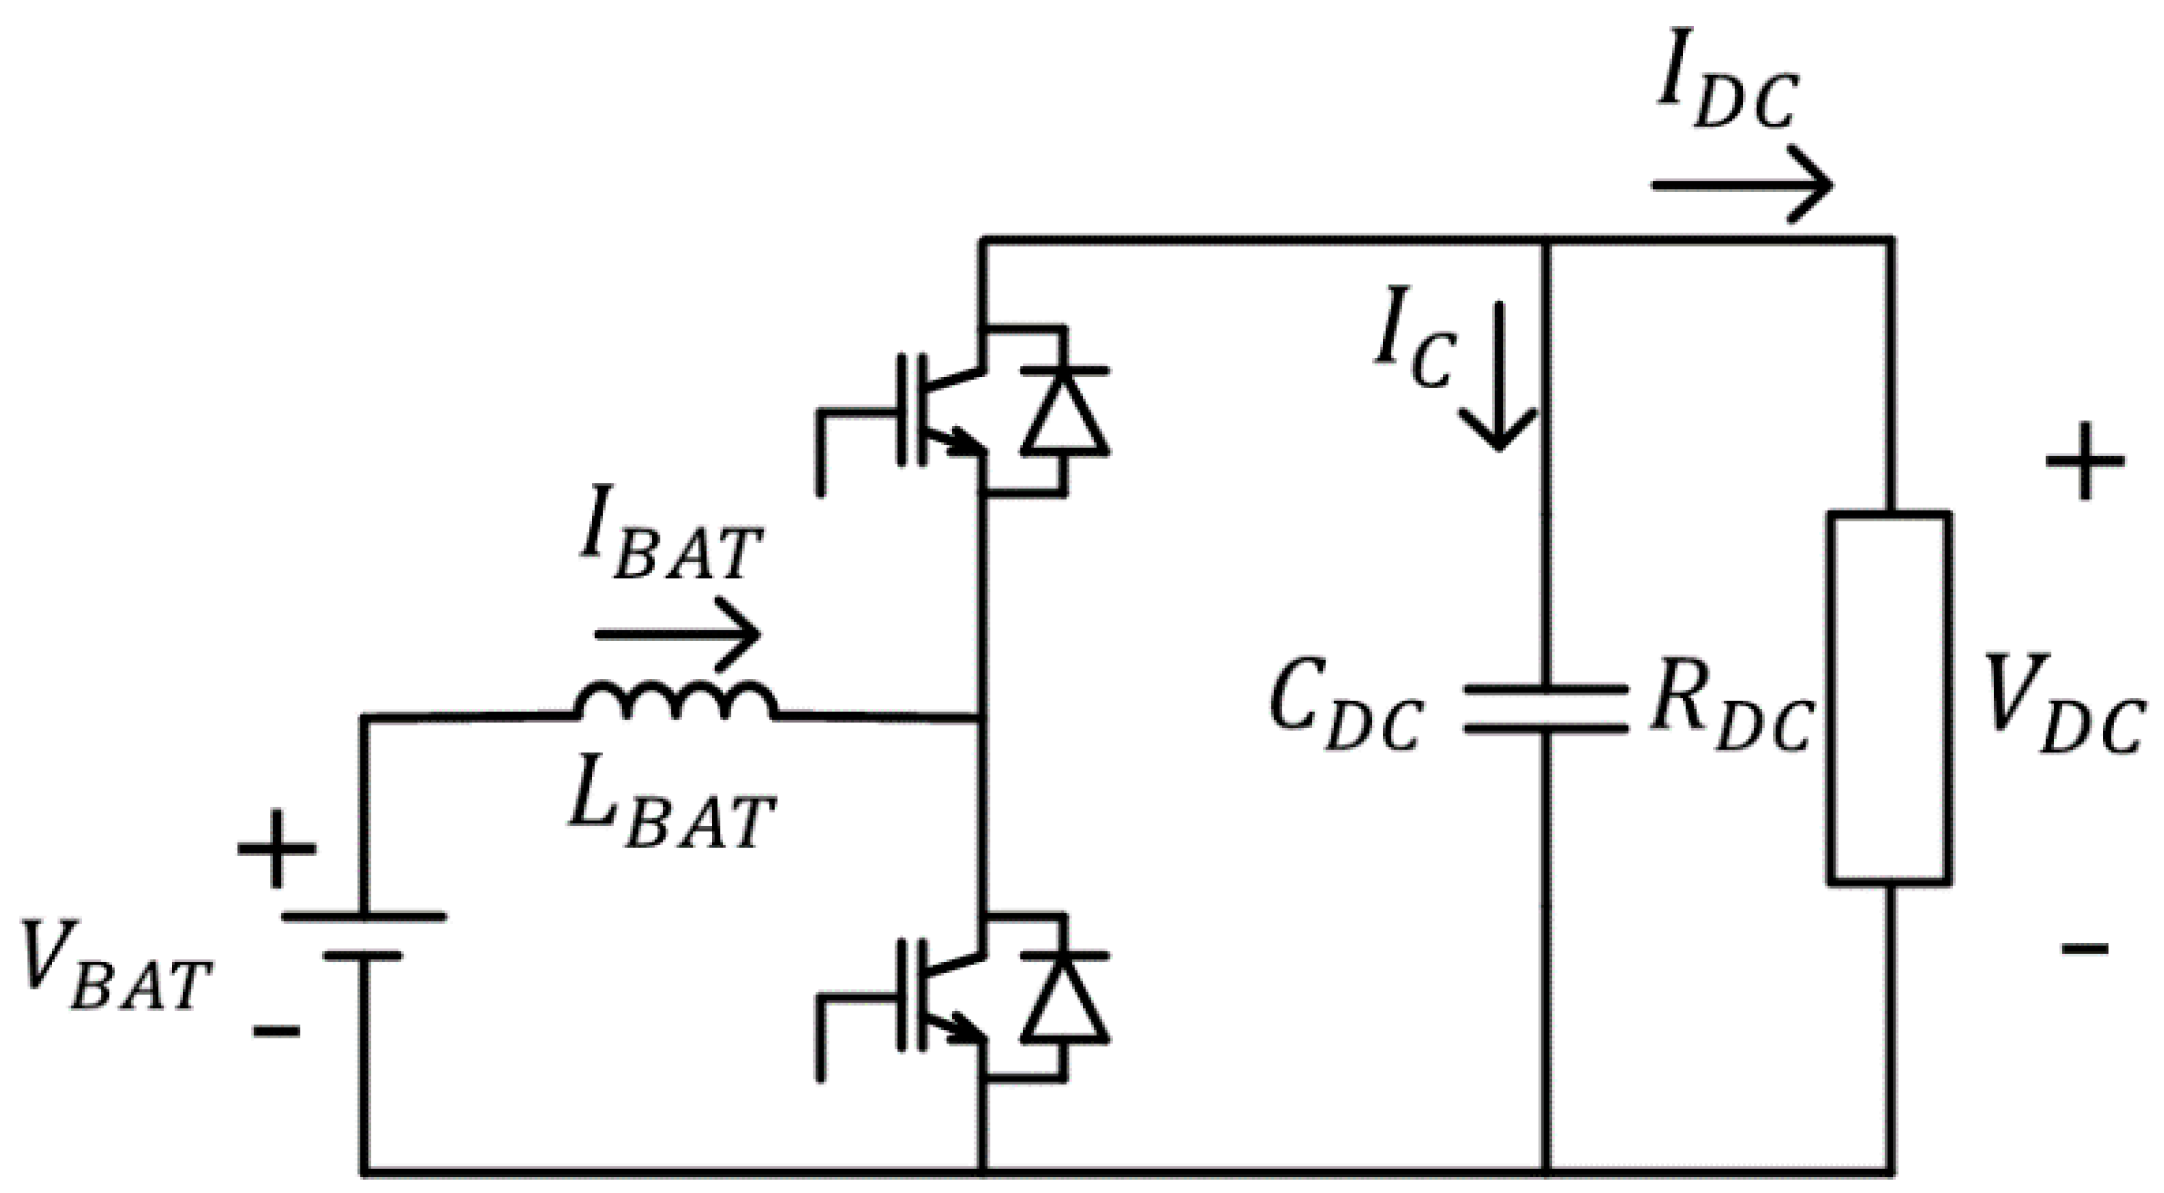
Figure 5 shows an equivalent circuit to derive a small signal model for the BESS. The circuit parameters are described in
Table 1, where
and
were determined to reduce the current ripple and the voltage ripple and the parameters of the proportional and integral (PI) control were determined by analyzing the current control loop and the voltage control loop.
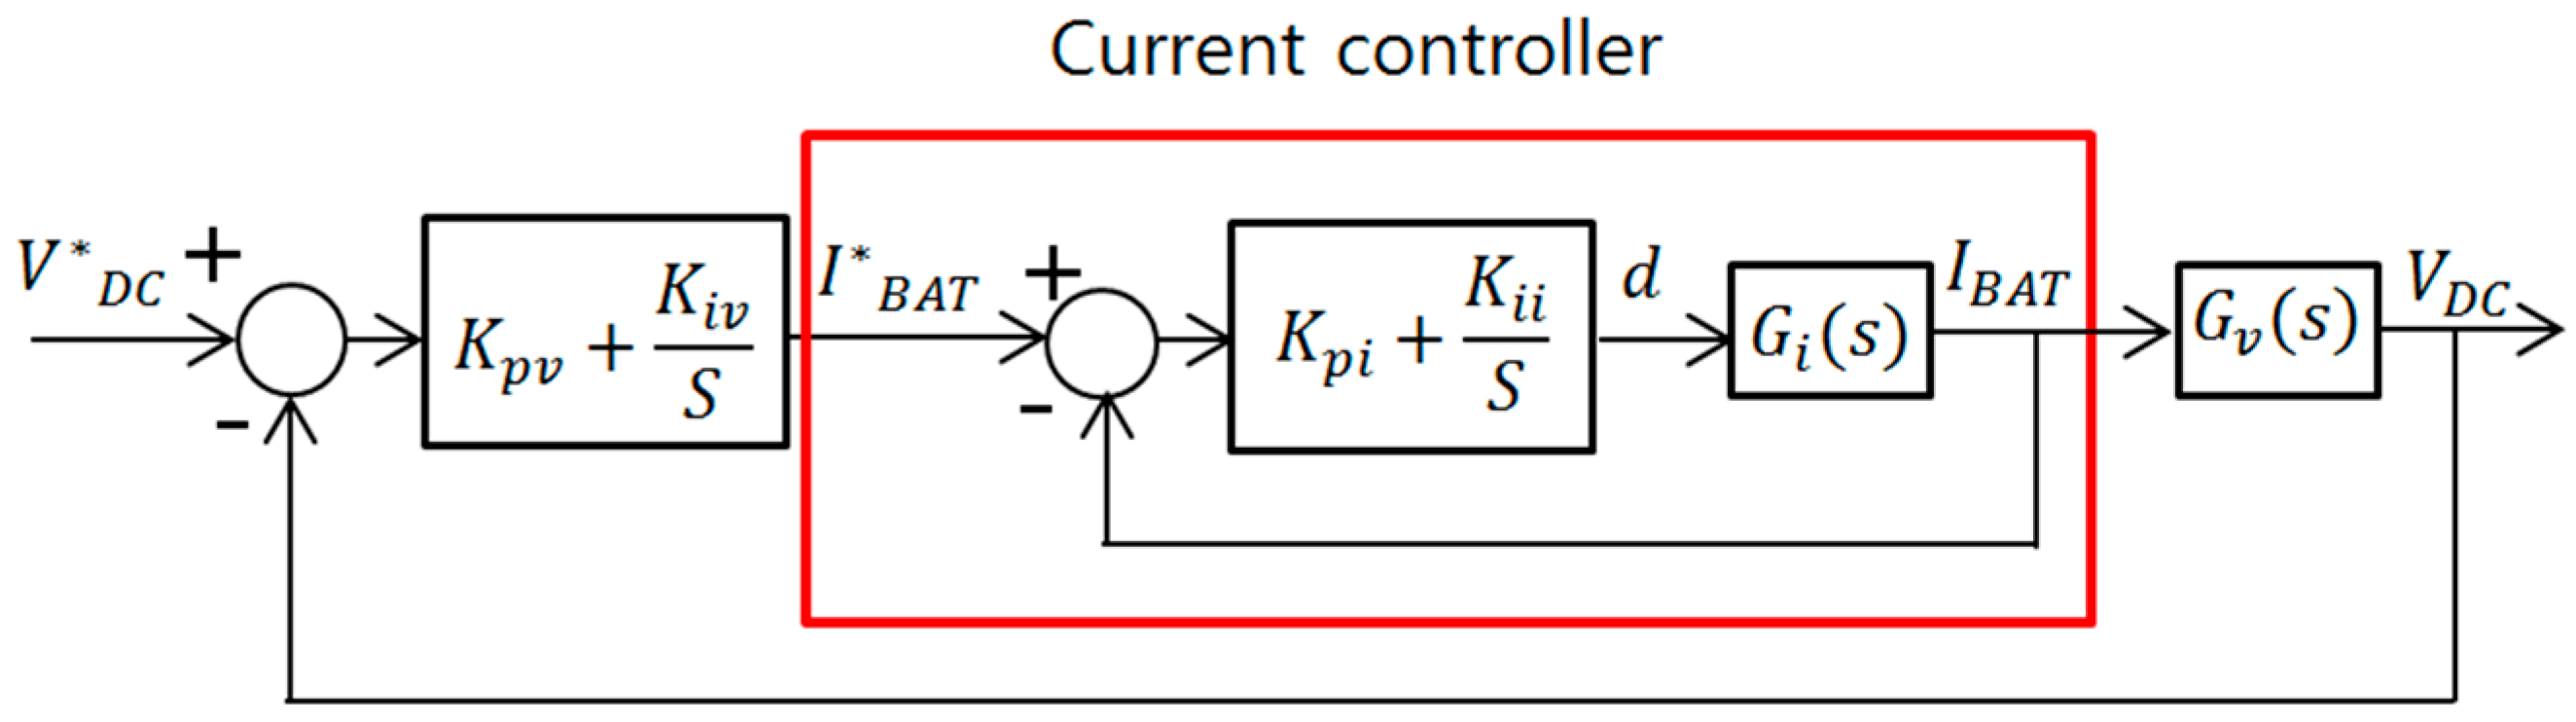
Figure 6 shows a closed-loop controller to control the output DC voltage of the BESS in which a current control loop is located as an inner loop in the voltage control loop.
Using the small signal model for bidirectional chopper, the current control transfer function
can be derived with respect to the relationship between
and
as the following:
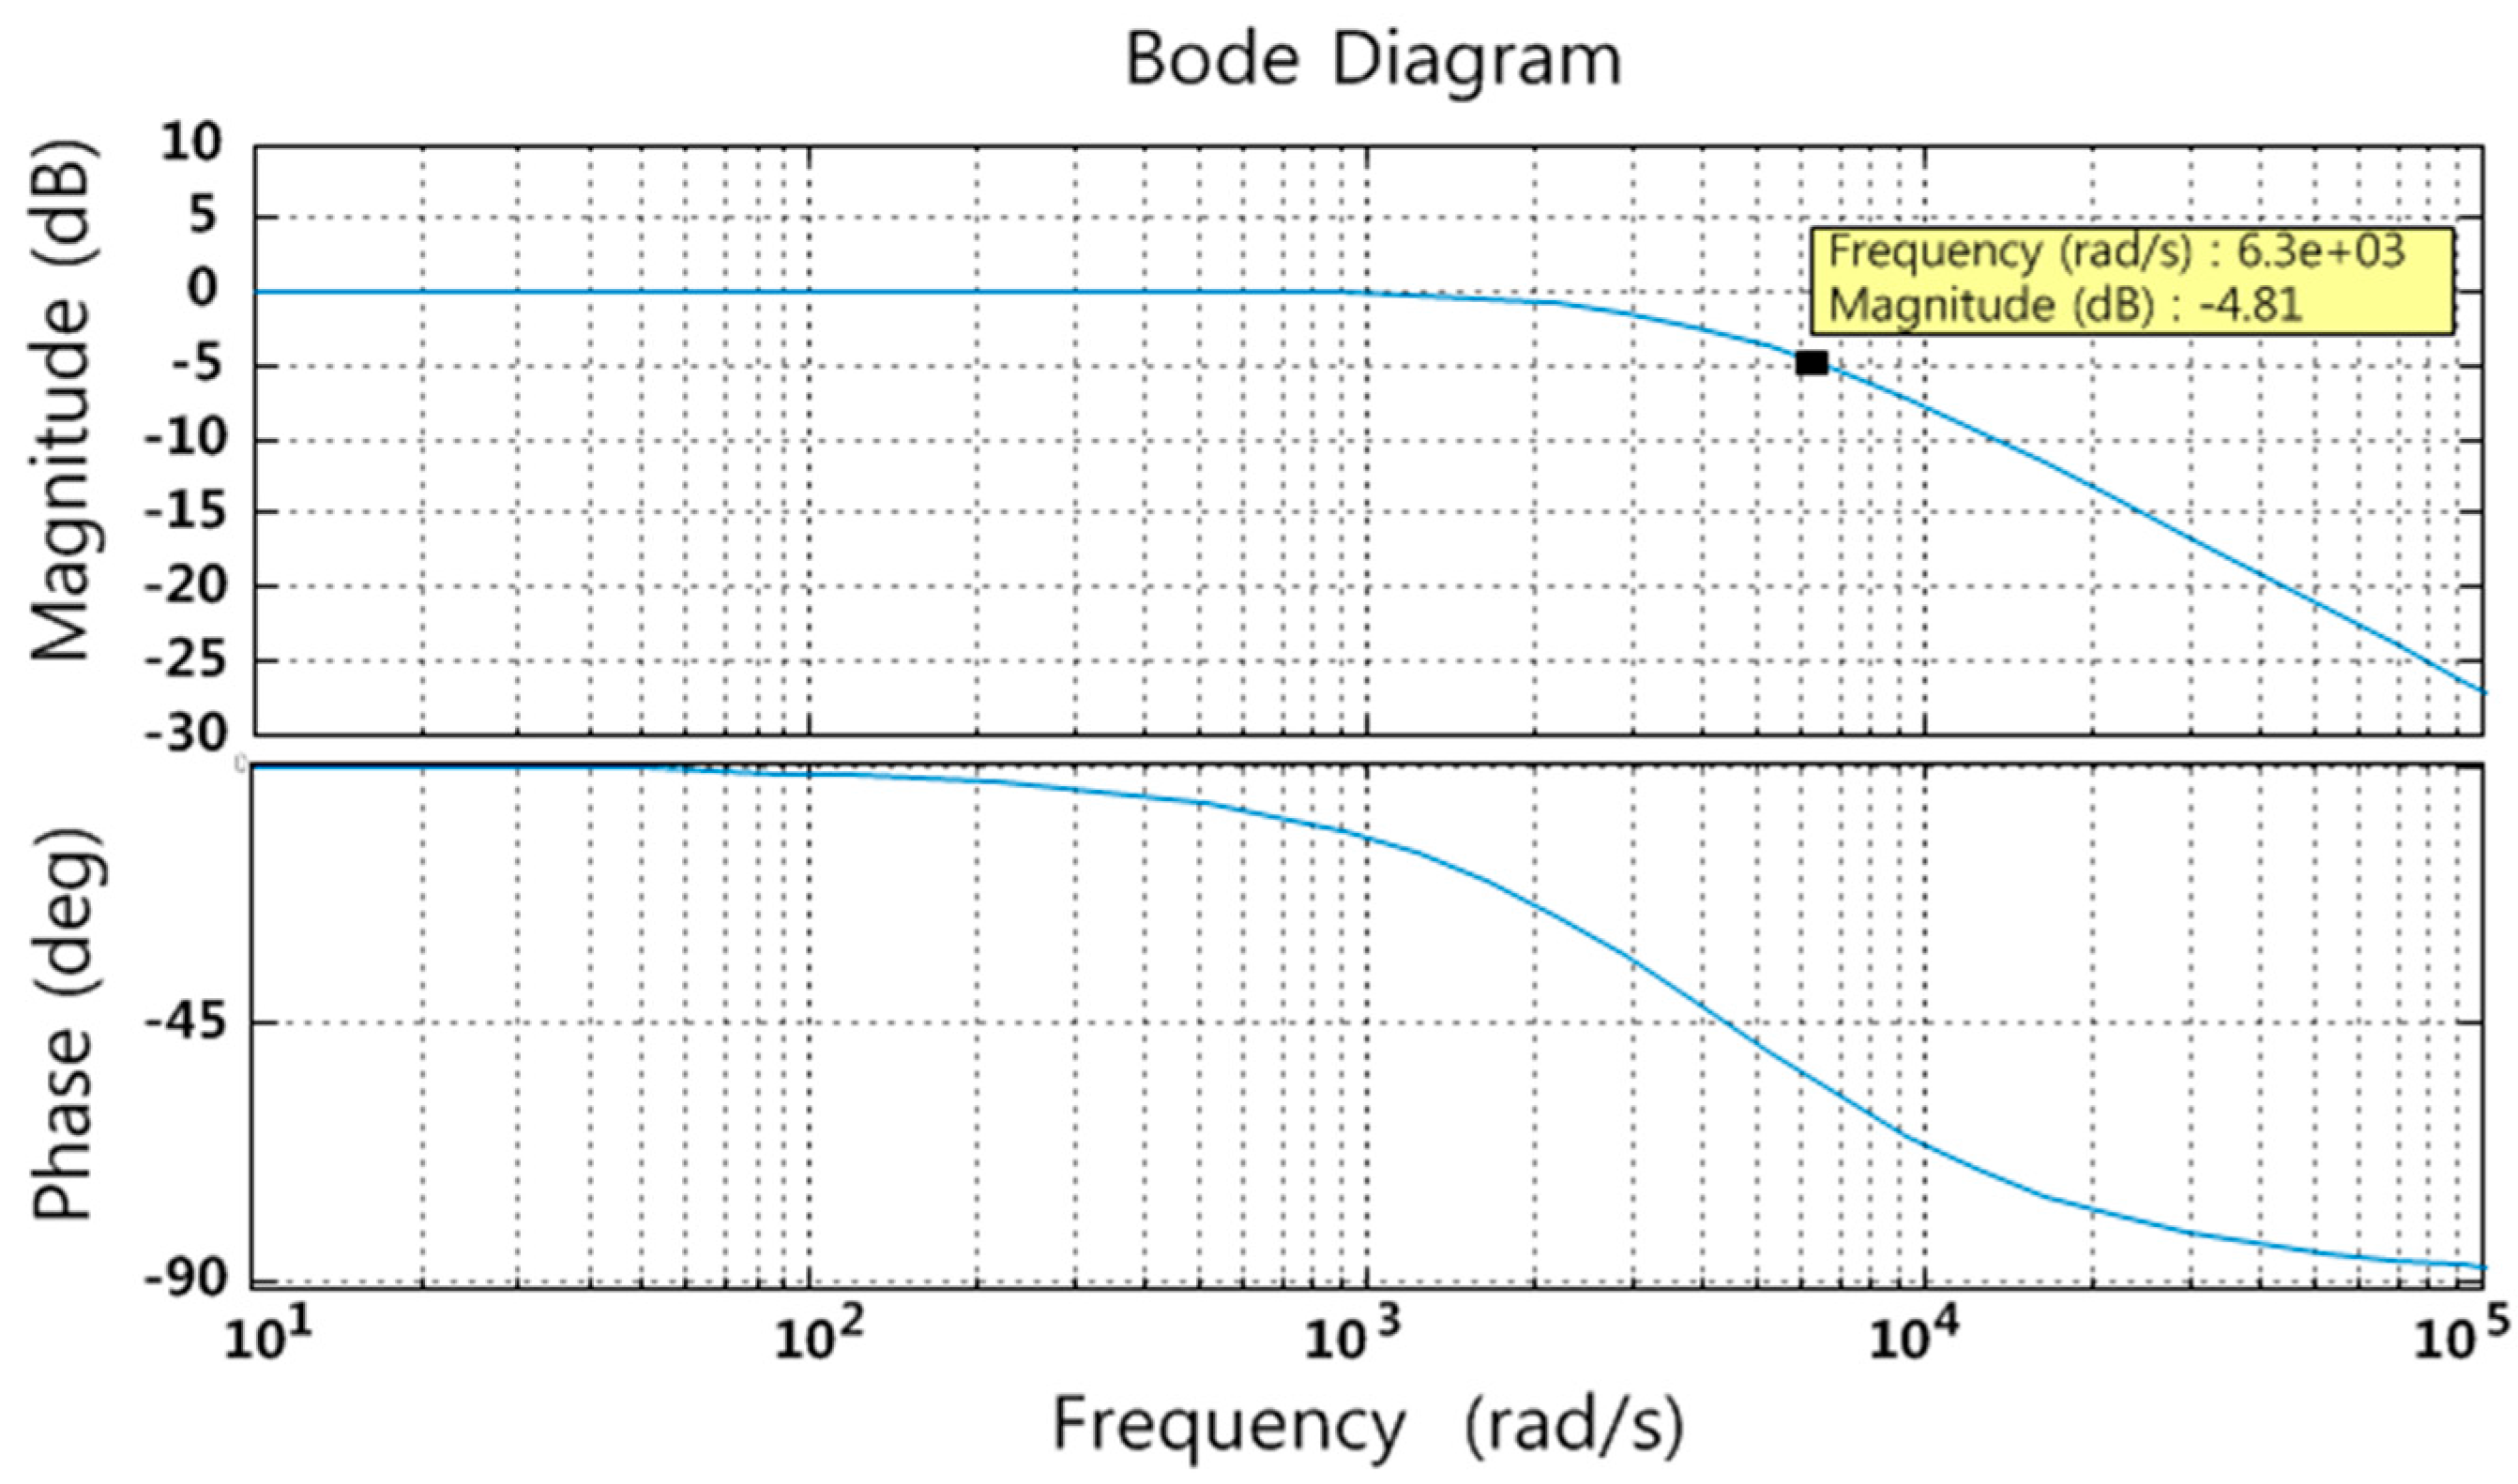
The PI parameters for the current control were determined by considering the bandwidth of 1 kHz, which is normally set to 1/10 of the switching frequency. The transfer function of a closed-loop current control that includes
and PI control can be expressed by Equation (10) by inserting the circuit parameters and PI control parameters:
The Bode plot for the closed-loop transfer function
can be drawn as shown in
Figure 7, which indicates enough phase-margin for stable operation.
From the small signal model for a bidirectional chopper, the voltage control transfer function
can be derived with respect to the relationship between
and
as the following:
where,
D is a duty ratio of the bidirectional chopper for small signal analysis.
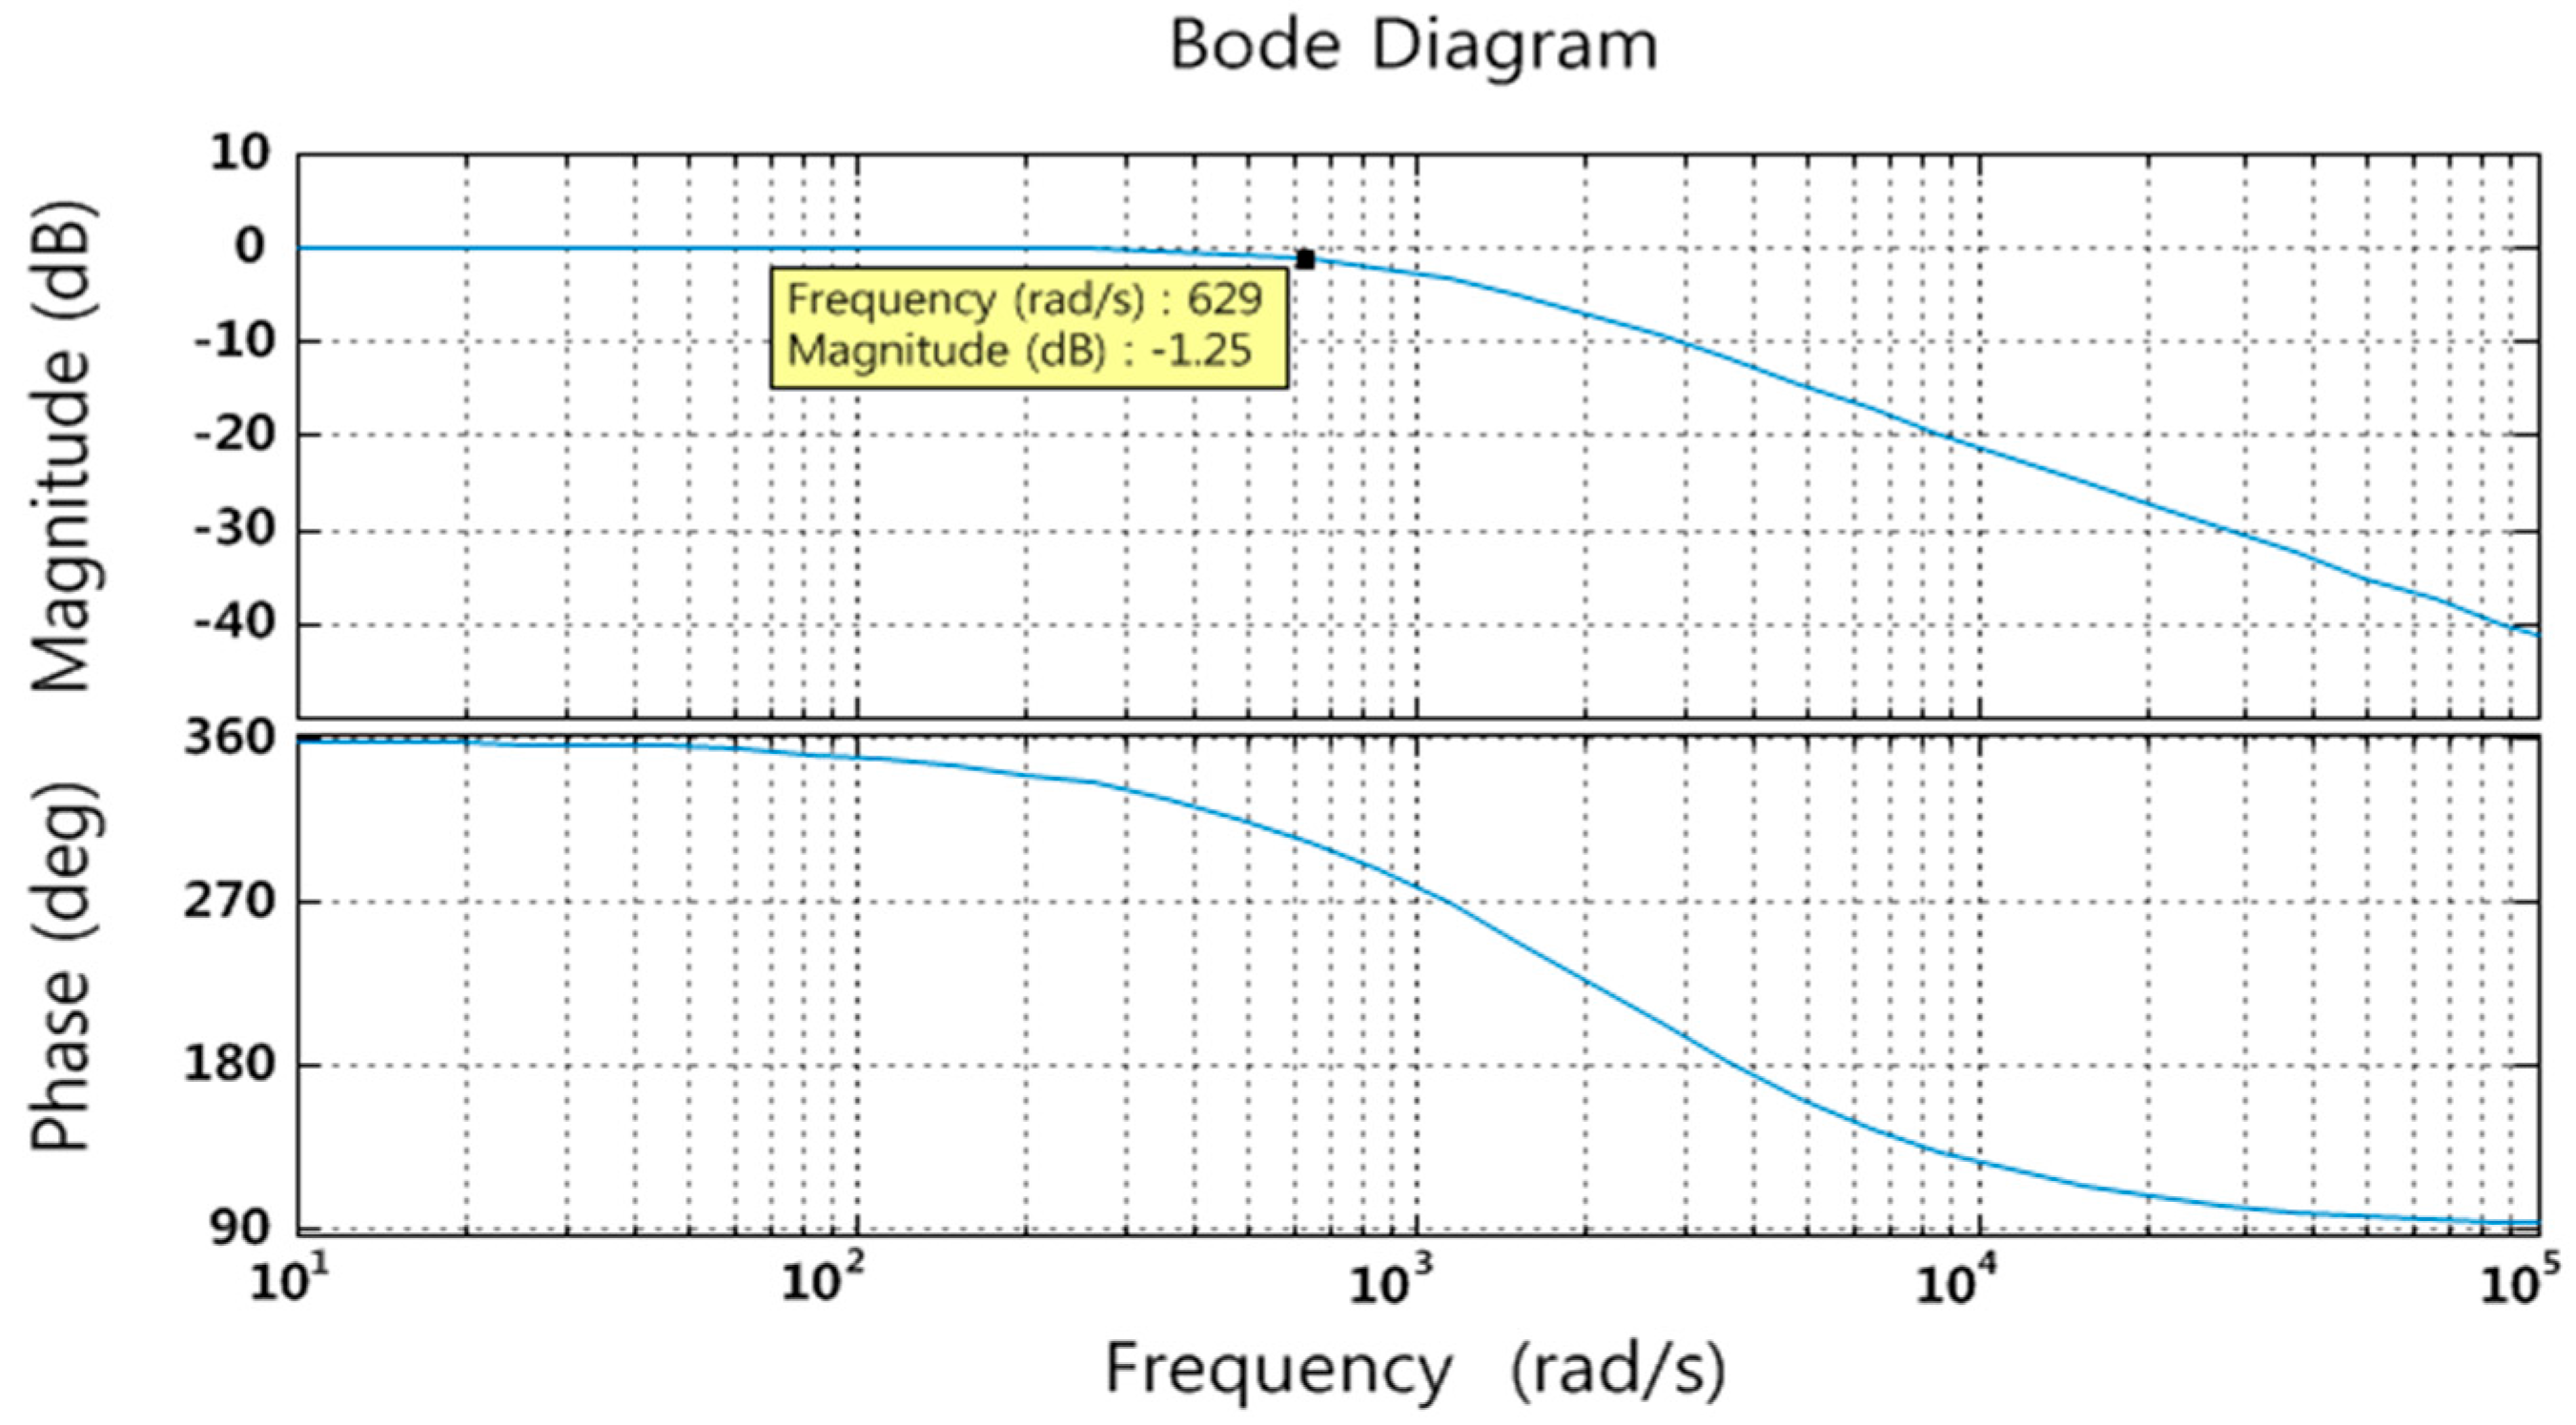
The transfer function for closed-loop voltage control, which includes
,
and PI control, can be expressed by Equation (12) by inserting the circuit parameters and PI control parameters:
The Bode plot for the closed-loop transfer function
can be drawn as shown in
Figure 8, which indicates enough gain-margin and phase-margin for stable operation.
5. System Operation Scheme
In this paper the EG operation is minimized to save the fuel cost and environmental burden. Therefore, the EG is not started until the battery SoC reaches 20% due to continuous sunless days and increased power usage by consumers. When the battery SoC reaches 20% and the DC grid voltage reaches the lowest value, the EG is started at the maximum output to supply power to the loads and to charge the battery.
The PV generator supplies all of the generated power to the battery through MPPT control in the battery SoC range of 20%–90%. However, if the battery SoC reaches the upper limit of 90% and the DC grid voltage reaches the upper limit because the amount from the PV generator is greater than the customer’s demand due to strong sunshine or low power-consumption, the output of the PV generator is artificially reduced to protect the battery. There are several algorithms for the MPPT control of a PV generator, such as the perturbation and observation method, the incremental conductance method, and the hill climbing method [
25,
26,
27]. Although other algorithms have better performance in tracking speed and error, this paper used the perturbation and observation method for the operation verification because it can be implemented simply in the lab.
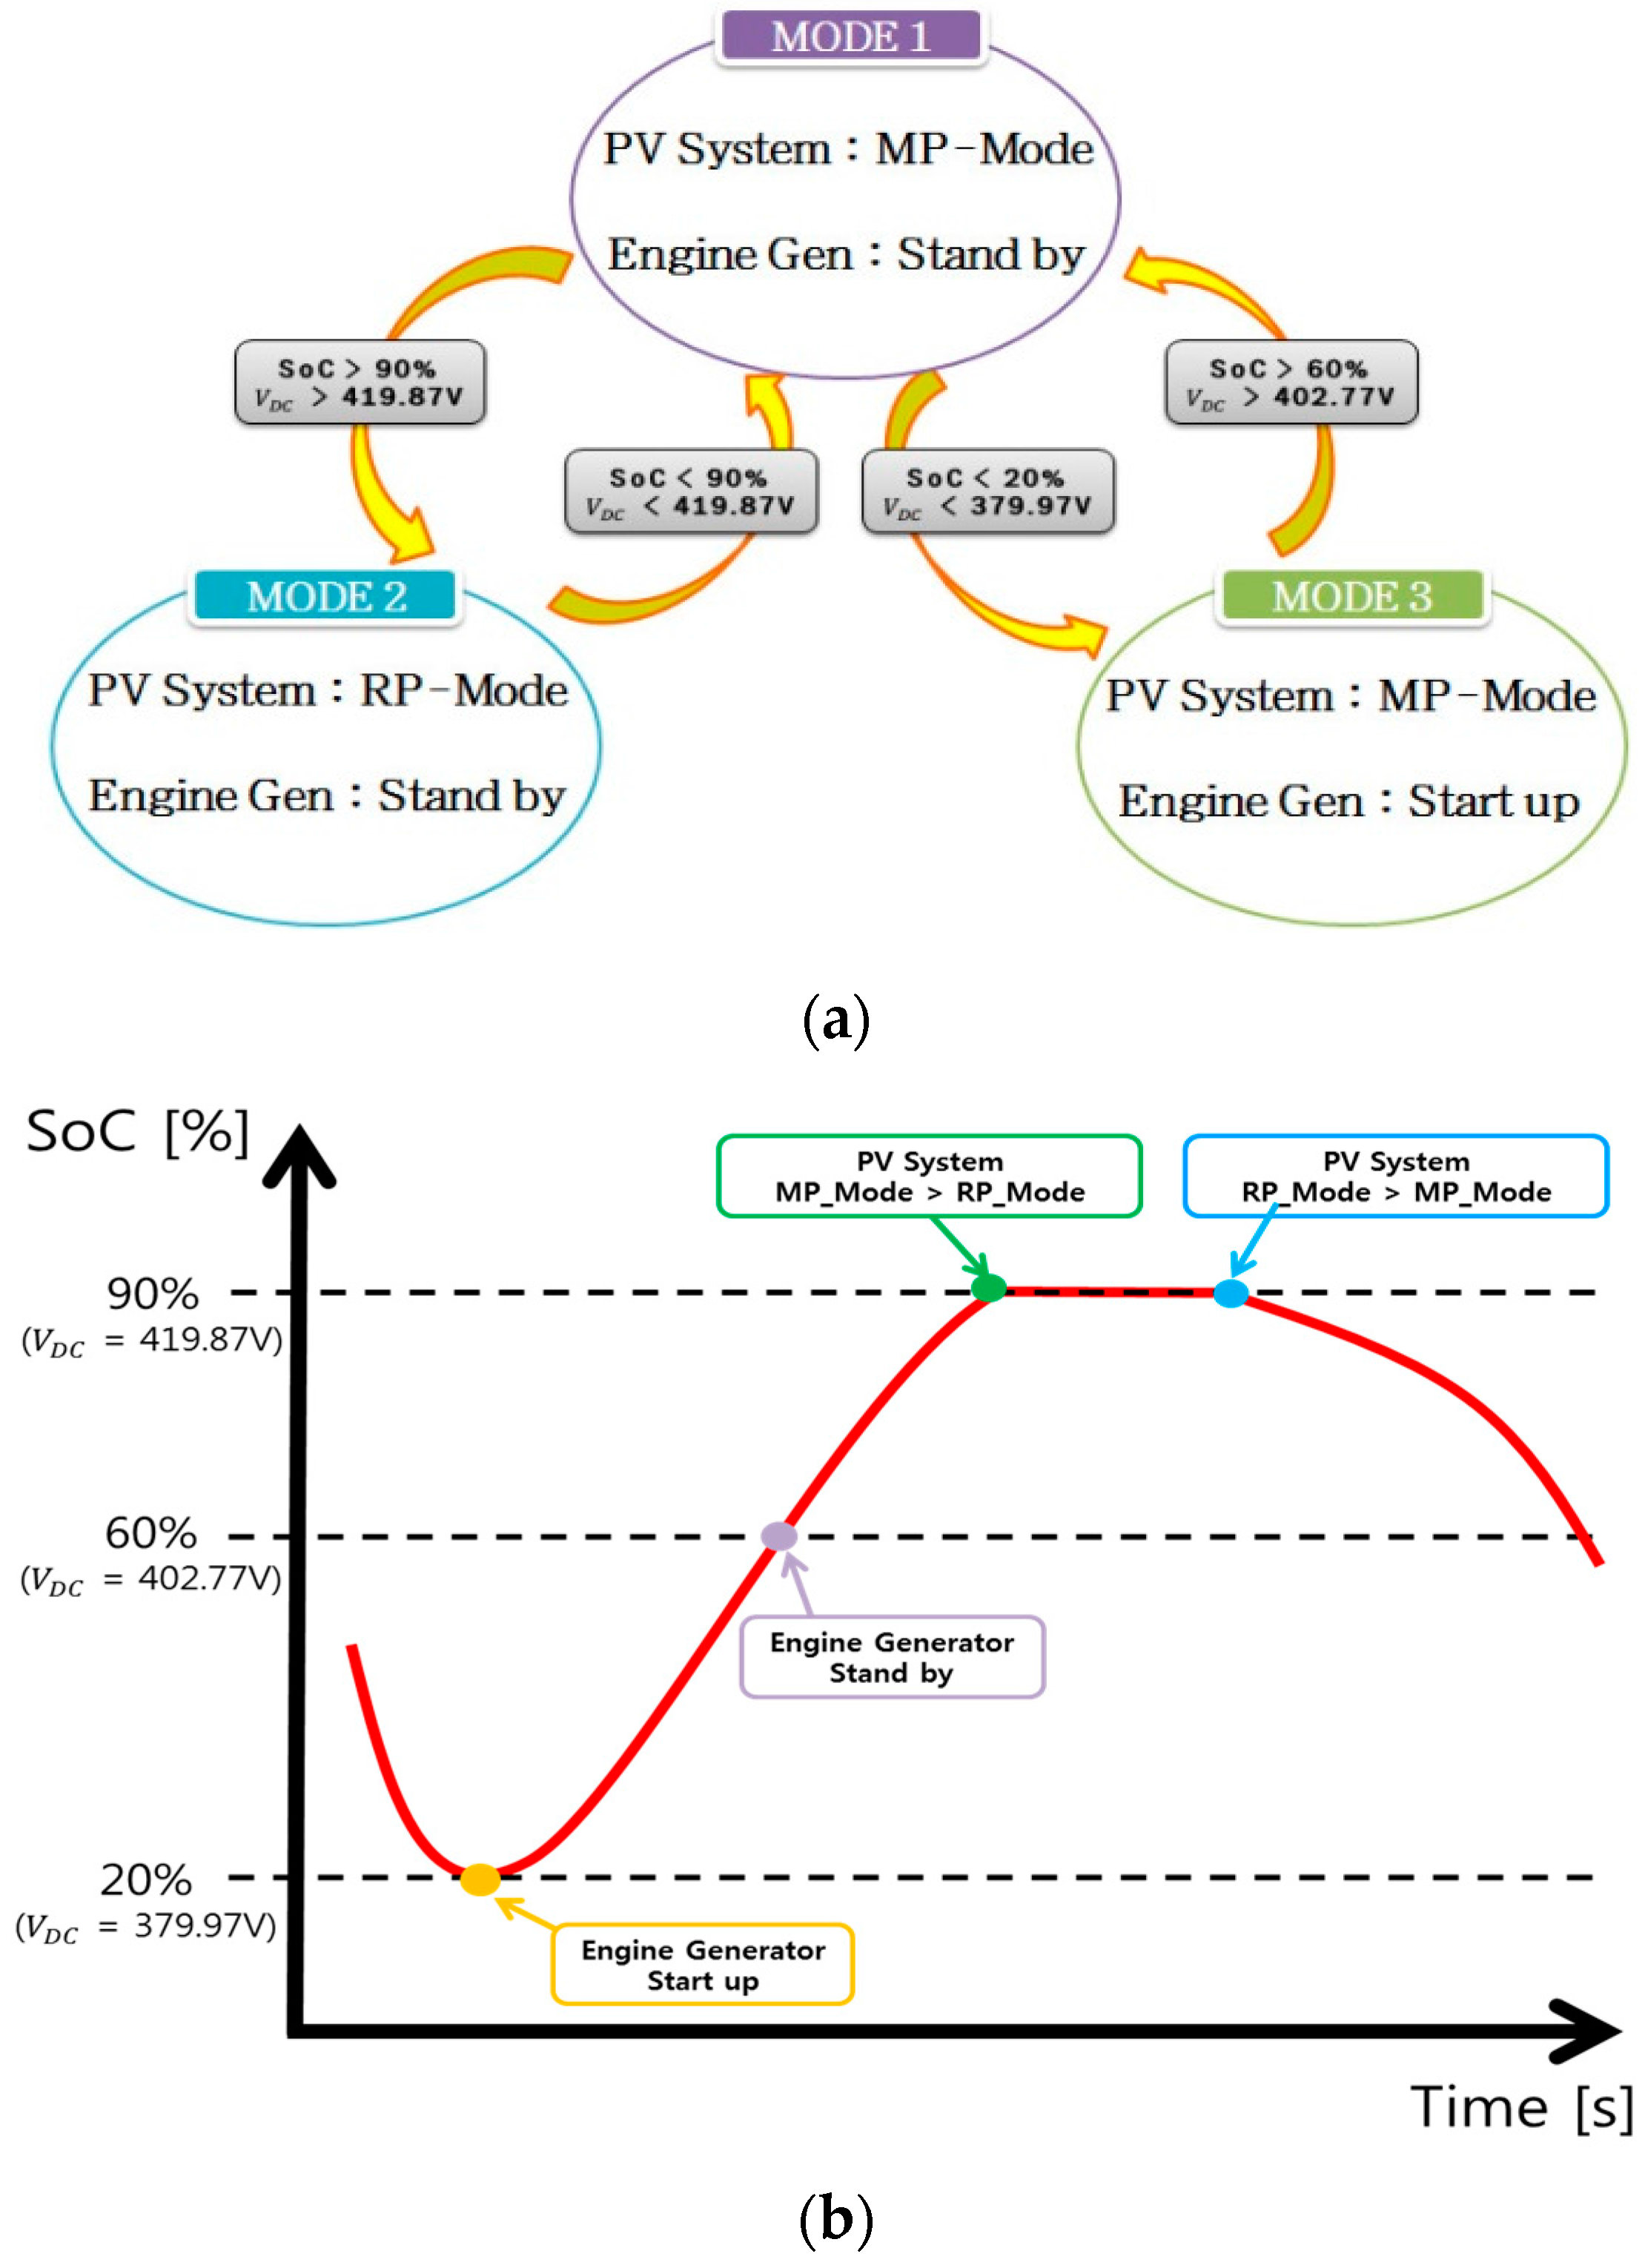
Figure 9a shows the three operation modes according to the SoC of the BESS. In Mode 1, the PV generator operates in the maximum power mode MP_MODE and the EG is not started when the battery SoC is between 20% and 90%. In Mode 2, when the SoC reaches 90%, the PV generator changes from the MP_MODE to the reduced power mode RP_MODE, and the EG is not operated for battery protection. In Mode 3, when the battery SoC reaches 20%, the PV generator operates in MP_MODE and the EG operates at the maximum output.
Figure 9b shows a curve plotting the variation of SoC over time. When the SoC reaches the lower limit of 20%, the EG is started. The PV generator and the EG operate in parallel until the SoC reaches 60%, at which point the EG stops running and the battery is charged only by the PV generator. Furthermore, when the SoC reaches the upper limit of 90%, the output of the PV generator is reduced and maintained at the load size. Then, when the load increases and the SoC starts to decrease, the PV generator operates at the maximum output.
6. Computer Simulations
Computer simulations were performed using the proposed operation scheme for the stand-alone DC microgrid shown in
Figure 1. For the solar cell in the PV generator, the dynamic equation derived from the equivalent circuit was modeled with C code. For the lithium-ion battery in the BESS, the Shepherd model derived from the equivalent circuit was used [
28]. For the EG, the engine speed and torque characteristics were simply modeled and combined with the embedded generator model.
Table 2 shows the electrical characteristics of EG, PV generator, BESS, and load used in the simulation. The average and maximum power consumptions of the load were assumed to be 3 kW and 4 kW, respectively. For the BESS, two sunless days were assumed with an operational range from 20%–90%. Average battery-use time was assumed to be 12 h and the battery voltage was assumed tp be 250 V. However, the battery capacity was assumed to be 6 kWh for easy checking of the SoC variation. For the PV generator, the output power was set at 3 kW assuming 80% of efficiency, considering the power loss of each module. The output power of the EG was set at 4 kW, considering the maximum power usage of consumers.
The duration of computer simulation was set for 23 s for speeding up the computer run time and effectively checking the performance according to the whole mode change described in
Figure 9. The load variation was arbitrarily defined by assuming the power usage pattern. The output of the PV generator was set from 8 s considering typical daily sunshine. Furthermore, the simulation scenario was designed for a proper performance comparison that reflects the mode change process shown in
Figure 9.
Table 3 lists the points that must be checked throughout the simulation.
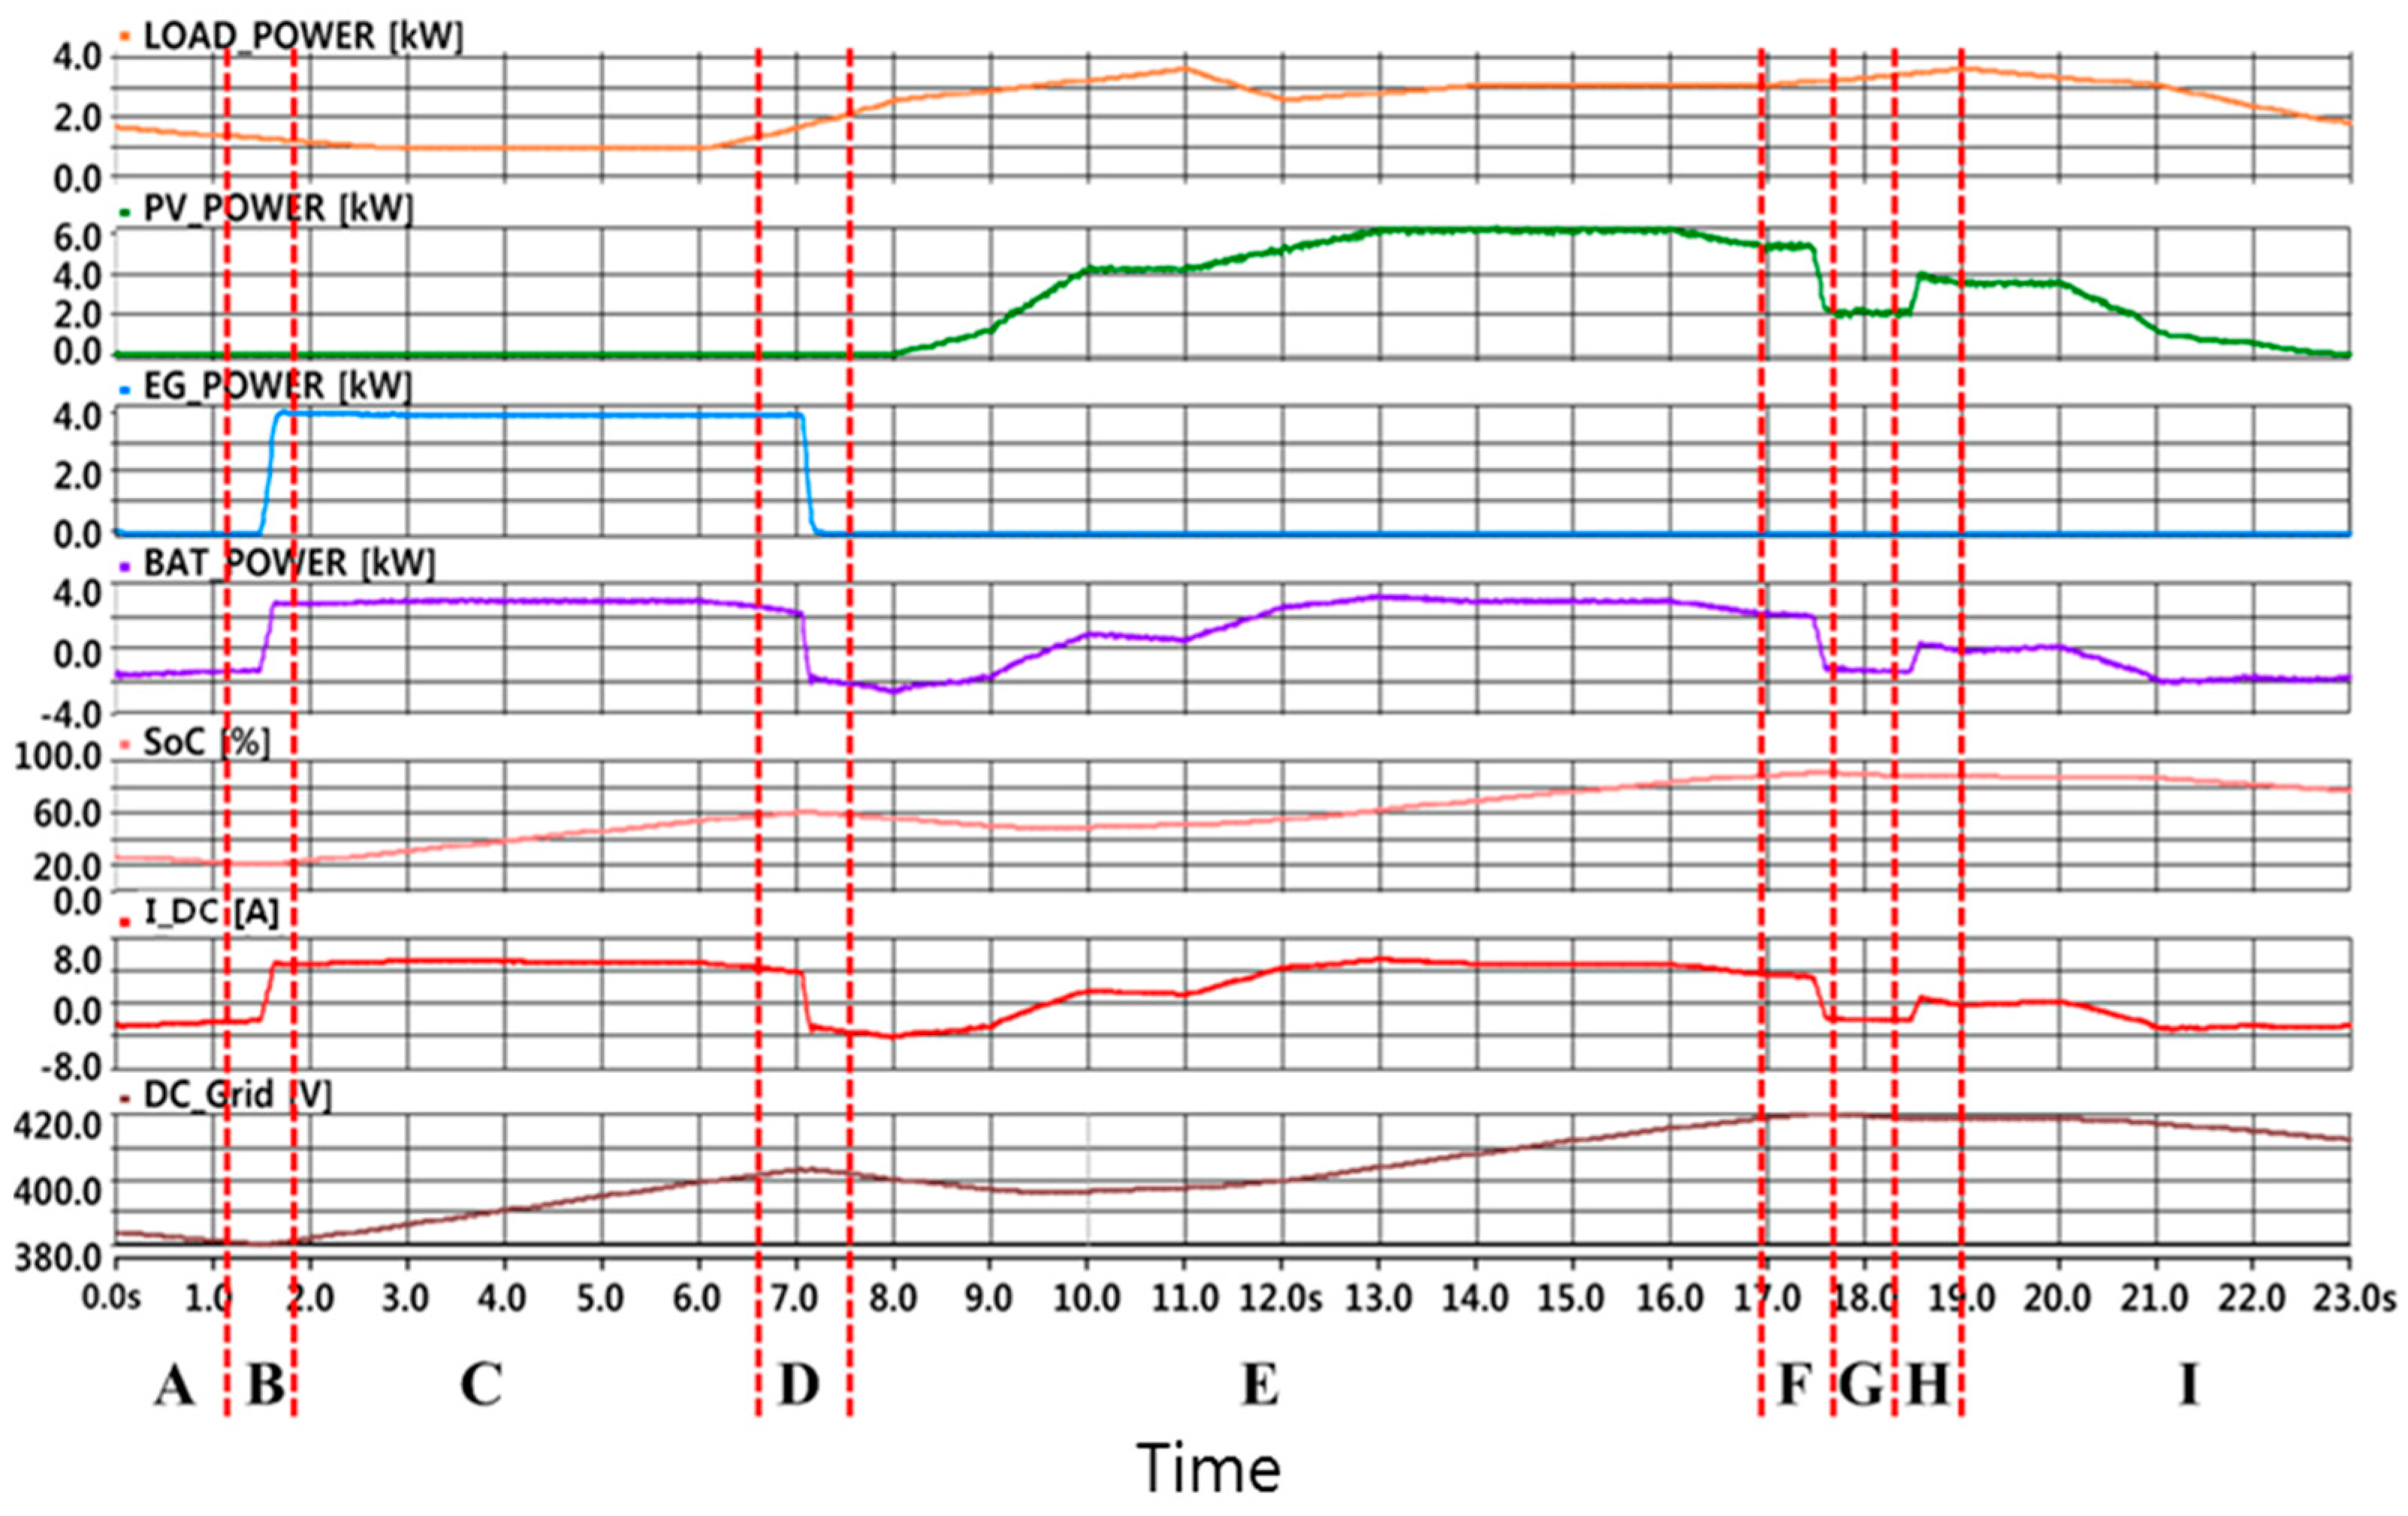
Figure 10 shows the simulation results, representing the transition process from Mode 1 to Mode 2, and vice versa, and from Mode 1 to Mode 3, and vice versa. The graphs from the top show the load power, PV power, EG power, battery power, battery SoC, BESS current, and DC grid voltage.
Section A shows the mode 1 operation assuming that initial SoC was set to 25%. Although the PV generator operates in MP_MODE, the output power is 0 kW because sunshine occurs after 8 s. Additionally, the EG does not generate the output power because the SoC does not reach the bottom limit. Thus, the BESS has to provide 100% of the load power. This causes the SoC to decrease from 25% to 20%. The DC grid voltage decreases from 385 to 380 V due to the SoC variation.
Section B shows the mode transition from Mode 1 to Mode 3. Since the BESS provides the load power by 100%, the battery SoC reaches 20% and mode transition occurs smoothly, The EG starts to generate the output power in MP_MODE and the output power of PV generator is 0 kW because of a lack of sunshine.
Section C shows the Mode 3 operation in which the EG generates the maximum output power of 4 kW. The EG charges the battery in the BESS and the battery SoC increases from 20% to 60%. The DC grid voltage rises from 380 V to 403 V.
Section D shows the mode transition from Mode 3 to Mode 1. When the battery SoC reaches 60%, EG stops to charge the battery and the BESS with the PV generator supplies the load power.
Section E shows the PV generator operates in MP_MODE as sunshine starts at 8 s. Since the PV output power is lower than the load power until 9.5 s, the BESS operates in discharge mode. However, the BESS operates in charge mode after 9.5 s because the PV output power continuously increases due to the increased sunshine. So, the SoC decreases until 9.5 s after then increases again.
Section F shows the mode transition from Mode 1 to Mode 2 when the SoC reaches 90%. The PV generator operates in RP_MODE to protect the battery from overcharge. The BESS change the operation from the charge mode to the discharge mode.
Section G shows the Mode 2 operation to protect the BESS in which the PV generator generates 2 kW power lower than the required load power. The BESS discharges the output power until the battery SoC falls down to 90% while the PV generator operates in RP-MODE. The DC grid voltage reaches the maximum level of 420 V.
Section H shows the mode transition from Mode 2 to Mode 1 when the battery SoC decreases from the upper limit of 90%. The mode transition occurs smoothly and the DC grid voltage reaches a little bit lower than 420 V.
Section I shows the PV generator operates in MP_MODE as Section E. As the sunshine slowly decreases, the BESS operates in discharge mode. Thus, the DC grid voltage slowly decreases as the battery SoC decreases.
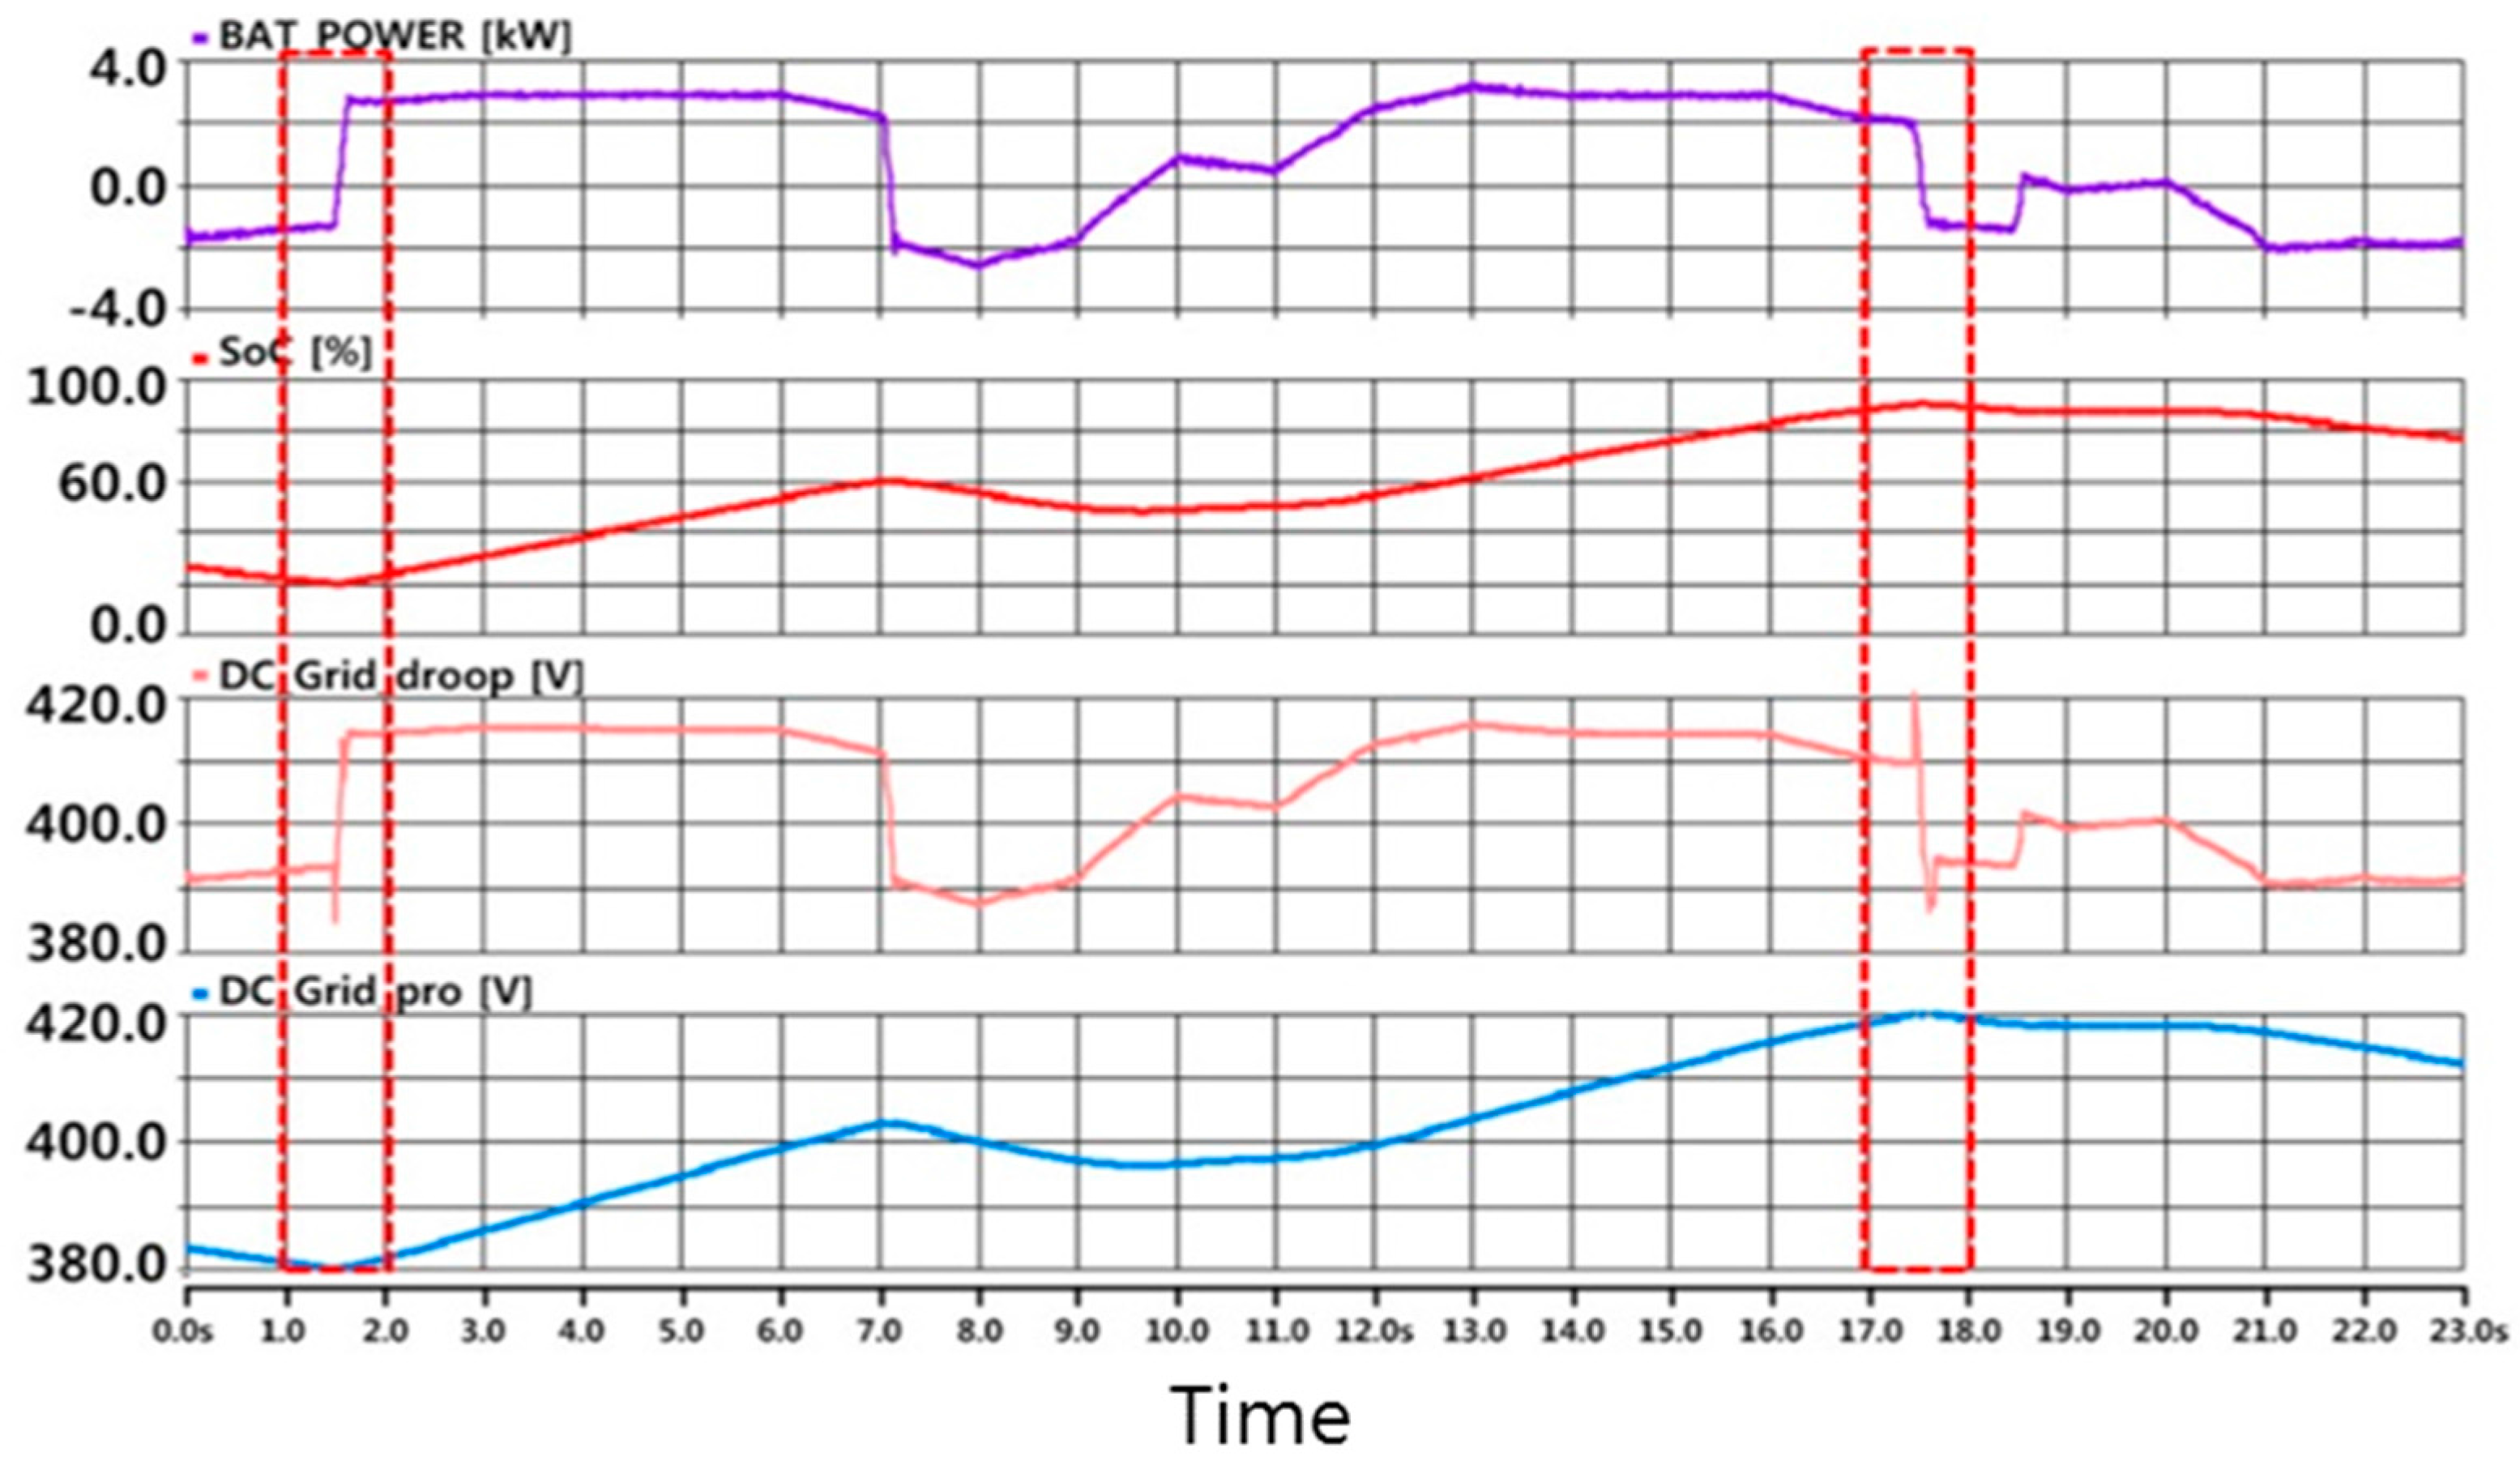
Figure 11 shows the simulation results to compare the proposed control scheme with the existing droop control scheme. The graphs from the top show the battery power, battery SoC, DC grid voltage with droop control, and DC grid voltage with the proposed control.
In the existing droop control the DC grid voltage is obtained by measuring the DC current and multiplying it by the constant resistance. Thus, the DC grid voltage has same variation as the BESS power. However, in the proposed scheme, the DC grid voltage is obtained by measuring the battery SoC and multiplying it by the SoC constant. Thus, the DC grid voltage has same variation as the battery SoC. However, in both control schemes the DC grid voltages are maintained between 380 and 420 V.
The mode transition was marked at which the battery SoC reaches the lower limit of 20% and the upper limit of 90%. The battery SoC reaches the lower limit of 20% from 1 to 2 s to protect the battery from over-discharge. Since the exiting droop adjusts the virtual resistance, the DC grid voltage suddenly drops to 385 V and rises up to 415 V. Thus, a maximum of 7.5% voltage variation occurs. However, in the proposed control scheme, as the battery SoC reaches 20%, the DC grid voltage also reaches the lower limit and the EG starts to operate.
The battery SoC reaches the upper limit of 90% from 17 to 18 s to protect the battery from over-charge. In the exiting droop, the virtual resistance is adjusted, the DC grid voltage suddenly rises up to 420 V and decreases down to 385 V. Thus, a maximum 8.75% voltage variation occurs. However, in the proposed control scheme, as the battery SoC reaches 90%, the DC grid voltage also reaches the upper limit of 420 V.
Therefore, the proposed scheme shows better performance in maintaining the DC grid voltage with lower variation.
7. Hardware Experiments
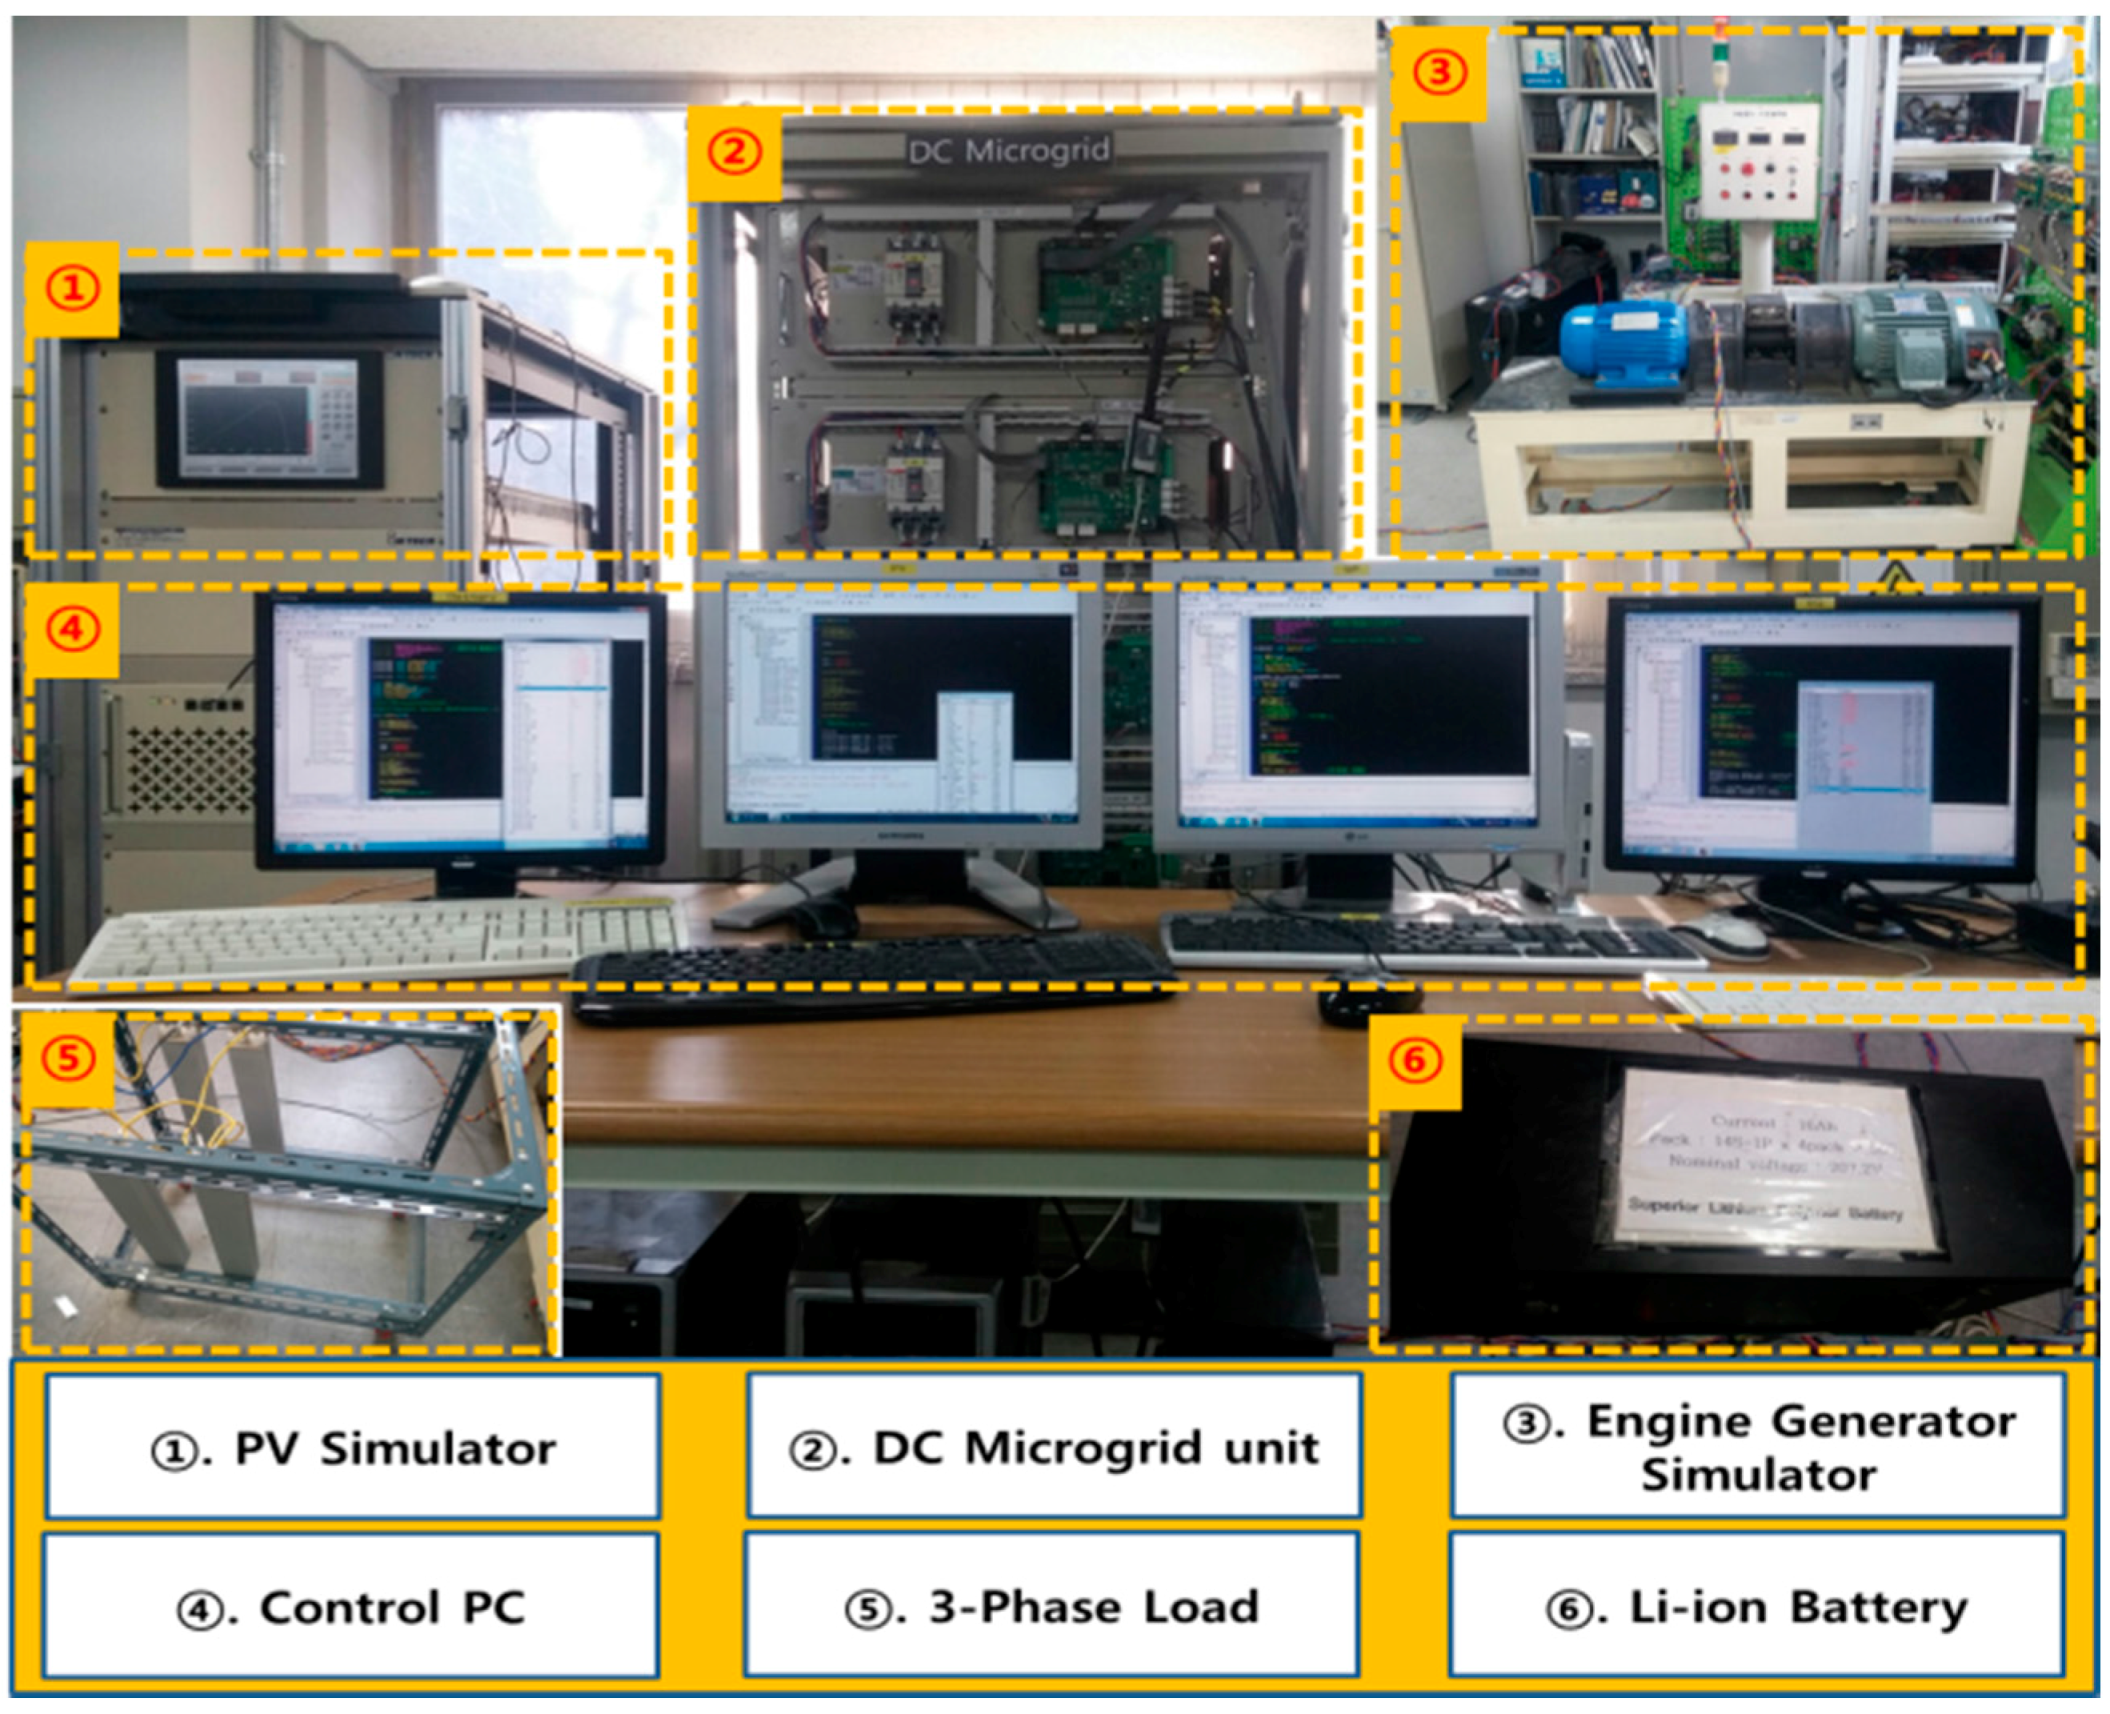
Figure 12 shows a scaled hardware prototype for the stand-alone DC microgrid which was set up in the lab for analyzing the performance of the proposed control through experiments. The scenario in the experiment was defined identically to that in the simulation to compare both results. The duration of the experiment was set for 17 min for speeding up the testing time and effectively checking the performance according to the whole mode change described in
Figure 9.
The BESS used in the experiment has a battery management system (BMS) which measures the SoC value in real-time. The measuring accuracy of the SoC is ±1%. The SoC data were sent to the central controller through CAN communication from the BMS. The load was assumed to be a three-phase resistive load which has variation with respect to time according to the operational scenario. Furthermore, as with the simulation, the SoC operational range was varied to analyze the results of the operational change. The enlarged data were observed to check the SoC variation in a short time.
The operation range of SoC in the experiments was set from 42% to 60% for easy checking of the variation in a short duration of experiment. Thus, 42% of the SoC in the experiment corresponds to 20% of the SoC in the simulation, while 60% of the SoC in the experiment is corresponds to 90% of the SoC in the simulation.
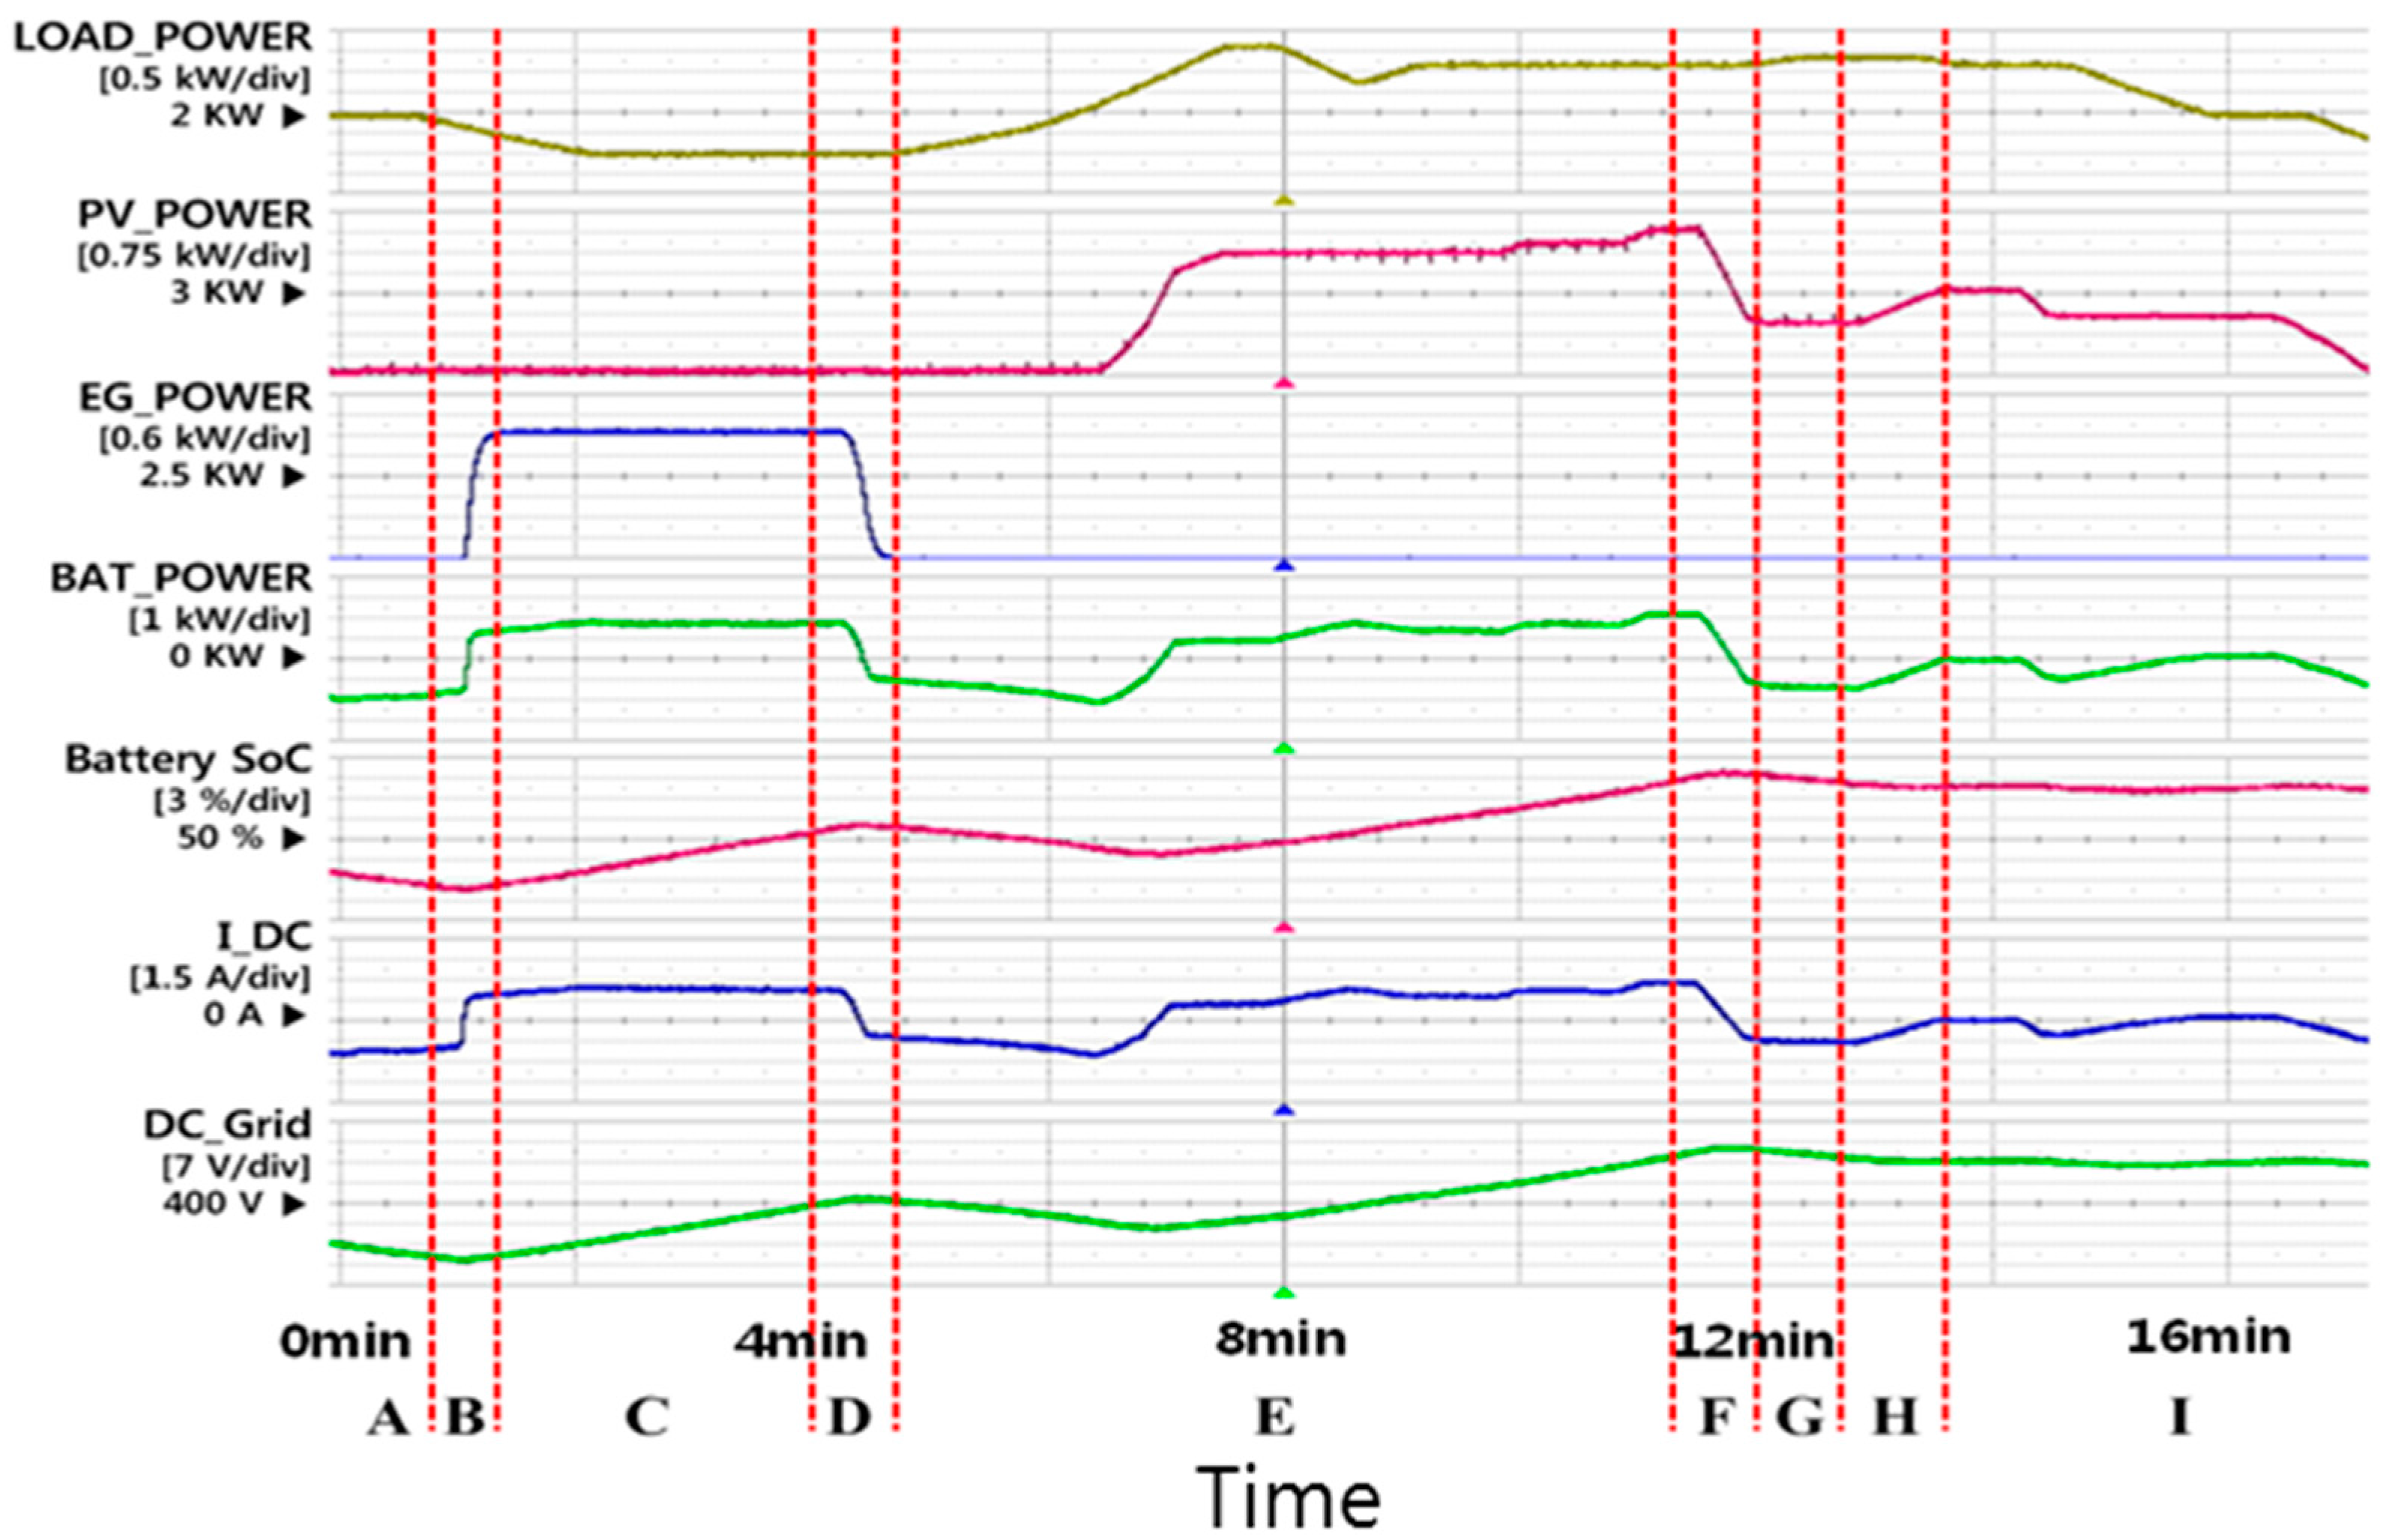
Figure 13 shows the experiment results, representing the mode transition process from Mode 1 to Mode 2, and vice versa, and from Mode 1 to Mode 3, and vice versa.
Section A shows the Mode 1 operation assuming that the initial SoC was set to 45%. The PV power is assumed to be 0 kW because sunshine occurs after 6 min 30 s. Since the EG does not generate the output power, the BESS has to provide 100% of load power. This causes the SoC to decrease from 45% to 42%. The DC grid voltage decreases from 385 V to 380 V due to the SoC variation.
Section B shows the mode transition from Mode 1 to Mode 3. Since the BESS provides 100% of the load power by the battery, the SoC reaches 42% and the mode transition occurs smoothly, The EG starts to generate at the maximum output power as described in the simulation.
Section C shows the Mode 3 operation in which the EG generates the maximum output power of 4 kW. The EG charges the battery in the BESS and the battery SoC increases from 42% to 52%. The DC grid voltage rises from 380 to 403 V.
Section D shows the mode transition from Mode 3 to Mode 1. When the battery SoC reaches 52%, the EG stops to charge the battery as explained in the simulation.
Section E shows the PV generator operating in MP_MODE as sunshine starts at 6 min 30 s. Since the PV output power is lower than the load power until 7 min, the BESS operates in discharge mode. However, the BESS operates in charge mode after 7 min as explained in the simulation.
Section F shows the mode transition from Mode 1 to Mode 2 when the SoC reaches 60%. The DC grid voltage reaches the maximum level of 420 V and the PV generator operates in RP_MODE to protect the battery from overcharge as explained in the simulation.
Section G shows the Mode 2 operation in which the PV generator generates 2 kW power lower than the required load power. The BESS discharges the output power until the battery SoC falls to 60% while the PV generator operates in RP-MODE.
Section H shows the mode transition from Mode 2 to Mode 1 when the battery SoC decreases from the upper limit of 60%. The mode transition occurs smoothly and the DC grid voltage reaches a bit lower than 420 V as shown in the simulation.
Section I shows the PV generator operates in MP_MODE as Section E. As the sunshine slowly decreases, the DC grid voltage slowly decreases as the battery SoC decreases as explained in the simulation.
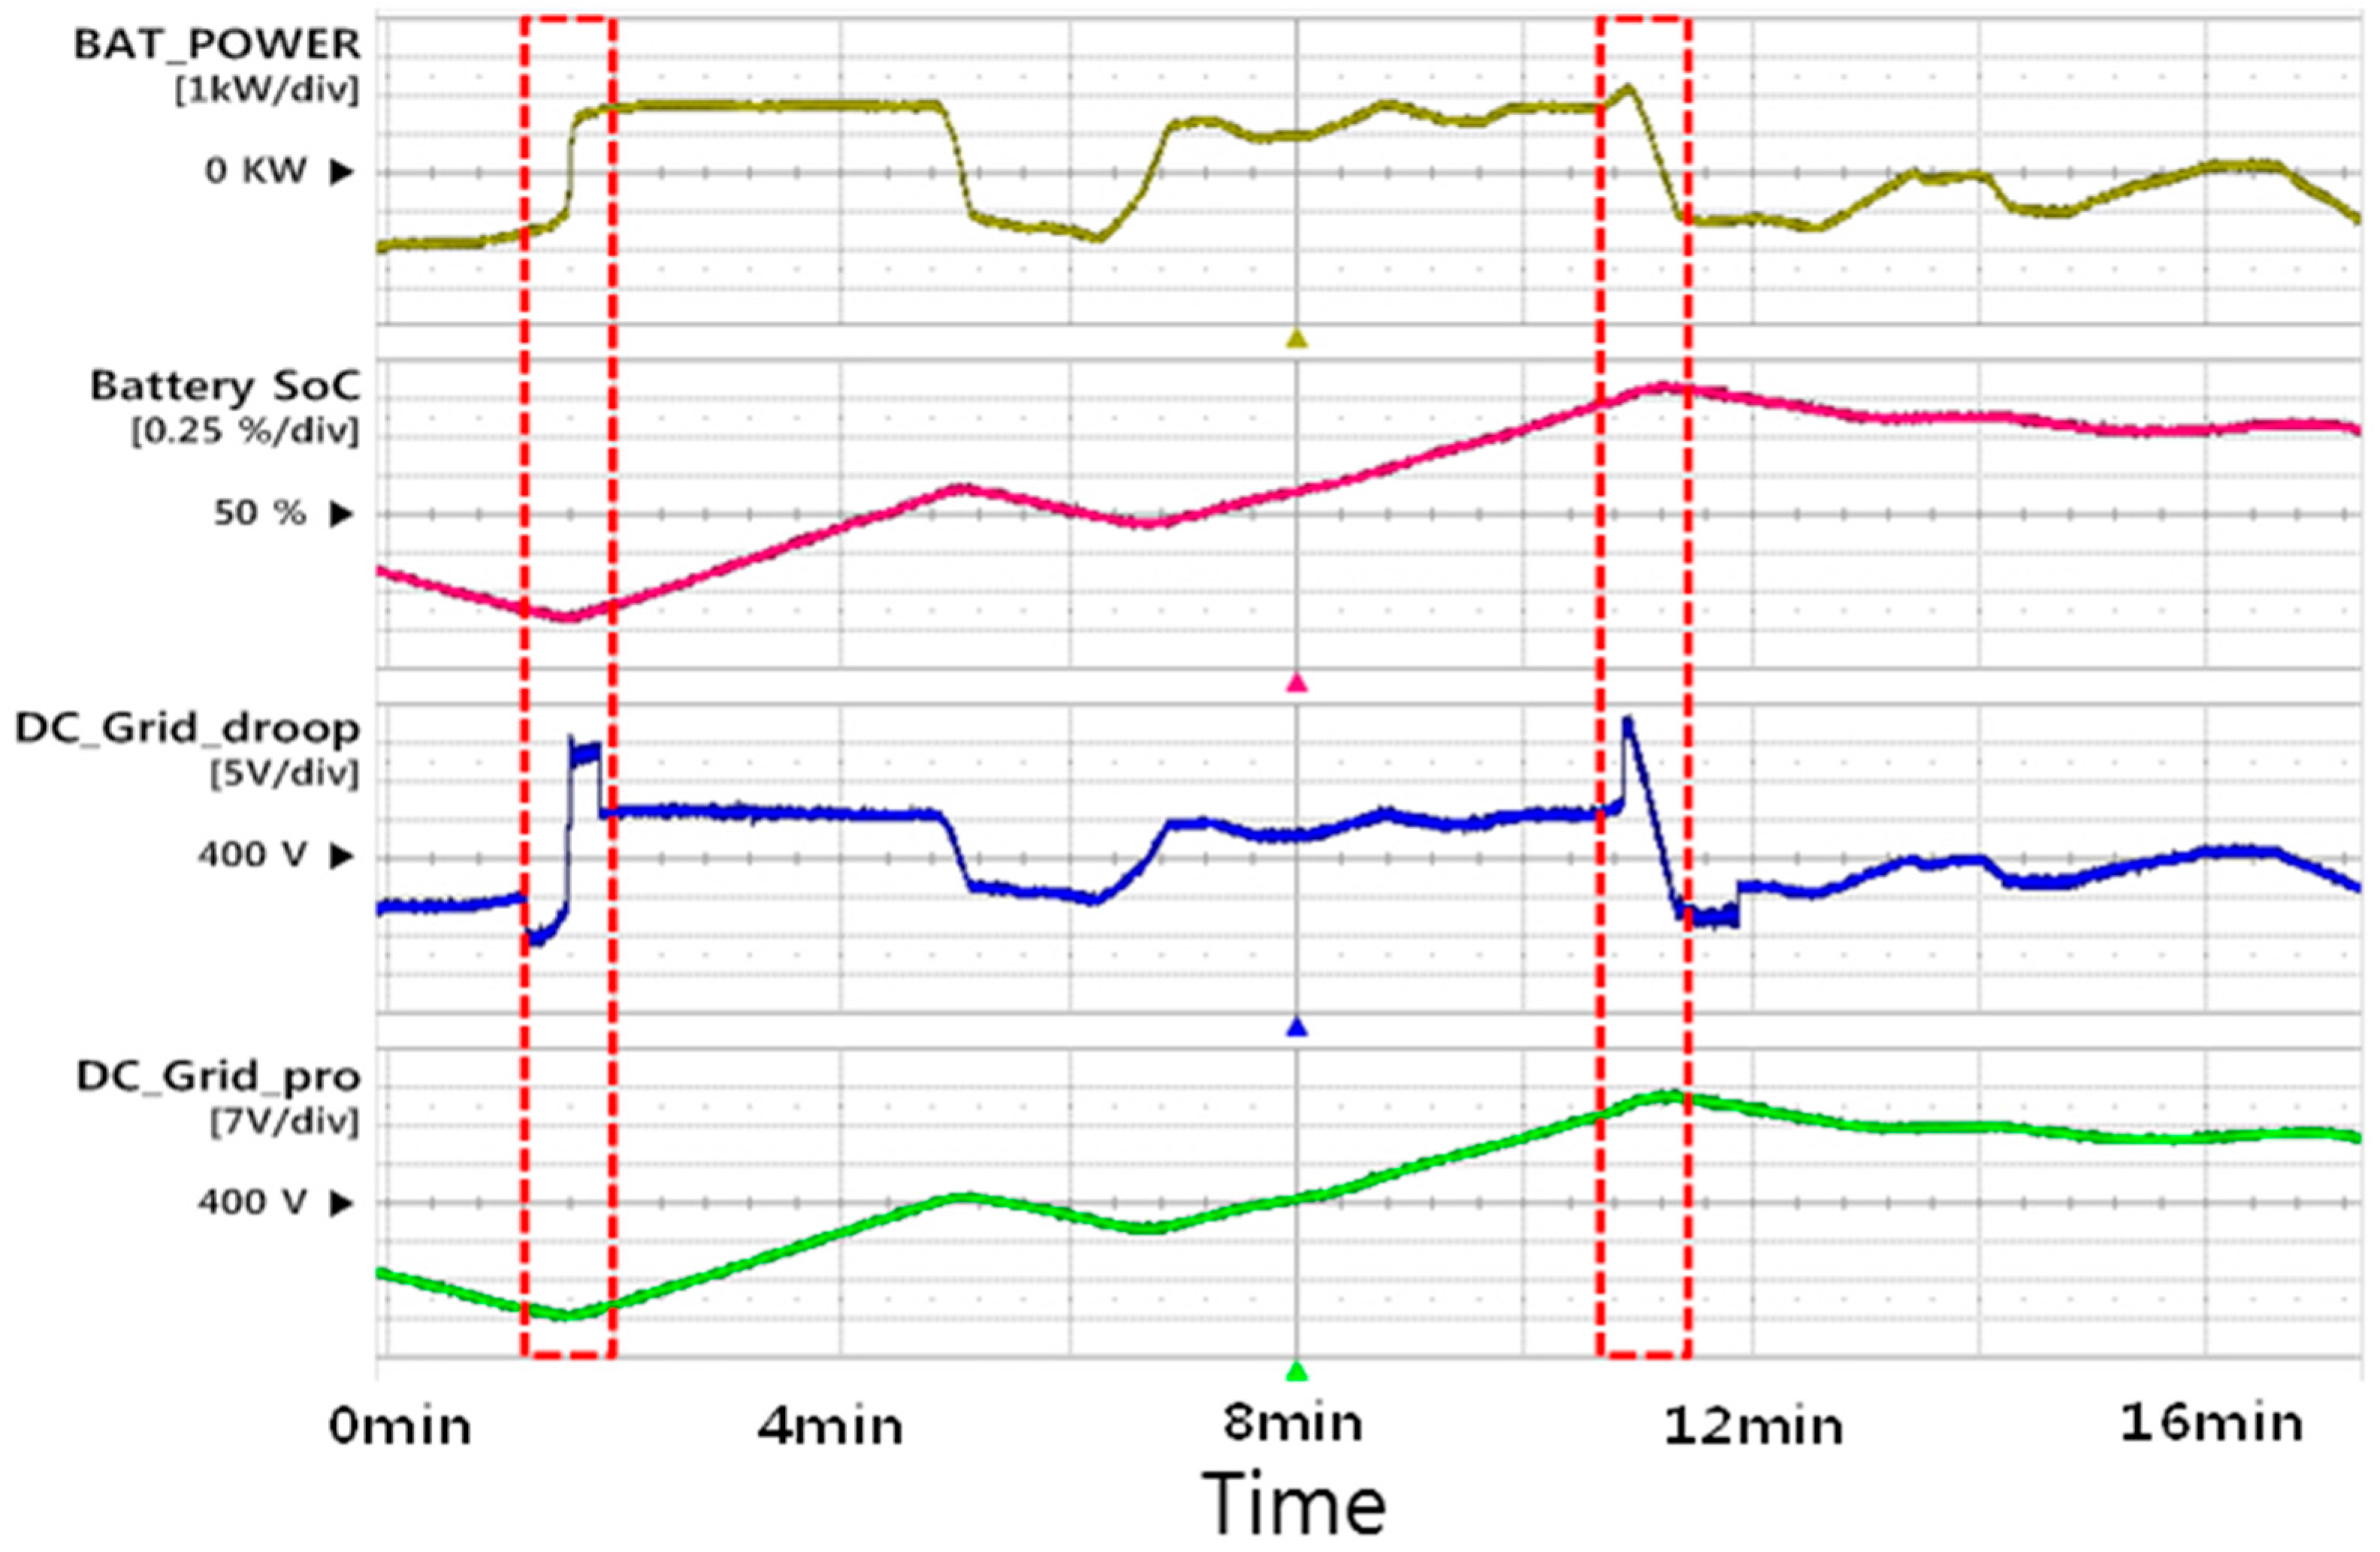
Figure 14 shows the comparison of experimental results between the existing droop control and the proposed control scheme. The transitions are marked between 1 min 20 s and 2 min, and between 10 min 40 s and 11 min 20 s. The proposed control scheme offers a lower DC grid voltage variation compared with the existing droop control.
In the change from Mode 1 to Mode 3 between 1 min 20 s and 2 min, the DC grid voltage changes 6.25% from 390 V to 415 V using the existing droop control. Additionally, in the change from Mode 1 to Mode 2 between 10 min 40 s and 11 min 20 s, the DC grid voltage changes 7.5% from 420 to 390 V using the existing droop control. However, the DC grid voltage changes smoothly with lower variation.
8. Conclusions
A new method of controlling the DC output voltage of a BESS based on the SoC, instead of performing droop control based on the DC output current, was proposed for the stable operation of a stand-alone DC microgrid.
To analyze the excellence of the proposed control, computer simulations were conducted. Based on the simulation results, a scaled-down hardware prototype for a stand-alone DC microgrid with a controller was built in the laboratory. Experiments were conducted in the same manner as the simulation scenario to compare the performance between the proposed control and the conventional droop control. The proposed control showed better performance with a narrower and slower variation in the DC output voltage compared to the conventional droop control.
The proposed method has a main limitation that we have to know the characteristic curve of the battery output voltage with respect to SoC. In the case of the Li-ion battery, the characteristic curve has a linear relationship in the SoC values of 20%–90%. However, if the battery is not a Li-ion type, for example nickel metal-hydride, the characteristic curve has non-linearity which makes it impossible to apply the proposed method directly. In this case, the characteristic curve is divided into two or three pieces of linear segment. The proposed droop control can be applied for each segment of the characteristic curve in the SoC values from 20%–90%. In the future work this approach will be tried for other types of batteries.


