
Condensation Risk Due to Variations in Airtightness and Thermal Insulation of an Office Building in Warm and Wet Climate

Abstract
:1. Introduction
- By using TRNSYS simulation, condensation conditions for all wall surfaces in an office building were investigated to identify the location(s) where condensation occurred.
- TRNFLOW was coupled to TRNSYS simulation to take into consideration the effect of air movements on condensation, e.g., supply air (SA), return air (RA) and exhaust air (EA) of the air-conditioning system; buoyancy due to variation in temperatures; infiltration and exfiltration.
- Condensation risks were estimated throughout the year, including when the air-conditioning system was not in operation.
- The adsorption-desorption of building materials, including papers in office building, was estimated.
- An index for evaluating condensation risk was proposed that utilizes the condensation ratio (CRt), condensation frequency (CFn) and condensation risk (CR).
- Furthermore, the effect of the airtightness of the window and variations in the thermal insulation properties of the external walls, roofs and windows, which are considered to affect the occurrence of condensation, on the CR were examined, and measures to restrain building condensation were discussed.
2. Condensation Risk Estimation under Reference Conditions
2.1. Outline of Condensation Risk Estimation
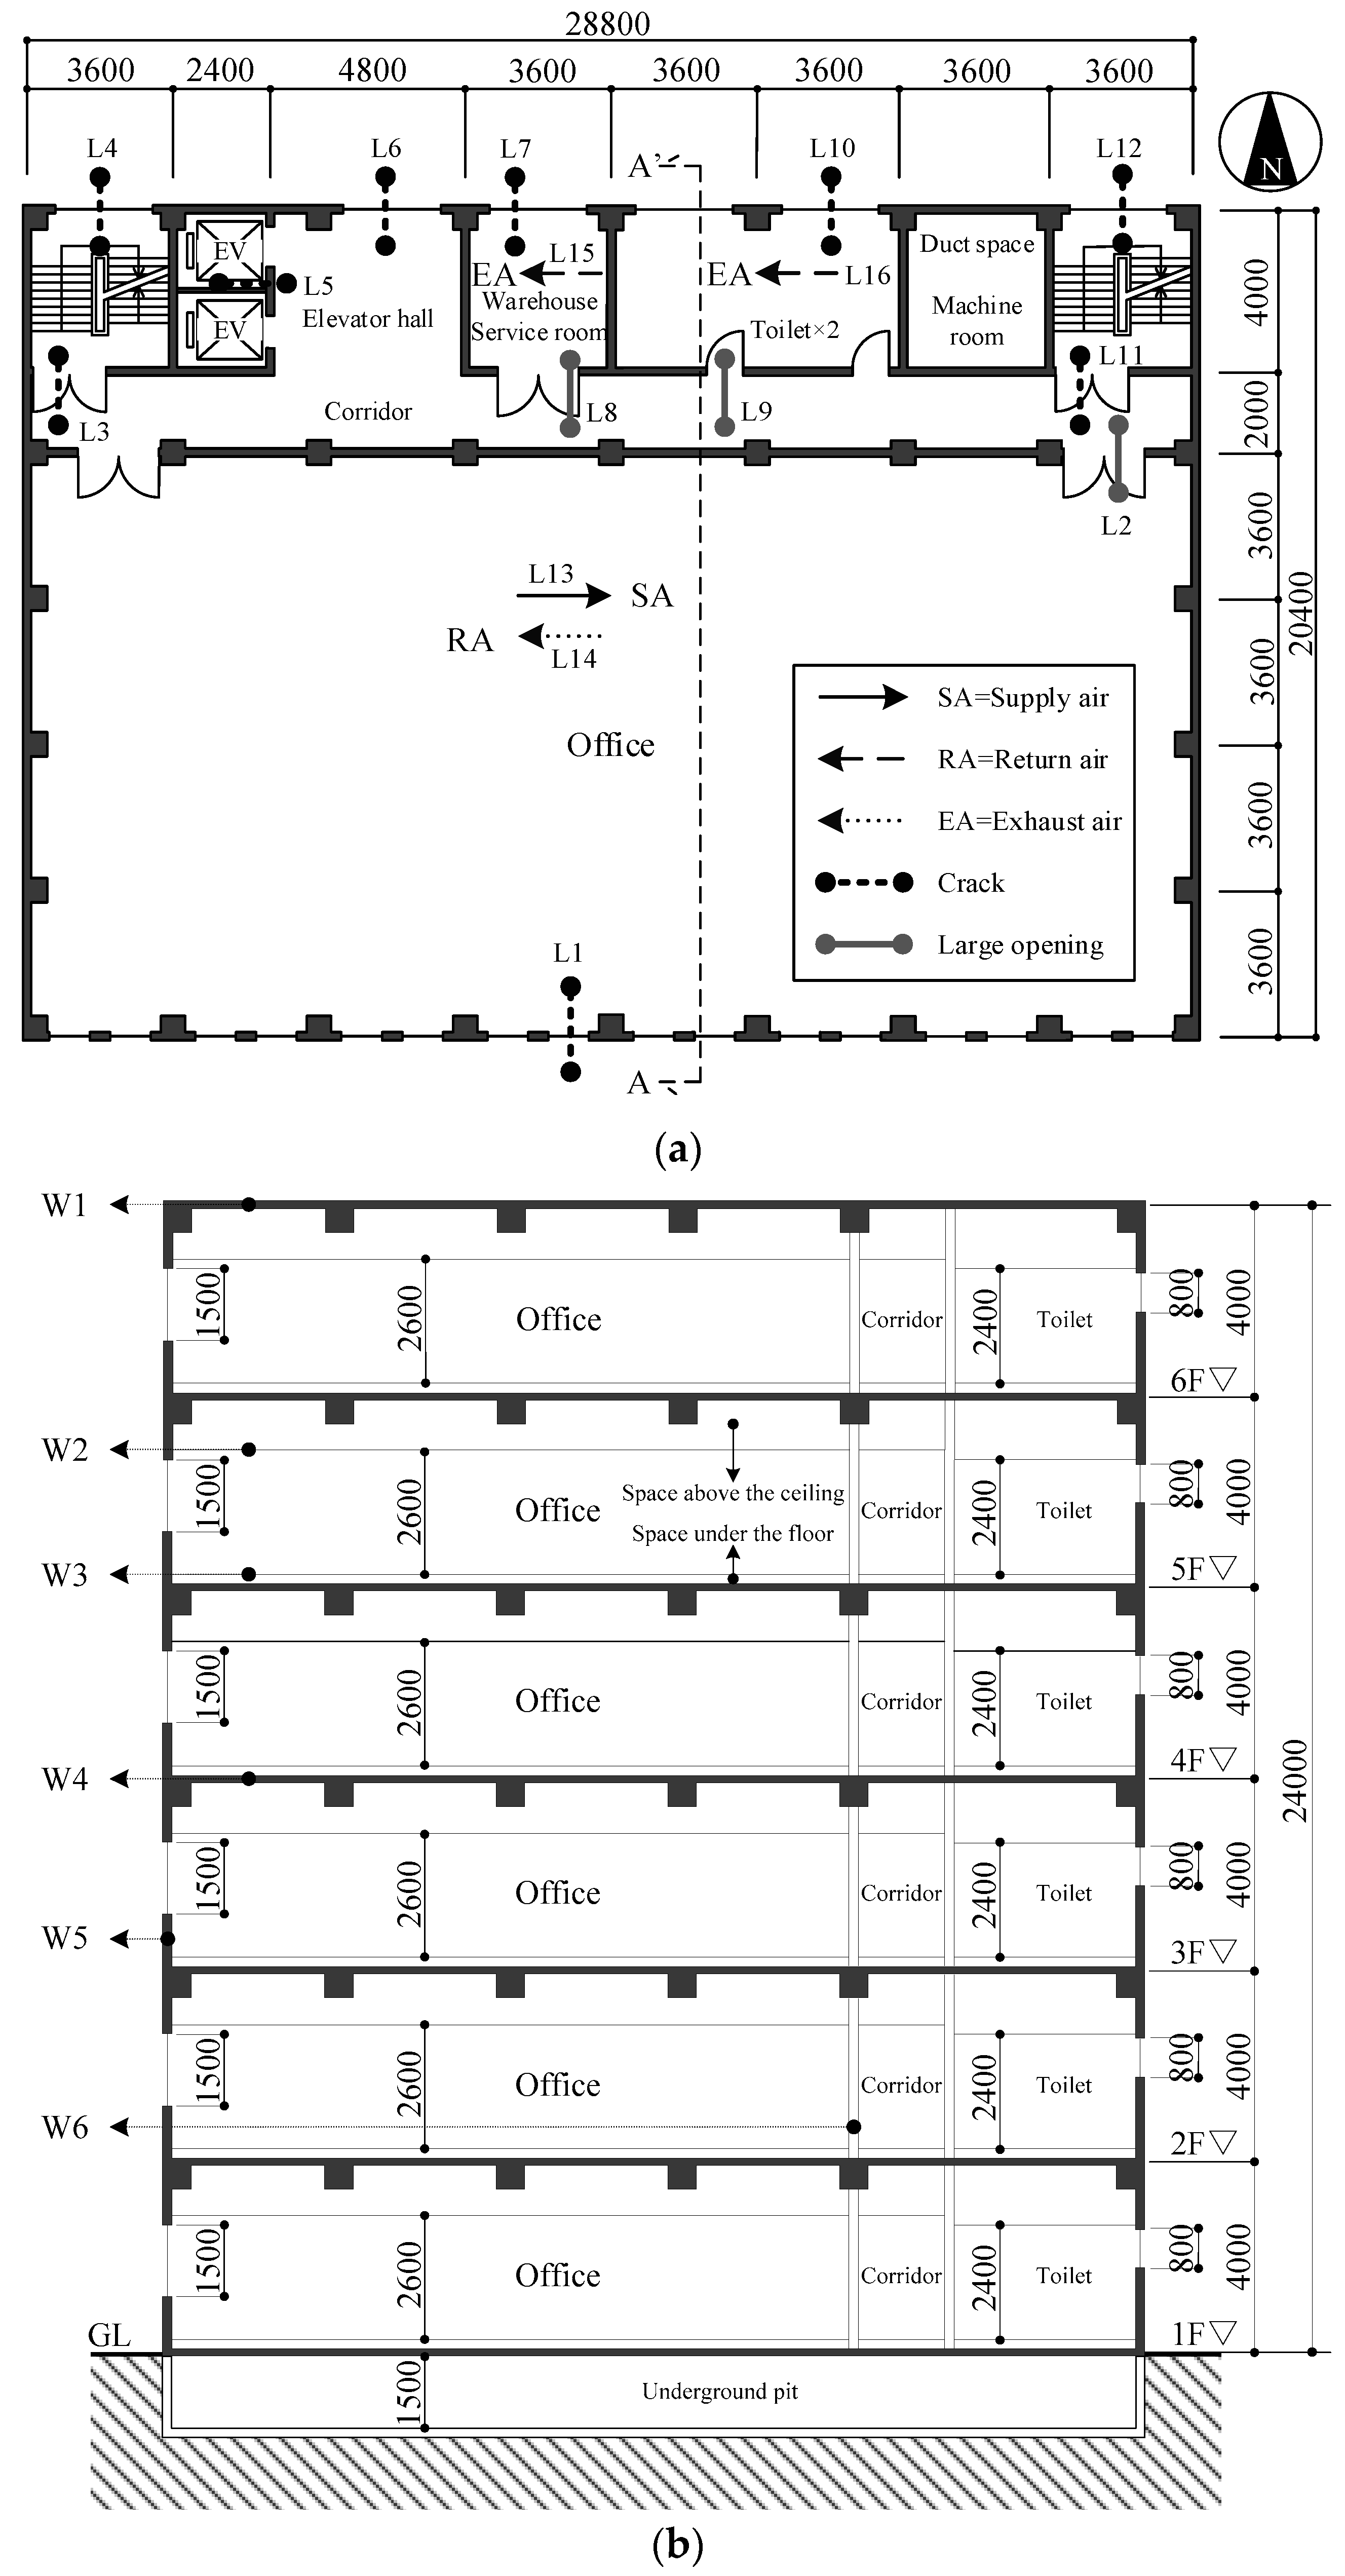
2.1.1. Analyzed Building Characteristics
2.1.2. Internal Conditions in the Building
2.1.3. Airflow Network in the Building
2.1.4. Supply Air Condition of Air-Conditioning
2.1.5. Moisture Adsorption-Desorption of Building Materials
2.1.6. Index of Condensation Risk
2.2. Results and Discussion of Condensation Risk Estimation under Reference Conditions
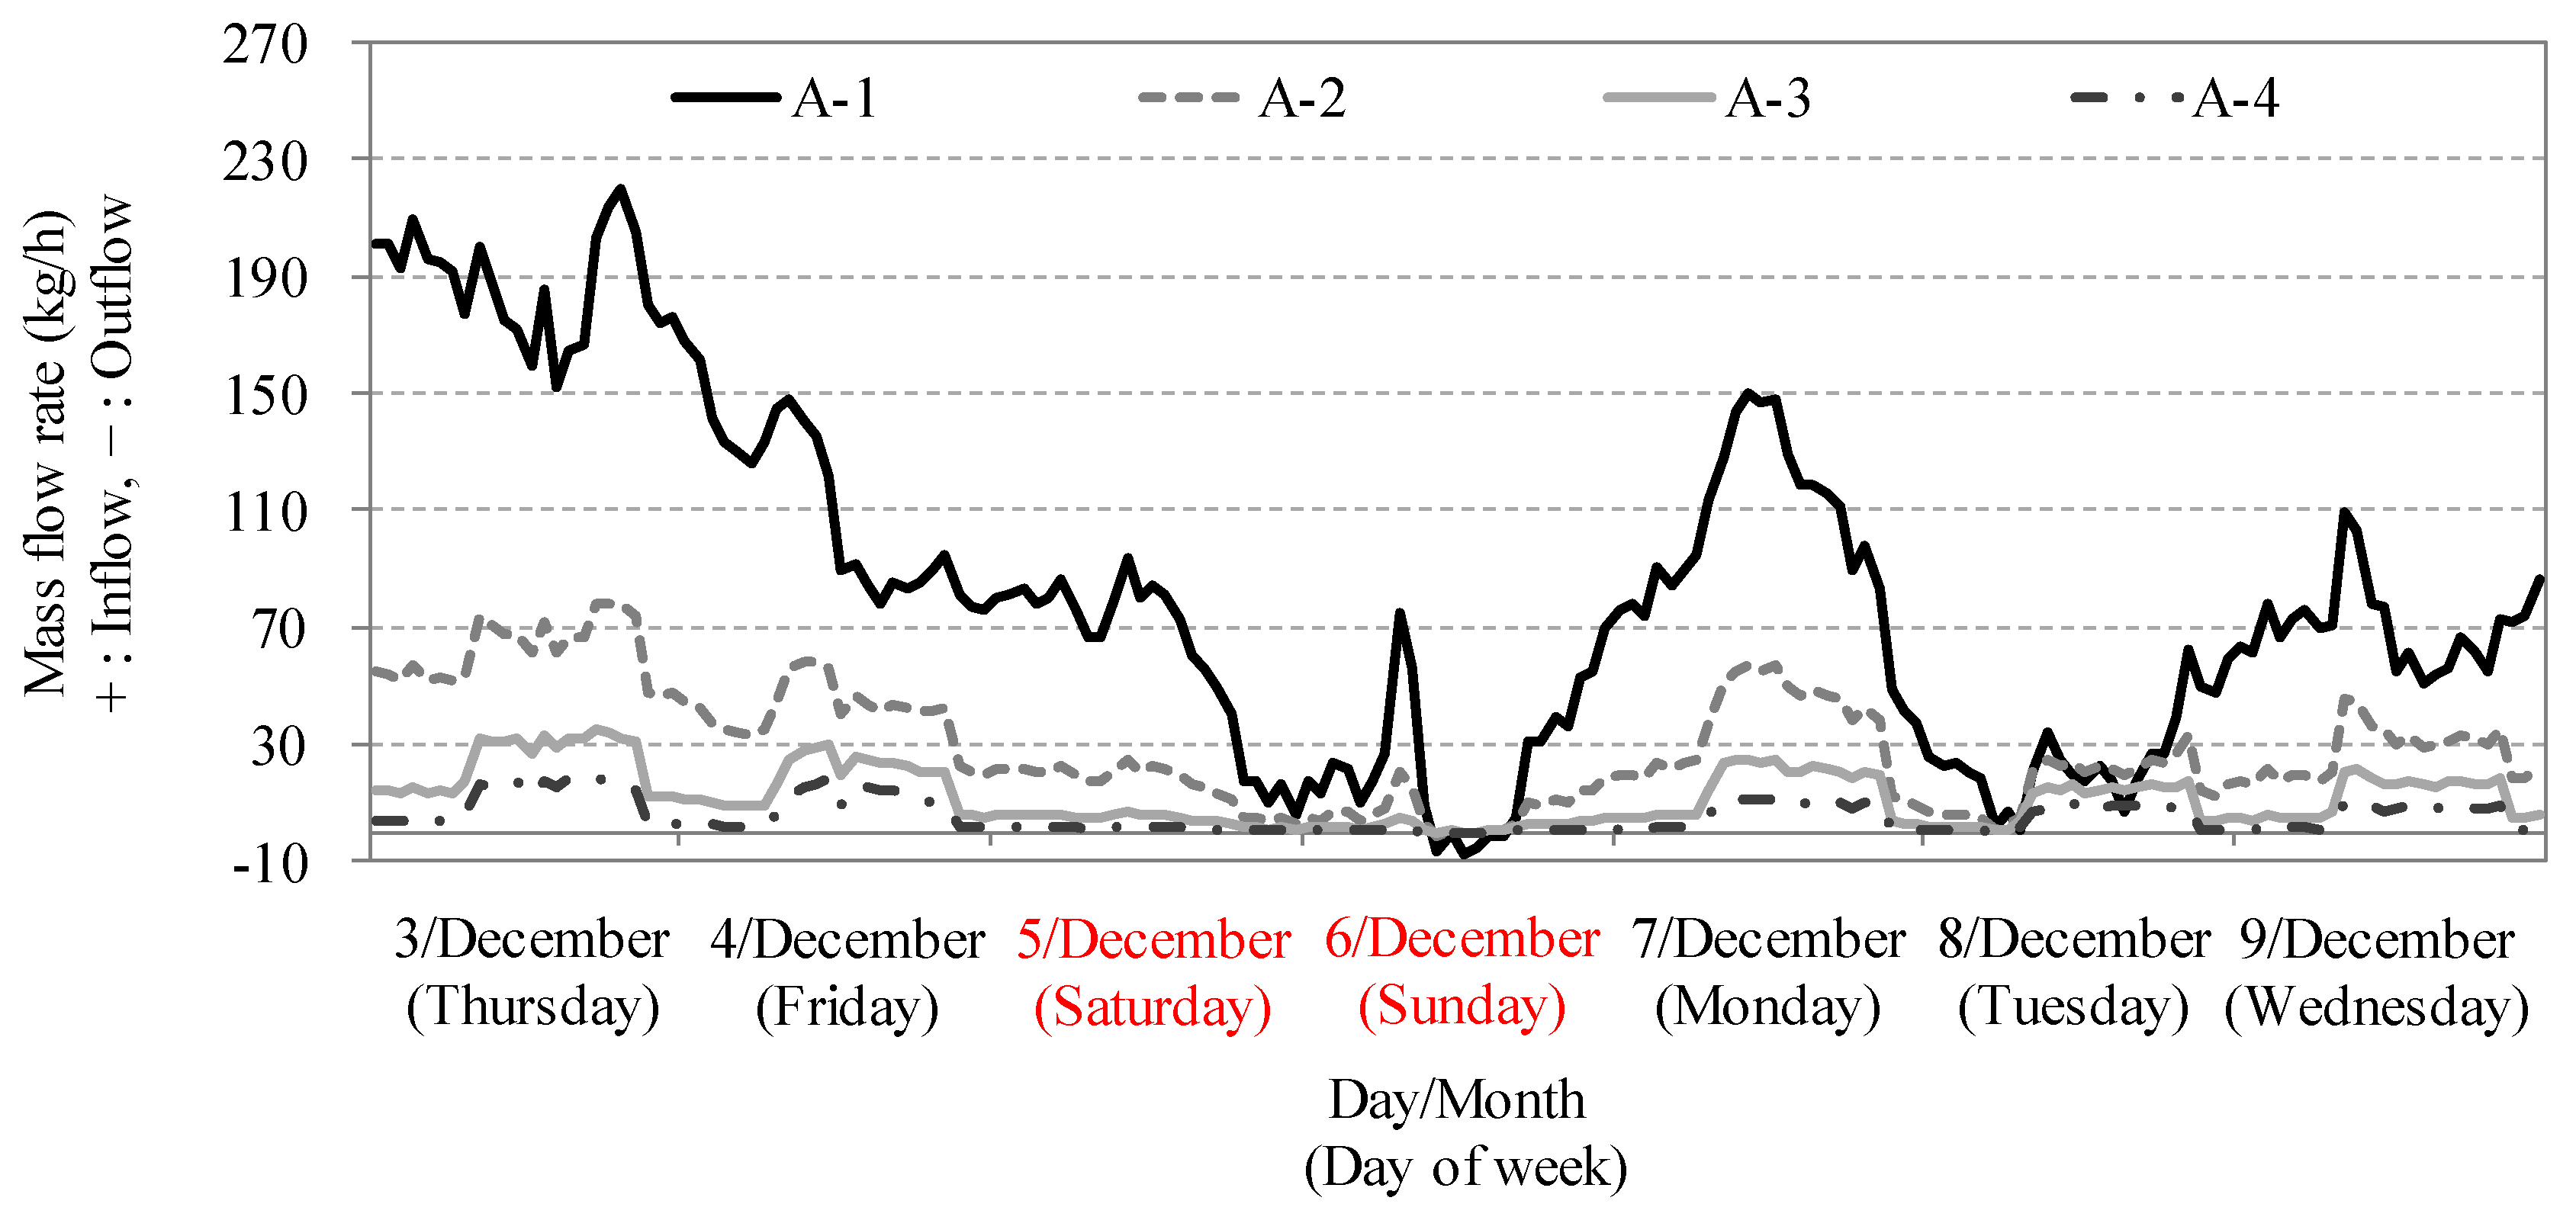
3. Condensation Risk Estimations under Varying Airtightness Conditions
3.1. Case Setup for Airtightness
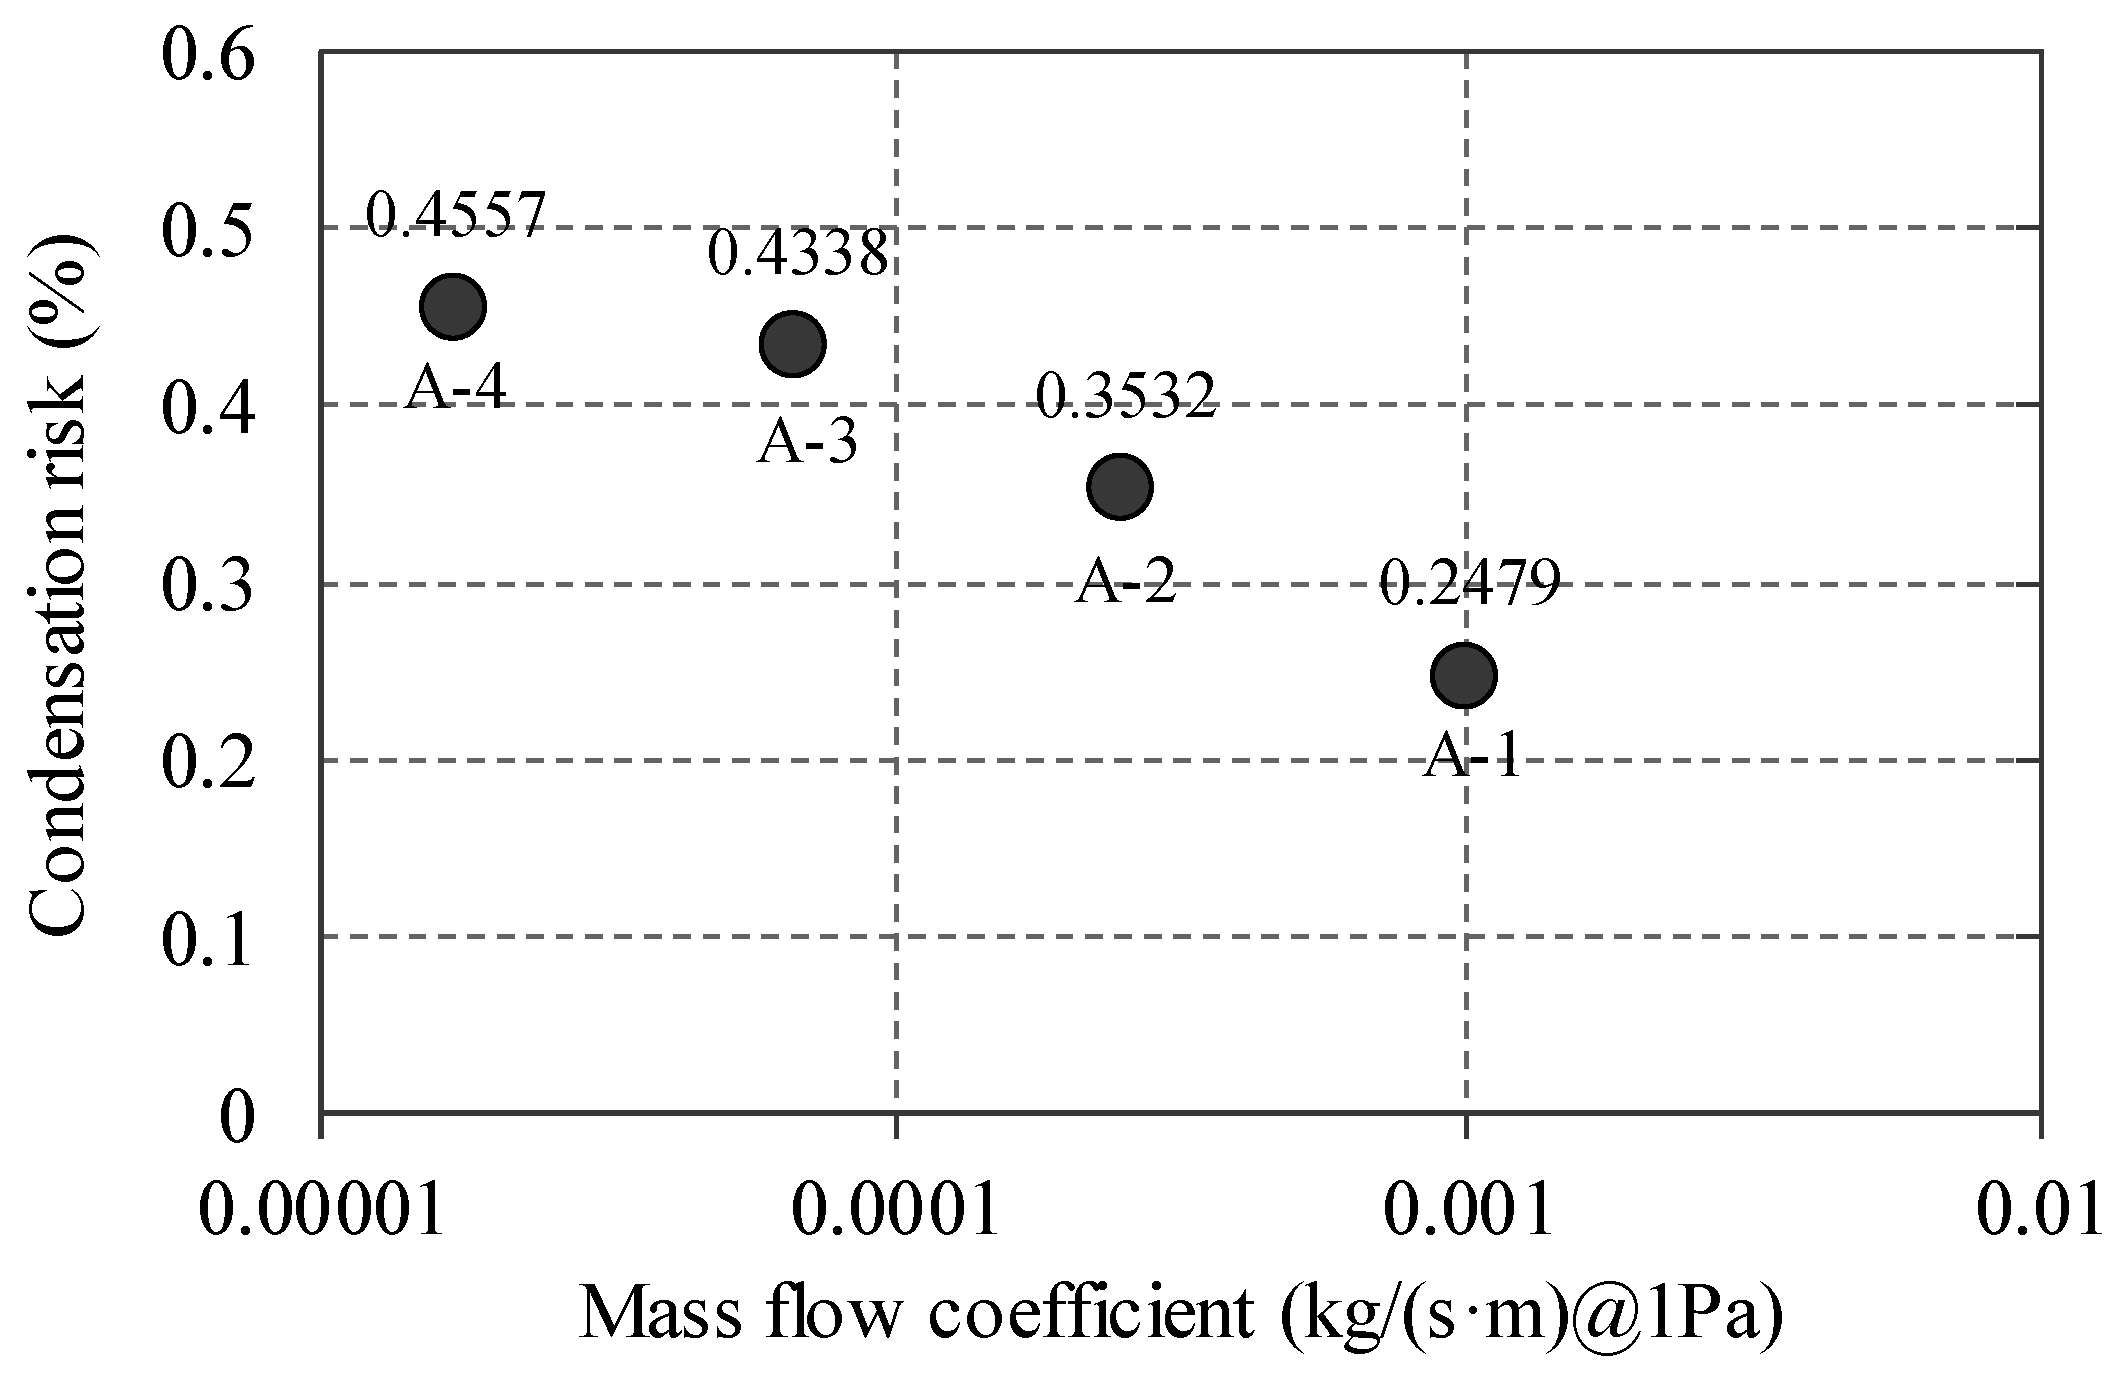
3.2. Results and Discussion of Condensation Risk Estimations for Airtightness
4. Condensation Risk Estimations under Varying Thermal Insulation Conditions
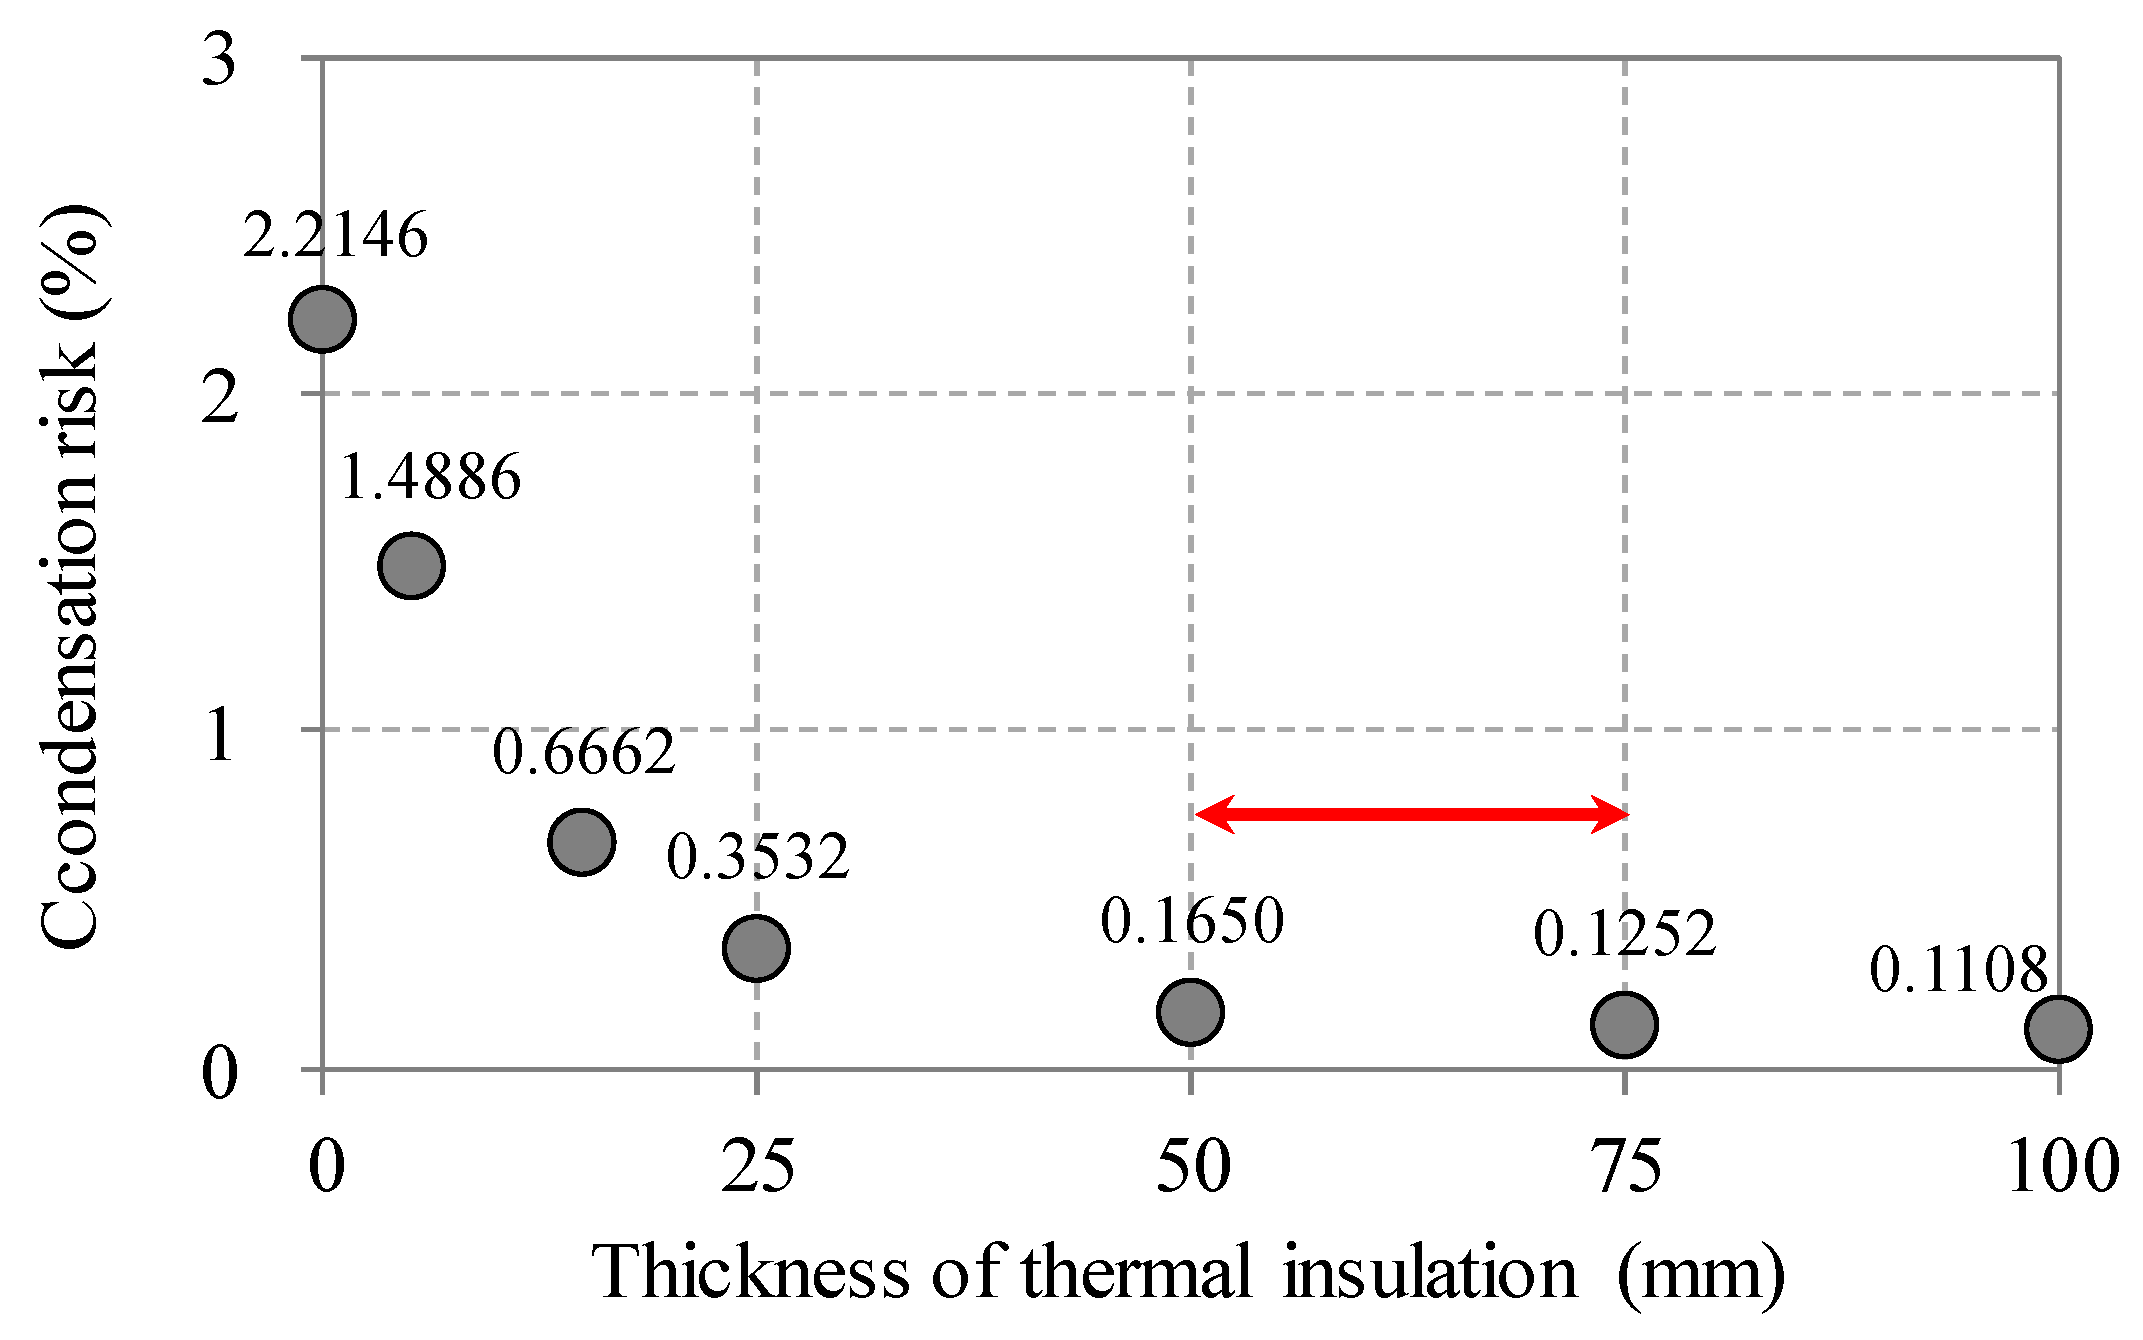
4.1. Condensation Risk Estimations for Thermal Insulation of External Walls
4.1.1. Case Setup for Thermal Insulation of External Walls
4.1.2. Results and Discussion of Condensation Risk Estimations for the Thermal Insulation of External Walls
4.2. Condensation Risk Estimations for the Thermal Insulation of the Roof
4.2.1. Case Setup for the Thermal Insulation of the Roof
4.2.2. Results and Discussion of Condensation Risk Estimations for Thermal Insulation of Roof
4.3. Condensation Risk Estimations for Thermal Insulation of Glass
4.3.1. Case Setup for Thermal Insulation of Glass
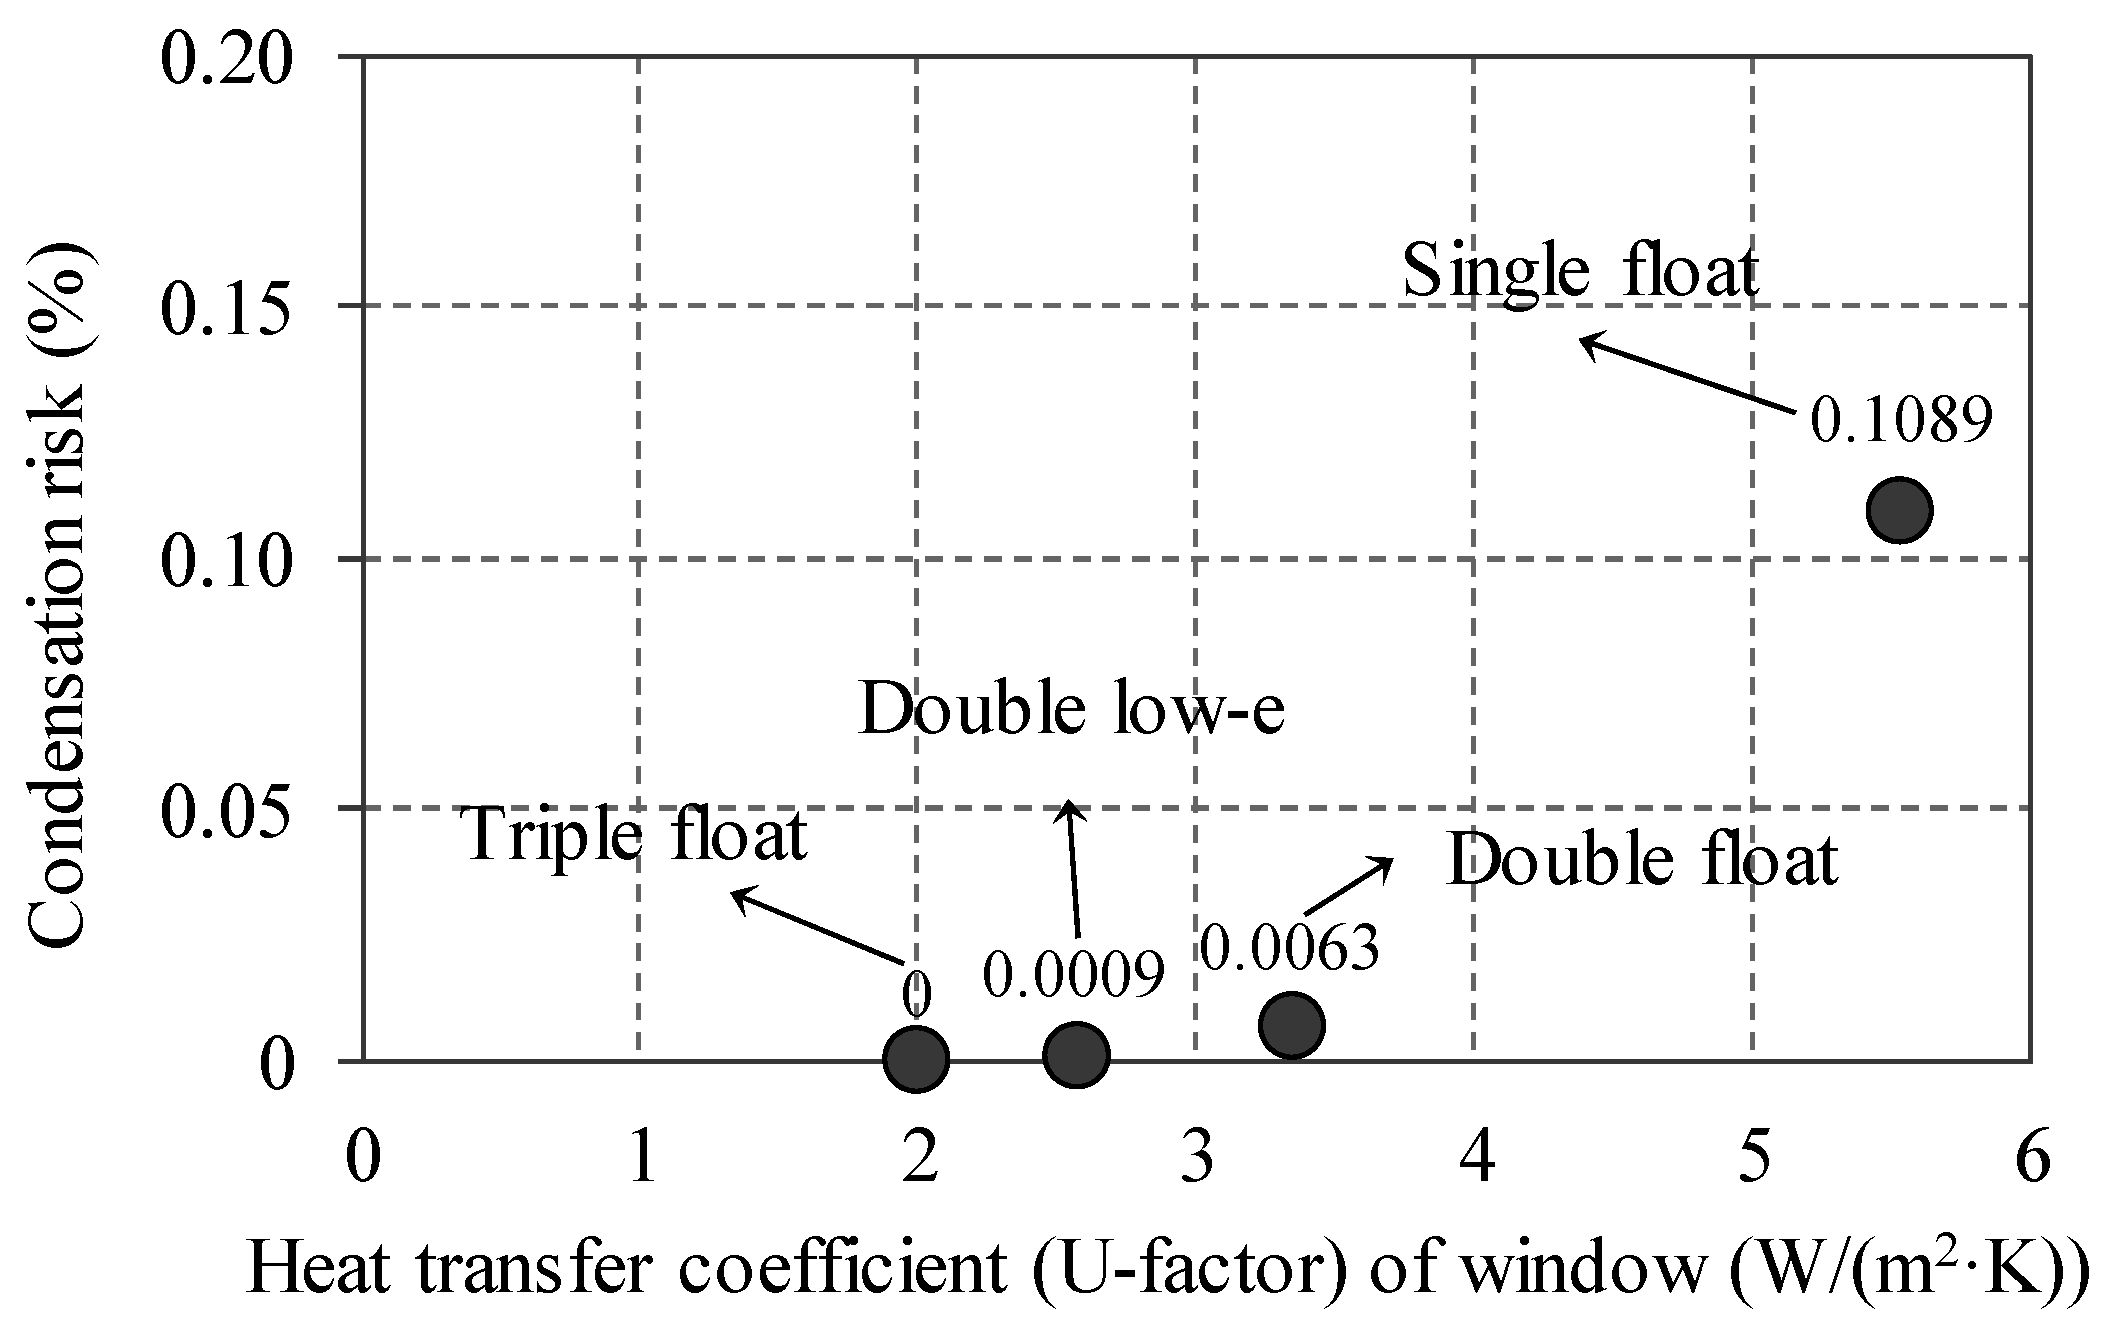
4.3.2. Results and Discussion of Condensation Risk Estimations for Thermal Insulation of Glass
5. Conclusions
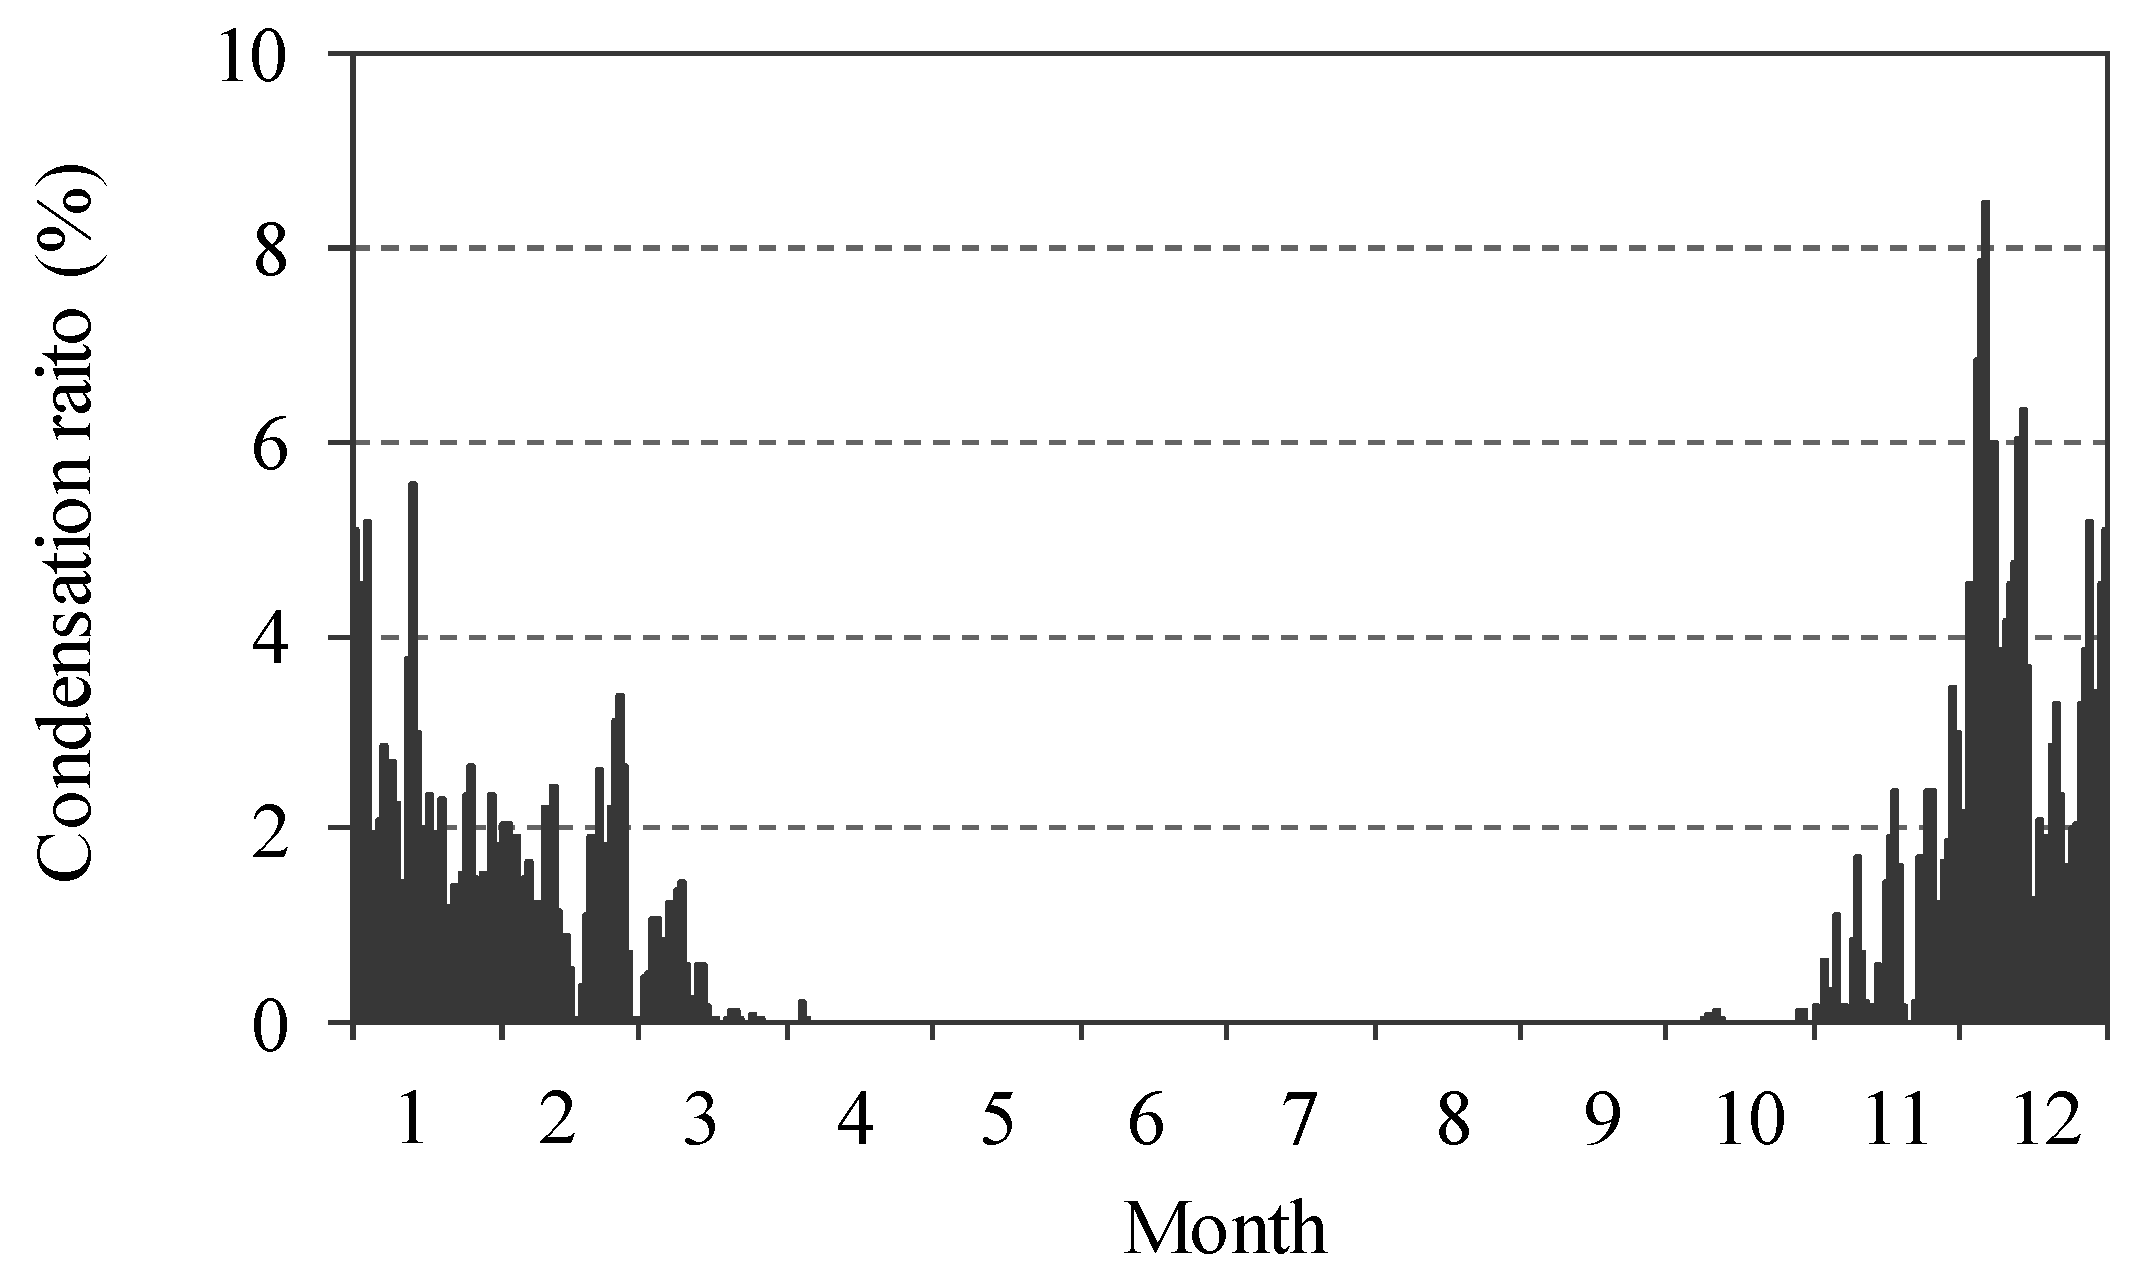
- Most of the condensation occurred in winter (December–March) with minimal condensation occurring in the intermediate periods (April–May and October–November).
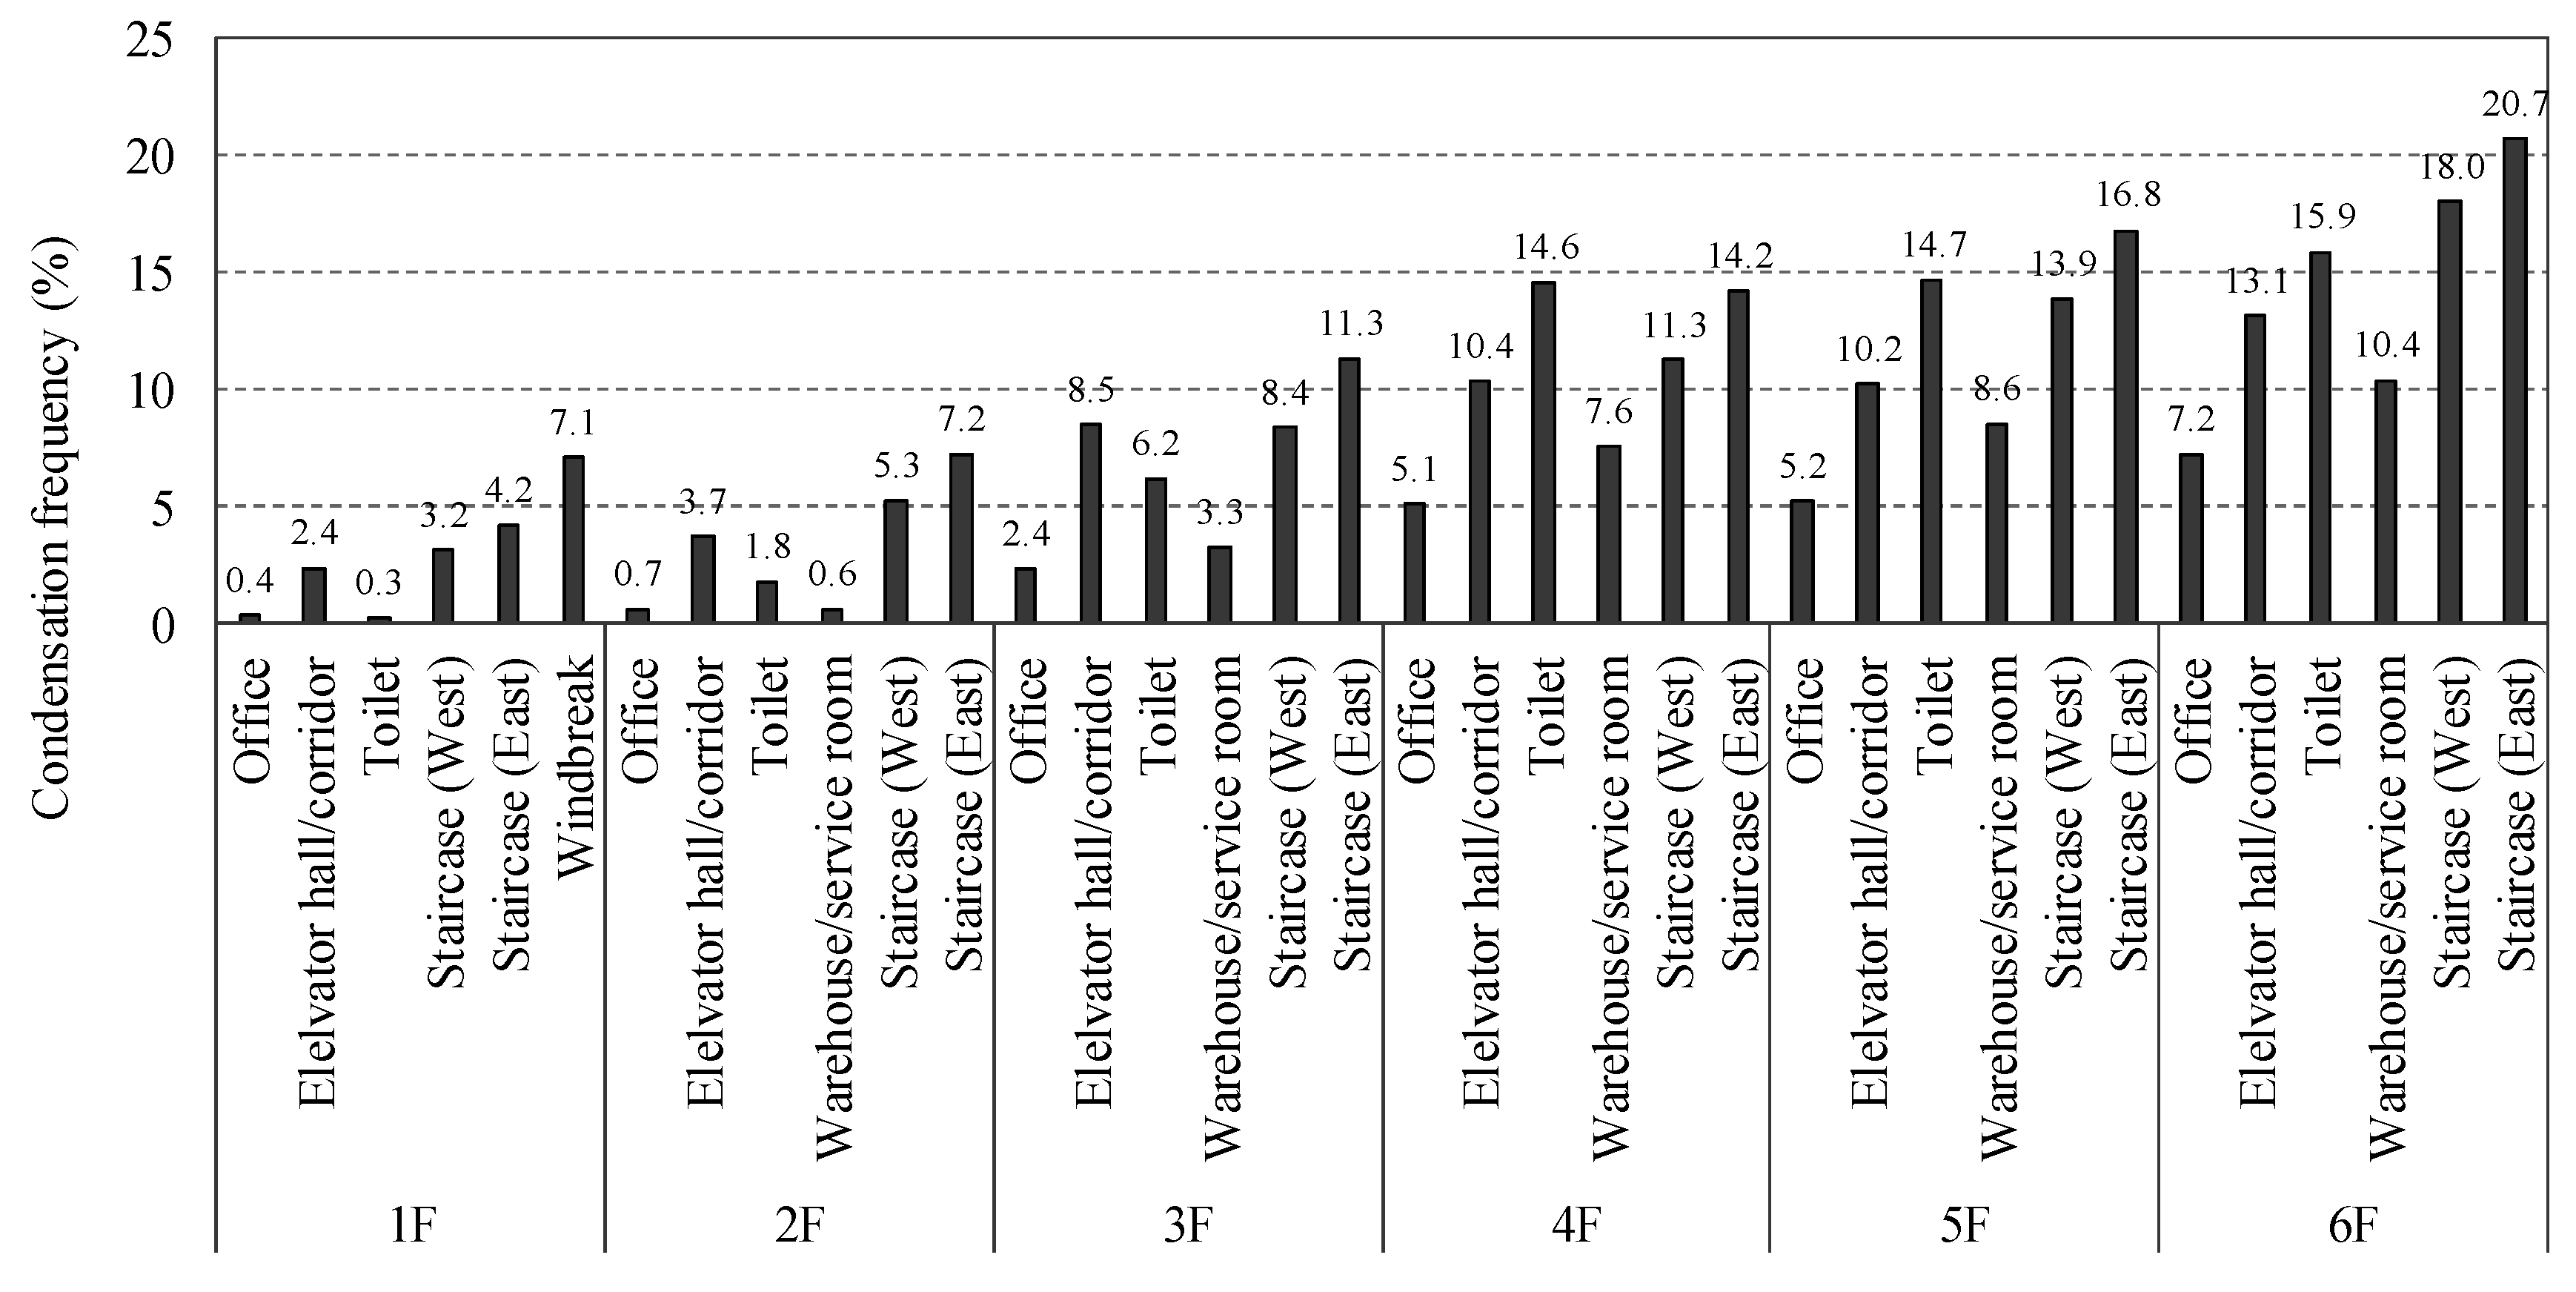
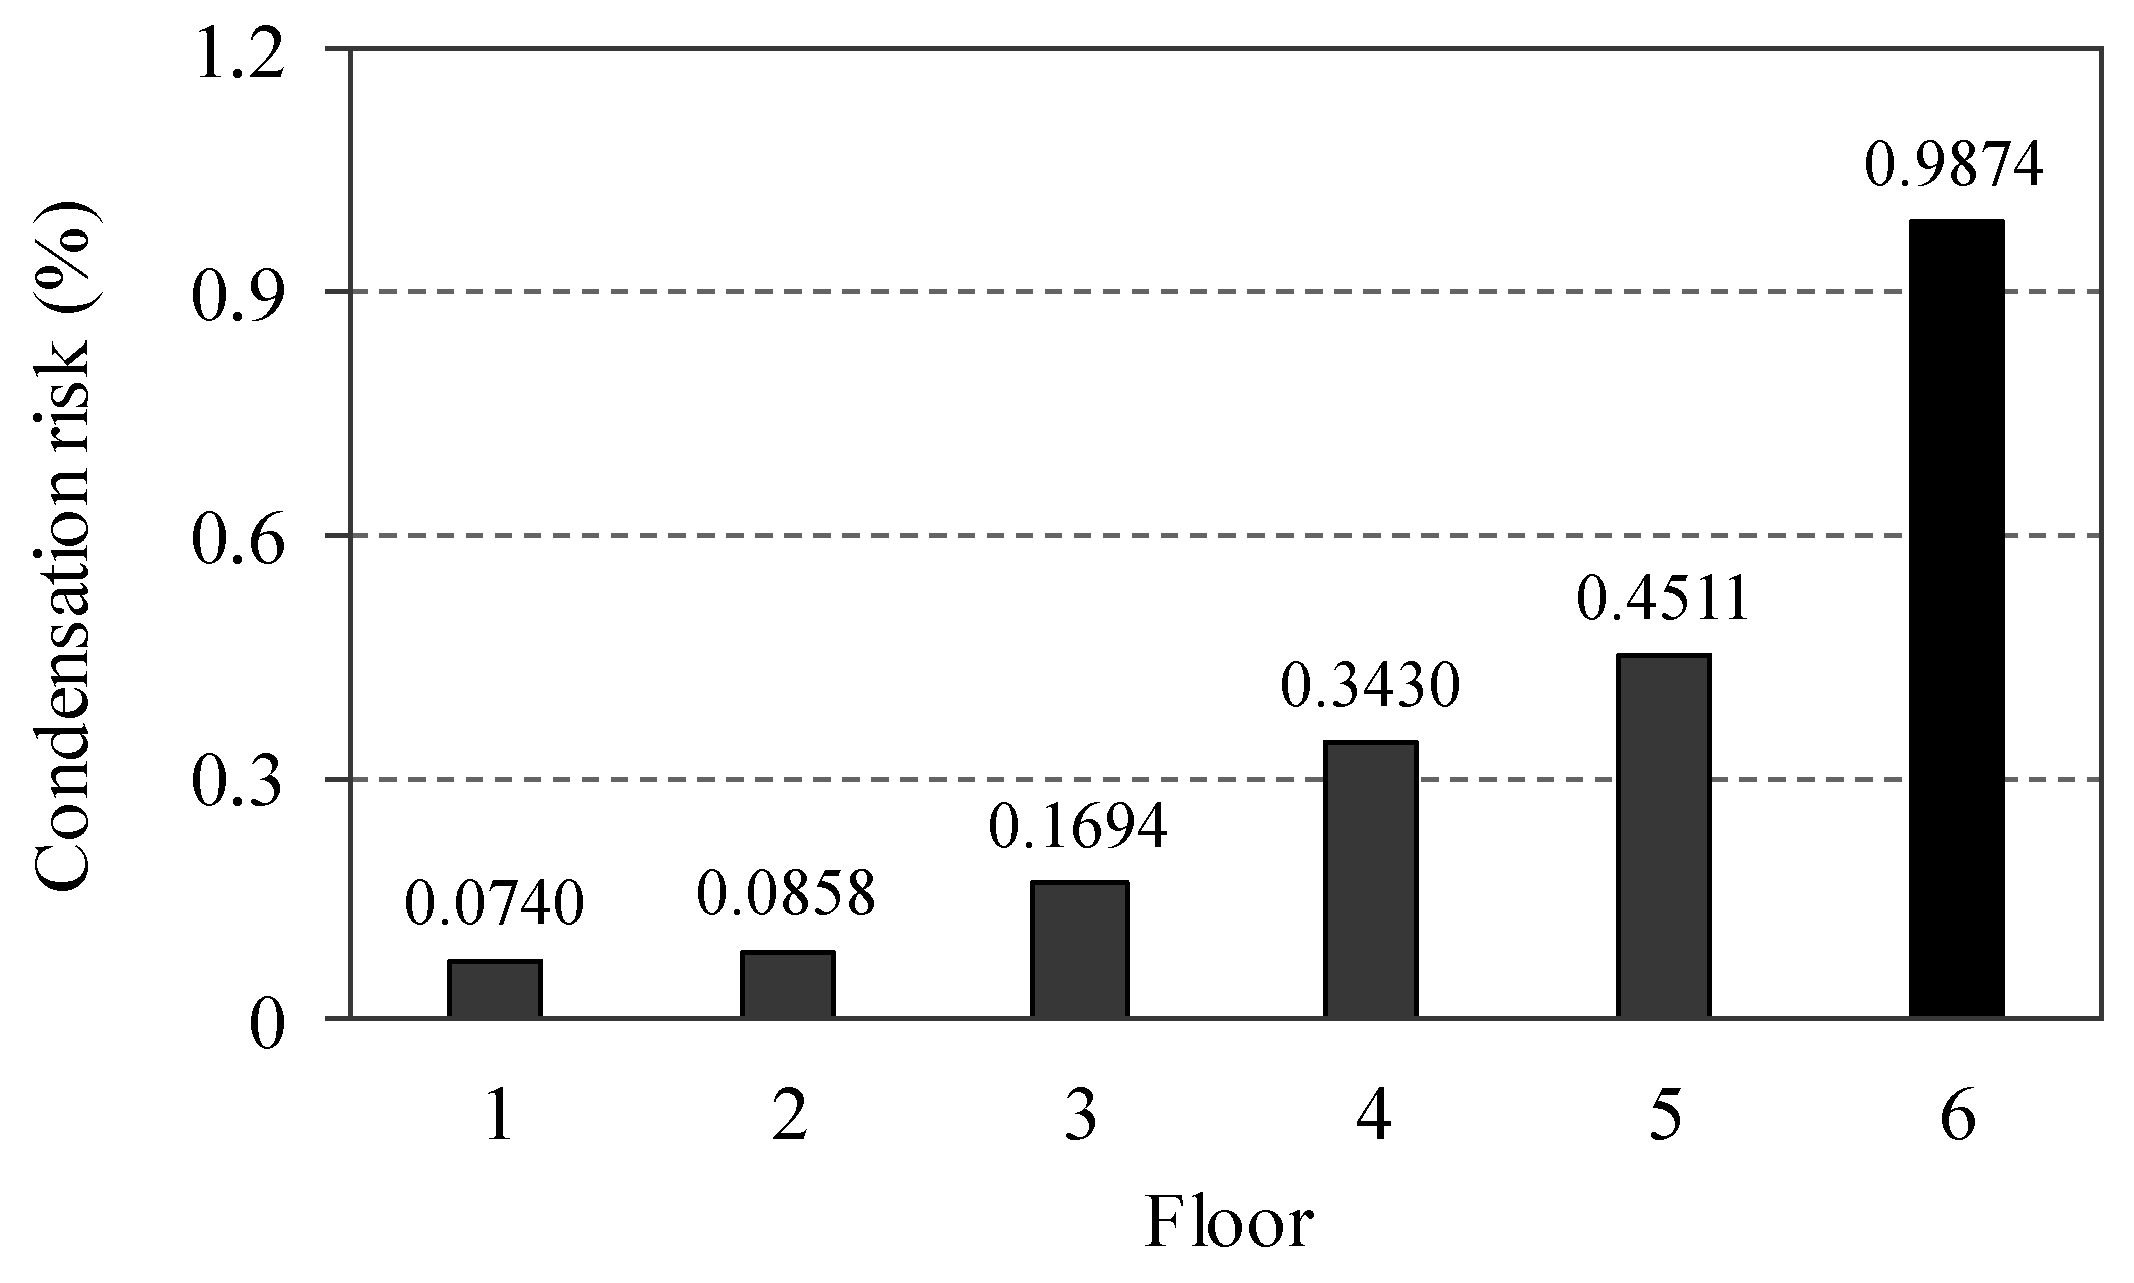
- For the topmost floor, because the roof surface is in contact with the OA during winter, the surface temperature of the roof tends to decrease easily, resulting in condensation. Therefore, improving the thermal insulation of the roof would be effective in reducing CRs.
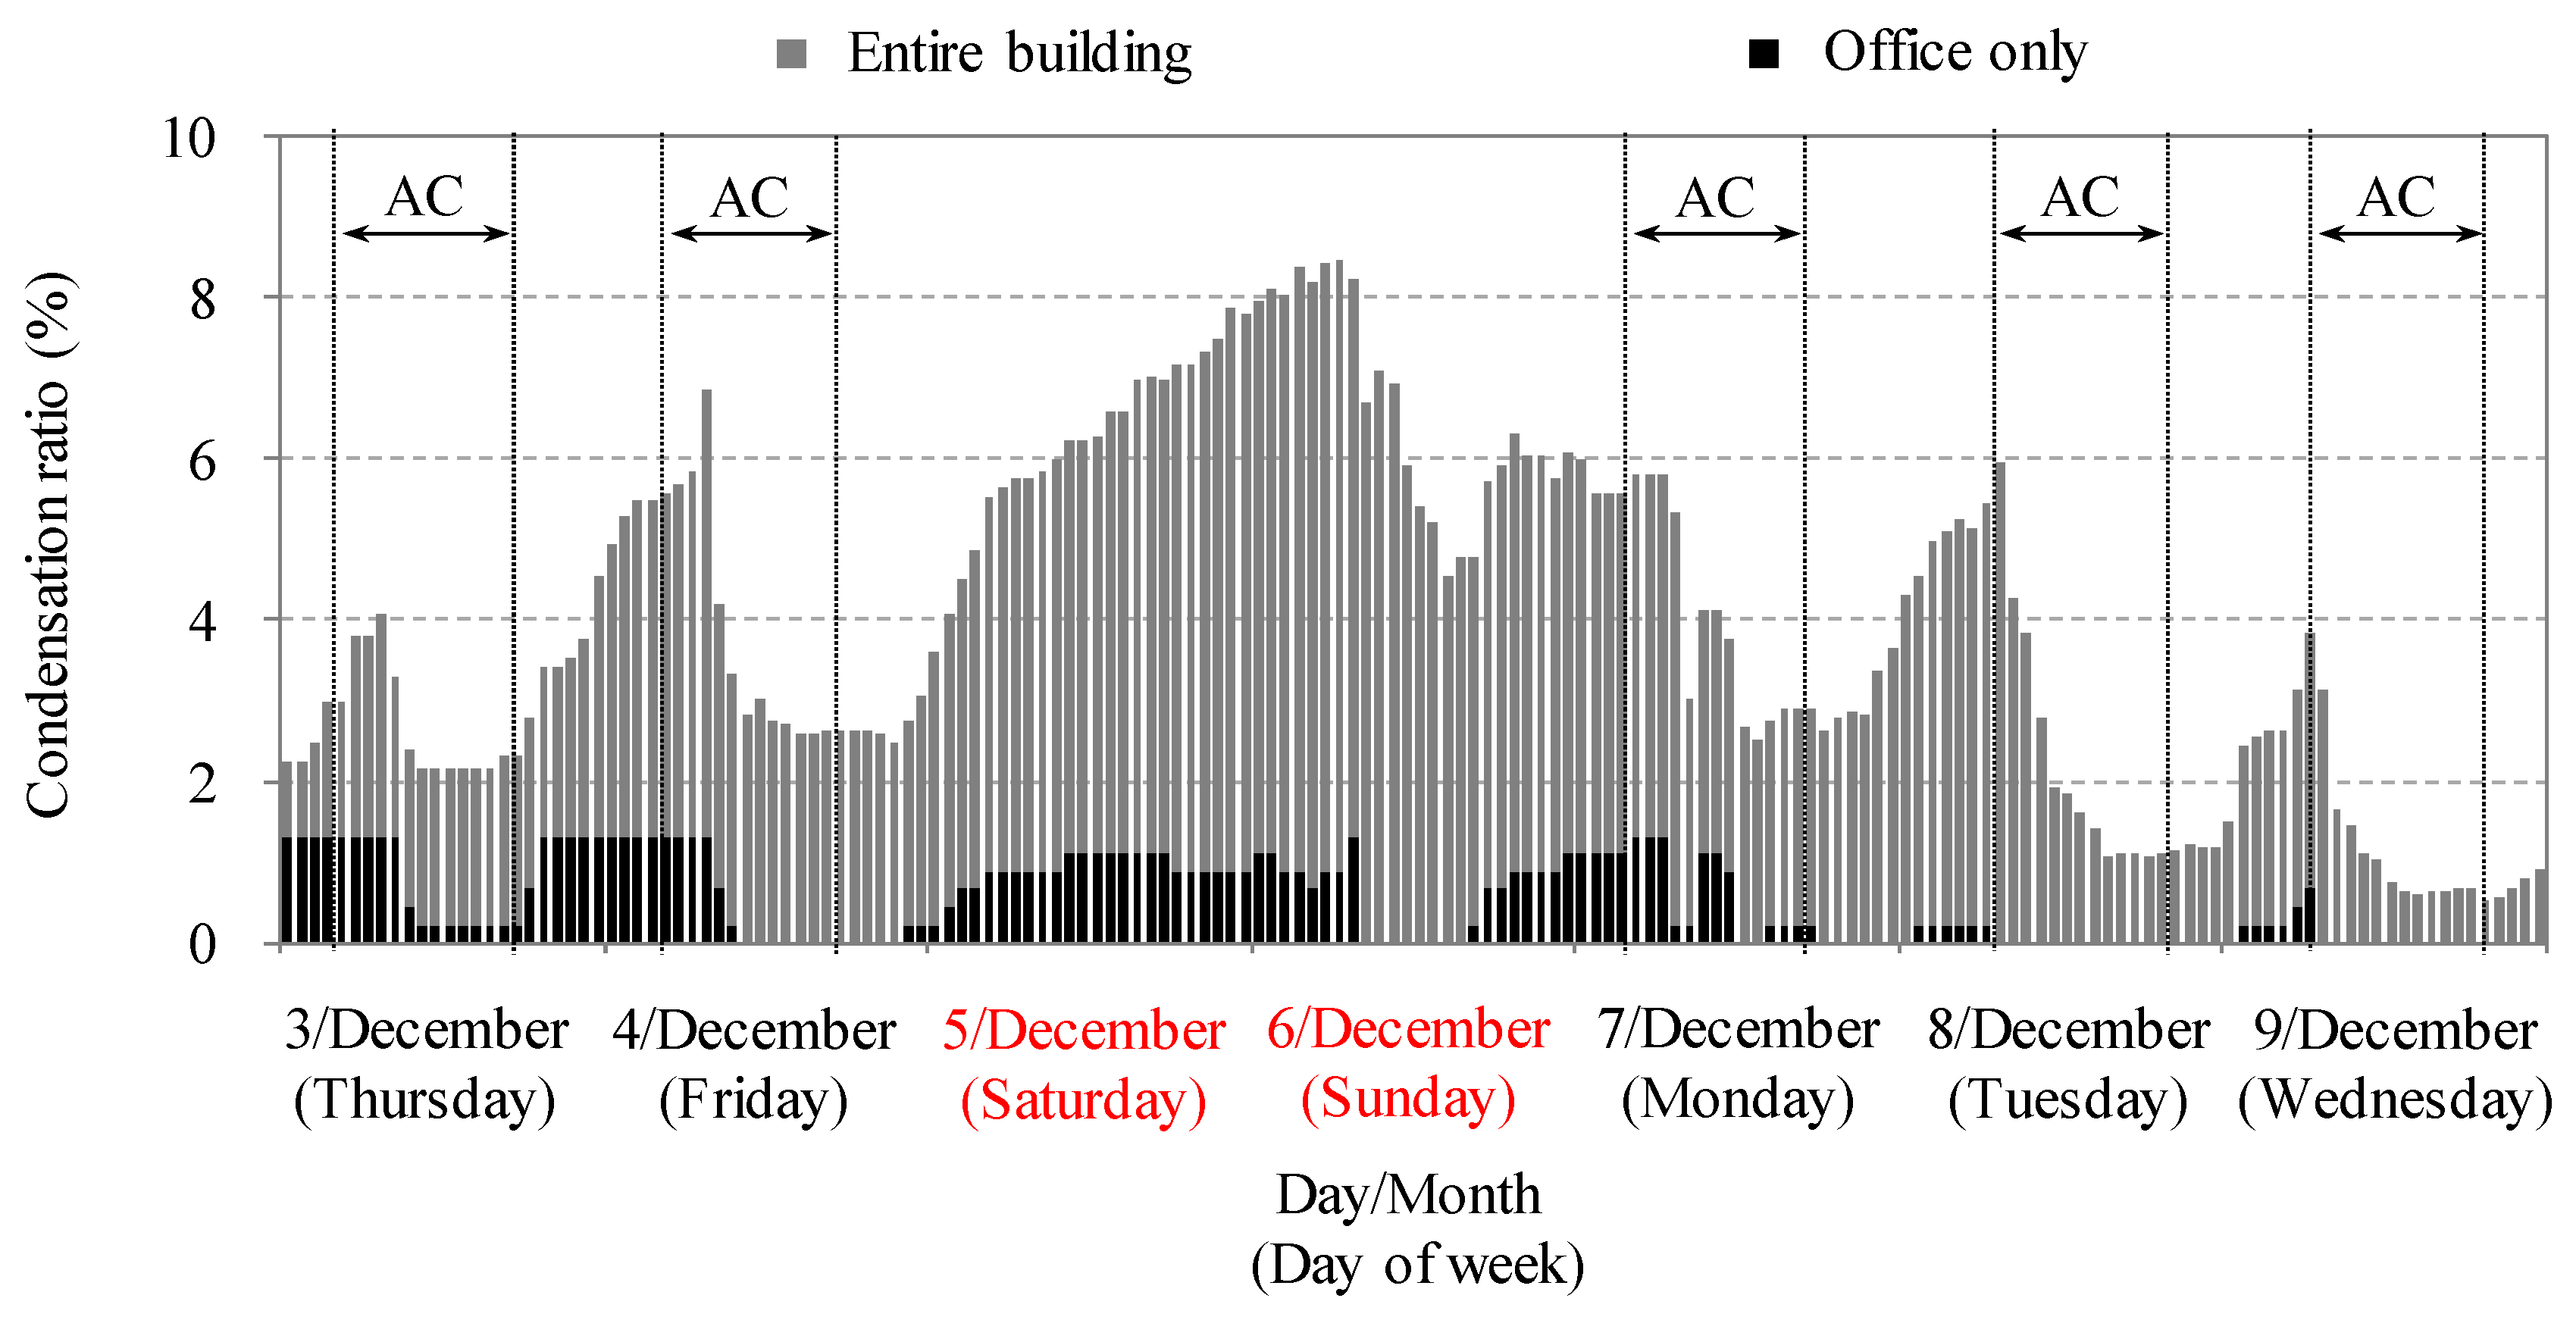
- The occurrence of condensation was significantly less in air-conditioned offices as compared to non-air-conditioned core parts. Thus, it can be concluded that the condensation countermeasures in non-air-conditioned core parts are important for the restriction of condensation within the entire building.
- From the perspective of air-conditioning load, soundproofing and dust-proofing measures, the use of a highly airtight window was more helpful than the JIS standards. However, from the perspective of condensation reduction, when the airtightness of a window was of a lower grade, the humidity ratio of the rooms in winter decreased due to the infiltration of outside air containing less water vapor than the inside air, which resulted in lowered CRs.
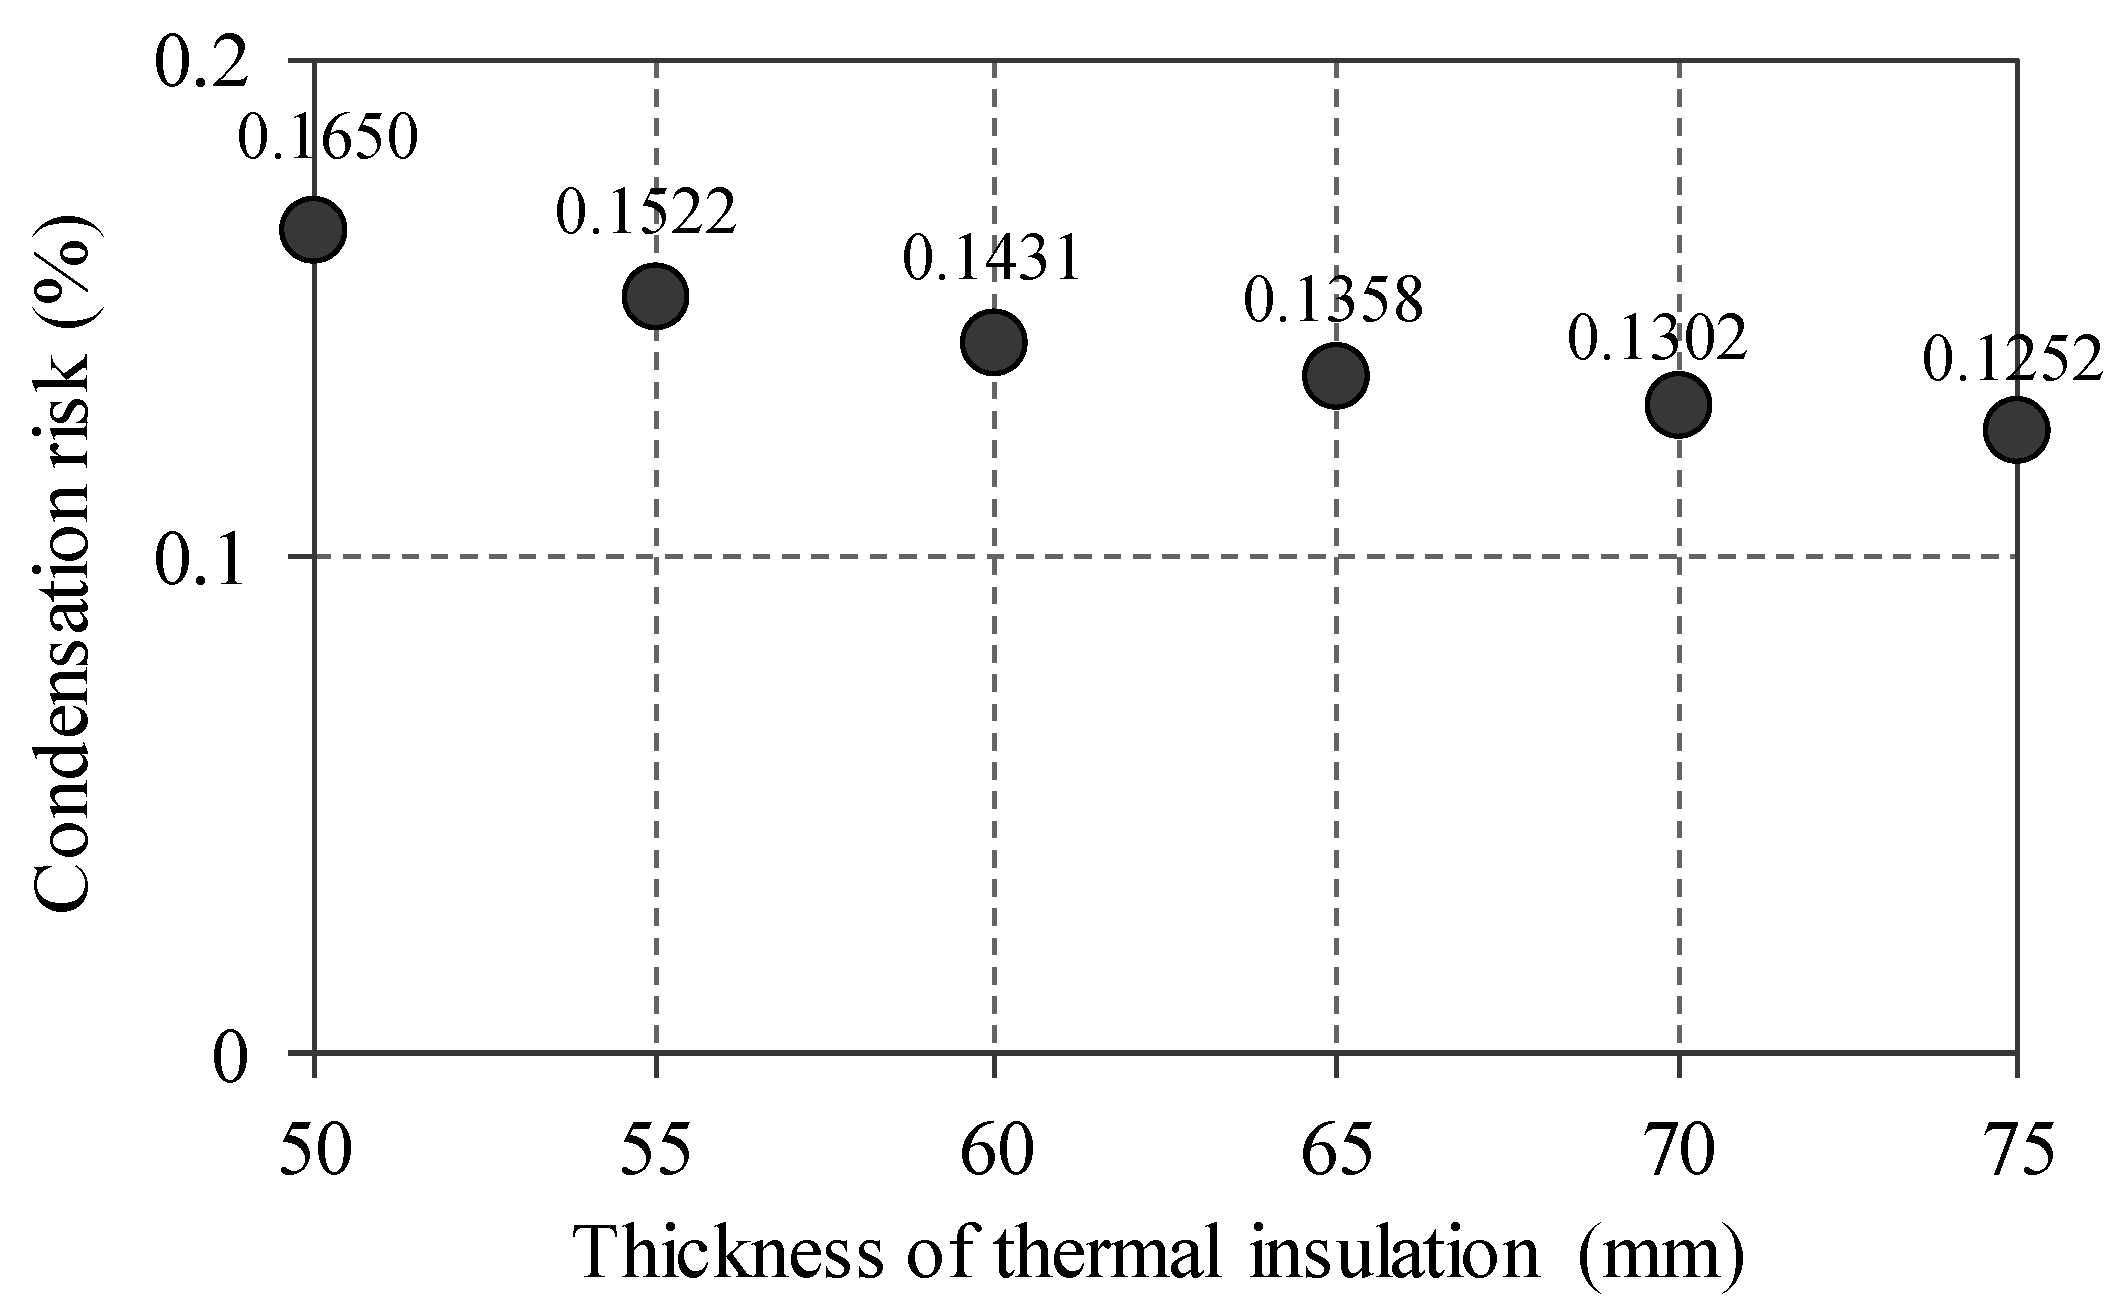
- Using thermal insulation materials 75 mm thick on the external walls completely suppressed condensation on all areas of Floors 1–5 except the windows, but it still occurred on the ceiling and external walls of the topmost floor. Even after increasing the thermal insulation material thickness of the external walls from 75 mm–100 mm, condensation continued to occur on the topmost floor on the windows, as well as other areas, necessitating an increase in the thickness of the thermal insulation materials of the roof. The thickness at which condensation was suppressed completely on all areas of the topmost floor except the windows was investigated, by keeping the thermal insulation material thickness of the external walls at 75 mm and increasing the thickness of the materials of the roof from 50 mm upwards. By increasing the thickness up to 105 mm, condensation was suppressed completely throughout the building except for on the windows. However, a large amount of condensation occurred on the windows, making it necessary to improve their thermal insulation performance. Therefore, enhancement of thermal insulation is essential for suppressing condensation, especially of the roof and windows.
- For the building in Tokyo that was the subject of this study, condensation within the building was suppressed completely when the thermal insulation material thickness of the external walls was greater than 75 mm, that of the roof was greater than 105 mm and the windows had triple float glass (U-factor: 2.0 W/(m2·K)) or better.
Acknowledgments
Author Contributions
Conflicts of Interest
Abbreviation
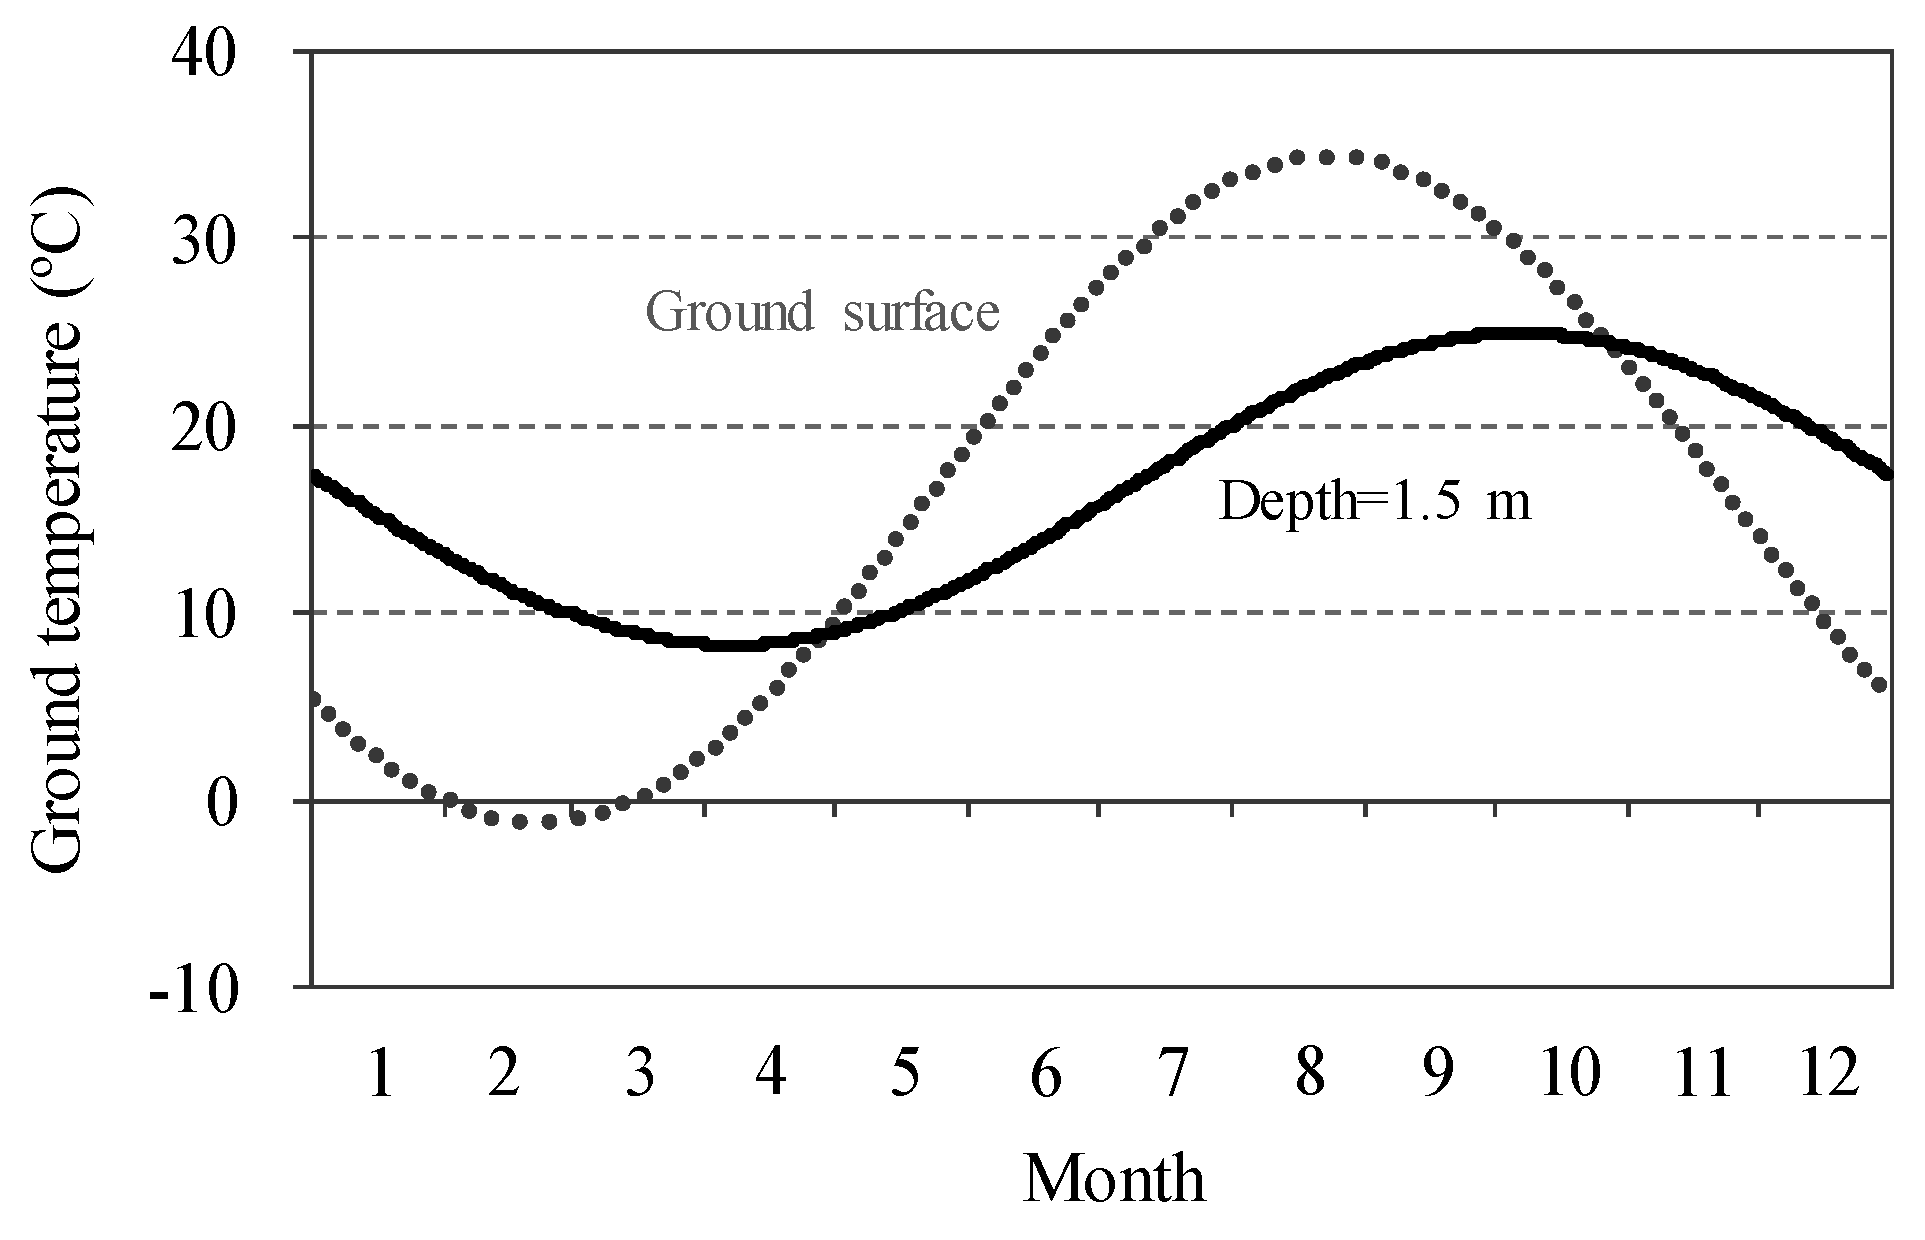
| Tground | Ground temperature, °C |
| Tmean | Mean ground temperature (average air temperature), °C |
| Tamp | Amplitude of surface temperature (maximum air temperature−minimum air temperature), °C |
| D | Depth below surface, m |
| α | Thermal diffusivity of the ground (soil), m2/h |
| tnow | Current day of the year, 1, 2, …, 365 |
| tshift | Day of the year corresponding to the minimum surface temperature, 1, 2, …, 365 |
| VSA | Airflow rate of supply air, m3/h |
| qSH | Sensible-heat load of the office, kJ/h |
| cA | Specific heat of air, kJ/(kg·K) |
| ρA | Density of air, kg/m3 |
| ΔTOffice_SA | Difference in temperature between the office and SA, °C |
| TERV | Outlet temperature of the enthalpy recovery ventilator, °C |
| TOA | Temperature of outdoor air, °C |
| ηSH | Sensible-heat exchange efficiency of the enthalpy recovery ventilator, dimensionless value |
| TRA | Temperature of return air, °C |
| XERV | Humidity ratio of the enthalpy recovery ventilator, kg/kg dry air |
| XOA | Humidity ratio of outdoor air, kg/kg dry air |
| ηLH | Latent-heat exchange efficiency of the enthalpy recovery ventilator, dimensionless value |
| XRA | Humidity ratio of return air, kg/kg dry air |
| XSP_Humid | Humidity ratio of set-point for humidification, kg/kg dry air |
| qLH | Latent-heat load of the office, kJ/h |
| L | Latent-heat of vaporization (kJ/kg) |
| Mair,i | Mass of air in zone i, kg |
| ωi | Humidity ratio of zone i, kg/kg dry air |
| t | Elapsed time, h |
| ṁinf,i | Mass flow rate of infiltration, kg/h |
| ωa | Ambient humidity ratio, kg/kg dry air |
| ṁv,k,I | Mass flow rate of ventilation type k, kg/h |
| ωv,k,i | Humidity ratio of ventilation type k, kg/kg dry air |
| Ẇg,i | Internal moisture gains, kg/h |
| ṁl,c,i | Mass flow rate of air link type c, kg/h |
| ωl,c,i | Humidity ratio of air link type c, kg/kg dry air |
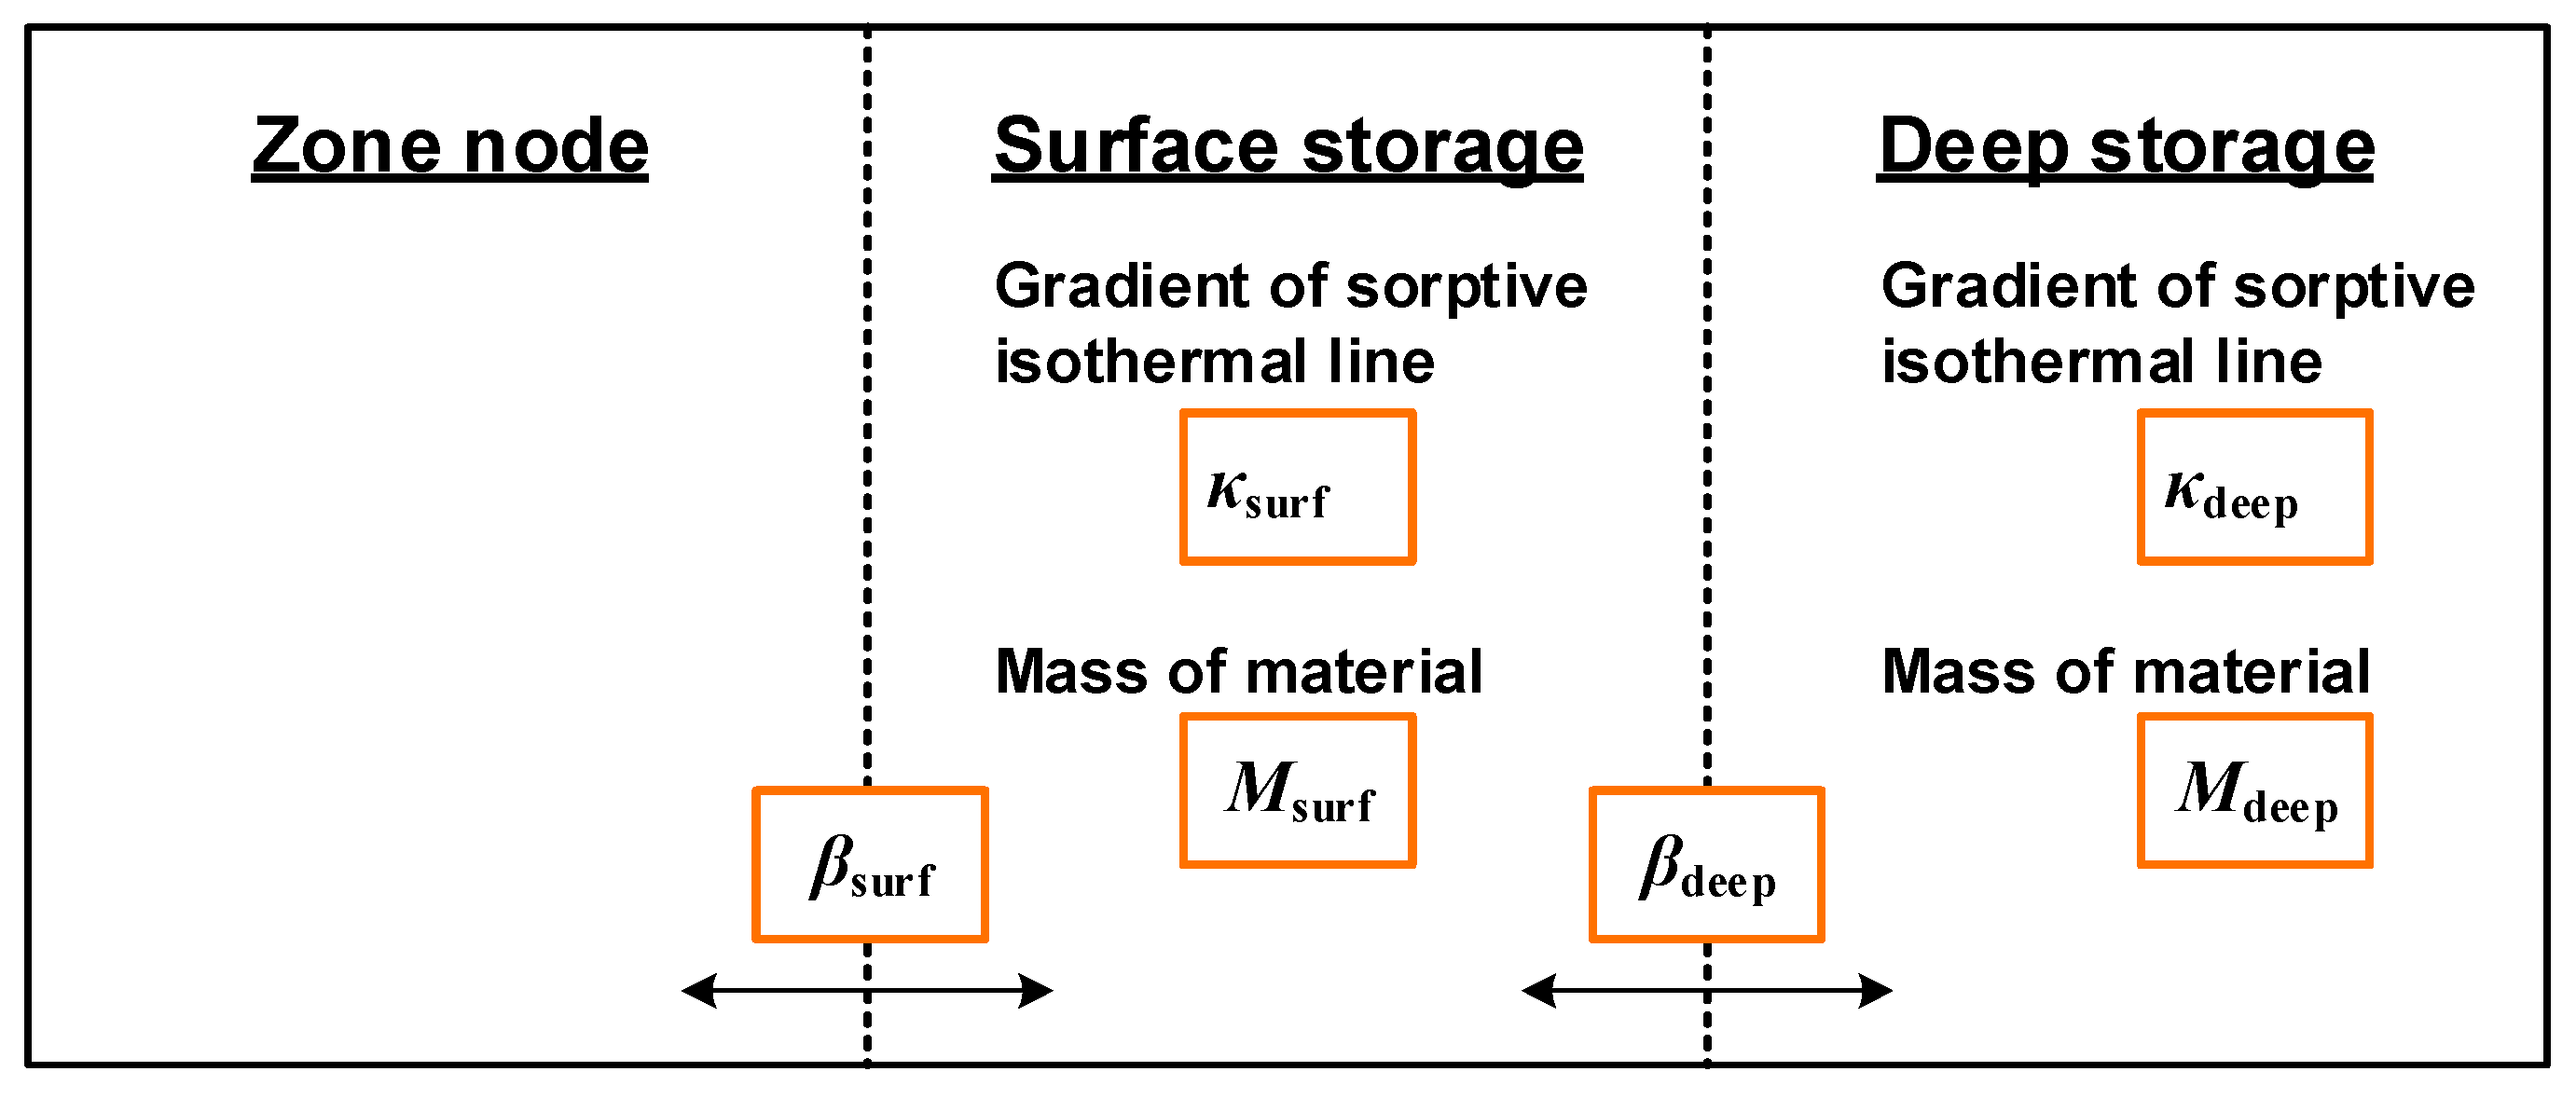
| βsurf | Mass transfer coefficient of surface storage, kg (air)/h |
| ωsurf | Humidity ratio of surface storage, kg/kg dry air |
| Msurf | Mass of surface storage, kg |
| κsurf | Gradient of sorptive isothermal line of surface storage, (kg (water)/kg (building material))/(relative humidity) |
| f(φ,ω) | Conversion factor from relative humidity to humidity ratio |
| βdeep | Mass transfer coefficient of deep storage, kg (air)/h |
| ωdeep | Humidity ratio of deep storage, kg/kg dry air |
| Mdeep | Mass of deep storage, kg |
| κdeep | Gradient of sorptive isothermal line of deep storage, (kg (water)/kg (building material))/(relative humidity) |
| CRt | Condensation ratio during time-step t, % |
| ICn,t | Occurrence or non-occurrence of condensation on wall surface n during time-step t, one or zero |
| An | Area of a wall surface n, m2 |
| CFn | Condensation frequency for wall surface n, % |
| CR | Condensation risk, % |
References
- Becker, R. Condensation and mould growth in dwellings—Parametric and field study. Build. Environ. 1984, 19, 243–250. [Google Scholar] [CrossRef]
- Lawton, M.D.; Dales, R.E.; White, J. The influence of house characteristics in a Canadian community on microbiological contamination. Indoor Air 1998, 8, 2–11. [Google Scholar] [CrossRef]
- Small, B.M. Creating mold-free buildings: A key to avoiding health effects of indoor molds. Arch. Environ. Health Int. J. 2003, 58, 523–527. [Google Scholar] [CrossRef] [PubMed]
- Lengsfeld, K.; Krus, M. Microorganisms on Facades—Reasons, Consequences and Measures. Available online: http://www.kuleuven.be/bwf/projects/annex41/protected/data/FhG%20Oct%202004%20Paper%20A41-T3-D-04-5.pdf (accessed on 18 January 2016).
- Pasanen, P.; Pasanen, A.L.; Jantunen, M. Water condensation promotes fungal growth in ventilation ducts. Indoor Air 1993, 3, 106–112. [Google Scholar] [CrossRef]
- Fisk, W.J.; Lei-Gomez, Q.; Mendell, M.J. Meta-analyses of the associations of respiratory health effects with dampness and mold in homes. Indoor Air 2007, 17, 284–296. [Google Scholar] [CrossRef] [PubMed]
- Meyer, H.W.; Würtz, H.; Valbjørn, O.; Sigsgaard, T.; Gyntelberg, F. Moulds and Health—An Epidemiological Study. In Proceedings of the 9th International Conference on Indoor Air Quality and Climate, Vol. III, Indoor Air 2002, The International Academy of Indoor Air Sciences, Monterey, CA, USA, 30 June–5 July 2002; pp. 394–397.
- Bush, R.K.; Portnoy, J.M.; Saxon, A.; Terr, A.I.; Wood, R.A. The medical effects of mold exposure. J. Allergy Clin. Immun. 2006, 117, 326–333. [Google Scholar] [CrossRef] [PubMed]
- Burge, S.; Hedge, A.; Wilson, S.; Bass, J.H.; Robertson, A. Sick building syndrome: A study of 4373 office workers. Ann. Occup. Hyg. 1987, 31, 493–504. [Google Scholar] [CrossRef] [PubMed]
- Mendell, M.J.; Lei-Gomez, Q.; Mirer, A.G.; Seppänen, O.; Brunner, G. Risk factors in heating, ventilating, and air-conditioning systems for occupant symptoms in US office buildings: The US EPA BASE study. Indoor Air 2008, 18, 301–316. [Google Scholar] [CrossRef] [PubMed]
- Maus, R.; Goppelsröder, A.; Umhauer, H. Survival of bacterial and mold spores in air filter media. Atmos. Environ. 2001, 35, 105–113. [Google Scholar] [CrossRef]
- Yanagi, U.; Ikeda, K. A study on the behavior and control of microbial contamination in an air conditioning system: Part 1—Growth environment and contamination status of microbes. J. Environ. Eng. (Trans. AIJ) 2005, 7, 49–56. (In Japanese) [Google Scholar]
- Occupational Safety and Health Administration (OSHA). Preventing Mold-Related Problems in the Indoor Workplace. Washington, DC: U.S. Department of Labor, Occupational Safety and Health Administration; Report No.: 3304–04N; Occupational Safety and Health Administration (OSHA): Washington, DC, USA, 2006.
- Saito, H.; Fukuda, K.; Sawachi, T. Integration Model of Hygrothermal Analysis with Decay Process for Durability Assessment of Building Envelopes. In Building Simulation; Tsinghua Press: Beijing, China, 2012; Volume 5, pp. 315–324. [Google Scholar]
- Andrade, C.; Sarrı́a, J.; Alonso, C. Relative humidity in the interior of concrete exposed to natural and artificial weathering. Cem. Concr. Res. 1999, 29, 1249–1259. [Google Scholar] [CrossRef]
- Vafai, K.; Sarkar, S. Condensation effects in a fibrous insulation slab. J. Heat Transf. 1986, 108, 667–675. [Google Scholar] [CrossRef]
- Janssens, A.; Hens, H. Interstitial condensation due to air leakage: A sensitivity analysis. J. Therm. Envel. Build. Sci. 2003, 27, 15–29. [Google Scholar] [CrossRef]
- Gutt, G.S. Condensation in attics: Are vapor barriers really the answer? Energy Build. 1979, 2, 251–258. [Google Scholar] [CrossRef]
- Bludau, C.; Zirkelbach, D.; Künzel, H.M. Condensation problems in cool roofs. Interface J. RCI 2009, 27, 11–16. [Google Scholar]
- Zillig, W.; Lenz, K.; Sedlbauer, K.; Krus, M. Condensation on Facades—Influence of Construction Type and Orientation. In Proceedings of the 2nd International Conference on Building Physics, Leuven, Belgium, 14–18 September 2003; pp. 437–444.
- Sato, N.M.N.; Shirakawa, M.A.; Loh, K.; John, V.M. Influence of Thermal Properties of Materials in Condensation and Microorganism Growth on Building Façades. In Proceedings of the 11DBMC International Conference on Durability of Building Materials and Components, Istanbul, Turkey, 11–14 May 2008; pp. 11–14.
- Aelenei, D.; Henriques, F.M.A. Analysis of the condensation risk on exterior surface of building envelopes. Energy Build. 2008, 40, 1866–1871. [Google Scholar] [CrossRef]
- Hien, W.N.; Liping, W.; Chandra, A.N.; Pandey, A.R.; Xiaolin, W. Effects of double glazed facade on energy consumption, thermal comfort and condensation for a typical office building in Singapore. Energy Build. 2005, 37, 563–572. [Google Scholar] [CrossRef]
- Song, S.Y.; Jo, J.H.; Yeo, M.S.; Kim, Y.D.; Song, K.D. Evaluation of inside surface condensation in double glazing window system with insulation spacer: A case study of residential complex. Build. Environ. 2007, 42, 940–950. [Google Scholar] [CrossRef]
- Hamdan, M.A. Layered wall design to prevent moisture condensation on its inside surface. Energ. Convers. Manag. 2002, 43, 1821–1828. [Google Scholar] [CrossRef]
- Liu, J.; Aizawa, H.; Yoshino, H. CFD prediction of surface condensation on walls and its experimental validation. Build. Environ. 2004, 39, 905–911. [Google Scholar] [CrossRef]
- Ogniewicz, Y.; Tien, C.L. Analysis of condensation in porous insulation. Int. J. Heat Mass Transf. 1981, 24, 421–429. [Google Scholar] [CrossRef]
- Ge, G.; Xiao, F.; Wang, S. Neural network based prediction method for preventing condensation in chilled ceiling systems. Energy Build. 2012, 45, 290–298. [Google Scholar] [CrossRef]
- Mumma, S.A. Chilled ceilings in parallel with dedicated outdoor air systems: Addressing the concerns of condensation, capacity, and cost. ASHRAE Trans. 2002, 108, 220. [Google Scholar]
- Muneer, T.; Abodahab, N. Frequency of condensation occurrence on double-glazing in the United Kingdom. Energy Convers. Manag. 1998, 39, 717–726. [Google Scholar] [CrossRef]
- Boyd, D.; Cooper, P.; Oreszczyn, T. Condensation risk prediction: Addition of a condensation model to BREDEM. Build. Serv. Eng. Res. Technol. 1988, 9, 117–125. [Google Scholar] [CrossRef]
- Becker, R. Effects of heating patterns on internal surface temperatures and risk of condensation. Build. Environ. 1993, 28, 333–345. [Google Scholar] [CrossRef]
- Mumovic, D.; Ridley, I.; Oreszczyn, T.; Davies, M. Condensation risk: comparison of steady-state and transient methods. Build. Serv. Eng. Res. Technol. 2006, 27, 219–233. [Google Scholar] [CrossRef]
- Yuzawa, H.; Sugihara, Y.; Kondo, T.; Hayashi, T.; Sekine, K.; Kohno, H.; Matsunawa, K.; Kato, S. Development of the Liquid Cooling Air-Conditioning System for Commercial Buildings (Part 2) Modeling of the Building and Air-Conditioning System for Feasibility Study. In Proceedings of the Society of Heating, Air-Conditioning and Sanitary Engineers of Japan, Nagano, Japan, 25–27 September 2013; pp. 21–24. (In Japanese)
- Method for Calculations and Judgements in Conformity to the 2013 Building Energy Standard of Japan, Part 1. In Non-Residential Buildings, 1st ed.; National Institute for Land and Infrastructure Management and Building Research Institute, Rengo printing center Co., Ltd.: Tokyo, Japan, 2013; pp. 118–128. (In Japanese)
- Architectural Institute of Japan. Expanded AMeDAS Weather Data (1981–2000); Architectural Institute of Japan: Minato-ku, Tokyo, Japan, 2005. [Google Scholar]
- Kusuda, T.; Achenbach, P.R. Earth Temperature and Thermal Diffusivity at Selected Stations in the United States (No. NBS-8972); National Bureau of Standards Gaithersburg: Gaithersburg, MD, USA, 1965.
- Thermal Energy System Specialist (TESS) Library Documentation. The Ground Source Heat Pump Component Library, Type501 GROUND TEMPERATURE PROFILE; Thermal Energy System Specialist (TESS): Madison, WI, USA, 2004. [Google Scholar]
- Bureau of Construction, Tokyo Metropolitan Government, Ground of Tokyo (GIS version). Available online: http://www.kensetsu.metro.tokyo.jp/jigyo/tech/start/03-jyouhou/geo-web/00-index.html (accessed on 20 December 2015).
- The Society of Heating, Air-Conditioning and Sanitary Engineers of Japan. The handbook of the Society of Heating, Air-Conditioning and Sanitary Engineers of Japan, Vol.1 Fundamental, 14th ed.; The Society of Heating, Air-Conditioning and Sanitary Engineers of Japan, Maruzen publishing Co., Ltd.: Tokyo, Japan, 2010; p. 414. (In Japanese) [Google Scholar]
- Japanese Standards Association. Japanese Industrial Standard Committee, JIS A 4706 Windows; Japanese standards Association: Mita, Minato-ku, Tokyo, Japan, 2000. [Google Scholar]
- Solar Energy Laboratory, Univ. of Wisconsin-Madison; TRANSSOLAR Energietechnik GmbH; CSTB—Centre Scientifique et Technique de Bâtiment; TESS—Thermal Energy System Specialists, LLC. TRNFLOW Manual: TRNFLOW A Module of an Air Flow Network for Coupled Simulation with TYPE 56 (Multi Zone Building of TRNSYS); Solar Energy Laboratory, Univ. of Wisconsin-Madison: Madison, WI, USA, 2006. [Google Scholar]
- Solar Energy Laboratory, Univ. of Wisconsin-Madison; TRANSSOLAR Energietechnik GmbH; CSTB—Centre Scientifique et Technique de Bâtiment; TESS—Thermal Energy System Specialists, LLC. TRNSYS Manual: Volume 6 Multizone Building Modeling with Type56 and TRNBuild; Solar Energy Laboratory, Univ. of Wisconsin-Madison: Madison, WI, USA, 2007; pp. 142–150. [Google Scholar]
- Woods, J.; Winkler, J.; Christensen, D. Evaluation of the Effective Moisture Penetration Depth Model for Estimating Moisture Buffering in Buildings, Technical Report of National Renewable Energy Lab. (NREL), 2013. Available online: http://www.osti.gov/scitech/biblio/1219896-evaluation-effective-moisture-penetration-depth-model-estimating-moisture-buffering-buildings (accessed on 21 January 2016).
- Yoshino, H.; Mitamura, T.; Hasegawa, K. Moisture buffering and effect of ventilation rate and volume rate of hygrothermal materials in a single room under steady state exterior conditions. Build. Environ. 2009, 44, 1418–1425. [Google Scholar] [CrossRef]
- Catalina, T.; Woloszyn, M.; Virgone, J. Impact of Moisture Buffering on Energy Performance of Cooling Ceilings. In Proceedings of the Annex 41 International Conference, Lyon, France, 25–27 October 2006.
- Abadie, M.; Deblois, J.P.; Mendes, N. A Comparison Exercise for Calculating Heat and Moisture Transfers Using TRNSYS and PowerDomus. Available online: http://www.kuleuven.be/bwf/projects/annex41/protected/data/PUCPR%20Oct%202005%20Paper%20A41-T1-Br-05-2.pdf (accessed on 6 January 2016).
- Japan Image and Information Management Association (JIIMA), Suggested the Policy of Promoting Green Office to the Minister of Public Management. Available online: http://www.jiima.or.jp/pdf/policy_recommendations1.pdf (accessed on 12 December 2015).
- Japanese Standards Association. Japanese Industrial Standard Committee, JIS A 1475 Method of Test for Hygroscopic Sorption Properties of Building Materials; Japanese Standards Association: Mita, Minato-ku, Tokyo, Japan, 2004. [Google Scholar]


| Wall Type (Wall Type Number 1) (Heat Transfer Coefficient (U-Factor) (W/(m2·K)) | Layer Composition (from Inner Side to Outer Side in the Zone), (Layer Thickness (mm)) | |
|---|---|---|
| Roof (W1) (0.611) |  | Concrete (150), cement mortar (15), waterproofing layer (asphalt type, 5), cement mortar (15), thermal insulation material (polystyrene foam type, 50), concrete (60) |
| Ceiling (W2) (2.702) |  | Acoustic board (12), gypsum board (10) |
| Raised floor (W3) (3.846) |  | Carpet (3), aluminum type plate (10) |
| Floor (W4) (3.608) |  | Concrete (150) |
| External wall (W5) (0.519) |  | Gypsum board (8), non-closed air layer (–) 2, thermal insulation material (polystyrene foam type, 25), concrete (150), cement mortar (25), tile (10) |
| Internal wall (W6) (3.343) |  | Gypsum board (24), non-closed air layer (–) 2, gypsum board (24) |
| Material of Layer | Thermal Conductivity (W/(m·K)) | Specific Heat (kJ/(kg·K)) | Density (kg/m3) |
|---|---|---|---|
| Concrete | 1.40 | 0.88 | 2200 |
| Cement mortar | 1.5 | 0.80 | 2000 |
| Waterproofing layer | 0.110 | 0.92 | 1000 |
| Polystyrene foam | 0.040 | 1.13 | 20 |
| Acoustic board | 0.064 | 0.84 | 300 |
| Gypsum board | 0.70 | 1.0 | 910 |
| Carpet | 0.080 | 0.80 | 400 |
| Aluminum type plate | 210.0 | 0.88 | 2700 |
| Tile | 1.30 | 0.84 | 2400 |
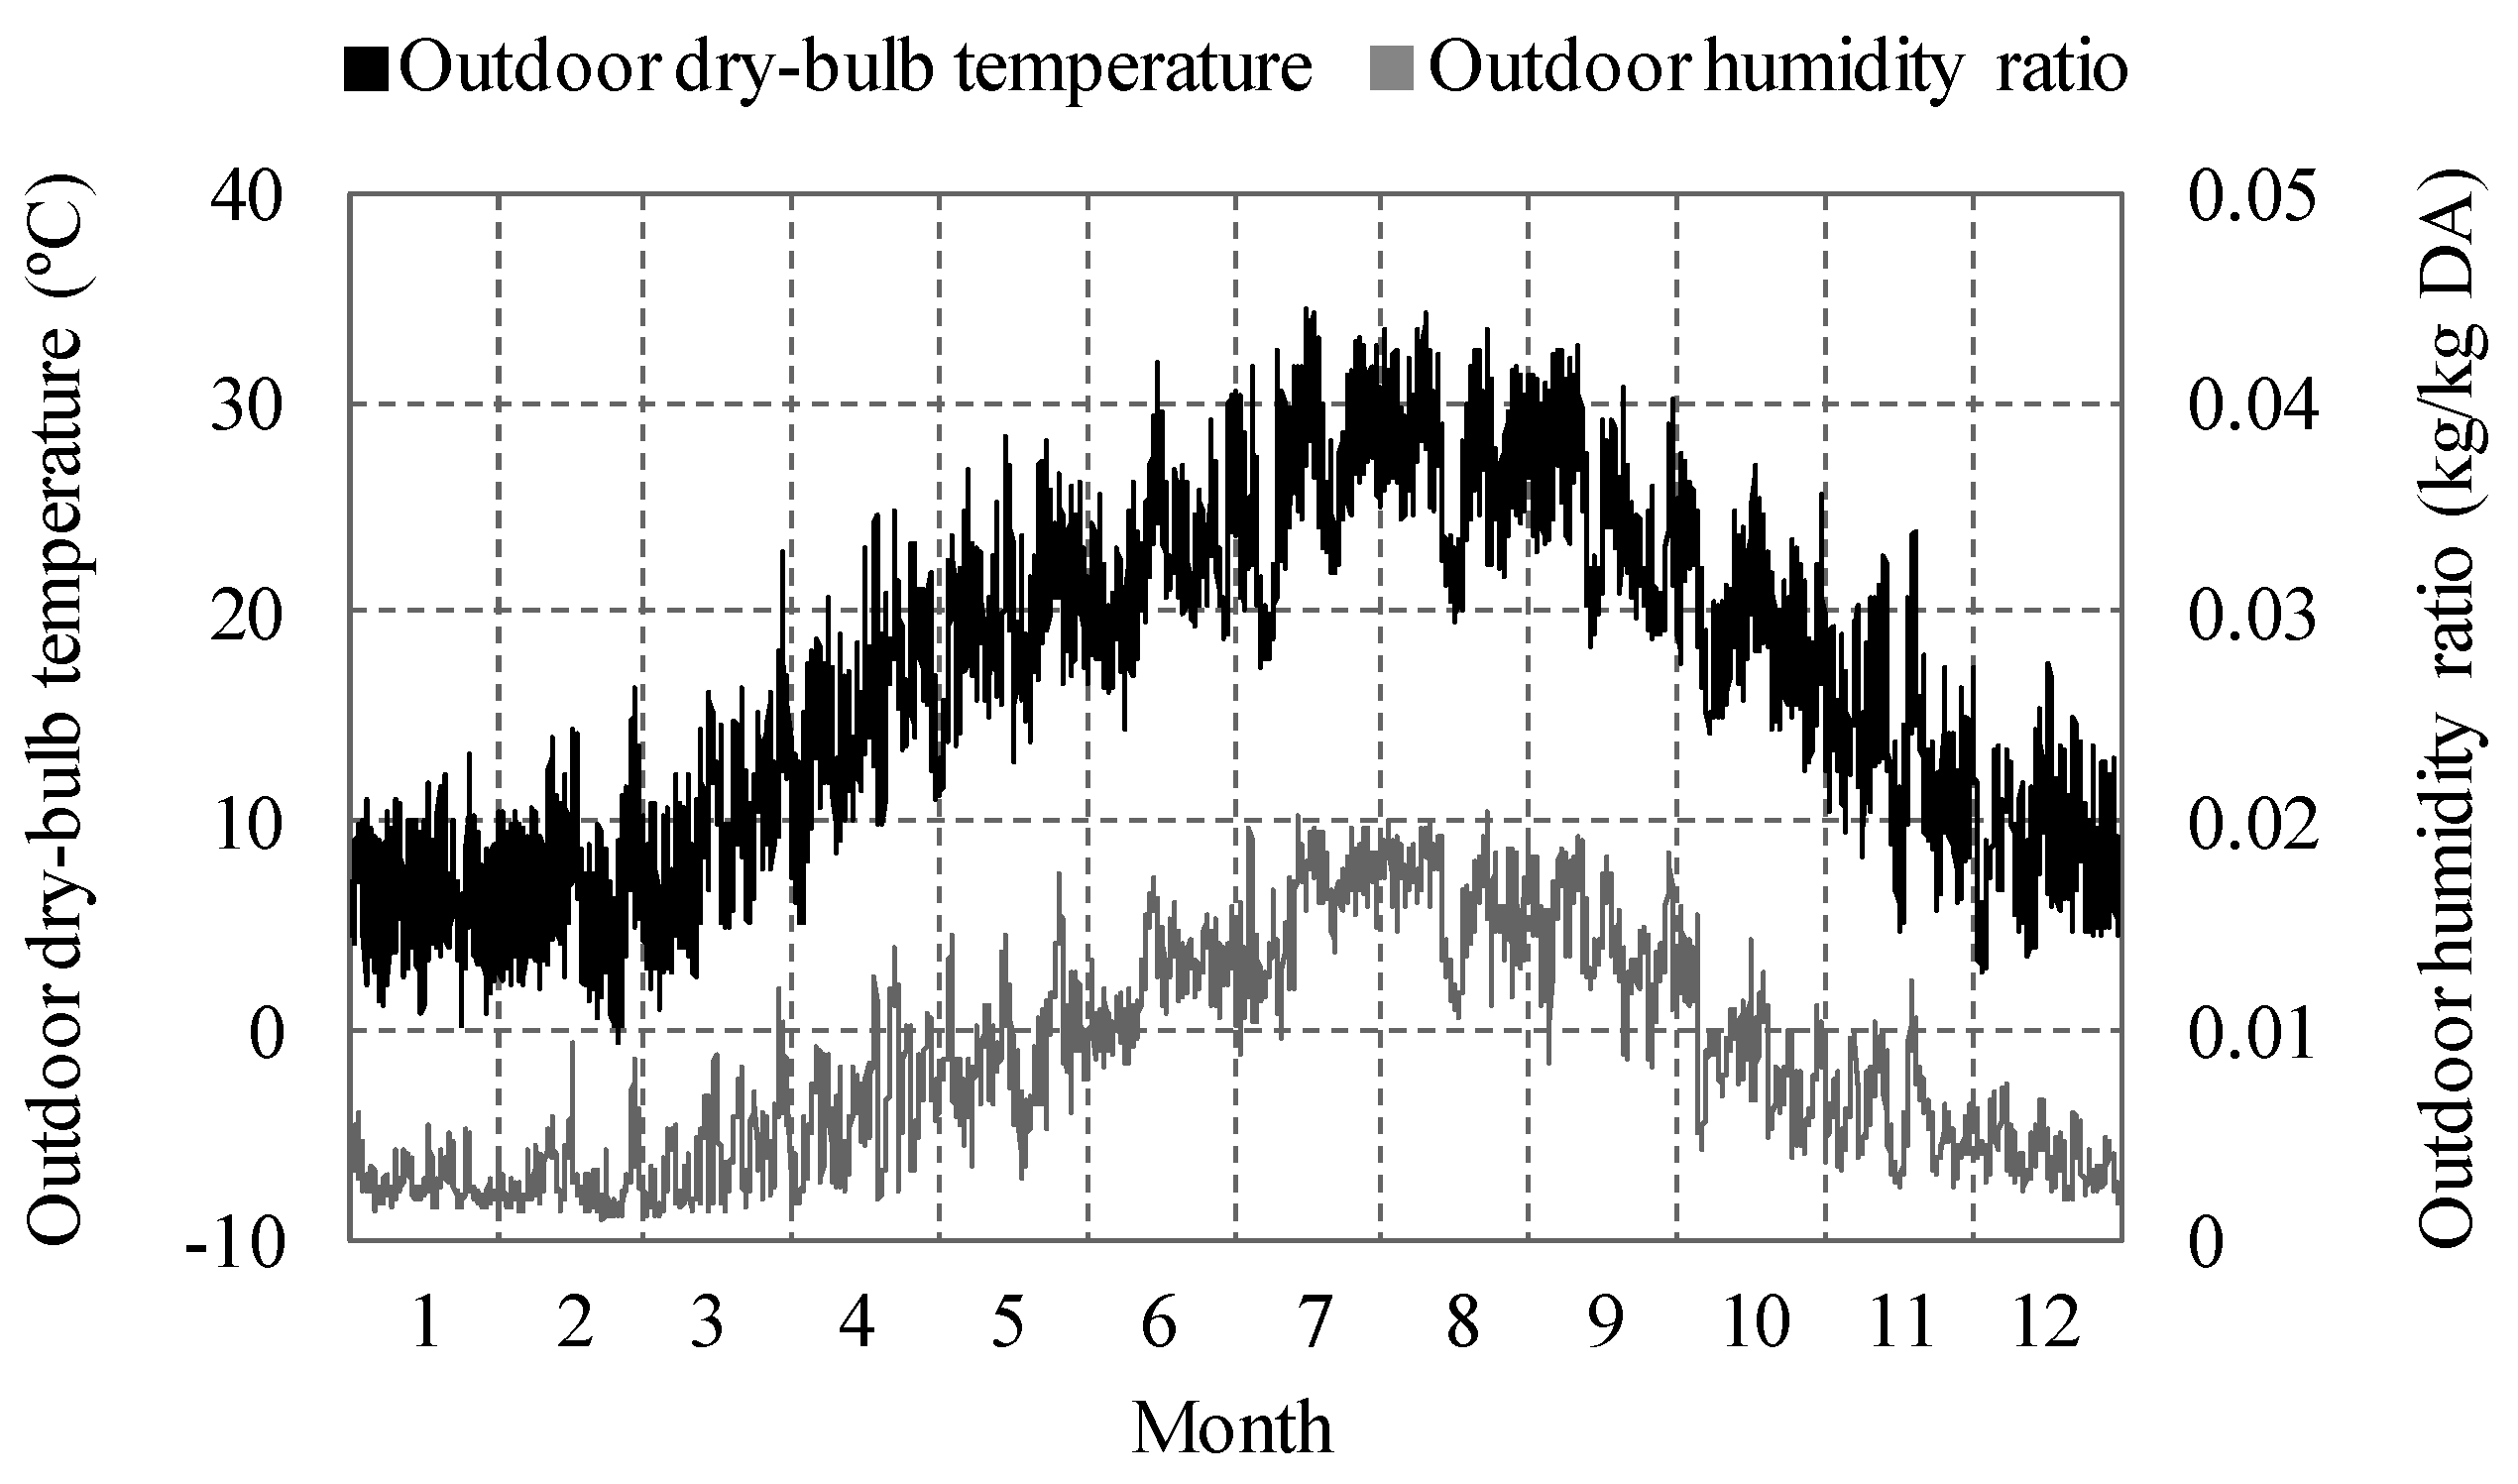
| Cooling Period (June–September) | Intermediate Periods (April–May and October–November) | Heating Period (December–March) | |||
|---|---|---|---|---|---|
| Dry-bulb temperature (°C) | Humidity ratio (kg/kg DA) | Dry-bulb temperature (°C) | Humidity ratio (kg/kg DA) | Dry-bulb temperature (°C) | Humidity ratio (kg/kg DA) |
| 14.4~34.4 | 0.0077~0.0204 | −0.5~22.9 | 0.0010~0.0120 | 4.7~28.4 | 0.0017~0.0174 |
| Summer (Cooling Period) (June–September) | Intermediate Periods (April–May and October–November) | Winter (Heating Period) (December–March) | |||
|---|---|---|---|---|---|
| Dry-bulb temperature (°C) | Relative humidity (%) | Dry-bulb temperature (°C) | Relative humidity (%) | Dry-bulb temperature (°C) | Relative humidity (%) |
| 26 | 50 | 24 | 50 | 22 | 50 |
| Time (h) | 1 | 2 | 3 | 4 | 5 | 6 | 7 | 8 | 9 | 10 | 11 | 12 |
| Lighting (%) | 0 | 0 | 0 | 0 | 0 | 0 | 0 | 0 | 100 | 100 | 100 | 100 |
| Office appliance (%) | 25 | 25 | 25 | 25 | 25 | 25 | 25 | 25 | 100 | 100 | 100 | 100 |
| Occupancy (%) | 0 | 0 | 0 | 0 | 0 | 0 | 0 | 0 | 100 | 100 | 100 | 100 |
| Time (h) | 13 | 14 | 15 | 16 | 17 | 18 | 19 | 20 | 21 | 22 | 23 | 24 |
| Lighting (%) | 50 | 100 | 100 | 100 | 100 | 100 | 100 | 100 | 80 | 0 | 0 | 0 |
| Office appliance (%) | 80 | 100 | 100 | 100 | 100 | 100 | 100 | 50 | 50 | 25 | 25 | 25 |
| Occupancy (%) | 60 | 100 | 100 | 100 | 100 | 100 | 50 | 30 | 20 | 0 | 0 | 0 |
| Cooling Period (June–September) | Intermediate Periods (April–May and October–November) | Heating Period (December–March) | |||
|---|---|---|---|---|---|
| Sensible heat (W) | Latent heat (W) | Sensible heat (W) | Latent heat (W) | Sensible heat (W) | Latent heat (W) |
| 68 | 53 | 73 | 48 | 78 | 43 |
| Air link Number 1 | From Node | To Node | Air Link Type | Characteristics of the Link |
|---|---|---|---|---|
| 1 | OA (south) | Office | Crack | Length of crack = 80 m; mass flow coefficient = 0.00025 kg/(s·m)@1 Pa; airflow exponent = 0.6 |
| 2 | Office | Corridor | Large opening | Door louver; area of opening = 0.6 m (W) × 0.3 m (H); number of openings = 4; opening rate = 40 %; airflow exponent = 0.6 |
| 3 | Elevator hall/corridor | Staircase (west) | Crack | Length of crack = 9.6 m; mass flow coefficient = 0.0000130 kg/(s·m)@1 Pa; airflow exponent = 0.6 |
| 4 | Staircase (west) | OA (north) | Crack | Length of crack = 6.4 m; mass flow coefficient = 0.00025 kg/(s·m)@1 Pa; airflow exponent = 1 |
| 5 | Elevator hall/corridor | Elevator shaft | Crack | Length of crack = 18 m; mass flow coefficient = 0.0000130 kg/(s·m)@1 Pa; airflow exponent = 0.6 |
| 6 | Elevator hall/corridor | OA (north) | Crack | Length of crack = 6.4 m; mass flow coefficient = 0.00025 kg/(s·m)@1 Pa; airflow exponent = 1 |
| 7 | Warehouse/service room | OA (north) | Crack | Length of crack = 6.4 m; mass flow coefficient = 0.00025 kg/(s·m)@1 Pa; airflow exponent = 1 |
| 8 | Elevator hall/corridor | Warehouse/service room | Large opening | Undercut of door; area of undercut = 2 m (W) × 0.01 m (H); number of undercuts = 1; airflow exponent = 0.6 |
| 9 | Elevator hall/corridor | Toilet | Large opening | Undercut of door; area of undercut = 0.9 m (W) × 0.01 m (H) ; number of undercuts = 2; airflow exponent = 0.6 |
| 10 | Toilet | OA (north) | Crack | Length of crack = 12.8 m; mass flow coefficient = 0.00025 kg/(s·m)@1 Pa; airflow exponent = 1 |
| 11 | Elevator hall/corridor | Staircase (east) | Crack | Length of crack = 9.6 m; mass flow coefficient = 0.0000130 kg/(s·m)@1 Pa; airflow exponent = 0.6 |
| 12 | Staircase (east) | OA (north) | Crack | Length of crack = 6.4 m; mass flow coefficient = 0.00025 kg/(s·m)@1 Pa; airflow exponent = 1 |
| 13 | Auxiliary node | Office | Duct | SA; dry-bulb temperature, humidity ratio and airflow rate of SA were set according to the calculation method described in Section 2.1.4 |
| 14 | Office | Auxiliary node | Fan | RA; airflow rate = airflow rate of SA − airflow rate of EA |
| 15 | Warehouse/service room | Auxiliary node | Fan | EA; airflow rate = 5 ACH |
| 16 | Toilet | Auxiliary node | Fan | EA; airflow rate = 5 ACH |
| Wall Orientation | Wind Angle (South = 0°, West = 90°, North = 180°, East = 270°) | |||||||
|---|---|---|---|---|---|---|---|---|
| 0° | 45° | 90° | 135° | 180° | 225° | 270° | 315° | |
| South | 0.2 | 0.05 | −0.25 | −0.3 | −0.25 | −0.3 | −0.25 | 0.05 |
| West | −0.25 | 0.05 | 0.2 | 0.05 | −0.25 | −0.3 | −0.25 | −0.3 |
| North | −0.25 | −0.3 | −0.25 | 0.05 | 0.2 | 0.05 | −0.25 | −0.3 |
| East | −0.25 | −0.3 | −0.25 | −0.3 | −0.25 | 0.05 | 0.2 | 0.05 |
| Building Materials and Paper | Density (kg/m3) | Gradient of Sorptive Isothermal Line ((kg (Water)/kg (Building Material))/(Relative Humidity)) | Diffusion Resistance (–) |
|---|---|---|---|
| Acoustic board | 300 | 0.013 | 1 |
| Concrete | 2200 | 0.040 | 70 |
| Gypsum board | 910 | 0.015 | 8 |
| Cement mortar | 2000 | 0.020 | 35 |
| Polystyrene foam | 20 | 0.700 | 50 |
| Paper | 100 | 0.120 | 53 |
| Zone | Surface Buffer Storage | Deep Buffer Storage | ||||
|---|---|---|---|---|---|---|
| βsurf 1 | κsurf 2 | Msurf 3 | βdeep 1 | κdeep 2 | Mdeep 3 | |
| Office | 2444.2 | 0.016 | 2660.4 | 814.7 | 1 | 7326.7 |
| Elevator hall/corridor | 258.7 | 0.015 | 497.4 | 86.2 | 1 | 753.1 |
| Staircase (east, west) | 175.9 | 0.033 | 1239.3 | 58.6 | 1 | 551.6 |
| Elevator shaft | 113.8 | 0.015 | 344.2 | 37.9 | 1 | 151.0 |
| Warehouse/service room | 152.2 | 0.015 | 331.7 | 50.7 | 1 | 380.3 |
| Toilets | 258.7 | 0.015 | 497.4 | 86.2 | 1 | 753.1 |
| Duct space/machine room | 174.7 | 0.037 | 2755.1 | 58.2 | 1 | 305.2 |
| Grade | Criterion | Mass Flow Coefficient (kg/(s·m)@1 Pa) | Airflow Exponent (−) | |
|---|---|---|---|---|
| A-1 | Area where ventilation is required | 0.001000 | 1 | |
| A-2 1 | General building | Soundproofed, thermally-insulated or dust-proofed building | 0.000250 | 1 |
| A-3 | 0.000067 | 1 | ||
| A-4 | 0.000017 | 1 | ||
| Thickness of Thermal Insulation (mm) | External Wall | 0 | 5 | 15 | 25 1 | 50 | 75 | 100 |
| Roof | The thickness of thermal insulation in roof was fixed at 50 mm 2 | |||||||
| Type of Glass | The type of glass was fixed at single float glass 3 | |||||||
| Type of Glass | U-Factor (W/(m2·K)) | Solar Heat Gain Coefficient (−) | Shading Coefficient (−) | Frame |
|---|---|---|---|---|
| Single float 1 | 5.53 | 0.797 | 0.78 | Aluminum type; area ratio of frame to window = 0.15; solar absorptance = 0.6; U-factor = 2.27 W/(m2·K) |
| Double float | 3.35 | 0.782 | 0.91 | |
| Double low-e | 2.53 | 0.567 | 0.66 | |
| Triple float | 2.00 | 0.700 | 0.78 |
© 2016 by the authors; licensee MDPI, Basel, Switzerland. This article is an open access article distributed under the terms and conditions of the Creative Commons Attribution (CC-BY) license (http://creativecommons.org/licenses/by/4.0/).
Share and Cite
Cho, W.; Iwamoto, S.; Kato, S. Condensation Risk Due to Variations in Airtightness and Thermal Insulation of an Office Building in Warm and Wet Climate. Energies 2016, 9, 875. https://doi.org/10.3390/en9110875
Cho W, Iwamoto S, Kato S. Condensation Risk Due to Variations in Airtightness and Thermal Insulation of an Office Building in Warm and Wet Climate. Energies. 2016; 9(11):875. https://doi.org/10.3390/en9110875
Chicago/Turabian StyleCho, Wanghee, Shizuo Iwamoto, and Shinsuke Kato. 2016. "Condensation Risk Due to Variations in Airtightness and Thermal Insulation of an Office Building in Warm and Wet Climate" Energies 9, no. 11: 875. https://doi.org/10.3390/en9110875