1. Introduction
Data centers comprise of large computational and storage systems interconnected through a communication network serving a large number of popular services in the Internet such as search engines (e.g., Google), Internet commerce (e.g., Amazon and e-Bay), web based e-mail (e.g., Yahoo mail), social networking (e.g., Myspace and Facebook) and video sharing (e.g., YouTube). In addition to computational and storage systems, the data centers also consist of power supply equipment, communication network, air conditioning, security systems and other related devices and can span over an area as large as a small town. Data centers are expanding rapidly in order to meet the traffic demands due to the large increase in Internet usage, resulting in ever increasing energy consumption. About 20% of energy consumption in a data center occurs in the Data Center Network (DCN) which lies at the core of a data center since it connects a large number of servers at various hierarchies through switches [
1]. Wang et al. stated that in a typical Google data center the network power is approximately 20% of the total power when the servers are utilized at 100%, but it increases to 50% when the utilization of servers decreases to 15%, which is quite typical in production data centers [
2]. Yang et al. stated that as data centers continue to grow in size, often housing tens of thousands or even hundreds of thousands of servers, the scale of data center networks has skyrocketed and in now in the same league as computing server’s costs [
3]. In large data centers, the DCN can connect hundreds or thousands of servers to support various applications and cloud computing. It is a general practice that the network devices of a data center are always kept in an “on” state, resulting in around 67.7 W energy consumption even in an idle state. The ever-increasing DCN cost and energy consumption have spurred the interest of the networking community to develop energy-efficient protocols and to devise methods to reduce energy consumption in DCNs striving for green data centers.
Major techniques for network energy optimization or green networking can broadly be categorized into four groups: (a) resource consolidation; (b) virtualization; (c) selective connectedness; and (d) proportional computing [
4,
5,
6]. Resource consolidation refers to finding a minimum power network subset which meets the current traffic demands. The resource consolidation methods are based on the identification of redundancy in networking resources due to over-provisioning and carefully designing algorithms for shutting down the redundant resources to consolidate network traffic on a selected subset of network components [
7,
8,
9,
10,
11]. Virtualization techniques operate multiple services on a single hardware thereby utilizing hardware smartly to conserve energy [
12]. Selective connectedness refers to the techniques used for identifying network components for potential future traffic and keeping them in a sleep state or in low power mode instead of shutting them down [
13]. Proportional computing refers to energy consumption proportional to resource utilization which includes data rate adjustments of links and ports based on various criteria [
14,
15,
16,
17].
A DCN is usually provided with extra resources to handle the worst-case workloads that seldomly occur, which means that under normal conditions the DCN capacity remains underutilized [
18]. This results in energy wastage due to energy consumption by those nodes which spend most of the time in an idle state. Adapting DCN capacity to its workload can result in a significant amount of power savings. This paper presents Adaptive TrimTree; a mechanism for a green DCN which proposes a combination of resource consolidation, selective connectedness and proportional computing methods to achieve optimal energy consumption with minimal performance compromises. The mechanism first identifies two network subsets called ‘active network subset’ and “passive network subset”. The active network subset is a minimum segment of the network needed to meet the current traffic demand based on the network topology and traffic, whereas the passive network subset is a set of switches and links which can be needed to meet future traffic demands and anomalies. Based on these subsets, route management and power management are carried out. Power management refers to switching the active components to “on” state, passive components to a sleep state and shutting OFF the remaining network components. The “Rate Adaption” module then adapts the link data rates of “on” components in accordance with the load, thus maximizing energy savings. We compare our proposed mechanism with the baseline e.g., fat-tree DCN and ElasticTree which is a power conservation scheme for DCNs based on resource consolidation only. The “active network subset” computation in our scheme is inspired by the topology-aware heuristic employed in ElasticTree [
11]. Our results confirm that Adaptive TrimTree outperforms both fat-tree DCN and ElasticTree on power savings with negligible impact on delay and packet loss percentage.
The remainder of the paper is organized as follows:
Section 2 presents a literature review. In
Section 3 we present the design of Adaptive TrimTree mechanism.
Section 4 presents the mathematical analysis of our proposed mechanism and
Section 5 presents the simulation results in terms of power consumption, packet loss percentage and delay.
Section 6 presents the discussion; and finally
Section 7 summarizes the results and concludes the paper.
2. Literature Review
Energy inefficiency in data centers has been recognized as a real challenge and a number of proposals have been presented in various energy conservation technique areas for computer networks and especially for data center networks. While we find a number of proposed schemes in the various energy optimization technique categories, to the best of our knowledge, there exists no unified scheme akin to our proposed method. A number of efforts have been reported for energy optimization using Virtual Machines (VMs). A mechanism for placement and communication between virtual machines is presented in [
3]. This work considers the placement of VMs at the planning stages as well as traffic configuration within the DCN. The main focus of this work is load balancing and avoiding congestions for efficient energy usage. Bilal et al. [
6] conducted a survey on various adaptive link rate methods for green communications and categorized the various schemes into groups. Their work is a useful guideline for researchers conducting research in this area, helping them in understanding the scope of the techniques proposed so far along with identifying shortcomings of each method. Bolla et al. [
7] conducted a survey of existing approaches and trends in energy-aware fixed network infrastructures for future Internet and concluded that a considerable amount of energy can be saved by using energy efficient resource management methods and energy proportional network components. Mahadevan et al. [
9] proposed a standard benchmark suit that can be applied on a switch to estimate its energy consumption at various traffic loads. This is useful in energy consumption estimation of various networks like Local Area Networks (LANs), Wide Area Networks (WANs) and data center networks.
Some of the notable works based on resource consolidation are those by Wang et al. [
10] and Heller et al. [
11]. Wang et al. proposed a power optimization technique for data center networks called CARPO. It is a correlation-aware power optimization algorithm that dynamically consolidates traffic flows on a subset of links and switches in a DCN. Heller et al. studied real traffic from a production data center and verified that traffic can be consolidated on a subset of links and switches while turning off the extra switches without affecting performance. They observed that their computed subset can handle bandwidth demands most of the time [
11]. This is closely related to our work and we use ElasticTree as a benchmark for performance analysis of our proposed mechanism. Proportional computing refers to the idea that the network must consume energy proportional to its traffic; there are two categories of proportional computing methods: Dynamic Voltage and Frequency Scaling (DVFS) and Adaptive Link Rate (ALR). ALR techniques are used to reduce energy consumption in devices by making them consume energy proportional to their load. Some of the adaptive link rate methods for Ethernet are suggested by Gunaratne et al. [
15,
16]. Nedevschi et al. [
17] suggested two schemes to reduce power consumption in network devices, the first method is to put network devices into sleep mode and the second method proposes rate adaption.
Comprehending data center network traffic is of utmost importance for designing topology- and traffic-based solutions. Some of the important work in this direction is described in [
19,
20]. Benson et al. [
19] observed DCN traffic patterns in detail through observation of data traces. They used Simple Network Management Protocol (SNMP) data to examine link utilization and packet losses at core, edge and aggregation layer. They observed that the average link utilization of aggregation layer links is only about 8% for 95% of the time while for edge and core links it is approximately 20% and 40%, respectively. They also conclude that the DCN traffic follows the on-off behavior.
In recent years some notable work has been done in predictive scheduling on CPUs to conserve energy. Salinas-Hilburg et al. [
21] have presented Grammatical Evolution techniques to improve energy efficiency by predicting the dynamic power of the CPU and memory subsystems using the hardware counters of each application. The model helps predict the power consumption of two different tasks co-allocated in the same server. This work is performed using hardware counters of individual applications without running the co-allocated application. Another work [
22] focuses on optimizing the energy efficiency through dynamic prediction of CPU idle intervals. The idea is to optimize the sleep intervals of the CPUs to improve the energy efficiency.
The energy efficiency problem in data centers has been tackled as a traffic engineering problem using a time-aware model in [
23], proving that it is a Non-deterministic Polynomial-time (NP) hard problem. The authors then assign VMs to servers to reduce the traffic and generate favorable conditions using traffic engineering. This work focuses on optimizing the routing to conserve energy. Another work [
24] also focuses on assignment of VM resources for energy optimization. A similar approach is proposed in [
25] for an energy efficient initial VM placement. Another energy-efficient routing framework for cloud data centers is proposed in [
26]. This work considers the problem under network-as-a-service paradigm and extends the energy-efficient routing from single-resource to multi-resource. A greedy routing algorithm is proposed, which selects the traffic flows gradually to exhaust capacities of active nodes.
The use of artificial intelligence techniques has also been seen in some of the latest works on energy optimization for data centers. A cooperative multi-agent solution to manage servers for VM consolidation is proposed in [
27] by Li et al. Their work focuses on managing the physical servers to avoid overloading and underutilization by assigning VMs. However, the results of this work are highly dependent on the quality of the decision making process. Swarm intelligence is used by Farahnakian et al. [
28] for consolidation and migration of VMs in the system under changing network states. They ensure that the Quality of Service (QoS) requirements are guaranteed before any energy optimization is done. Similarly in [
29] Gao et al. use the reinforcement learning techniques for VM consolidation and placement. Gupta et al. [
30] propose a resource management scheme which combines dynamic voltage/frequency scaling and server consolidation to achieve energy efficiency. They ensure that the required service level agreements in cloud data centers are met. Their scheme integrates timing analysis, queuing theory, integer programming, and control theory techniques to improve energy efficiency of the system.
3. Adaptive TrimTree Mechanism
This section presents the design of Adaptive TrimTree mechanism. Some of the key design features of Adaptive TrimTree are as follows:
A simple traffic-and-topology-based heuristic for resource consolidation: Resource consolidation saves energy by switching off the redundant network resources. We opt for a simple heuristic based on traffic analyzer output and DCN topology.
Selective connectedness for traffic anomalies thus avoiding performance loss due to sudden traffic demands: Resource consolidation can oversimplify the need for redundant resources therefore identifying additional required resources and keeping those in sleep mode to be invoked as required provides better service guarantee.
Link rate adaption of active network subset based on buffer occupancy and link utilization to scale the data rates of switches thus making the network subset energy proportional.
The system design of our proposed mechanism is shown in
Figure 1. It comprises of four modules; TrimTree, Route Update, Power Management and Rate Adaption. The first module “TrimTree” identifies two network subsets called “active network subset” and “passive network subset”. The active network subset is a minimum segment of network to meet the current traffic demand based on the network topology and traffic. The passive network subset is a set of switches and links which can be required to meet future traffic demands and anomalies. This information is shared with the “Route Update” and “Power Management” modules. The “Route Update” module updates routing tables for the new network subset (active + passive). The “Power Management” module physically implements the active and passive networks by switching the active components to ON state, passive components to sleep state and shutting OFF the remaining network components. The “Rate Adaption” module adapts the link data rates of “on” components in accordance with the load thus maximizing energy savings.
3.1. TrimTree Module
The TrimTree module employs a simple traffic-and-topology-based heuristic to compute two network subsets; ‘active network subset’ and ‘passive network subset’. We select the regular and straightforward fat-tree DCN topology for implementing Adaptive TrimTree. Before elaborating the details of TrimTree module we briefly discuss the fat-tree DCN topology shown in
Figure 2. The fat-tree data center network design incorporates the low cost Ethernet commodity switches to form a k-ary fat-tree [
31]. There are k pods, each having two layers of k/2 switches. Each switch in the lower layer is k-port connecting directly to k/2 servers through k/2 ports and connecting with k/2 ports of the aggregation layer through remaining k/2 ports. There are (k/2)
2 k-port core switches with one port connecting to each pod. Generally, a fat-tree with k-port switches supports k
3/4 servers.
The fat-tree topology supports the use of identical, commodity switches in all layers offering multiple-times cost reduction as compared to tier architectures. This design employs two-level route lookups to assist multi-path routing. In order to prevent congestion at a single port due to concentration of traffic to a subnet and to keep the number of prefixes to a limited number, two-level routing tables are used that spread outgoing traffic from a pod evenly among core switches by using the low-order bits of the destination IP address.
The “active network subset” generated by TrimTree module is a minimum power network subset which meets the current traffic demand using a simple yet fast heuristic based on network topology and traffic information from the traffic analyzer inspired by the topology-aware heuristic proposed by Heller et al. in [
11]. This heuristic uses the flows information from the traffic analyzer to find a minimum number of up-traffic and down-traffic active links and active switches in edge, aggregation and core layers of fat-tree DCN. It is suited for fat tree topology and is not routing protocol dependent. The ‘active network subset’ is computed as follows:
Active network subset = {active links + active switches}
Active links = {active core-aggregation links + active aggregation-edge links}
Ative switches = {active core switches + active aggregation switches}
Active links computation:
Active core-aggregation links = max{min number of links to support uplink traffic
pod→core, min number of links to support downlink traffic core→pod, 1}
Active core-aggregation links = max{∑all uplink pod→core switch traffic flows/link rate,
∑all downlink core→pod traffic flows/link rate, 1}
Active aggregation-edge links = max{min active number of links to support uplink traffic
edge→aggregate switch, min number of active links to support downlink traffic
aggregate→edge switch, 1}
Active aggregation-edge links = max{(∑all uplink edge→aggregate switch traffic
flows/link rate), (∑all downlink aggregate→edge switch traffic flows/link rate), 1}
Active switches computation:
Active aggregation switches = max{min number of aggregation switches uplink traffic
edge→aggregate link, min number of aggregation switches downlink core→aggregate link, 1}
Active core switches = traffic between core and the most active pod
Active core switches = maxlinks{minimum number of uplinks from pod to core to satisfy
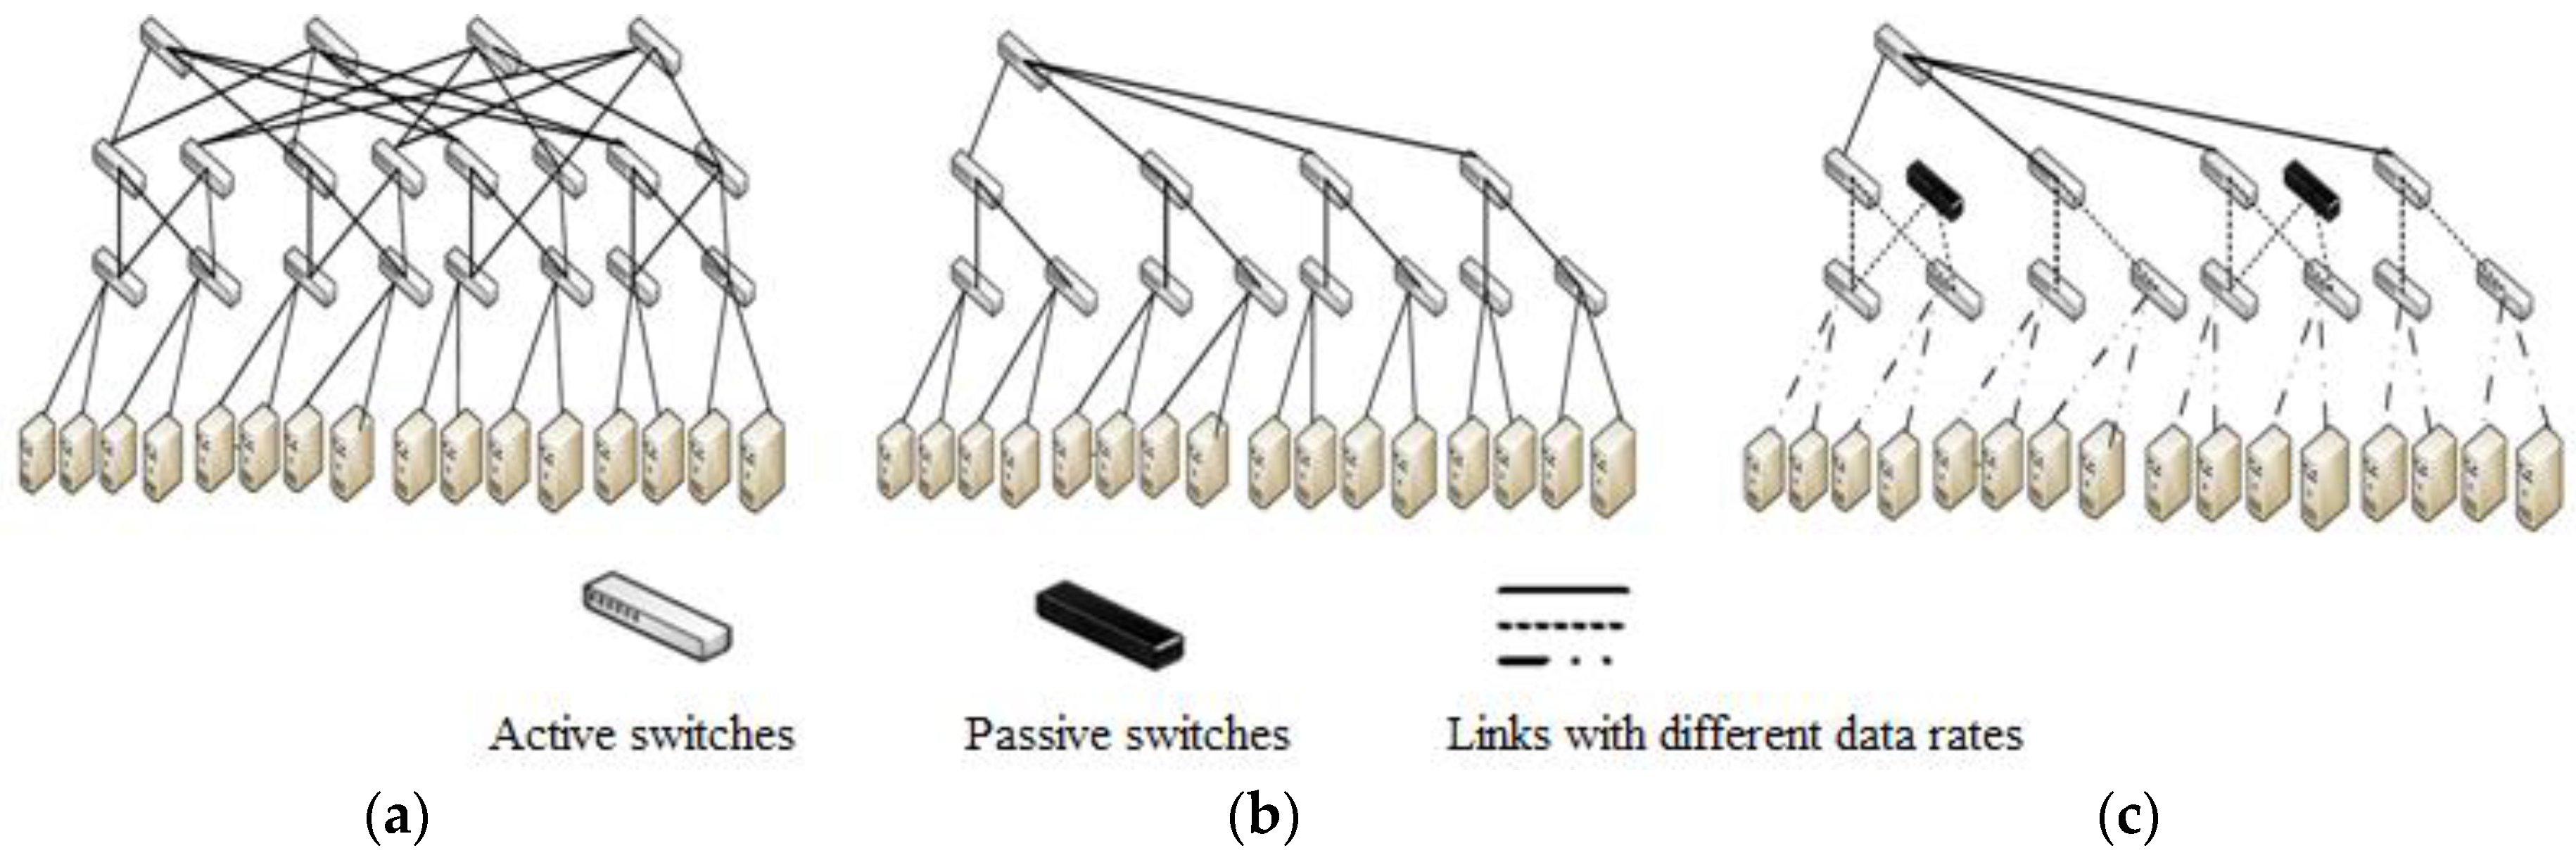
aggregate→core traffic flows}An example of application of this heuristic on fat-tree topology of
Figure 3a is shown in
Figure 3b. The “passive network subset” is computed by the TrimTree module based on “active network subset” and DCN application. It is reported by Benson et al. [
19] that in cloud data center, 75% of traffic remains within a rack and in university and private enterprise data centers 40%–90% of traffic leaves the rack passing through the network. Therefore for cloud applications, “passive network subset” is computed by augmenting the “active network subset” and selecting aggregation layer switches and links in the same pod for backup because there is very little out-of-rack traffic. While for other applications, TrimTree computes a ‘passive network subset’ which comprises of two aggregate switches in a 4-pod network as shown in
Figure 3c which means alternate aggregate switches in fat-tree DCN along with its uplinks and downlinks. The “passive network subset” is computed as follows:
  Passive network subset = {passive links + passive switches}
  Passive links = {passive core-aggregation links + passive aggregation-edge links}
  Passive switches = {passive core switches + passive aggregation switches}
  Passive links computation:
      Passive core-aggregation links = {0 for cloud application/ neighboring links of active links}
      Passive aggregation-edge links = {alternate neighboring links of active links}
  Passive switches computation:
      Passive aggregation switches = {alternate neighbor switches of active aggregate switches}
      Passive core switches = {0 for cloud application/neighboring core switch of active core switch}
This information is passed to the Route Update and the Power Management modules. The roles of these two modules are discussed below.
3.2. Route Update Module
The Route Update module invokes the routing protocol for fat-tree like OSPF-ECMP which updates paths for all network flows and pushes these routes into the network. This is accomplished for active and passive network subsets. Although the passive network subset is initially in sleep mode routes must exist in routing tables of active switches so that when there is additional traffic, a wake-up packet can be sent to a passive switch. The decision criteria for toggling a neighboring passive switch can be based on packet loss percentage or queue threshold etc. Other details concerned with routing such as how active and passive routes are segregated at the switches, and how to toggle a passive switch to “on” state etc. do not fall in the domain of this paper therefore we focus on our primary objective and leave this as a future work.
3.3. Power Management Module
Generally selective connectivity implementation in the Internet involves two approaches for putting switches into “sleep” mode: uncoordinated and coordinated. In “uncoordinated sleeping”, devices (routers/LAN switches) make their own decisions about when to go to “sleep” based on traffic monitoring on interface(s). In “coordinated sleeping”, a network-wide approach is taken where sleep decisions are coordinated and made at the level of an area in an Autonomous System (AS) and selected routers/switches are informed to “sleep” [
32]. In many of today’s end systems, a “Wake-on-LAN” functionality is built into the Network Interface Card (NIC), such that the NIC wakes the host when a special packet arrives.
The Power Management module receives active and passive network subsets information from the TrimTree module and implements “coordinated sleeping” to toggle the power state of ports, line-cards, and switches which have to be turned “off” while keeping the active network subset “on”. It also toggles the passive network subset components to “sleep” mode. The precise way of implementing this in a real data center network is not elaborated which can use any of the suitable mechanism such as command line interface or SNMP or some other control mechanism.
Subsequent toggling of passive subset switches into “on” and “sleep” mode is managed by the switches, which is uncoordinated approach. Different methods of implementing uncoordinated sleeping are proposed in literature along with solutions of issues involved in each method. We propose an approach where an active switch upon deciding to invoke an adjacent passive switch sends a wake-up packet to turn it to “on” state. We suggest that passive switches once invoked must remain “on” in order to avoid unnecessary complexity because since TrimTree module re-computes network subsets periodically, there would be new subsets soon and new states will be implemented nevertheless.
3.4. Rate Adaption Module
The Rate Adaption module incorporates link rate adaption in all the active Ethernet switches of the DCN. It is done by making them adjust their link rates proportional to buffer occupancy and link utilization. It has been reported that operating switches at lower data rates results in considerable energy saving especially when the network size is large [
2,
13]. It has also been observed that a simple policy based on output buffer queue length threshold and utilization monitoring is quite effective in decision-making regarding the adjustment of data link rates [
13]. In order to keep our mechanism simple and fast, we incorporate a simple link rate adaption policy adopted by all switches of the ‘active network subset’. Queue threshold and link utilization are selected as the parameters for triggering low-to-high and high-to-low data rate transitions respectively. If link data rate is low and the queue length is less than the high queue threshold (around 50% of buffer size) the data rate remains low but if queue length exceeds the high queue threshold, the link rate is set high. This is accomplished by a rate transition Medium Access Control (MAC) frame acknowledged by the receiving end. If the link data rate is high and the queue length is less than the low queue threshold (around 20% of buffer size) and link utilization is less than link utilization threshold, the link data rate is set low. This is accomplished by a rate transition MAC frame sent and if acknowledged, data rate is set to low. Link utilization is monitored by counting bytes sent during a specified period.
4. Analysis of Energy Consumption
In this section we analyze the energy consumption in Adaptive TrimTree and compare it with energy usage in Fat-Tree topology Minimum Spanning Tree (MST) of ElasticTree [
11]. For the analysis purposes we have used the topologies shown in
Figure 3a–c to represent full connected fat-tree DCN with all active switches, MST ElasticTree, and Adaptive TrimTree respectively. For
n-port fat-tree DCN topology, the number of servers, switches in the edge layer, aggregation layer and core layer and links are given in
Table 1.
In our analysis we use 48-port topologies with different number of pods. We have used PRONTO 3240 as commodity switches in DCN at all layers. Power specification for a PRONTO 3240 switch [
10] is given in
Table 2.
Wang et al. [
10] developed a formula for empirical power consumption model of the entire network in their testbed comprising of 10 virtual switches on a single physical switch. Since each individual virtual switch cannot be shut down separately, they measure the power consumption of the entire physical switch with no ports turned on which is 66.7 W leading to 6.67 for each virtual switch as its chassis power consumption. To calculate the power consumption in fat-tree DCN topology we generalize the formula by Wang et al. for ports operating at different data rates, in Equation (1):
where 6.67 W is the chassis power consumption of each virtual switch,
Ns = number of active virtual switches,
Pi is the active power of a single port at the data rate level
i, and
Ji is the corresponding number of active ports at that data rate level and
d is the total number of data rates at which ports can operate. Power consumption in Fat-Tree, ElasticTree and Adaptive TrimTree are computed and the results given in
Table 3. Note that in our example, we assume only two data rates for ports: 1 Gbps and 100 Mbps therefore
d = 2. The power consumed by an active port at maximum data rate (1 Gbps) is 1 W and power consumed by active ports at 100 Mbps 0.3 W. We assume that in Adaptive TrimTree 25% of ports are operating at 100 Mbps which is both reasonable and realistic keeping in view that it is a MST for meeting the current traffic demand, although this percentage can exceed. Also some ports can operate at 10 Mbps consuming 0.15 W of power. Calculation of total power consumption (shown in
Table 3) is as follows:
Fat-tree: 2880 active switches, 138,240 active ports each consuming 1 W power at 1 Gbps, d = 1: ElasticTree: 1201 active switches, 30,048 active ports each consuming 1 W power at 1 Gbps, d = 1: Adaptive TrimTree: 1201 active switches, (30,048 − 7512 = 22,536) active ports each consuming 1 W power at 1 Gbps, and 7512 ports each consuming 0.3 W power at 100 Mbps, d = 2:
In power consumption computation for Adaptive TrimTree, we have assumed that none of the passive components are “on”. As passive switches will turn “on”, power consumption in Adaptive TrimTree will increase but that is the worst case scenario and power consumption will still be lower than both fat-tree and ElasticTree due to some links operating at reduced data rates.
We varied the number of pods as 4, 8, 16, 24 and 48 and computed power consumption in fat-tree, ElasticTree and Adaptive TrimTree. The results are plotted in
Figure 4 which shows a drastic increase in power consumption as the number of pods increases in the fat-tree topology but ElasticTree is quite promising and Adaptive TrimTree gives best results.
The power saving percentage can be calculated by using the formula given in Equation (2):
Power saving comparison of Adaptive TrimTree (some links operating at 1 Gbps and others operating at 100 Mbps) with ElasticTree and fat-tree topology is given in
Table 4.
5. Results
In order to test and validate our proposed mechanism we carried out simulations using the Mininet emulator [
33] which runs a collection of hosts, switches, routers and links on a single Linux kernel using lightweight virtualization. We use Iperf for traffic generation and to estimate delay jitter and packet loss. To measure latency we used ping command. We implemented the fat-tree topology of DCN given in
Figure 2 for four pods. Next we implemented the MST of ElasticTree for 4-pod fat-tree topology with all links/switches and ports operating at 1 Gbps. Finally we implemented the active and passive network subsets of Adaptive TrimTree. In Adaptive TrimTree, links between various switches operate at varying data rates from 10 Mbps, 100 Mbps to 1 Gbps depending upon link utilization and passive switches are initially in sleep mode. Iperf simulation parameters are given in
Table 5.
The various tests and simulations are explained in the following sections along with their results. Our performance metrics include power consumption, packet loss percentage and delay.
5.1. Analysis of Queue Threshold and Link Utilization
Link utilization is the ratio of current link traffic to the maximum traffic that the interface can handle. While high link utilization depicts the link is busy, low link utilization shows that the link is underutilized. When link utilization exceeds the threshold under normal condition, it causes a considerable delay because of the increase in queue size. A queue of average length less than a certain threshold never causes packets to drop. This threshold depends on traffic characteristics, such as burstiness and arrival rate.
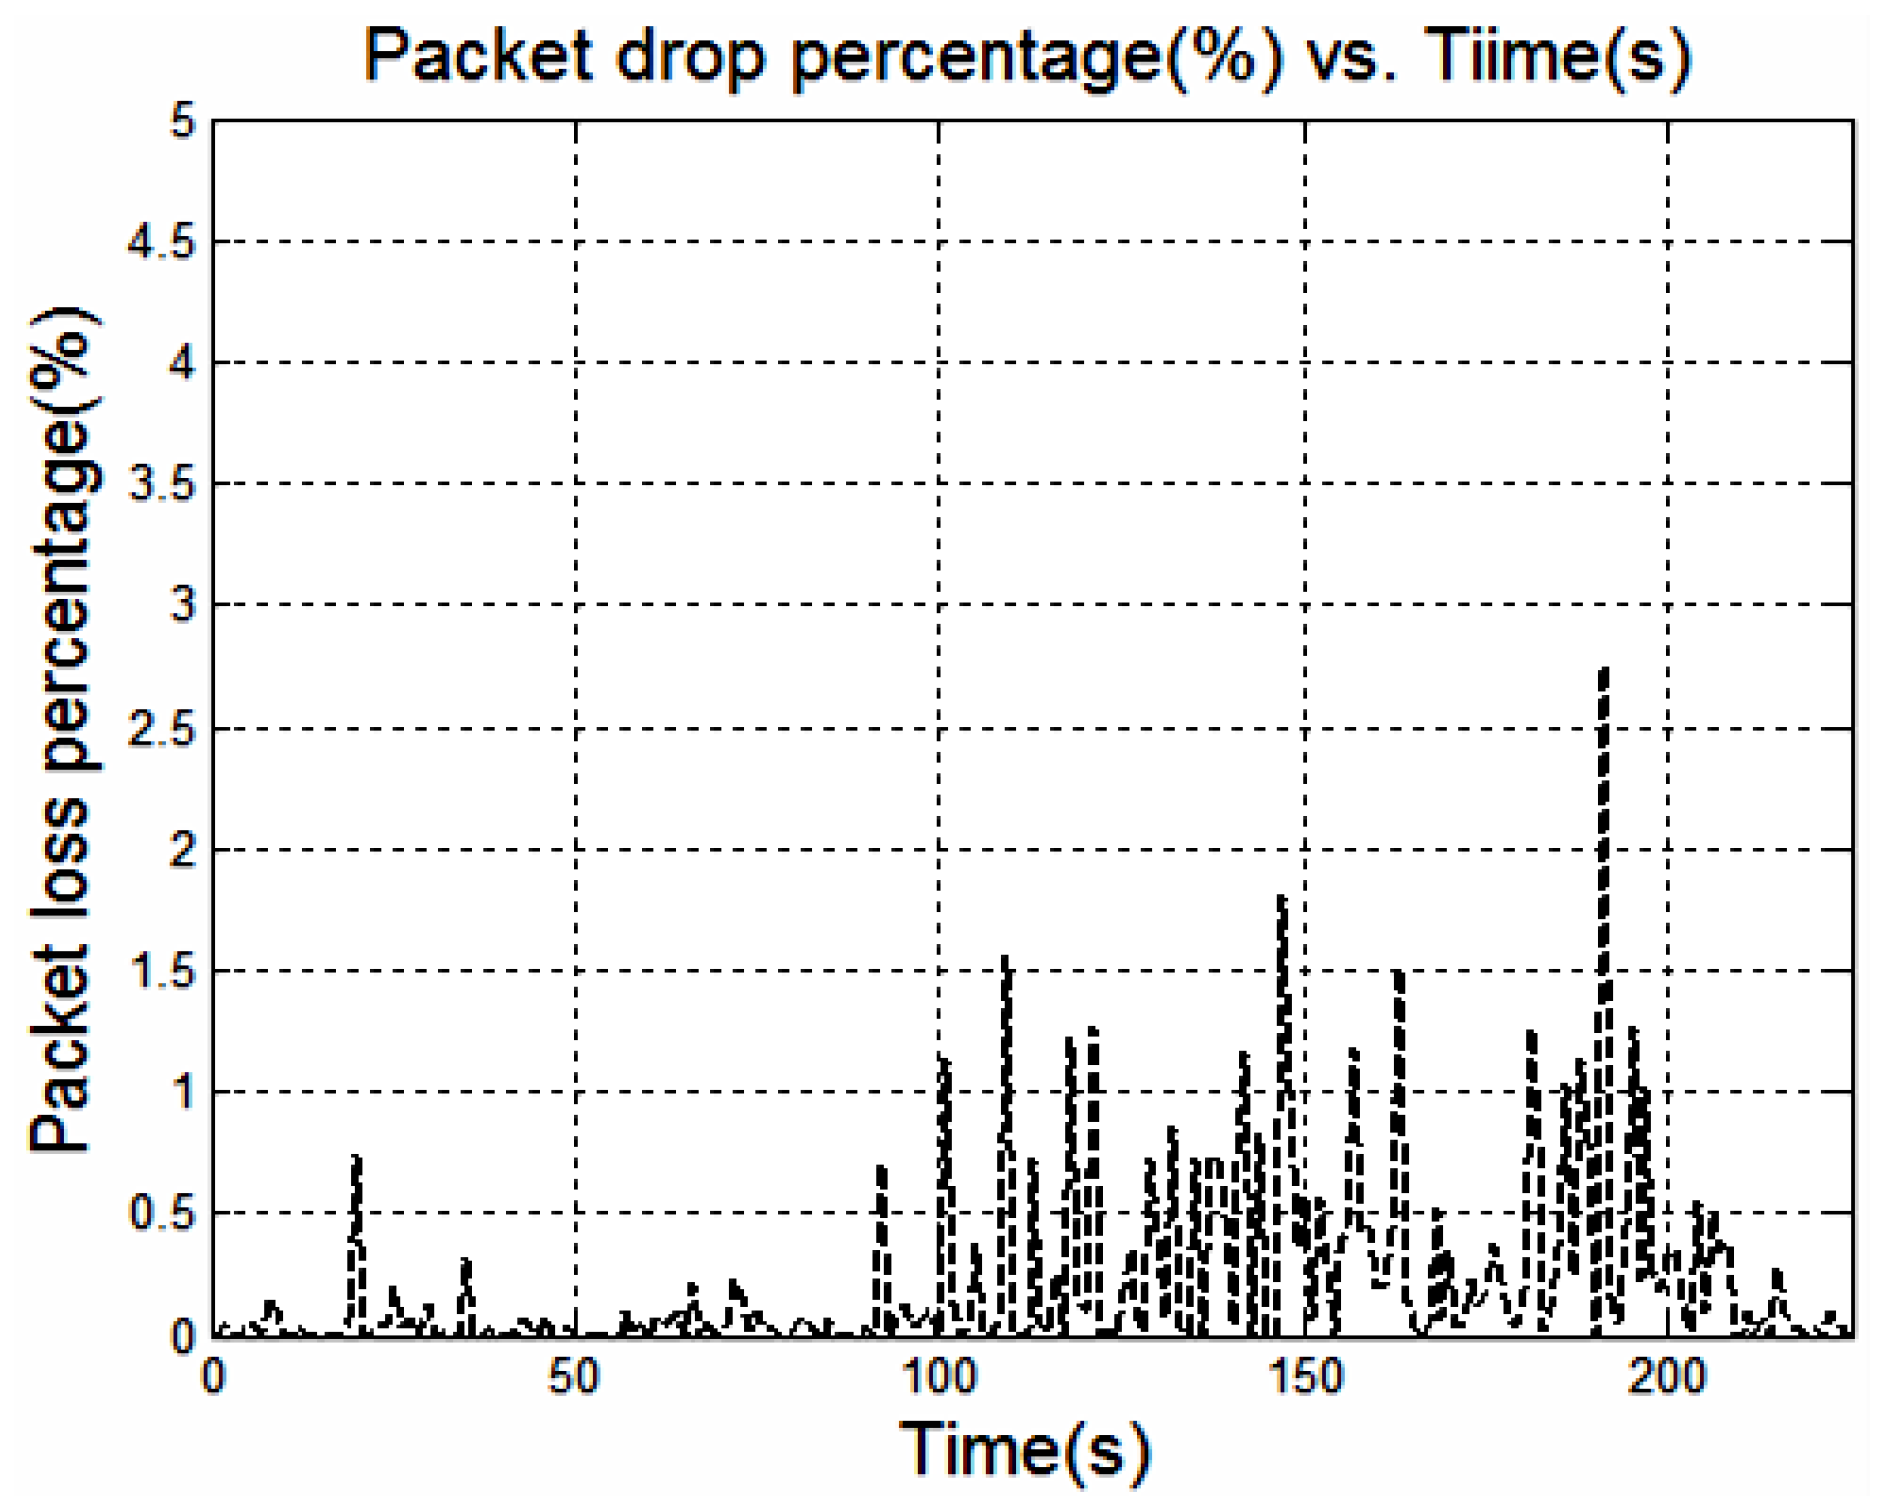
We used packet loss percentage to determine queue threshold and link utilization in order to set these values for link rate adaption. We first estimated the data rate at which the queue starts to overflow and results in 1% packet loss and observed the impact of data rate on average queue length and link utilization. We implemented fat-tree topology of DCN and considered data transmission within pod 1 where host 1 sends data to host 2. We performed queue analysis for this topology and observed the relationship between packet loss ratio and queue operation. We observed that for 0% packet loss, buffer utilization (buffer occupancy) is 0.56. Repeating these calculations, we generated a plot of packet loss percentage versus buffer utilization shown in
Figure 5. When data rate is around 550 Mbps, the queue threshold increases to 0.8 and packet loss percentage becomes approximately equal to 1%.
We also observed the network and link characteristics for inter-pod traffic. We observed that when link utilization is 55%, packet loss is 1%. From queue analysis and link utilization analysis we deduce that when packet loss percentage is above 1%, link utilization threshold and queue length reaches threshold and we must turn on extra switches or increase links capacity.
Figure 6 shows the packet loss percentage vs. time which shows a continuous increase in packet loss percentage.
The simulation parameters for Mininet simulations are given in
Table 6.
5.2. Power Consumption
We evaluate Adaptive TrimTree against ElasticTree protocol in terms of power consumption in order to observe power saving when Adaptive TrimTree is used. We generate three different DCN traffic patterns and observe power consumption versus time. We consider: (1) within-rack; (2) mixed 50% within-rack and 50% out-of-rack and (3) more out-of-rack (25% within-rack and 75% out-of-rack) traffic patterns and call these traffic pattern-I, traffic pattern-II and traffic pattern-III. The traffic patterns vary for different DCN applications and mixed pattern is more realistic, we consider extreme cases in order to better understand the impact of our proposed scheme. The results are shown in
Figure 7. For traffic pattern-I, the maximum data rate peak is around 550 Mbps. For Traffic pattern-II, the data rate is mostly between 500 Mbps and 1 Gbps. The average traffic data rate peak is mostly around 1Gbps for traffic pattern III.
Figure 7a shows power consumption in Adaptive TrimTree and ElasticTree for traffic pattern I,
Figure 7b shows power consumption in Adaptive TrimTree and ElasticTree for traffic pattern II,
Figure 7c shows power consumption in Adaptive TrimTree and ElasticTree for traffic pattern III and
Figure 7d shows the average power consumption in Adaptive TrimTree and ElasticTree.
5.3. Packet Loss Percentage
Next we evaluate Adaptive TrimTree against the ElasticTree protocol in terms of packet loss percentage in order to observe the impact of using Adaptive TrimTree on packet losses. We generate the three different DCN traffic patterns as mentioned in
Section 5.2 and observe packet loss percentages in Adaptive TrimTree and ElasticTree. The results are shown in
Figure 8.
Figure 8a shows packet loss percentages in both protocols for traffic pattern I,
Figure 8b shows packet loss percentages for traffic pattern II,
Figure 8c shows packet loss percentages for traffic pattern III and
Figure 8d shows the average packet loss percentage in Adaptive TrimTree and ElasticTree.
5.4. AverageDelay
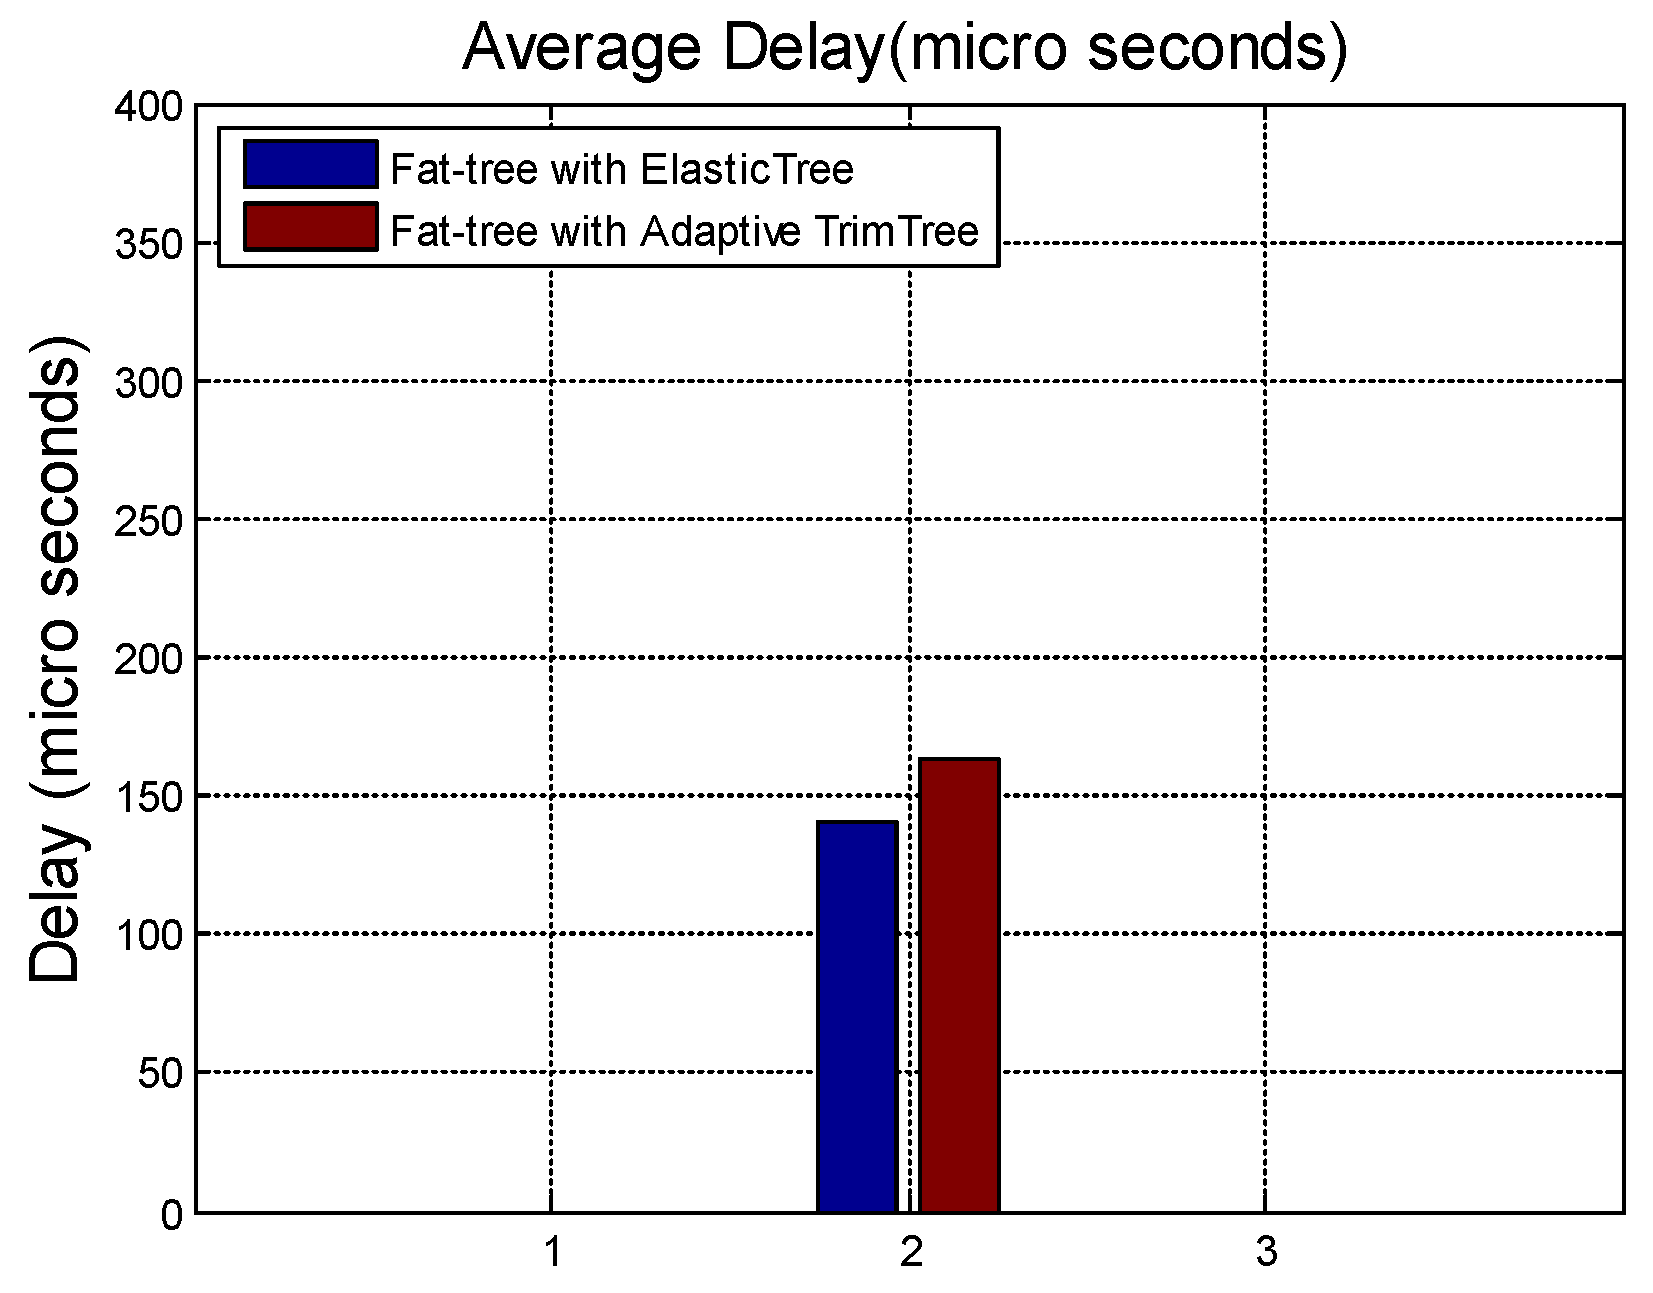
Figure 9 shows average delay comparison between Adaptive TrimTree and ElasticTree protocols.
6. Discussion
Our proposed mechanism Adaptive TrimTree is aimed at reducing power consumption in data center networks while keeping the associated costs acceptable. The results in
Figure 7 show power consumption reduction when Adaptive TrimTree is used as compared to ElasticTree [
11]. We observe that Adaptive TrimTree reduces power consumption by almost 20% as compared to the ElasticTree protocol. Generally in network energy consumption reduction schemes, there is a tradeoff between power-related metrics such as network power consumption, network energy efficiency, network power usage effectiveness, etc. and performance-related metrics such as network latency, bandwidth oversubscription ratio, network losses, average link utilization ratio, etc. and the goal of the designer is to keep this tradeoff acceptable [
32]. In the analysis of our proposed scheme, we selected power consumption as the power-related metric and link utilization, packet loss percentage and average delay as the performance-related metrics which affect network performance in terms of Quality of Service (QoS). We discussed link utilization in
Section 5.1 and observed that the link utilization is an indicator of the utilization of links which must not be under-utilized or over-utilized. For link utilization of 55%, packet loss percentage is 1% which if exceeded beyond this limit results in unacceptable losses due to queue buildup.
In order to observe the impact on packet loss percentage and delay, we carried out simulations and obtained results shown in
Figure 8 and
Figure 9.
Figure 8 shows that the average packet loss percentage is slightly higher in Adaptive TrimTree as compared to ElasticTree, however it is much less than 1%. This is due to the fact that when the packet loss exceeds a threshold, links are made to operate at their full rated capacity and if it still exceeds this limit, selective connectedness triggers passive switches to ON mode thus reducing loss at a cost of lower power reduction. We also observe that the nature of packet loss in Adaptive TrimTree is not bursty while burst losses are more common in ElasticTree. The impact of Adaptive TrimTree on network delay is observed in
Figure 9 which shows that there is a slight increase in delay which is almost negligibly higher than ElasticTree.
Overall our results show that at the cost of slightly higher packet loss percentage and delay, Adaptive TrimTree achieves significant power consumption improvements. The active and passive network subsets are computed after fixed time intervals which can be controlled. Based on QoS requirements for various applications, if traffic patterns are expected to vary too often, the network operator can minimize this time for minimizing the tradeoffs while saving power consumption. In order to study particular behavior of data center network applications, network profiling can be used. One such profiler is proposed and discussed in [
34] which assist operators and developers in diagnosing performance problems for different data center applications which are becoming complex and more distributed. This type of application profiler can be employed by the network operator in order to best adjust the tradeoffs between power reduction and QoS.
The results of our mathematical analysis show that the average power saved by Adaptive TrimTree as compared to ElasticTree is approximate 9%, while our simulation results are more promising and show an improvement of 19.6%. This is due to the fact that in our model, we assumed that around 25% of ports operate at reduced data rates of 100 Mbps while the remaining switches operate at the full data rate of 1 Gbps which can be termed as the worst case scenario because Mahadevan et al. [
9], based on 5-day measurements, report that 90% of links can be set at 10 or 100 Mbps and less than 5% of links need to be set at 1 Gbps. These settings would result in a much higher percentage of improvement. In our simulations, around 20% of the ports operate at 10 Mbps and around 20% at 100 Mbps which means that around 35%–40% ports operate in reduced data rates. This includes the impact of passive network components also which turn on only upon receiving the packets.
The strength of Adaptive TrimTree mechanism resides in the use of simple yet collective methods to minimize energy consumption without affecting overall network performance. The techniques based on a single methodology for example link rate adaption can be suitable for use in Ethernet [
15,
16,
17] however when used in data center networks, link rate adaption would give minimal energy saving because these networks are large in size and mostly provide resource redundancy which results in a large number of network devices consuming energy while in idle state. Similarly a resource consolidation technique based on multiple or complex heuristics would result in considerable energy saving, however it can suffer from a lack of responsiveness in cases of high traffic demand [
11]. The schemes developed for data center network energy saving are mostly based on a single energy saving technique, and we are not aware of a unified or holistic method especially developed for data center networks.
Adaptive TrimTree scheme is based on a novel concept of unified approach for energy conservation which serves as a foundation for further work in this direction. We plan to test it through testbed implementations. There are many areas for future research, the first and foremost being the implementation and testing of this scheme in a variety of sizes of data center networks. Subsequently a network profiler can be developed and/or implemented to fine tune tradeoffs based on diverse applications requirements. An interesting and important future direction is implementation and assessment of “coordinated sleeping” and “uncoordinated sleeping” schemes for power management of active and passive network subsets especially in subsequent management of passive network subset along with its coupling with routing.


