1. Introduction
1.1. Background and Necessity of the Study
Artificial ground coverage has increased with the expansion and densification of urban spaces by economic development, whereas the greenery coverage ratio has decreased. Because of this trend, climate change consequences occur in cities, such as heat island effects or heat waves during summer, aggravating the urban microclimate. Furthermore, the coverage of urban surfaces with asphalt or concrete according to urbanization may cause a feeling of unpleasantness and doesn’t have any benefit on the neighboring buildings, even indoors [
1]. The ever increasing number of high-rises and densification are likely to lead to an ignorance of the elements that must be considered in solar access design. Such issues result in further problems such as a violation of the right to sunlight or privacy invasion, which may decrease the quality of the dwelling environment [
2]. Apartment housing, in particular, is frequently exposed to designs insensitive to the problematic aspects mentioned above, resulting in many negative effects caused by the high population density and floor area ratio [
3].
To improve the urban microclimates and achieve a pleasant dwelling environments, the design process must consider both the daylight availability and the outdoor thermal environment. Therefore, a quantitative review and the establishment of a wide range of relevant basic data is required.
1.2. Literature Review
Studies of the outdoor thermal and daylight availability in the process of layout planning of the apartment housing are as follows.
In studying the outdoor thermal environment, Taleghani
et al. selected singular blocks E-W and N-S along with a country yard block as the study targets and analyzed the urban outdoor space using an ENVI-met simulation [
4]. Chen
et al. conducted a site investigation focusing on apartment complexes in Shenzhen city to create a pleasant and friendly environment. Architectural figures and layout planning that can help improve the outdoor thermal environment in apartment complexes were also suggested [
5]. Yang, Lau and Qian conducted a site investigation on outdoor spaces in three high-rise complexes in Shanghai, the aim of which was to improve the heat island phenomenon. The results of this study showed that the density and green space affects the Urban Heat Island (UHI)-night patterns differently, and that the UHI-day is closely linked to shading factors. This study further evaluated plants may also help to ease the heat island phenomenon by having a cooling effect [
6]. Yang, Lau and Qian also examined the effects of the urban design factors on heat island symptoms in a city during summer. Focusing on high-rises complexes in Shanghai, an investigation was conducted from mid-July to mid-August with design parameters including the building layout and greenery. The design parameters were shown to have relevance with the heat island effect; the shadows of the buildings and plant canopies were both found to affect the UHI-day. The study further showed that anthropogenic heat, greenery density and coverage influence UHI-night [
7]. Jeong and Yoon selected typical apartment house complexes as a study model and estimated the thermal comfort and the possibility of heat islands in a city. Architectural figures, layout planning and exterior materials were evaluated quantitatively through an analysis of their effect on the outdoor thermal environment at the city level [
1].
Several studies have examined the daylight availability. Kim and Yang studied the effects that changes in the planning criteria of apartment housing have on the access of the apartment unit as well as that of the outdoor environment [
8]. Lee
et al. investigated various layout planning methods, considering shading characteristics, by taking into account the various apartment types as well as the planning elements of the district unit plan and their application possibility [
9]. Park and Kang analyzed the daylight availability status of green building certified apartments [
10]. Kim and Kim classified the types of apartment layouts and conducted a daylight availability evaluation [
11]. Hwang and Lee analyzed the daylight availability focusing on tower type apartment house complexes [
12].
These studies evaluated the daylight availability by assessing apartment houses that apply building code standards. Most studies deduced the directions for design by actual measurements and simulations with the aim to reduce the heat island effect. On the other hand, because these studies are limited by conducting a single analysis of the outdoor thermal environment or daylight availability, the results of these studies can barely be used as quantitative basic data in designing apartment complexes that satisfy the conditions for both the light environment and thermal environment.
For these reasons, this study selected a layout design factor that affects the outdoor thermal environment and daylight availability in apartment complex planning factors. After this, a quantitative research by case study was conducted; numerical simulations were performed to determine the effect of this layout design factor on the outdoor thermal environment and solar accessibility. Through a Design of Experiments (DOE) method, this study attempted to find out the optimal integrated layout plan considering both the outdoor thermal environment and solar accessibility in the schematic design phase of the apartment houses.
1.3. The Method and Purpose of the Study
In this study, the design factors of apartment housing layout planning were selected by studying the building regulations, the urban planning regulations of the City of Seoul, South Korea, and a literature review. After this, valid cases which affect the outdoor thermal environment and solar accessibility were derived using an orthogonal array of the DOE. Through DOE analysis and estimations, an optimal layout planning of an apartment house complex that can be used as basic data in planning apartment house complexes was deduced.
2. Outline of the Numerical Simulation
2.1. Daylight Availability Simulation
For the daylight availability simulation a three dimensional solar accessibility analysis program, Sanalyst Version 3.0 (SysDev, Seoul, Republic of Korea), was used. The basic sunshine duration calculation algorithm of Sanalyst is the same as that of Radiance or Diva for Rhino [
13,
14,
15,
16,
17]. To run Sanalyst, the analysis factors, including the building and ground were used as geometrical forms. Based on the true solar time, this program offers a range of functions to analyze aspects such as a three dimensional shadow analysis, or a general daylight availability analysis to evaluate the points of each apartment unit. The outputs were in DXF (Drawing Exchange Format) file format, showing input and output features.
2.2. Thermal Environment Simulation
Thermorender Ver 5.0 was used for the outdoor thermal simulation, This program is an application tool based on the 3D-CAD program; a three dimensional numerical simulation of the entire surface temperature is possible, which can then be used to analyze the outdoor and indoor thermal environment as well as calculate the heat load from a single house to city level. This package represents the detailed architecture designs and generates a three dimensional distribution of the entire surface of the building through a calculation of the heat balance.
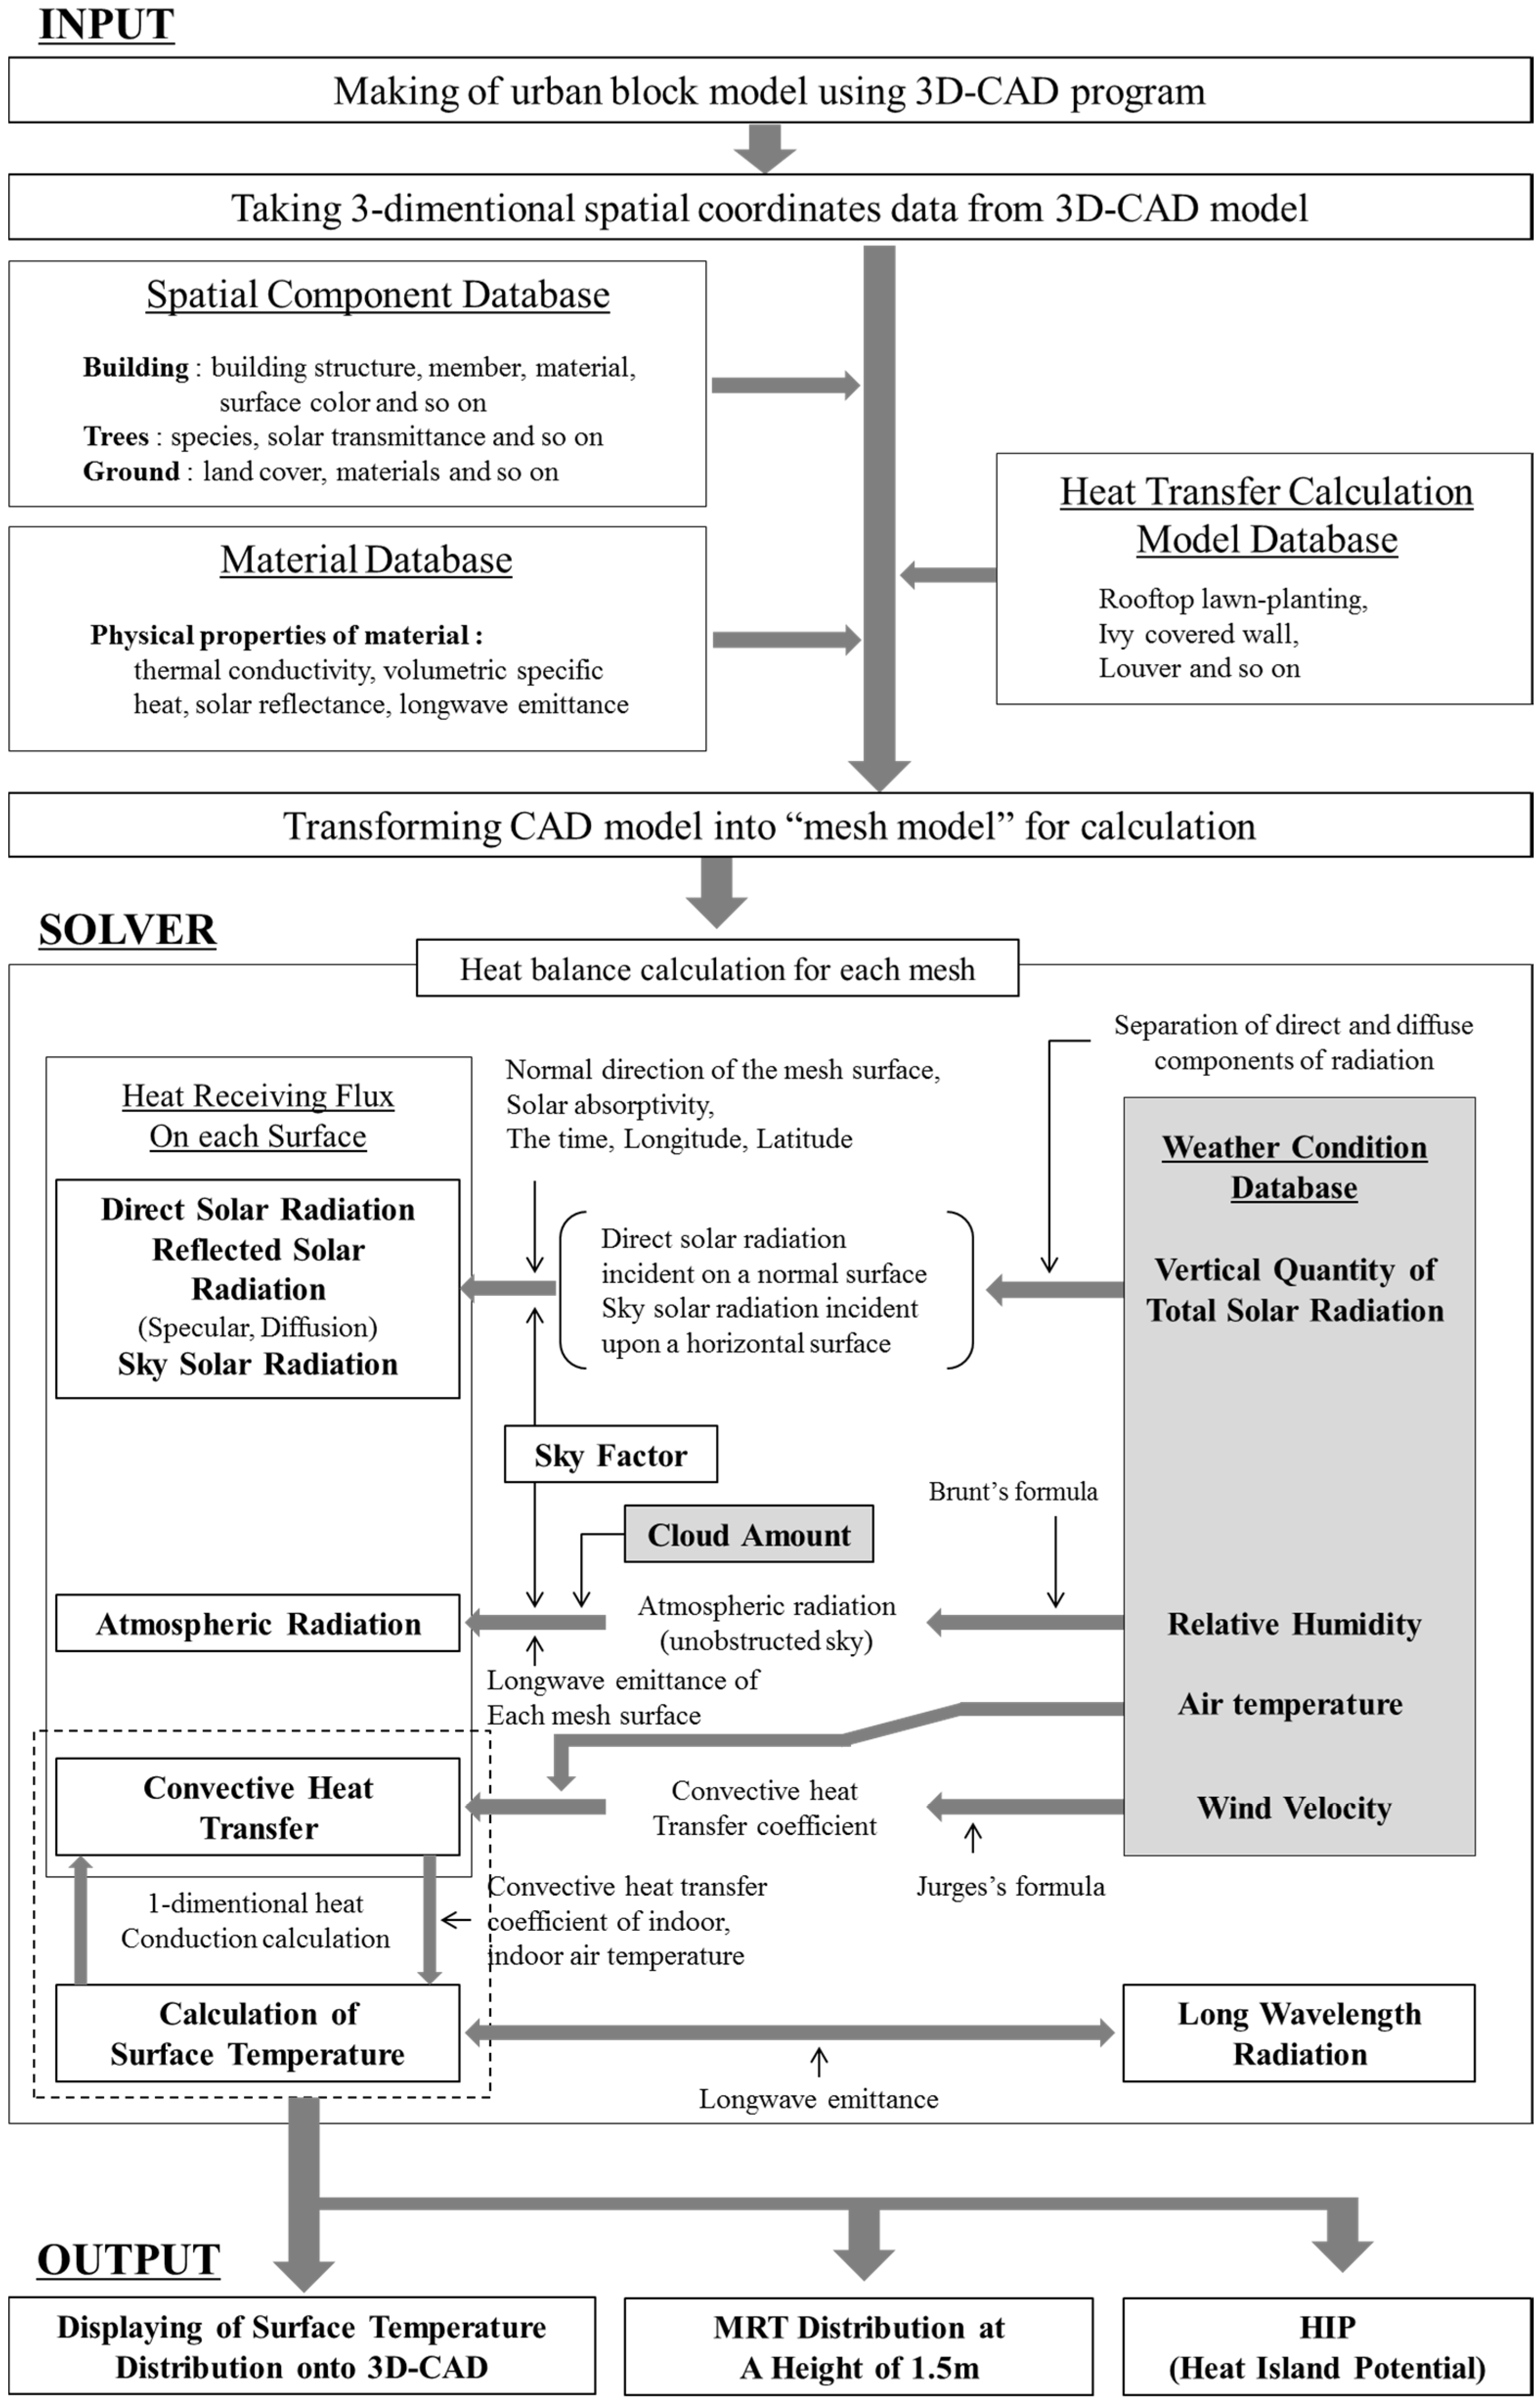
Figure 1 shows the numerical simulation process [
18]. In the input process, 3D-CAD was used; at the generating stage, a city block, database of space constitution, materials, and heat transfer calculation model were input. The mesh data was set, and the heat balance calculation process is then conducted for each mesh. The results can show a three dimensional distribution of the entire surface temperature according to a time period of 24 h. Based on this, the Mean Radiant Temperature (MRT) distribution at 1.5 m from the ground can be drawn out as the thermal comfort index of a building. Through this, the temperature distribution of, e.g., ground surface or a human body at a certain height, can be shown according to necessity. MRT (Mean Radiant Temperature) is the omni-directional average temperature accounting for the effect of thermal radiation on a building and exterior space:
MRT: Mean Radiant Temperature (°C)
Fi: Form factor of a very small surface
N: Total number of a very small surface
Tsi: The surface temperature of a very small surface
Daily changes in (Heat Island Potential) HIP (range of 0 to 23 h), an index used to evaluate the heat island potential at a city level, can also be shown. HIP (Heat Island Potential) represents the air temperature indicated by the sensible heat load of the atmosphere over the whole surface of a city block. It is the mean surface temperature of the load shown quantitatively, taking into account the effect of the ruggedness of buildings and city blocks.
HIP: Heat Island Potential (°C)
A: Area of the site plan (m2)
S: Area (m2)
Thermorender is the program developed to compare the effects of architectural planning factors on each other in terms of the thermal radiation environment. Thermorender is characterized by its accurate calculation of 3D surface temperature, assuming that the temperature of object space is a fixed value. As to its significance and methodology, this has already been established in several papers published in international journals [
1,
18,
19,
20,
21,
22].
Figure 1.
Numerical simulation process.
Figure 1.
Numerical simulation process.
2.3. Selecting a Model
Table 1 lists the conditions of the study site and type of the housing block. The site area was 265 m × 170 m, and the blocks were laid out as parallel. In the case of apartments in Korea located in the temperate climatic zone, the most universally used planning form is rectangular, as this provides households with good daylight availability and accessibility. This study established a rectangular residential building form, with this being environmentally advantageous in the temperate climatic zone. The size of each unit was set to 85 m
2 or less according to the size of the national house. The height of the story was equal to 2.9 m.
Table 1.
Site arrangement condition and housing block type condition.
Table 1.
Site arrangement condition and housing block type condition.
| | Basic Conditions | Content |
|---|
| Site | Site size | 265 m × 170 m (Length to width ratio 1:1.6) |
| Arrangement type | Parallel arrangement |
| Spacing between the side walls of neighboring blocks | 6.0 m |
| Housing Block Type | Type | Flat-type apartment |
| Size | 85 m2 or less area of exclusive use space per unit |
| Floor-ceiling height | 2.9 m |
2.4. Simulation Boundary Conditions
The Korean study area is located in East Asia, within the latter climate zone. In such area, daylight availability needs to be taken into account as the elevation angle of the sun is low in winter; the outdoor thermal environment also needs to be taken into account due to high temperatures and significant insolation in summer. For this reason, in this study, we selected days with the lowest daylight availability and outdoor thermal environment conditions as evaluation days for simulation.
The location for the simulation was set in Seoul, South Korea; latitude 37°33′59″, and longitude 126°58′40″. The evaluation day for the outdoor thermal environment was set as 5 August, a representative day when temperature and insolation reach their maximum values.
To evaluate the outdoor thermal environment, a three dimensional, all surface temperature simulation was conducted. To evaluate the thermal environment in summer where radiant environment is dominant, MRT (Mean Radiant Temperature) and HIP (Heat Island Potential) were utilized as evaluation indicators in this study. MRT and HIP are indicators calculated from the 3D surface temperature distribution of object space. The formation of 3D surface temperature distribution and of the radiant thermal environment is determined by the shape and layout of buildings and by material composition, with these being the most important variables of architectural plans [
18,
19,
20,
21,
22].
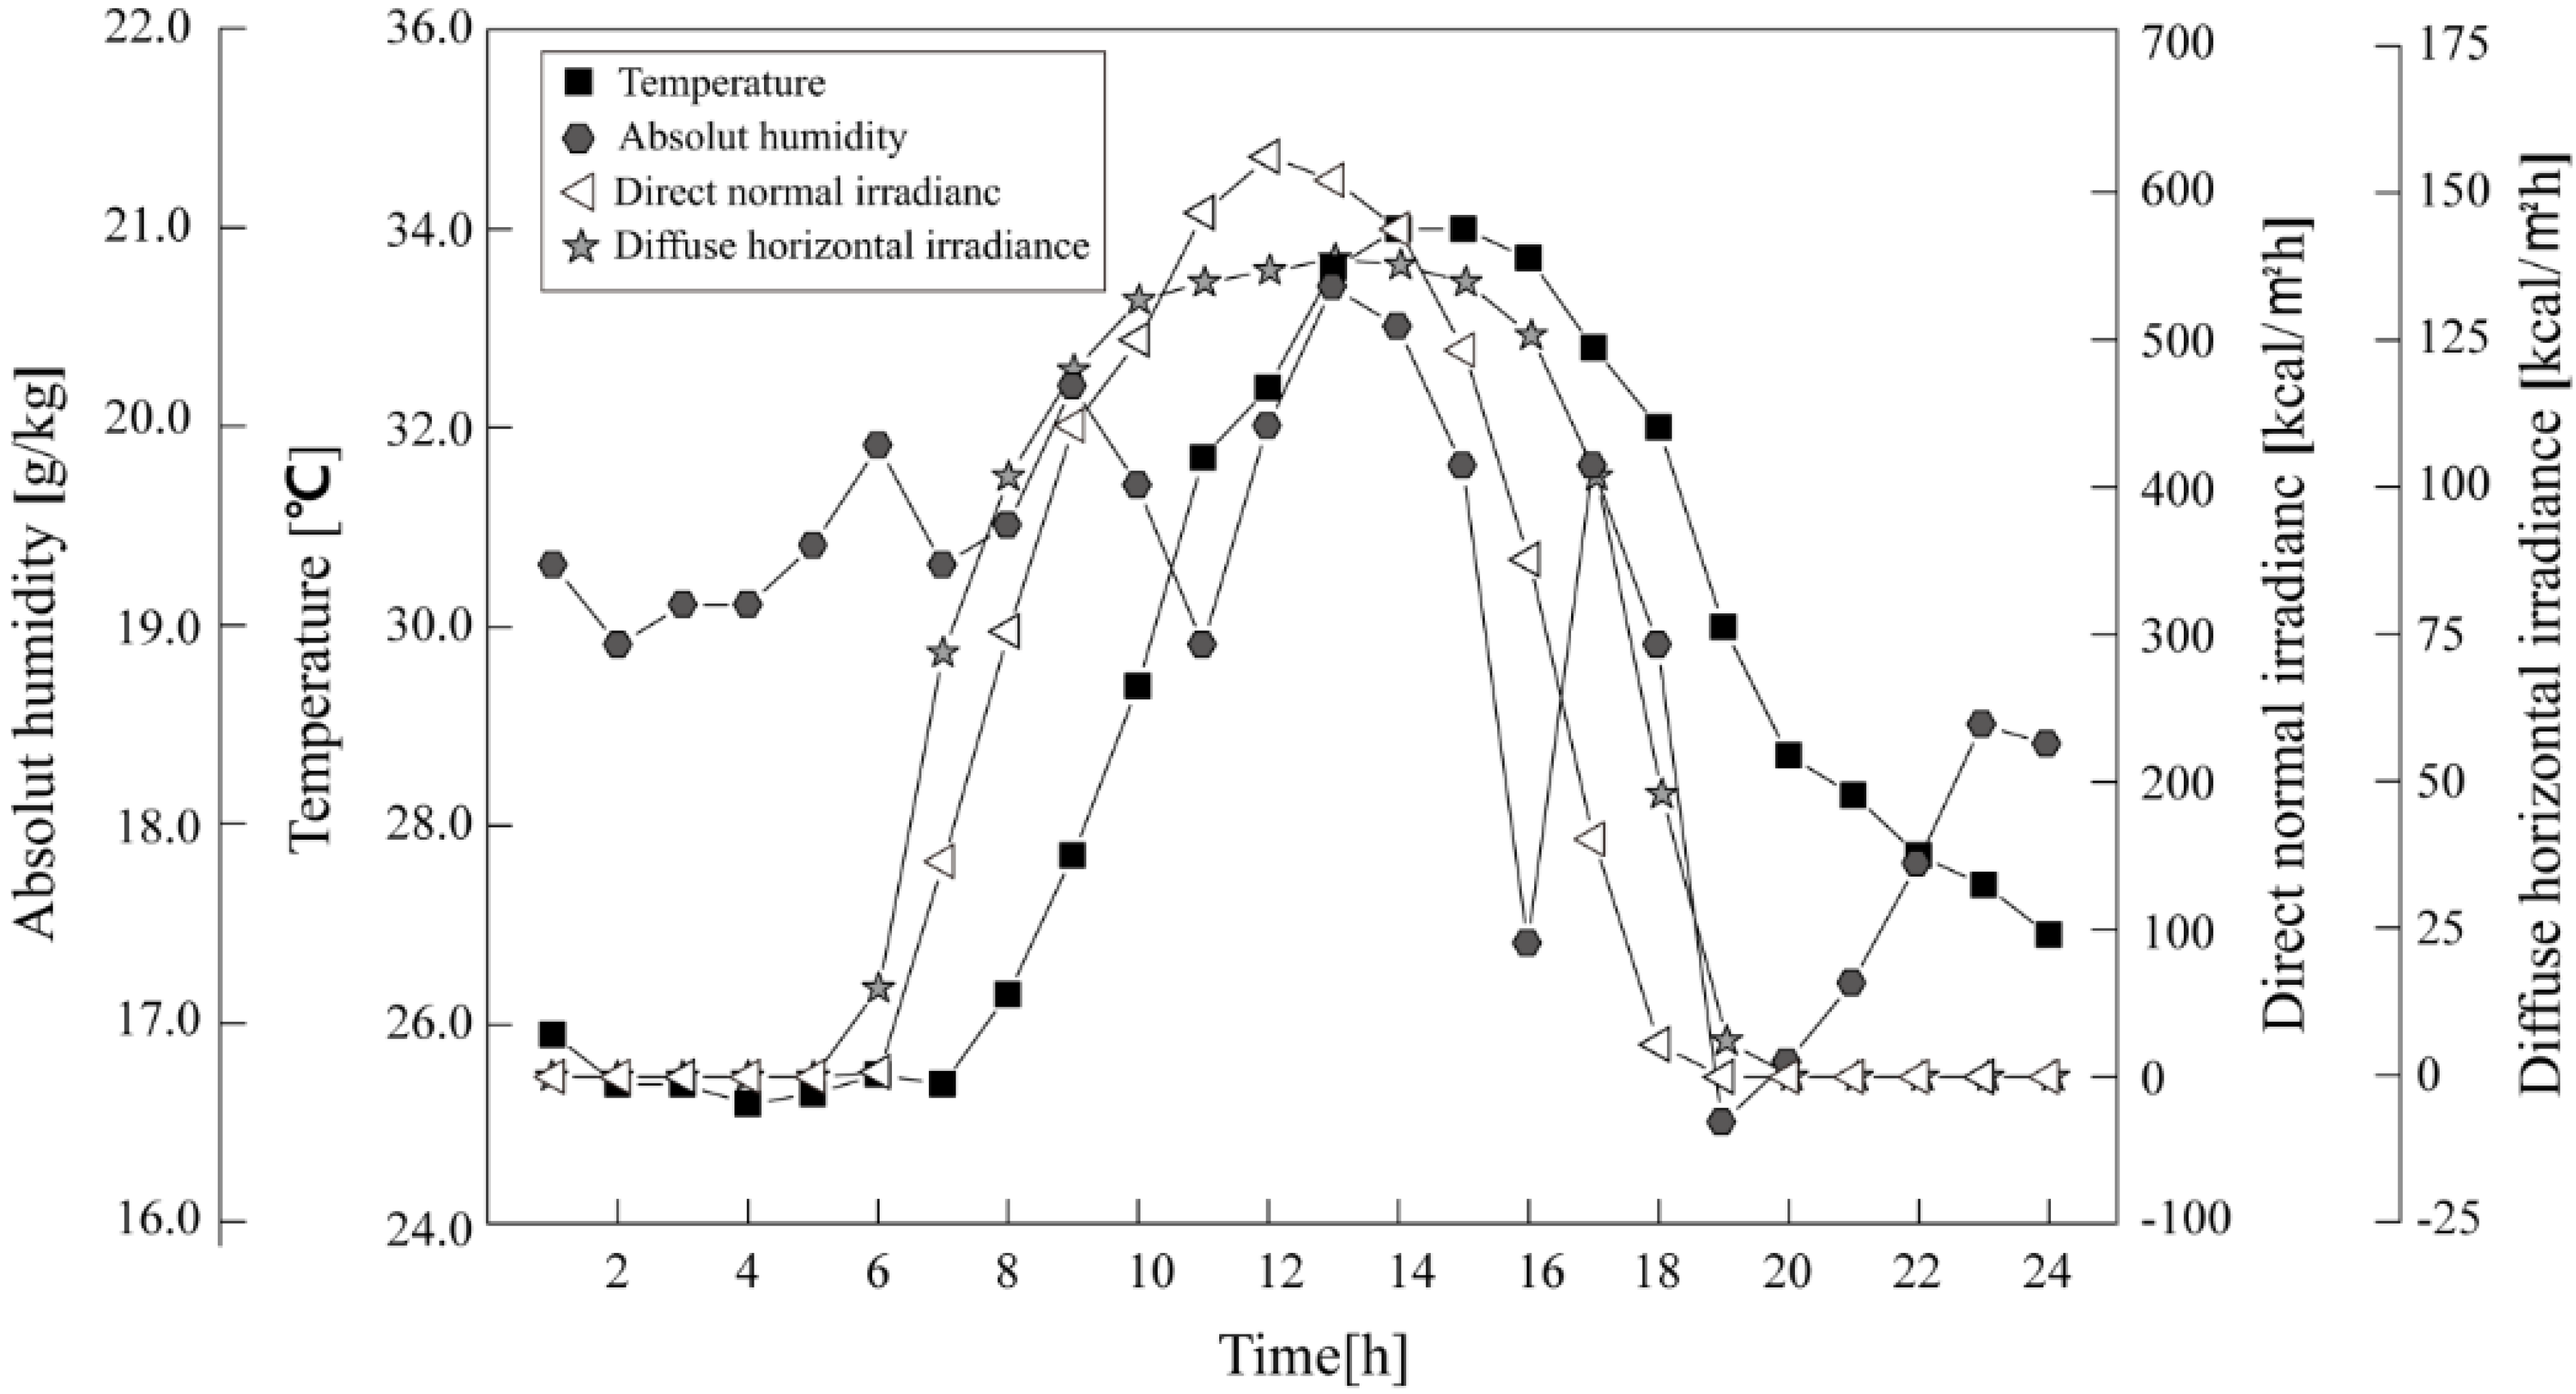
The Seoul standard meteorological data (air temperature for 24 h, absolute humidity, direct normal irradiance, diffuse horizontal irradiance, radiation quantity at night, wind direction, and wind speed) was used for the simulation (
Figure 2).
The evaluation day for daylight availability was set as 21 December, which is when the elevation angle of the sun is at its lowest; time was based on true solar time. In South Korea, sunlight endurance is given a minimum threshold by a building regulation. The regulation requires that on 21 December, which is the day when the sun’s altitude is at its lowest, sunlight must be secured for a total of 4 h between 08:00 and 16:00 or for two continuous hours between 09:00 and 15:00. In this study, we evaluated the sunlight environment based on this limit of endurance [
23].
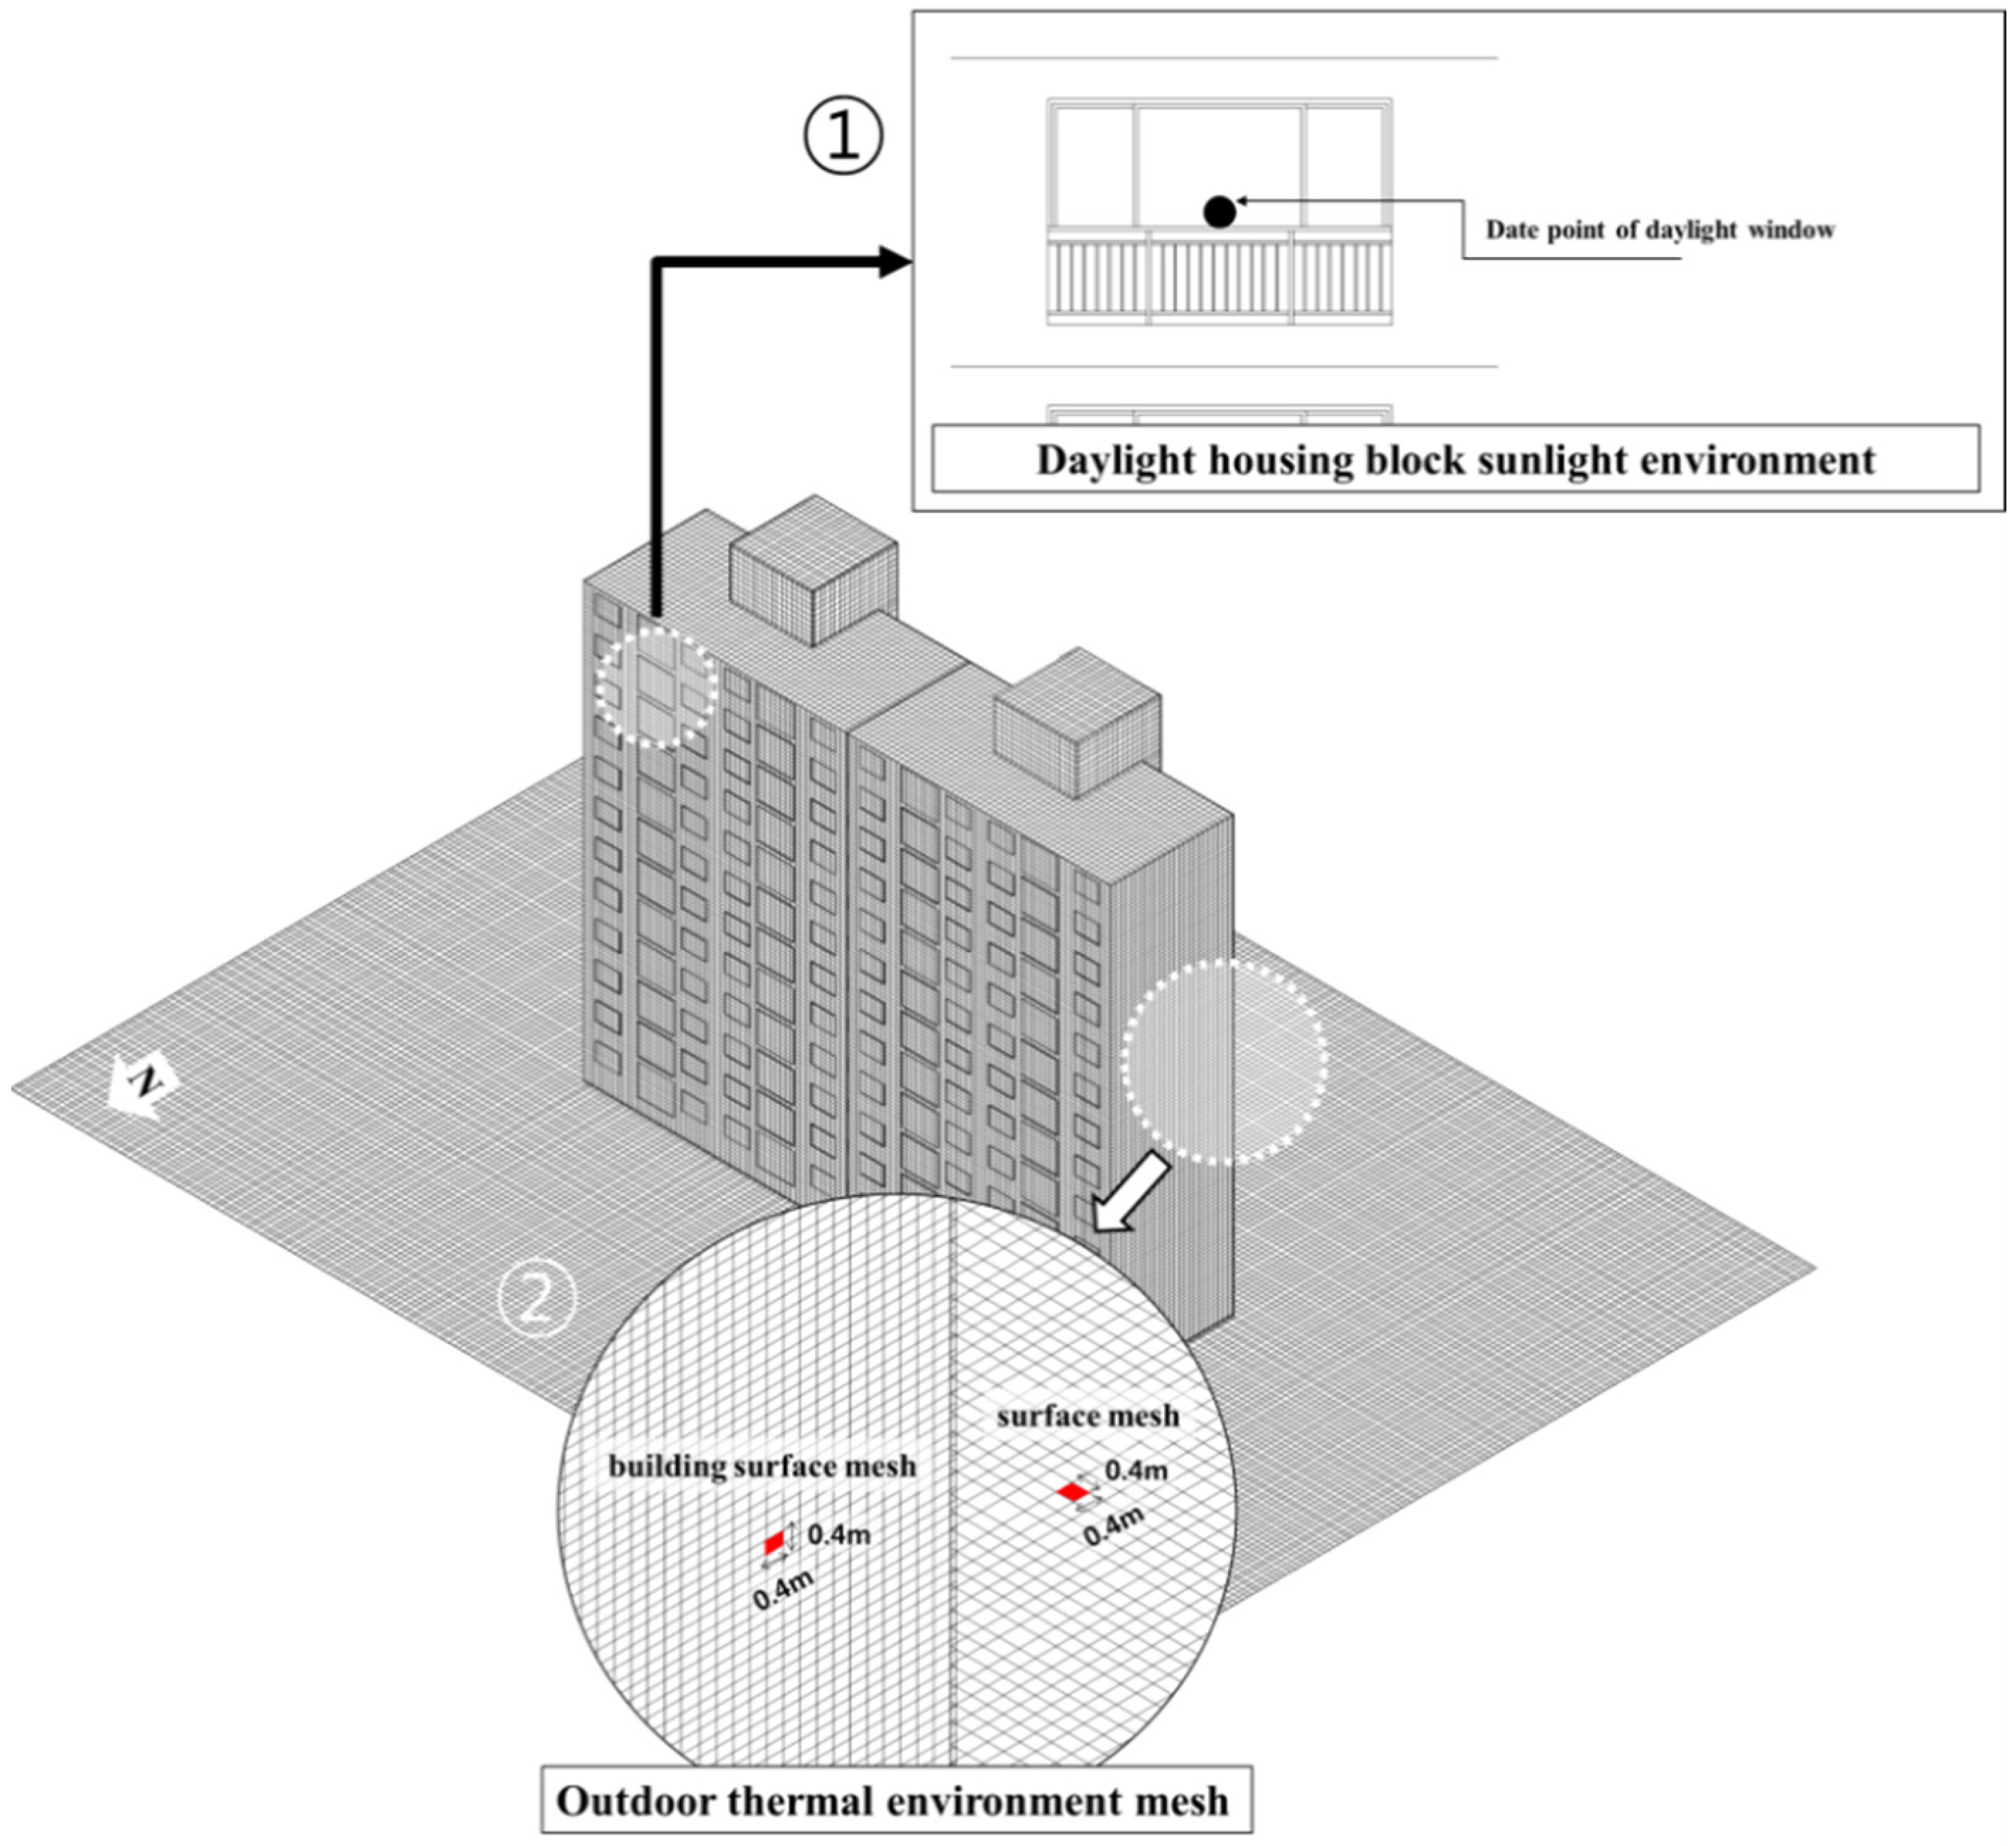
Figure 3① shows the measurement points on daylight of the apartment housing for the daylight availability analysis.
Figure 3② shows the mesh division for simulation of the three dimensional entire surface temperature. A 0.4 m three dimensional uniform mesh was used to analyze the influence of architectural materials of the ground surface and apartment building on the outdoor thermal environment.
Table 2 lists the properties of the materials from which the housing block was composed. The indoor temperature was set to 26 °C.
Figure 2.
Weather conditions for outdoor thermal environment simulation.
Figure 2.
Weather conditions for outdoor thermal environment simulation.
Figure 3.
Simulation conditions.
Figure 3.
Simulation conditions.
Table 2.
Properties of the materials of which the housing block was composed.
Table 2.
Properties of the materials of which the housing block was composed.
| Material Name | Solar Reflectance | Long Wave Emissivity | Solar Transmittance | Thermal Conductivity (W/m·K) | Volumetric Specific Heat (J/m3·K) |
|---|
| Diffuse | Specular |
|---|
| Concrete | 0.2 | 0.0 | 0.90 | 0.0 | 1.600 | 1,896,000 |
| Press concrete | 0.2 | 0.0 | 0.90 | 0.0 | 1.600 | 1,896,000 |
| Mortar | 0.0 | 0.0 | 0.95 | 0.0 | 1.500 | 1,600,000 |
| Waterproof mortar | 0.0 | 0.0 | 0.95 | 0.0 | 1.500 | 1,600,000 |
| Gypsum board | 0.0 | 0.0 | 0.95 | 0.0 | 0.220 | 904,000 |
| Type 2 extruded polystyrene foam insulation | 0.0 | 0.0 | 0.95 | 0.0 | 0.034 | 25,000 |
| 6 mm thick glass | 0.0 | 0.072 | 0.094 | 0.802 | 1.000 | 1,913,862 |
| Soil Surface | 0.2 | 0.0 | 0.90 | 0.0 | 0.500 | 1,600,000 |
3. Design of Experiments (DOE) Case Settings
3.1. The Summary of the DOE
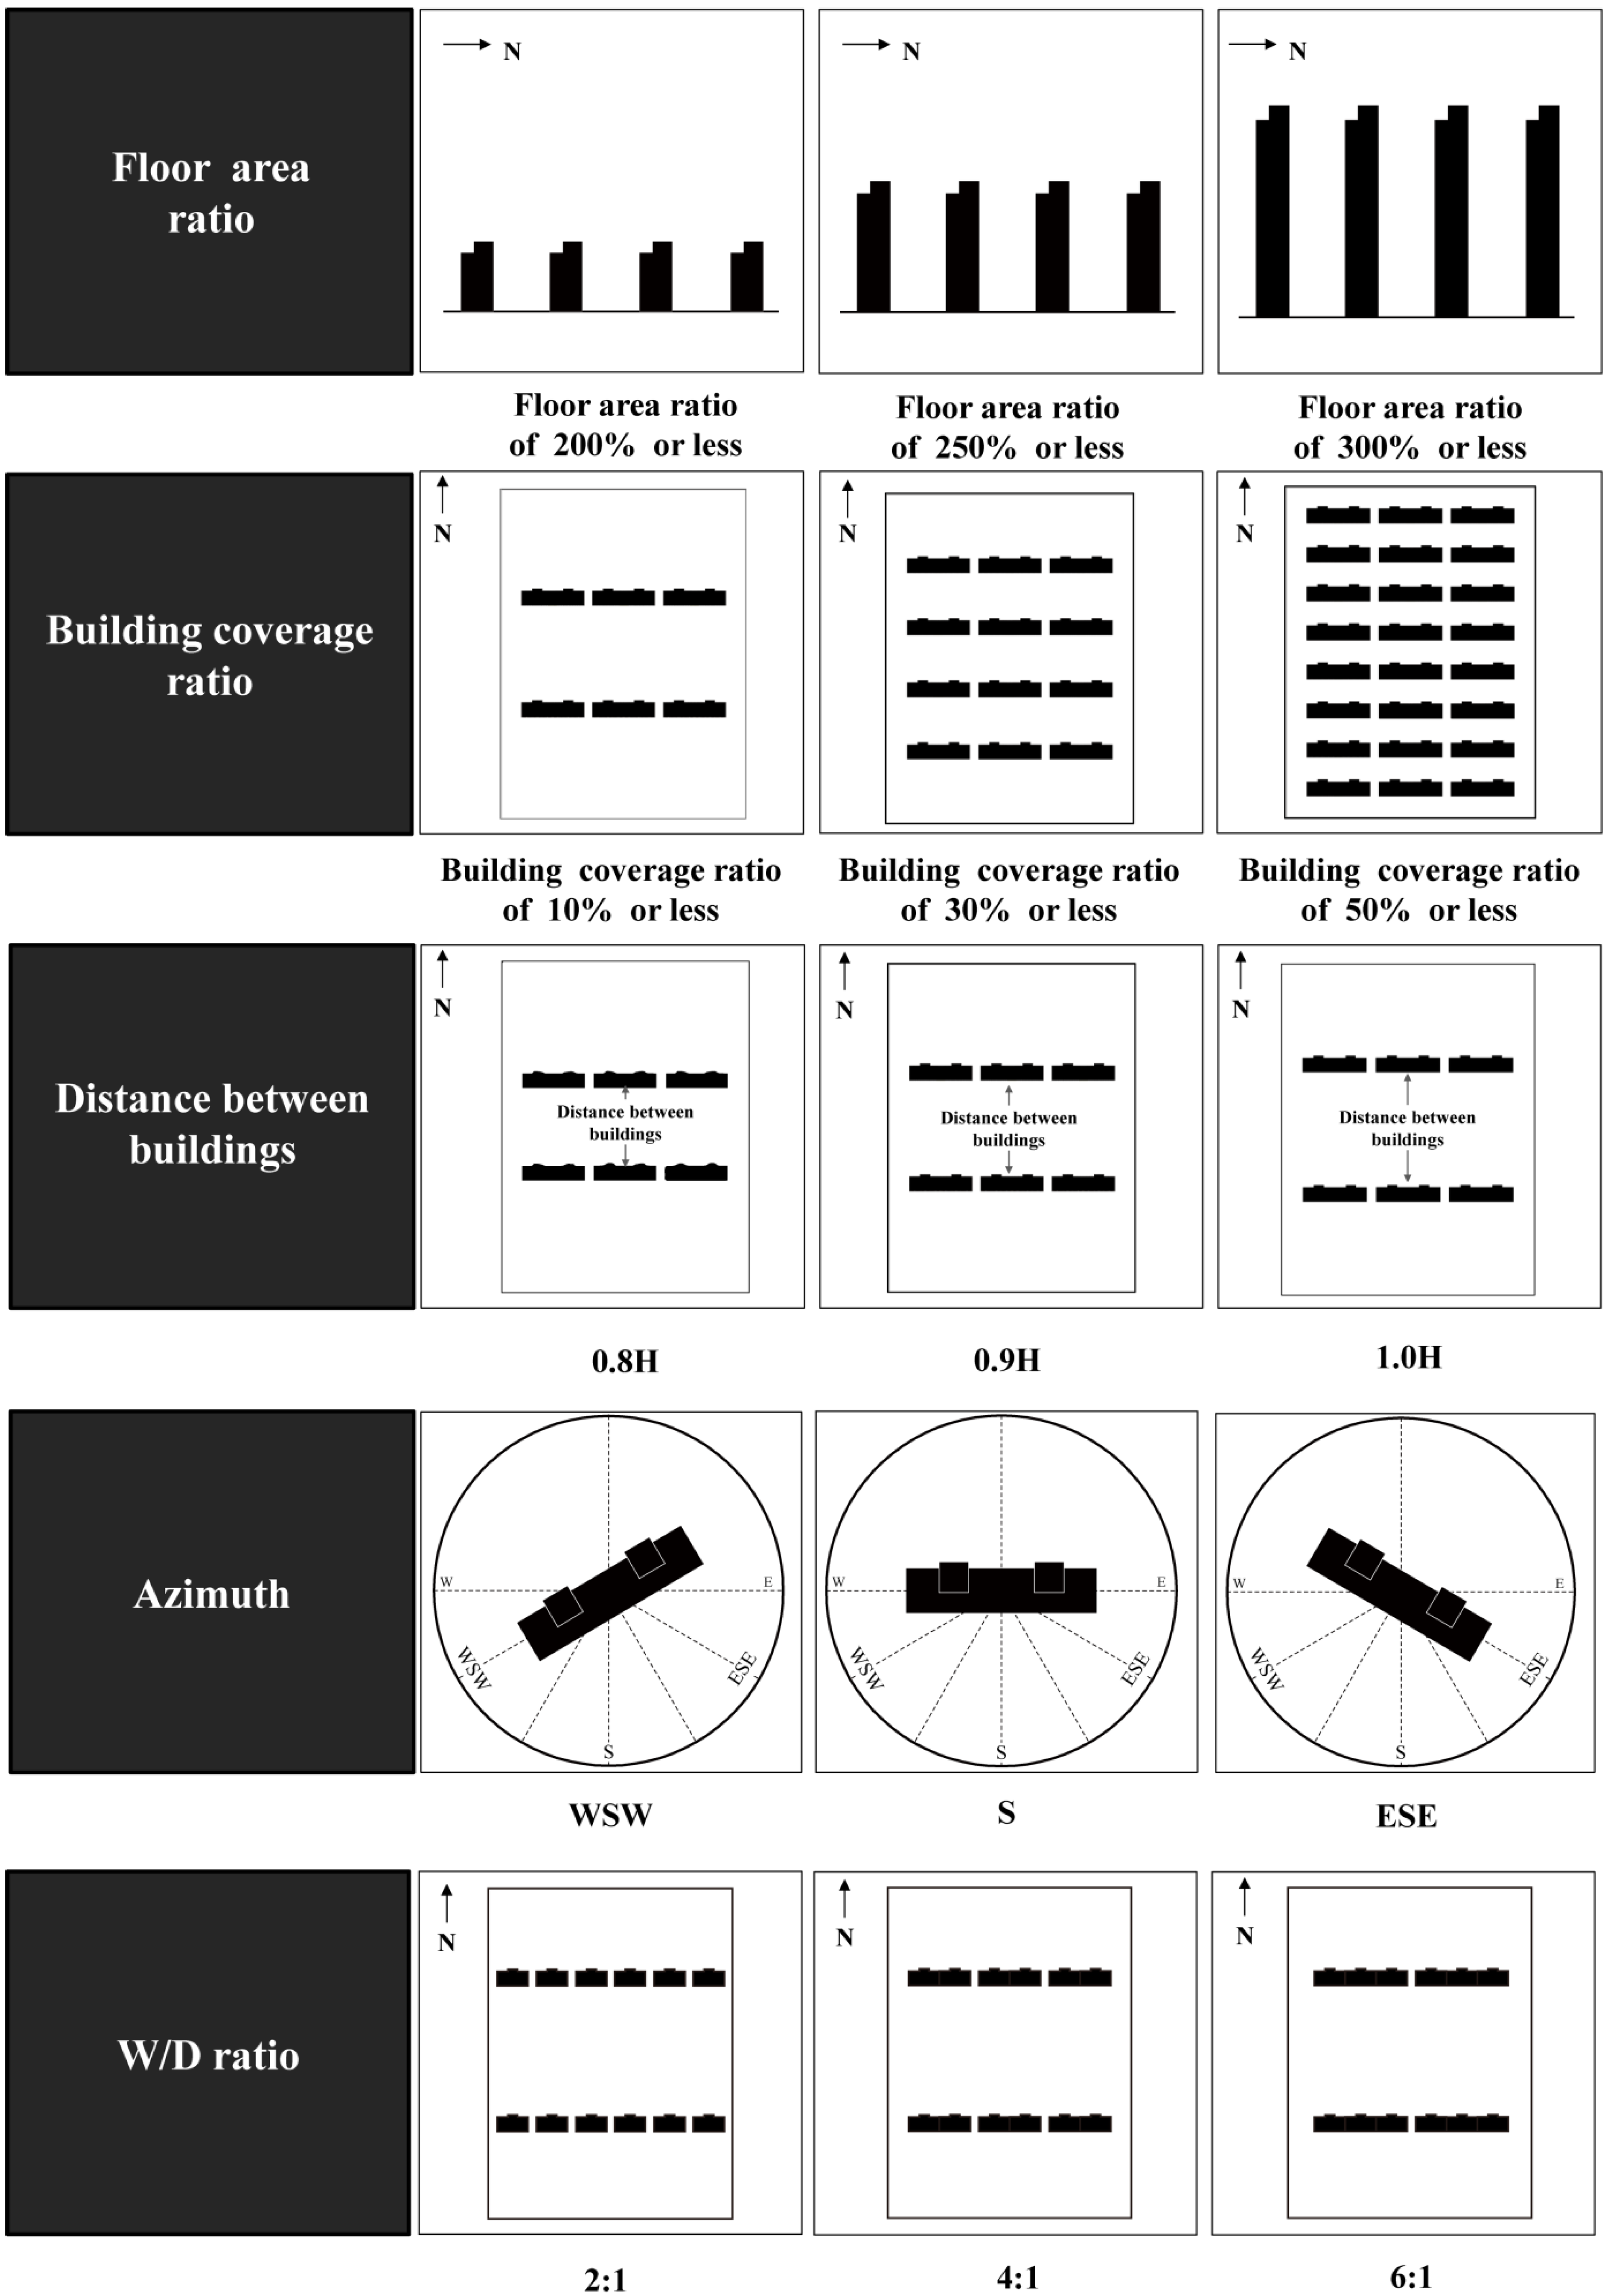
To analyze the design factors of the apartment housing, the floor area ratio, building coverage ratio, distance between buildings, azimuth, and w/d ratio were selected as the main factors. Whereas the season, region, site area, and the architectural materials of the building surface were set as fixed values (
Table 3).
Numerical simulations of a total of 243 cases were required. This study used an orthogonal design of experiments (DOE) array was performed to analyze data to obtain a statistically significant result.
Table 3.
Design parameters and level.
Table 3.
Design parameters and level.
| Design Parameters | Level |
|---|
| 0 | 1 | 2 |
|---|
| A | Floor Area Ratio | 200% or less | 250% or less | 300% or less |
| B | Building Coverage Ratio | 10% or less | 30% or less | 50% or less |
| C | Distance Between Buildings | 0.8 H | 0.9 H | 1.0 H |
| D | Azimuth | WSW | S | ESE |
| E | w/d ratio | 2:1 | 4:1 | 6:1 |
3.2. DOE Case Settings
Table 3 and
Figure 4 show the design factors of apartment housing layout planning; there were four in total. As the main factors related to the architectural density, the floor area ratio (A) and building coverage ratio (B) were selected. As factors regarding the layout of the apartment buildings, the distance between buildings (C) and azimuth (D) were chosen. Finally as a factor relevant to the architecture figure, the w/d ratio (E) was selected. The distance between buildings (C), azimuth (D) the w/d ratio (E) were selected based on Building Regulations Article 86 [
23] and a literature review.
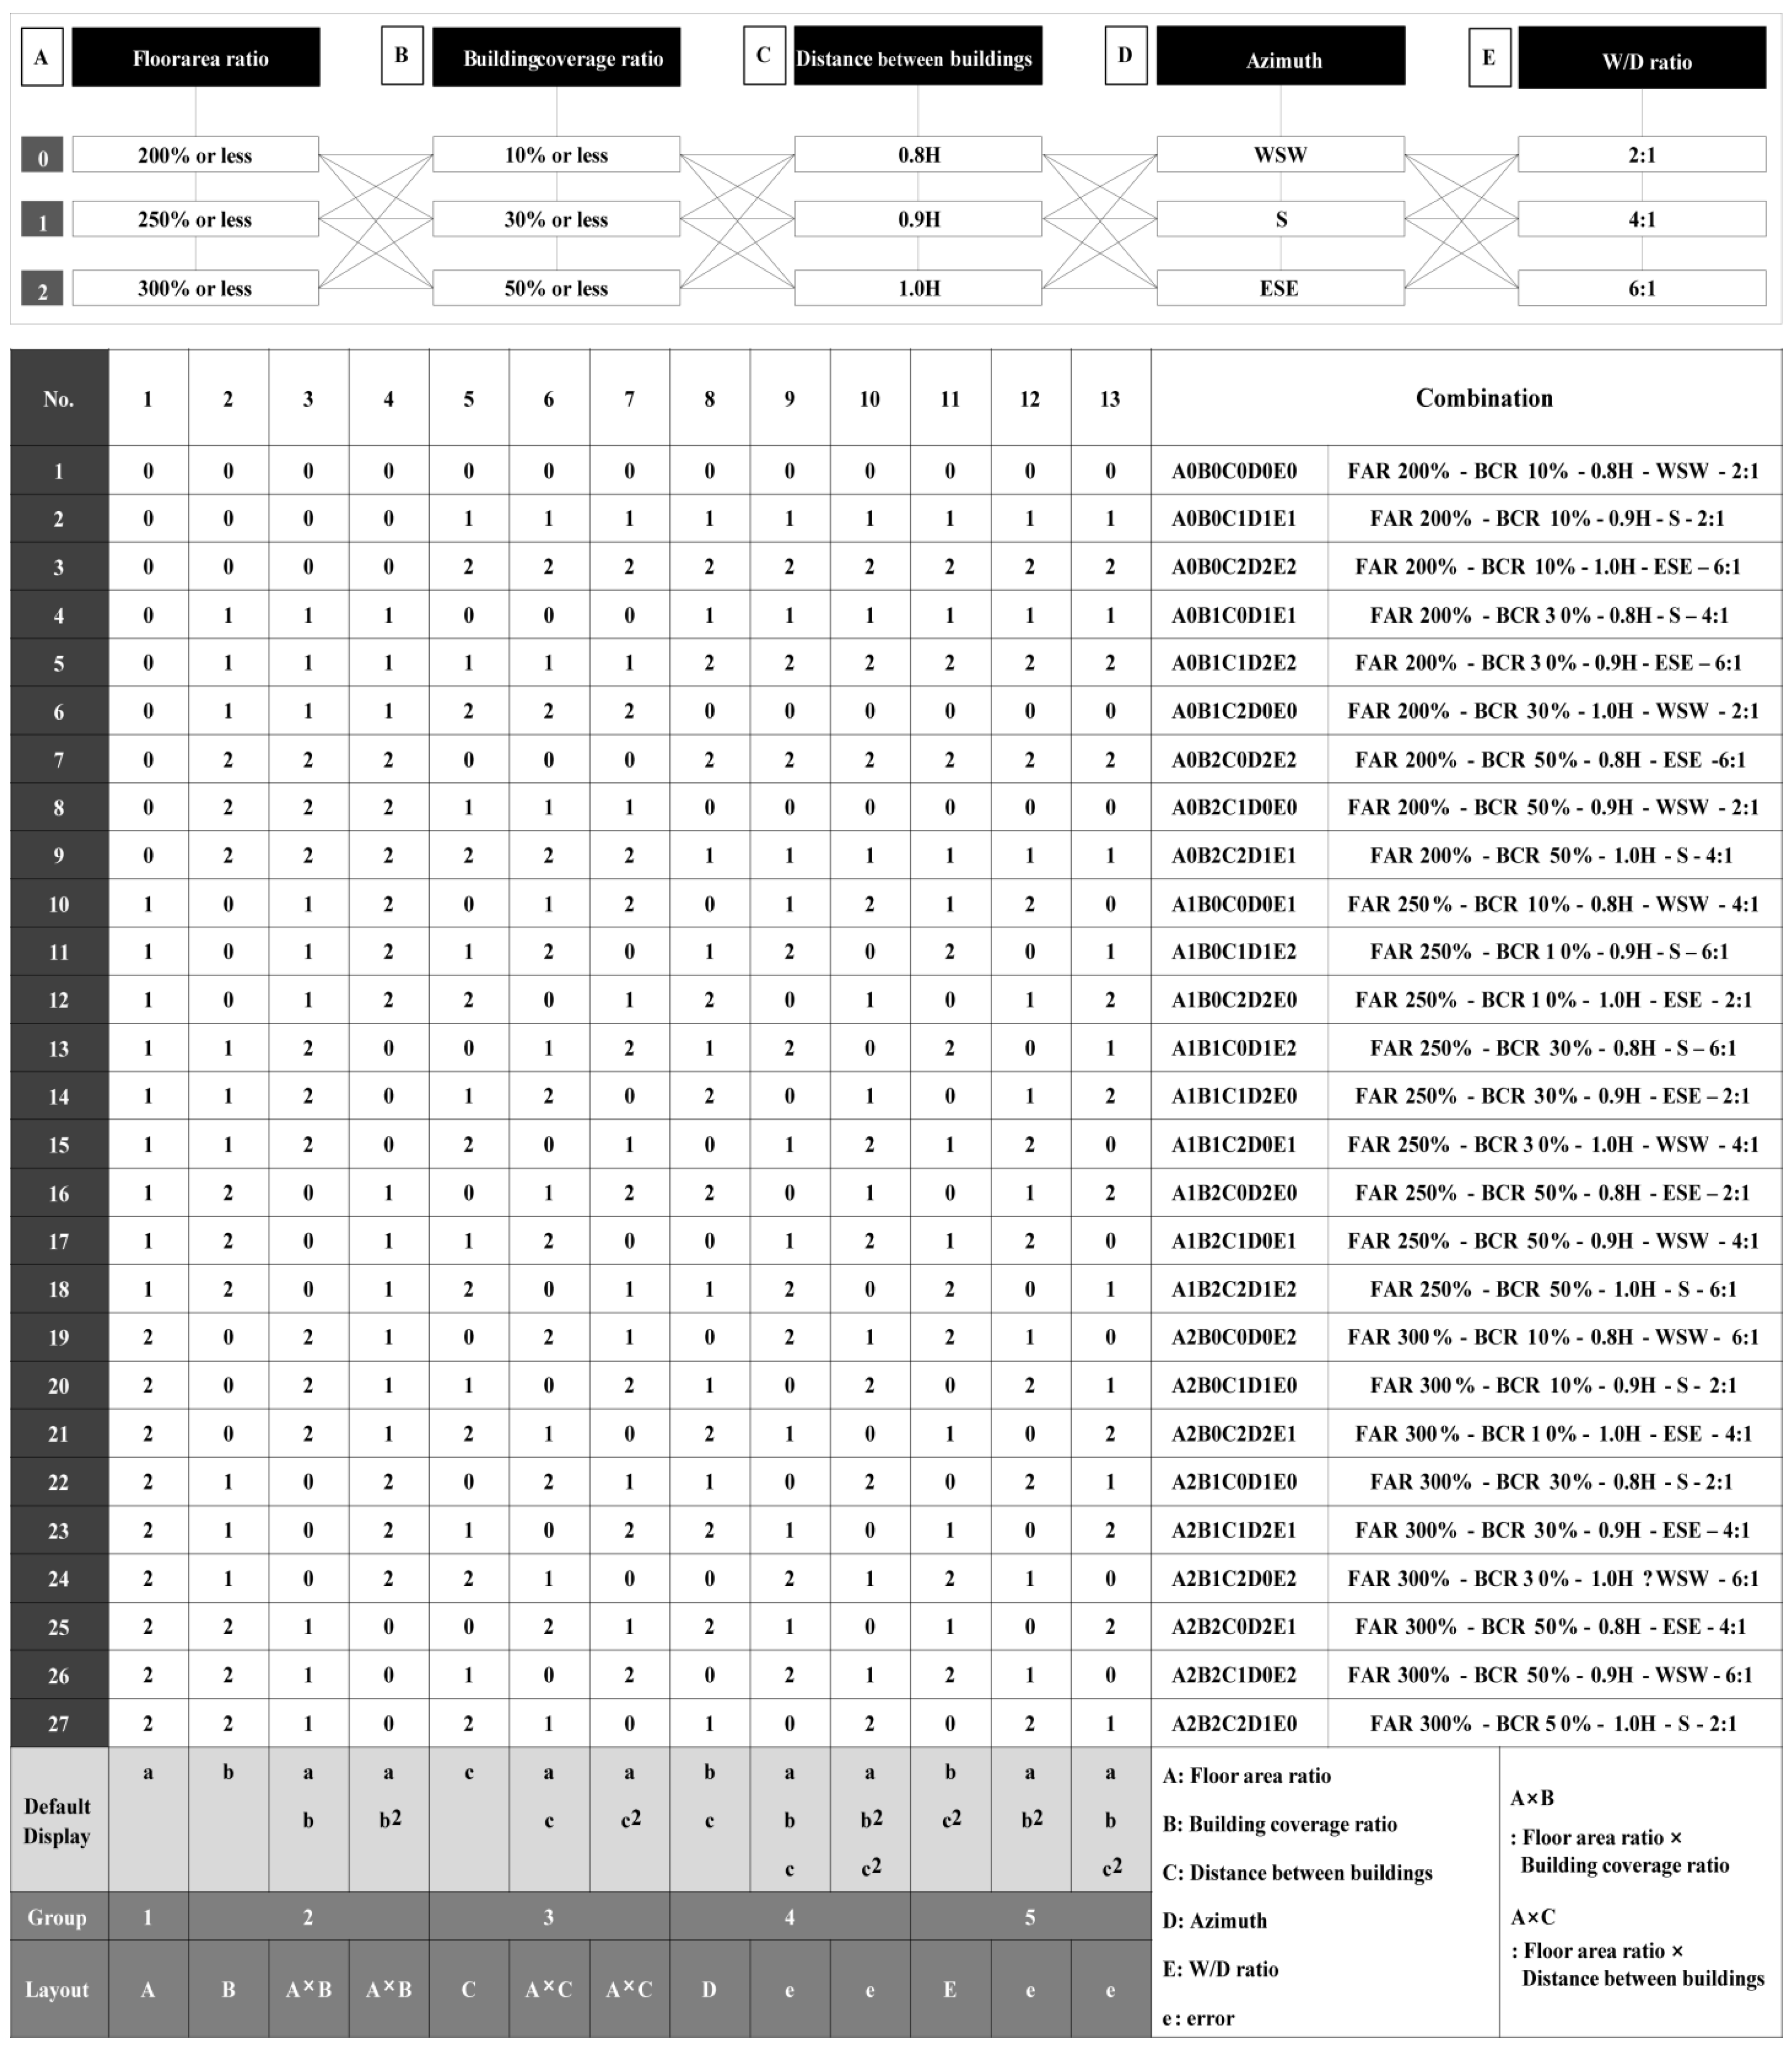
Figure 5 shows the valid case settings for the simulation using an orthogonal array of L
27(3
13). The building coverage ratio (B) according to floor area ratio (A) and the distance between buildings (C) were hypothesized to interact with each other.
Figure 5.
Case settings for the simulation using an orthogonal array of L27(313).
Figure 5.
Case settings for the simulation using an orthogonal array of L27(313).
4. Simulation and DOE
4.1. Conclusion of the Outdoor Thermal Environment and Daylight Availability Analysis
Table 4 lists the simulation results of the outdoor thermal environment and daylight availability. The mean value of temperatures measured on the surface of the entire building at 14:00, when outside temperature is highest, and the MRT value measured at 1.5 m above ground of the object area central point, were used for evaluation. The mean value of the HIP daily change and the HIP temperature distribution are shown in the results of outdoor thermal environment analysis. Regarding the results of the daylight availability analysis, the sunlight accessibility ratio at the measurement points of daylights in each unit of the apartment building was adopted.
Table 4.
Results of outdoor thermal environment and daylight availability analysis.
Table 4.
Results of outdoor thermal environment and daylight availability analysis.
| Case | Outdoor Thermal Environment | Sunlight Environment |
|---|
| All surface Temperature of 3-Dimension Building Surface Temperature (°C) | MRT (°C) | HIP (°C) | Sunlight Accessibility Ratio [%] |
|---|
| 14:00 | 14:00 | 05:00 | 12:00 | 14:00 | 20:00 |
|---|
| MAX | Average | MIN |
|---|
| 1 | 43.8 | 42.8 | 42.4 | 57.2 | 14.9 | 33.5 | 26.3 | 22.5 | 84 |
| 2 | 43.7 | 43.3 | 42.7 | 60.2 | 13.8 | 31.7 | 25.8 | 21.3 | 54 |
| 3 | 43.7 | 43.6 | 43.5 | 62.2 | 13.6 | 31.7 | 26.4 | 21.2 | |
| 4 | 44.8 | 43.7 | 42.3 | | 13.5 | | | 25.3 | |
| 5 | 44.9 | 43.9 | 43.1 | 58.5 | | 31.0 | 25.9 | | 94 |
| 6 | 44.9 | 43.5 | 42.4 | 59.0 | 14.8 | 33.1 | 26.2 | 22.1 | 99 |
| 7 | 46.4 | 44.8 | 44.3 | 56.7 | 14.6 | 31.8 | 27.0 | 21.6 | 72 |
| 8 | 46.3 | 44.4 | 43.6 | 58.1 | 16.3 | 33.9 | 27.4 | 23.5 | 86 |
| 9 | | | | 56.1 | 15.2 | 32.5 | 27.0 | 22.4 | 52 |
| 10 | 43.5 | 43.1 | 42.6 | 57.0 | 15.5 | 34.6 | 27.0 | 23.7 | 97 |
| 11 | 43.5 | 43.4 | 43.4 | 63.7 | 15.1 | 32.9 | 27.0 | 23.3 | 64 |
| 12 | 43.3 | 42.5 | 42.0 | 63.0 | 17.1 | 34.1 | 29.0 | 25.5 | |
| 13 | 44.3 | 43.3 | 42.5 | 55.5 | 14.5 | 31.7 | 26.0 | 22.0 | 89 |
| 14 | 44.1 | 42.6 | 41.3 | 58.2 | 16.5 | 32.7 | 27.9 | 24.1 | 95 |
| 15 | 44.6 | 43.7 | 42.4 | 57.2 | 15.3 | 34.0 | 26.7 | 23.1 | |
| 16 | 45.6 | 43.5 | 42.6 | 57.0 | 17.1 | 32.9 | 28.4 | 24.4 | 76 |
| 17 | 46.2 | 44.6 | 43.6 | 53.2 | 16.0 | 34.0 | 27.3 | 23.4 | 93 |
| 18 | 46.0 | 45.0 | 44.5 | 59.5 | 15.7 | 32.9 | 27.4 | 23.2 | 50 |
| 19 | 43.2 | 43.2 | 43.1 | 60.4 | 16.5 | | 27.8 | 25.1 | |
| 20 | 43.1 | 42.3 | 41.8 | 63.7 | 18.5 | 35.0 | 29.2 | | 63 |
| 21 | 43.2 | 42.8 | 42.3 | | 17.1 | 34.3 | | 26.0 | |
| 22 | | | | 56.4 | 18.0 | 33.5 | 28.0 | 26.0 | 46 |
| 23 | 43.9 | 42.8 | 41.4 | 58.7 | 16.7 | 33.1 | 28.4 | 24.8 | 97 |
| 24 | 44.5 | 43.7 | 43.0 | 59.4 | 16.5 | 35.2 | 27.7 | 24.7 | |
| 25 | 45.3 | 43.7 | 42.7 | 54.6 | 16.7 | 32.8 | 28.3 | 24.2 | 83 |
| 26 | 45.6 | 44.5 | 44.0 | 57.5 | 16.5 | 34.6 | 27.6 | 24.1 | 92 |
| 27 | 45.2 | 43.7 | 42.9 | 59.8 | | 34.3 | 29.1 | 26.4 | 50 |
The mean value of the HIP daily change and the HIP temperature distribution were shown in the results of the outdoor thermal environment analysis. Regarding the results of the daylight availability analysis, a sunlight accessibility ratio at the measurement points of daylights in each unit of the apartment building was adopted.
The highest three dimensional entire surface temperature was observed in case 9 (floor ratio: 200% or less; building coverage ratio: 50% or less; distance between buildings: 1.0 H; azimuth: S; w/d ratio: 4:1). The lowest three dimensional entire surface temperature was observed in case 22 (floor ratio: 300% or less; building coverage ratio: 30% or less; distance between buildings: 0.8 H; azimuth: S; w/d ratio: 2:1). The average surface temperature difference of the apartment housing was 3.0 °C.
In the MRT results, case 21 (floor ratio: 300% or less; building coverage ratio: 10% or less; distance between buildings: 1.0 H; azimuth: ESE; w/d ratio: 4:1) showed the highest value at the height of 1.5 m away from the ground surface, while case 4 (floor ratio: 200% or less; building coverage ratio: 30% or less; distance between buildings: 0.8 H; azimuth: S; w/d ratio: 4:1) showed the lowest. The average difference of the MRT value was about 11.2 °C.
The averages at the individual times were 15.8 °C at 05:00, 33.3 °C at 12:00, 27.4 °C at 14:00 and 23.6 °C at 20:00. The time at which the temperature difference was the biggest was 20:00, with the difference of 6.2 °C. With a high floor area ratio, the surface area of a concrete building increases, which decreases changes in HIP relative to changes in the ratio of green coverage.
Regarding the results of the daylight availability, the highest sunlight accessibility in each unit was observed in cases 3, 12, 15, 19, 21, and 24, satisfying the daylight availability condition at 100%. (sunlight accessibility of each apartment unit (V) = X/Y × 100, X: the number of apartment units securing continuous sunlight at least for 2 h between 09:00 and 15:00 on winter solstice, Y: the total number of units, green building certified) The lowest case was case 4, constituting 38%, with a very poor daylight availability compared to the other cases.
4.2. Assessment of Design Parameters by DOE Analysis
Table 5 lists the result of significant probability analysis by the Taguchi experimental design. The Taguchi experimental design method was first developed by applying the signal to noise ratio (
SN) concept [
24] of communication engineering and loss function, and the range of application was expanded for other fields of study (when handling quality characteristics of functions in telecommunications engineering, an input signal and noise are examined to determine the degree of effect they have on the output of the system. The transferred input signal affects output quality, and the noise applied to the system causes changes in the output quality, lowering the reliability of results. Therefore, Taguchi’s method was used to identify the clarity of data in the terms of signal-to-noise ratio (
SN).
SN is the ratio of signal to noise.
.) The design factors that affect the outdoor thermal environment and the daylight availability are the building coverage ratio (B), buildings (C), azimuth (D). Other factors such as distance between the floor area ratio (A) and w/d ratio (E) had virtually no influence on the outdoor thermal environment and daylight availability. In addition, interactions of design factors,
i.e., the floor area ratio (A) x building coverage ratio (B), and floor area ratio (A) x distance between buildings (C), did not appear to be significant.
From the various types of
SN , the smaller the better characteristic was used to [
25] a ranking of the impact of design variables was withdrawn based on the reaction results of the
SN and the average value at each level of the main factors. The most influential factor on the outside thermal environment and the daylight availability was the azimuth (D), followed in descending order of building coverage ratio (B) > distance between buildings (C) > floor area ratio (A) > w/d ratio (E).
A predictive analysis of the optimal level was conducted by using the credibility of the DOE. Among the 1~27 rankings, case 4 was selected to be the most optimal layout plan appropriate for the outdoor thermal environment and the daylight availability, while case 3 was not shown to be proper for the outdoor thermal environment and the daylight availability. According to this result, MRT is considered to be an important factor when selecting rankings; cases which show higher MRT results than others show lower rankings. For an optimal layout planning of the apartment housing which satisfies the outdoor thermal environment and the daylight availability, greenery planning at the stage of layout planning is recommended to create a more comfortable living environment.
Table 5.
Significant probability analysis by design of experiments (DOE).
Table 5.
Significant probability analysis by design of experiments (DOE).
| Factor | F | P (Level of Significance) |
|---|
| Floor area ratio (A) | 4.23 | 0.056 |
| Building coverage ratio (B) | 7.82 | 0.013 |
| Distance between buildings (C) | 4.45 | 0.050 |
| Azimuth (D) | 61.71 | 0.000 |
| w/d ratio (E) | 2.36 | 0.157 |
| Floor area ratio (A) × Building coverage ratio (B) | 1.15 | 0.402 |
| Floor area ratio (A) × Distance between buildings (C) | 1.83 | 0.217 |
4.3. Conclusions of the Outdoor Thermal Environment According to the Greenery Coverage Ratio
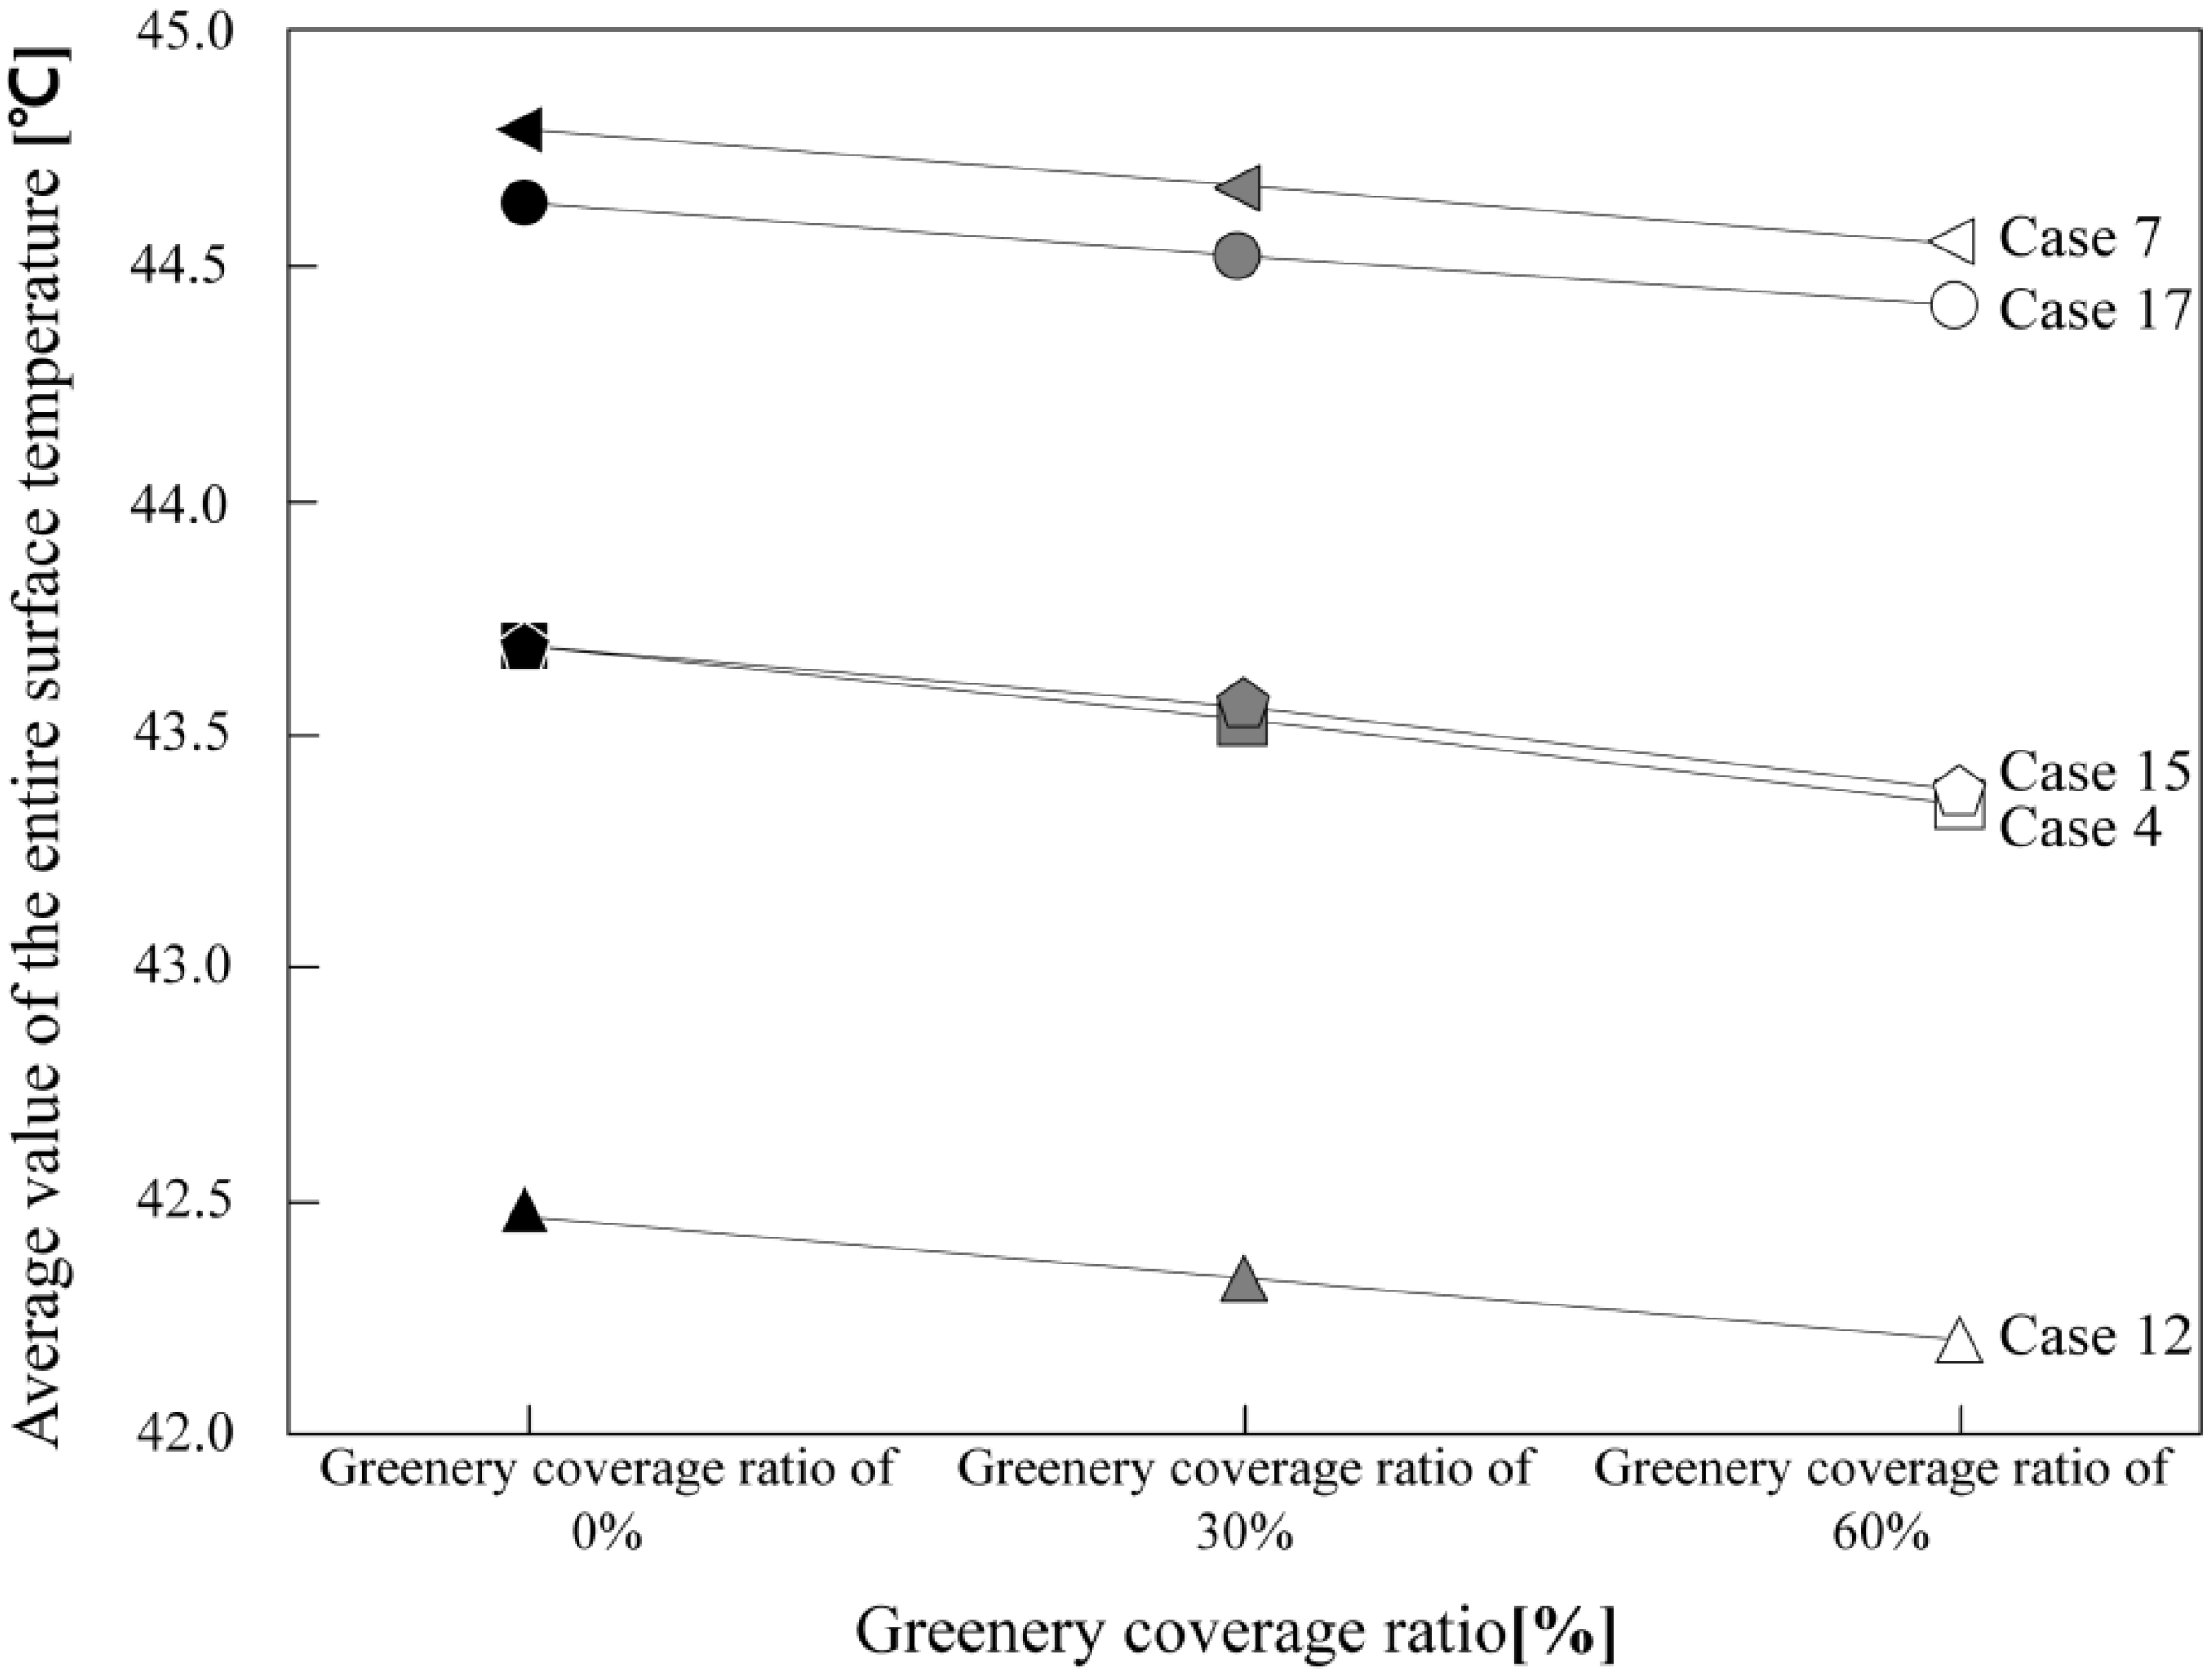
According to the results of a predictive analysis, for a total of five cases, 1st ranking (Case 4), 9th ranking (Case 7), 14th ranking (Case 17), 17th ranking (Case 12) and 27th ranking (Case 15), greenery coverage ratios of 30% and 60% were applied based on the building.
Figure 6 shows the average value of the entire building surface temperature by changes in the greenery coverage ratio. By applying greenery on the ground surface, the entire building surface temperature decreases by 0.3 °C on average. When applying 30% of the greenery coverage ratio, an average of 0.1 °C is decreased, while when 60% of the greenery coverage ratio is applied, an average of 0.3 °C is decreased. Case 4 (floor ratio: 200% or less; building coverage ratio: 30% or less; distance between buildings: 0.8 H; azimuth: S; w/d ratio 4:1) showed the biggest decrease; applying 30% of the greenery coverage ratio showed a 0.2 °C temperature decrease, and when applying 60% of the greenery coverage ratio showed a 0.3 °C temperature decrease.
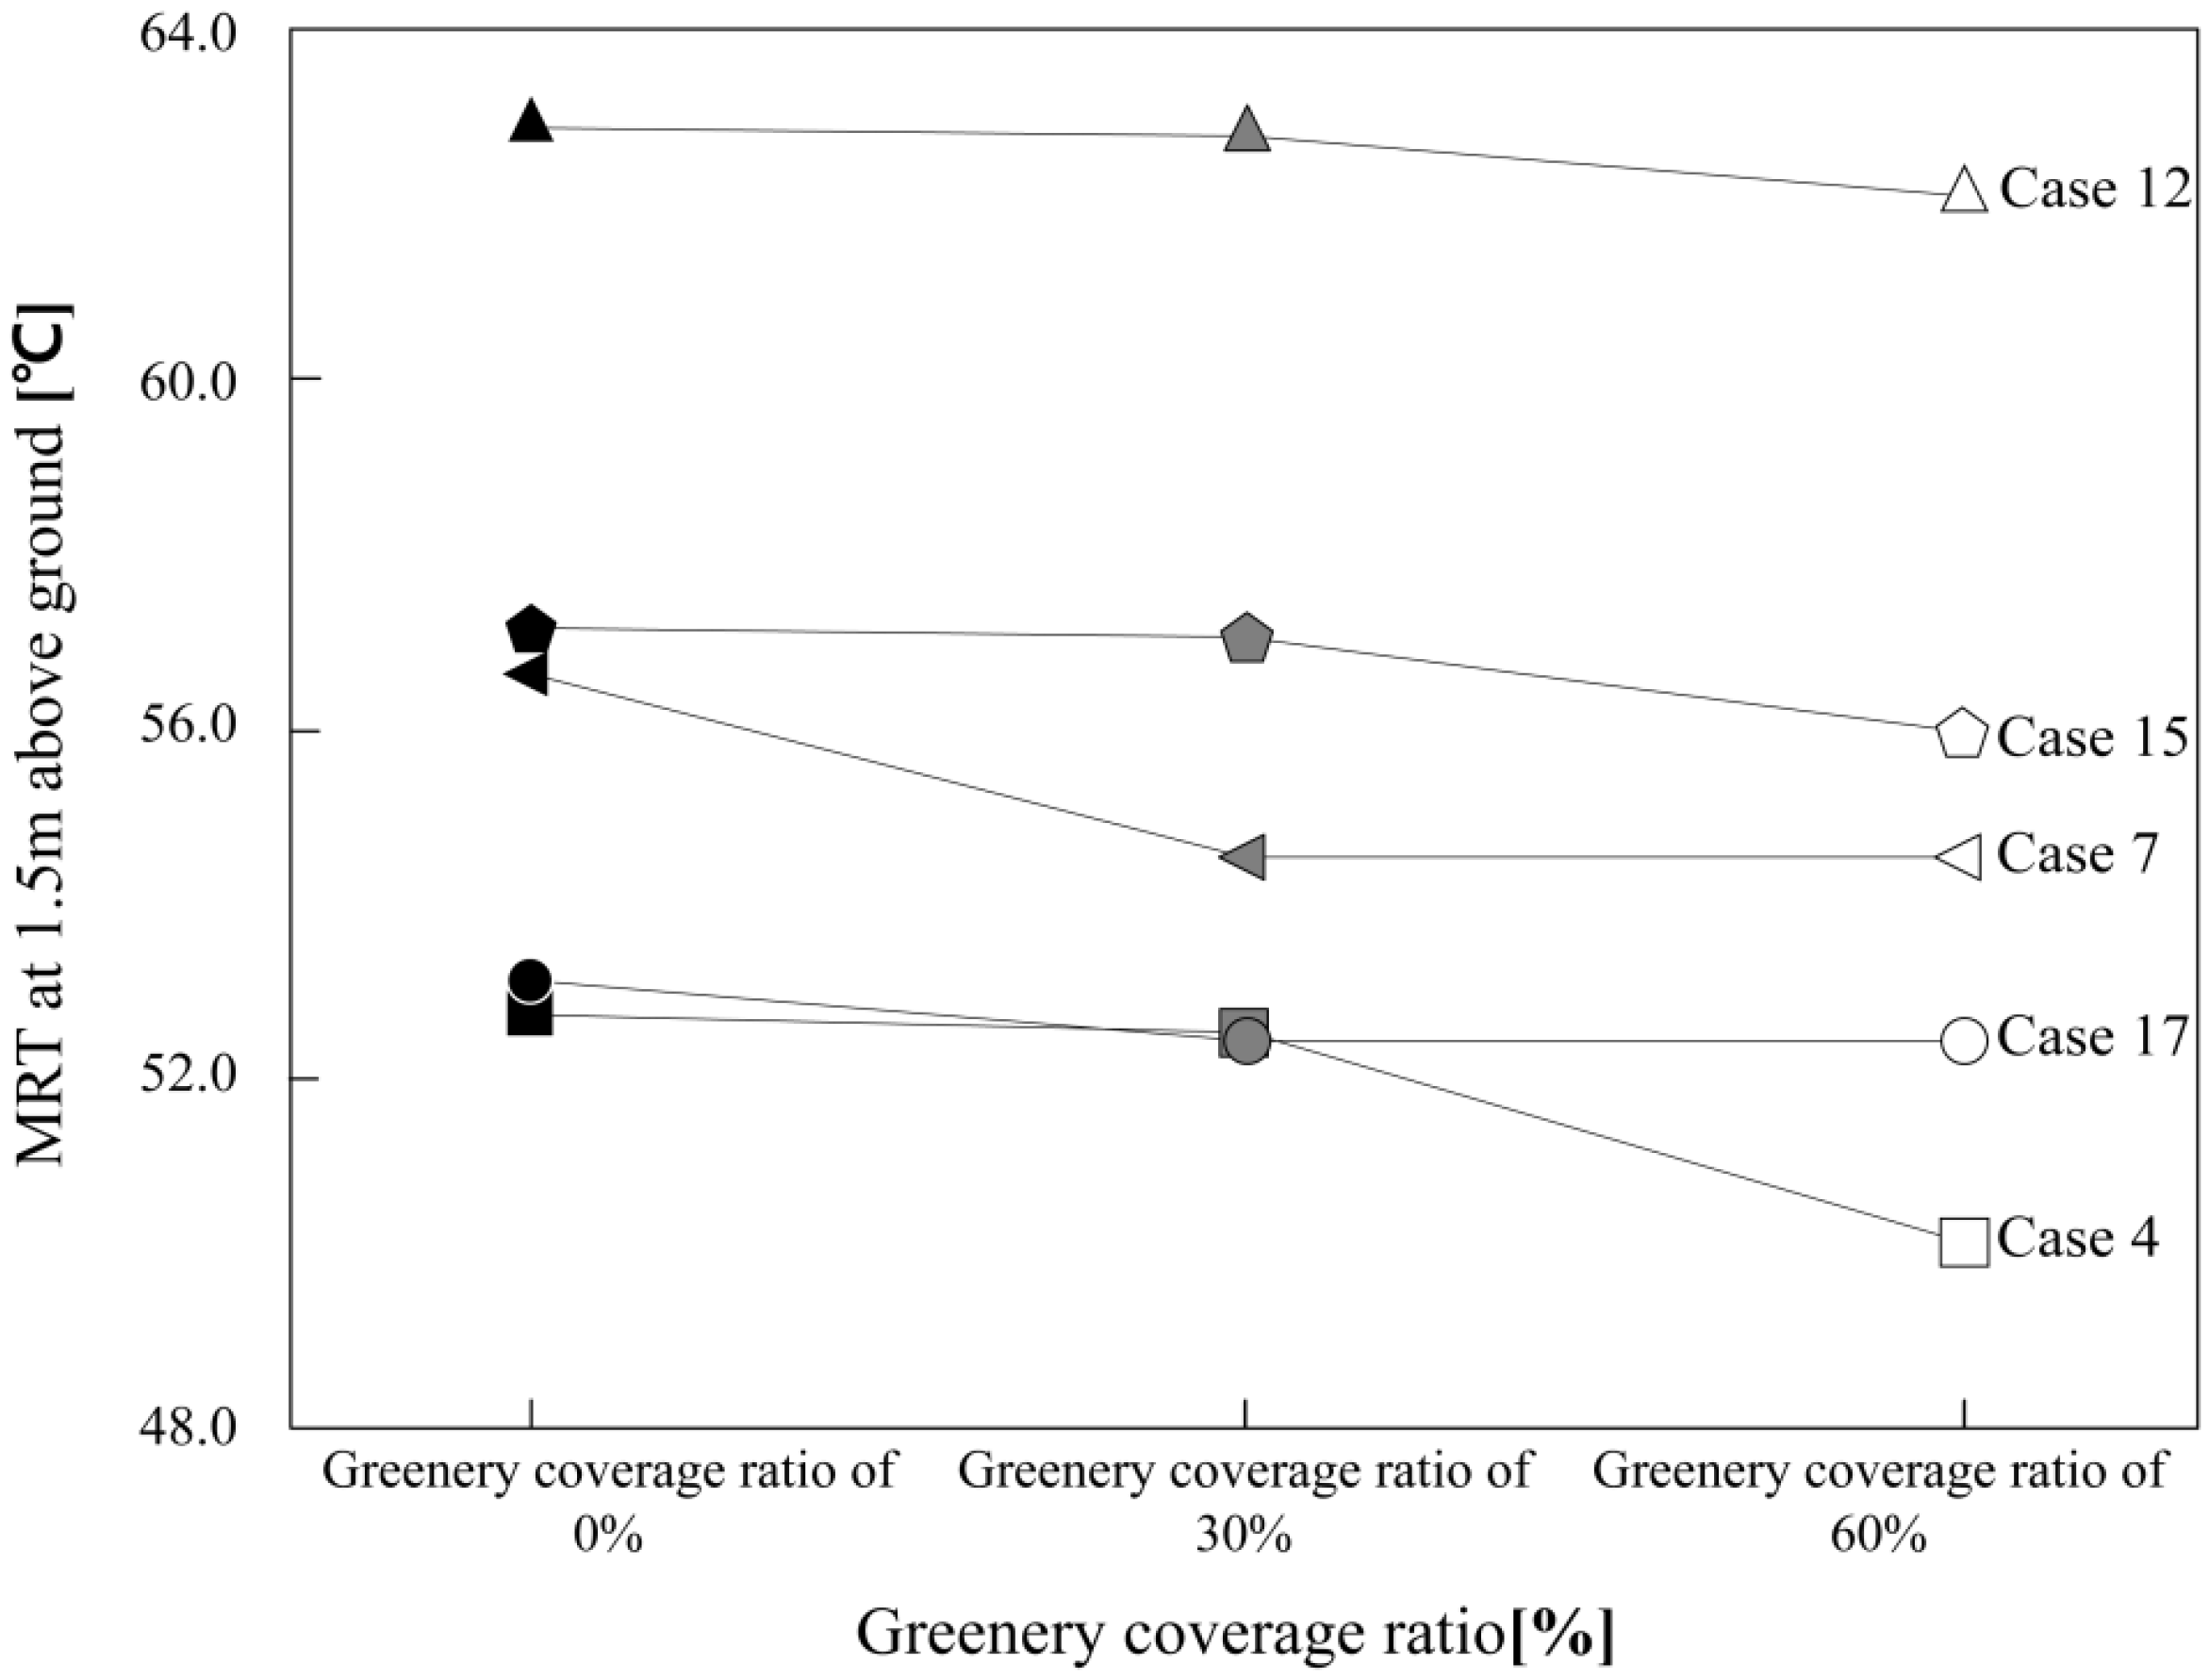
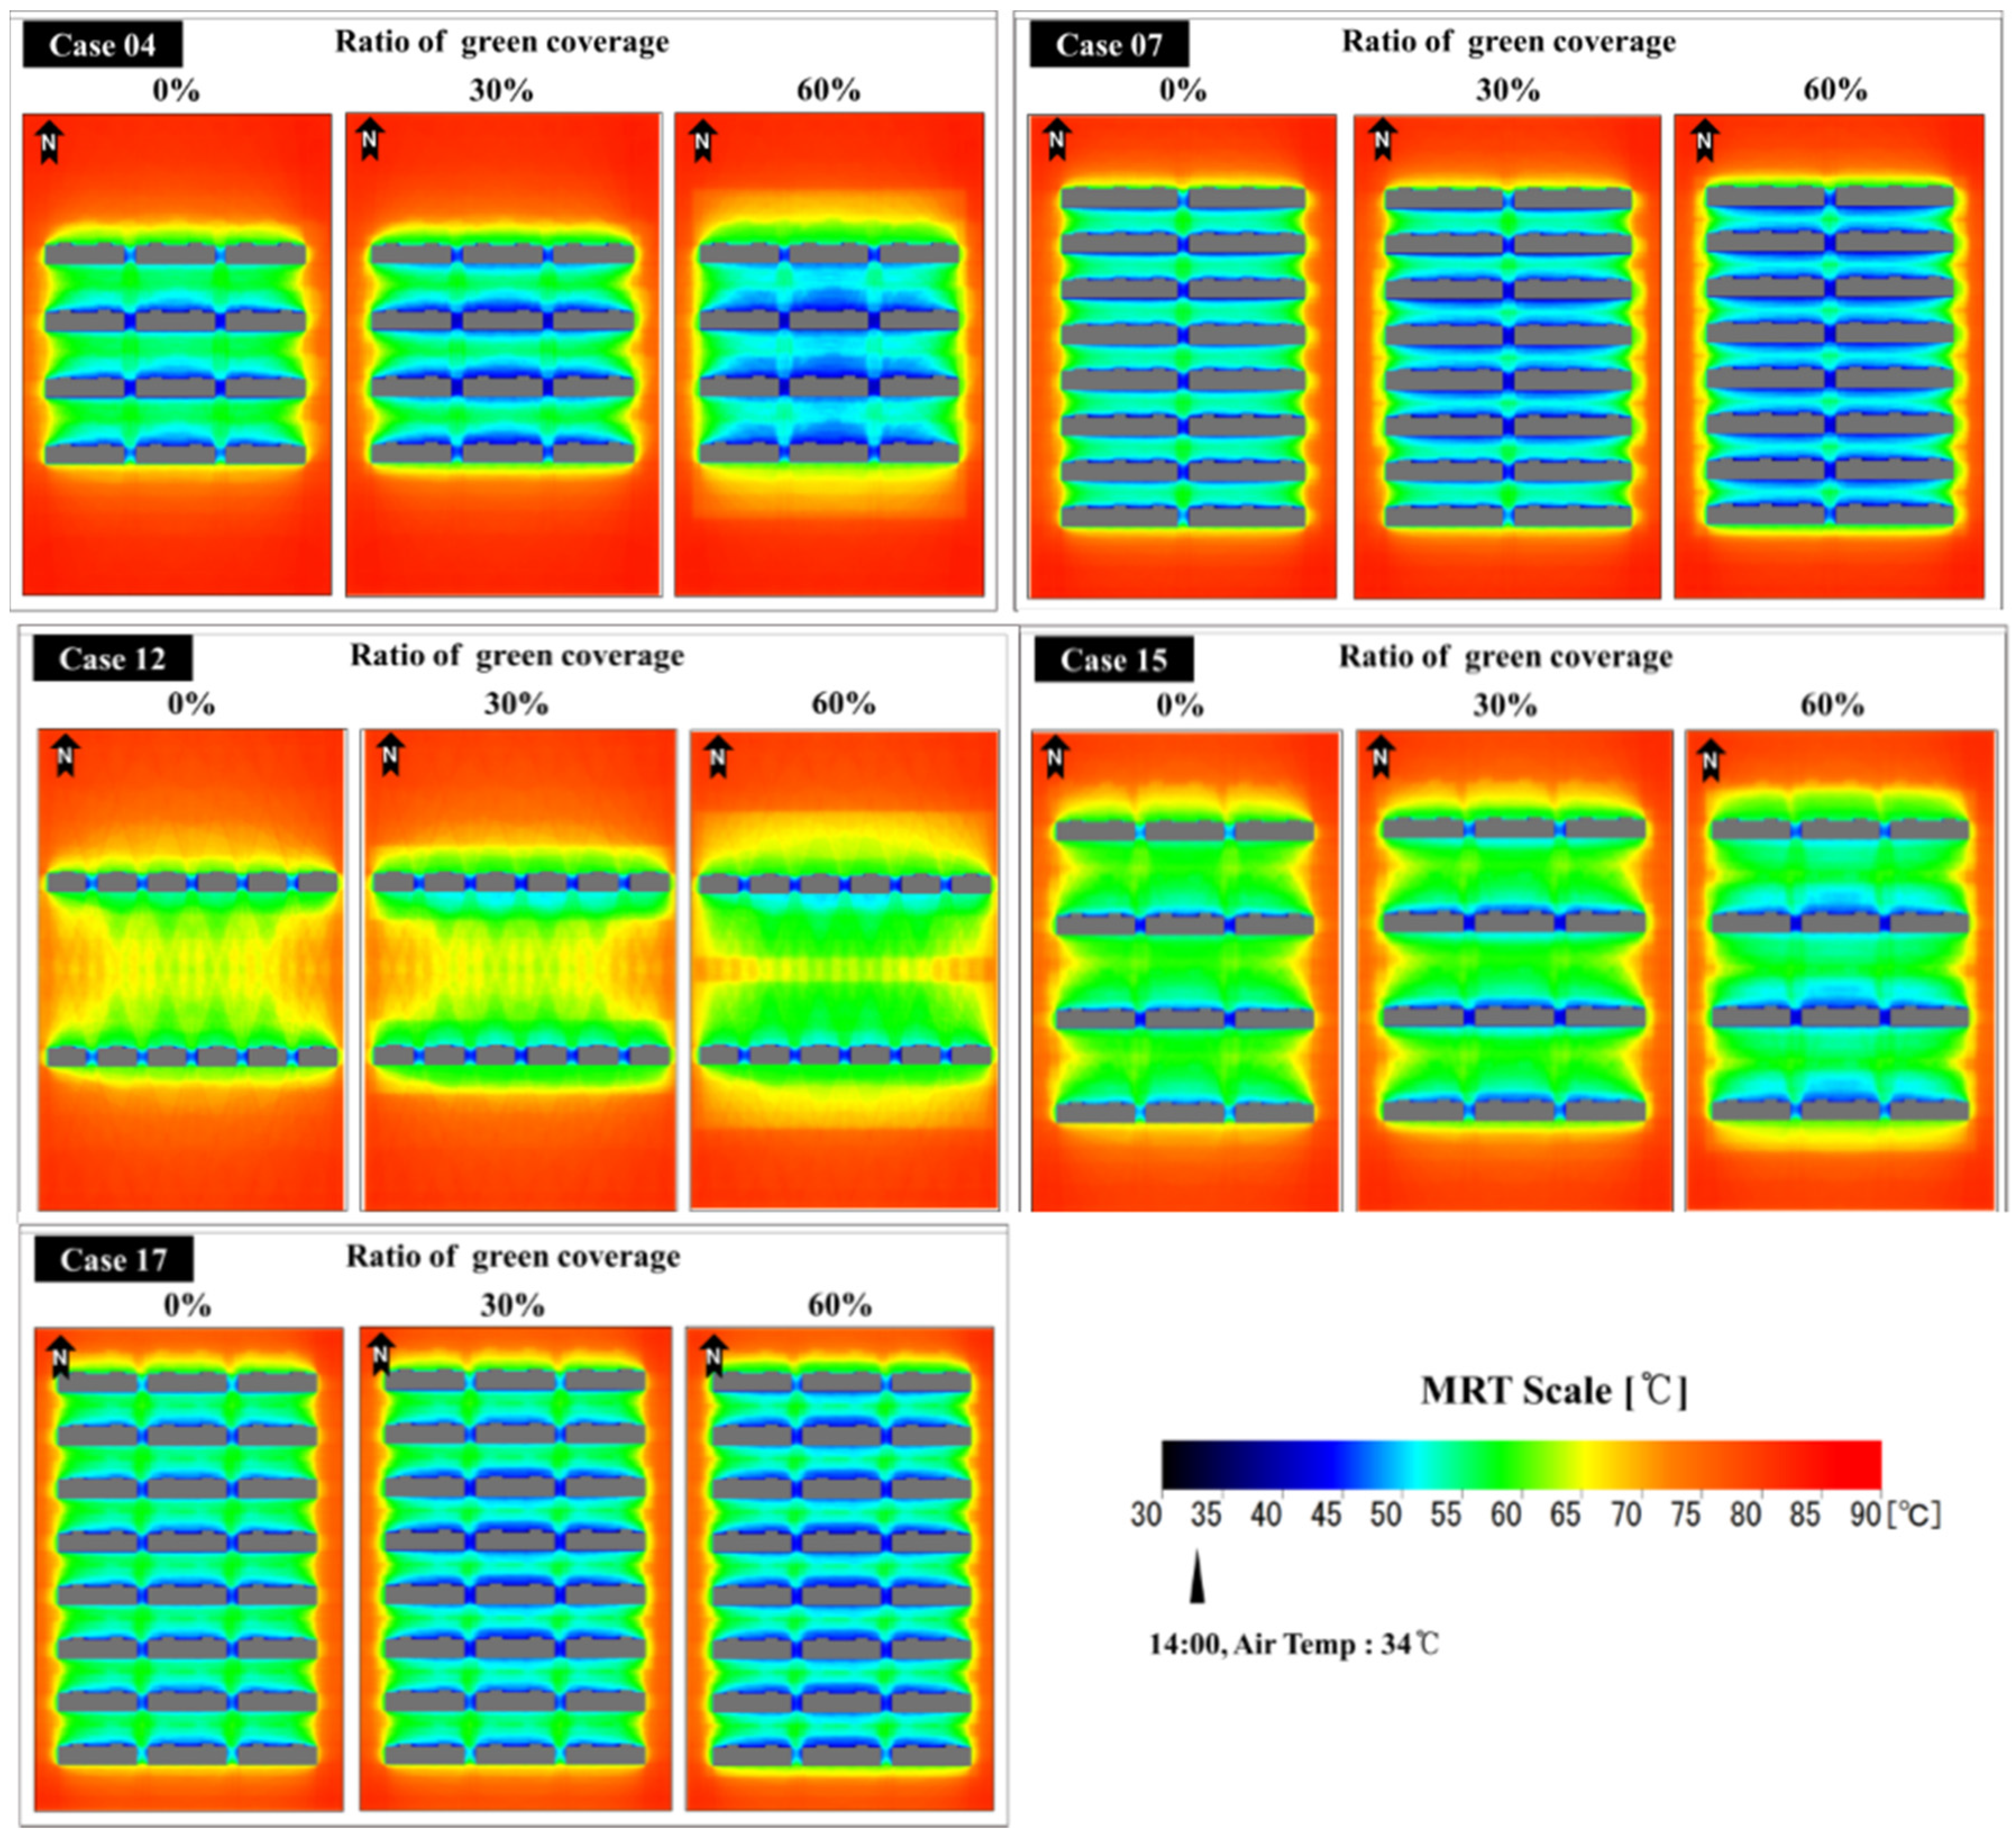
MRT distribution is shown in
Figure 7 and
Figure 8. Calculation results of the average MRT by changes in the greenery coverage ratio are shown in
Figure 7, and MRT distribution at the height of 1.5 m from the ground surface at 14:00 is shown in
Figure 8. By applying green space on the surface ground, the MRT value went down by approximately 1.1 °C. When applying a greenery coverage ratio of 30%, a decrease of 0.6 °C on average was seen, and when applying 60%, on average the temperature decreased by 1.5 °C. When 30% greenery coverage ratio was applied, Case 7 showed a decrease of 2.1 °C and, when 60% greenery coverage ratio was applied, Case 4 showed a decrease of 2.6 °C. The lower the building coverage ratio, the lower the decrease in the MRT temperature was shown to be. To maintain pleasant outdoor space, it is thought that an afforestation plan is important not only for the building surroundings but also for the outdoor space.
Table 6 shows HIP results by changes in the greenery coverage ratio (at 05:00, 12:00, 14:00, 20:00). This shows that HIP decreases as the greenery coverage ratio increases. Each case at 12:00 showed the highest decline of HIP (5.4 °C on the average), and there was a decrease of 4.6 °C on average at 20:00. By applying green space on the ground surface, it is possible to prevent air from being overheated by evaporation at 12:00 when sunlight is the strongest. After sunset, the heat island effect tends to be released due to the evaporative cooling effect of plants. Case 2 showed the highest HIP decline according to the change of the greenery coverage ratio as, when applying 30% of the greenery coverage ratio at 12:00, the temperature decreased by 2.1 °C; and when applying 60% of the greenery coverage ratio, 5.4 °C decreased. Furthermore, when applying 30% of the greenery coverage ratio at 20:00, 1.8 °C decreased; and when applying 60% of the greenery coverage ratio, the result showed a decline of 4.6 °C.
Figure 6.
Average value of the entire surface temperature according to the change of the greenery coverage ratio.
Figure 6.
Average value of the entire surface temperature according to the change of the greenery coverage ratio.
Figure 7.
Mean Radiant Temperature (MRT) according to the change of the greenery coverage ratio.
Figure 7.
Mean Radiant Temperature (MRT) according to the change of the greenery coverage ratio.
Figure 8.
MRT results according to changes in the greenery coverage ratio.
Figure 8.
MRT results according to changes in the greenery coverage ratio.
Table 6.
Heat Island Potential (HIP) by greenery coverage ratio.
Table 6.
Heat Island Potential (HIP) by greenery coverage ratio.
| Case | Greenery Coverage Ratio (%) | HIP (°C) |
|---|
| 05:00 | 12:00 | 14:00 | 20:00 |
|---|
| 4 | 0% | 13.5 | 31.0 | 25.3 | 20.6 |
| 30% | 12.3 | 29.1 | 23.8 | 18.9 |
| 60% | 10.2 | 24.8 | 20.5 | 15.4 |
| 7 | 0% | 14.6 | 31.8 | 27.0 | 21.6 |
| 30% | 13.4 | 30.0 | 25.4 | 19.9 |
| 60% | 12.3 | 28.1 | 23.7 | 18.2 |
| 12 | 0% | 17.1 | 34.1 | 29.0 | 25.5 |
| 30% | 15.5 | 31.3 | 26.7 | 23.1 |
| 60% | 13.3 | 27.3 | 23.2 | 19.5 |
| 15 | 0% | 15.3 | 33.9 | 26.7 | 23.1 |
| 30% | 14.2 | 31.9 | 25.2 | 21.3 |
| 60% | 12.1 | 27.5 | 22.1 | 18.0 |
| 17 | 0% | 16.0 | 34.0 | 27.3 | 23.4 |
| 30% | 14.9 | 32.0 | 25.8 | 21.8 |
| 60% | 13.8 | 29.9 | 24.2 | 20.0 |
5. Limitation of the Study
This study focused on the three-dimensional surface temperature distribution and formation of the radiation environment of the outdoor space of an apartment, which requires an additional examination of the temperature and wind velocity profile. This examination can be done through a computational fluid dynamics (CFD) analysis using the three-dimensional surface temperature distribution obtained from this research as the boundary condition. Additionally, we expect that an addition of various evaluations of building shapes and types of arrangement will allow us to obtain more comprehensive results.
6. Conclusions
Case studies were conducted on the sunlight and numerical simulations of the entire three dimensional surface temperature, focusing on the layout planning factors of the apartment housing complex. In doing so, the design factors that influence the outdoor thermal environment and the daylight availability were selected, and the optimal integrative layout planning was drawn out.
Using an orthogonal layout of L27(313), 27 valid cases in total were selected. After this, the outdoor thermal environment and the daylight availability of each case were analyzed. The results showed that the layout planning factor has a strong effect on the outdoor thermal environment and the daylight availability, particularly in the MRT and the HIP results. Establishing a comfortable living space is possible by arranging environment-friendly design factors appropriately to satisfy the outdoor conditions (e.g., thermal environment and daylight availability).
Design factors that influence the outdoor thermal environment and the daylight availability are the building coverage ratio (0.013), pitch of building (0.050) and azimuth (0.000). The rank of influence of the design factors on the outdoor thermal environment and the daylight availability appeared in the following order azimuth (D) > building coverage ratio (B) > distance between buildings (C) > floor area ratio (A) > w/d ratio (E).
The change in the outdoor thermal environment was also examined by applying a greenery coverage ratio of 30% and 60% for each case. By applying green space to the ground surface, the entire building surface temperature was decreased by 0.3 °C on average. Furthermore, the MRT average value declined by approximately 1.5 °C. When applying a 30% greenery coverage ratio, an average decreased of 0.6 °C was noted; and when applying a 60% greenery coverage ratio, the temperature decreased by an average of 1.5 °C. This shows that HIP decreases as the greenery coverage ratio increases. Each case at 12:00 showed the highest decline of HIP (5.4 °C on the average), and there was a decrease of 4.6 °C on average at 20:00.
Greenery plans should be implemented in accordance with application of building density, and it is thought that mitigation of thermal island effects can be achieved through earth surface and building afforestation plans, with these also contributing to the creation of pleasant outdoor environments.
Acknowledgments
This research was supported by Basic Science Research Program through the National Research Foundation of Korea (NRF) funded by the Ministry of Science, ICT & Future Planning (2015R1A2A2A01007849).
Author Contributions
Both authors participated in the research, analysis and interpretation of the data, as well as the design and production of this article. Both authors agree to be listed and approve the submitted and accepted versions of the publication.
Conflicts of Interest
The authors declare no conflict of interest.
References
- Jeong, S.; Yoon, S. Method to quantify the effect of apartment housing design parameters on outdoor thermal comfort in summer. Build. Environ. 2012, 53, 150–158. [Google Scholar] [CrossRef]
- Seong, Y.; Kim, Y.; Seok, H.; Choi, J.; Yeo, M.; Kim, K. Automatic computation for optimum height planning of apartment buildings to improve solar access. Sol. Energy 2011, 85, 154–173. [Google Scholar] [CrossRef]
- Jung, S.; Yoon, S. Analysis on the influence of building coverage ratio and floor area ratio on sunlight environment and outdoor thermal environment in flat-type apartment houses. J. Archit. Inst. Korea Plan. Des. 2015, 31, 69–76. [Google Scholar] [CrossRef]
- Taleghani, M.; Kleerekoper, L.; Tenpierik, M.; van den Dobbelsteen, A. Outdoor thermal comfort within five different urban forms in the Netherlans. Build. Environ. 2015, 83, 65–78. [Google Scholar] [CrossRef]
- Chen, H.; Ooka, R.; Harayama, K.; Kato, S.; Li, X. Study on outdoor thermal environment of apartment block in Shenzhen, China with coupled simulation of convection, radiation and conduction. Energy Build. 2004, 36, 1247–1258. [Google Scholar] [CrossRef]
- Yang, F.; Lau, S.Y.; Qian, F. Summertime heat island intensities in three high-rise housing quarters in inner-city Shanghai China: Building layout, density and greenery. Build. Environ. 2010, 45, 115–134. [Google Scholar] [CrossRef]
- Yang, F.; Lau, S.Y.; Qian, F. Urban design to lower summertime outdoor temperatures: An empirical study on high-rise housing in Shanghai. Build. Environ. 2011, 46, 769–785. [Google Scholar] [CrossRef]
- Kim, J.; Yang, S. Analysis on the sola environmental changes according to the amendment of apartment planning indexes in Seoul. J. Archit. Inst. Korea Plan. Des. 2011, 27, 203–210. [Google Scholar]
- Lee, J. Study on the application methods of the various types of apartment buildings based on the sun shade layout and the possibility of the advanced application to PUD planning. J. Archit. Inst. Korea Plan. Des. 2011, 27, 165–176. [Google Scholar]
- Park, E.; Kang, B. A research on analysis of sunlight environment impact of certified green building apartment complexes. J. Archit. Inst. Korea Plan Des. 2007, 23, 3–13. [Google Scholar]
- Kim, K.; Kim, K. Evaluation of solar access for an individual apartment unit according to different types of building blocks and layout. J. Archit. Inst. Korea Plan. Des. 2006, 22, 275–282. [Google Scholar]
- Hwang, H.; Lee, J. The estimation of environmental performance in domestic buildings by the indicator of sunshine and openness: Focusing on tower-type apartment houses. J. Archit. Inst. Korea Plan. Des. 2005, 21, 319–326. [Google Scholar]
- Mohsenin, M.; Hu, J. Assessing daylight performance in atrium buildings by using climate based daylight modeling. Sol. Energy 2015. [Google Scholar] [CrossRef]
- Yun, G.; Yoon, K.; Kim, K. The influence of shading control strategies on the visual comfort and energy demand of office buildings. Energy Build. 2014, 84, 70–85. [Google Scholar] [CrossRef]
- Fath, K.; Stengel, J.; Sprenger, W.; Wilson, H.; Schultmann, F.; Kuhn, T.E. A method for predicting the economic potential of photovoltaics in urban areas based on hourly Radiance simulations. Sol. Energy 2015, 116, 357–370. [Google Scholar] [CrossRef]
- Bueno, B.; Wienold, J.; Katsifaraki, A.; Kuhn, T.E. Fener: A radiance-based modelling approach to assess the thermal and daylighting performance of complex fenestration systems in office spaces. Energy Build. 2015, 94, 10–20. [Google Scholar] [CrossRef]
- Reinhart, C.F.; Herkel, S. The simulation of annual daylight illuminance distributions—A state of the art comparison of six RADIANCE-based methods. Energy Build. 2000, 32, 167–187. [Google Scholar] [CrossRef]
- He, J.; Hoyano, A.; Asawa, T. A numerical simulation tool for predicting the impact of outdoor thermal environment on building energy performance. Appl. Energy 2009, 86, 1596–1605. [Google Scholar] [CrossRef]
- He, J.; Hoyano, A. A numerical simulation method for analyzing the thermal improvement effect of super-hydrophilic photocatalyst-coated building surfaces with water film on the urban/built environment. Energy Build. 2008, 40, 968–978. [Google Scholar] [CrossRef]
- He, J.; Hoyano, A. A 3D CAD-based simulation tool for prediction and evaluation of the thermal improvement effect of passive cooling walls in the developed urban locations. Sol. Energy 2009, 83, 1064–1075. [Google Scholar] [CrossRef]
- Asawa, T.; Hoyano, A.; Nakaohkubo, K. Thermal design tool for outdoor spaces based on heat balance simulation using a 3D-CAD system. Build. Environ. 2007, 43, 2112–2123. [Google Scholar] [CrossRef]
- He, J. A design supporting simulation system for predicting and evaluating the cool microclimate creating effect of passive evaporative cooling walls. Build. Environ. 2011, 46, 584–596. [Google Scholar] [CrossRef]
- Enforcement Decree of the Building Act; Ministry of Land, Infrastructure and Transport: Seoul, Korea, 2013.
- Athreya, S.; Venkatesh, Y.D. Application of taguchi method for optimization of process parameters in improving the surface roughness of lathe facing operation. Int. Refereed J. Eng. Sci. 2012, 1, 13–19. [Google Scholar]
- Taguchi, G.; Chowdhury, S.; Wu, Y. Quality Loss Function. In Taguchi’s Quality Engineering Handbook; John Wiley & Sons: Hoboken, NJ, USA, 2005; pp. 171–198. [Google Scholar]
© 2015 by the authors; licensee MDPI, Basel, Switzerland. This article is an open access article distributed under the terms and conditions of the Creative Commons Attribution license (http://creativecommons.org/licenses/by/4.0/).


