
Reducing Carbon Emissions from Shopping Trips: Evidence from China


Abstract
:1. Introduction
2. Methods
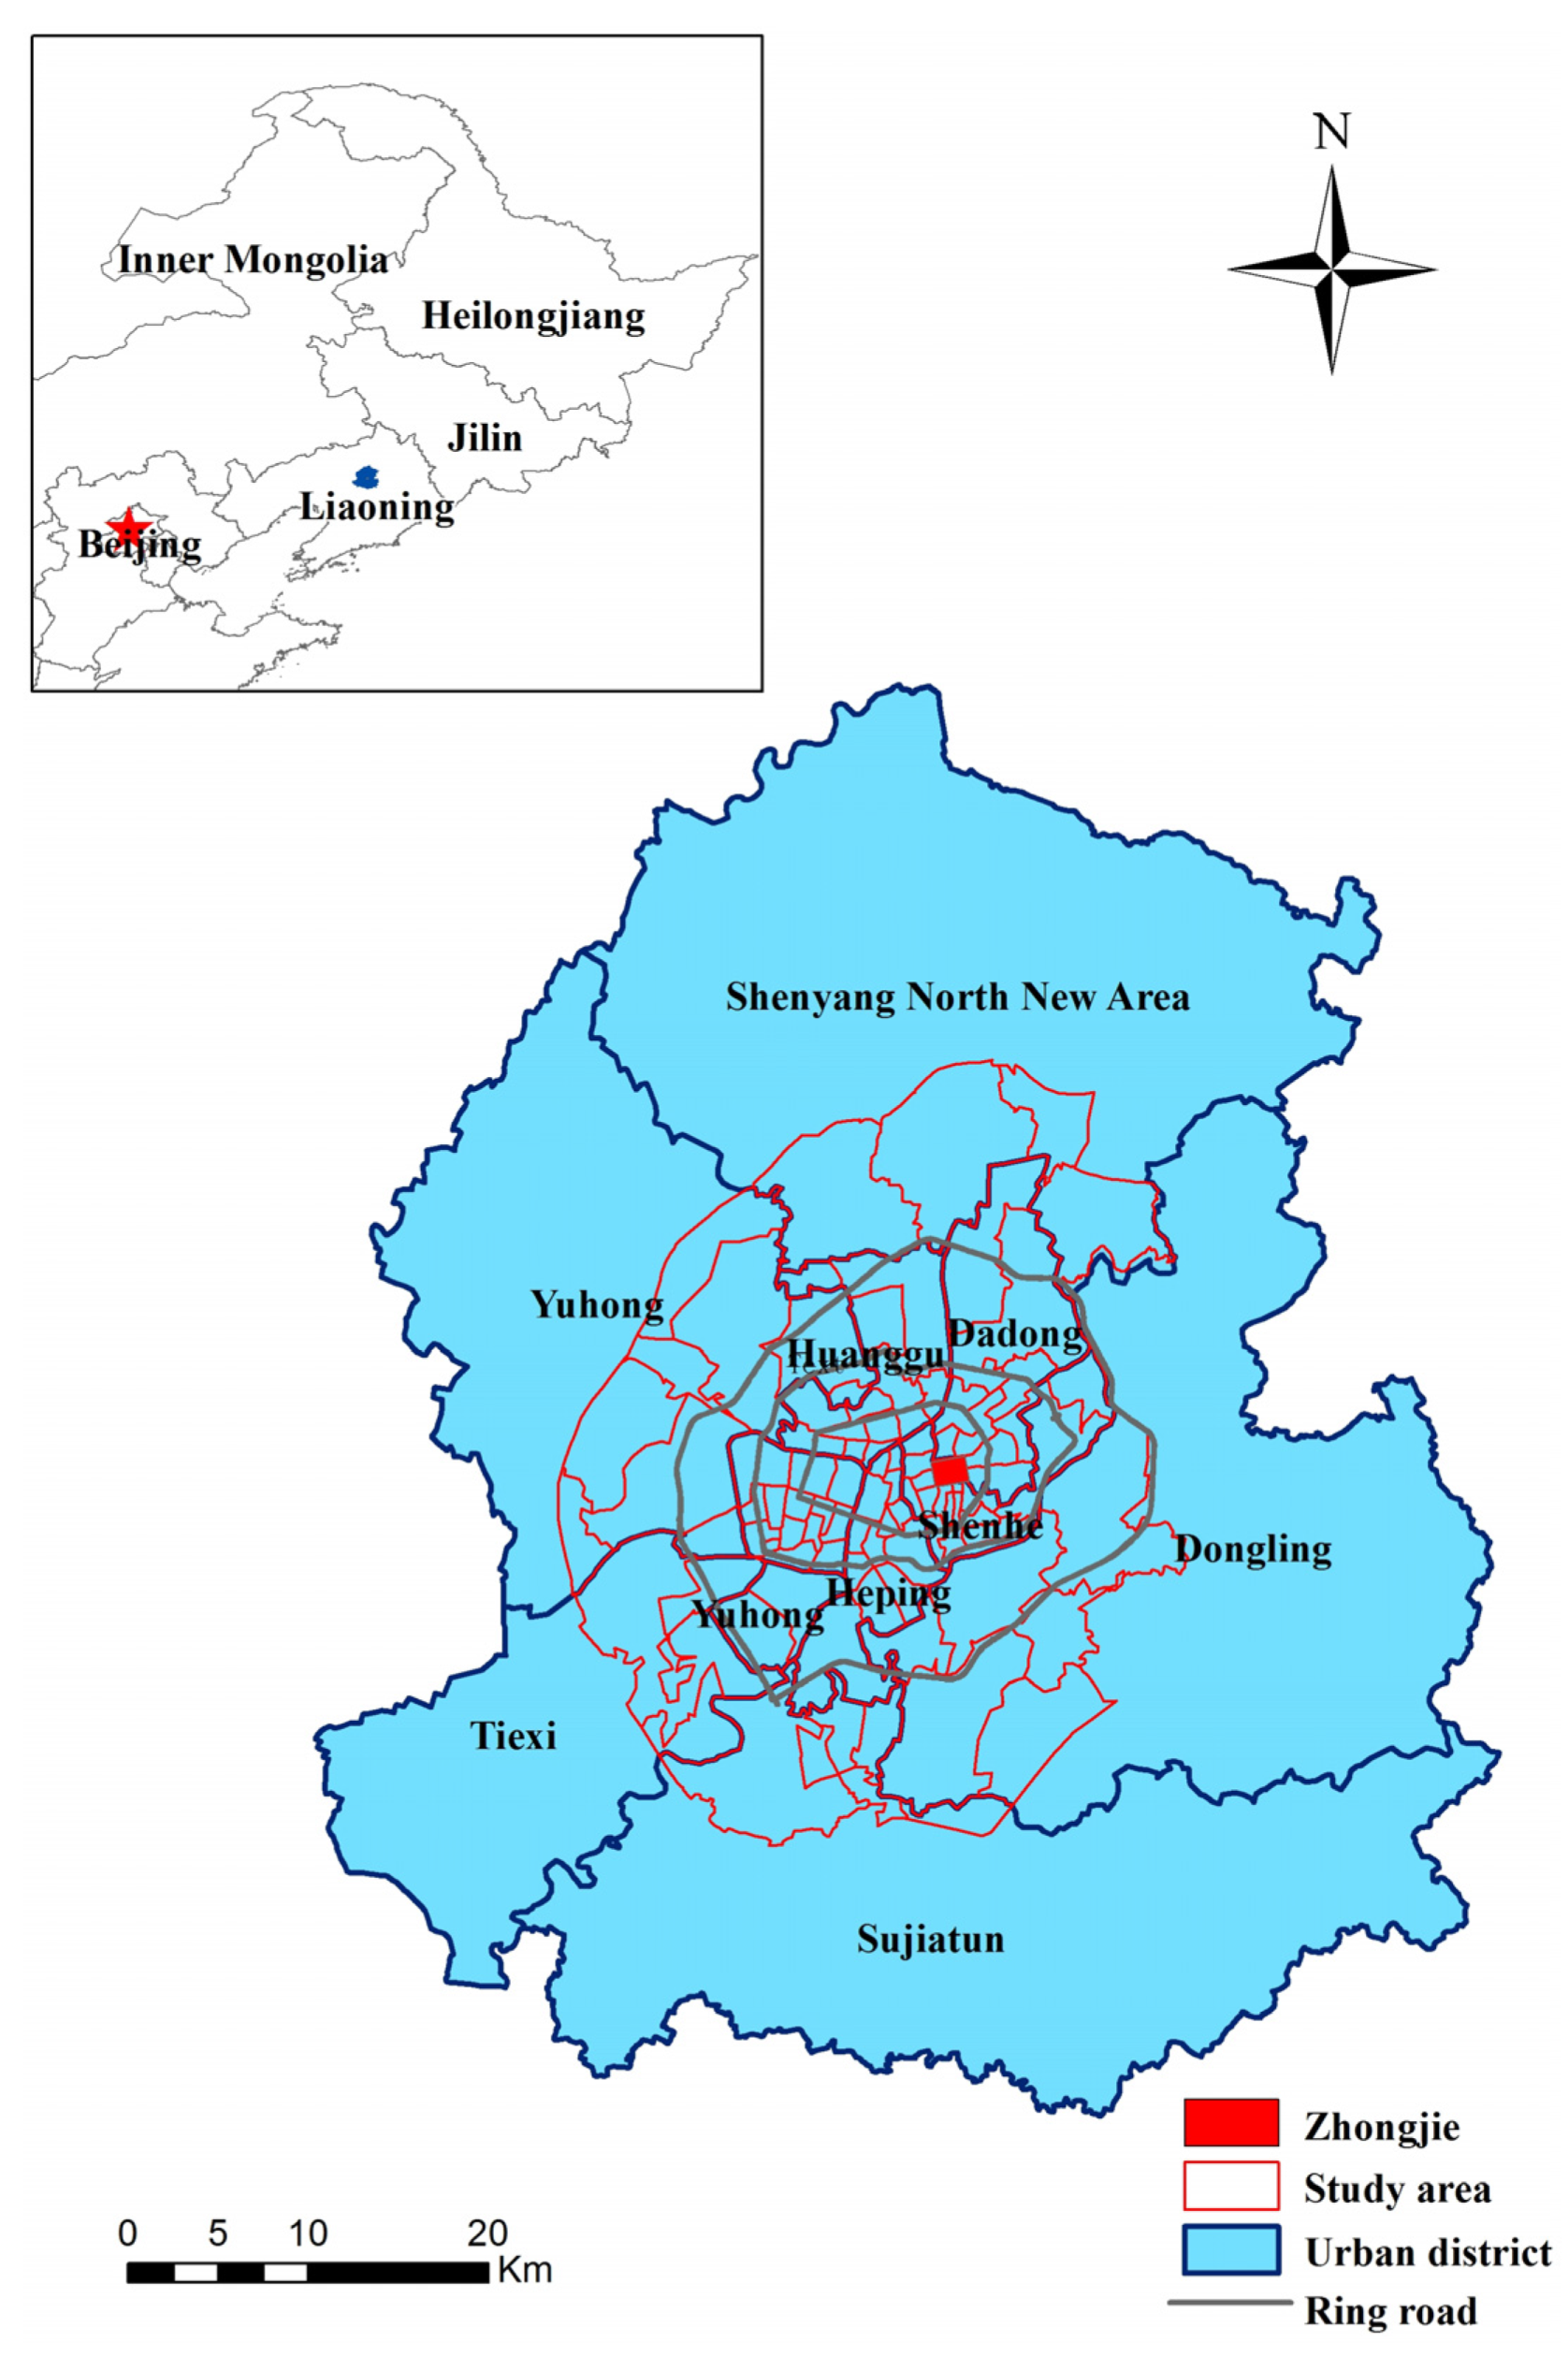
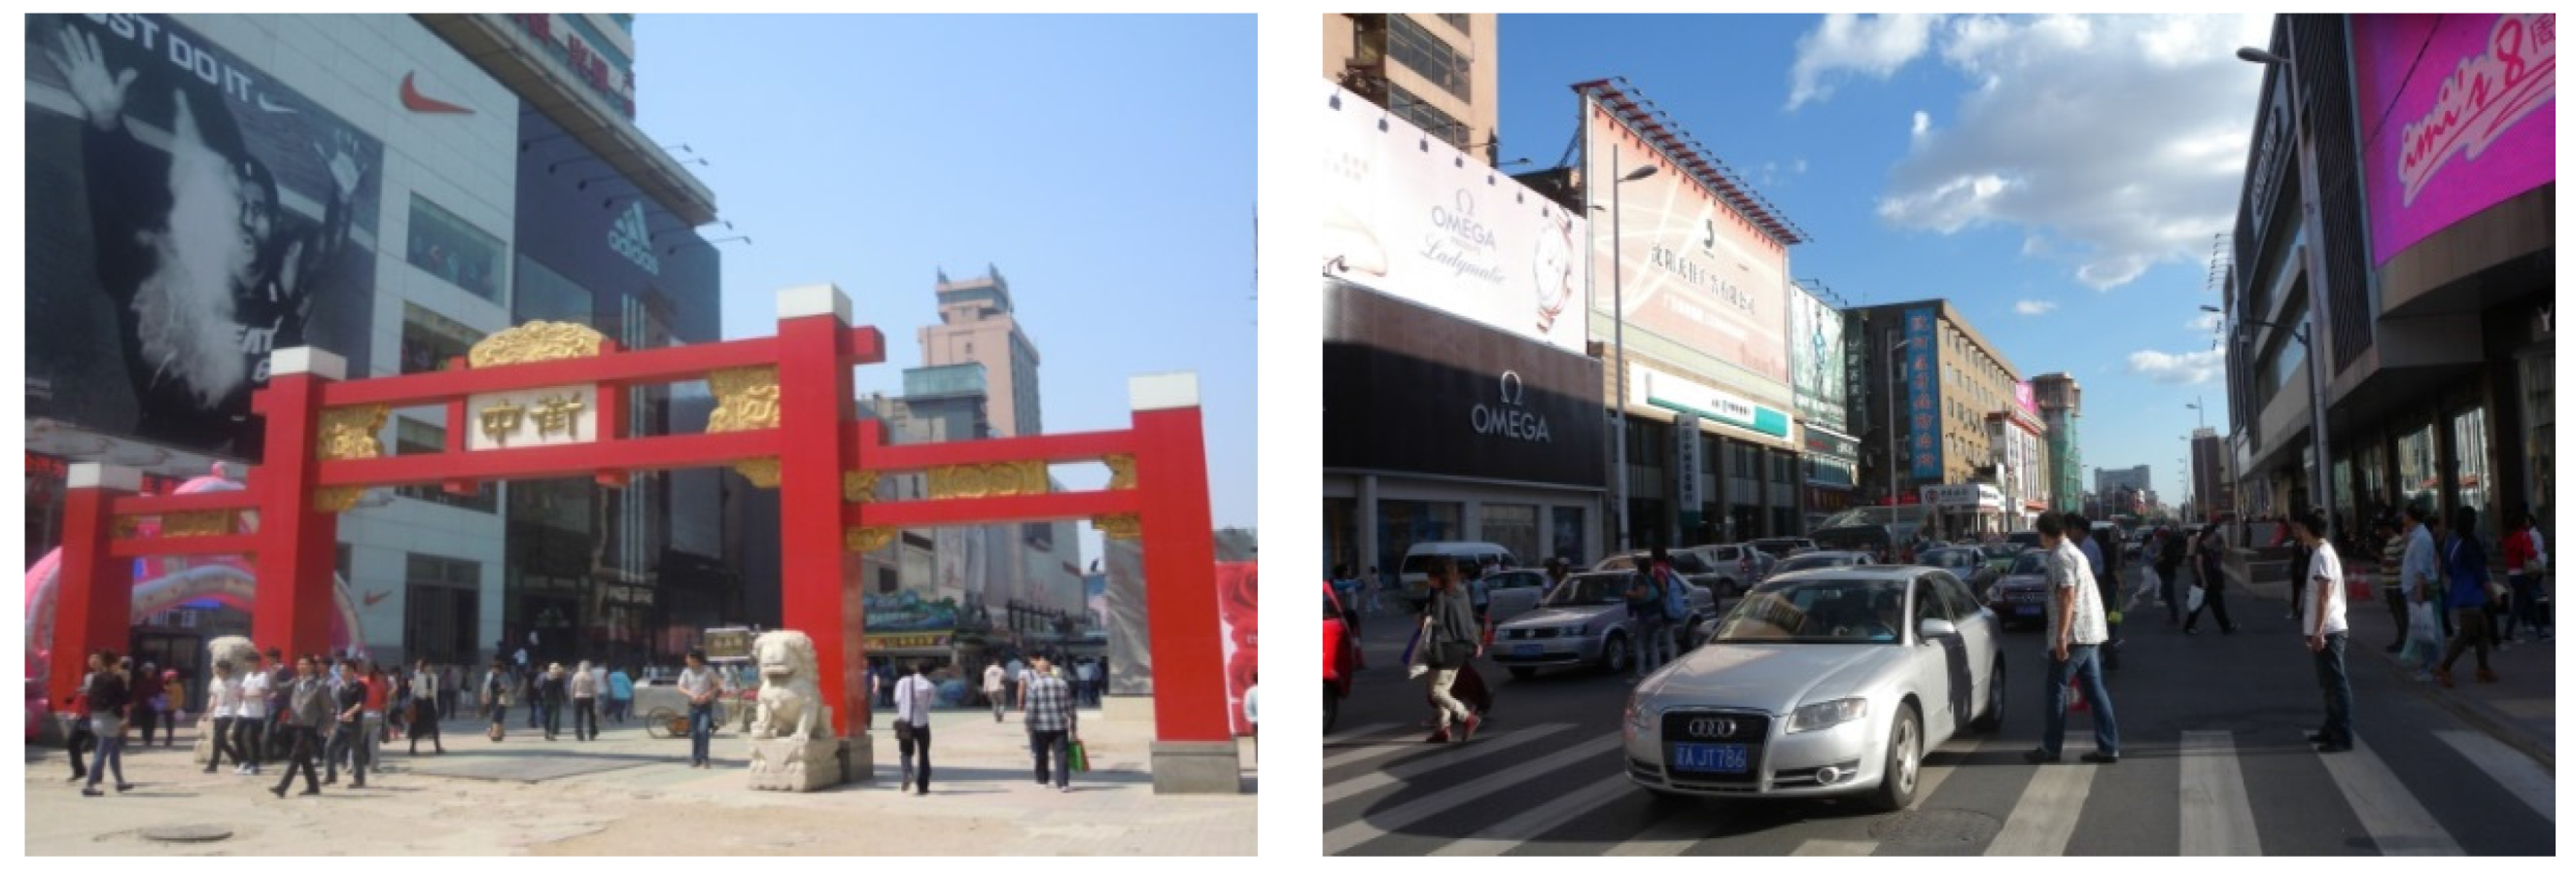
2.1. Zhongjie, Shenyang
2.2. Data Collection


2.3. Modeling
2.3.1. Optimal Path Analysis
2.3.2. Estimating Transport Carbon Emissions

| Classes | Modes | Emission intensity (g/person·km) |
|---|---|---|
| Minicar | Private car, Taxi, Official car | 135.0 |
| Motorbus | Bus, Shuttle bus, Tombus | 35.0 |
| Rail transit | Subway | 9.1 |
| Moped | Electric bike, Disability moped, Lightweight motorcycle | 8.0 |
| Others | Walk, Bicycle | 0.0 |
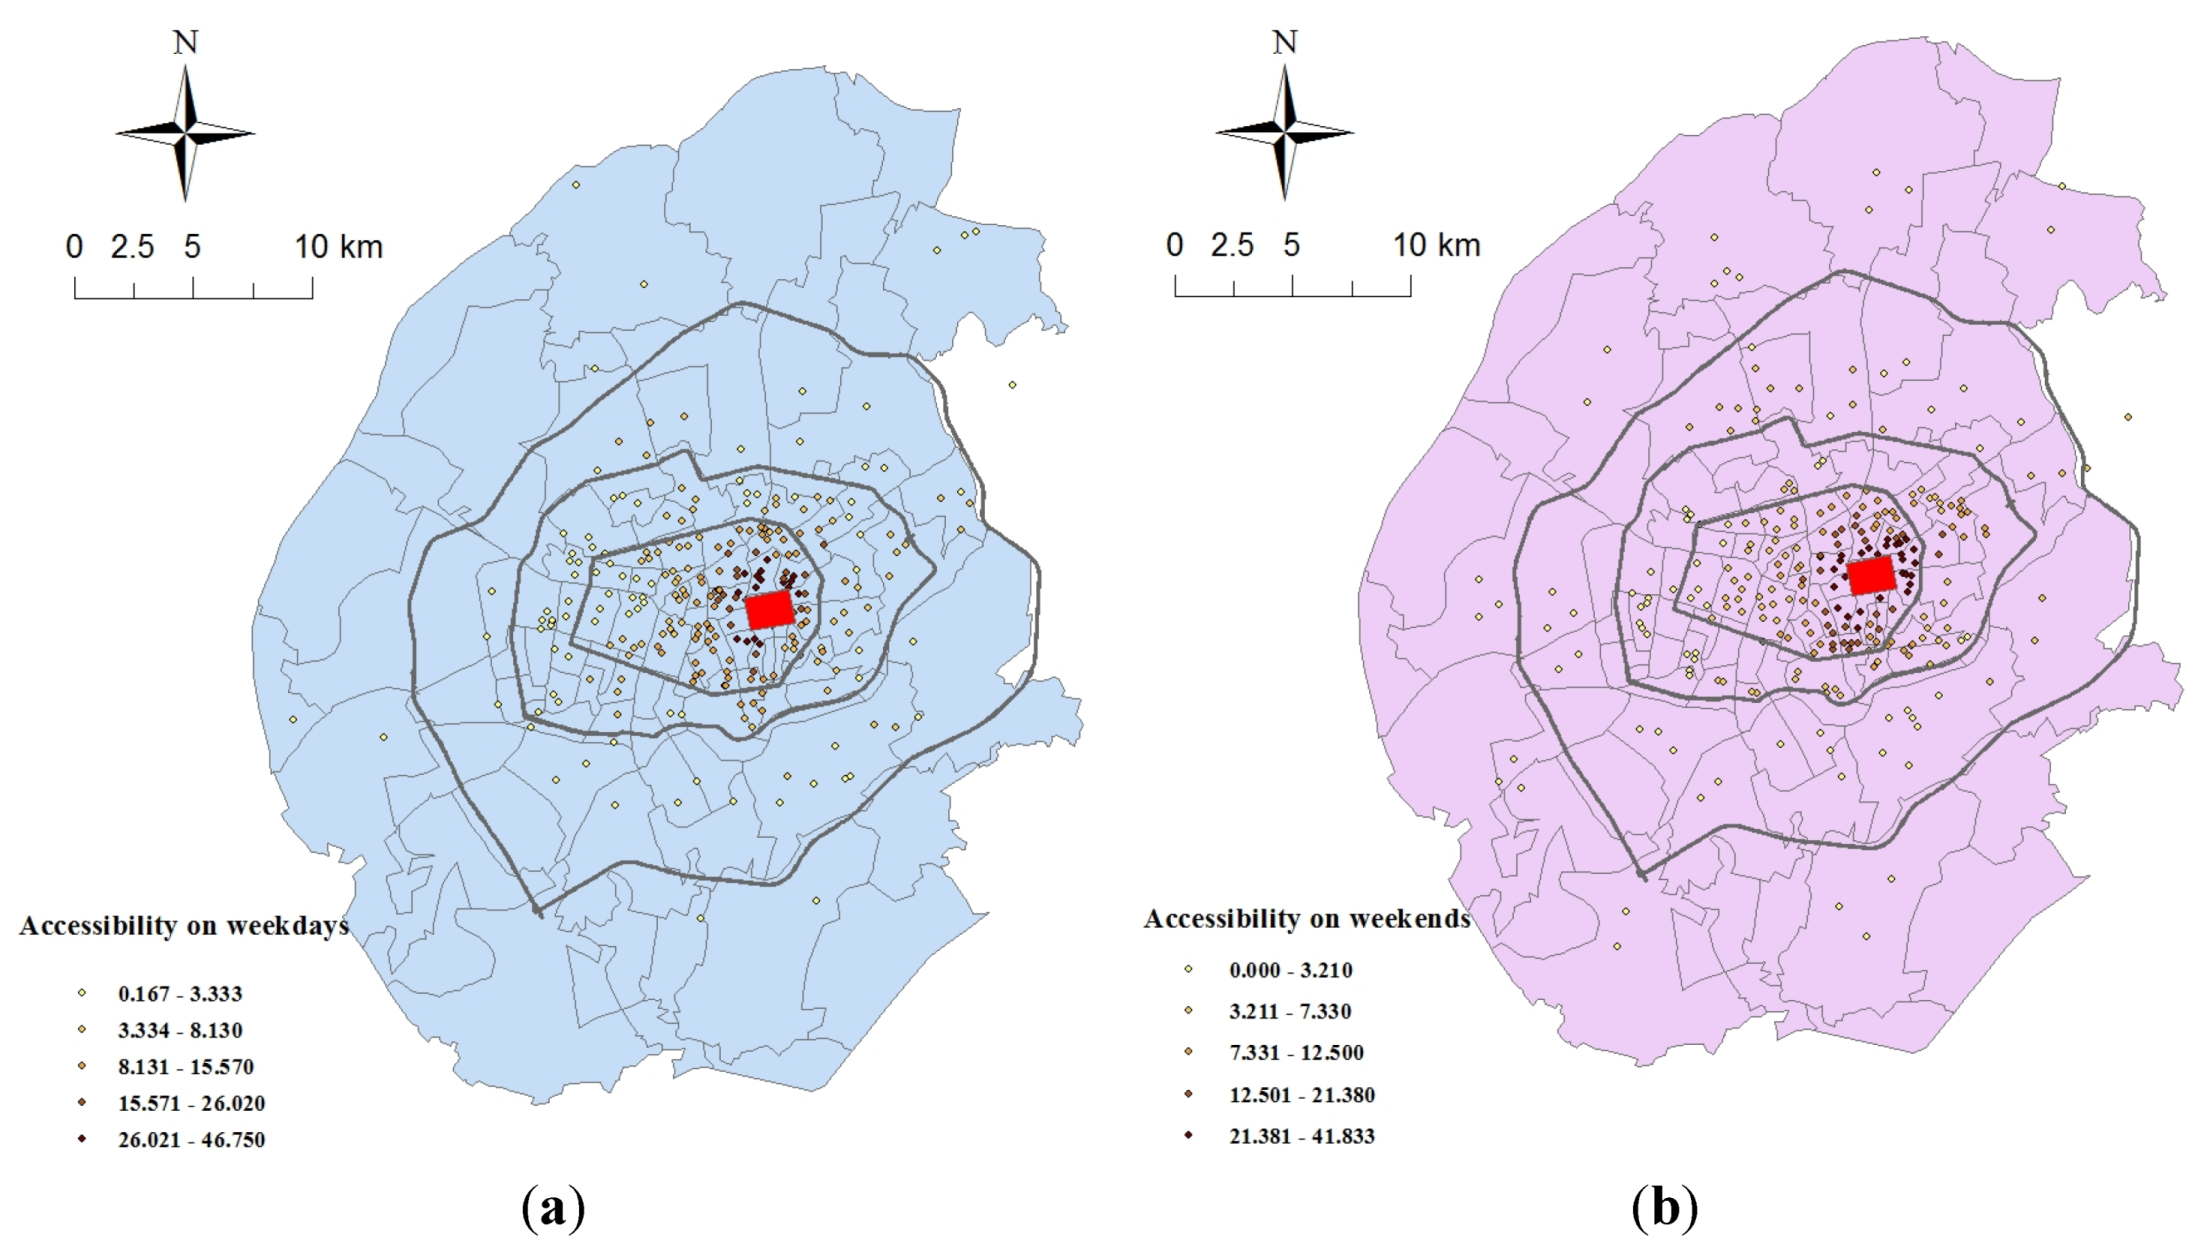
2.3.3. Access to Public Transport
3. Results
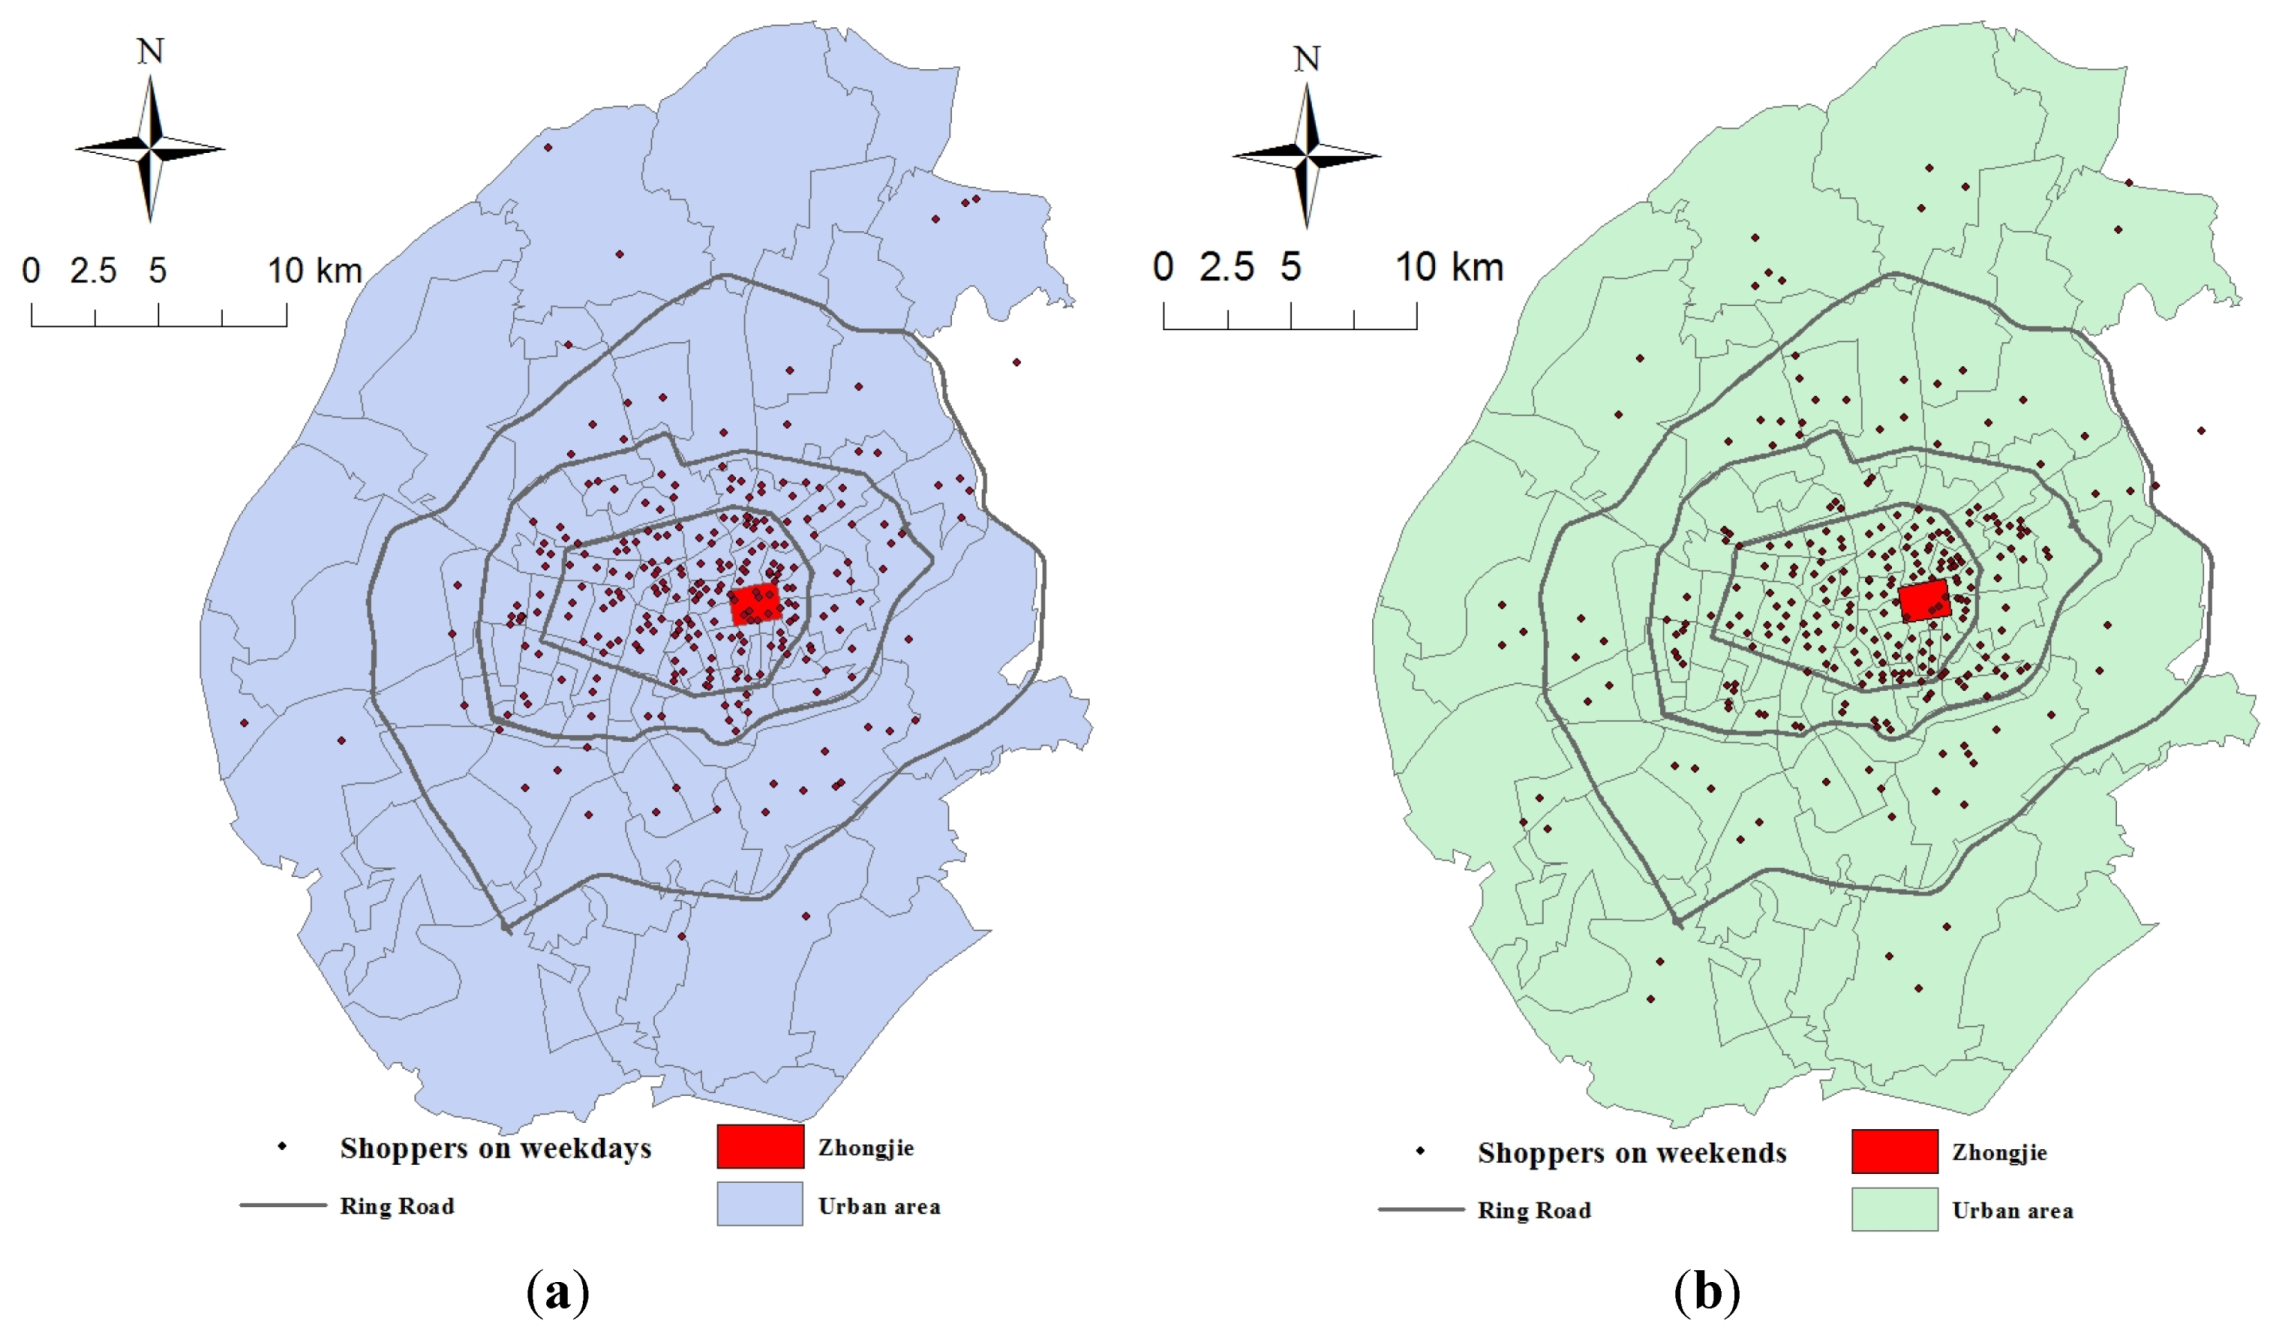
3.1. Characteristics of Shoppers

| Gender | Age group | Education | Occupation | Per capita monthly income |
|---|---|---|---|---|
| Male (31.2/35.7/25.7); Female (68.8/64.3/74.3) | ≤18 (4.6/5.3/3.8); 18–25 (38.4/26.0/53.8); 25–35 (37.6/39.7/34.9); 35–50 (11.0/16.0/4.7); 50–65 (8.0/12.2/2.8); ≥65 (0.4/0.8/0.0) | Below HS (15.2/17.6/12.1); HS (10.5/16.0/4.7); Undergraduate (68.4/61.8/75.7); Above Master (5.9/4.6/7.5) | GAPI (6.8/6.9/6.5); SHRI (16.9/9.2/26.2); Enterprise (41.8/46.2/36.5); Self-employed (9.3/8.5/10.3); Unemployed (7.6/7.7/7.5); Retirement (17.6/21.5/13.0) | <2000 (18.5/14.7/23.8); 2000–3000 (32.4/29.5/35.2); 3000–5000 (26.9/28.7/24.8); >5000 (22.2/27.1/16.2) |
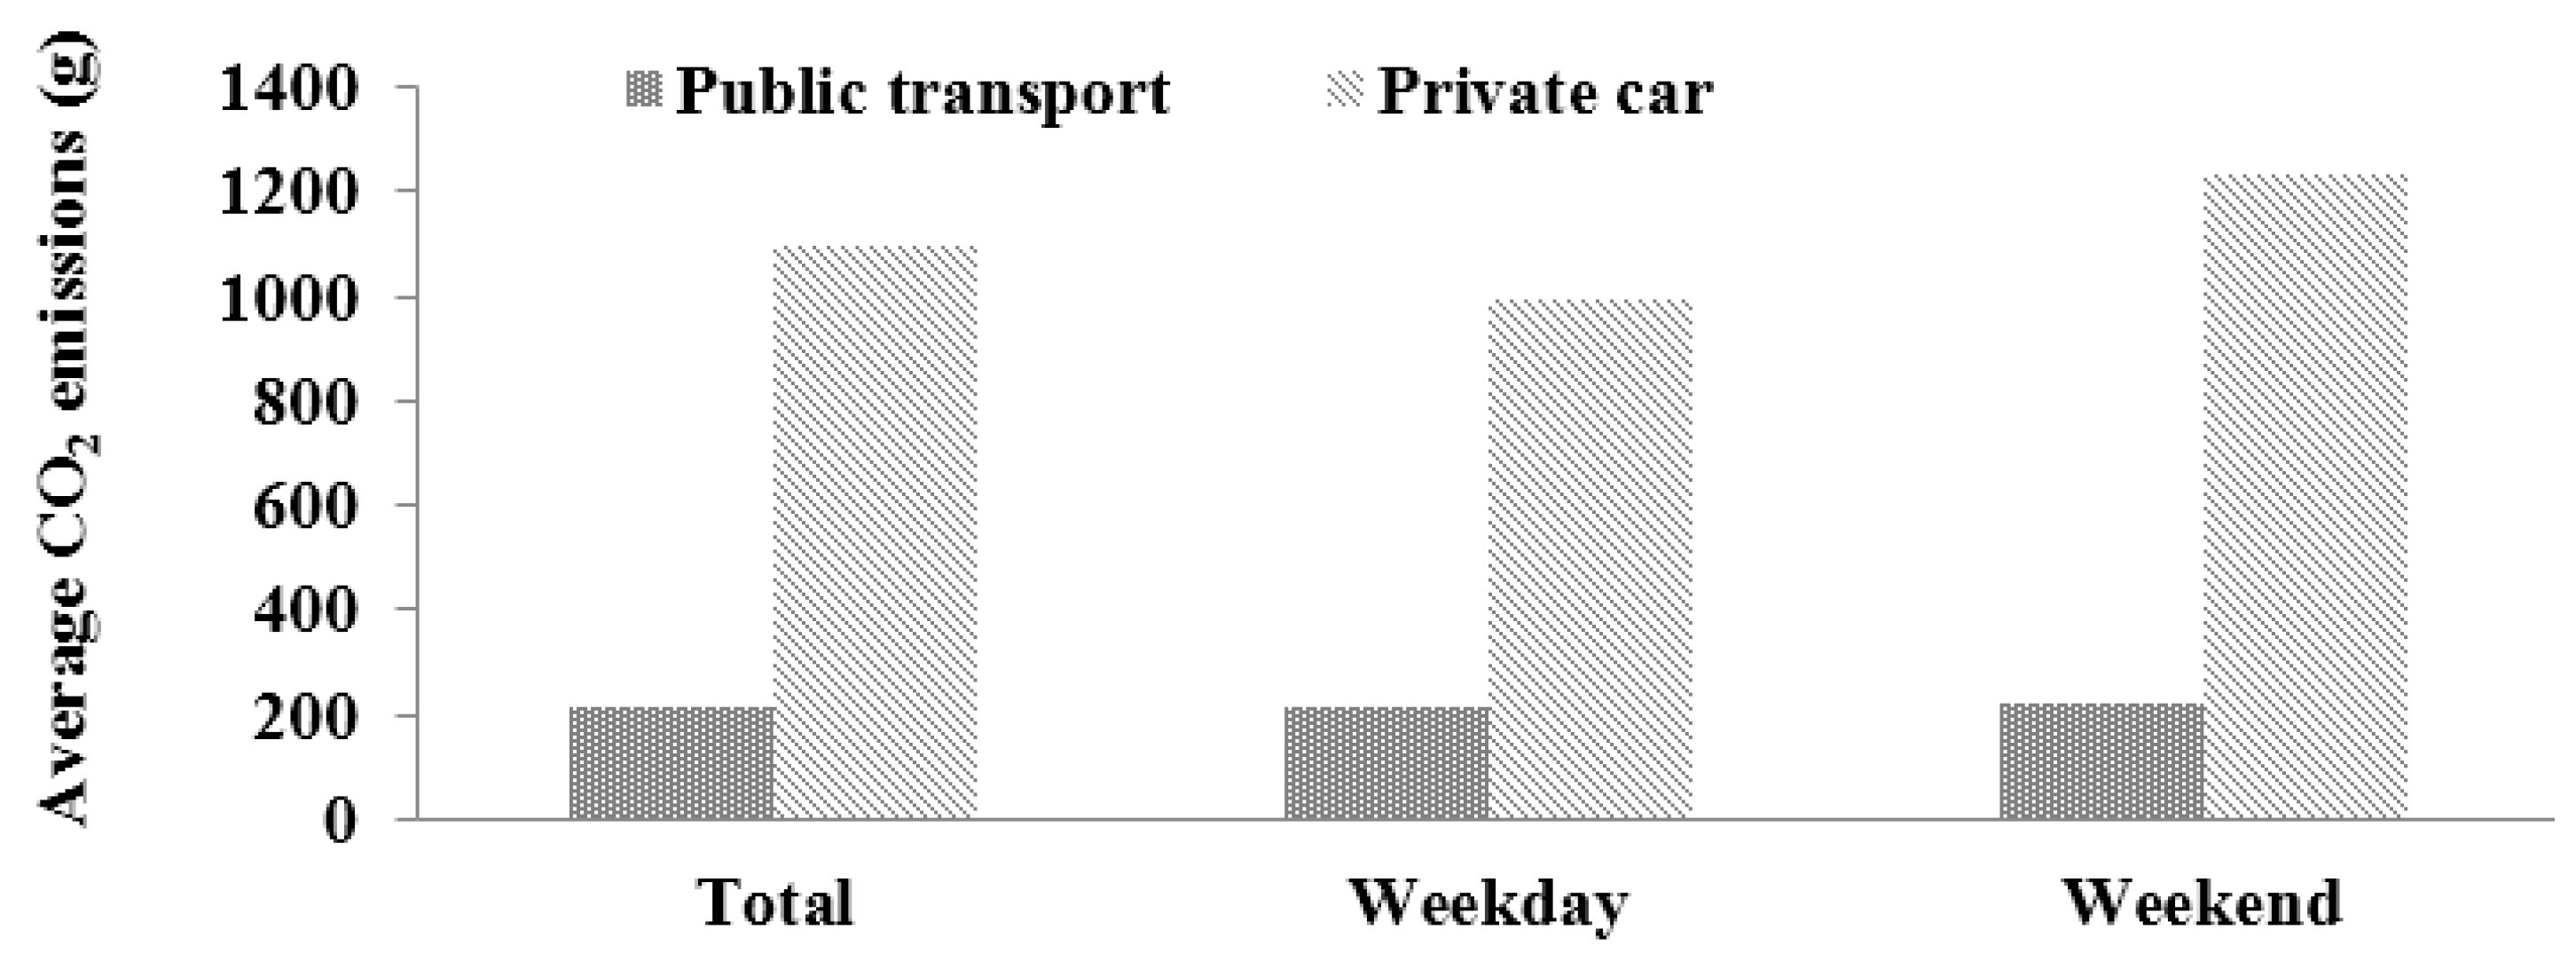
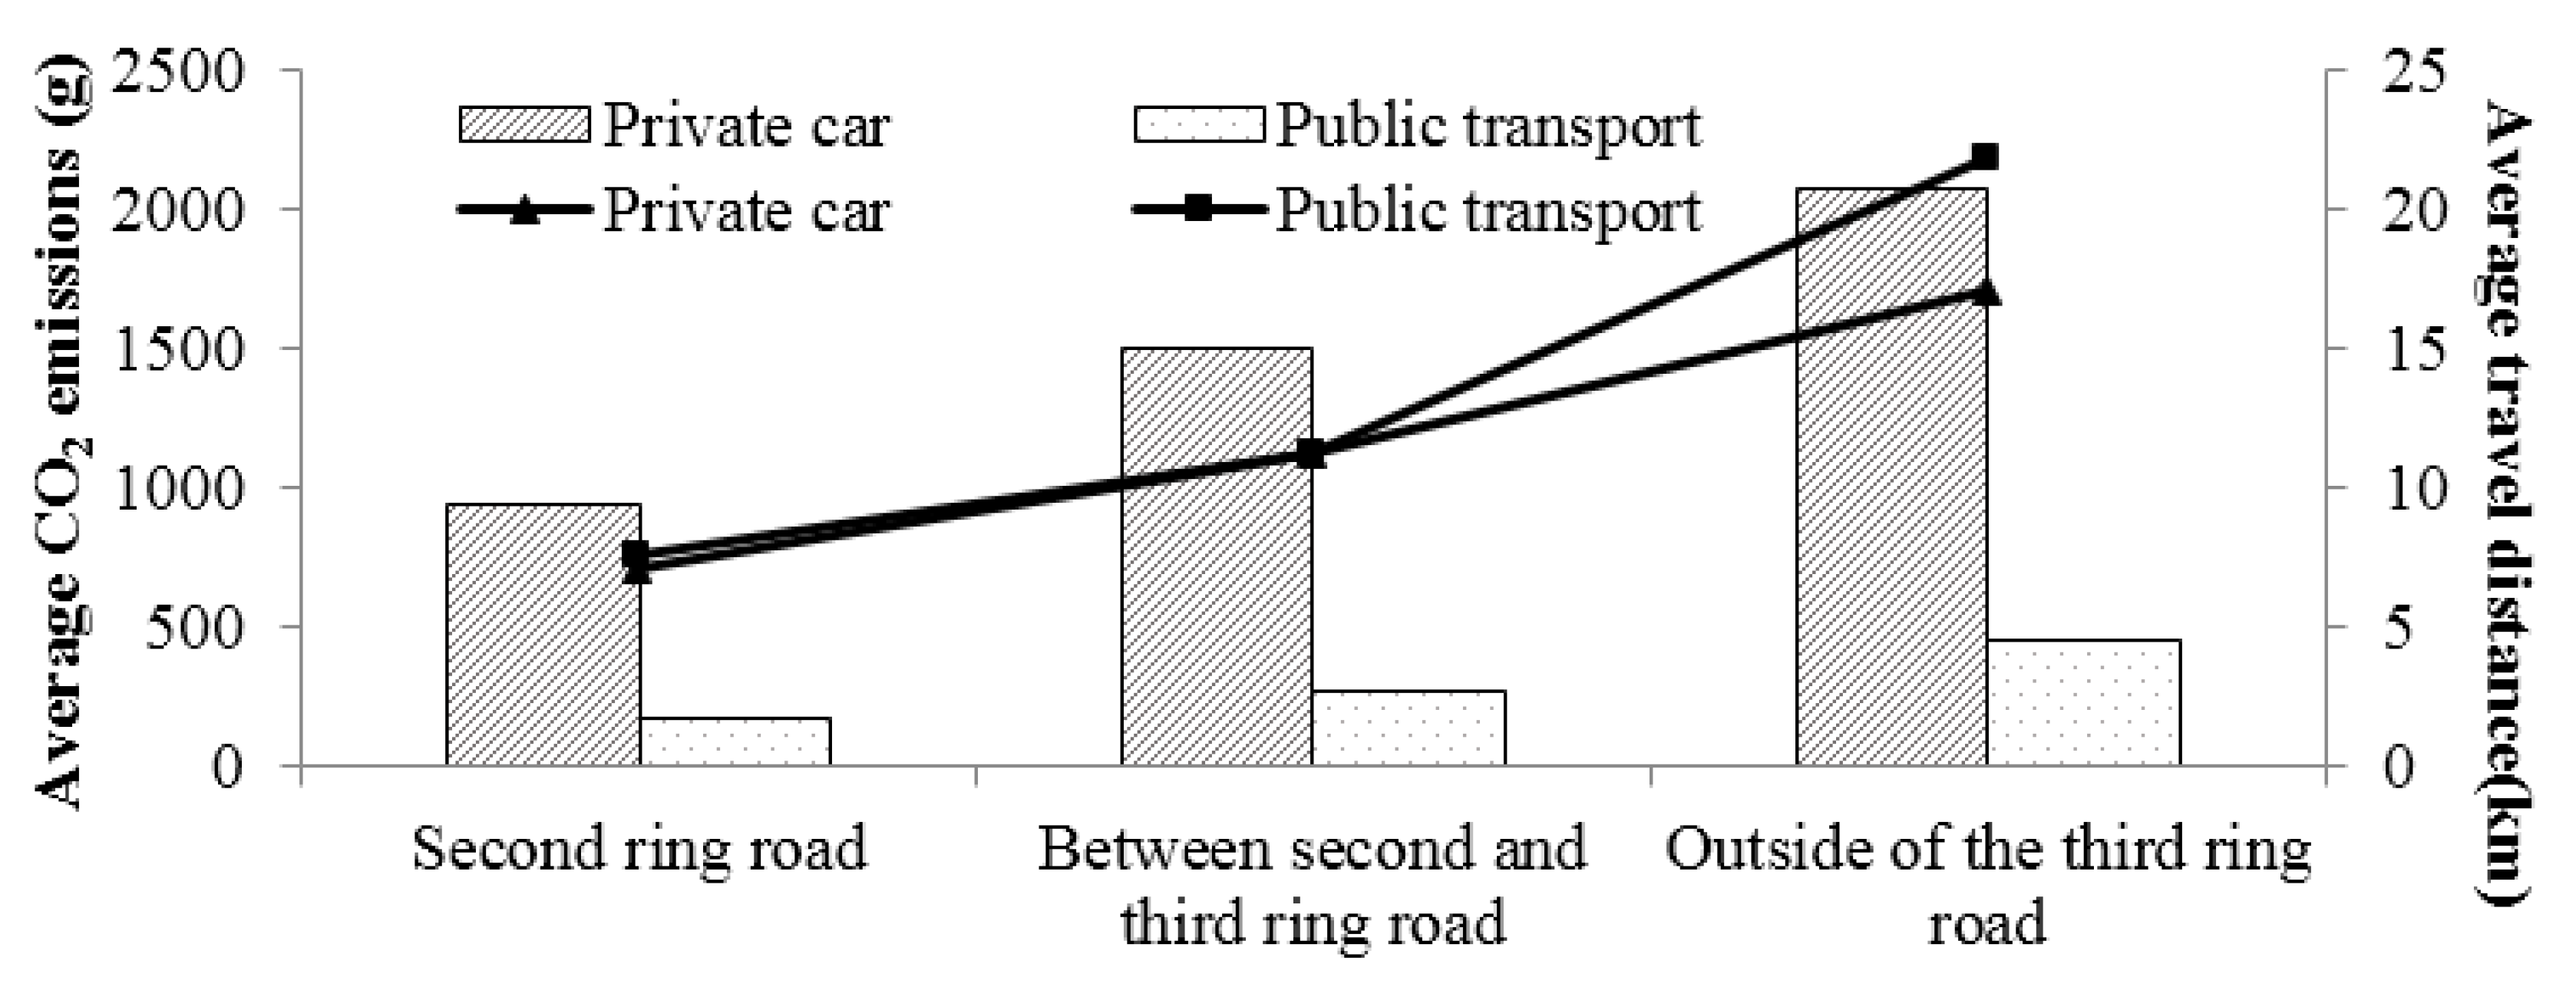
3.2. Measuring Carbon Emissions

3.3. Car Owners’ Transport Choice
| Access to public transport | Car ownership | Travel mode | ||
|---|---|---|---|---|
| Private car | Public transport | Walk | ||
| Very high | 8.7/5.1 | 50.0/0.0 | 0.0/0.0 | 50.0/100.0 |
| High | 2.2/7.7 | 100.0/0.0 | 0.0/66.7 | 0.0/33.3 |
| Medium | 21.7/23.1 | 30.0/22.3 | 70.0/44.4 | 0.0/33.3 |
| Low | 32.6/33.3 | 60.0/53.9 | 40.0/46.1 | 0.0/0.0 |
| Very low | 34.8/30.8 | 37.5/58.3 | 62.5/41.7 | 0.0/0.0 |
| Access to public transport | Travel mode | Characteristics | ||||
|---|---|---|---|---|---|---|
| Age group | Education | Occupation | Per Capita monthly income | Gender | ||
| High and very high | Private car | 25–35 (66.7) 35–50 (33.3) | Undergraduate (100.0) | GAPI (33.3) Enterprise (66.7) | 3000–5000 (33.3) >5000 (66.7) | Male (39.4) Female (60.6) |
| Public transport | 18–25 (50.0) 25–35 (50.0) | Below HS (50.0) Undergraduate (50.0) | Enterprise (100.0) | 2000–3000 (50.0) 3000–5000 (50.0) | Male (50.0) Female (50.0) | |
| Medium | Private car | 18–25 (33.3) 25–35 (66.7) | Undergraduate (66.7) Above Master (33.3) | Enterprise (66.7) Unemployed (33.3) | 3000–5000 (33.3) >5000 (66.7) | Male (45.2) Female (54.8) |
| Public transport | ≤18 (14.3) 25–35 (42.8) 35–50 (28.6) 50–65 (14.3) | HS (28.5) Undergraduate (42.9) Above Master (28.6) | GAPI (14.2) SHRI (28.6) Enterprise (28.6) Unemployed (14.3) Retirement (14.3) | < 2000 (14.3) 3000–5000 (14.3) >5000 (71.4) | Male (33.3) Female (66.7) | |
| Low and very low | Private car | 18–25 (6.7) 25–35 (33.3) 35–50 (53.3) 50–65 (6.7) | Below HS (26.7) HS (20.0) Undergraduate (53.3) | Enterprise (60.0) Self-employed (6.7) Unemployed (6.7) Retirement (26.6) | <2000 (6.7) 2000–3000 (20.0) 3000–5000 (20.0) >5000 (53.3) | Male (60.0) Female (40.0) |
| Public transport | 18–25 (18.7) 25–35 (56.3) 35–50 (12.5) 50–65 (12.5) | Below HS (6.2) HS (12.5) Undergraduate (75.0) Above Master (6.3) | GAPI (12.4) SHRI (6.2) Enterprise (56.3) Self-employed (12.5) Unemployed (6.3) Retirement (6.3) | 2000–3000 (25.0) 3000–5000 (43.8) >5000 (31.2) | Male (37.5) Female (62.5) | |
| Access to public transport | Travel mode | Characteristics | ||||
|---|---|---|---|---|---|---|
| Age group | Education | Occupation | Per capita monthly income | Gender | ||
| High and very high | Public transport | ≤18 (20.0) 18–25 (20.0) 25–35 (40.0) 50–65 (20.0) | Below HS (20.0) HS (20.0) Undergraduate (40.0) Above Master (20.0) | SHRI (60.0) Self-employed (20.0) Retirement (20.0) | 2000–3000 (20.0) 3000–5000 (40.0) >5000 (40.0) | Male (60.0) Female (40.0) |
| Medium | Private car | 25–35 (50.0) 50–65 (50.0) | Below HS (50.0) HS (50.0) | Enterprise (100.0) | 2000–3000 (50.0) 3000–5000 (50.0) | Male (55.3) Female (44.7) |
| Public transport | ≤18 (11.1) 18–25 (61.1) 25–35 (16.7) 35–50 (11.1) | Below HS (11.1) HS (5.6) Undergraduate (72.2) Above Master (11.1) | SHRI (44.3) Enterprise (27. 8) Self-employed (16. 7) Unemployed (5.6) Retirement (5.6) | <2000 (11.1) 2000–3000 (16. 7) 3000–5000 (50.0) >5000 (22.2) | Male (22.2) Female (77.8) | |
| Low and very low | Private car | 18–25 (7.1) 25–35 (78.6) 35–50 (14.3) | Below HS (7.1) Undergraduate (78.6) Above Master (14.3) | GAPI (14.4) SHRI (7.1) Enterprise (57.1) Self-employed (21.4) | 2000–3000 (15.3) 3000–5000 (38.5) >5000 (46.2) | Male (64.9) Female (35.1) |
| Public transport | ≤18 (18.2) 18–25 (54.6) 25–35 (9.0) 35–50 (18.2) | Below HS (18.2) HS (9.1) Undergraduate (63.6) Above Master (9.1) | SHRI (36.3) Enterprise (27.3) Self-employed (18.2) Unemployed (9.1) Retirement (9.1) | <2000 (18.2) 2000–3000 (18.2) 3000–5000 (63.6) | Male (27.3) Female (72.7) | |
4. Discussion and Conclusions
Acknowledgements
Author Contributions
Conflicts of Interest
References
- Banister, D. Cities, mobility and climate change. J. Transp. Geogr. 2011, 19, 1538–1546. [Google Scholar] [CrossRef]
- Mu, R.; Jong, M.D. Establishing the conditions for effective transit-oriented development in China: The case of Dalian. J. Transp. Geogr. 2012, 24, 234–249. [Google Scholar] [CrossRef]
- Darido, G.; Torres-Montoya, M.; Mehndiratta, S. Urban transport and CO2 emissions: Some evidence from Chinese cities. Wiley Interdiscip. Rev. Energy Environ. 2014, 3, 122–155. [Google Scholar] [CrossRef]
- Meng, X. China’s urban billion: The story behind the biggest migration in human history. Int. Commun. 2013, 343, 138–139. [Google Scholar]
- Townsend, C.; Zacharias, J. Built environment and pedestrian behavior at rail rapid transit stations in Bangkok. Transportation 2009, 37, 317–330. [Google Scholar] [CrossRef]
- Mishalani, R.G.; Goel, P.K.; Westra, A.M.; Landgraf, A.J. Modeling the relationships among urban passenger travel carbon dioxide emissions, transportation demand and supply, population density, and proxy policy variables. Transp. Res. D Transp. Environ. 2014, 33, 146–154. [Google Scholar] [CrossRef]
- Zhang, M. Exploring the relationship between urban form and nonwork travel through time use analysis. Landsc. Urban Plan. 2005, 73, 244–261. [Google Scholar] [CrossRef]
- Yeates, M.; Montgomery, D. The changing commercial structure of non-metropolitan urban centres and vacancy rates. Can. Geogr. 1999, 43, 382–399. [Google Scholar] [CrossRef]
- Liu, Y.; Yue, W.; Fan, P.; Song, Y. Suburban residential development in the era of market-oriented land reform: The case of Hangzhou, China. Land Use Policy 2015, 42, 233–243. [Google Scholar] [CrossRef]
- Zhou, Y.; Logan, J.R. Growth on the edge: The new chinese metropolis. Urban China Transit. 2008, 140–160. [Google Scholar]
- Meng, M.; Koh, P.; Wong, Y.; Zhong, Y. Influences of urban characteristics on cycling: Experiences of four cities. Sustain. Cities Soc. 2014, 13, 78–88. [Google Scholar] [CrossRef]
- Gu, J. The governance structure of apartment owner committee and its organizational framework. In Annual Report on Community Development of China; Yu, Y.Y., Ed.; Social Science Academic Press: Beijing, China, 2009. [Google Scholar]
- Schenk, T.A.; Löffler, G.; Rauh, J. Agent-based simulation of consumer behavior in grocery shopping on a regional level. J. Bus. Res. 2007, 60, 894–903. [Google Scholar] [CrossRef]
- Bose, R.K. Urban transport scenarios in South Asia: Energy and environmental impact of enhanced public transport systems. Transp. Res. Rec. 2007, 2011, 116–126. [Google Scholar] [CrossRef]
- Gomi, K.; Shimada, K.; Matsuoka, Y. A low-carbon scenario creation method for a local-scale economy and its application in Kyoto city. Energy Policy 2010, 38, 4783–4796. [Google Scholar] [CrossRef]
- Fan, Y.; Khattak, A.J. Does urban form matter in solo and joint activity engagement? Landsc. Urban Plan. 2009, 92, 199–209. [Google Scholar] [CrossRef]
- Niedzielski, M.A.; Horner, M.W.; Xiao, N. Analyzing scale independence in jobs-housing and commute efficiency metrics. Transp. Res. A Policy Pract. 2013, 58, 129–143. [Google Scholar] [CrossRef]
- Hickman, R.; Ashiru, O.; Banister, D. Transitions to low carbon transport futures: Strategic conversations from London and Delhi. J. Transp. Geogr. 2011, 19, 1553–1562. [Google Scholar] [CrossRef]
- Kyrö, R.; Heinonen, J.; Säynäjoki, A.; Junnila, S. Assessing the potential of climate change mitigation actions in three different city types in Finland. Sustainability 2012, 4, 1510–1524. [Google Scholar] [CrossRef]
- Cervero, R.; Kockelman, K. Travel demand and the 3ds: Density, diversity, and design. Transp. Res. D Transp. Environ. 1997, 2, 199–219. [Google Scholar] [CrossRef]
- Lo, K. Urban carbon governance and the transition toward low-carbon urbanism: Review of a global phenomenon. Carbon Manag. 2014, 1–15. [Google Scholar] [CrossRef]
- Waygood, E.; Sun, Y.; Susilo, Y.O. Transportation carbon dioxide emissions by built environment and family lifecycle: Case study of the Osaka metropolitan area. Transp. Res. D Transp. Environ. 2014, 31, 176–188. [Google Scholar] [CrossRef]
- Doi, K. Multiagent land-use and transport model for the policy evaluation of a compact city. Environ. Plan. B Plan. Des. 2005, 32, 485–504. [Google Scholar]
- Stead, D. Relationships between land use, socioeconomic factors, and travel patterns in Britain. Environ. Plan. B 2001, 28, 499–528. [Google Scholar] [CrossRef]
- Hickman, R. Reducing Travel by Design: A Micro Analysis of New Household Location and the Commute to Work in Surrey; University of London: London, UK, 2007. [Google Scholar]
- Yang, D.; Timmermans, H. Effects of urban spatial form on individuals’ footprints: Empirical study based on personal GPS panel data from Rotterdam and Eindhoven area. Procedia Environ. Sci. 2014, 22, 169–177. [Google Scholar] [CrossRef]
- Lee-Gosselin, M.; Thériault, M.; Savard-Duquet, N.; Miranda-Moreno, L.F.; Barla, P. Disaggregated empirical analysis of determinants of urban travel greenhouse gas emissions. Transp. Res. Rec. J. Transp. Res. Board 2010, 2156, 160–169. [Google Scholar]
- Chai, Y.; Ta, N. Progress in space-time behavior research in China. Prog. Geogr. 2013, 32, 1362–1373. [Google Scholar]
- Jia, T.; Carling, K.; Håkansson, J. Trips and their CO2 emissions to and from a shopping center. J. Transp. Geogr. 2013, 33, 135–145. [Google Scholar] [CrossRef]
- Sánchez-Torrubia, M.G.; Torres-Blanc, C.; López-Martínez, M.A. Pathfinder: A visualization emathteacher for actively learning Dijkstra’s algorithm. Electron. Notes Theor. Comput. Sci. 2009, 224, 151–158. [Google Scholar] [CrossRef]
- Wu, C.-H.; Chen, L.-C. 3D spatial information for fire-fighting search and rescue route analysis within buildings. Fire Saf. J. 2012, 48, 21–29. [Google Scholar] [CrossRef]
- Schipper, L.; Stokenberga, A. Trends in transport activity, energy use, and carbon footprint in Mexico City, Mexico. Transp. Res. Rec. J. Transp. Res. Board 2012, 2287, 105–112. [Google Scholar]
- Ou, J.; Liu, X.; Li, X.; Chen, Y. Quantifying the relationship between urban forms and carbon emissions using panel data analysis. Landsc. Ecol. 2013, 28, 1889–1907. [Google Scholar] [CrossRef]
- Prabhu, A.; Pai, M. Buses as low-carbon mobility solutions for urban India. Transp. Res. Rec. J. Transp. Res. Board 2012, 2317, 15–23. [Google Scholar] [CrossRef]
- Sobrino, N.; Monzon, A. Management of urban mobility to control climate change in cities in Spain. Transp. Res. Rec. J. Transp. Res. Board 2013, 2375, 55–61. [Google Scholar] [CrossRef]
- Carling, K.; Håkansson, J.; Jia, T. Out-of-town shopping and its induced CO2-emissions. J. Retail. Consum. Serv. 2013, 20, 382–388. [Google Scholar] [CrossRef]
- Chai, Y.; Xiao, Z.; Liu, Z. Low-carbon optimization strategies based on CO2 emission mechanism of household daily travels: A case in Beijing. Geogr. Res. 2012, 31, 334–344. [Google Scholar]
- Ma, J.; Chai, Y.; Liu, Z. The mechanism of CO2 emissions from urban transport based on individuals’ travel behavior in Beijing. Acta Geogr. Sin. 2011, 66, 1023–1032. [Google Scholar]
- Ji, J.; Gao, X. Evaluating urban structure by modeling satisfaction towards public transportation. Acta Geogr. Sin. 2009, 64, 1477–1487. [Google Scholar]
- Bertaud, A.; Lefèvre, B.; Yuen, B. GHG emissions. Urban mobility and efficiency of urban morphology: A hypothesis. In Proceedings of the 5th Urban Research Symposium on Cities and Climate Change: Responding to an Urgent Agenda, Marseille, France, 28–30 June 2009; pp. 28–30.
- Limtanakool, N.; Dijst, M.; Schwanen, T. The influence of socioeconomic characteristics, land use and travel time considerations on mode choice for medium- and longer-distance trips. J. Transp. Geogr. 2006, 14, 327–341. [Google Scholar] [CrossRef]
- Baiocchi, G.; Minx, J.; Hubacek, K. The impact of social factors and consumer behavior on carbon dioxide emissions in the United Kingdom. J. Ind. Ecol. 2010, 14, 50–72. [Google Scholar] [CrossRef]
© 2015 by the authors; licensee MDPI, Basel, Switzerland. This article is an open access article distributed under the terms and conditions of the Creative Commons Attribution license (http://creativecommons.org/licenses/by/4.0/).
Share and Cite
Li, J.; Zhang, P.; Lo, K.; Guo, M.; Wang, M. Reducing Carbon Emissions from Shopping Trips: Evidence from China. Energies 2015, 8, 10043-10057. https://doi.org/10.3390/en80910043
Li J, Zhang P, Lo K, Guo M, Wang M. Reducing Carbon Emissions from Shopping Trips: Evidence from China. Energies. 2015; 8(9):10043-10057. https://doi.org/10.3390/en80910043
Chicago/Turabian StyleLi, Jing, Pingyu Zhang, Kevin Lo, Meng Guo, and Mark Wang. 2015. "Reducing Carbon Emissions from Shopping Trips: Evidence from China" Energies 8, no. 9: 10043-10057. https://doi.org/10.3390/en80910043