Article

Thermal System Analysis and Optimization of Large-Scale Compressed Air Energy Storage (CAES)

Key Laboratory of Condition Monitoring and Control for Power Plant Equipment, North China Electric Power University, Ministry of Education, Changping District, Beijing 102206, China
*
Author to whom correspondence should be addressed.
Energies 2015, 8(8), 8873-8886; https://doi.org/10.3390/en8088873
Submission received: 24 June 2015 / Revised: 17 August 2015 / Accepted: 17 August 2015 / Published: 21 August 2015

Abstract

:
As an important solution to issues regarding peak load and renewable energy resources on grids, large-scale compressed air energy storage (CAES) power generation technology has recently become a popular research topic in the area of large-scale industrial energy storage. At present, the combination of high-expansion ratio turbines with advanced gas turbine technology is an important breakthrough in energy storage technology. In this study, a new gas turbine power generation system is coupled with current CAES technology. Moreover, a thermodynamic cycle system is optimized by calculating for the parameters of a thermodynamic system. Results show that the thermal efficiency of the new system increases by at least 5% over that of the existing system.

1. Introduction

The problem of electric power supply shortages has recently been alleviated somewhat with the accelerated pace of global power construction. This shortage has restricted economic development and long-term residential electricity use levels. Nonetheless, electricity cannot be stored on a large scale; power must be generated instantly as needed. A peak-valley difference in electricity is observed on the user side of a power grid, which requires the power supply to change with electricity load. Figure 1 shows the typical daily load curve of a region and highlights the peak and valley on the user side.
Figure 1. Typical daily load curve.
Energies 08 08873 g001
The peak load capacity on the power generation side cannot meet cities’ increasing electricity load demands. The pressure of regulating the peak of the main power grid has increased with the growth of the proportion of residential electricity consumption, as well as the increased use of air conditioners and popular household appliances [1].
Moreover, the utilization of renewable sources, such as solar energy and wind energy, has been associated with a large-scale power grid problems given its intermittence, randomness, and instability; these sources limit grid stability and security [2,3]. Due to the presence of various obstacles, much of the electricity generated by renewable energy power plants cannot connect to the power grid. This problem induces to the phenomena of “abandoned wind” and “abandoned solar energy”, which waste much renewable energy and investment [4].
Compressed air energy storage (CAES) is a large-scale industrial energy storage system that stores the energy generated at one time via compressed air. This energy can then be used in another situation. At a utility scale, the energy generated during periods of low-energy demand (off-peak) can be released to meet high-demand (peak load) periods. The study of energy storage can therefore promote the development of the current power grid.
Currently, the main problem of the CAES power plants is that high-pressure compressed air energy is not fully utilized, which is due to the limit of the inlet pressure of gas turbines. The purpose of this paper is to improve the energy efficiency of CAES system, by improving the thermodynamic system, optimizing parameters of the thermodynamic system, for the fuller use of compressed air energy [5].

2. Technical Principles, Analysis, and Optimization of Compressed Air Energy Storage

As depicted in Figure 2, a CAES power plant consists of an energy storage system and an energy release system. The energy storage system uses air compressors to store energy by converting electric energy into the pressure energy of compressed air when the amount of generated energy is greater than the needs of the power grid. The energy release system later releases energy from compressed air in the form of electricity to the power grid when the grid side has a high demand [6,7,8]. In an actual runtime, one to two expanders and combustions are set up in a CAES power plant, such as the McIntosh Power Plant. A regenerator can be used to maximize the heat of the turbine exhaust [9].
Figure 2. Compressed air energy storage (CAES) power generation system.
Energies 08 08873 g002
Two CAES power plants operate commercially: the Huntorf Power Plant, which was operationalized in Germany in 1978, and the Mcintosh Power Station, which began operating in the United States in 1991 [10,11]. In the 1990s, Japan committed to the building a 35 MW experimental CAES power plant that was eventually operationalized in 1997. Other countries, such as Israel, Finland, Great Britain, and Italy, also plan to conduct feasibility studies and demonstration projects related to such an initiative. Since the first CAES patent was published in 1949, two generations of CAES plants have been developed. An outstanding feature of the advanced, second-generation CAES system is that the storage system applies high pressure and the release system employs advanced gas turbines to generate electricity [12,13,14,15]. The energy conversion factor can exceed 50%.

2.1. Characteristics of a Compressed Air Energy Storage Thermal System

A CAES generation system has the following features [16,17,18,19]:
  • Compression pressure is high. The pressure of air that is compressed by the compressor and stored in the gas storage device can exceed 100 bar.
  • Storage temperature in the gas-storing devices is low. At present, most gas storage devices are located in underground caves at room and even lower temperatures.
  • Storage air pressure decreases linearly with the consumption of compressed air during power generation.
Based on these characteristics, the Brayton Cycle can therefore be optimized and efficiency can be improved further.

2.2. Analysis and Improvement of a Compressed Air Energy Storage Thermal System

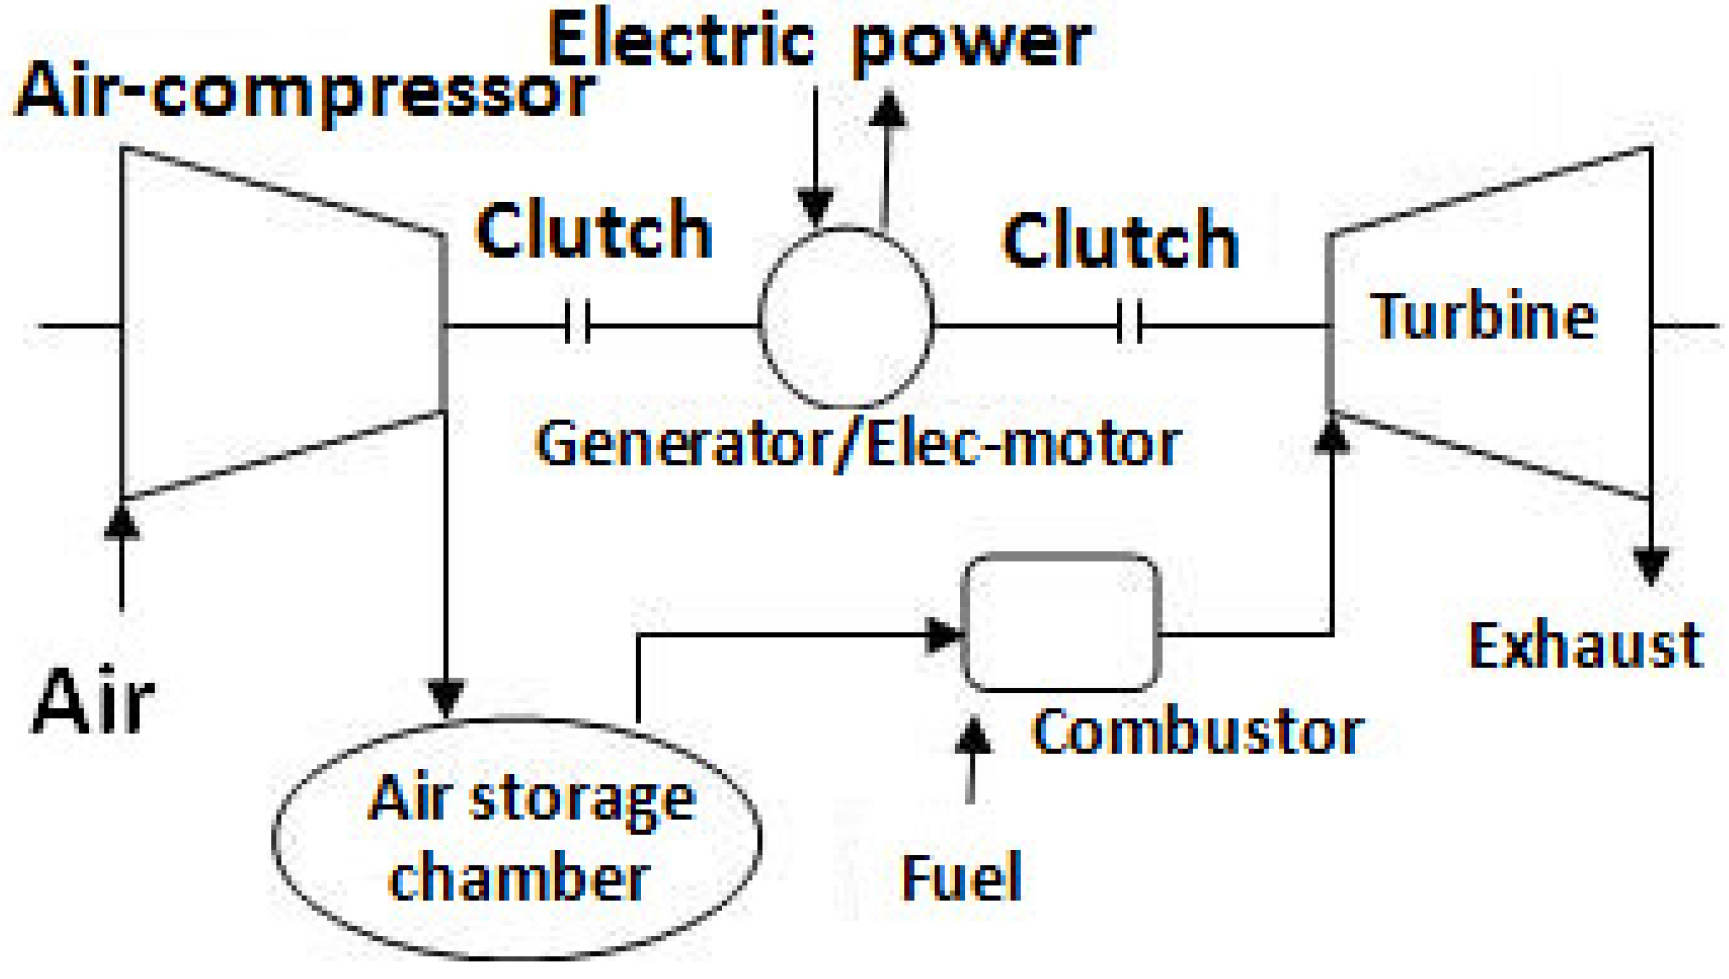
2.2.1. Thermal System Calculation and Analysis of a Second-Generation Compressed Air Energy Storage Power System

If the use of an air expander in the energy release system of a CAES power plant defines the first-generation CAES systems, then the utilization of an entire gas turbine as the energy release system characterizes the second-generation CAES systems. This enhancement significantly increases the energy transformation efficiency of the second-generation systems over that of the first-generation systems.
A schematic of the second-generation CAES power system is illustrated in Figure 3.
Figure 3. Schematic of the second-generation CAES power system.
Energies 08 08873 g003
A thermodynamic model is built for the system using the software Aspen Plus with the PENG-ROB property method. The initial isentropic efficiency of the compressor and the turbine is 0.88, and the initial mechanical efficiency of these components is 0.99. Both isentropic and mechanical efficiencies decrease, and the rate of decrease rises with pressure. The gas turbine combustor is assumed to be adiabatic and exerts a constant pressure. The difference in the terminal temperature of the heat exchanger ranges between 10–15 °C. The fuel is a natural gas composed of 97.6% methane, 0.62% ethane, 0.41% propane, 0.21% butane, 0.01% pentane, 0.05% hexane, 0.65% carbon dioxide, and 0.45% nitrogen. The ratio of C/H is 3.95. For convenient modeling analysis, the system does not consider blade cooling. The systems are compared and analyzed on the basis of theoretical aspects. The results are presented as Table 1.
Table 1. Simulation results of the second-generation compressed air energy storage (CAES) system.
ParametersGas pressureFlow Rate of AirPressure Ratio of a Gas TurbineInlet Temperature of a TurbineExhaust Temperature
Values100 bar600 kg/s15.41300 °C383.4 °C
The second-generation system can be used as the reference system, and the improved system is compared with this system to reduce the effect of selecting the calculation methods and the physical parameters that comprise the calculation results.
The results are as follows:
  • When the pressure of the compressed air is high (above 100 bar), the exhaust temperature of the expander decreases if high-pressure energy is utilized further although air temperature increases after heat regeneration. Thus, expander efficiency is reduced.
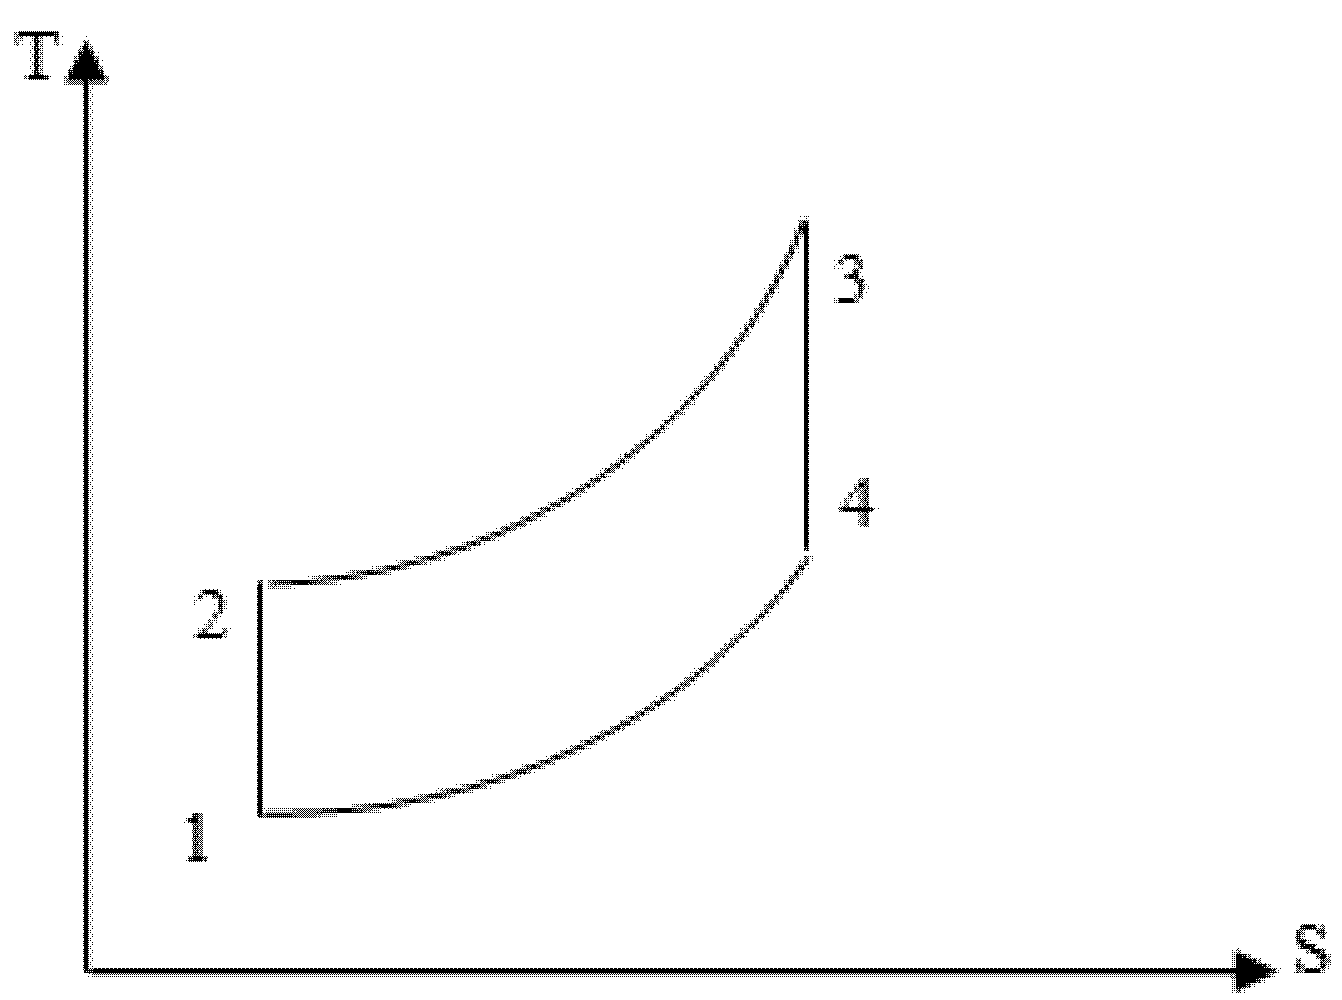
  • In the release system, the gas turbine circle belongs to the simple Brayton cycle. An efficient gas turbine and system can be generated by optimizing this cycle.

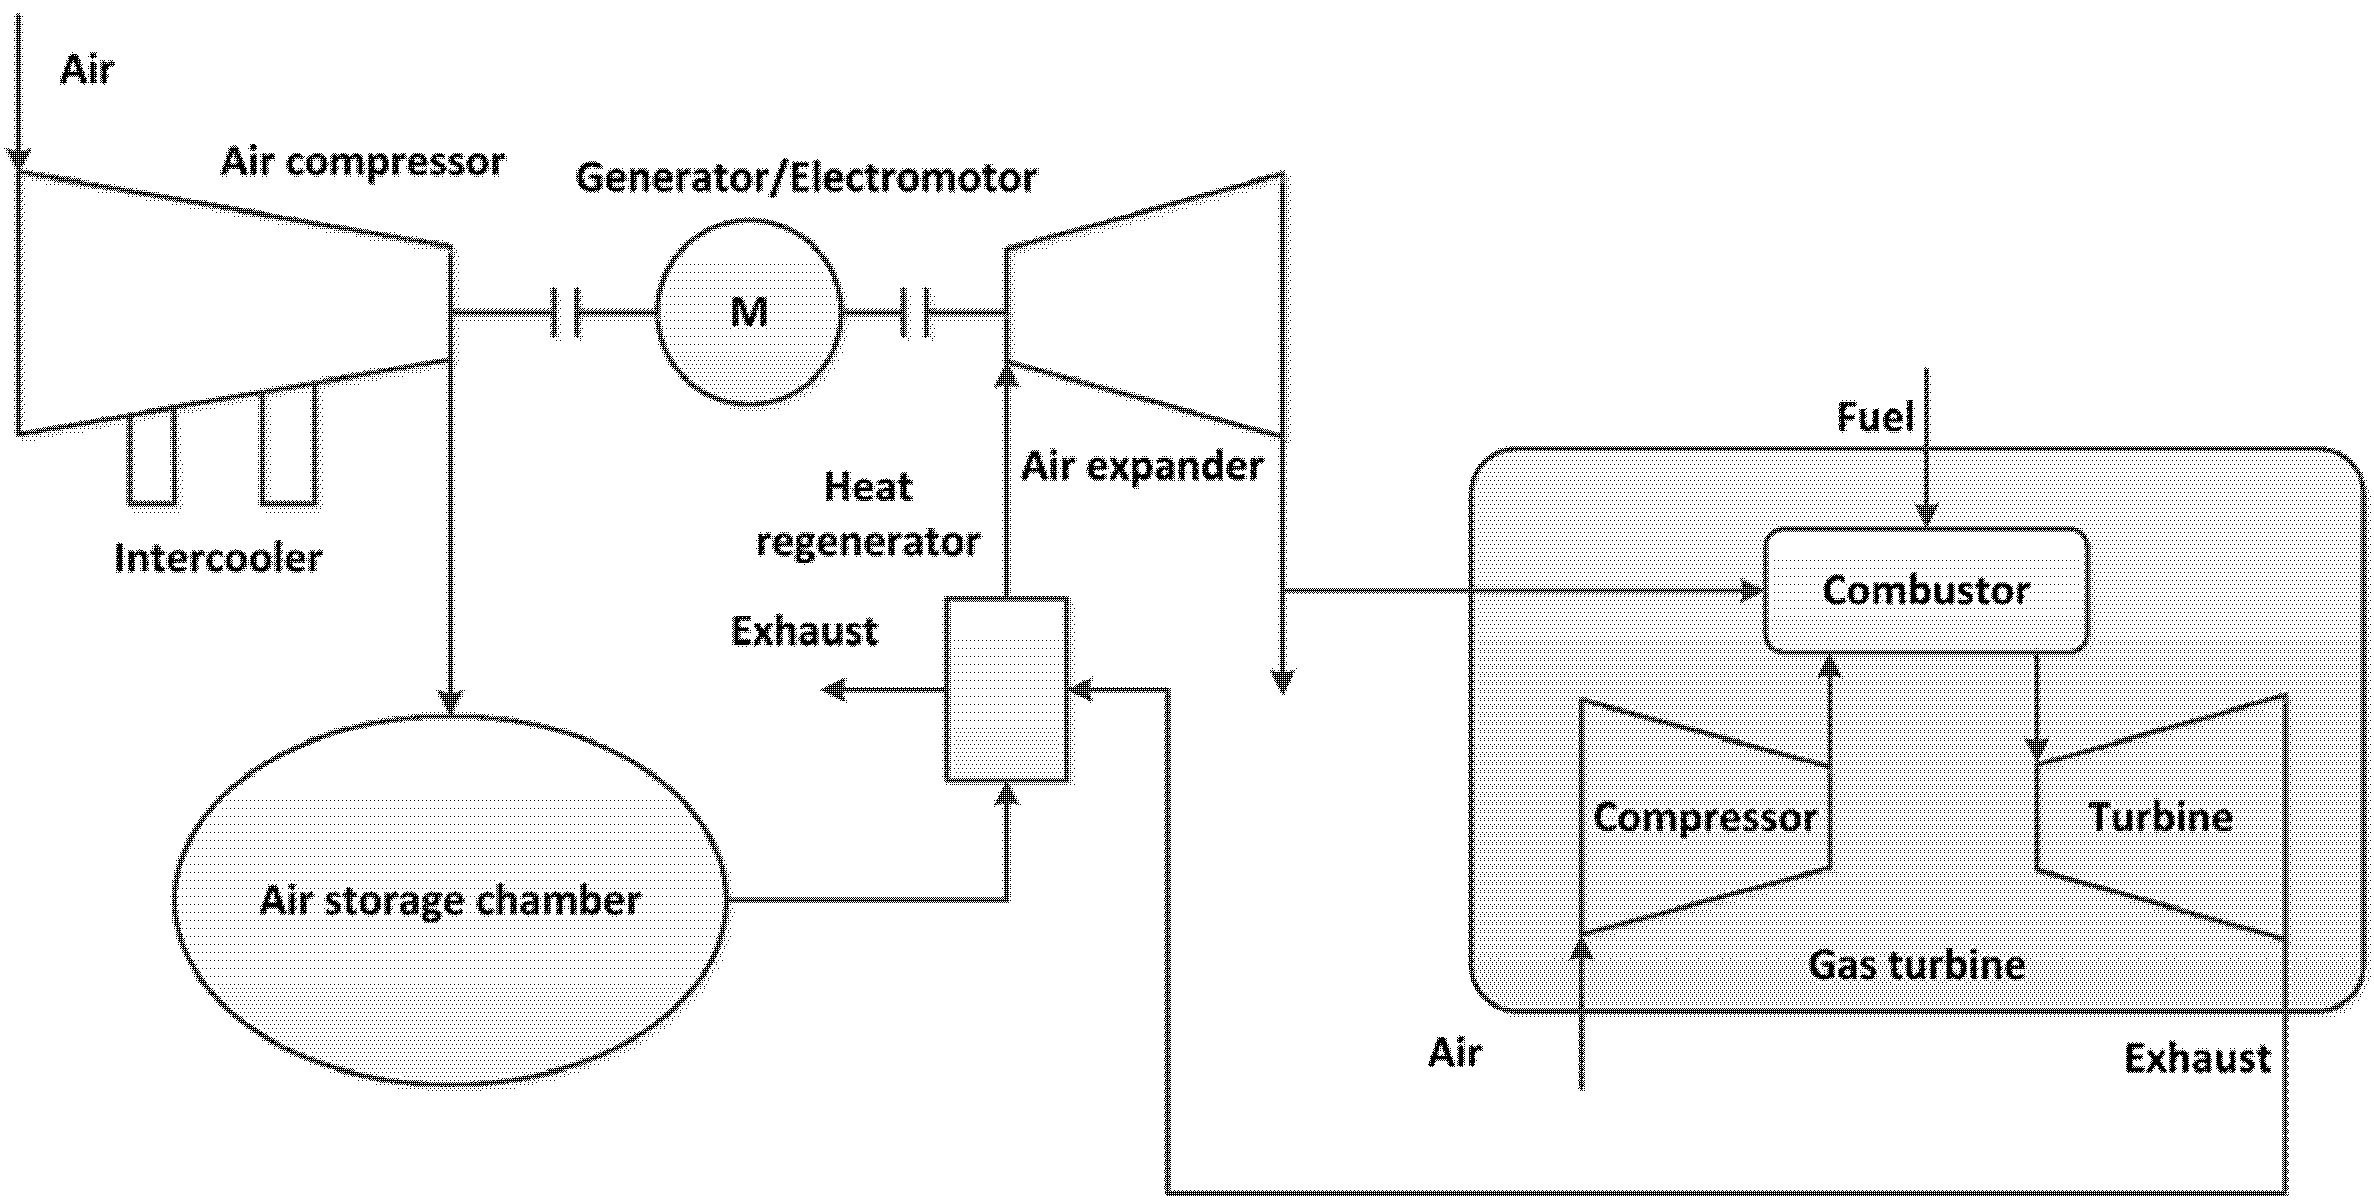
2.2.2. Improvement and Optimization of the Thermodynamic Cycle of a System

(1) Use of a new type of high-pressure reheat gas turbine

The pressure of the air originating from the air storage chamber is too high. Thus, air must be expanded to attain an ordinary pressure and flow into the combustion chamber for the turbine to operate effectively. This new system adopts a new type of high-pressure reheat gas turbine that uses high-pressure energy, and the values of the gas parameters increase.
In addition, the new type gas turbine includes a “reheat” process. This process is characterized by splitting the combustion process into two stages that are separated by an expansion to an intermediate pressure level. In this process, energy is added part way through the expansion process, thus resulting in high gas turbine efficiency and high power density.
The reheating process can raise the average heat absorption temperature, thus enhancing system efficiency. Figure 4 shows the T-S (Temperature-Entropy) chart of the common Brayton cycle, whereas Figure 5 indicates the temperature-entropy chart of the reheat Brayton cycle. The average heat absorption temperature of the reheat Brayton cycle is higher than that of the previous cycle, as is efficiency. Hence, overall efficiency improves.
Figure 4. T-S (Temperature-Entropy) chart of the Brayton cycle.
Energies 08 08873 g004
Figure 5. T-S chart of the reheat Brayton cycle.
Energies 08 08873 g005

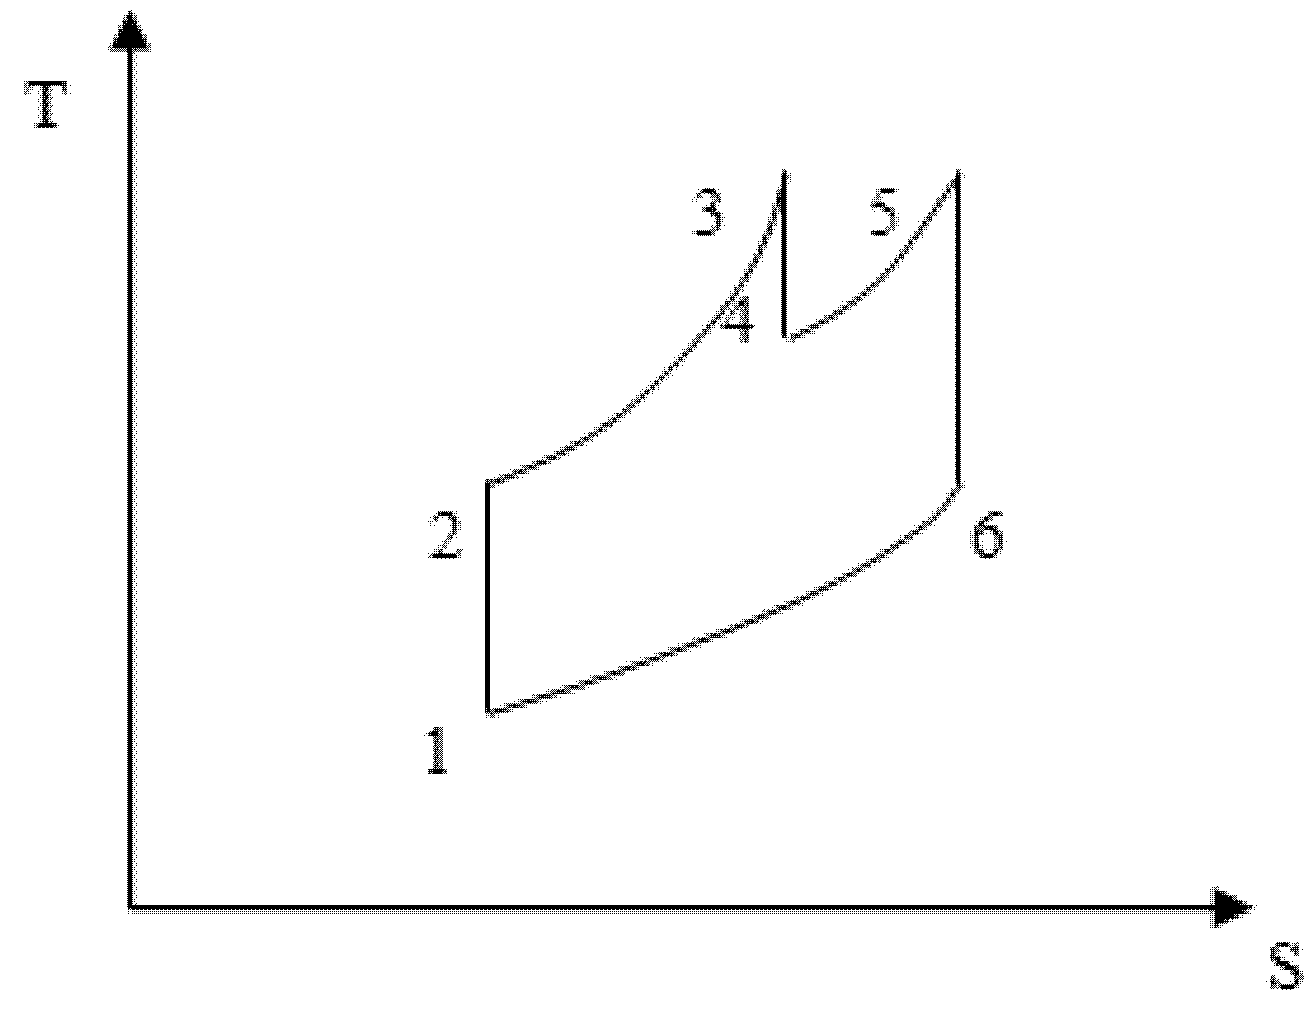
(2) Using the regenerative cycle

Based on the calculations, the power consumption of the compressor that does not utilize inter-cooling devices is almost 600 MW. This consumption is the result of a sharp increase in air temperature during the compression process. To maximize the gas turbine exhaust, a regenerative cycle is generated to preheat low-temperature air from the gas storage chamber. Hence, the temperature of the gas turbine exhaust drops to improve energy efficiency.

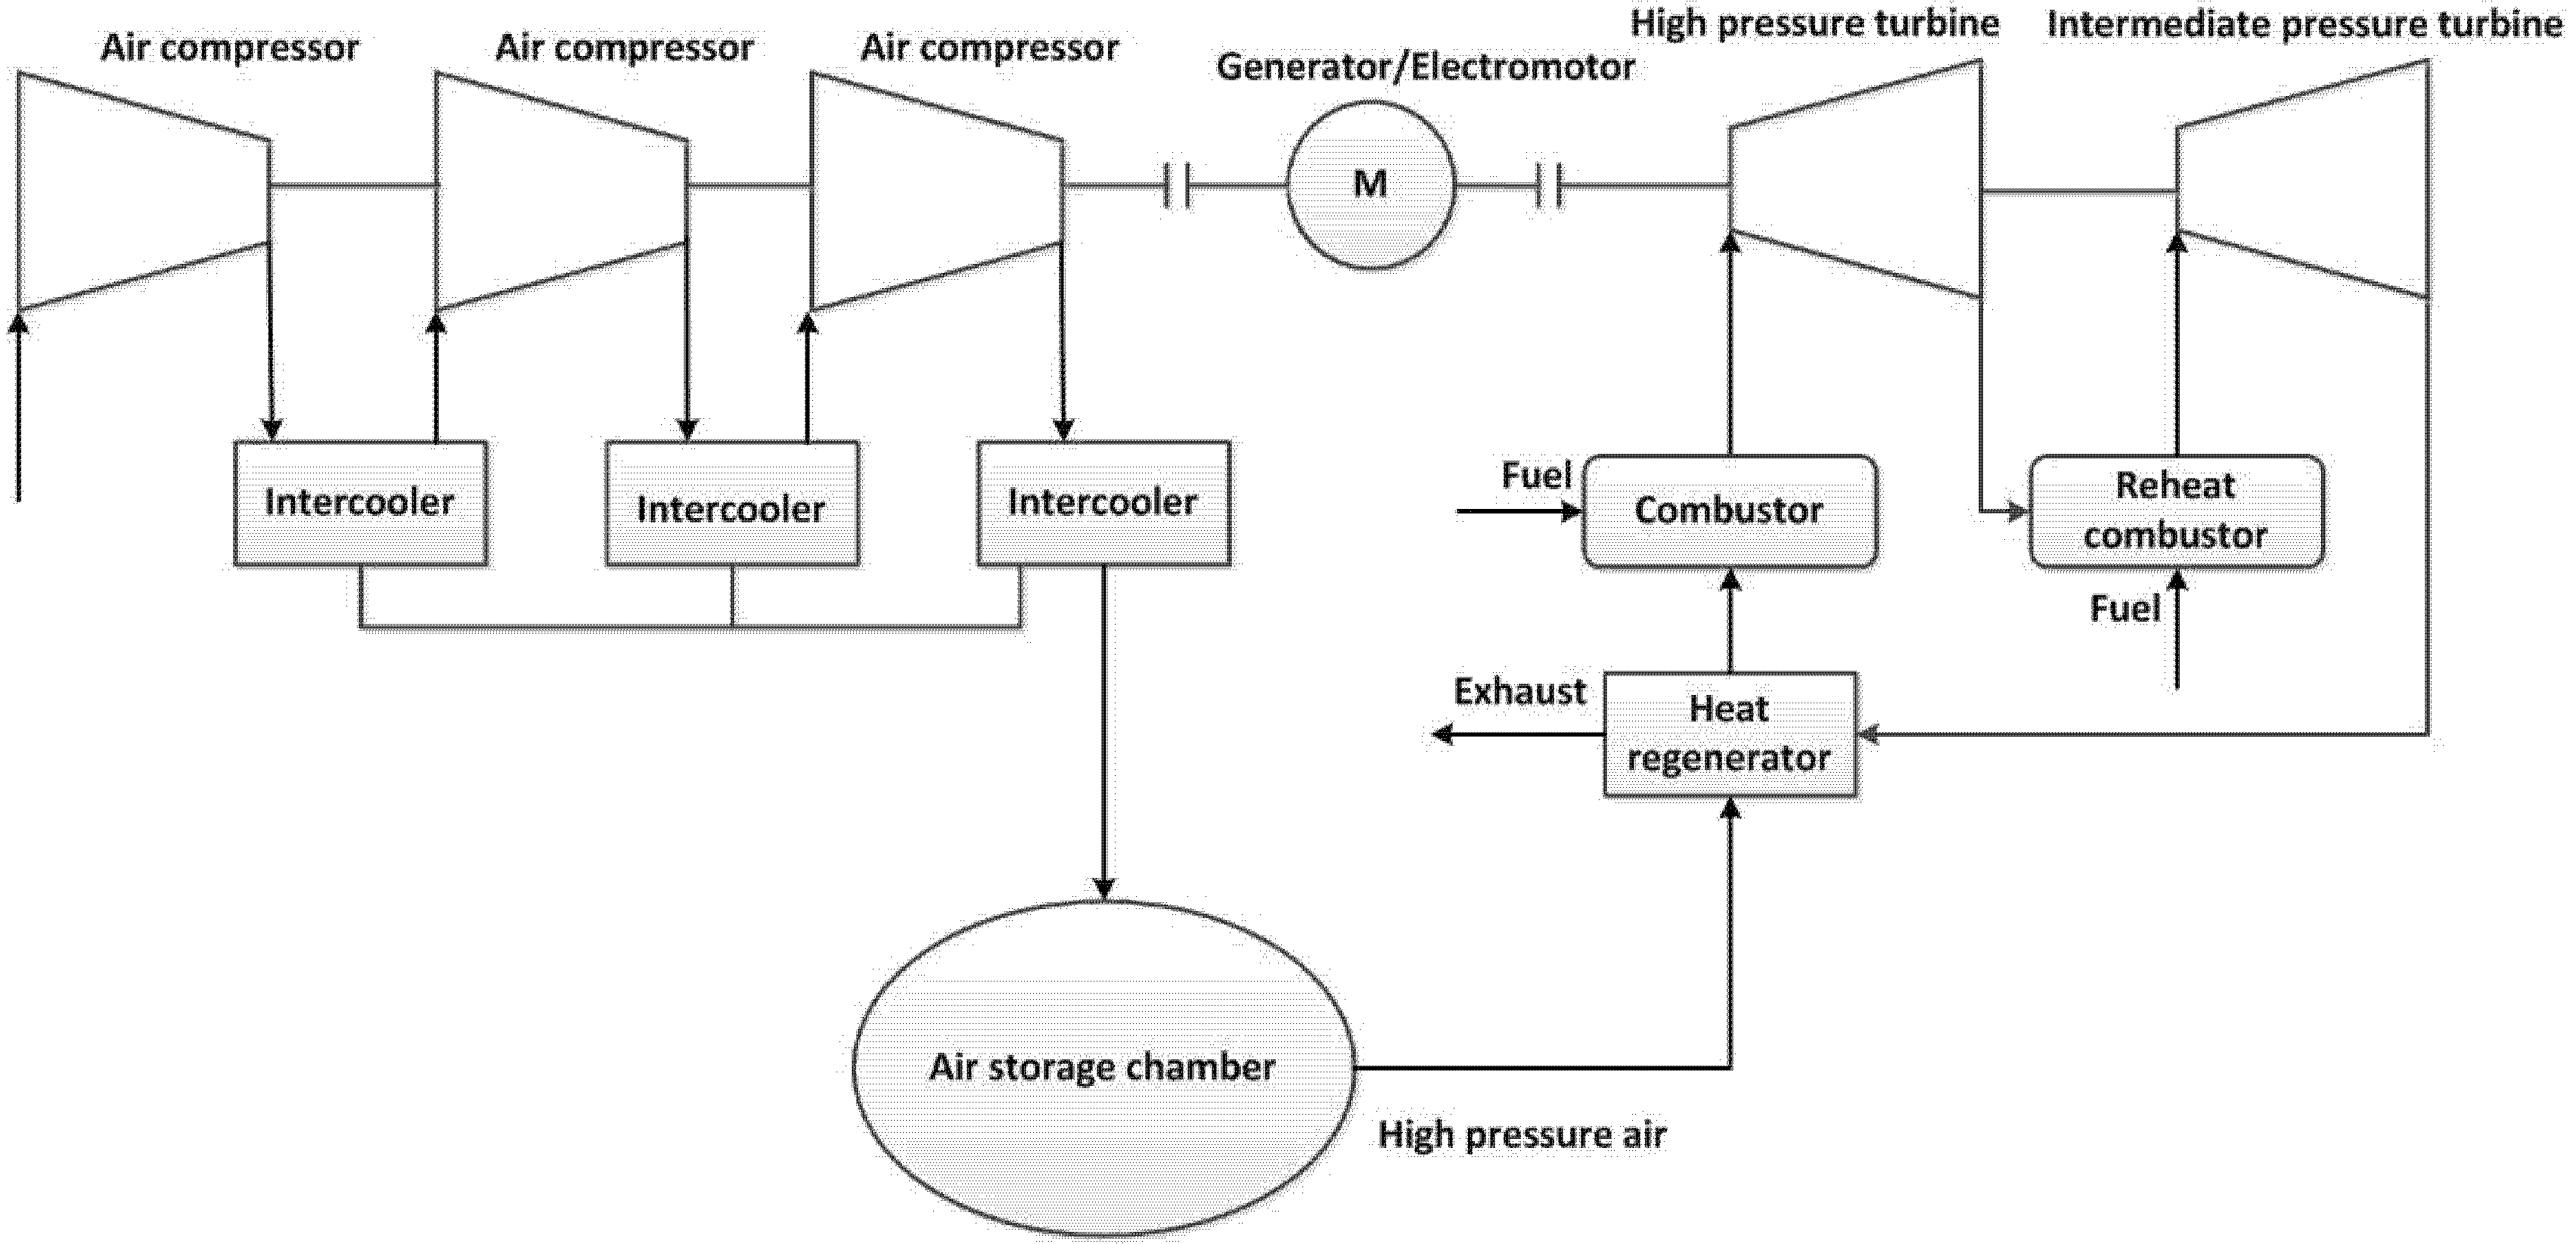
2.2.3. Improved System

The model of the improved CAES system, which is shown in Figure 6, is built for calculation and analysis purposes.
Figure 6. Schematic of the improved CAES system.
Energies 08 08873 g006
When air expands in operation, the air enters the regenerator for preheating. In this stage, multiple grades of heat can be used, thus maximizing the temperature of high-pressure air before entering the combustor. Consequently, fuel consumption can be reduced.
The improved system adopts a new gas turbine power generation technology that allows high-parameter air to enter the gas turbine. This technology can utilize the pressure energy of high-pressure air further.
The improved system uses the “reheat” combustion form. In the intermediate-pressure portion, the ordinary F-class gas turbine is used. The high-pressure combustion stage is added on this basis. The new inlet pressure of the high-pressure reheat gas turbine exceeds 60 bar, thus enabling the use of high-pressure energy. High-pressure air that originates from the air storage chamber is heated by the heat stored during the inter-cooling process and re-heated by the regenerator. The air enters the high-pressure gas turbine, is heated in a combustor to 1300 °C, and enters a high-pressure turbine (HPT) to expand partially. The HPT exhaust enters the reheat combustor for reheating and then transitions to the intermediate pressure turbine (IPT) to expand completely. The complete working process is thus described. The new gas turbine system adopts a split-shaft arrangement, and the intermediate-pressure portion employs the ordinary, widely-used F-class gas turbine. As a result, the system arrangement is simplified. The new reheat gas turbine technology can maximize the pressure energy-compressed air directly and utilize the reheat technology to further improve system efficiency.

3. Results and Discussion

3.1. Effect of Pressure on Efficiency

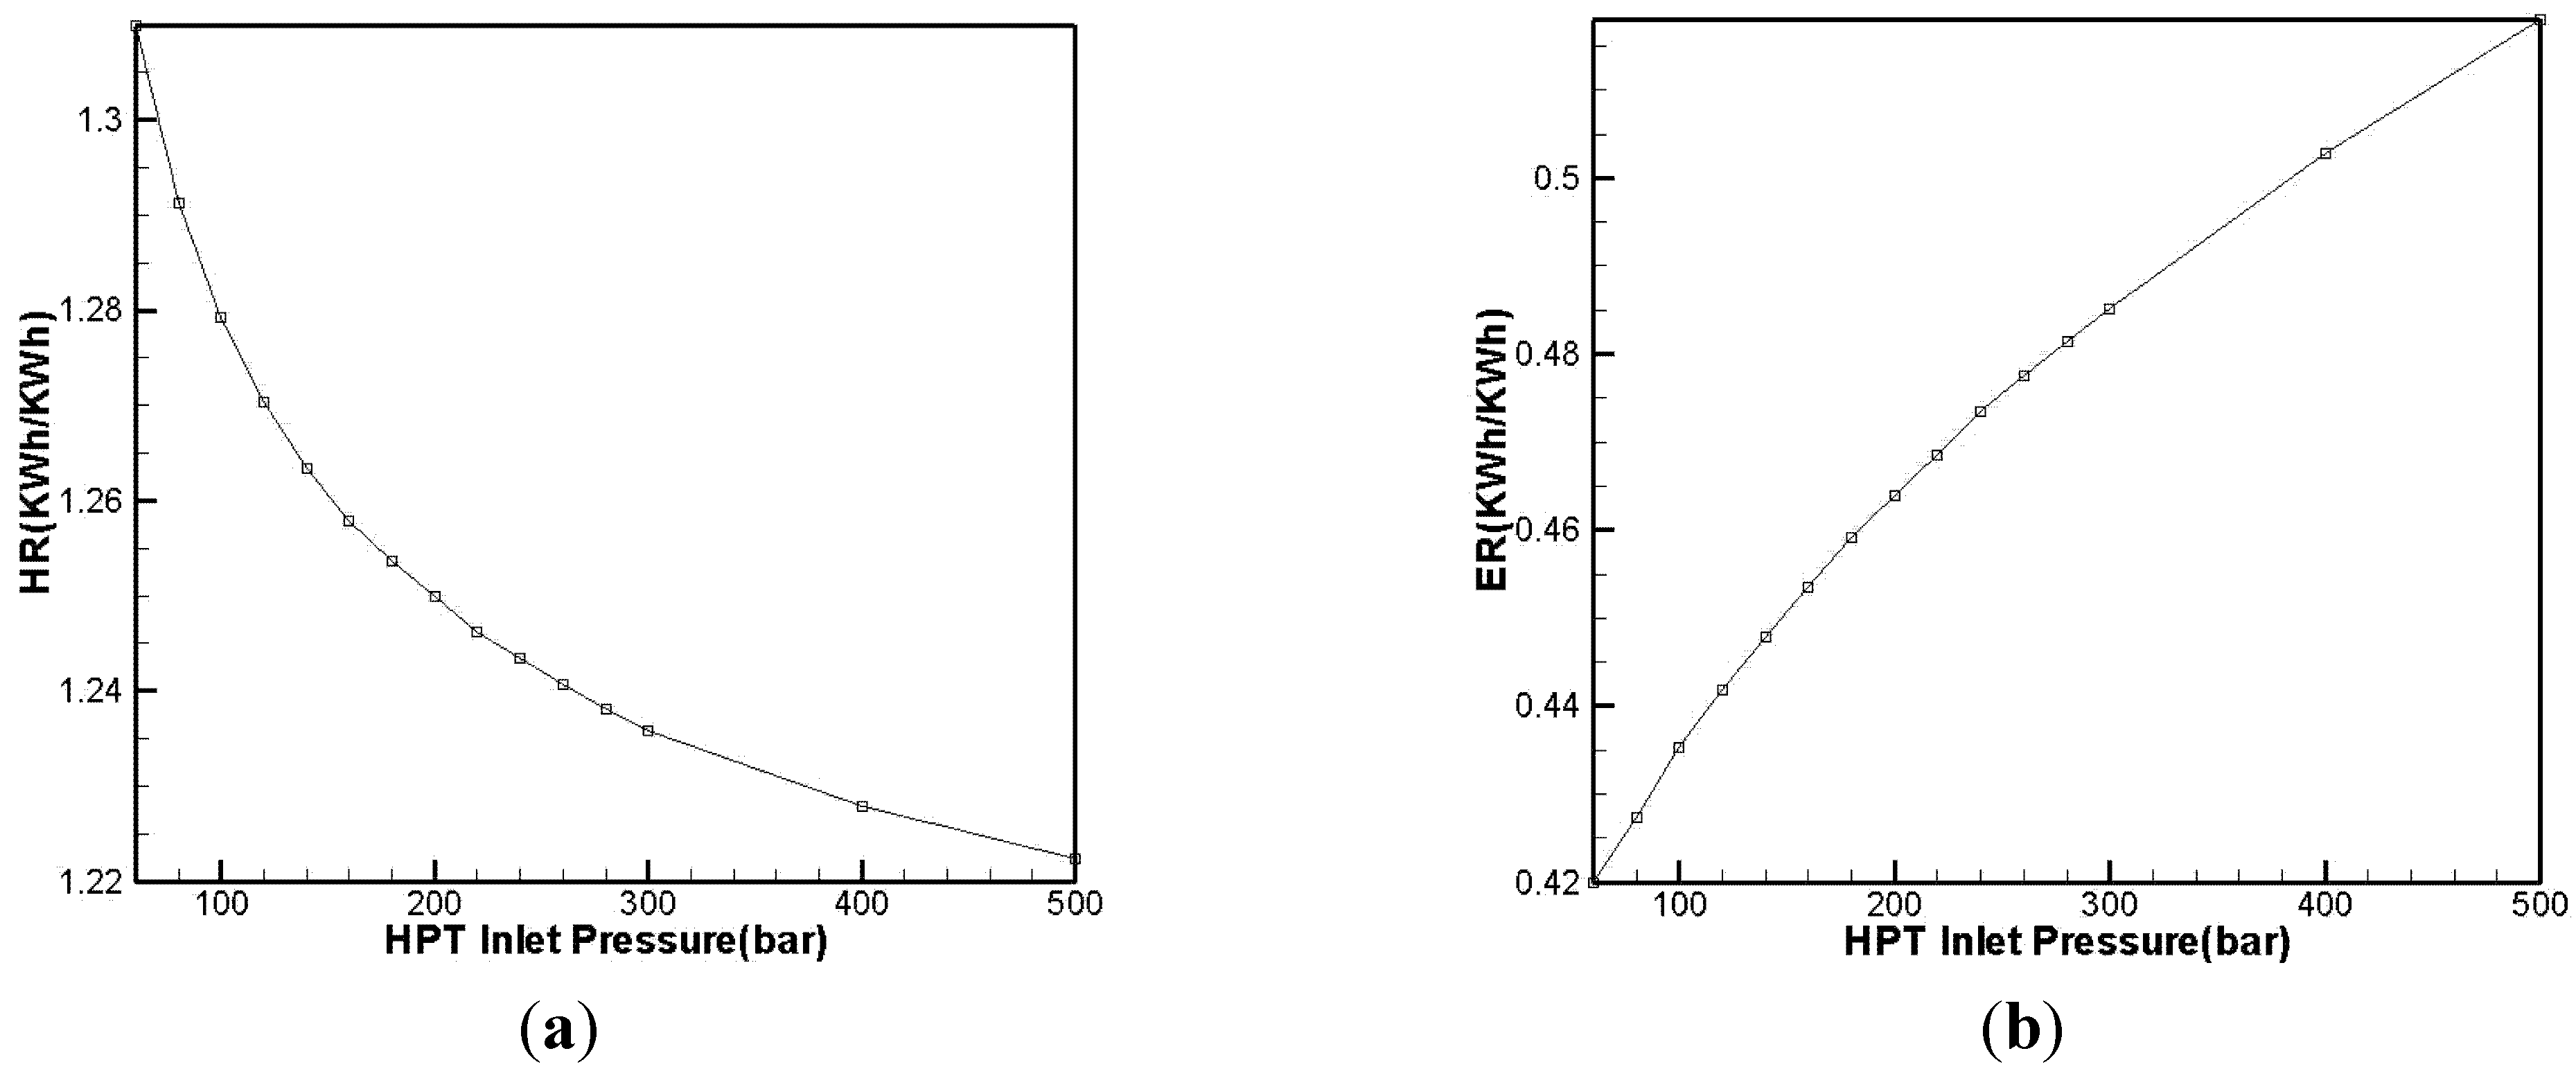
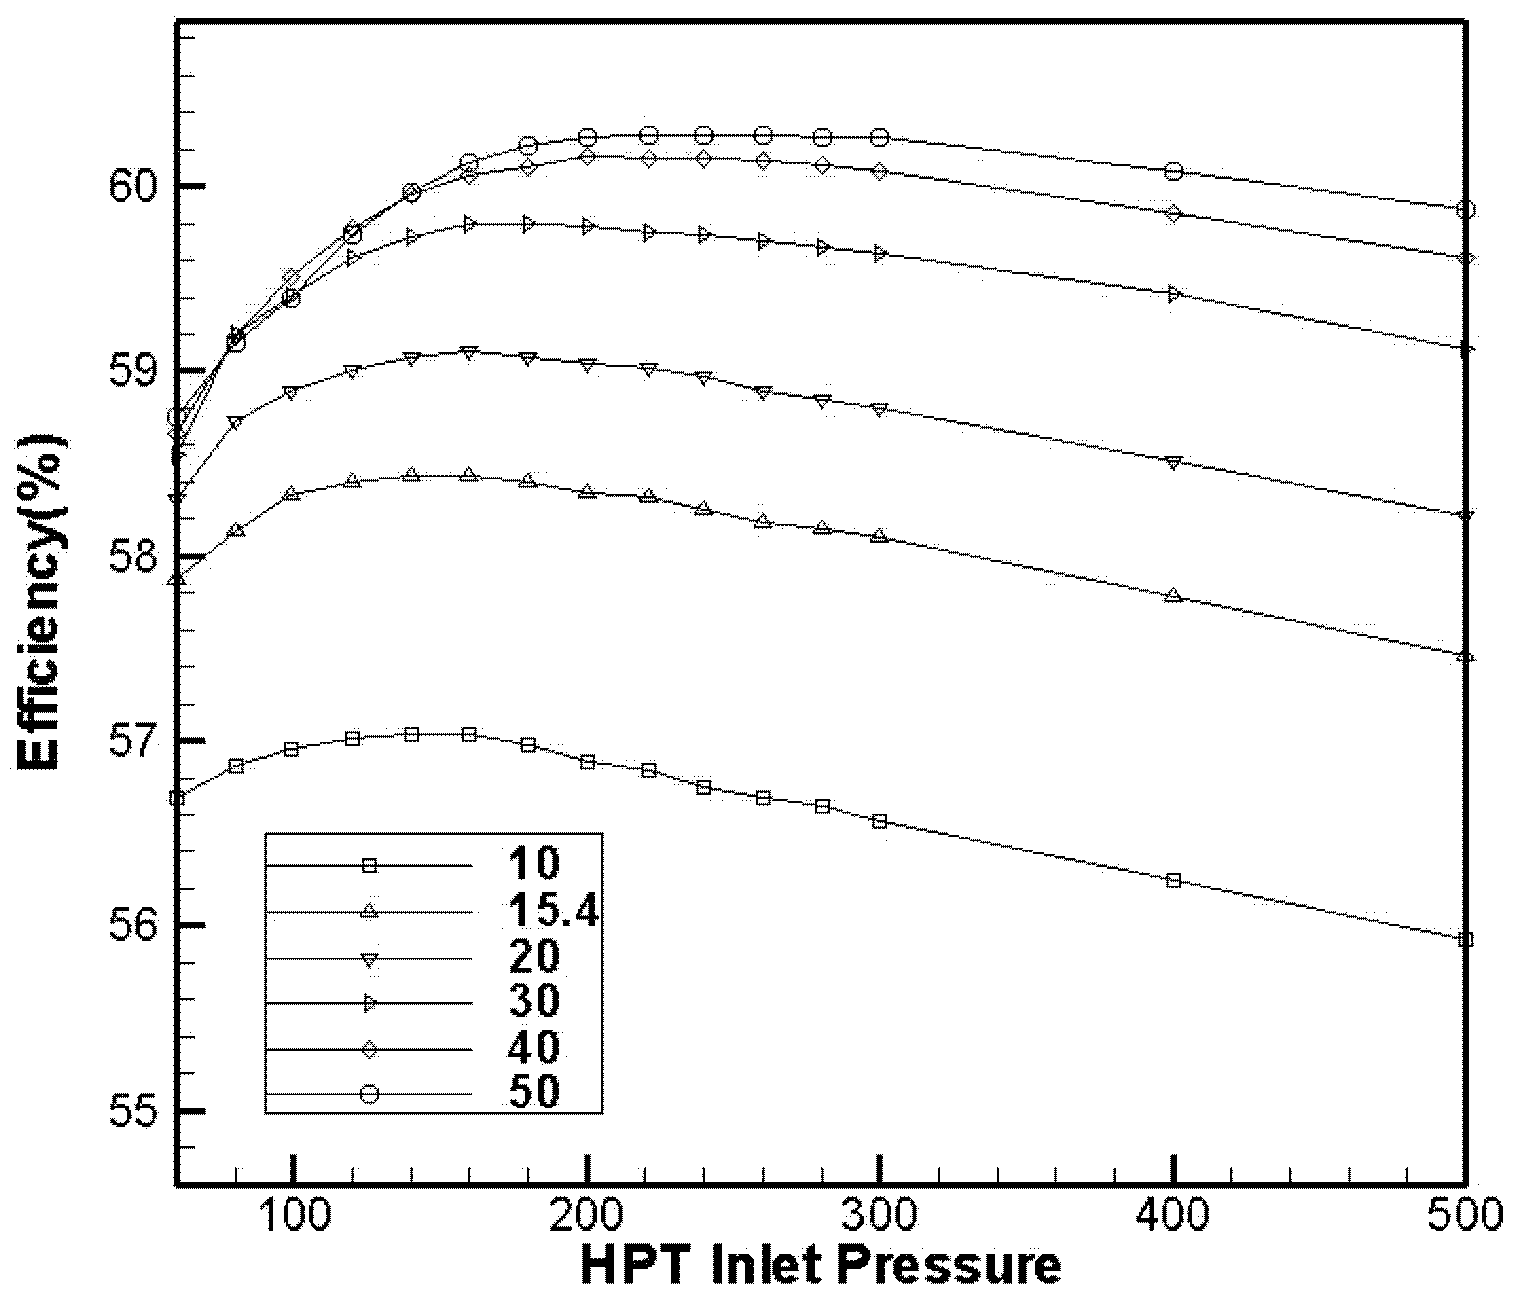
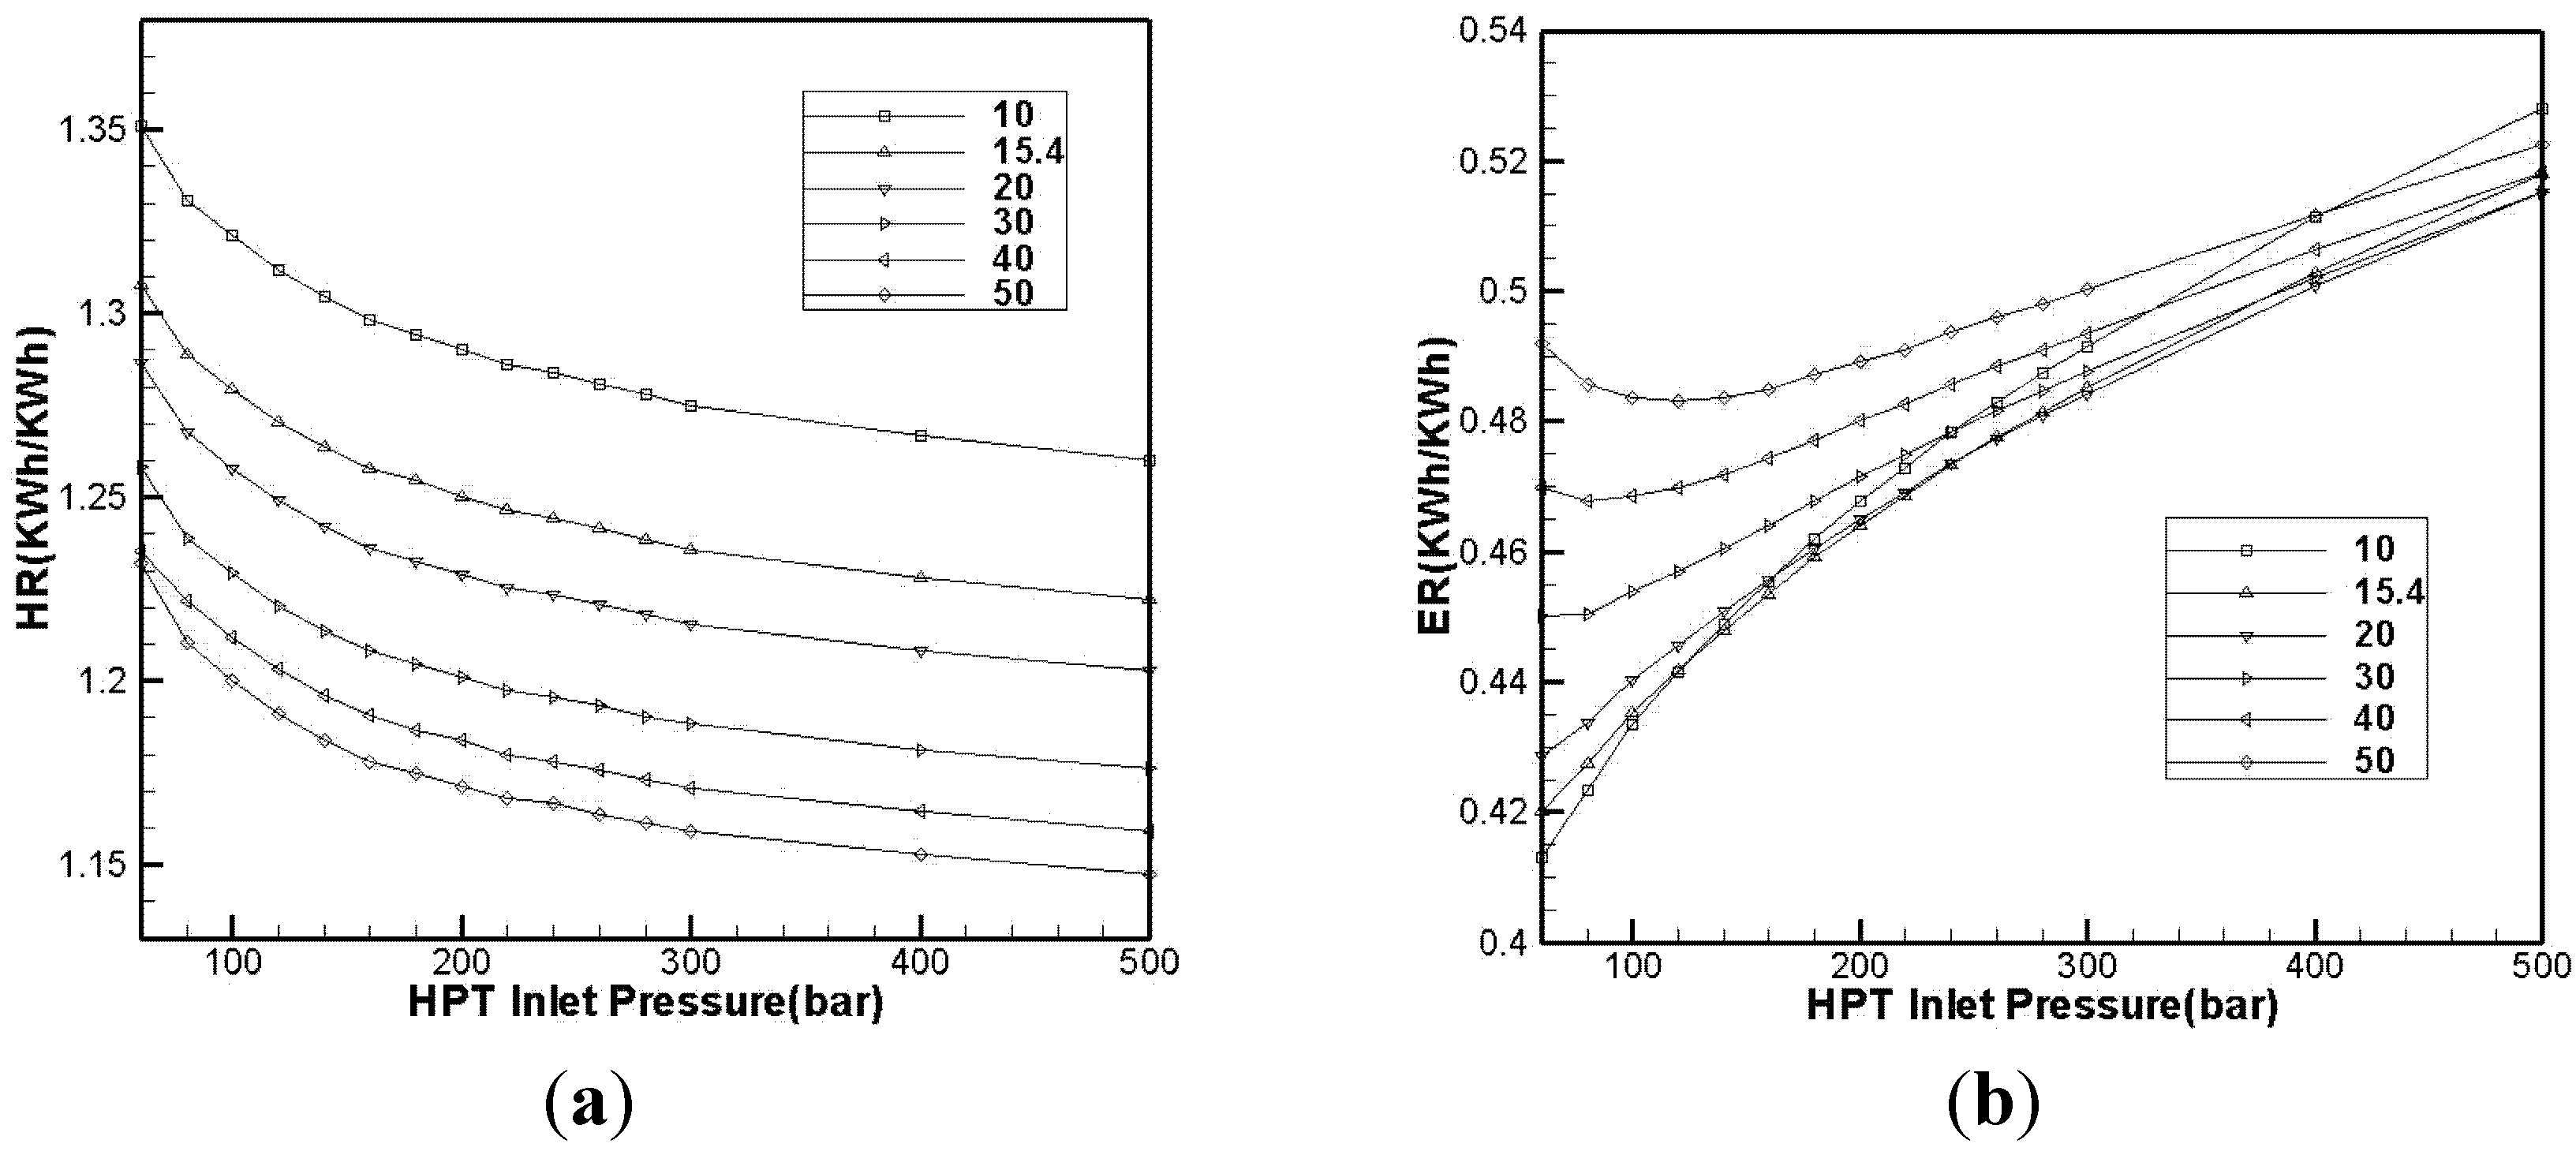
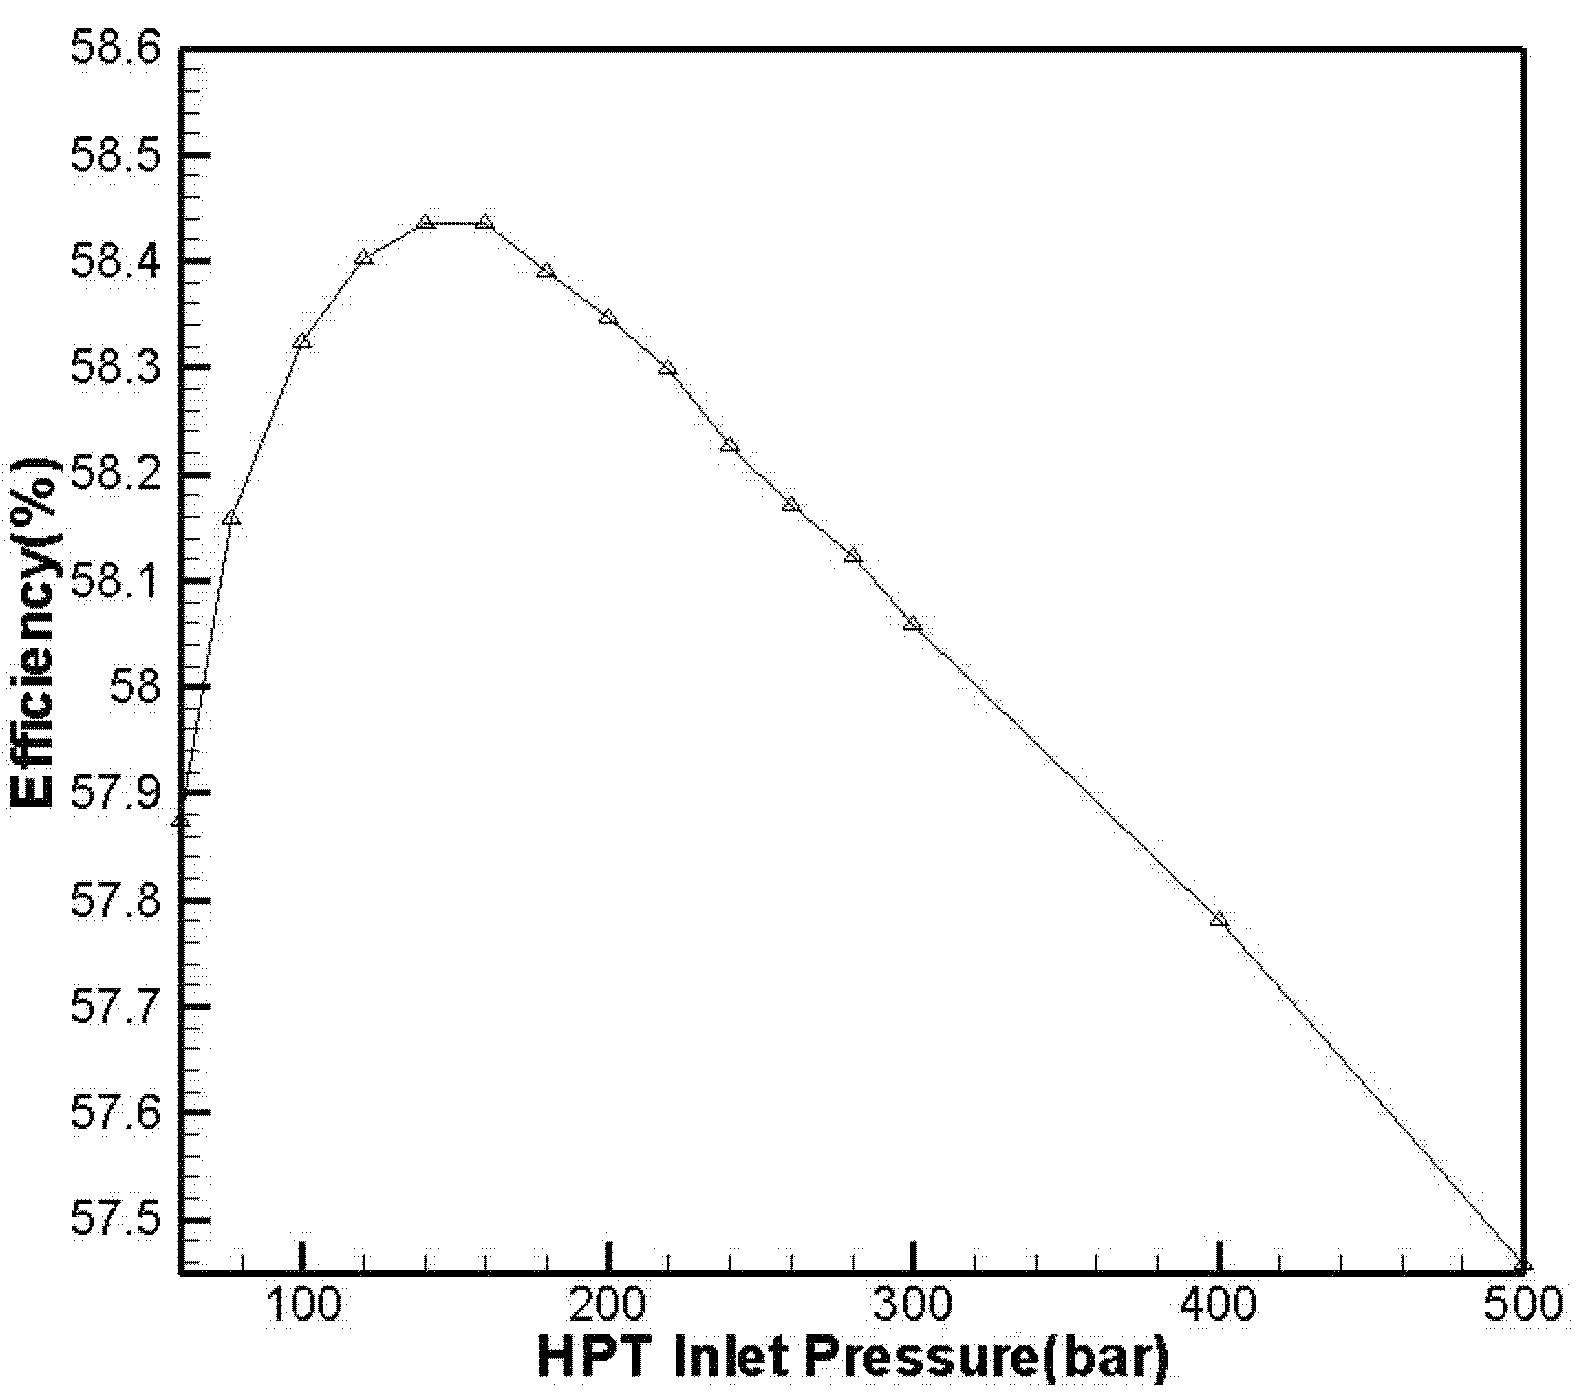
3.1.1. Effect of High-Pressure Turbine Inlet Pressure on Efficiency

The inlet pressure of IPT is maintained at 15.4 bar, and the inlet pressure of the HPT is modified. Subsequently, the corresponding efficiency is calculated. The result is shown in Figure 7. The power source of the CAES system is composed of both the chemical energy from fuel and the mechanical energy from compressed air; hence, energy conversion factor (Equation (1)) is calculated as follows:
ξ = P e P c + G f L H V
where Pe is total system output power; Pc is compressor power consumption; Gf is the flow rate of fuel; and LHV is the low heat value of the fuel.
To economically evaluate CAES system generation, heat rate (HR) (Equation (2)) and electric power consumption rate (ER) (Equation (3)) are computed as follows:
H R = G f L H V P e
E R = P c P e
The results are depicted in Figure 7 and Figure 8. As indicated in Figure 7, system efficiency increases gradually at first and then decreases steadily with an increase in HPT (PH) pressure to a maximum of approximately 140–160 bar. Figure 8a indicates that when PH increases, system HR decreases. In the low-pressure range (below 200 bar), HR decreases rapidly; however, the rate of this decrease slows down in the high-pressure range. Meanwhile, Figure 8b shows that system ER increases linearly with PH.
Figure 7. Effects of high-pressure turbine (HPT) inlet pressure on efficiency.
Energies 08 08873 g007
Figure 8. Effects of HPT inlet pressure on (a) heat rate (HR); (b) electric power consumption rate (ER).
Energies 08 08873 g008
The trends of HR and ER in Figure 8a,b highlight why system efficiency initially increases and eventually decreases. When compression pressure increases, compressor energy consumption increases exponentially, thus enhancing system ER. The work capacity per unit of fuel gradually increases as well when pressure increases. This increase in capacity is significant in the low-pressure range and plateaus in the high-pressure range. The reduction of HR in the low-pressure range is greater than the increase in ER; hence, system efficiency gradually increases. In the high-pressure range, however, the increase in ER is significantly greater than the reduction of HR reduction. Thus, system efficiency decreases considerably.
To explore the effect of high pressure on efficiency under different IPT (PI) inlet pressures further, experiments are conducted in these conditions.
As shown in Figure 9, system efficiency increases initially and then eventually decreases with an increase in PH given different PI values. When PI increases, the PH value that corresponds to the peak point of system efficiency gradually increases.
As indicated in Figure 10a, HR declines with an increase in PH given different PI values. In addition, the higher PH, the smaller HR.
Overall ER increases with PH given different PI values (Figure 10b). When the PI value is high, overall ER initially decreases and then increases in a low-pressure range. When PH is low and PI is excessively high, gas cannot expand completely in HPT. Thus, the output power is low although compressor power consumption and ER are high. When PH increases, the work capacity of the high-pressure gas turbine increases and ER declines. At a pressure of 10 bar, work capacity is limited relative to an increase in compressor power consumption, and ER is greater than other high pressures because a low PI does not match combustion temperature.
Figure 9. Effects of HPT inlet pressure on efficiency under different intermediate pressure turbine (IPT) inlet pressures.
Energies 08 08873 g009

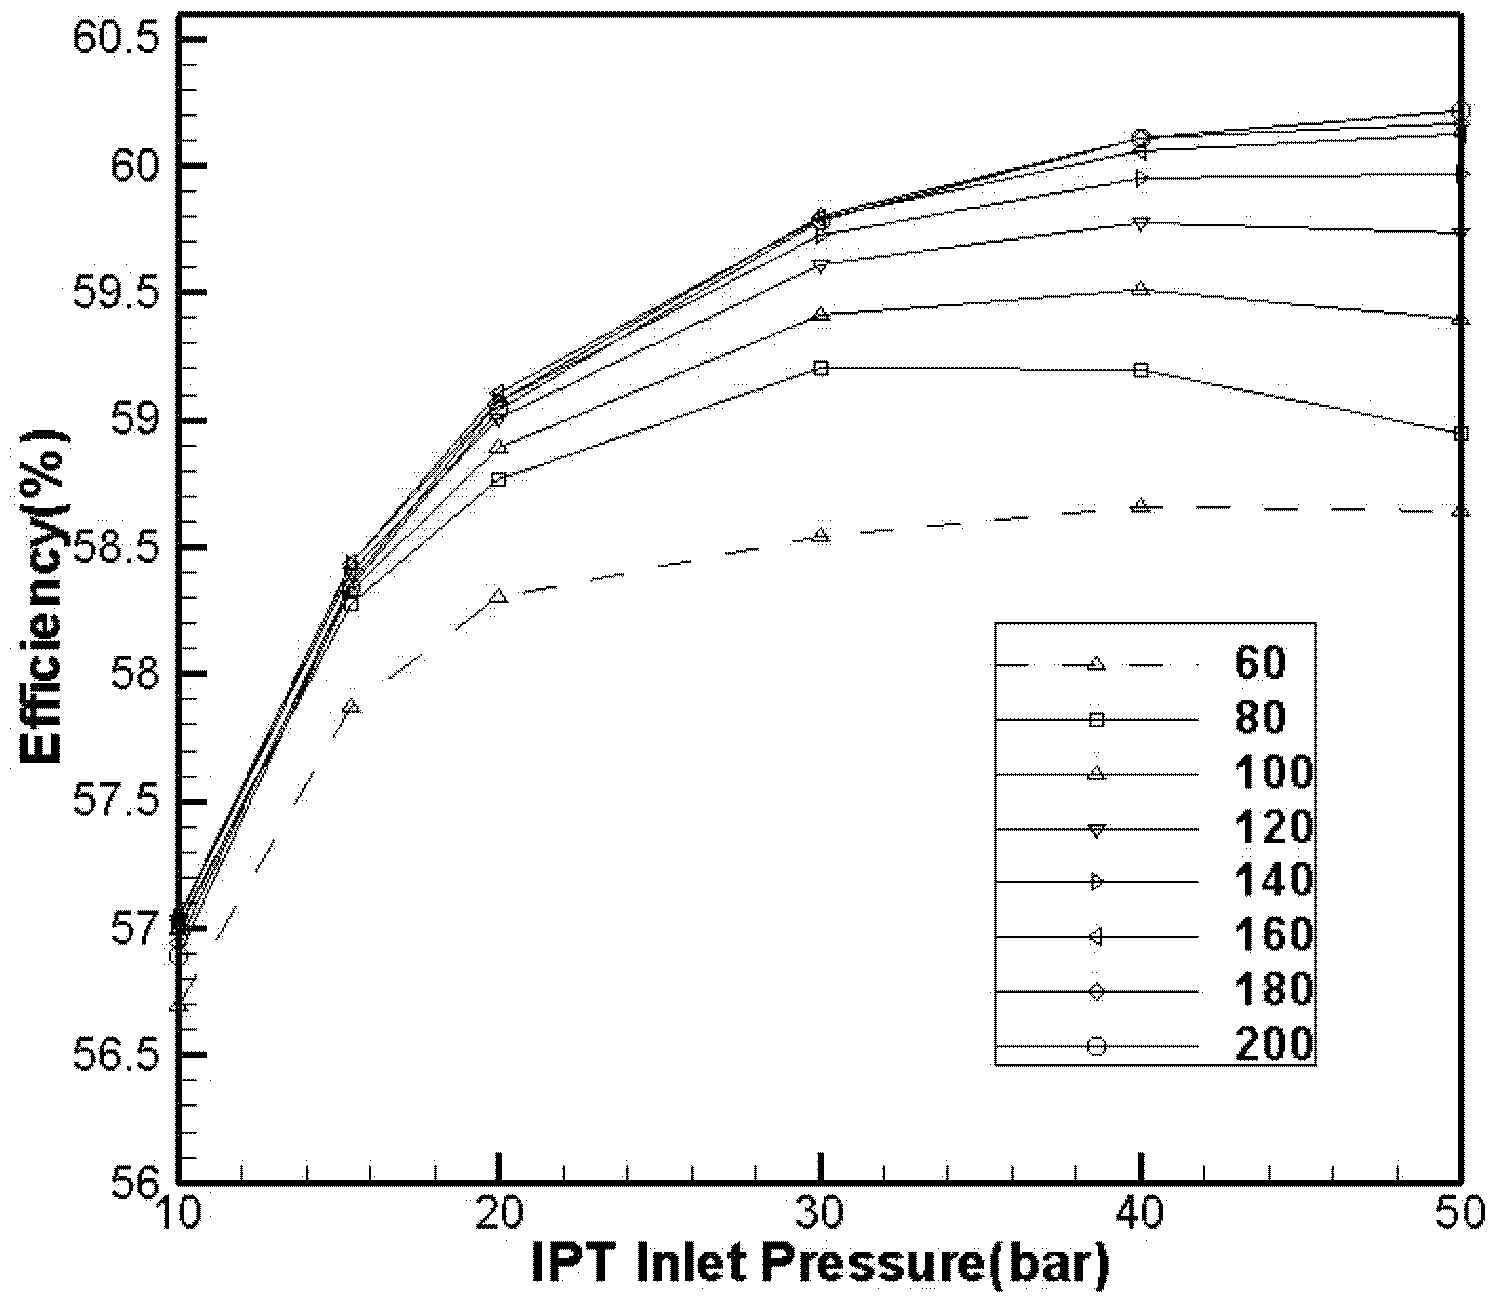
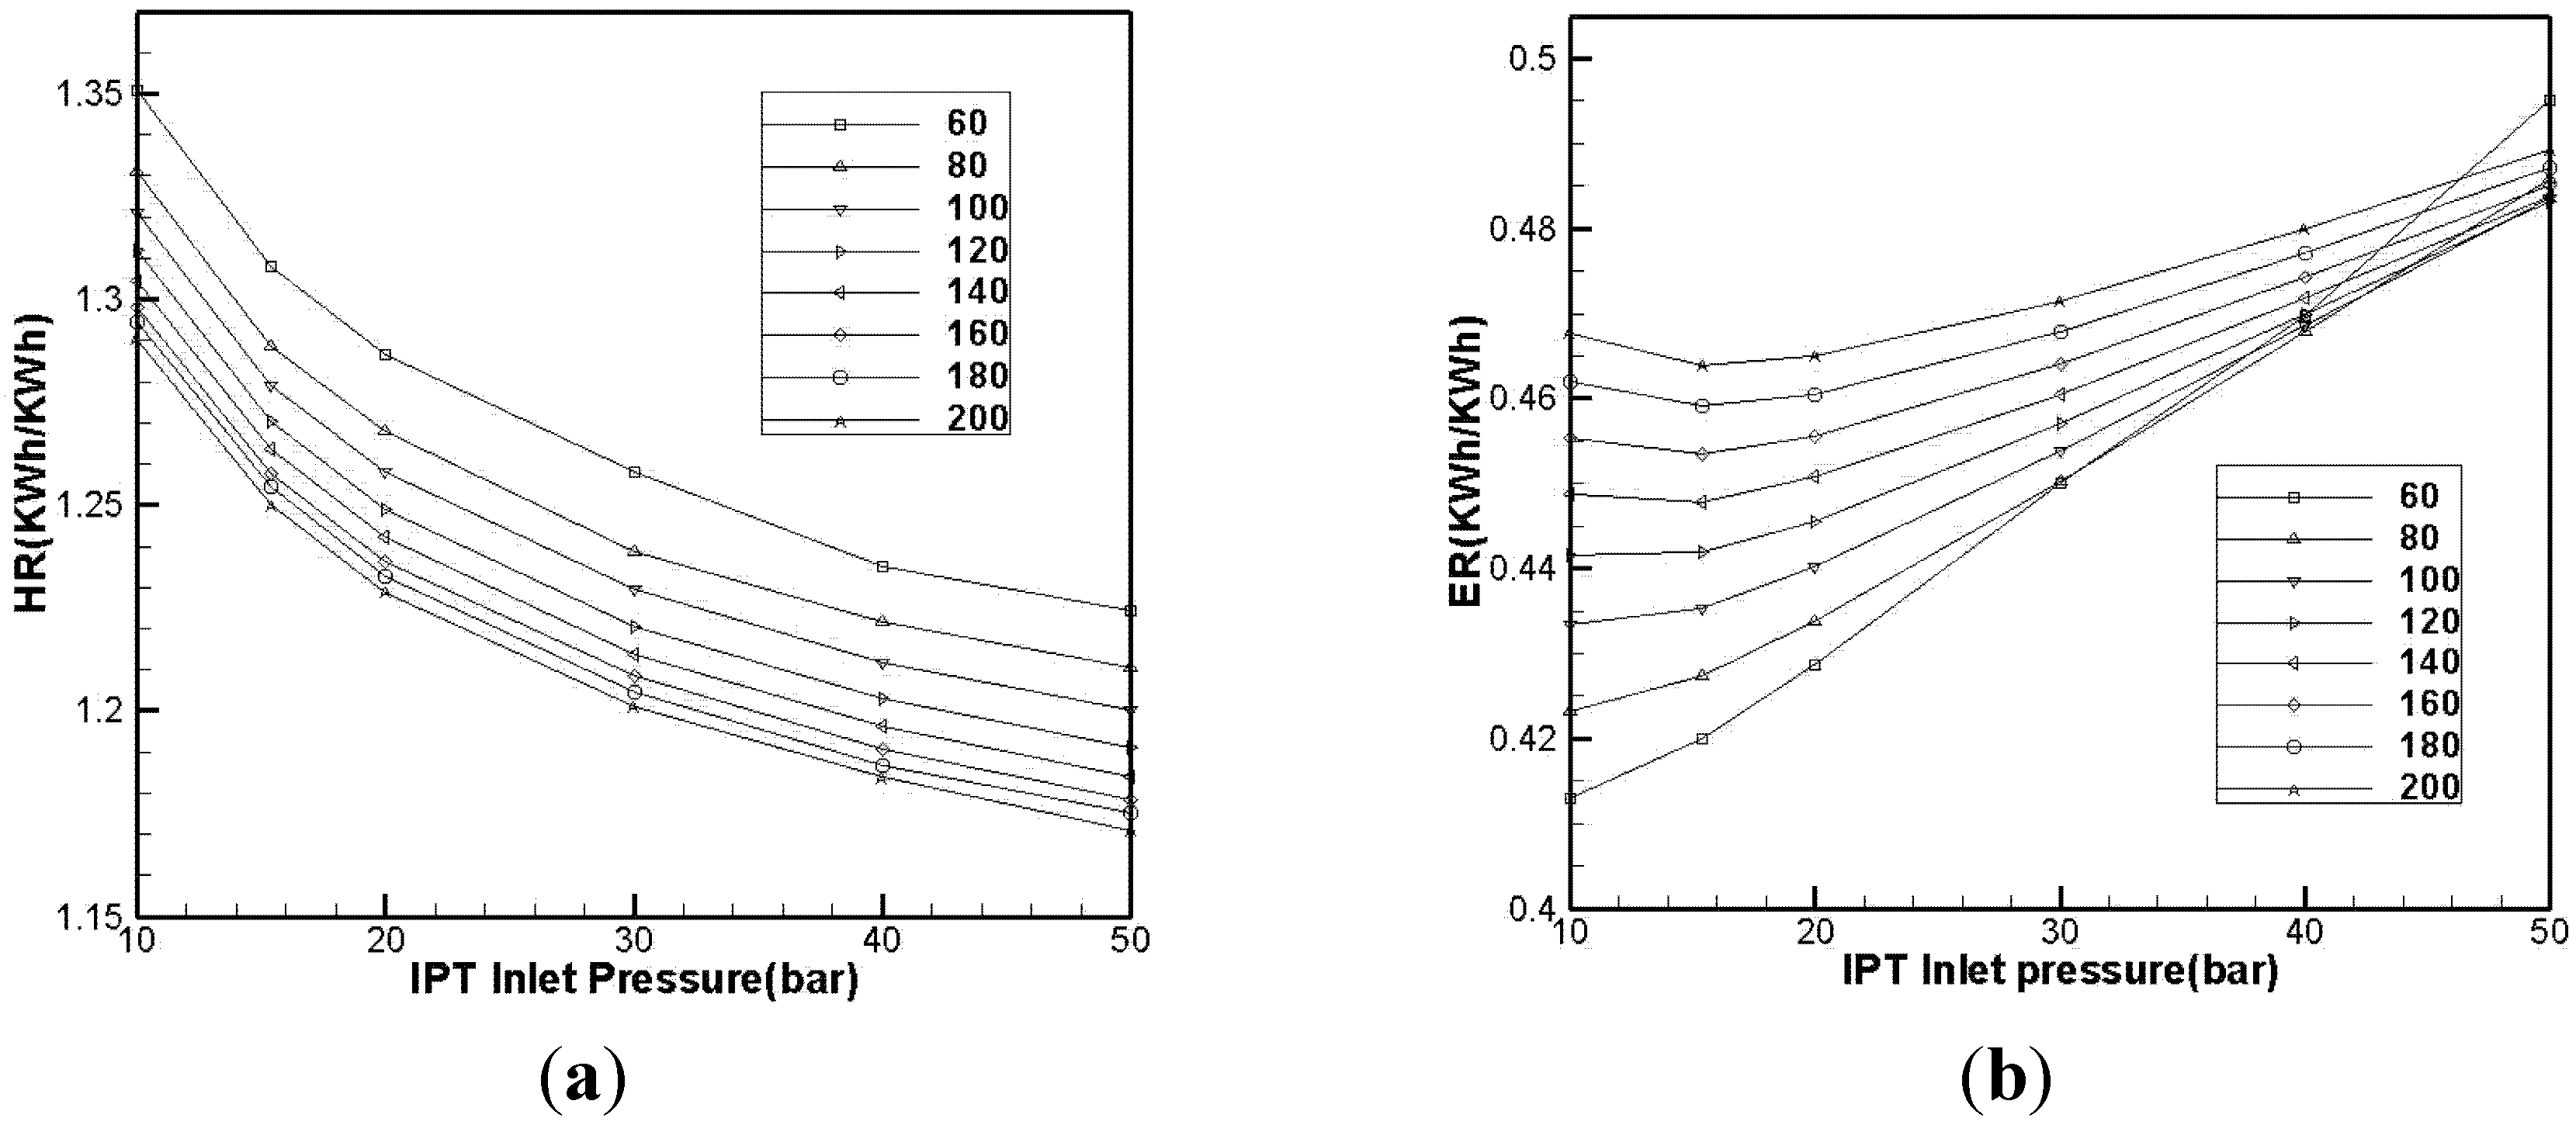
3.1.2. Effect of Intermediate-Pressure Turbine Inlet Pressure on Efficiency

PH is set to certain values, and PI value is modified the corresponding efficiency, HR, and ER are then calculated. The results are displayed in Figure 11 and Figure 12.
As per Figure 11, under different PH, PI values also reach an optimum pressure value. System efficiency increases and the corresponding optimum pressures of middle pressure gradually rise as well with PH value. Figure 12a shows the relationship between PI and HR and indicates that HR declines with an increase in PI. A high PH value corresponds to a low HR given different PI values. As depicted in Figure 12b, ER gradually increases with PI with different PH values. When PI is low and PH is high, ER initially increases and then decreases. When the HPT pressure measures 60 bar, ER increases significantly with PI. This phenomenon can be attributed to the low PH and high PI, that is, the inlet pressure is close to the outlet pressure in the high-pressure stage. In this case, work apply is low, work capacity increases slightly, and ER increases considerably.
Figure 10. Effects of HPT inlet pressure on (a) HR and (b) ER under different IPT inlet pressures.
Energies 08 08873 g010
Figure 11. Effect of IPT inlet pressure on efficiency given different HPT inlet pressures.
Energies 08 08873 g011
Figure 12. Effect of IPT inlet pressure on (a) HR and (b) ER given different HPT inlet pressures.
Energies 08 08873 g012

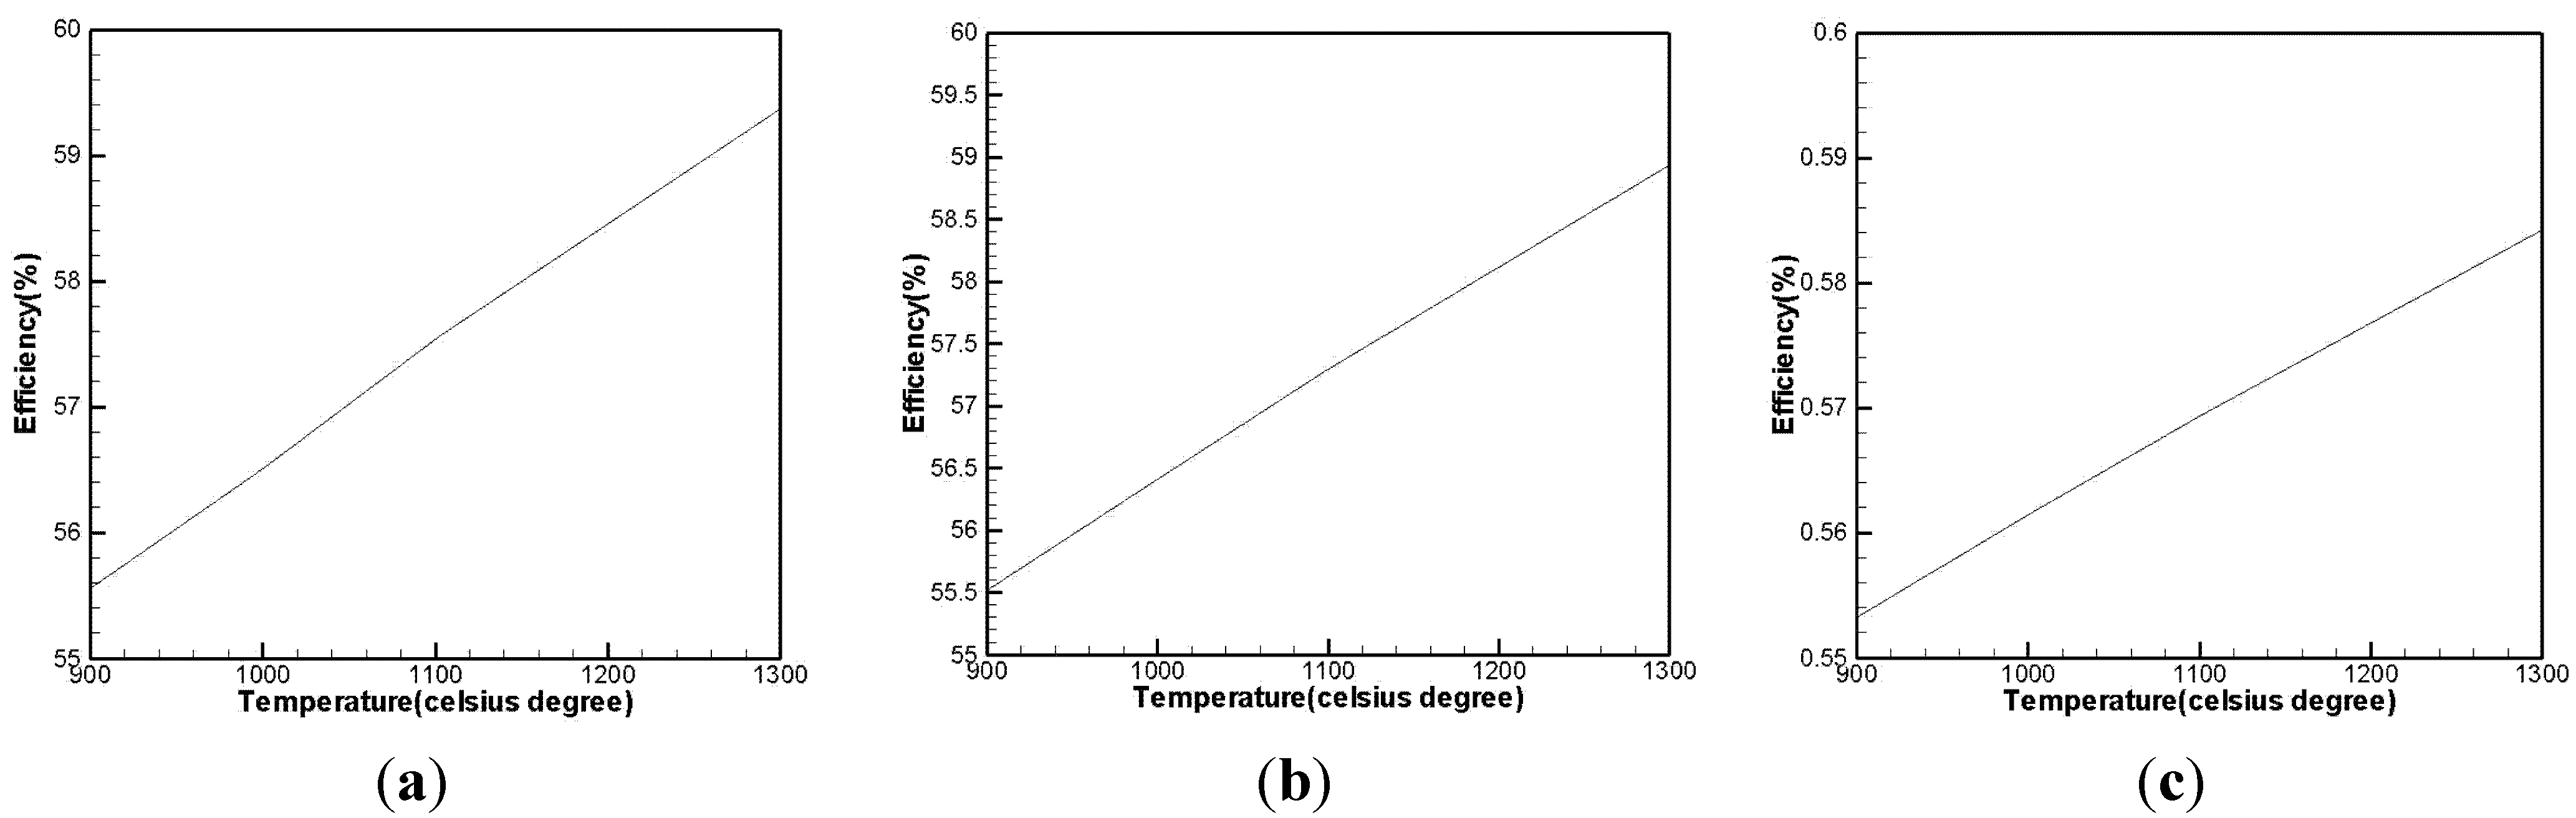
3.2. Effect of High-Pressure Turbine Inlet Temperature on Efficiency

As exhibited in Figure 13, the IPT inlet temperature of the turbine is fixed at 900, 1100, and 1300 °C. The relationship between HPT inlet temperature and efficiency can be established by changing the HPT inlet temperature. The purpose of this study is to determine whether or not system efficiency improvement relies heavily on the IPT pressure-level turbine.
Figure 13 suggests that system efficiency increases with HPT inlet temperature of. The efficiency of the proposed system is higher than that of the existing second-generation CAES system even in the low-temperature region. Efficiency also increases in the high-temperature region. Hence, a highly efficient operation process does not rely significantly on the temperature level of the middle pressure-level turbine. Moreover, efficiency is enhanced considerably even when the E gas turbine (900 °C) is used in the reheating process.
Figure 13. Effect of HPT inlet temperature on efficiency While IPT inlet temperature is: (a) 900 °C; (b) 1100 °C; (c) 1300 °C.
Energies 08 08873 g013

3.3. Performance Under Various Conditions

In CAES power plants, the outlet air pressure of an air storage chamber decreases gradually. Therefore, CAES plants actually function in sliding-pressure operation. As depicted in Figure 14, the efficiencies of the second-generation CAES system and of the improved system are calculated under various conditions.
As indicated in Figure 14, system efficiency fluctuates under various conditions. Nonetheless, the efficiency of the improved CAES system is always significantly higher than that of the second-generation CAES system. Furthermore, this efficiency does not decline significantly at low pressure. Therefore, the improved CAES system is highly practical.
Figure 14. Effect of changes inair storage chamber pressure on efficiency.
Energies 08 08873 g014

3.4. Calculation Results

The analysis results regarding the influence of PH and PI on the efficiency of the improved system suggest that the maximum system efficiency ranges between 140–150 bar. Thus, setting 140 bar as the PH value is appropriate. In addition, a system is efficient when PI value is lower than 20 bar; therefore, the conventional F-class pressure of 15.4 bar is applied. The use of the conventional pressure in IPT implies that the existing gas turbine can be adopted and that system construction is simplified. Table 2 presents a comparison of the improved system with the second-generation system with respect to selected parameters. The table shows that the efficiency of the improved CAES is 9% higher than that of the second-generation CAES system. Furthermore, ER and HR are lower in the former than in the latter. Hence, the pressure energy of the stored air is applied efficiently.
Table 2. Comparison of the parameters of second-generation CAES systems with those of the improved CAES system.
System/ParametersSecond-Generation CAESImproved System
Air storage chamber parametersPressure (bar)140
Temperature (°C)50
Compressor outlet parametersPressure (bar)140
Temperature (°C)50
Air flow (kg/s)600600
Turbine expansion work (MW)HPT (air turbine)157.3396.6
IPT (gas turbine)474.7492.0
Compressor power consumption (MW)398398
Turbine inlet pressure (bar)/temperature (°C)HPT-133/1300
IPT (gas turbine)15.4/130015.4/1300
Flow rate of the fuel (kg/s)17.7422.36
Power output (MW)632.0888.6
Efficiency49.06%58.44%
HR (kWh/kWh)1.4101.265
ER (kWh/kWh)0.6290.447

3.5. Investment Estimation

The construction costs of an F-class CAES power plant are referenced to estimate the investment into an improved CAES system. The results are presented in Table 3. The construction costs of the improved CAES system increase with the requirement for new research facilities, but these costs decrease once the facilities mature. Cost per KWh did not increase significantly because power capacity increases when reheat technology is used.
Table 3. Investment estimation (million dollars).
ProjectReference F-Class CAES Power Plant (2 MW × 600 MW)Mature Reheating Combustion Equipment (2 MW × 800 MW)New Reheat CAES Equipment (2 MW × 800 MW)
Electromechanical equipment153.4271.08355.55
High-pressure gas turbine-67.84135.67
Low-pressure gas turbine41.9045.2245.22
Compressor17.0817.0832.55
Gas turbine generator8.8714.0714.07
Intercoolers2.662.662.66
Instrument and control system3.915.867.03
Spare parts fee + freight78.90118.35118.35
Regenerator25.4825.4825.48
Main transformer supply5.318.098.09
252 KV GIS supply2.093.183.18
Gas pressure regulating station and gas replacement2.052.962.96
Total equipment cost188.34310.78395.25
Civil engineering cost and gas storage chamber398.21495.60566.51
252 KV GIS supply2.093.183.18
Gas pressure regulating station and gas replacement2.052.962.96
Total equipment cost188.34310.78395.25
Civil engineering cost and gas storage chamber398.21495.60566.51
Crew, including heating pipe network17.9424.9424.94
Gas transmission pipeline17.7325.5925.59
Static total investment 622.22865.901012.29
Static investment per kW ($/KW)518536633
Dynamic total investment691.36952.121124.77
Dynamic investment per kW ($/KW)576595703

4. Conclusions

The conclusions drawn from the analysis and calculations are as follows:
(1)
The efficiency of the improved CAES system increased by 9% with the adoption of a high-pressure gas turbine that includes a reheat process and the utilization of heat energy in the inter-cooling process based on the second-generation CAES system.
(2)
In the improved system, efficiency is related to HPT inlet pressure. When pressure increases, efficiency increases at first and then decreases. An optimum value was thus obtained.
(3)
System efficiency increases initially and decreases eventually with an increase in IPT inlet pressure. Optimal pressure also increases with HPT inlet pressure.
(4)
Efficiency is related to HPT inlet temperature, and an increase in temperature can improve the thermal efficiency of a cycle to some extent.
(5)
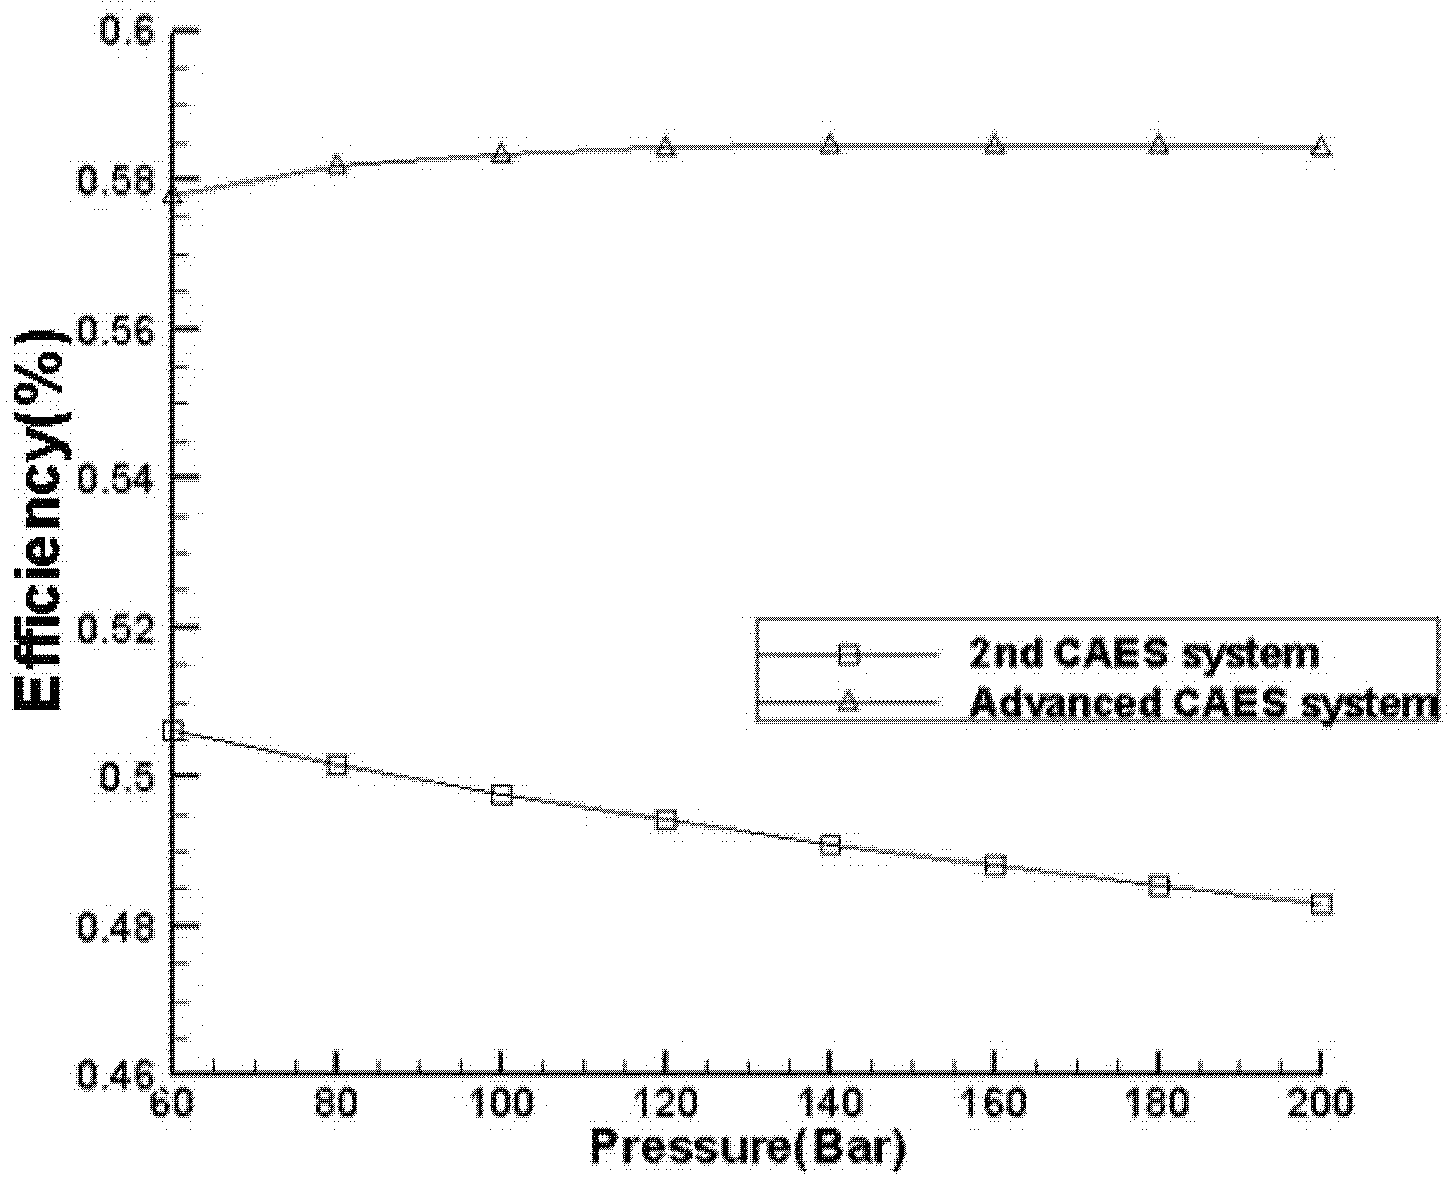
System efficiency changes with air storage chamber pressure. Despite changes in pressure, the efficiency of the improved system is always significantly higher than that of the existing second-generation CAES system.
(6)
In the improved system, not only did the parameter values increase, but capacity increased as well. System capacity reached 800 MW, thus indicating that the system can be used on a large scale.
(7)
The costs of the F-class gas turbine equipment and the equipment for the improved system are estimated, and the cost per kW of the latter do not increase significantly.

Acknowledgments

This work was supported by The Fundamental Research Funds for the Central Universities (13XS09 and 2014ZZD04) by Chinese Ministry of Education. China Guodian New Energy Technology Research Institute gave technical support. The authors express their sincere gratitude for supporting this important work.

Author Contributions

Zhongguang Fu conceived and designed the improved system and the research; Ke Lu performed the Calculating process, data analysis and wrote the original manuscript; Yiming Zhu did the data processing, illustrations modification and helped during the editing, rewriting and review process.

Conflicts of Interest

The authors declare no conflict of interest.

Nomenclature

ξ
energy conversion coefficient
Pe
total system output power (MW)
Pc
compressor power consumption (MW)
Gf
flow rate of fuel (kg/s)
HR
heat consumption rate (kJ/kWh)
ER
power consumption rate (kWh/kWh)
PI
inlet pressure of IPT (bar)
PH
inlet pressure of HPT (bar)

References

  1. Ouyang, C.Y. To attach great importance to the development of power grid peaking problems. Electr. Power Technol. Econ. 2002, 1, 10–15. (In Chinese) [Google Scholar]
  2. Grazzini, G.; Milazzo, A. Thermodynamic analysis of CAES/TES systems for renewable energy plants. Renew. Energy 2008, 33, 1998–2006. [Google Scholar] [CrossRef]
  3. Abbaspour, M.; Satkin, M.; Mohammadi-Ivatloo, B.; Lotfi, F.H.; Noorollahi, Y. Optimal operation scheduling of wind power integrated with compressed air energy storage (CAES). Renew. Energy 2013, 51, 53–59. [Google Scholar] [CrossRef]
  4. Li, C. Progress in renewable energy problem in China. Forum Sci. Technol. China 2008, 2, 111–120. (In Chinese) [Google Scholar]
  5. Jubeh, N.M.; Najjar, Y.S. Green solution for power generation by adoption of adiabatic CAES system. Appl. Therm. Eng. 2012, 44, 85–89. [Google Scholar] [CrossRef]
  6. Raju, M.; Khaitan, S.K. Modeling and simulation of compressed air storage in caverns: A case study of the Hundorf plant. Appl. Energy 2012, 89, 474–481. [Google Scholar] [CrossRef]
  7. Liu, W.; Yang, Y.; Zhang, X.; Xin, Y. Present Situation and Development Trend of Compressed air energy storage (CAES) power plant. Shandong Electr. Power 2007, 2, 10–14. (In Chinese) [Google Scholar]
  8. Kushnir, R.; Dayan, A.; Ullmann, A. Temperature and pressure variations within compressed air energy storage caverns. Int. J. Heat Mass Transf. 2012, 55, 5616–5630. [Google Scholar] [CrossRef]
  9. Nakhamkin, M.; Chiruvolu, M. Available Compressed Air Energy Storage (CAES) Plant Concepts. Available online: http://espcinc.com/mobile/library/PowerGen_2007_paper.pdf (accessed on 18 August 2015).
  10. Proczka, J.J.; Muralidharan, K.; Villela, D. Guidelines for the pressure and efficient sizing of pressure vessels for compressed air energy storage. Energy Convers. Manag. 2013, 65, 597–605. [Google Scholar] [CrossRef]
  11. Crotogino, F.; Mohmeyer, K.U.; Scharf, R. Huntorf CAES: More than 20 Years of Successful Operation. In Proceedings of the Spring 2001 Meeting, Orlando, FL, USA, 15 April 2001.
  12. Van der Linder, S. The case for CAES. Modern Power Systems. Available online: http://www.modernpowersystems.com/features/featurethe-case-for-caes/ (accessed on 18 August 2015).
  13. Concept Screening of Coal Gasification CAES Systems; EPRI Research Report; Electric Power Research Institute: Palo Alto, CA, USA, May 1979.
  14. Schoenung, S.M. Utility energy storage applications studies. IEEE Trans. Energy Convers. 1996, 11, 658–664. [Google Scholar] [CrossRef]
  15. Thumann, A.; Mehta, D.P. Handbook of Energy Engineering, 5th ed.; The Fairmont Press Inc: Anaheim, CA, USA, 2001; pp. 391–418. [Google Scholar]
  16. Liu, W.Y.; Yang, Y.P.; Song, Z.P. Compressed air energy storage and performance simulation. In Proceedings of the China Engineering Thermophysics engineering thermodynamics and energy utilization Conference, Xi’an, China, 8 November 2004; pp. 288–296. (In Chinese)
  17. Liu, W.Y.; Yang, Y.P.; Song, Z.P. Optimization and Performance Simulation of Different CAES Systems. J. Eng. Thermophys. 2005, 6, 25–28. (In Chinese) [Google Scholar]
  18. Huang, Q.H. Steam Turbine and Gas Turbine Principles and Applications; Southeast University Press: Nanjing, China, 2005; pp. 190–205. (In Chinese) [Google Scholar]
  19. Kushnir, R.; Ullmann, A.; Dayan, A. Compressed air flow within aquifer reservoirs of CAES plants. Transp. Porous Media 2010, 81, 219–240. [Google Scholar] [CrossRef]

