Communication

Enzyme-Assisted Extraction of Oil from Wet Microalgae Scenedesmus sp. G4

1
School of Food and Biological Engineering, Jiangsu University, Zhenjiang 212013, Jiangsu, China
2
Key Laboratory of Renewable Energy, Chinese Academy of Sciences, Guangzhou 510640, Guangdong, China
3
Beijing Biomass Energy Technology Center, State Grid Energy Conservation Service Ltd., Beijing 100053, China
*
Author to whom correspondence should be addressed.
Energies 2015, 8(8), 8165-8174; https://doi.org/10.3390/en8088165
Submission received: 17 May 2015 / Revised: 17 July 2015 / Accepted: 24 July 2015 / Published: 5 August 2015

Abstract

:
The enzyme-assisted aqueous extraction of oil from wet microalgae was employed to avoid the energy consumption of a dewatering process. In this paper, oil-rich microalgae Scenedesmus sp. G4 was hydrolyzed by enzyme mixtures for oil extraction. The results showed that the algae concentration had the greatest influence on yield of extracted oil, and the temperature and the ratio of enzyme mixtures affected the results as follows: the maximum yield of oil extracted from Scenedesmus sp. G4 reached 86.1% under optimal conditions with an algae concentration at 2.5 g/L, temperature 30/50 °C, pH 3.5/4.5 and a cellulase:pectinase:hemicellulase ratio of 1:1:1 or 1:2:1 (w/w/w). The results also indicated that the enzyme mixtures had a significant impact on the integrity of microalgae cells and the crystallization index increased from 30.7% to around 36.0% after enzymatic hydrolysis treatment. The cell wall of Scenedesmus sp. G4 has a high content of cellulose Iα and low crystallization, which is beneficial to the oil extraction by the enzyme-assisted hydrolysis method.

Graphical Abstract

1. Introduction

Oil-rich microalgae are fast-growing organisms, able to fix large amounts of CO2 and adapt to various environments. Their development and utilization are regarded as an important measure to contain global warming and guarantee national energy security [1,2]. The cost of large-scale utilization of microalgae energy, however, remains high [3]. Conventional oil extraction methods require dry microorganisms, and one of the major challenges is that the energy costs of a dehydration process before oil extraction are relatively high. Moreover, the conventional methods use chemical solvents that display insufficient recovery of extracts and toxicity and their unrenewable petroleum origin is undesirable. Nowadays, green extraction has become part of the sustainable development and industrial strategy [4,5]. Besides green extraction methods like ultrasound or microwaves [6], as shown in Table 1, enzyme-assisted aqueous extraction does not require a drying process and reduces the use of organic reagents in the extraction process, thus improving the economic efficiency and environmental benefits of the utilization of microalgae energy [7]. Compared with traditional chemical processes, extraction of energy substances using enzymatics method will not affect the quality of value-added biomass, and the high value-added coproduction of bioactivators greatly improves its competitiveness to rival fossil fuel [8].
Table 1. Comparison with conventional extraction methods.
ItemConventional extractionEnzyme-assisted extraction
Dehydration processNeededNo
Organic reagentExcess neededSmall
Quality of value-added biomassAffectedUnaffected
The structure of the cell wall of microalgae is closely related to the effect of enzymolysis. The characteristic specificity of enzymes causes great limitations in single enzyme enzymolysis processes, and the cell walls of microalgae could be more thoroughly and effectively degraded by combining several kinds of enzymes. However mixed enzymatic hydrolysis studies always focus on large terrestrial plants, and hardly ever on methods for treating microscopic plants like microalgae. Also few reports have described the coordinative mechanism of enzymolysis in enzyme-assisted aqueous extraction of oil-rich microalgae.
In order to obtain a higher oil extraction yield, in this paper the oil-rich wet microalgae Scenedesmus sp. G4 was used to extract oil by enzyme-assisted hydrolysis. According to the orthogonal experiments, different extraction conditions were compared such as the ratio of cellulase, pectinase and hemicellulase, and the effects of operational parameters (i.e., pH, temperature and microalgae concentration) on the yield of oil extraction were also investigated. The microalgae enzyme-assisted extraction mechanism was also initially analyzed by using modern methods such as scanning electron microscope (SEM), Fourier transform infrared spectroscopy (FT-IR), and X-ray diffraction (XRD).

2. Materials and Methods

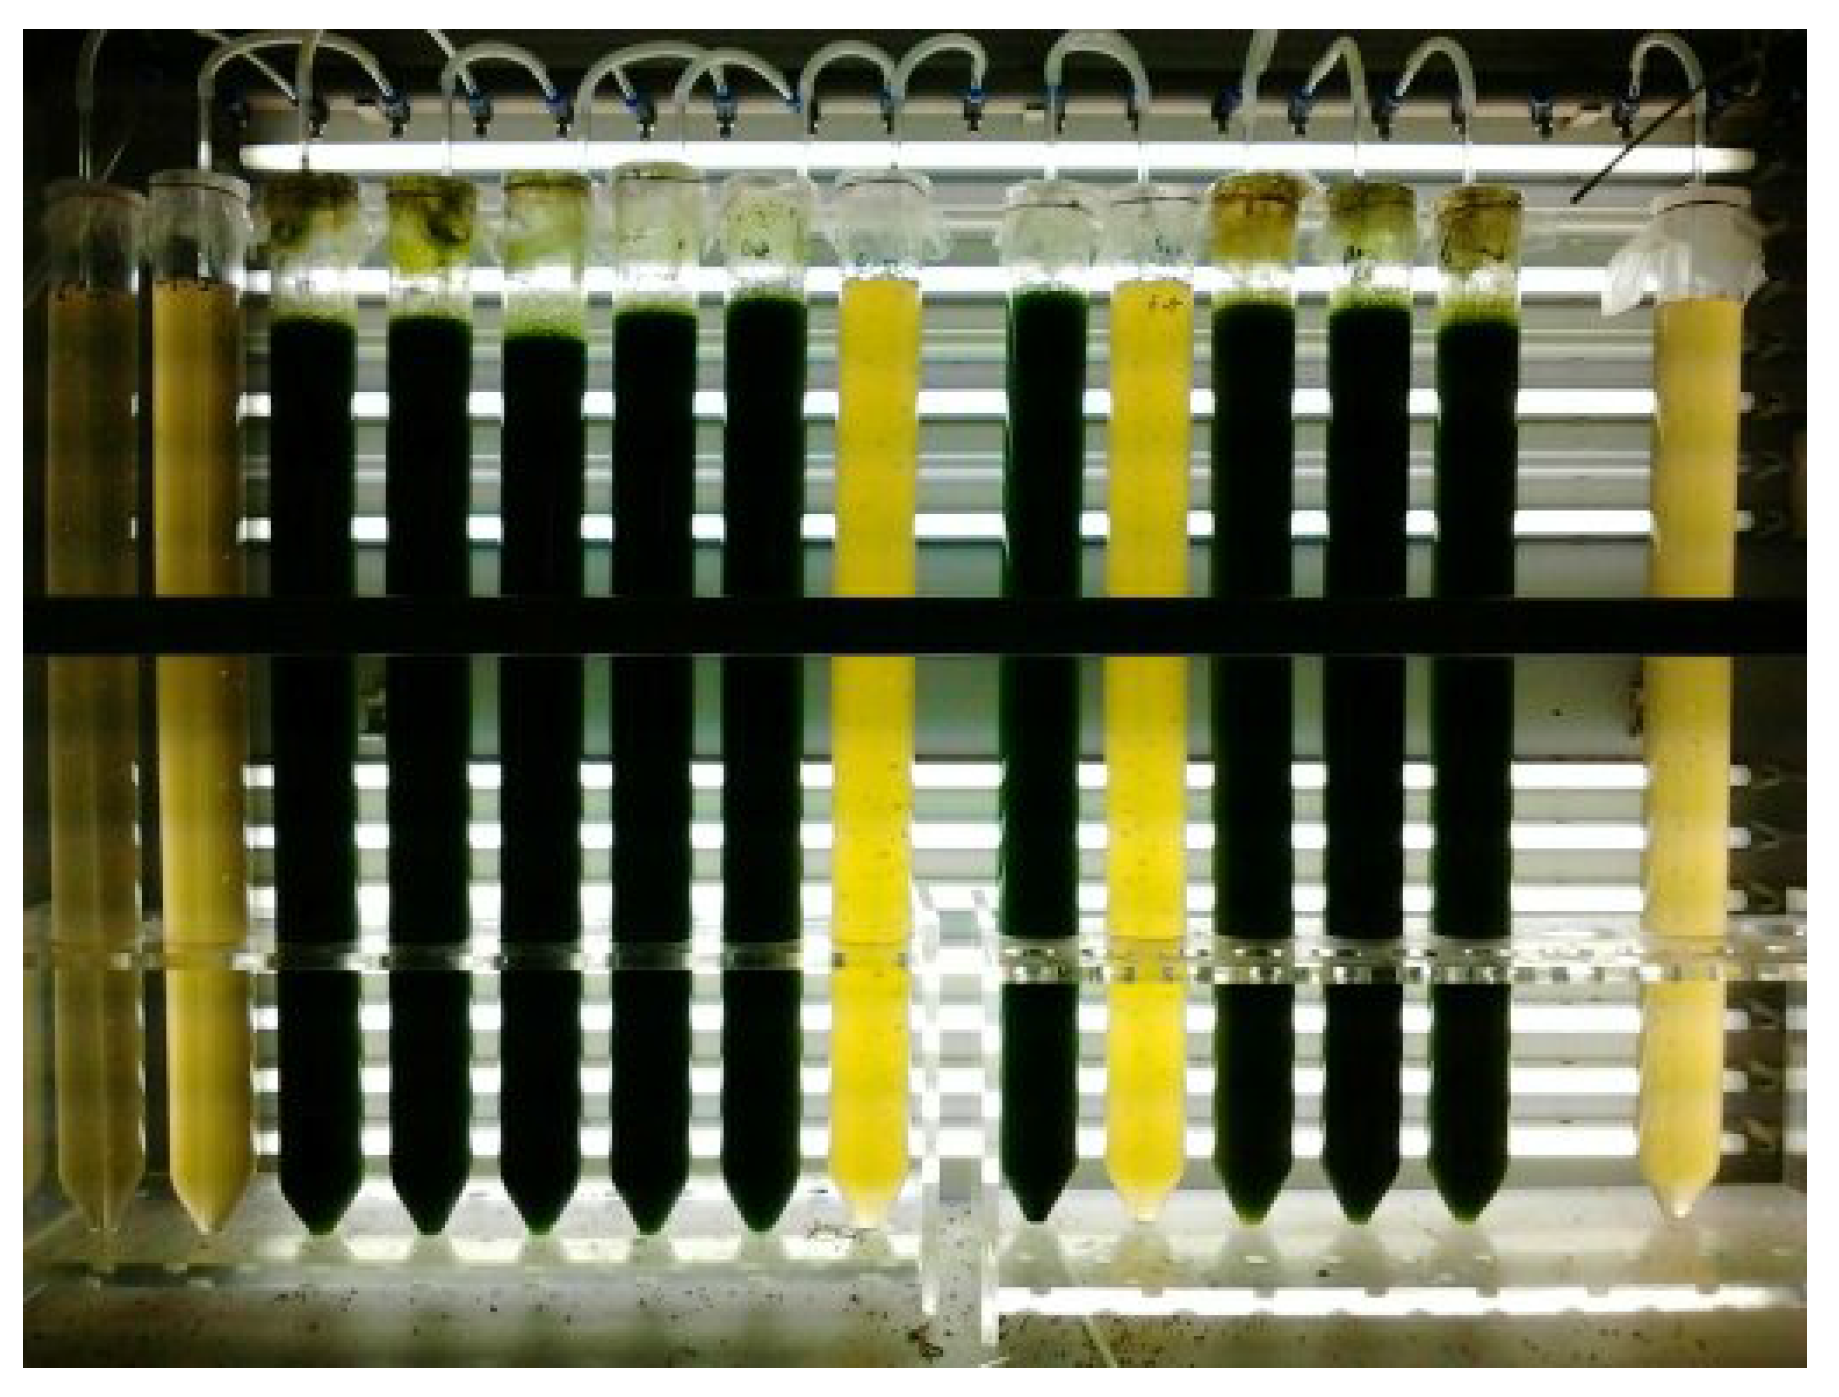
2.1. Microalgal Strain and Culture Conditions

The freshwater green algae Scenedesmus sp. G4 was preserved at the Guangzhou Institute of Energy Conversion, Chinese Academy of Sciences (Guangzhou, Guangdong, China). For the cultivation of this strain, BG11 medium [9] was used. About 100 mL of the pre-culture broths mentioned above were inoculated into a vertical tubular photobioreactor containing 1.0 L medium. The vertical tubular photobioreactor consisted of glass tubes of 70.0 cm height and 5.0 cm outside diameter. Light was supplied by white cool fluorescent lamps (Hengxing-T4, 24W) on one side of the photobioreactor (light intensity: 200 ± 50 μE/(m2 s)). Aeration and mixing were achieved by compressed air enriched with 6.0% CO2 through a glass-filter, which was inserted in the bottom of the reactor and the flow rate of the gas was 0.5 vvm regulated by a gas flow meter (Model G, Aalborg Instruments & Controls, Inc., Orangeburg, NY, USA). The temperature of the culture media was 25 °C ± 1 °C regulated by the room air conditioner (Gree Electric Appliances Inc., Zhuhai, Guangdong, China). A photo of the vertical tubular photobioreactors is shown in Figure 1. After 7 days of cultivation, the cultures were used for oil extraction by enzyme mixture hydrolysis.
Figure 1. Photo of the vertical tubular photobioreactors.
Energies 08 08165 g001

2.2. Measurement Methods of Oil, Protein and Sugar Content

Total oil, protein and sugar content were measured according to Bigogno et al.’s method [10], Chu et al.’s method [11] and Yemm and Willis’s method [12], respectively. The contents of oil, protein and sugar in dry weight (g/g dry weight) of Scenedesmus sp. G4 were 48.8%, 21.8% and 24.1%, respectively.

2.3. Enzyme Mixtures

Cellulase was purchased from Heshibi Biotechnology Co., Ltd. (Yinchuan, Ningxia, China) which was extracted from the fermentation liquor of Penicillium sp. cultures. Enzyme protein accounted for 10.08% (g/g dry weight). Pectinase and hemicellulase, both obtained from Yuanye Biotechnology Co., Ltd. (Shanghai, China) were extracted from the fermention of Aspergillus niger cultures. Protein accounted for 8.70% and 4.17% (g/g dry weight), respectively, in these substances.

2.4. Enzyme Assays

The filter paper enzyme activity of cellulase was measured according to method of the Commission on Biotechnology of the International Union of Pure and Applied Chemistry (IUPAC) [13]. Pectinase activity was evaluated by the method described by Meneghel et al. [14]. Hemicellulase activity was analyzed by xylanase activity measured according to Diogo et al.’s method [15]. The filter paper enzyme activity of cellulase was 7.2 U/mg protein. The enzyme activities of pectinase and hemicellulase were 500 U/mg protein and 1.5 U/mg protein, respectively.

2.5. Measurement of Oil Extraction

The enzymatic hydrolysis was performed in a 100 mL conical flask containing 30 mL of buffer solution. The enzymatic treatment was incubated in a water-bath shaker at 150 rpm for 72 h. The enzyme concentration was 2.0%. After enzymatic hydrolysis treatment, 20 mL hexane was added to each sample. The suspension obtained was mixed by a vortex mixer. Thereafter, the suspension was centrifuged at 5000 rpm for 5 min at 25°C. The supernatant was transferred to an evaporation flask. The solvent of the supernatant was eliminated by a vacuum rotary evaporator set at 30°C. The residue was re-extracted twice within 30 min. The flask was cooled and weighed to determine the oil content [7]. During the oil extraction process, 0.01% butylated hydroxytoluene (BHT) was added as antioxidant.

2.6. Orthogonal Array Testing of Enzyme Mixtures Hydrolysis

The orthogonal parameters were designed as shown in Table 2. Sodium azide, accounting for 0.03%, was added. In order to find the optimum condition of oil extraction, intuitive analysis was used.
Table 2. Levels and factors of orthogonal experiment for enzymatic hydrolysis.
FactorsAlgae concentration (g/L)Temperature (°C)pHCellulase:pectinase:hemicellulase (dry weight ratio of protein)
Level12.5303.51:1:1
25.0404.02:1:1
37.5504.51:2:1
410.0605.01:1:2

2.7. Scanning Electron Microscopy

In order to observe the variations on the surface morphologies of microalgae after alkaline flocculation, these samples were examined using a high-resolution SEM (Model No.: S-3700N; Hitachi Co., Tokyo, Japan), which was operated at 10–20 kV accelerating potential. Prior to the observation, the surface of the sample was coated with a thin, electric conductive gold film.

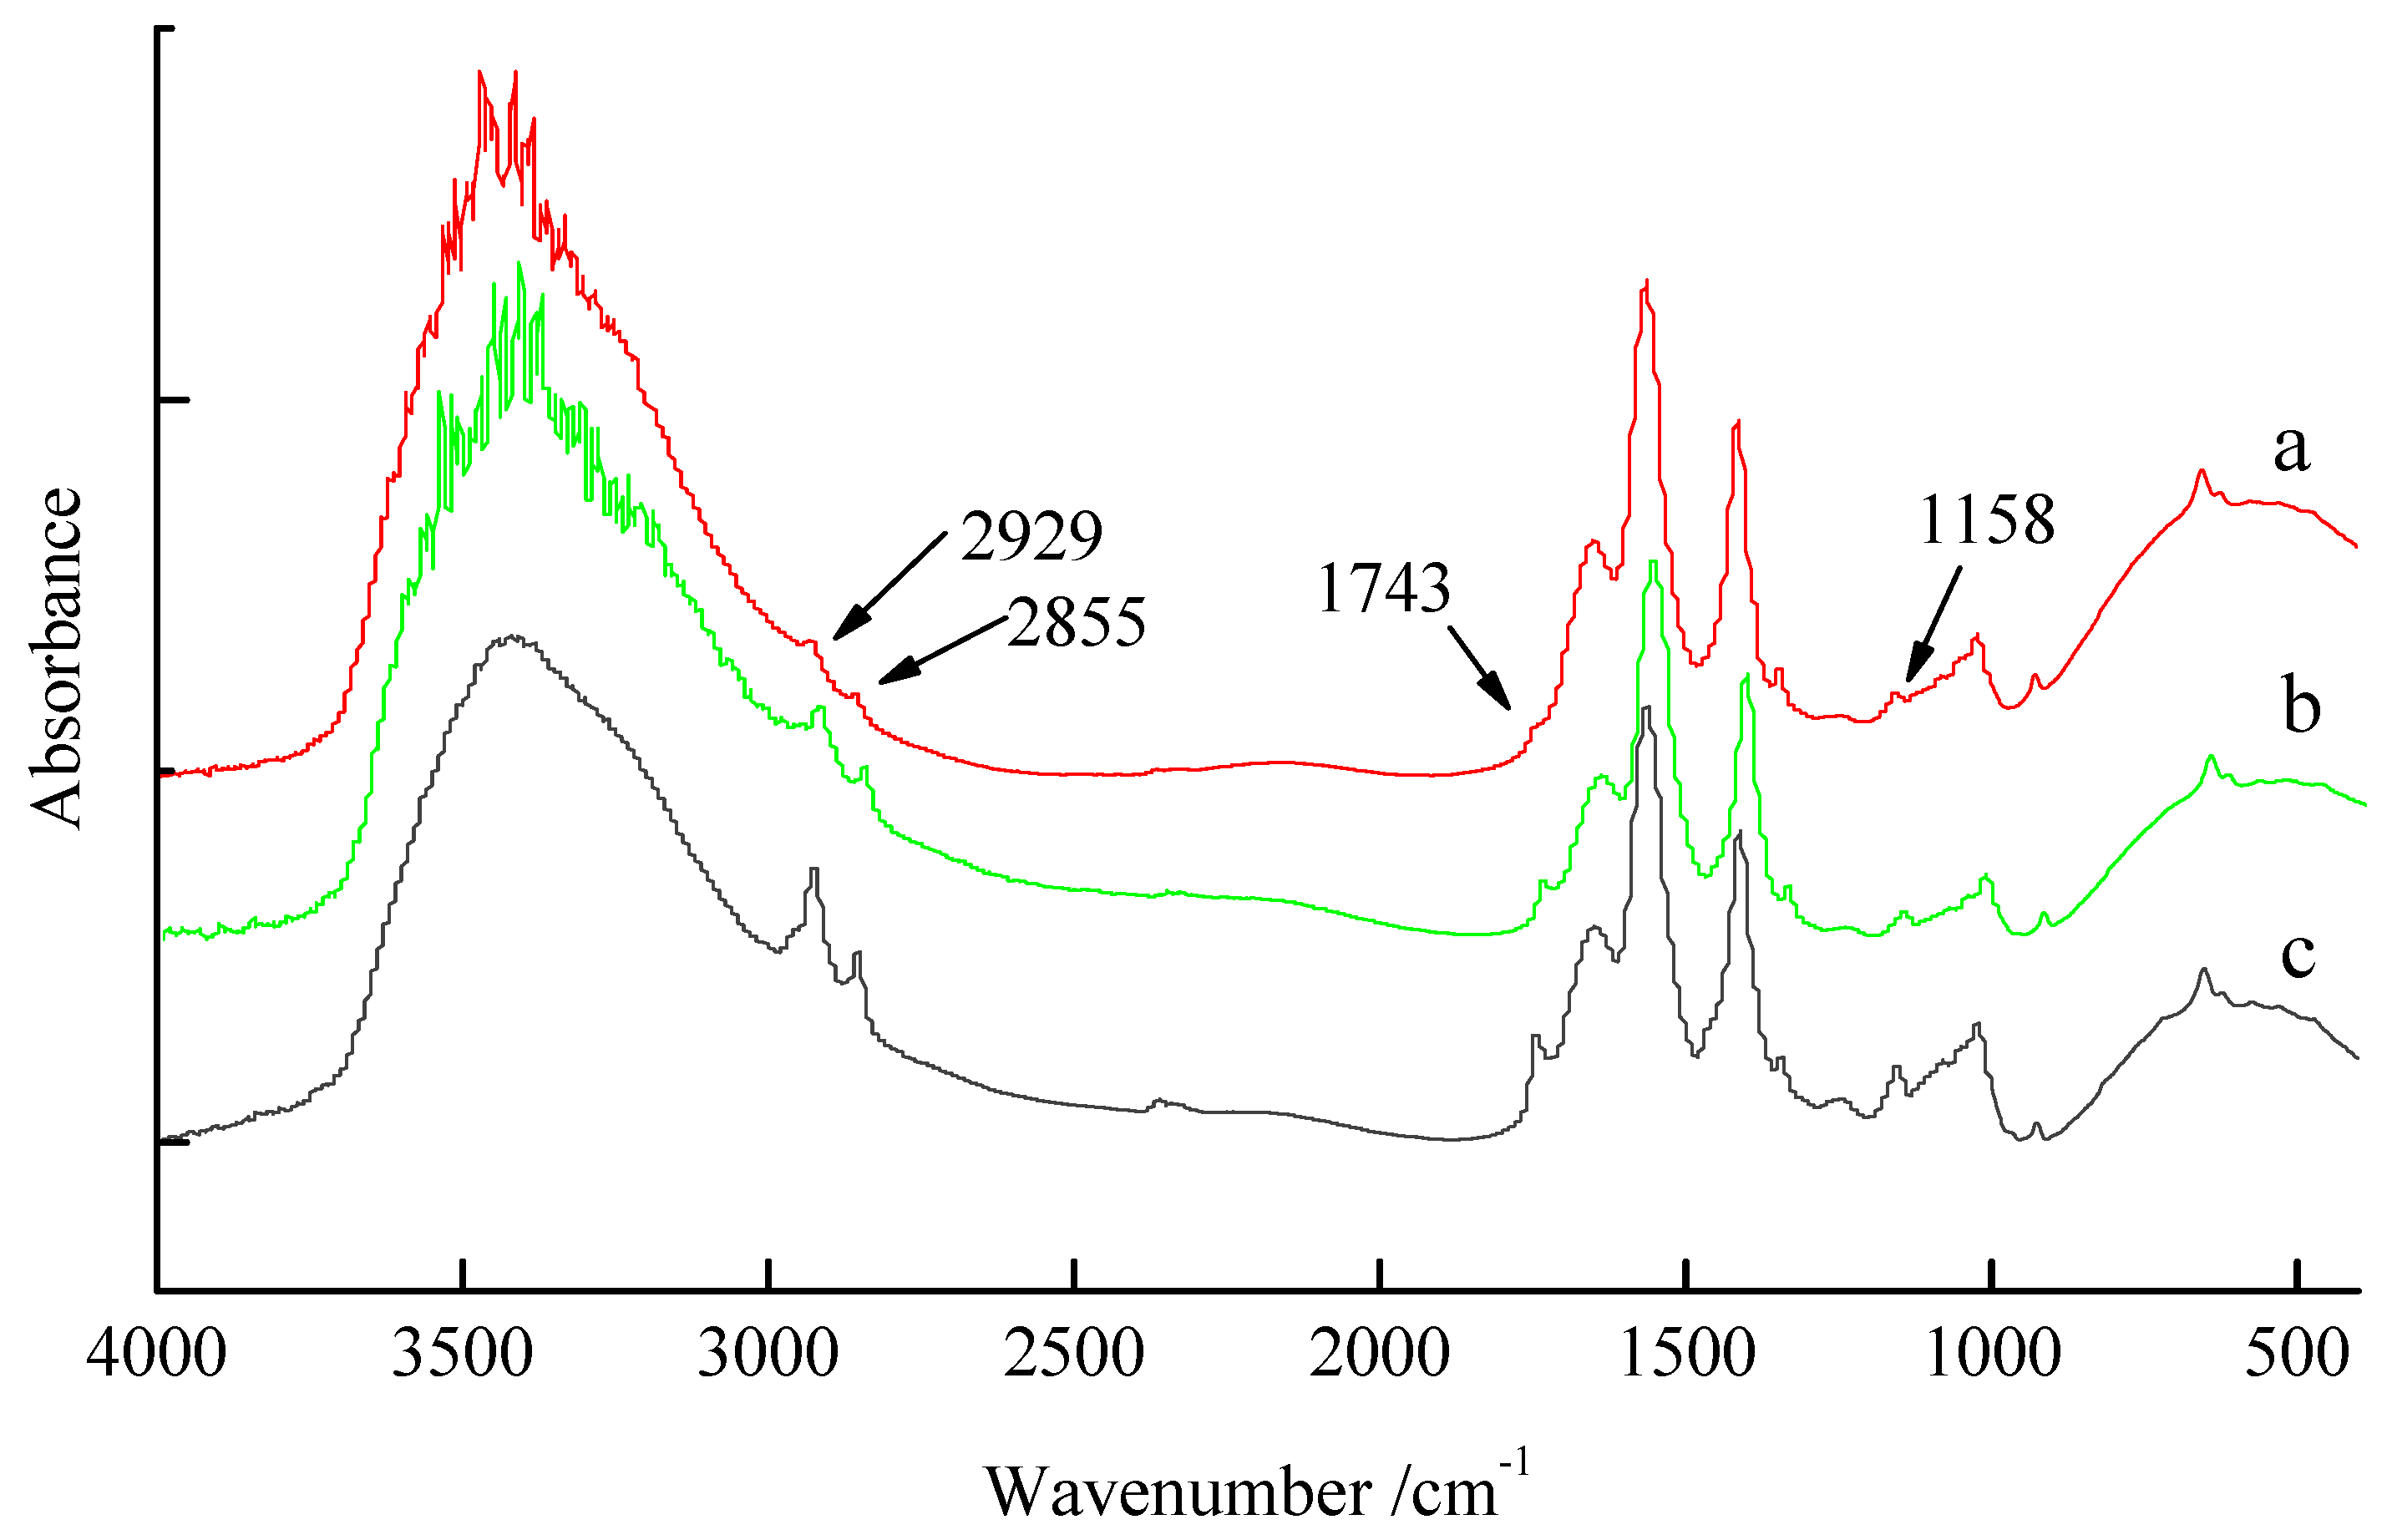
2.8. Fourier Transform Infrared Spectroscopy Analysis

Infra-red spectra (IR) of the freeze-dried microalgae were measured on a KBr disk with a Tensor 27 FT-IR (Bruker, Billerica, MA, USA) to determine the functional groups of the microalgae cell surface. Absorbance spectra were collected at wavenumbers between 4500 cm−1 and 400 cm−1 with a nominal resolution of 2 cm−1 with 64 scans collected for data acquisition. An empty well served as the background reference for each microplate.

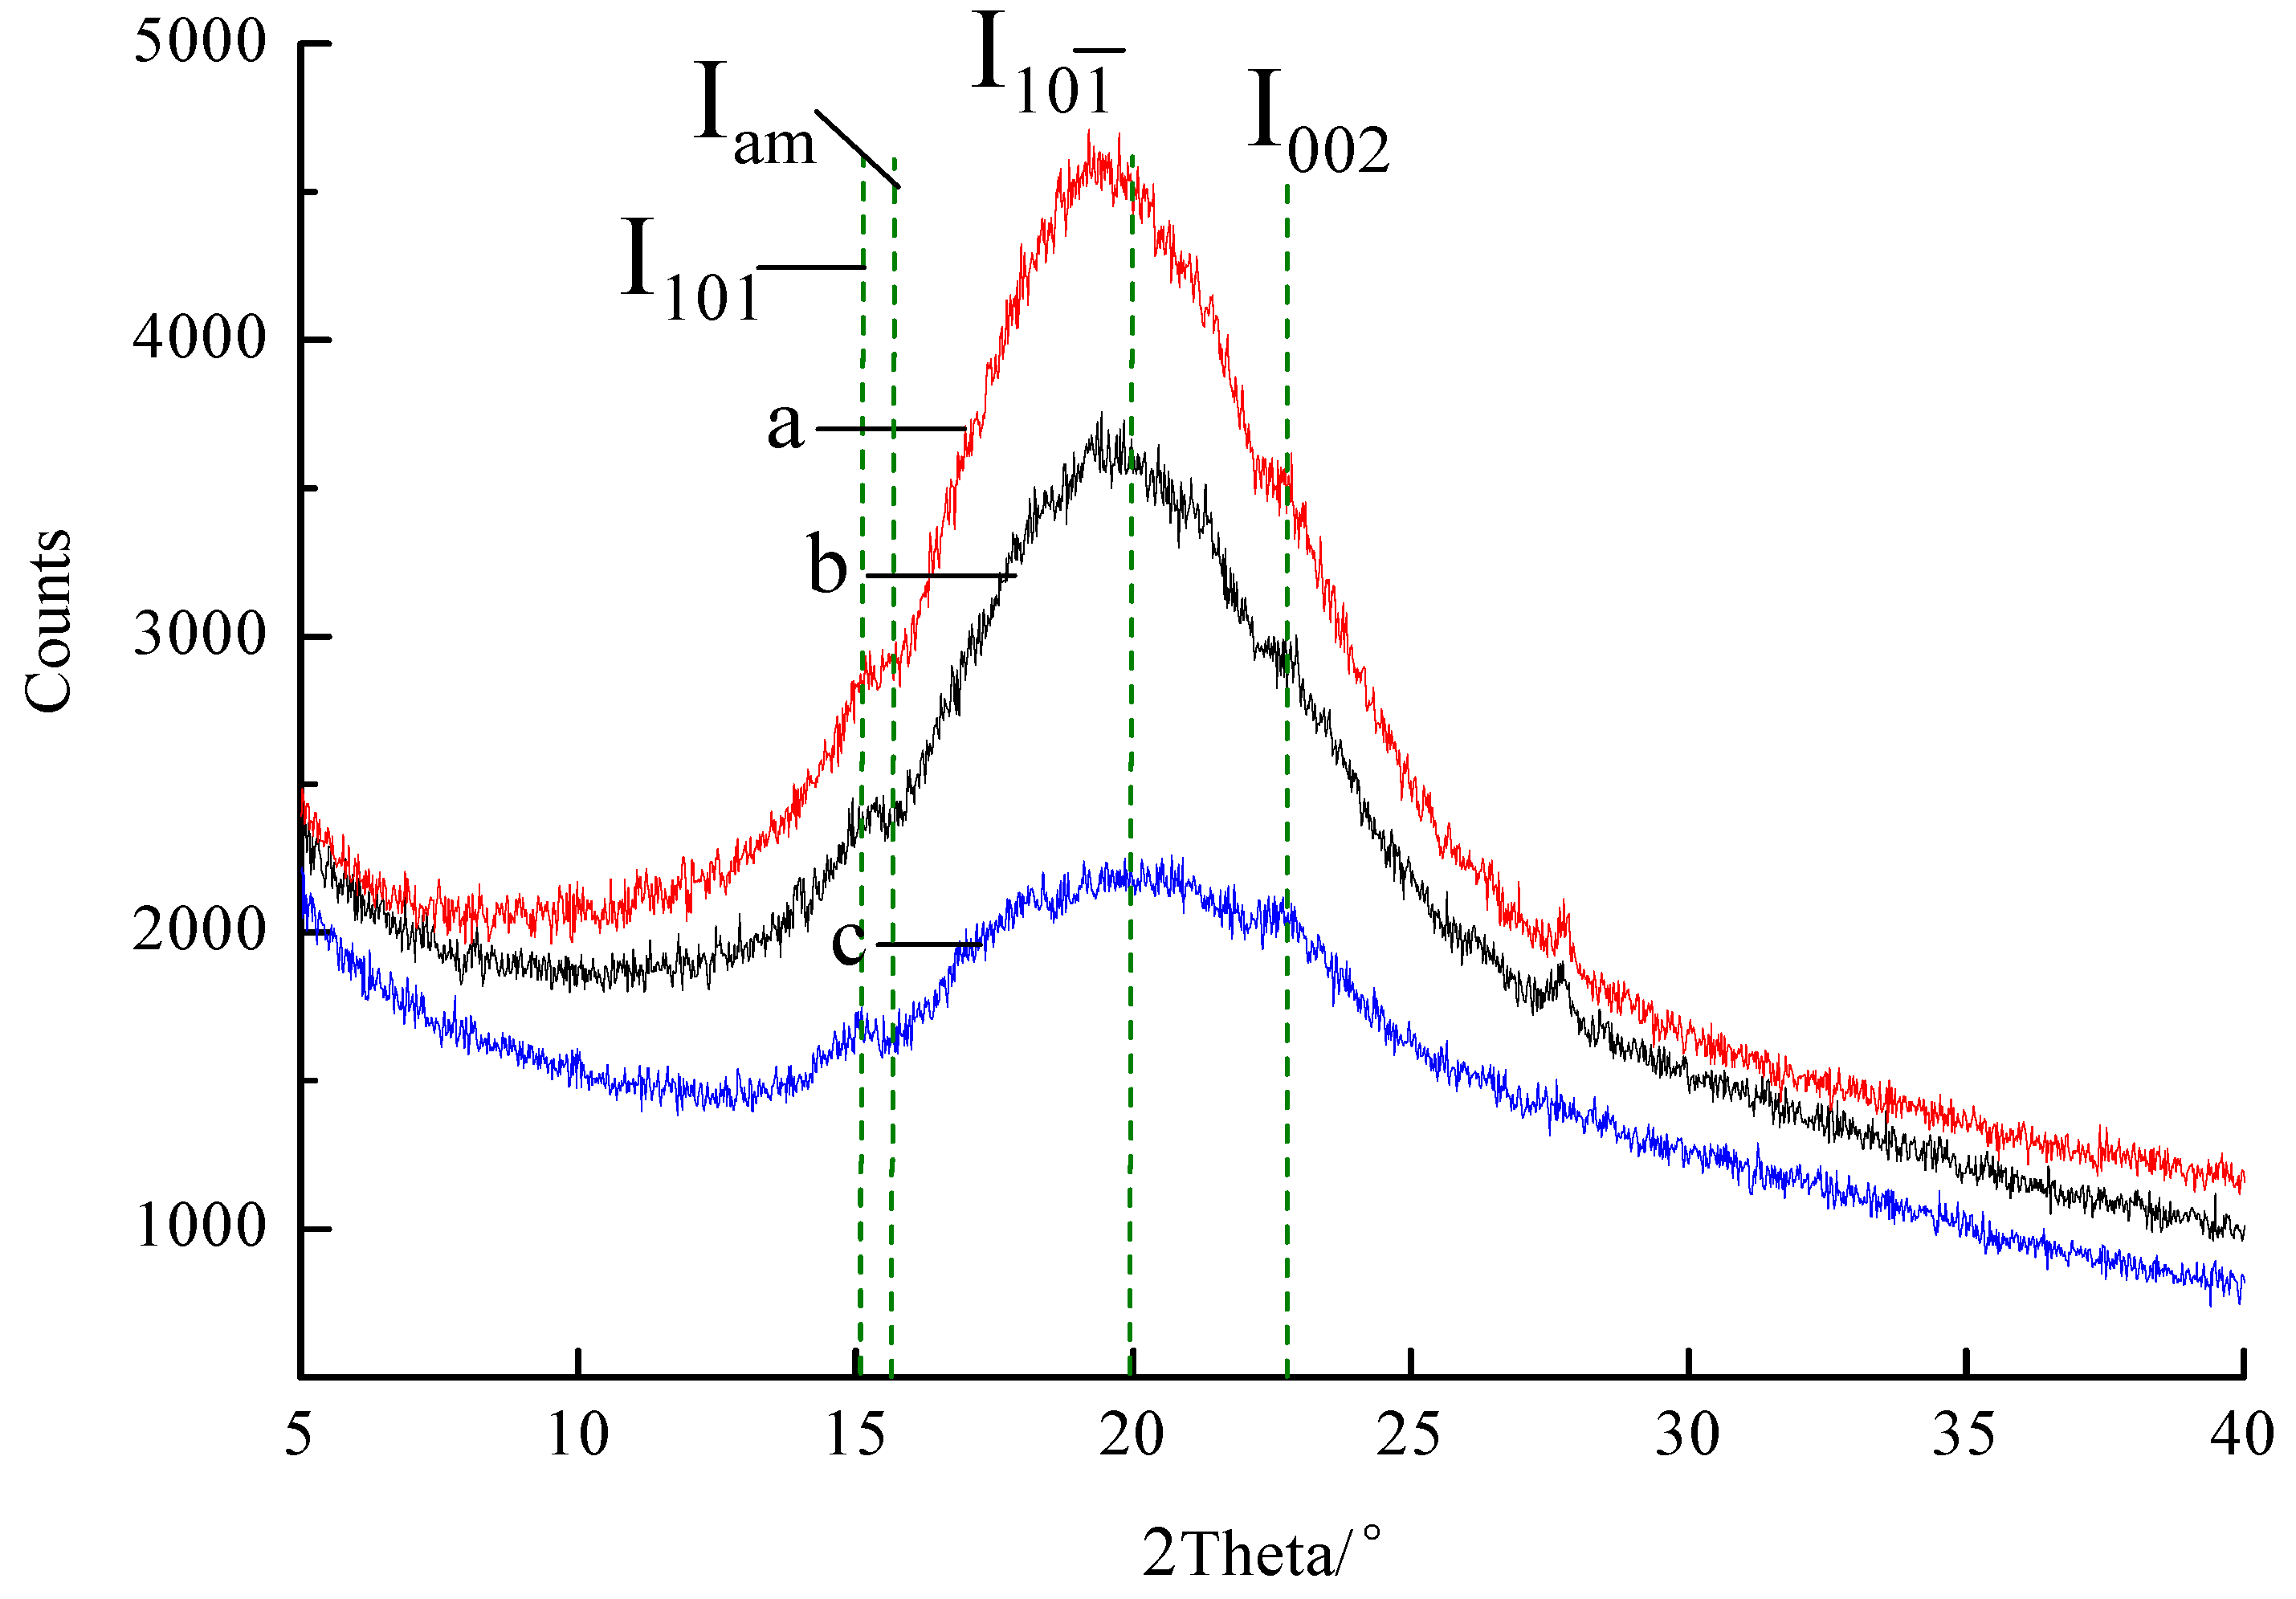
2.9. X-Ray Diffraction Analysis

XRD measurements of the freeze-dried algal powder before and after alkaline flocculation were carried out on X’Pert Pro-MPD diffractometer (Panalytical, Almelo, The Netherlands) using the planar monochromator method and Cu Kα radiation (wavelength of 0.15406 nm). The samples were placed on a silicon holder. XRD data were collected in the range of 5°–80°, a step length of 0.017°, the radioactive rays under a voltage of 40 kV and an electric current of 40 mA. The crystallization index (CrI, %) will be calculated with equation [16,17]:
C r I = I main I am I main × 100
Imain is the diffraction intensity of the main peak (2θ = 20.1°) and Iam is the diffraction intensity of base line (2θ = 15.3°).

3. Results and Discussion

3.1. Results of Orthogonal Array Testing on the Enzymatic Hydrolysis

Pectinase, cellulase and hemicellulase were chosen as components of the enzyme mixtures. Compared with single enzymes, enzyme mixtures could further enlarge the channels of algae cell walls, to easily separate the oil molecules from the cells. Table 3 shows that different parameters had very different effects on the oil extraction yield. The algae concentration had the greatest influence on the yield of oil extraction, followed by the temperature and the ratio of the enzyme mixtures. The pH had the least influence on the oil extraction process. According to the test results shown in Table 4, the maximum yield of extraction oil reached 86.1% under the optimal conditions of 2.5 g/L algae concentration, 30/50 °C temperature, pH 3.5/4.5, and a cellulase:pectinase:hemicellulase ratio of 1:1:1 (w/w/w) or 1:2:1 (w/w/w).
Table 3. Analysis of variance (ANOVA) for the orthogonal test.
FactorSum of squaresDegree of freedomF-valueSignificance
Algae concentration (g/L)7907.023311.336*
Temperature (°C)619.91330.889-
pH2.69330.004-
Cellulase:pectinase:hemicellulase (dry weight ratio of protein)200.72330.288-
Pure error697.533--
Table 4. Results of orthogonal tests on the yield of oil extraction from Scenedesmus sp. G4 by enzyme-assisted hydrolysis.
No.Algae concentration (g/L)Temperature (°C)pHCellulase:pectinase:hemicellulase (dry weight ratio of protein)Yield (%)
12.5303.51:1:186.1
22.5404.02:1:161.5
32.5504.51:2:186.1
42.5605.01:1:269.7
55.0304.01:2:141.0
65.0403.51:1:230.7
75.0505.01:1:151.2
85.0604.52:1:134.8
97.5304.51:1:223.2
107.5405.01:2:120.5
117.5503.52:1:127.3
127.5604.01:1:128.7
1310305.02:1:116.4
1410404.51:1:112.3
1510504.01:1:228.7
1610603.51:2:116.4
I75.85041.67040.12544.575-
II39.42531.25039.97535.000-
III24.92548.32539.10041.000-
IV18.45037.40039.45038.075-
R57.40017.0751.0259.575-
I, II, III, IV—sum of coverage rate of Levels 1–4, respectively. R: the difference between the largest sum value and the smallest sum value of each factor.

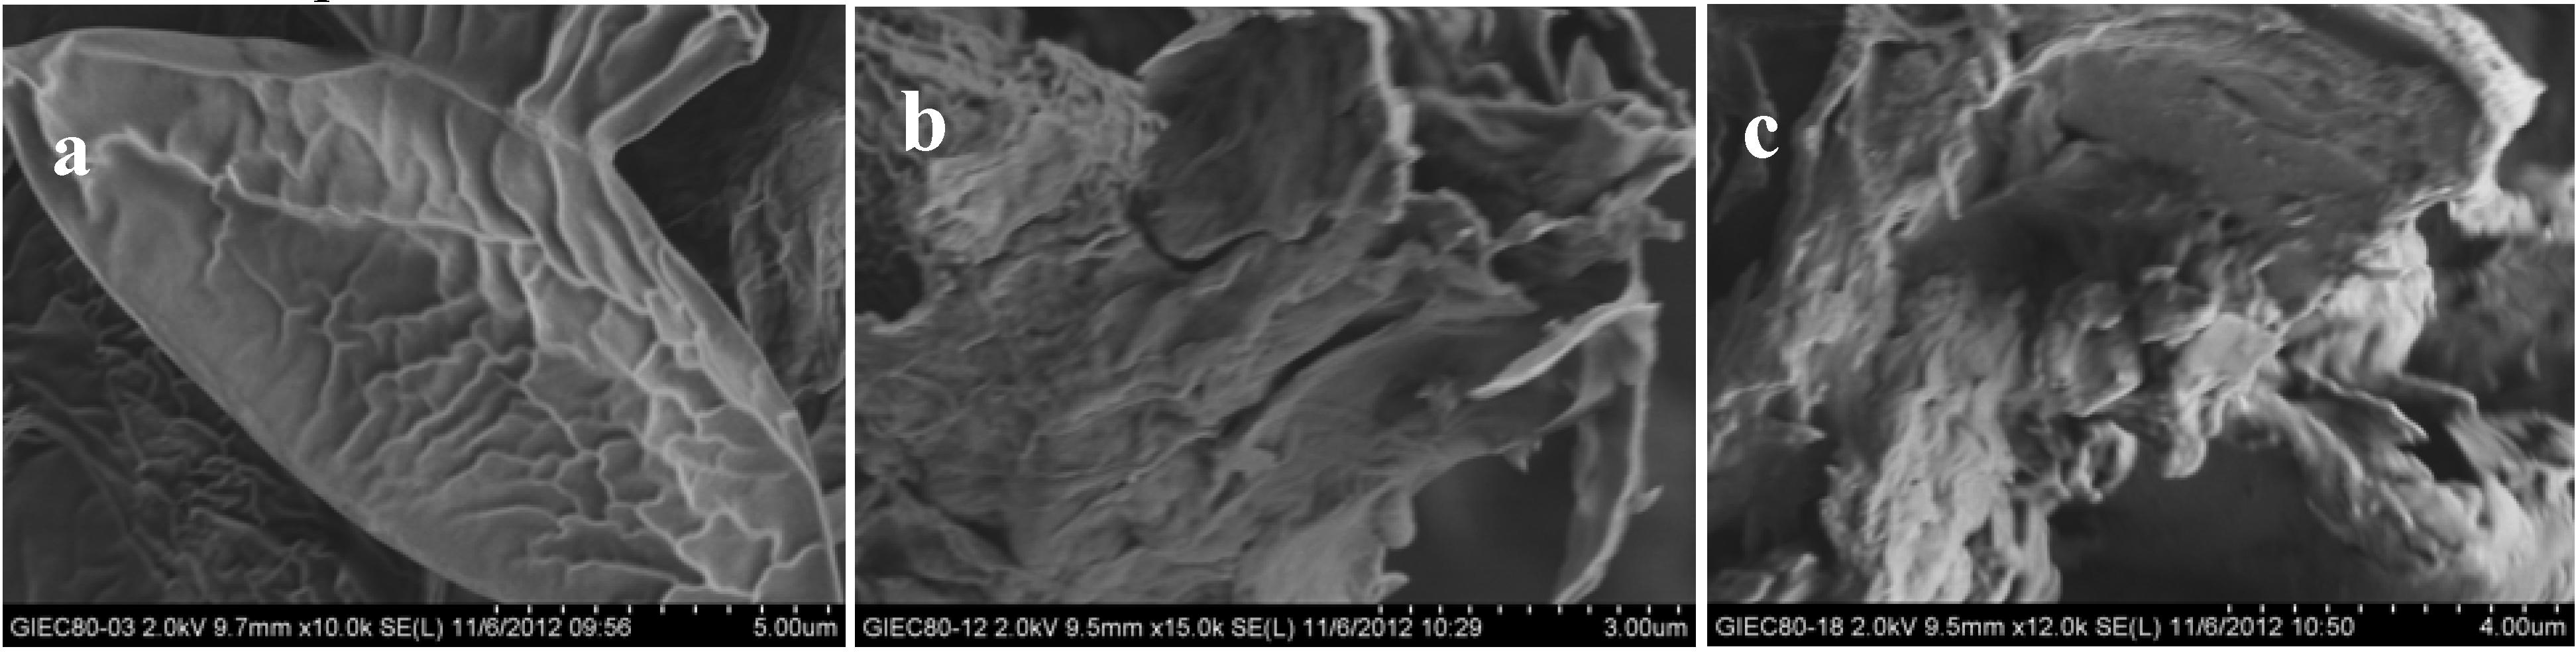
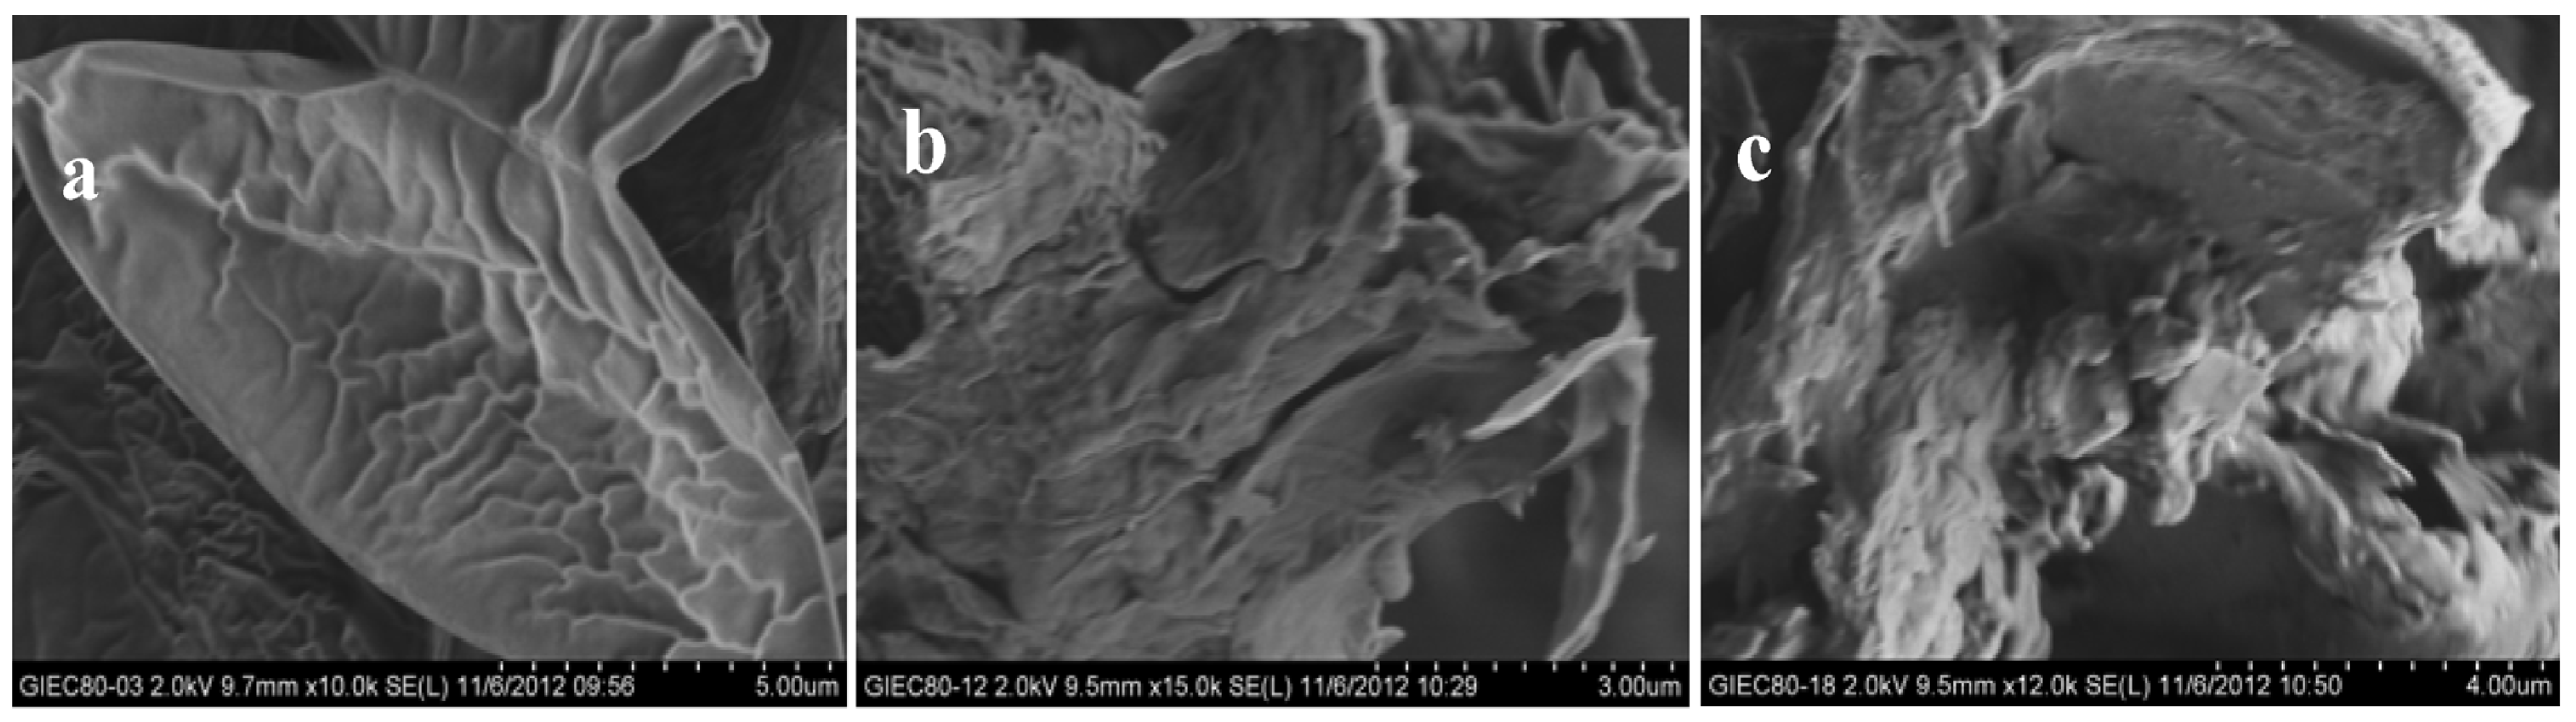
3.2. Scanning Electron Microscope Analysis of the Enzymatic Hydrolysis Products

As Figure 2 shows, before enzymatic hydrolysis Scenedesmus sp. G4 cells presented a smooth surface, the cellular morphology was clear and the cell walls complete.
Figure 2. Scanning electron microscope (SEM) micrographs of Scenedesmus sp. G4 cultures: (a) before enzymatic hydrolysis; (b) hydrolyzed by enzyme mixtures 60 h, pH = 3.5; and (c) hydrolyzed by enzyme mixtures 60 h, pH = 4.5.
Energies 08 08165 g002
After hydrolysis by enzyme mixtures, the cell surface was rough and significant cell lysis occurred. The enzyme mixtures significantly damaged the intactness of microalgae cells, destroying the cell wall structure which was good for the next step of oil extraction.

3.3. The X-ray Diffraction Analysis of the Enzymatic Hydrolysis Products

As shown in Figure 3, the changes in the microalgae Scenedesmus sp. G4 after enzymatic hydrolysis were not significant according to the XRD results. The characteristic peaks at the positions of diffraction angles at 14.7°, 16.8°, 20.5° and 22.7° were attributed to the diffraction planes of 101, 10 1 ¯ , 021 and 002 in cellulose I. Since the composition of green algae basically do not contain lignin, and the content of cellulose Iα was relatively high, while typical lignocellulosic biomass has a relatively higher content of cellulose Iβ [18,19,20], the hydrogen bond in molecules of cellulose Iα was relatively weak, making the enzymolysis of endoglucanase easy [21] to facilitate the next step of oil extraction process. The crystallization index of Scenedesmus sp. G4 was increased after enzymatic hydrolysis. Figure 3 also shows that the crystallization index of Scenedesmus sp. G4 changes from 30.7% before enzyme hydrolysis to 36.0% after enzymatic hydrolysis.
Figure 3. X-ray diffraction (XRD) patterns of Scenedesmus sp. G4 cultures: (a) before enzyme hydrolysis; (b) hydrolyzed by enzyme mixtures 60 h, pH = 3.5; and (c) hydrolyzed by enzyme mixtures 60 h, pH = 4.5.
Energies 08 08165 g003

3.4. The Fourier Transform Infrared Spectroscopy Analysis of Enzymatic Hydrolysis

The FT-IR spectra of the algae Scenedesmus sp. G4 before and after enzymatic hydrolysis are shown in Figure 4 [22,23]. The main component of the cell walls of green algae is cellulose, which is a glucose polymer connected by β-D-,4-glucosidic bonds. As shown in Figure 4 the broad peak at 3500–3300 cm−1 was attributed to –OH under the atomic force of H and O or –NH stretching vibrations. The carboxyl group absorption was located in the range of 2400–3300 cm−1. The small shoulder at 2929 cm−1 might be the vibration peak of associated carboxyl/phenolic groups. Compared with the microalgae Scenedesmus sp. G4 before enzymatic hydrolysis, the absorptions at 2929 cm−1, 2855 cm−1, 1743 cm−1, 1158 cm−1 were increased after enzymatic hydrolysis. The cellulose and hemicellulose were exposed by the enzymatic hydrolysis. The cell wall bonds were changed by the mixed enzymatic hydrolysis, which improved the oil extraction significantly.
Figure 4. Figure4. The changes of organic functional groups on Scenedesmus sp. G4 cultures: (a) before enzyme hydrolysis; (b) hydrolyzed by enzyme mixtures 60 h, pH = 4.5; and (c) hydrolyzed by enzyme mixtures 60 h, pH = 3.5.
Energies 08 08165 g004

4. Conclusions

Experimental results showed that oil extraction from wet microalgae can be directly carried out by enzyme-assisted extraction. The algae concentration had the greatest influence on oil extraction yield, followed by the temperature and the ratio of enzyme mixtures. The enzyme mixtures had a significant impact on the integrity of microalgae cells and the crystallization index was increased from 30.7% to around 36.0% after enzymatic hydrolysis. The cell wall of Scenedesmus sp. G4 with its high content of cellulose Iα and low crystallization index, was beneficial to the oil extraction by the enzyme-assisted hydrolysis method. The enzyme-assisted extraction of oil from wet microalgae could be a valid alternative to the conventional ways.

Acknowledgments

This research was funded by the China Postdoctoral Science Foundation (2014M551519 and 2015T80502), the 12th Five Year Support Plan of the Ministry of Science and Technology, China (2011BAD14B03), the Natural Science Foundation of Jiangsu Province (BK20140540), the Senior Talent Scientific Research Initial Funding Project of Jiangsu University (14JDG024), the State Grid Science and Technology Program (No. SGECS56-2014), the key Laboratory of Renewable Energy, Chinese Academy of Sciences (No. y507k11001) and the Priority Academic Program Development of Jiangsu Higher Education Institutions.

Author Contributions

Shuhao Huo wrote the main part of the paper and performed the experiments. Zhongming Wang conceived the experiments. Fengjie Cui and Bin Zou revised the paper. Pengxiang Zhao and Zhenhong Yuan read and approved the manuscript.

Conflicts of Interest

The authors declare no conflict of interest.

References

  1. Demirbas, A.; Demirbas, M.F. Algae Energy: Algae as a New Source of Biodiesel; Springer-Verlag: London, UK, 2010. [Google Scholar]
  2. Huo, S.; Dong, R.; Wang, Z.; Pang, C.; Yuan, Z.; Zhu, S.; Chen, L. Available resources for algal biofuel development in China. Energies 2011, 4, 1321–1335. [Google Scholar] [CrossRef]
  3. National Algal Biofuels Technology Roadmap; U.S. Department of Energy: Washington, DC, USA, 2010.
  4. Rombaut, N.; Tixier, A.S.; Bily, A.; Chemat, F. Green extraction processes of natural products as tools for biorefinery. Biofuels Bioprod. Biorefining 2014, 8, 530–544. [Google Scholar] [CrossRef]
  5. Chemat, F.; Vian, M.A.; Cravotto, G. Green extraction of natural products: Concept and principles. Int. J. Mol. Sci. 2012, 13, 8615–8627. [Google Scholar] [CrossRef] [PubMed]
  6. Mason, T.J. The extraction of natural products using ultrasound or microwaves. Curr. Org. Chem. 2011, 15, 237–247. [Google Scholar] [CrossRef]
  7. Liu, Y.; Zhang, X.; Tan, T. Enzyme-aided extraction of lipid from wet microalgae chlorella vulgaris. J. Bioprocess Eng. Biorefinery 2013, 4, 193–197. [Google Scholar] [CrossRef]
  8. Romero García, J.M.; Acién Fernández, F.G.; Fernández Sevilla, J.M. Development of a process for the production of L-amino-acids concentrates from microalgae by enzymatic hydrolysis. Bioresour. Technol. 2012, 112, 164–170. [Google Scholar] [CrossRef] [PubMed]
  9. Rippka, R.; Deruelles, J.; Waterbury, J.; Herdman, M.; Stanier, R. Generic assignments, strain histories and properties of pure cultures of cyanobacteria. J. Gen. Microbiol. 1979, 111, 1–61. [Google Scholar] [CrossRef]
  10. Bigogno, C.; Khozin-Goldberg, I.; Boussiba, S.; Vonshak, A.; Cohen, Z. Lipid and fatty acid composition of the green oleaginous alga Parietochloris incisa, the richest plant source of arachidonic acid. Phytochemistry 2002, 60, 497–503. [Google Scholar] [CrossRef]
  11. Chu, W.L.; Phang, S.; Goh, S.H. Environmental effects on growth and biochemical composition of Nitzschia inconspicua Grunow. J. Appl. Phycol. 1996, 8, 389–396. [Google Scholar] [CrossRef]
  12. Yemm, E.W.; Willis, A.J. The estimation of carbohydrates in plant extracts by anthrone. Biochem. J. 1954, 57, 508–514. [Google Scholar] [PubMed]
  13. Ghose, T.K. Ghose Measurements of cellulase activities. Pure Appl. Chem. 1987, 2, 257–268. [Google Scholar]
  14. Meneghel, L.; Reis, G.P.; Reginatto, C.; Malvessi, E.; da Silveira, M.M. Assessment of pectinase production by Aspergillus oryzae in growth-limiting liquid medium under limited and non-limited oxygen supply. Process Biochem. 2014, 49, 1800–1807. [Google Scholar] [CrossRef]
  15. Diogo, J.A.; Hoffmam, Z.B.; Zanphorlin, L.M.; Cota, J.; Machado, C.B.; Wolf, L.D.; Squina, F.; Damásio, A.R.; Murakami, M.T.; Ruller, R. Development of a chimeric hemicellulase to enhance the xylose production and thermotolerance. Enzym. Microb. Technol. 2015, 69, 31–37. [Google Scholar] [CrossRef] [PubMed]
  16. Bernhardt, H.; Hoyer, O.; Schell, H.; Lusse, B. Reaction mechanisms involved in the influence of algogenic matter on flocculation. Wasser Abwasser Forsch. 1985, 18, 67–75. [Google Scholar]
  17. Henderson, R.K.; Parsons, S.A.; Jefferson, B. The impact of differing cell and algogenic organic matter (AOM) characteristics on the coagulation and flotation of algae. Water Res. 2010, 44, 3617–3624. [Google Scholar] [CrossRef] [PubMed] [Green Version]
  18. Hayashi, N.; Sugiyama, J.; Okano, T.; Ishihara, M. Selective degradation of the cellulose Iα component in Cladophora cellulose with Trichoderma viride cellulase. Carbohydr. Res. 1997, 305, 109–116. [Google Scholar] [CrossRef]
  19. Atalla, R.H.; Van der Hart, D.L. Native cellulose: A composite of two distinct crystalline forms. Science 1984, 223, 283–285. [Google Scholar] [CrossRef] [PubMed]
  20. Van der Hart, D.L.; Atalla, R.H. Studies of microstructure in native celluloses using solid-state carbon-13 NMR. Macromolecules 1984, 17, 1465–1472. [Google Scholar] [CrossRef]
  21. Daroch, M.; Geng, S.; Wang, G. Recent advances in liquid biofuel production from algal feedstocks. Appl. Energy 2013, 102, 1371–1381. [Google Scholar] [CrossRef]
  22. Zhang, J.; Ma, X.; Yu, J.; Zhang, X.; Tan, T. The effects of four different pretreatments on enzymatic hydrolysis of sweet sorghum bagasse. Bioresour. Technol. 2011, 102, 4585–4589. [Google Scholar] [CrossRef] [PubMed]
  23. Zhao, X.; Wang, X.; Liu, D.H. Peracetic acid pretreatment of sugarcane bagasse for enzymatic hydrolysis: A continued work. J. Chem. Technol. Biotechnol. 2008, 83, 950–956. [Google Scholar] [CrossRef]

