Article

Economic Value of Li-ion Energy Storage System in Frequency Regulation Application from Utility Firm’s Perspective in Korea

1
College of Business Administration, Inha University, Incheon 431050, Korea
2
College of Business Administration, University of Seoul, Seoul 130743, Korea
3
Graduate School of Logistics, Incheon National University, Incheon 406772, Korea
4
College of Business and Technology, Seoul National University of Science and Technology, Seoul 139743, Korea
5
KEPCO Research Institute, Daejeon 305760, Korea
*
Author to whom correspondence should be addressed.
Energies 2015, 8(6), 5000-5017; https://doi.org/10.3390/en8065000
Submission received: 20 March 2015 / Revised: 13 May 2015 / Accepted: 20 May 2015 / Published: 28 May 2015

Abstract

:
Energy Storage Systems (ESSs) have recently been highlighted because of their many benefits such as load-shifting, frequency regulation, price arbitrage, renewables, and so on. Among those benefits, we aim at evaluating their economic value in frequency regulation application. However, unlike previous literature focusing on profits obtained from participating in the ancillary service market, our approach concentrates on the cost reduction from the perspective of a utility firm that has an obligation to pay energy fees to a power exchange. More specifically, we focus on the payments between the power exchange market and the utility firm as a major source of economic benefits. The evaluation is done by cost- benefit analysis (CBA) with a dataset of the Korean market while considering operational constraint costs as well as scheduled energy payments, and a simulation algorithm for the evaluation is provided. Our results show the potential for huge profits to be made by cost reduction. We believe that this research can provide a guideline for a utility firm considering investing in ESSs for frequency regulation application as a source of cost reduction.

1. Introduction

In a traditional generation setting, electricity, in its technical characteristics, cannot be stored, which means that if there is demand, the demand should be fulfilled right away. This implies that a power system should always secure sufficient generation capacity to meet the highest demand at peak times, even though demand stays lower for most of the time. In fact, such inefficiency is becoming more problematic as peak time demands keep soaring faster than average demands.
In this respect, Energy Storage Systems (ESS) have been paid great attention because they are believed to enhance power system efficiency due to their capability of discharging, storing, and charging electricity within a very short time interval. In fact, a variety of applications of ESS have been proposed, including peak-time shifting, load balancing, provision of ancillary services, and quality enhancement. However, despite their remarkable pace of technological advancement, adoption of ESS is still in the early stage, particularly for grid utility-related applications.
Despite the hype propagated by ESS industries, it is also true that there has been hesitation or resistance to adopting and investing in ESS. Arguably, one of the strongest obstacles to the diffusion of ESS is the absence of scientific economic validation that can be referred to or consulted by investors and policy makers [1]. Of course, some studies, such as [1,2,3,4,5], have discussed the economic value of ESS in the general scope, but they are still insufficient to attract investors and policy makers in particular application areas. For example, while most researchers studied the economic values of ESS obtained from arbitrage trade of energy, only a few articles investigated the economic value in terms of frequency regulation.
In addition to the frequency regulation application, a more important and specific question is who invests in and owns the ESS. In general, investors would participate in an ancillary service market to make profits by reserving capacity for regulation. However, in contrast to the general case, what happens if a utility firm that is in a position to pay regulation service fees to a power exchange market invests in ESS and utilizes it for regulation? Therefore, in this paper, we consider the case in which a utility firm invests in and operates ESS for frequency regulation.
This paper proposes an economic valuation method for a battery-based energy storage system used for frequency regulation purposes, from a utility firm’s perspective. Also, unlike typical economic analyses relying on highly approximated monthly or yearly benefits, our simulation and corresponding algorithm to implement it is based on more precise estimation of hourly changes in electricity generation and on more complicated operation constraints. The method we present also considers important characteristics specific to the Korean electricity market and makes the analysis from the perspectives of both the wholesaler and generators. By providing detailed analysis of economic outcomes from both sides, the proposed method helps investors make an informed decision as well as provides meaningful implications for policy makers.
The structure of this paper is as follows: In Section 2, we investigate the literature regarding ESS investment and discuss backgrounds of frequency regulation, especially in the Korean electricity market. Then, we suggest a framework and an algorithm for ESS investment evaluation in frequency regulation application from a utility firm’s perspective in Section 3. Based on the proposed framework, simulation and analysis are executed to analyze the effect of a utility adopting ESS in Section 4. Section 5 summarizes the major results, and provides implications for policy maker and utility firm investors.

2. Literature Review and Background

2.1. Energy Storage System (ESS) for Frequency Regulation (FR)

Energy Storage Systems (ESS) can charge and discharge electricity in a very short time. Since their benefits are known to be broad and include load-shift, reliability, and stabilization of the power grid, the utilization of ESS has garnered attention from practitioners and policy makers in the related fields. For example, Sandia Lab [6] provides a description and service-specific technical details for 18 services and applications associated with the use of electricity storage for electric-utility-related applications. The 18 services are categorized as follows: (1) Bulk energy service including energy time-shift and energy supply capacity; (2) Ancillary Services like regulation, spinning reserves, black start, and voltage support; (3) Transmission infrastructure like upgrade deferral; (4) Distribution infrastructure like distribution upgrade deferral and voltage support; and (5) Customer energy management services like power quality, reliability, and demand charge management.
Among the various applications of ESS, the regulation market (also referred to as frequency regulation or, in parts of the EU, called regulating power) has earned attention due to its potential for economic benefits and readiness in terms of market situation and technical issues. Regulation is used to reconcile momentary differences caused by fluctuations in generation and loads. This imbalance between generation and loads increases or decreases the frequency of electricity, which leads to degradation of power quality. The primary purpose of regulation is to maintain the grid frequency at a certain level (60 Hz).
This is accomplished by using a real-time communication signal directly controlled by the grid operator. The regulation control signal can call for either a positive or negative correction, often referred to in the industry as “regulation up” and “regulation down”, respectively. If loads exceed generation, frequency and voltage drop and the grid operator relays a signal to generators requesting regulation up. Conversely, when there is a momentary excess of electric supply capacity, the grid operator requests regulation down and asks generators to reduce generation.
Regulation is typically provided by generating units that are online and ready to increase or decrease power as needed. Regulation is contracted capacity on an hourly basis and dispatched on intervals between four seconds and one minute. Neither regulation up nor regulation down is dispatched for a long duration. An important consideration for this application is that most thermal or base load generation used for regulation service is not especially well-suited or designed to provide regulation; they are not designed for operation at partial loads or to produce variable outputs, which means that they are usually most efficient when power plants operate at a specific and constant (power) output level. Similarly, air emissions and plant wear and tear are usually lowest (per kWh of output) when thermal generation operates at a full load and with constant output [6].
Therefore, storage may be an attractive alternative to most generation-based load following for at least three reasons: (1) in general, storage has superior part-load efficiency; (2) efficient storage can be used to provide up to twice its rated capacity (for regulation); and (3) storage output can be varied rapidly (e.g., output can change from none to full or from full to none within seconds rather than minutes).

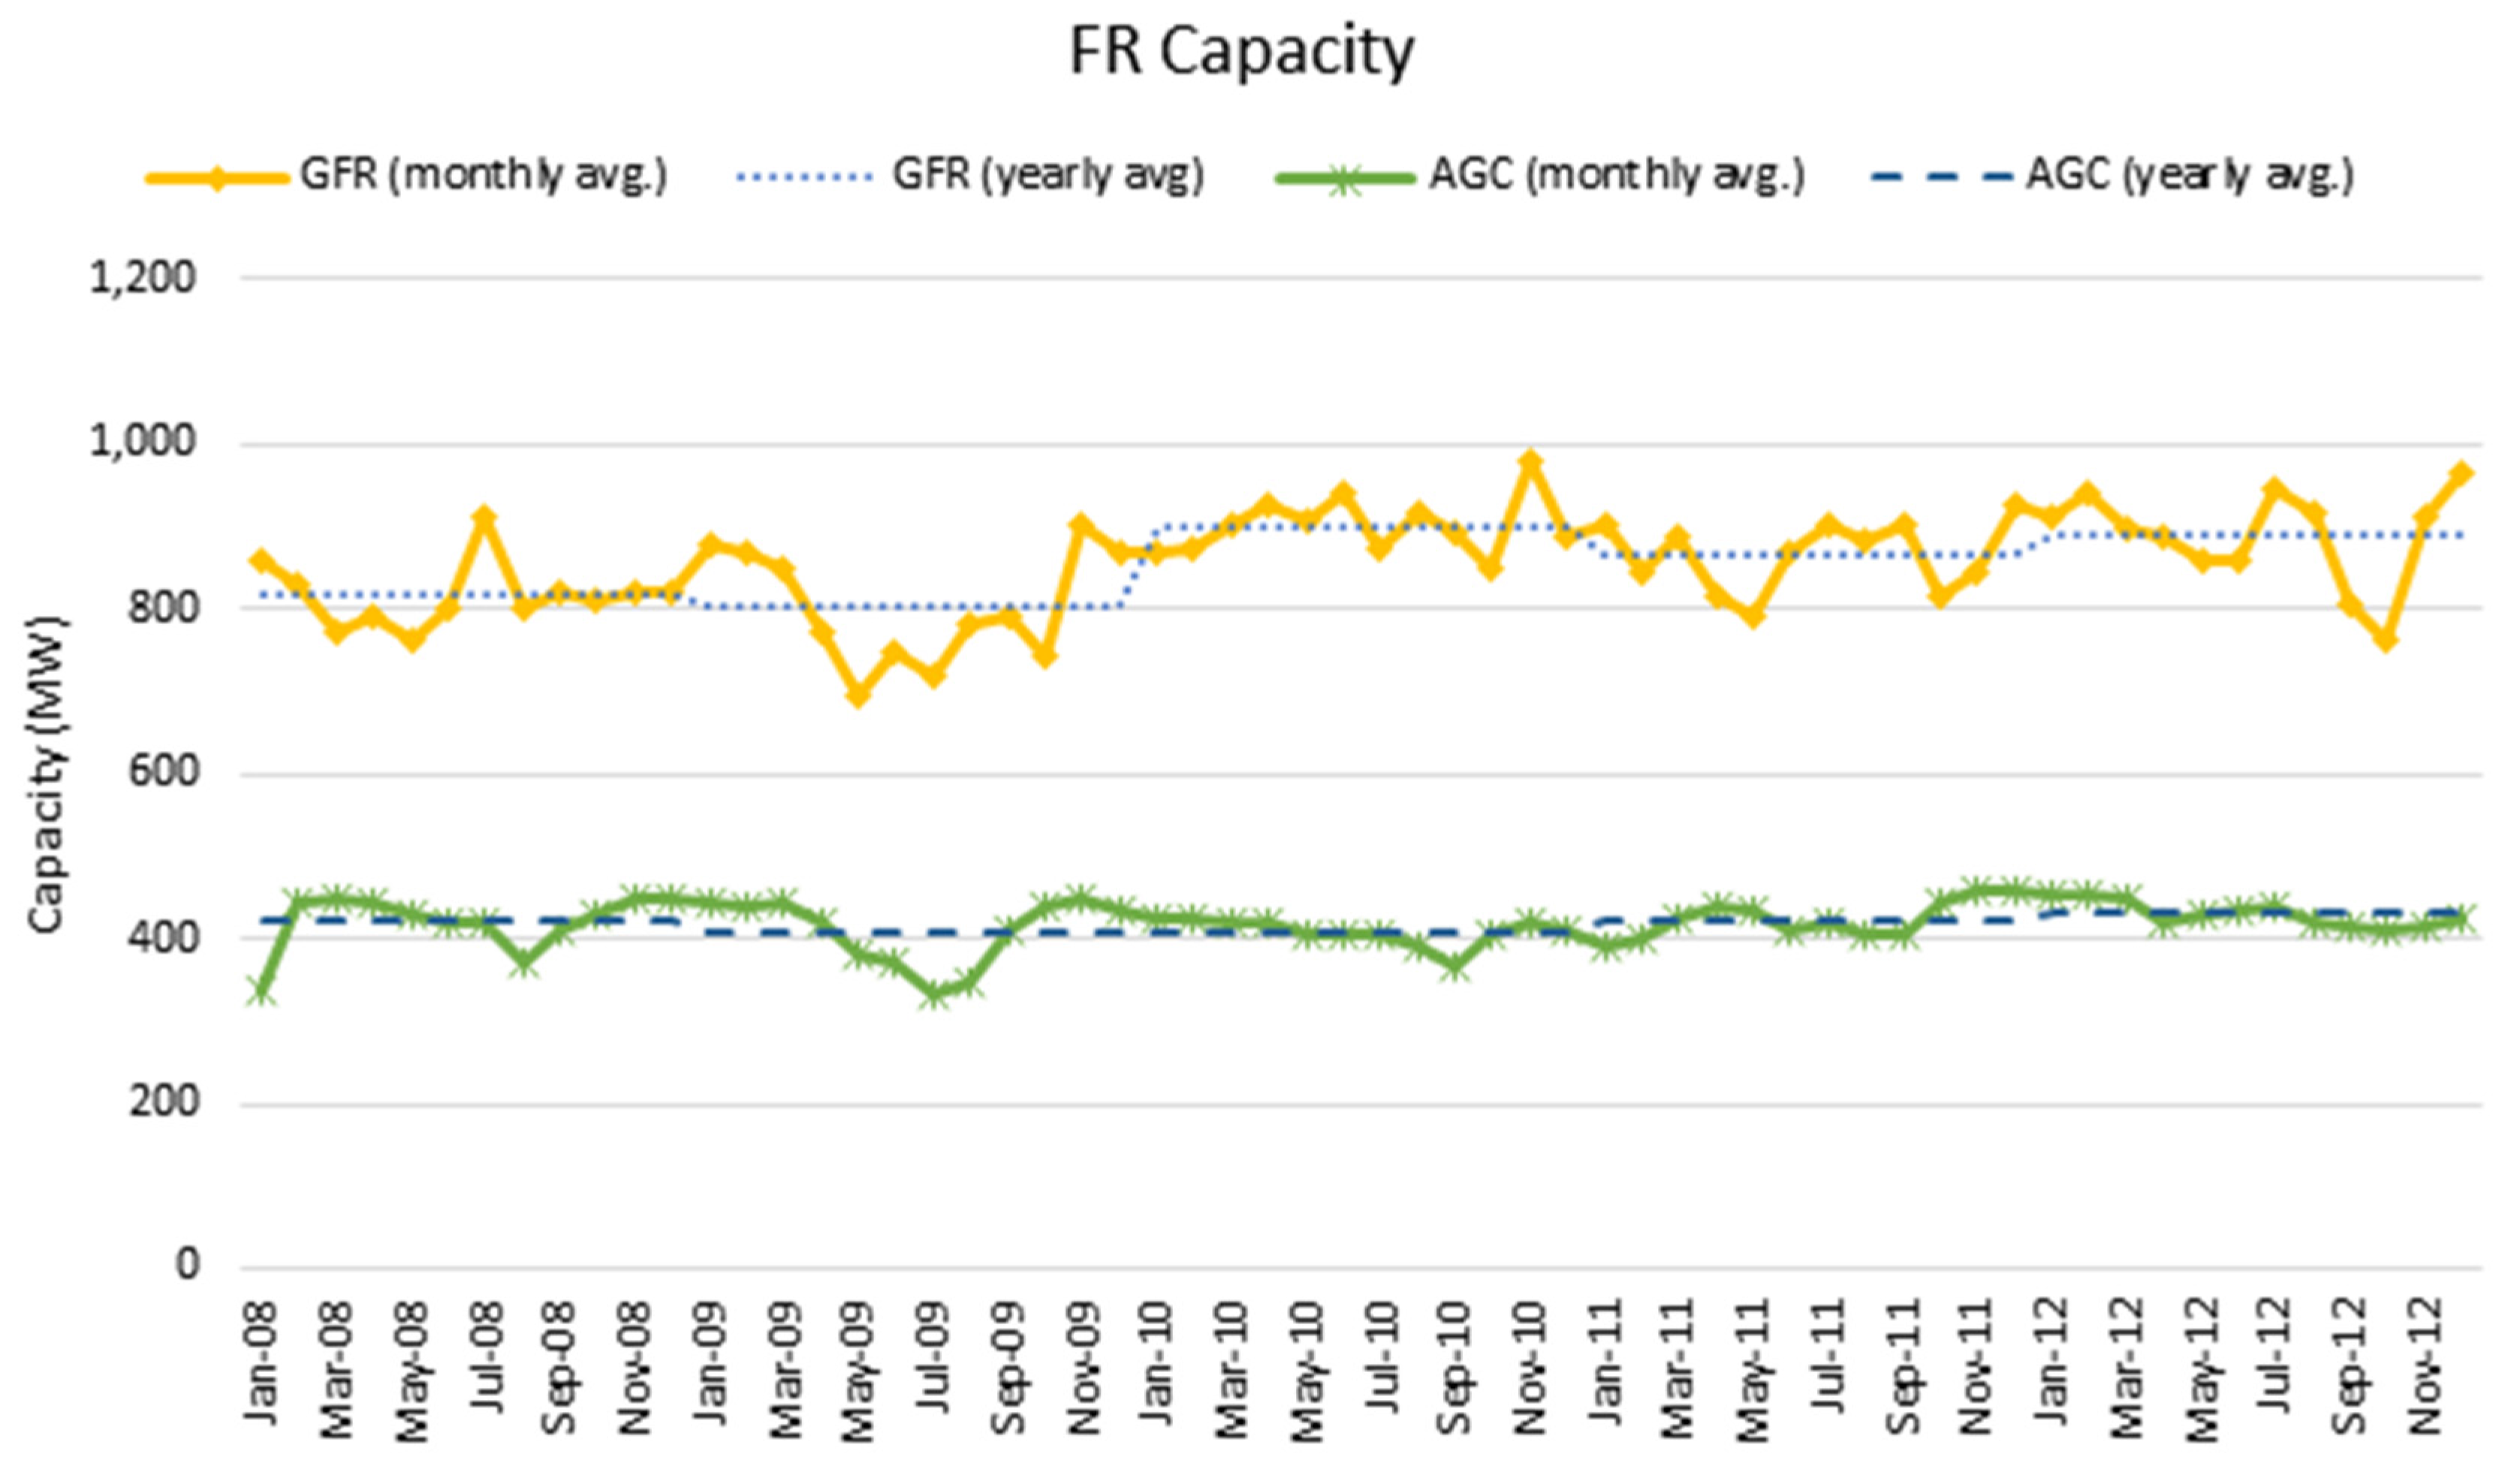
2.2. Frequency Regulation in Korea

In Korea, frequency regulation is directed by KEPCO (Korea Electric Power COrporation) and KPX (Korea Power eXchange) in two forms, an Automatic Generation Control signal (AGC) and a Governor Free signal (GF). KPX and KEPCO ask generators to respond within five minutes, when the frequency is outside of the range of 0.2 Hz change. The typical amount of contracted regulation service in Korea is less than about 1,500 MW. For the past five years, governor free regulation (GFR) and automatic generation control (AGC) have been, on average, 800–1000 MW and 400 MW, respectively, as shown in Figure 1.
Figure 1. The capacity of frequency regulation.
Energies 08 05000 g001
In Korea, the economic validity of employing ESS for FR cannot be discussed without considering the roles that KEPCO plays in the Korean electricity market. KEPCO is a monopsony wholesale buyer and is in charge of transportation and distribution. KEPCO buys electricity in the market operated by KPX and transports/distributes electricity to customers. KEPCO is also in charge of operating ancillary services including FR. Therefore, it determines the total FR capacity and performs allocation to generators. Specifically, it secures the capacity for frequency regulation by reserving a part of the bid amount offered from generators, and generators are dispatched real time for FR based on their reserved capacity. Since KEPCO is a monopsony buyer, it has the responsibility of paying generators for their participation in ancillary services. As of now, KEPCO itself is not allowed to participate in FR service markets or power generation. In fact, since the service fee for ancillary services is being regulated, there can be no ancillary service market in the current market situation. Given this market situation, the benefits from ESS employed for frequency regulation service can only be defined in terms of KEPCO’s financial benefits. More specifically, it can be expected that KEPCO can reduce energy payments made to generators, incurred as a result of managing FR-related operations.

2.3. Frequency Regulation and Constraint Cost

One important issue regarding regulation is that in the course of its operation a substantial amount of constraint costs are incurred by the grid operator. Constraint cost is the most important concept in comprehending the economic validity of applying ESS for FR service. Constraint costs arise to the extent that there are differences between the market schedule of generation and the actual dispatch by the grid operator.
Constraint costs are related with the following two types of generators that appear during the operation of frequency regulation. First, there are constrained-off generators that were scheduled to run by the market (that is, considered in determining the system market price) but which did not run in the actual dispatch or ran at a decreased level (constrained off/down). Second, there are constrained-on generators that were not scheduled to run or ran at a low level in the market, but which ran at a higher level in reality (constrained on/up). This situation happens because regulation is contracted and paid for during scheduling, but in actual operation the contracted amount was not called on to provide electricity.
In this case, in order to balance supply and demand, a generator that is constrained off/down will always result in other generators being constrained on/up and vice versa. That is, the generators that are constrained off/down have to pay back a constraint payment (negative) and the corresponding units that are constrained on/up receive a constraint payment (positive). As the price of the constrained on/up unit is generally greater than the constrained off/down unit, there is always a net cost associated with constraints. ESS reduces the constrained off/down capacity by replacing them. This in turns reduces the capacity of the corresponding constrained on/up generation, which results in a cost savings for the grid operators.

2.4. Economic Valuation Literature for Energy Storage System

Energy Storage Systems (ESS) are applicable in a variety of areas, as described in [6]. Among those, we focus on frequency regulation in this paper, particularly from the utility’s perspective. Unlike other studies, this paper considers the viewpoint of a utility that has to pay constraint costs (constrained on/off) to a power exchange market as compensation for controlling frequency regulation. Moreover, our simulation and proposed algorithm reflects on a situation in which an introduction of ESS would change the operation and schedule of existing generators and accordingly lead to changing the payments for constraint costs as well as payments for scheduled energy.
Among the literature discussing the economic values of ESS, Alt et al. [7] presented a method for determining the benefits of dynamic operating cost for energy storage systems from the utility company perspective using DYNASTORE. This research showed that the operating benefits for load frequency control are fewer than for spinning reserve and load leveling. However, in this paper they drew a conclusion regarding the benefits of ESS only by comparing the production costs of energy generated by unit generators and ESS. Oudalov et al. [4] and Mercier et al. [8] suggested an optimal way of dimensioning ESS and evaluated the profitability over 20 years. They maximized the net present value of profits for frequency control reserve and excess energy sale. The main objectives of optimization for a potential ESS owner are participating in an ancillary service market and making profits from providing the service. Moreover, further studies such as Walawalkar et al. [5] and Bradbury et al. [1] focused on the benefits by participating in arbitrage price and regulation depending on energy prices and market clearing prices. Economic valuation of an energy storage system in an ancillary service market has also been studied using real data from Chile and Israel, questioning the optimal size of an energy storage system [9,10]. However, these studies focus on either the profits earned from participating in an ancillary service market or the benefits incurred through the difference in production costs between an ESS and a generator. On the other hand, our paper concentrates on the payment change, such as scheduled energy payments and constraint cost payments, in accordance with the change of operations schedule after ESSs are utilized.
Moreover, studies regarding utility side management for ESS can be found [11]. However, most papers concern different application area such as load-leveling application, vehicle-to-grid application, optimal site, or the optimal size of an ESS. Jung et al. [12] and Lo and Anderson [13] proposed an algorithm of economic dispatch for load-leveling and finding an optimal ESS capacity from the utility’s perspective. Even though some papers have discussed the impact of vehicle-to-grid application on a utility [14,15], frequency regulation from a utility perspective is not much studied, whereas Ouldaov et al. [16] discussed the frequency regulation issue from the utility’s perspective and derived benefits that were calculated simply through control prices and supplied power. The compensation for regulation could be made either by the market or through mandatory obligation, which has to be paid by a utility. However, in this paper, the fact that the operation schedule and payment paid by a utility can be changed by an ESS is not reflected in the model.
Therefore, in this study we consider the economic value of ESS in frequency regulation from the perspective of utility that is in a position to make payments for constraint cost as well as for scheduled energy, and also propose an algorithm to estimate the economic benefits using Korean market data.

3. Methodology

3.1. Valuation Principles

In this paper, we assume that the whole economic value of ESS can be translated into decreased energy payments by a monopsony buyer in the wholesale electricity market. The wholesale electricity market in Korea is a monopsony market in which a single buyer is responsible for buying the total electricity produced and ancillary services are also totally controlled by the monopsony buyer. Given this market institution, it can be reasonably assumed that ESS deployment for FR will result in reduction in a buyer’s energy payment because ESS can reduce the amount of constrained-on generation that is usually dispatched to generators with high variable cost.
Specifically, the estimation of the economic value of ESS is conducted by measuring how much energy payments would change after an ESS is deployed. To this end we employ historical data for a benchmark scenario, which will serve as a reference for comparison. The historical data is a good representation of a current practice in which no ESS capacity is employed and the whole FR capacity is taken on by generators consuming fossil fuel. Therefore, our focus of economic valuation is on estimating how a current practice would change due to the deployment of ESS capacity and how much energy payments would be reduced due to such changes in practice.
The following variables are used to define energy payment. The notation for each variable is provided in parentheses. The variables represent the key outcomes of production scheduling, which affects the amount of energy payment by the wholesaler. All variables have an hourly record since the schedule is generated every hour.
  • Variable Cost (vc)—Variable cost is the cost of generating electricity incurred by a generator. Variable cost of a generator is mostly dependent on the price of fuel it consumes. In Korea, variable costs cannot be determined by generators but need to be evaluated by a central committee, the Generation Cost Evaluation Committee (GCEC). The committee finally determines variable costs based on the evaluation of various elements such as energy prices, fixed costs, efficiency, and/or the generator’s other technical features.
  • System Marginal Price (smp)—smp is a market price of electricity determined after a dispatch schedule is established. As the name indicates, smp defines the system-wide cost incurred to produce a unit of electricity additional to the amount of electricity that has been generated so far. smp is very important in that it determines the wholesale price, which affects the energy payment given to generators involved in the production schedule.
  • Price-Setting Scheduled Energy (Q_pse)—Q_pse is the scheduled amount of generation by each generator. It is determined based on offers by generators in the day-ahead electricity market. It should to be noted that Q_pse determines smp but is not equal to the actual amount of generation due to reserved capacity.
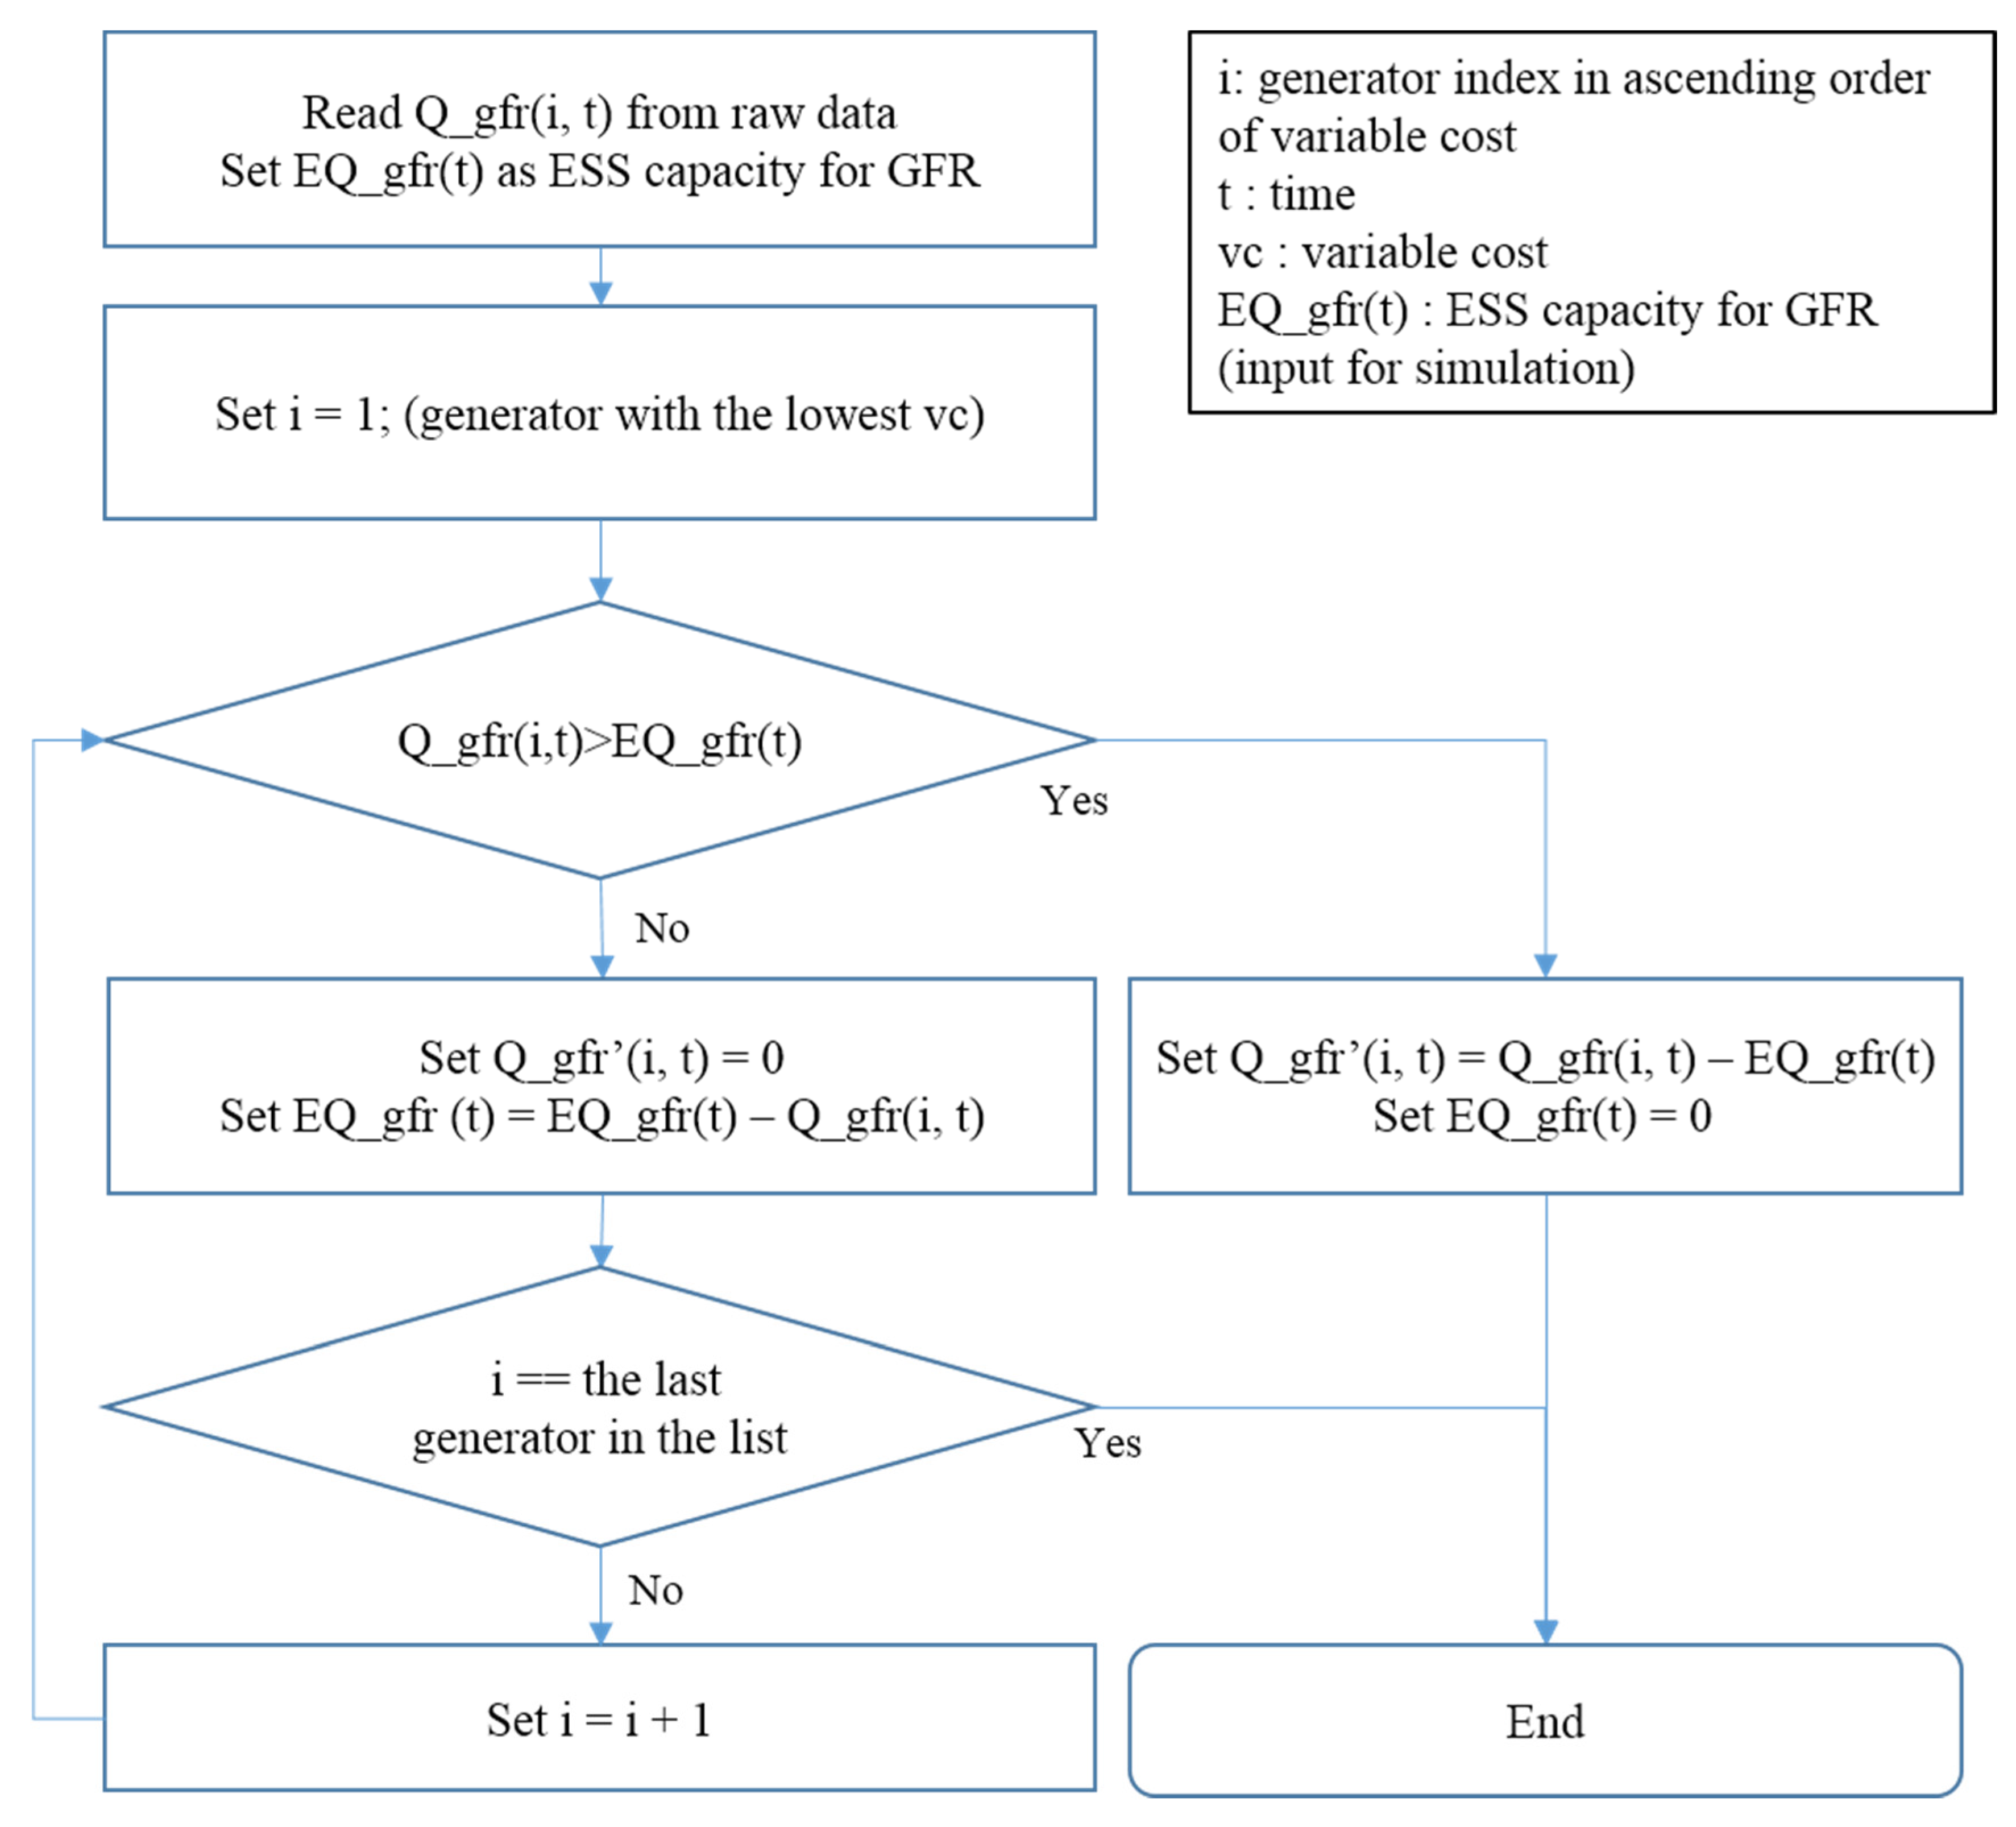
  • Constrained-off capacity (Q_coff = Q_gfr + Q_act)—Q_coff represents constrained-off capacity reserved for FR service. Q_coff is allocated to each generator by reserving a part of the Q_pse it offered. Q_coff is the sum of Q_gfr and Q_act, which represent the two types of regulation operation: governor free and automatic generation control. If Q_coff is fully dispatched in real time, the actual generation of each generator becomes Q_pse-Q_coff.
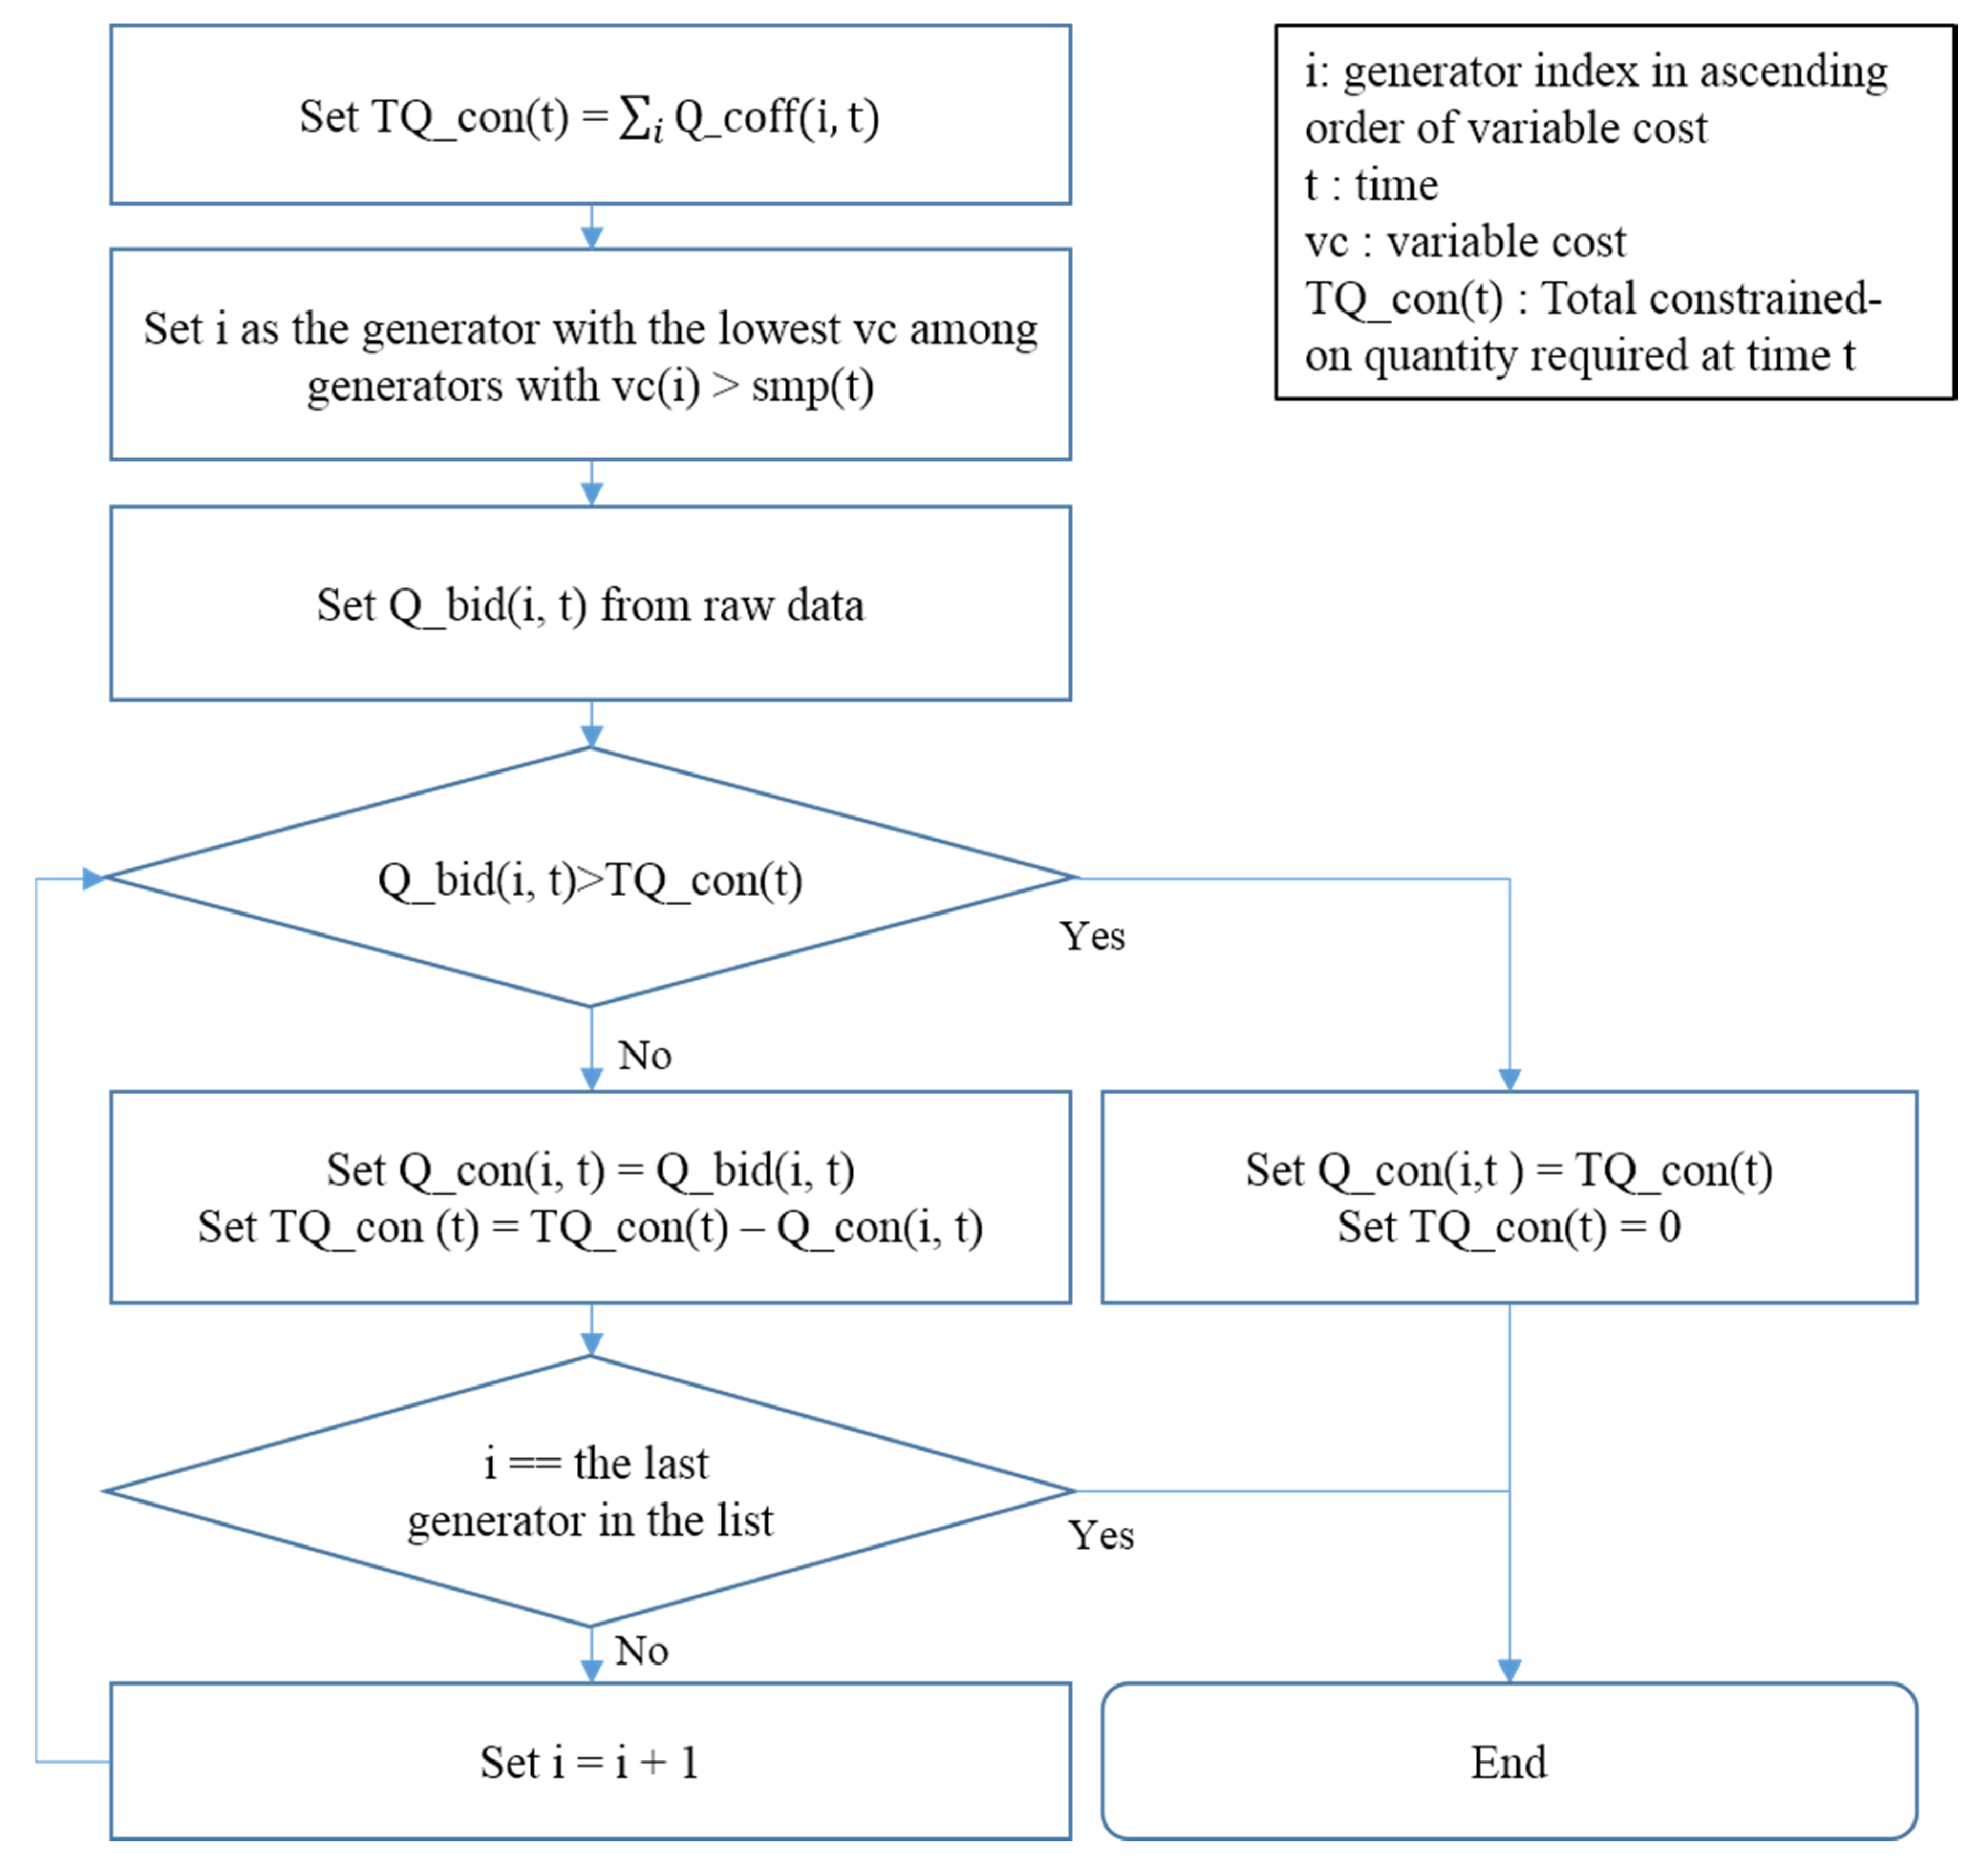
  • Constrained-on capacity (Q_con)—Q_con is the amount of constrained-on generation requested for making up the loss of scheduled supply due to Q_coff. Generators with available capacity are dispatched in real time. It is worth noting that Q_con here considers constrained-on generation only for compensating the loss due to FR service, meaning that it does not account for any other constrained-on generations that might occur in real-time situations such as forecast errors or failures in distribution/transmission.
Notice that, among the variables introduced, the only variables affected by the introduction of ESS capacity are Q_coff and Q_con. For vc, we can assume that it remains fixed because vc is mostly associated with generation efficiency and fuel costs, both of which are not related with ESS. Q_pse can also be assumed to remain fixed because ESS only provides capacity for FR service and is not involved in providing electricity supply to meet energy demand. Since Q_pse remains unchanged, the amount of scheduled supply also remains unchanged, which in turn does not change smp. Consequently, the availability of ESS capacity only changes Q_coff and Q_con and the payment savings are solely determined by how these two variables would change.

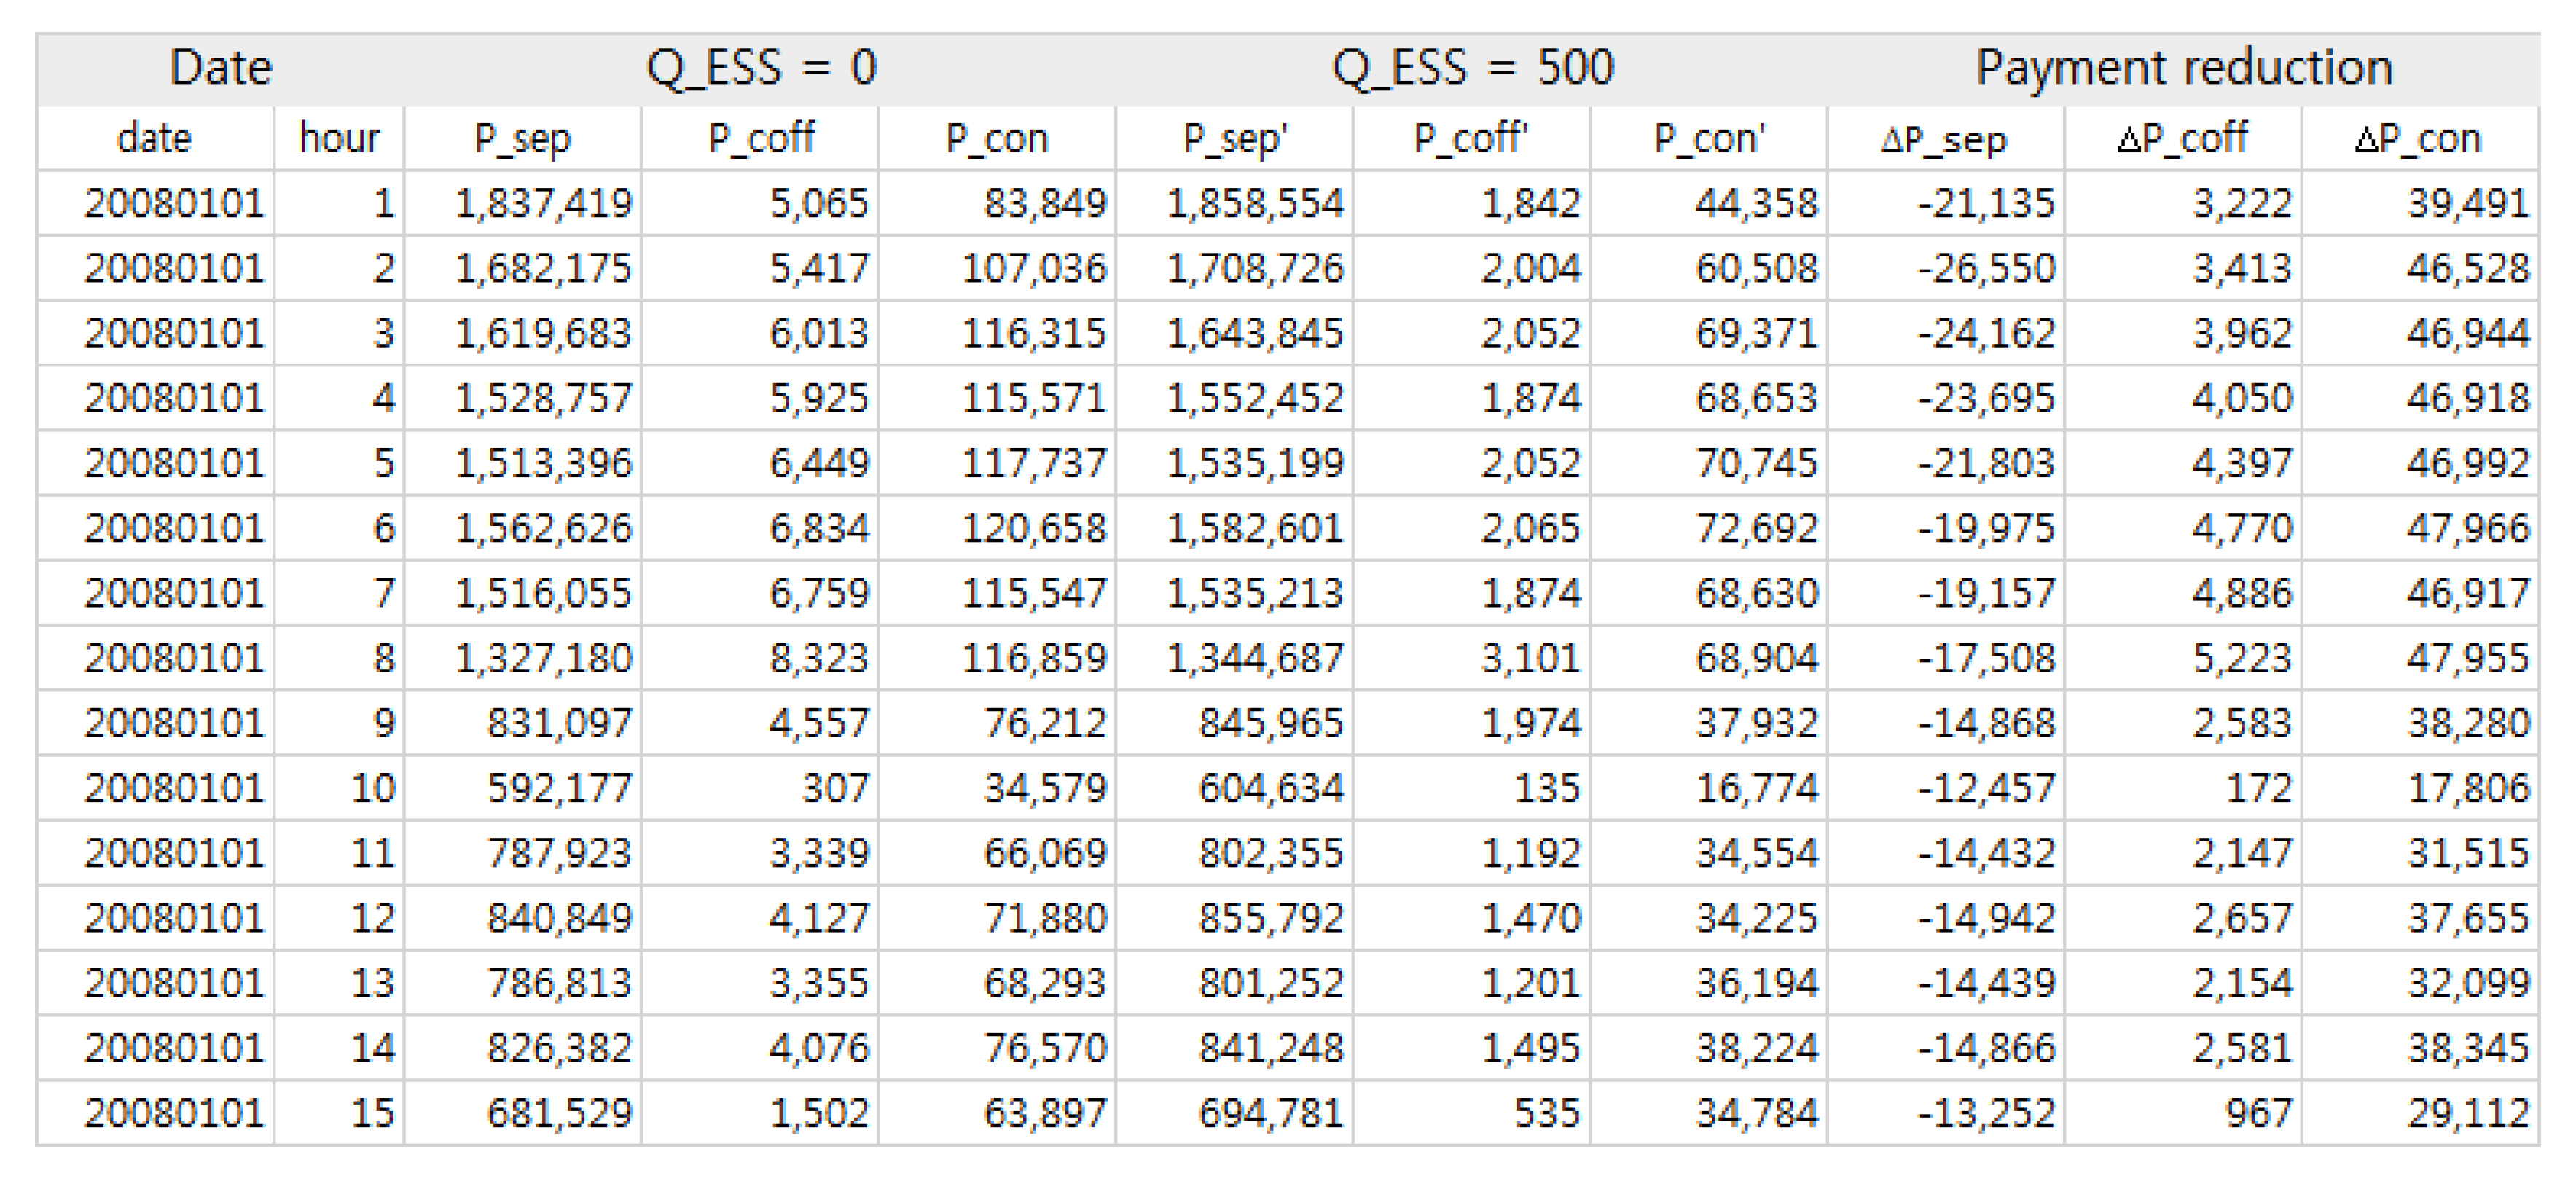
3.2. Payment Equations

Now we define payment equations by using the variables introduced so far. Among the various payment items made by the wholesaler, we consider the following three items that are most affected by the deployment of ESS capacity: Scheduled Energy Payment (P_sep), constrained-off payment (P_coff), and constrained-on payment (P_con). P_sep is the most basic payment item given to generators for electricity generation. Since it is payment for actual generation, the reserved capacity for FR service is not considered. Thus, P_sep is calculated as follows (subscripts i and t represent the individual generator and time (in hours), respectively):
P_sep(i, t) = [Q_pse(i,t) − Q_coff(i,t)] × mp(i,t)
Notice that mp (abbreviation of marginal price), instead of smp, is employed as a unit price for payment settlement; mp is an adjusted marginal price defined for individual generators. This adjustment is intended to reflect variations in variable costs among generators, preventing low cost generators (nuclear or coal) from earning relatively excessive profits compared with other generators.
Another important payment item regarding FR service is constrained payment, either constrained-off payment or constrained-on payment. Constrained-off payment can be considered as reimbursement of the opportunity cost of providing FR services; it is made to FR service providers to compensate for their lost profits due to the capacity provided for FR service. P_coff is calculated as follows:
P_coff(i,t) = Q_coff(i,t) × [mp(i,t) − vc(i,t)]
On the other hand, constrained-on payment is incurred because of make-up generation for the capacity not dispatched due to reservation for FR generation. Constrained-on generation is usually dispatched to high-cost generators, because most low-cost generators’ capacity was already brought into the production schedule. In theory, the total amount of constrained-on generation should be equal to the total reserved capacity; that is, ΣQ_coff should be equal to ΣQ_con unless reserve capacity is limited. However, in practice, there are situations in which additional generation is not possible because of insufficient reserve capacity, due to high peak demand. Constrained-on payment (P_con) is calculated as follows:
P_con(i,t) = Q_con(i,t) × max[smp, vc(i,t)]
Notice that the unit price for P_con should be larger than smp and vc. Because constrained-on generation is dispatched to generators whose capacity (a part or the whole) was not brought into the production schedule, they could have higher variable cost than smp. Therefore, if constrained-on generation should be dispatched to such generators, the unit price should be their variable costs instead of smp.

3.3. Q_coff and Q_con

As we have examined in the previous section, estimating the changes in Q_coff and Q_con for each generator is a crucial part of the economic valuation of ESS for FR. We use Q_coff’ and Q_con’ to denote the altered Q_coff and Q_con after a certain amount of ESS capacity is deployed. In order to calculate Q_coff’ and Q_con’, we need a rule to determine which generators become free of constrained-off/on generation when the total FR capacity charged on existing generators is reduced due to the ESS capacity deployed.
The Q_coff’ or Q_con’ of a certain generator could remain unchanged or become smaller depending on whether it is chosen for replacement by ESS capacity or not. The energy payment will also differ depending on the manner in which we select generators. That is, a selection rule plays a crucial role in estimating payment reduction.
Let us begin with a rule for determination of Q_coff’. If we reduce the Q_coff of a certain generator, its P_sep would increase but its P_coff would decrease. It is clear that P_coff reduces when Q_coff is reduced. The reason why P_sep increases is that if Q_coff is reduced the reduced amount will be converted into generation, which increases Q_pse and P_sep.
As a result, the following facts are obvious. If we reduce the Q_coff of high-cost generators first, we can expect that the decrease in P_coff would not be significant (because vc and mp are close), but the increase in P_sep would be significant due to their high mp. On the other hand, if we first reduce the Q_coff of low-cost generators, then the expected increase in P_sep would be much smaller but the decrease in P_coff must be larger compared with the case of high-cost generators. In consequence, generators with a larger gap between mp and vc and a smaller mp should be considered first in order to maximize payment reduction. That is, it is more advantageous if reduction in Q_coff starts from low-cost generators. Figure 2 describes the procedure in which Q_coff' is estimated.
For a better understanding of the procedure in Figure 2, consider the following simple example.
Figure 2. Calculating Q_coff’.
Energies 08 05000 g002
Let us assume that in this imaginary scenario smp is 128 $/MWh and the ESS capacity for governor free operation is 500 MW. Table 1 lists Q_coff values and average variable costs for each generator type at time t. According to the procedure, Q_coff values are reduced starting from the low-cost generators as follows. At first, the coal generators’ Q_coff is 213.8 MW; this is smaller than 500 MW, the unallocated ESS capacity. Hence the Q_coff’ for Generator 2 now becomes 0 and the unallocated ESS capacity becomes 286.2 MW, which is the reduction from 500 to 213.8. Likewise, the Q_coff for Generator 3 is 13.5 MW, which is lower than the current unallocated ESS capacity of 286.2 MW. Hence Q_coff’ becomes 0 for Generator 3 and the remaining unallocated ESS capacity becomes 272.7 MW, which represents a reduction from 286.2 to 13.5. In the case of Generator 4, Q_coff is 492.2 MW, which is larger than the currently remaining ESS capacity (272.7 MW). Therefore, the whole remaining capacity is used to reduce Q_coff for Generator 4, and thus its Q_coff’ becomes 219.5 MW (= 492.2 − 272.7).
Table 1. Example of calculating Q_coff and Q_coff’.
Generator IndexVariable Cost ($/MWh)Q_ESS = 0 (Benchmark)Q_ESS = 500 MW∆Q_gfr (MW)
Q_gfr (MW)Q_gfr’ (MW)
13.5000
235.0213.80−213.8
348.013.50−13.5
4100.0492.2219.5−272.7
5126.69.99.90
6162.3132.0132.00
Total−500
Meanwhile, estimating Q_con’ is a little more complicated. It is aforementioned that in our scenario we confined Q_con to represent make-up generation corresponding to the reserved capacity for FR. However, in practice we cannot quantify Q_con in this way because FR is not the only reason that constrained-on generation is required. This means that there is no Q_con in the benchmark (i.e., historical data), so before we estimate Q_con’ we first need to estimate Q_con for each generator.
The estimation of Q_con is basically similar to the procedure for estimating Q_coff except that each generator’s remaining capacity (This is the capacity they bid but was not finally brought into the generation schedule. This remaining capacity is the upper limit of Q_con for each generator.) is needed to determine the dispatch amount. The way to estimate Q_con is described in Figure 3. The available capacity of generators can be calculated by subtracting Q_pse from the capacity they offered in the day-ahead market. The procedure starts with ΣQ_coff, the total reserved capacity for FR, and assigns Q_con to generators in an ascending order of variable costs. Undoubtedly, it is more advantageous for low-cost generators to be dispatched first in this case.
Table 2 shows an example of allocating Q_con based on the procedure. Let us assume that smp is 128 $/MWh and ΣQ_cof is 500 MW. Generators are listed in an ascending order of variable costs. Since smp is 128 $/MWh, we start the procedure from Generator 3 with the lowest variable cost above smp. From Generator 3 to Generator 6, the whole remaining capacity is dispatched, and for Generator 7 48 MW is dispatched, which adds up to 500 MW of ΣQ_con.
Figure 3. Calculating Q_con(i)’.
Energies 08 05000 g003
Table 2. Example of calculating Q_con and Q_con’.
Generator IndexCapacity (MW)Q_bid (MW)Variable Cost (A) ($/MWh)Q_ESS = 0 (Benchmark)Q_ESS = 500 MW
Q_con (B) (MW)P_con (B × A) ($)Q_con’ (C) (MW)P_con’ (C × B) ($)
23523.00458.3690.44458.3641,452.85458.3641,452.85
24267.00234.0092.50234.0021,645.64205.9919,054.81
25267.00234.0092.56234.0021,658.21
26267.00234.0093.58234.0021,897.04
27543.00475.8995.863.99382.32
28708.00620.5096.14
29377.00330.4197.14
Total1,164.36107,036.06664.3660,507.66
As mentioned before, Q_con and Q_con’ must be determined through the same procedure described above. The only difference is that calculation of Q_con and Q_con’ begins with ΣQ_coff and ΣQ_coff’, respectively.

3.4. Benefit Equation

So far we have defined three payment items and estimated Q_coff’ and Q_con’. Now we estimate how each payment item changes as ESS provides capacity for FR service. By using the payment equations, we can now derive a benefit equation. A benefit equation represents the estimated payment reduction after ESS capacity is introduced. Given that vc, Q_pse, and smp remain fixed, the amount of reduced payment for each generator can be defined as follows based on Equations (1)–(3):
P_SEP + ∆P_COFF + ∆P_CON = −∆Q_coff × mp + ∆Q_coff × (mp − vc) + ∆Q_con × max(smp, vc) = ×∆Q_coff × vc + Q_con × max(smp, vc)
Notice that the equation represents payment reduction so profit occurs when the value of the equation becomes negative. The equation clearly shows that the amount of payment reduction depends on smp, variable costs, and the ∆Q_coff and ∆Q_con of each generator. Since low-cost generators are mostly constrained-off, their ∆Q_coff is negative but the ∆Q_con is almost zero. In contrast, high-cost generators are mostly constrained-on so ∆Q_coff becomes nearly zero and ∆Q_con becomes negative. Therefore, the equation shows that while there is an increase in payment for low-cost generators, payment to most high-cost generators decreases. Given that the aggregated quantities of ∆Q_coff and ∆Q_con are the same, (Of course, there are situations that this does not hold. For example, unexpected demand surges or high SMP (i.e., insufficient capacity for constrained-on dispatch) sometimes prevent Q_con from matching Q_coff. ) the decrease in payments to high-cost generators dominates the increase in payments to low-cost generators. This implies that the difference in variable costs among generators is a key factor in determining the size of benefits.

4. Results

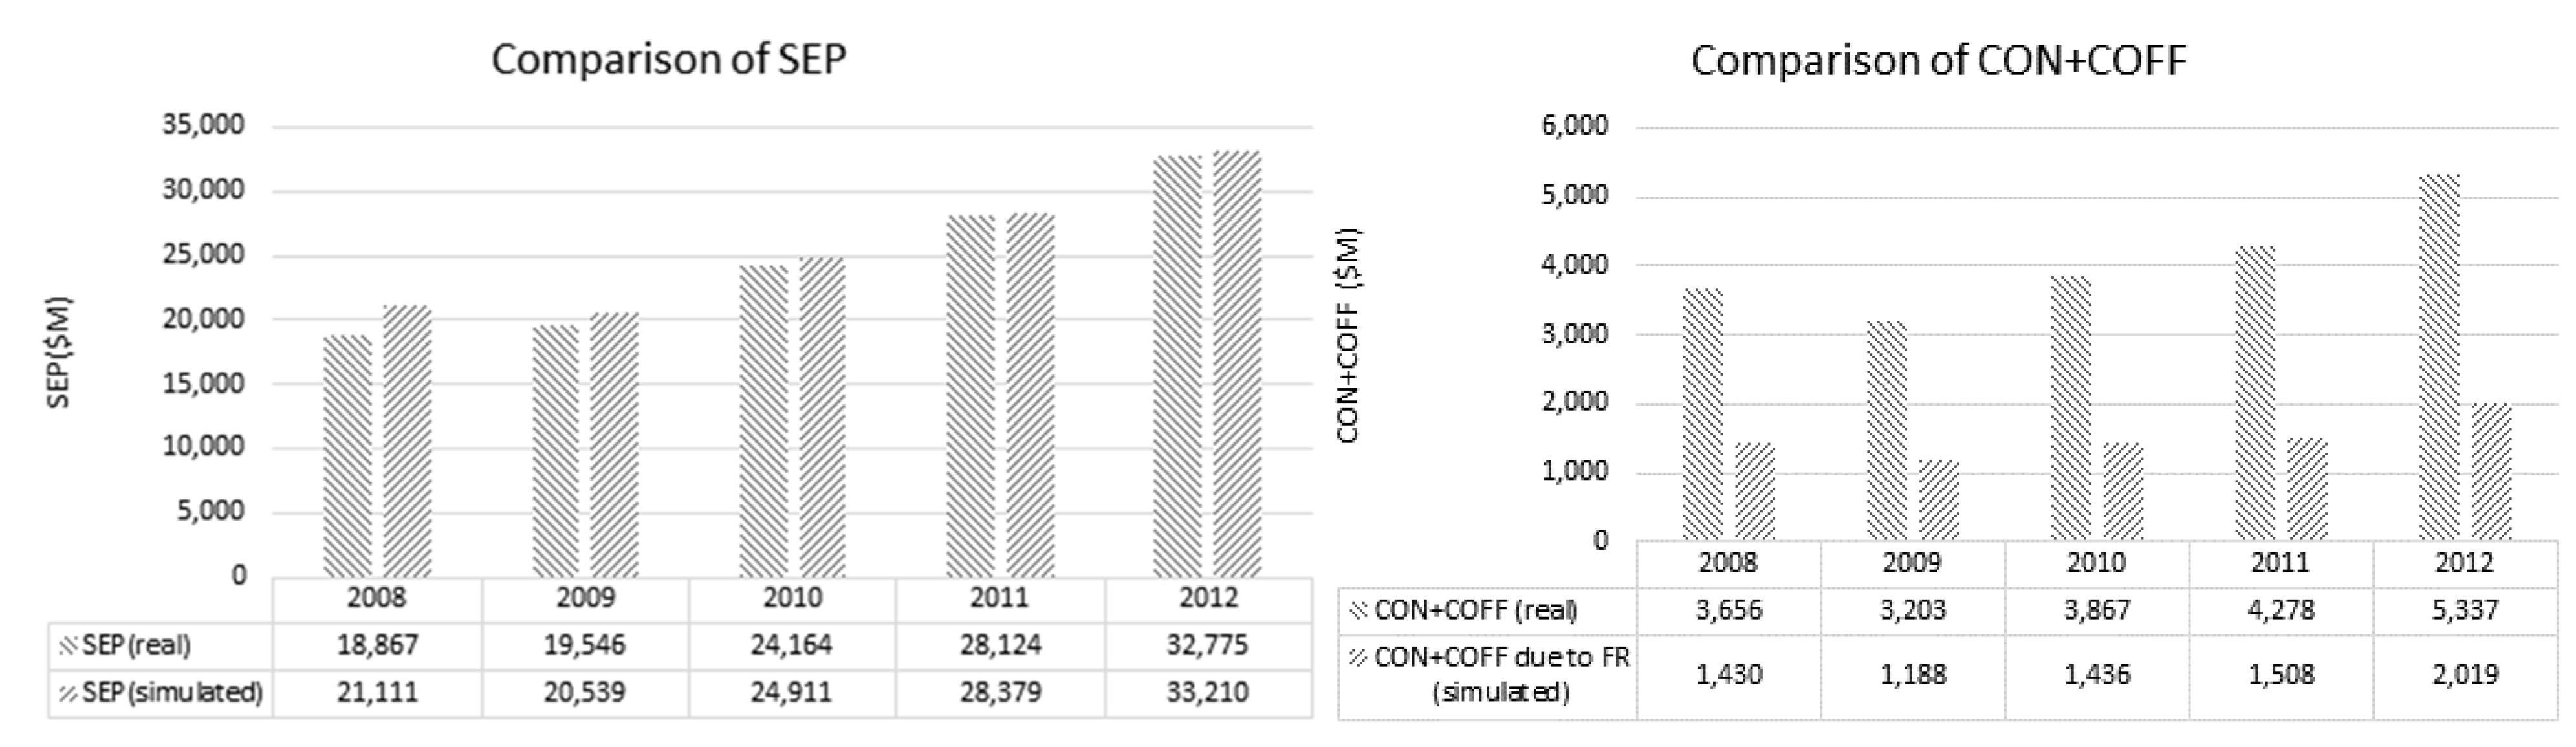
4.1. Estimated Benefits

We implemented a simulation tool that incorporates the equations and procedures we developed by using Microsoft Excel and Visual Basic macro. The simulator has input for ESS capacity and benchmark data of Q_pse, Q_coff, smp, and so forth. With these input data, the simulator performs calculations for Q_coff’, Q_con, and Q_con’ following the aforementioned procedure and then generates hourly estimates of payment reduction based on the payment equations. Figure 4 shows a portion of the results produced by the simulator.
Because benchmark data is real historical data, it can be used to test the validity of the payment equations built into the simulator. This can be done by comparing the actual payment records and the results obtained by the simulator. Figure 5 presents the yearly records of each payment item from 2008 to 2012 with the estimated payment items calculated from Equations (1)–(3). In the case of P_sep, both payment amounts turned out to be very close, indicating that the estimation on payment savings due to the changes in Q_coff (note that P_sep depends on Q_coff) can also be considered reliable as long as those changes are realistic. For constrained payments, the actual payment records turned out to be higher than the estimated results, which is natural since we exclude constrained generation due to other reasons than FR service. However, the ratio of the estimated constraint payments due to FR turns out to be about 40% of the real total constrained payments, and that ratio is fairly consistent throughout the period. In reality, it was reported that the amount of constrained generation and the FR capacity did remain constant and their ratio was about 40%. This suggests that our estimation of P_coff and P_con is likely to accurately reflect the actual payments.
Figure 4. Simulation outputs (unit: $).
Energies 08 05000 g004
Figure 5. Comparison of simulation results with real data.
Energies 08 05000 g005
Now we consider the introduction of ESS capacity and estimate the amount of payment savings generated by using the simulator. We first assume an ESS with 500MW capacity was employed in 2008 and used for the next five years. Figure 6 presents the estimated payment savings obtained from this assumption. As expected, despite the increase of P_sep, the total payment turned out to be reduced thanks to more significant declines in P_coff and P_con payments. Specifically, it was estimated that the energy payment savings in 2008 were about $386.7 million and went up to about $499.4 million in 2012. This figure amounts to about 11.7% of the total real energy payments by KEPCO in 2012. According to a 2012 report by KPX, the total energy payment (including capacity payment and ancillary service fees) amounts to about $42.5 billion. In other words, it is expected that KEPCO can cut about 12% of its annual operating costs through ESS investment.
An interesting question worth asking here is where these savings come from. Since the wholesaler is a monopsony buyer in the Korean electricity market, the wholesaler’s payment savings only come from declined revenues of generators. Since our simulator records estimated payment for each generator, we can compare the amount of revenue declines depending on the generator type. As shown in Figure 7, it turns out that whereas coal generators earn more revenue due to the increase in P_sep, liquefied natural gas (LNG) and oil generators lose significant revenue due to the marked decline in constrained-on generation. In other words, most of a wholesaler’s benefits come from the revenue decline of high-priced generators like LNG or oil generators. This finding suggests that ESS provides base-unit generators like coal generators with an opportunity to make more revenue. In addition, the reduction of constrained-off generation enables them to utilize their full capacity, which also gives them a chance to save costs by enhancing generation efficiency. Consequently, the results show that ESS increases the utilization of the base-unit generators and decreases the reliance on generators consuming a high-cost energy source like LNG or oil.
Figure 6. Estimated payment reduction (ESS capacity = 500 MW).
Energies 08 05000 g006
Figure 7. Estimated revenue change by fuel type.
Energies 08 05000 g007
Another important point is that the estimated benefit is highly dependent on smp. Since smp is mostly affected by the high-priced generators, we can say that the estimated benefit also relies on the variable costs of the high-priced generators. Figure 8 plots the monthly estimated payment savings with variable costs and smp. The figure clearly shows that the estimated payment savings are highly correlated with the energy price of LNG generators, which are responsible for determining smp in most cases. This suggests that the economic value of ESS gets larger as energy prices go up.
Figure 8. Estimated payment reduction and variable costs.
Energies 08 05000 g008

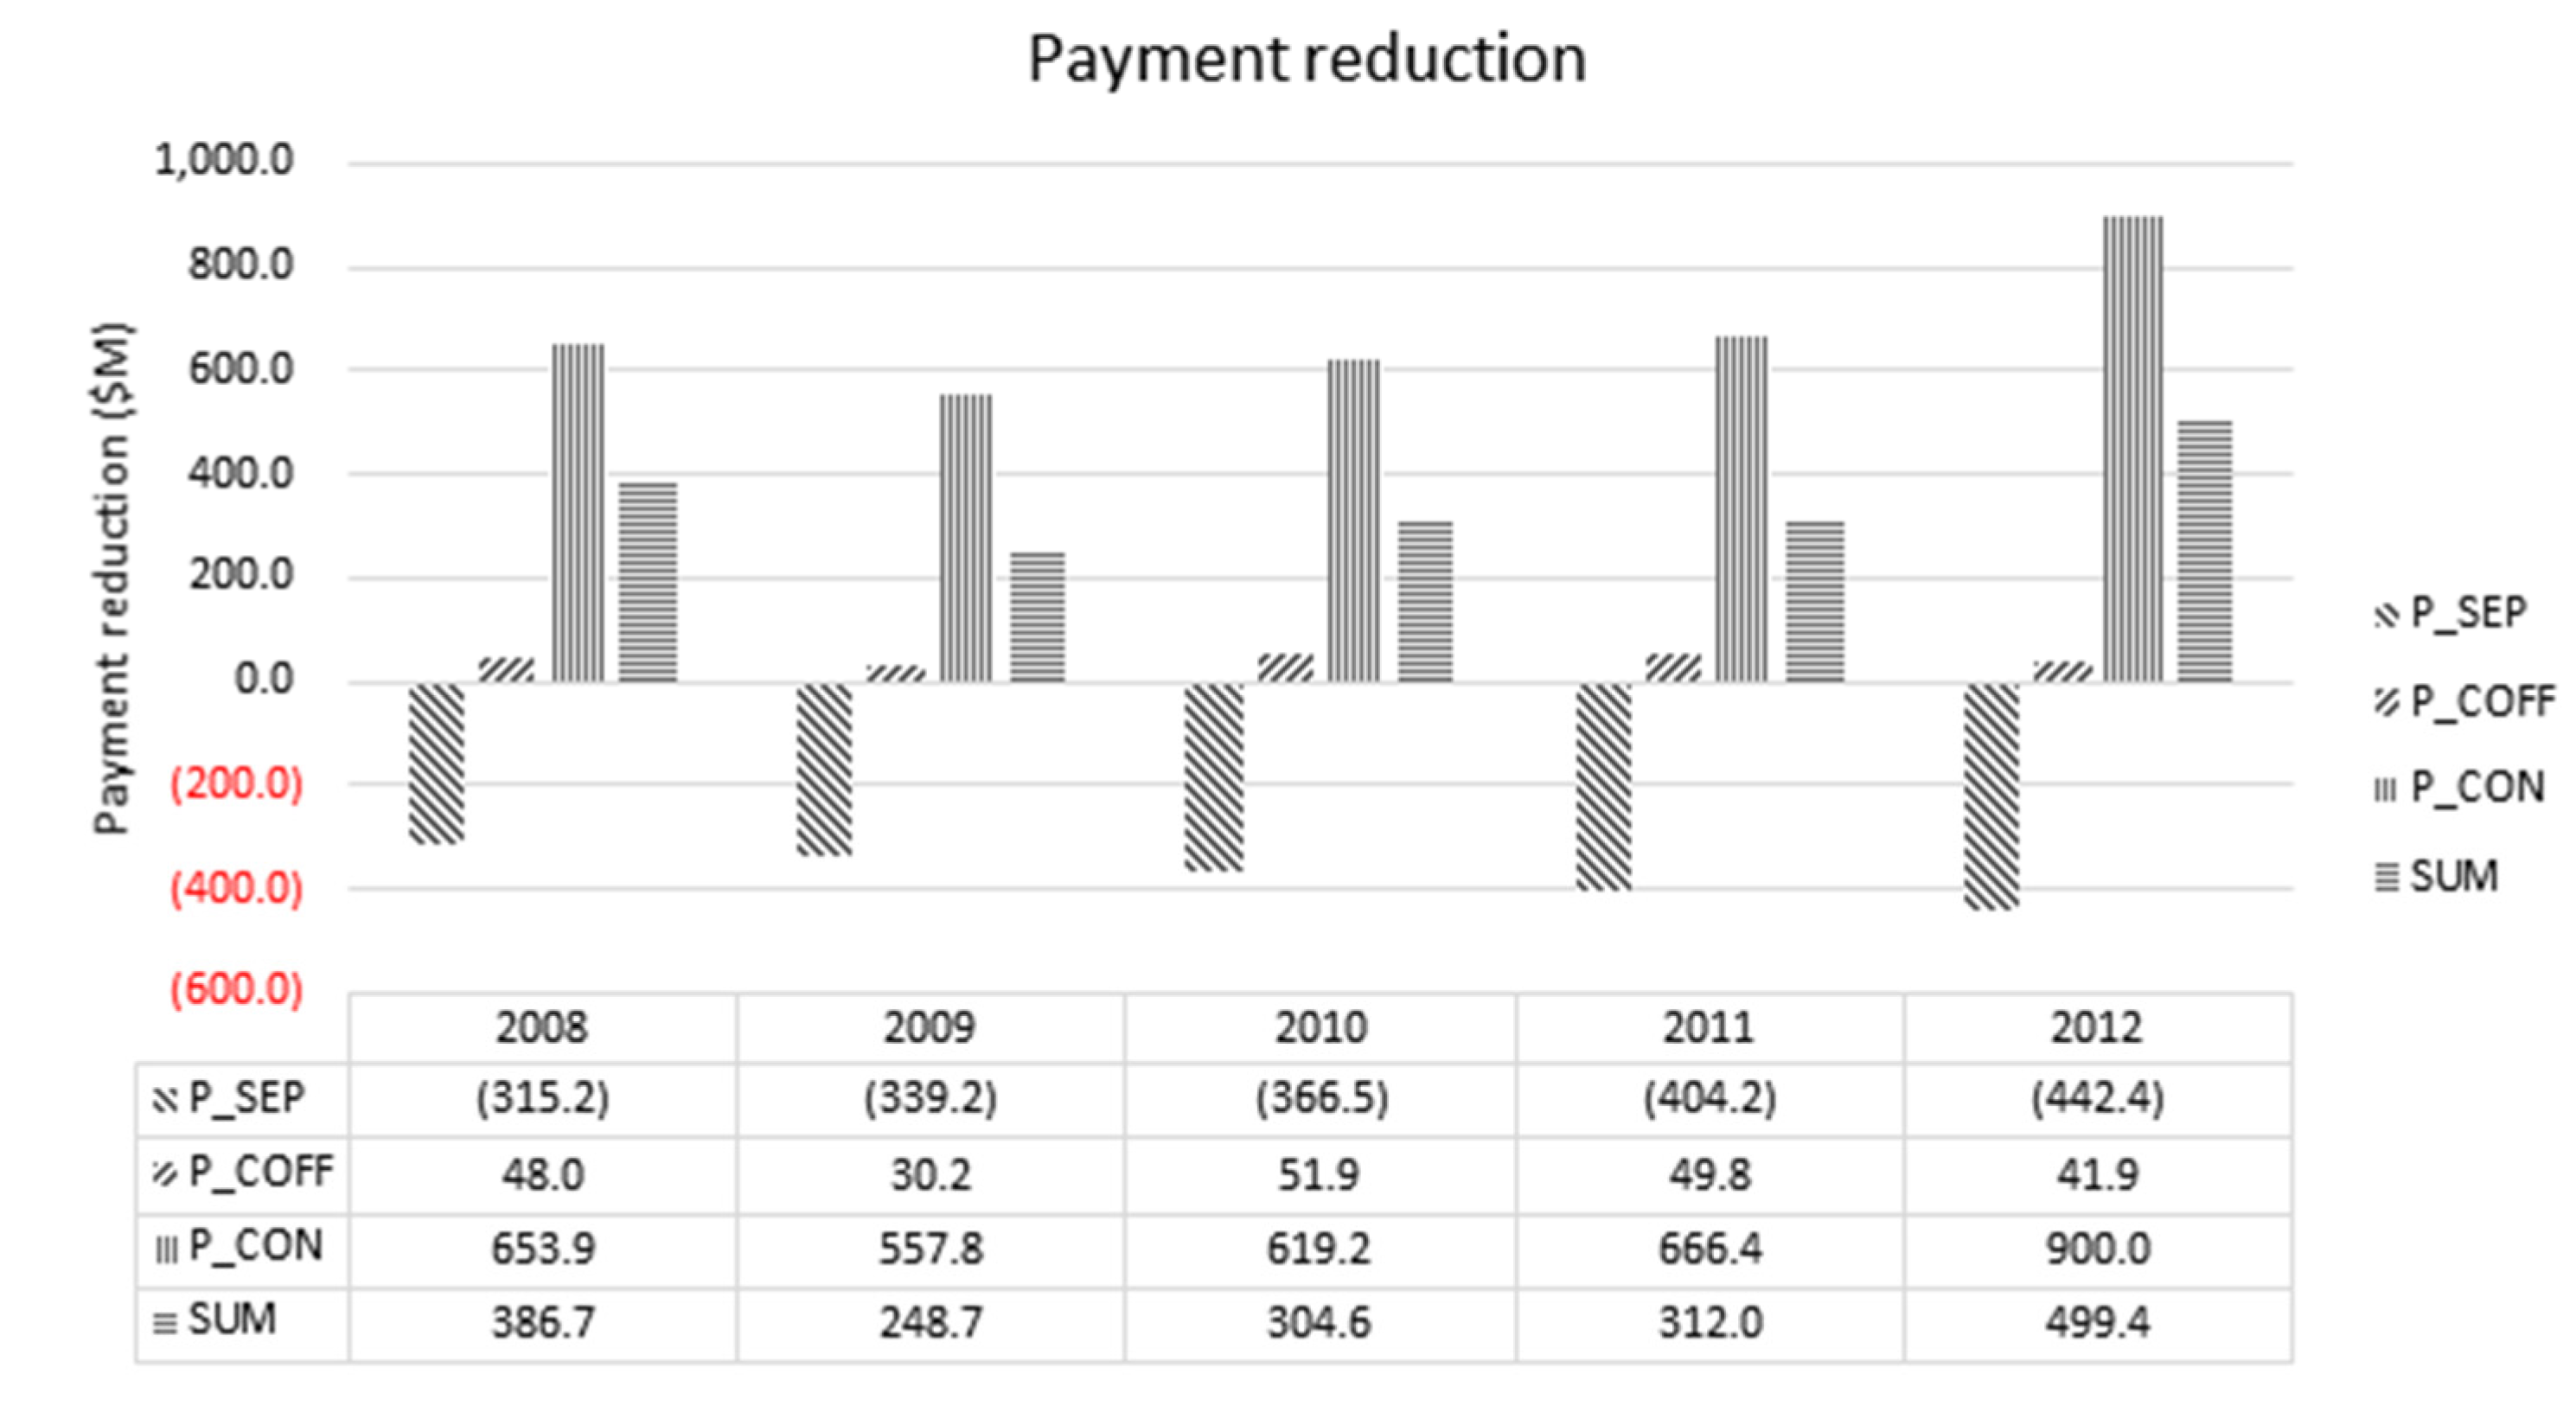
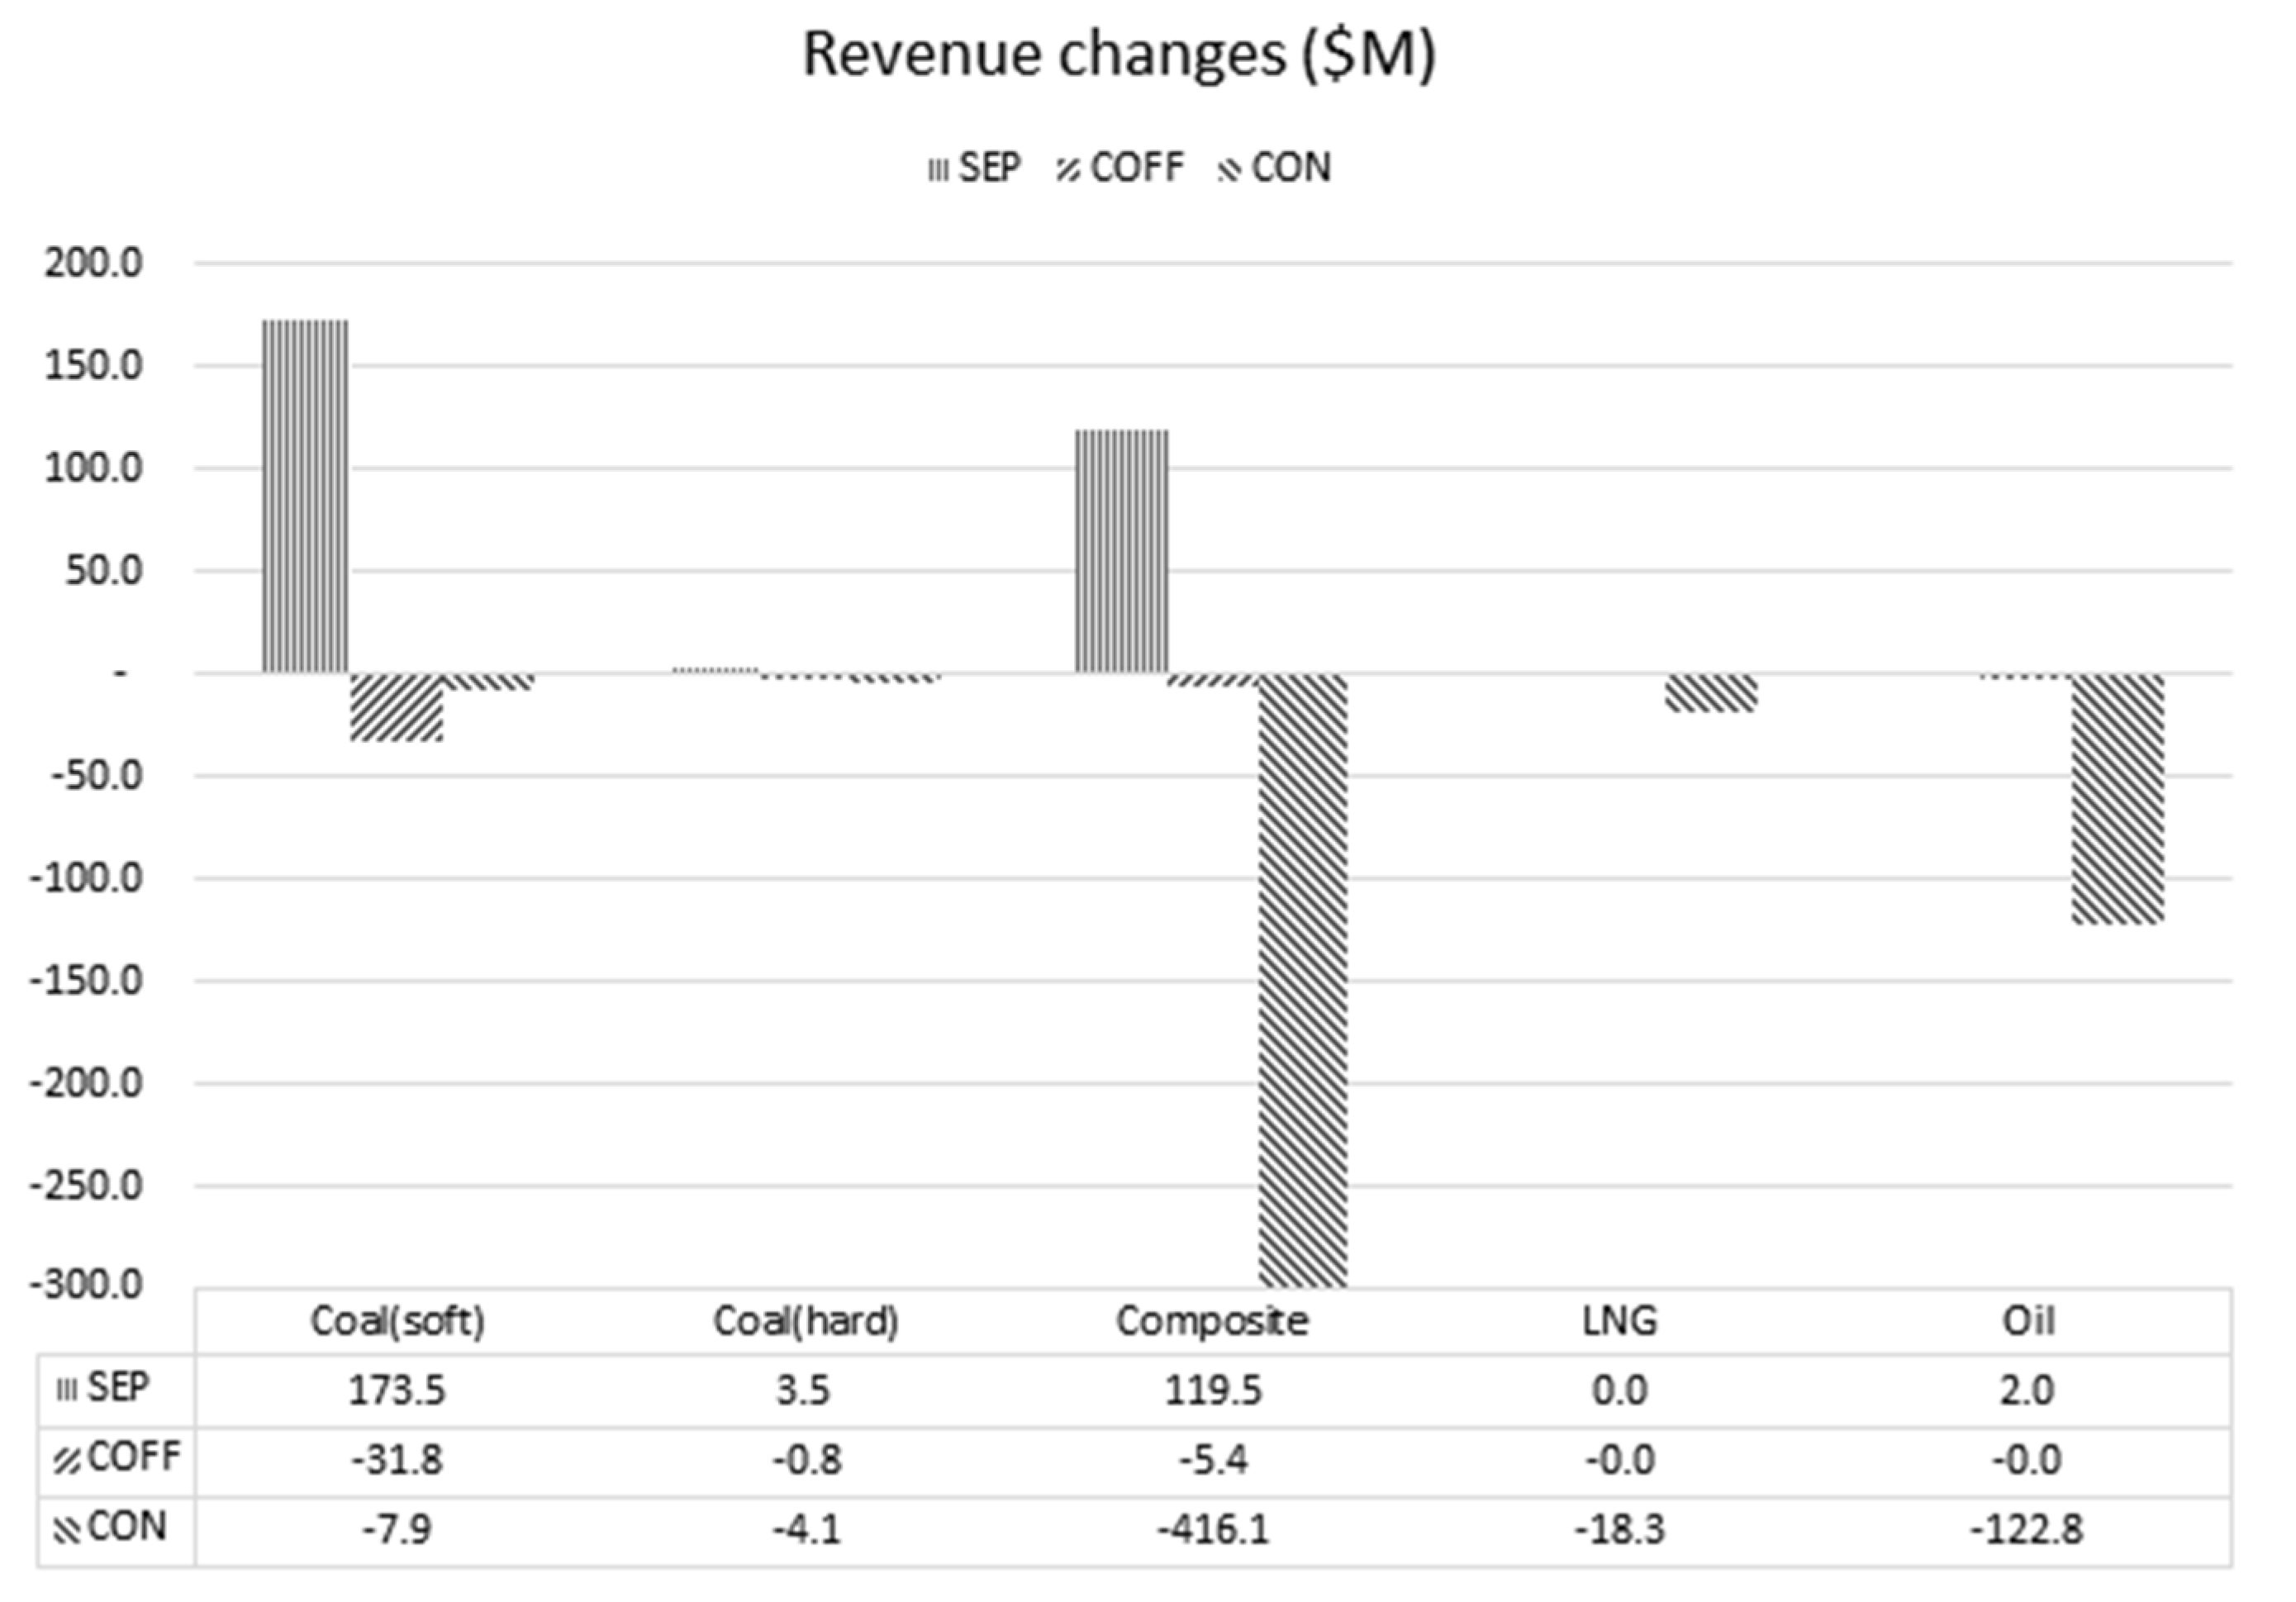
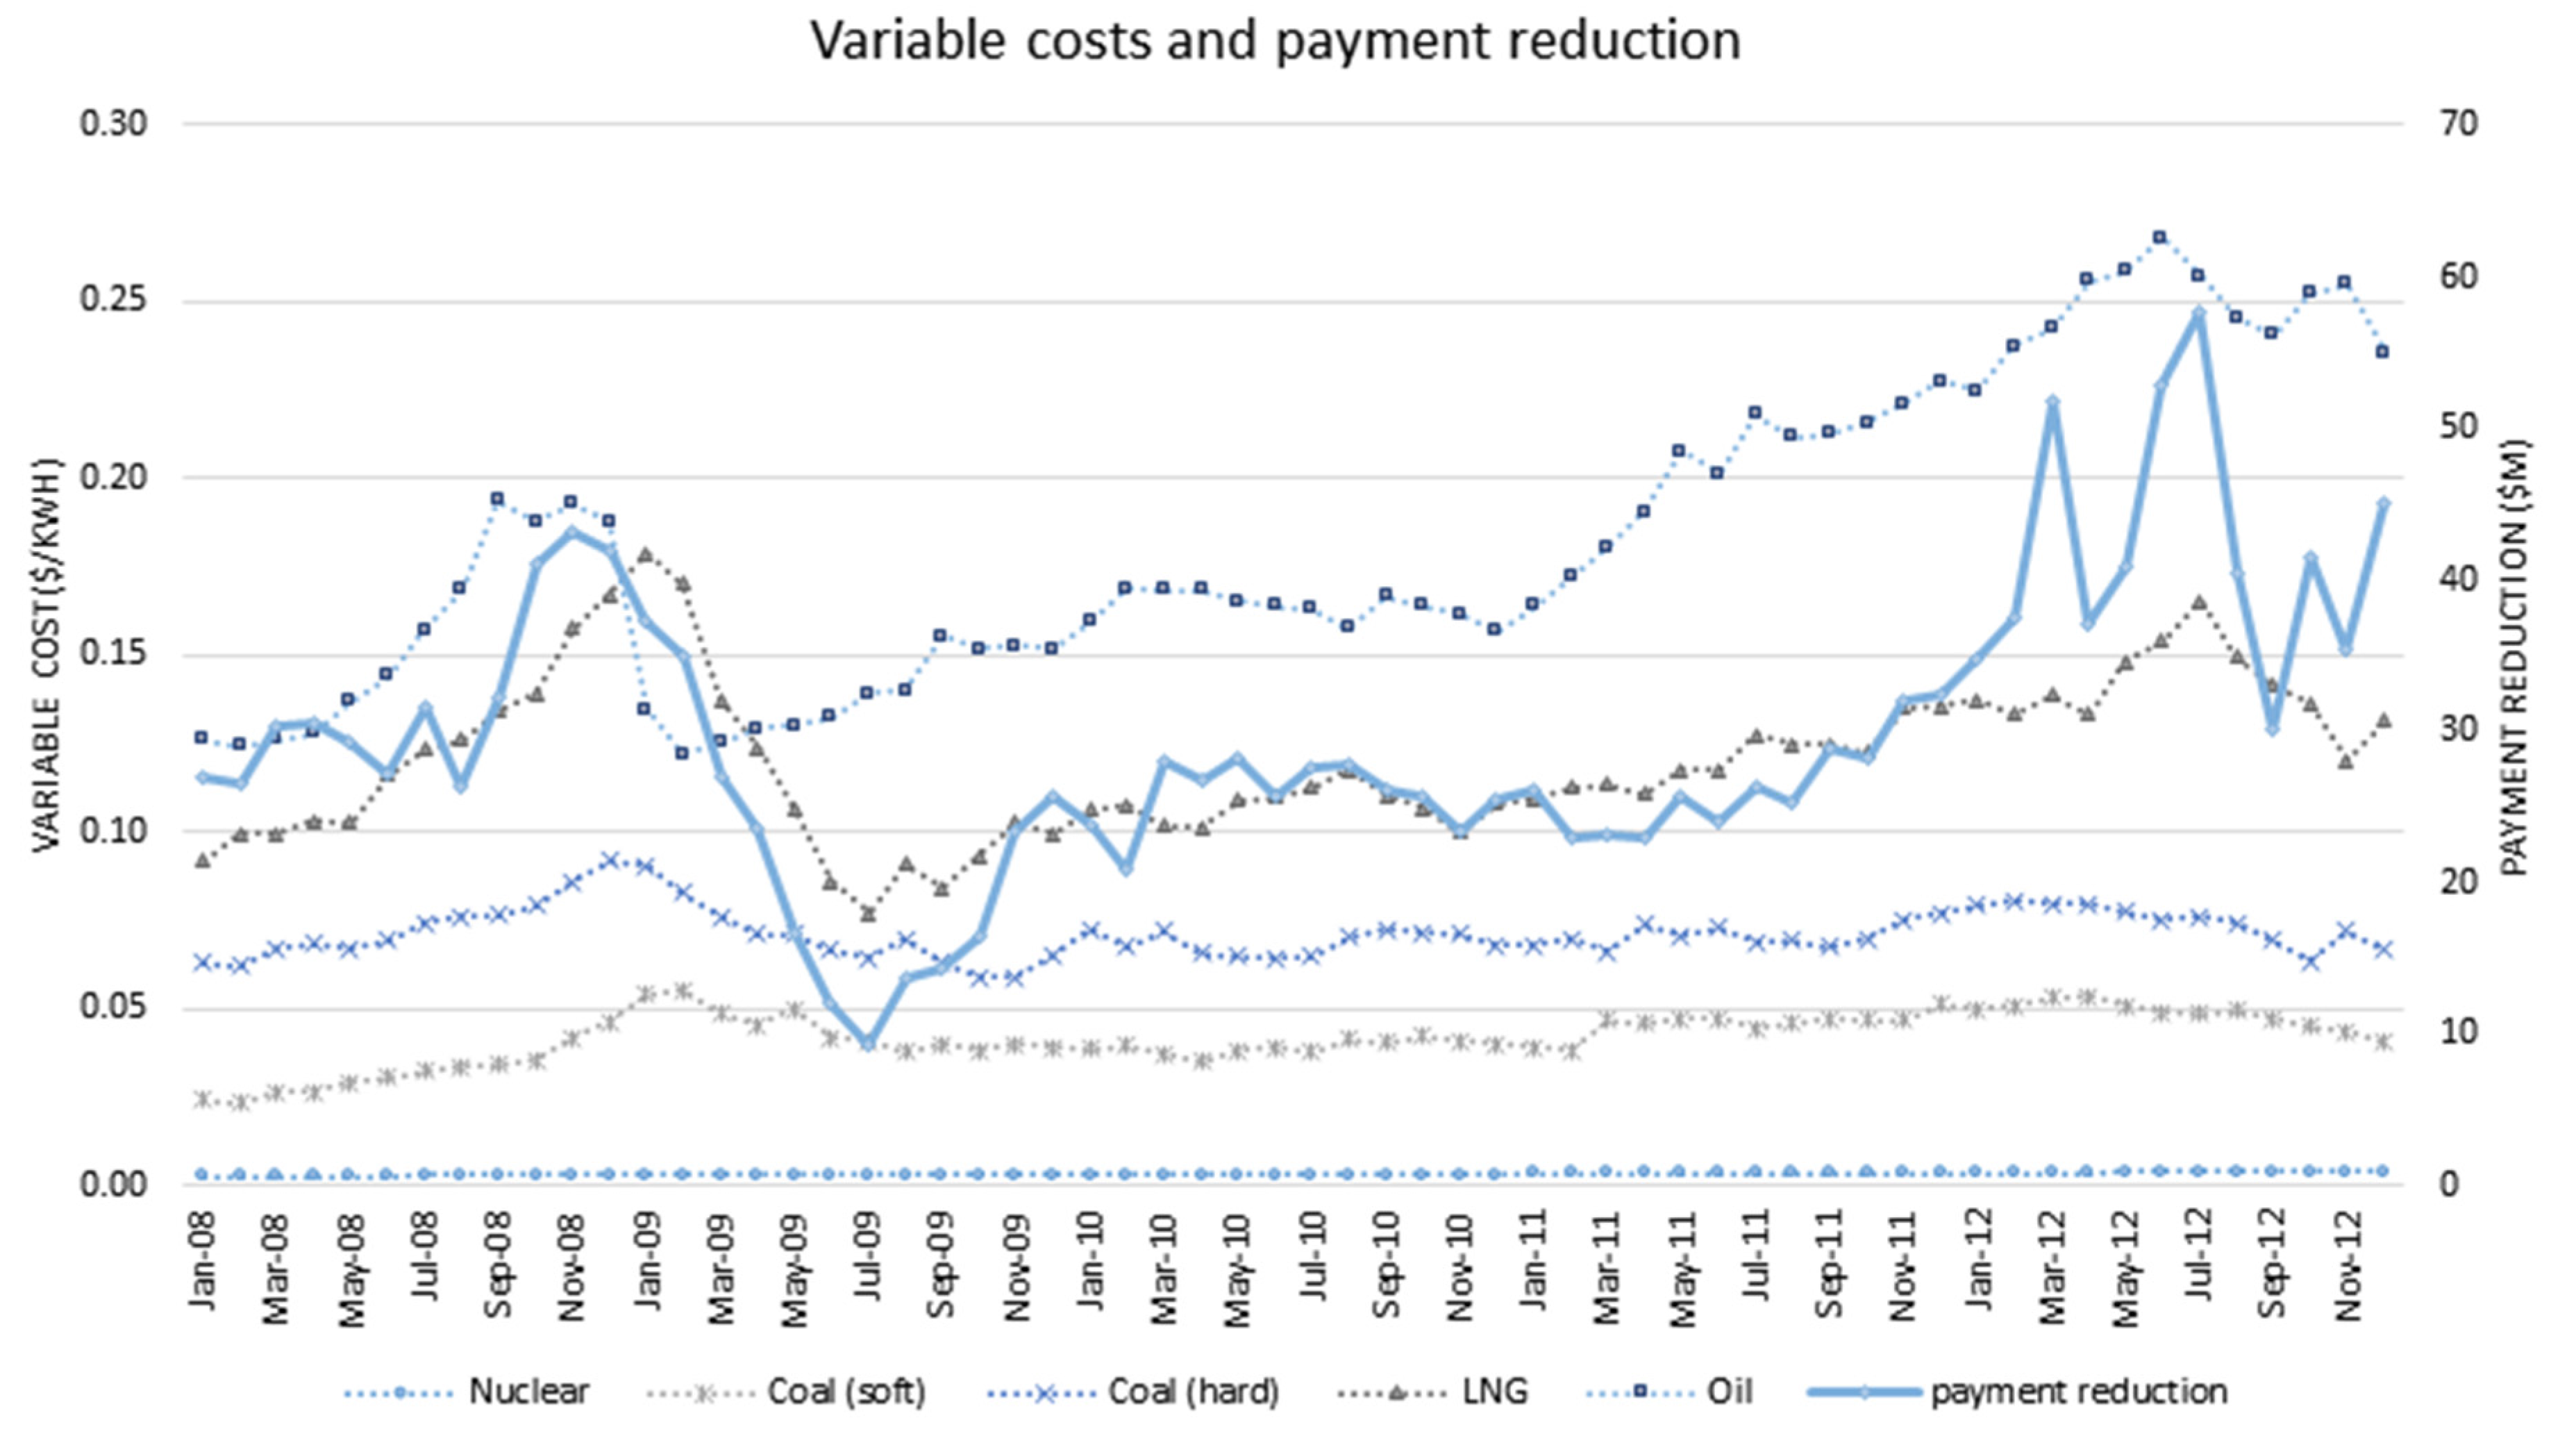
4.2. Estimated Benefit–Cost Ratio (BCR)

Based on these outcomes, we tried to evaluate the economic value of ESS investment from the perspective of a wholesaler in the monopsony wholesale market. To this end, we consider an investment scenario as shown in Table 3. For the first five years of the period, we considered the same data for simulation as the benchmark and during the next five years we assumed that the average data of the previous five years would repeat every year.
Given this scenario, we calculated its benefit–cost ratio (BCR) by estimating the net present values of payment savings and the ESS costs (NPVBenefit and NPVCost) as follows:
B C R = N P V B e n e f i t N P V C o s t =   i = 0 n B e n e f i t i ( 1 + r ) i / i = 0 n C o s t i ( 1 + r ) i
where Benefiti is the benefit for the year i, Costi is the cost for the year i, and r is a discount rate.
As for the costs of operating ESS, we referred to [17], which presents the installation costs and operational expenses of various commercial ESSs available in the market. In this handbook, various storage system costs and technical performances are provided based on surveys from multiple vendors. Among many different types of batteries such as lead-acid, sodium-nickel-chloride and CAES, we used the data on Li-ion batteries for frequency regulation support, and then calculated the annual costs. Specifically, according to their performance data, we assumed that the efficiency of ESS is 80%. Also, to estimate the operating expenses of the Li-ion battery, we utilized the information on the fixed operations and maintenance costs as well as the variable costs given in the literature [17]. Finally, we obtained the annual costs, as given in Table 3.
Based on our estimation, an investment in ESS of 500 MW provides a BCR of 2.56. Given that we did not take into account other benefits worth considering, such as energy import, CO2 reduction, generation efficiency, and so forth, the results suggest that the investment in ESS for FR deserves our fullest consideration.
Table 3. Benefit–cost ratio of ESS investment (discount rate: 6.5%/year, 500 MW ESS, unit: $M).
Year2008200920102011201220132014201520162017NPV
Benefit349.6233.4282.3292.5465.6465.6465.6465.6465.6465.62747.4
Cost721.962.962.962.962.962.962.962.962.962.91071.2
BCR 2.56

5. Conclusions

Although it is well known that ESS has attractive technological features for regulation application, its economic value is relatively little known. In addition, current practice, in which thermal/base-load generators are mostly in charge of regulation service, is economically inefficient due to high constraint costs and under-utilization of low-cost generators. Thus, in this paper, we consider the frequency regulation application of ESS from a utility’s perspective and investigate the economic value by providing a new simulation algorithm. Unlike the existing literature, our valuation logic includes the fact that the schedule of base-load generators would be changed when a utility operates an ESS, not to mention the change in constraint costs. Our results clearly show that an ESS provides an economically viable solution to this problem. Our method estimates that with a 500 MW ESS capacity about 11.7% of energy payments can be saved each year. This savings can in turn lead to a lower retail electricity rate. The savings in energy payment implies that a power system can be much less dependent on high-cost/pollution-causing generators.
Although we did not consider the social benefits of ESS application, a lesser dependence on high-cost generators can result in less reliance on fossil fuels, which are mostly imported from overseas. This means that ESS is also beneficial in terms of government finance. This point can be further explored by including other social benefits that we did not consider in this paper: CO2 emissions reduction, facility upgrade deferral, or other economic impacts.
This paper also presents a challenge for policy change. According to our analysis results, deployment of ESS could raise a conflict of interest between generators and the wholesaler. In addition, most generators do not have a motive to invest in ESS due to the low rate of service fees. Sophisticated government policy measures are necessary to deal with such a subtle relationship of gain and loss among stakeholders.
As suggested by the results, if the wholesaler appropriates the excessive benefits from its market position, the benefit must be shared among other shareholders in some ways. For instance, the government can subsidize the investment of ESS and part of the benefits can be transferred to create a lower retail rate or to increase power capacity. As of 2014, the economic validity of ESS investment is under evaluation by KEPCO and the Korean government and it is expected that there will be some policy propositions regarding an energy policy including the diffusion of ESS.

Author Contributions

Wonchang Hur mainly performed the simulations in collaboration with the other authors, and Yongma Moon completed manuscript. Also, all authors contributed to the editing and reviewing of the paper, and approved the final manuscript.

Conflicts of Interest

The authors declare no conflict of interest.

References

  1. Bradbury, K.; Pratson, L.; Patiño-Echeverri, D. Economic viability of energy storage systems based on price arbitrage potential in real-time U.S. electricity markets. Appl. Energy 2014, 114, 512–519. [Google Scholar]
  2. Rudolf, V.; Papastergiou, K.D. Financial analysis of utility scale photovoltaic plants with battery energy storage. Energy Policy 2013, 63, 139–146. [Google Scholar] [CrossRef]
  3. Sioshansi, R.; Denholm, P.; Jenkin, T.; Weiss, J. Estimating the value of electricity storage in PJM: Arbitrage and some welfare effects. Energy Econ. 2009, 31, 269–277. [Google Scholar] [CrossRef]
  4. Oudalov, A.; Chartouni, D.; Ohler, C. Optimizing a battery energy storage system for primary frequency control. IEEE Trans. Power Syst. 2007, 22, 1259–1266. [Google Scholar] [CrossRef]
  5. Walawalkar, R.; Apt, J.; Mancini, R. Economics of electric energy storage for energy arbitrage and regulation in New York. Energy Policy 2007, 35, 2558–2568. [Google Scholar] [CrossRef]
  6. Eyer, J.; Corey, G. Energy Storage for the Electricity Grid: Benefits and Market Potential Assessment Guide; Sandia Report No. SAND2010-0815; Sandia National Laboratories: Albuquerque, NM, USA, 2010. [Google Scholar]
  7. Alt, J.T.; Anderson, M.D.; Jungst, R.G. Assessment of utility side cost savings from battery energy storage. IEEE Trans. Power Syst. 1997, 12, 1112–1120. [Google Scholar] [CrossRef]
  8. Mercier, P.; Cherkaoui, R.; Oudalov, A. Optimizing a Battery Energy Storage System for Frequency Control Application in an Isolated Power System. IEEE Trans. Power Syst. 2009, 24, 1469–1477. [Google Scholar] [CrossRef]
  9. Suazo-Martínez, C.; Pereira-Bonvallet, E.; Palma-Behnke, R. A Simulation Framework for Optimal Energy Storage Sizing. Energies 2014, 7, 3033–3055. [Google Scholar] [CrossRef]
  10. Kottick, D.; Blau, M.; Edelstein, D. Battery energy storage for frequency regulation in an island power system. IEEE Trans. Energy Convers. 1993, 8, 455–459. [Google Scholar] [CrossRef]
  11. Divya, K.C.; Østergaard, J. Battery energy storage technology for power systems—An overview. Electr. Power Syst. Res. 2009, 79, 511–520. [Google Scholar] [CrossRef]
  12. Jung, K.-H.; Kim, H.; Rho, D. Determination of the installation site and optimal capacity of the battery energy storage system for load leveling. IEEE Trans. Energy Convers. 1996, 11, 162–167. [Google Scholar] [CrossRef]
  13. Lo, C.H.; Anderson, M.D. Economic dispatch and optimal sizing of battery energy storage systems in utility load-leveling operations. IEEE Trans. Energy Convers. 1999, 14, 824–829. [Google Scholar] [CrossRef]
  14. Yilmaz, M.; Krein, P.T. Review of the impact of vehicle-to-grid technologies on distribution systems and utility interfaces. IEEE Trans. Power Electron. 2013, 28, 5673–5689. [Google Scholar] [CrossRef]
  15. Kempton, W.; Tomić, J. Vehicle-to-grid power fundamentals: Calculating capacity and net revenue. J. Power Sources 2005, 144, 268–279. [Google Scholar] [CrossRef]
  16. Oudalov, A.; Chartouni, D.; Ohler, C.; Linhofer, G. Value analysis of battery energy storage applications in power systems. In Proceedings of the 2006 IEEE PES Power Systems Conference and Exposition (PSCE’06), Atlanta, GA, USA, 29 October–1 November 2006; pp. 2206–2211.
  17. Sandia National Laboratories. Electricity Storage Handbook in Collaboration with NRECA; Sandia National Laboratories: Albuquerque, NM, USA, 2013. [Google Scholar]

