Article

The Development of Cloud Energy Management

1
Department of Energy and Refrigerating Air-Conditioning Engineering, National Taipei University of Technology, Taipei 10608, Taiwan
2
Chunghwa Telecom, Data Communications Business Group, Taipei 10048, Taiwan
3
Foundation of Taiwan Industry Service, Taipei 10608, Taiwan
*
Author to whom correspondence should be addressed.
Energies 2015, 8(5), 4357-4377; https://doi.org/10.3390/en8054357
Submission received: 27 January 2015 / Accepted: 4 May 2015 / Published: 14 May 2015

Abstract

:
The energy management service (EMS) has been utilized for saving energy since 1982 by managing the energy usage of site or facilities through the microprocessor, computer, Ethernet, internet, and wireless sensor network. The development and represented function groups of EMS are illustrated in the supplementary file of this paper. Along with this tendency, a cloud EMS, named the intelligent energy management network (iEN), was launched by Chunghwa Telecom in 2011 and tested during a pilot run from 2012 to 2013. The cloud EMS integrated three service modes together, including infrastructure as a service (IaaS), platform as a service (PaaS), and software as a service (SaaS). This cloud EMS could reduce the facility cost and enable a continuously improved service for energy conservation. From the literature review, 32 selected EMS cases of whole site and single facility were chosen for calculating the energy savings and payback rate. According to the literature, the average energy savings by applying EMS are 11.6% and 21.4% for the whole site and single facility, respectively. The iEN was applied on 55 demo sites with the similar scale, the same kind of machines and approaching conditions. The testing sites include a factory, a complex building, and a residual building, 12 lighting systems and 8 air conditioning systems. According to the testing results, the average energy savings by applying iEN are 10% and 23.5% for the whole site and single facility, respectively. Comparing with the reported EMS cases, it was found that the energy savings by adopting the cloud EMS were only 70%–80% compared with those using the traditional EMS. Although the cloud EMS presented less energy savings, it revolutionized the traditional EMS by its innovative business model. Compared with the averaged 1.7 years payback period of the traditional EMS, more than 70% of the cloud EMS cases could pay back immediately for the service fees and without the equipment investment.

1. Introduction

Cloud computing technology had a breakthrough and made revolutionary improvements to the applications of the information technology (IT) industry. In this study, how the cloud computing technology revolutionized the EMS and yielded the developed cloud EMS was studied. Before a detailed discussion, the progressing history of EMS is first illustrated. According to the database of the Science Direct on Line (SDOL) and the IEEE Xplore (IEL Online), mainly in electrical and power electronic fields, the published papers from 1907 to 2014 related to EMS number 357,030 and 26,767, respectively. Among the numerous researches, 11 representative articles were chosen to address the development of EMS. Different types of EMS and their main features developed during the past 30 years are summarized in Table 1.
Table 1. The development of the energy management service (EMS).
YearTypeFeature
1982Microprocessor based EMS [1] Energies 08 04357 i001
1985Computerized EMS [2] Energies 08 04357 i002
1989De-centralized EMS [3] Energies 08 04357 i003
1995Ethernet based EMS [4] Energies 08 04357 i004
2000Nationwide EMS [5] Energies 08 04357 i005
2002–2008Wireless sensor network based EMS [6] Energies 08 04357 i006
2008Energy information system (EIS) [7] Energies 08 04357 i007
2012Architecting EMS according to ISO 50001 [8] Energies 08 04357 i008
2013–2014IT [9], big data, data mining [10] and cloud computing technique [11] explored the trend of revolutionizing EMS to cloud EMS.
Table 1 illustrates the development of EMS from 1982 till now. The progressing trends could be summarized as: (1) from 1980 to 1990, the computer replaced the micro-processor to enhance the data processing capability; (2) from 1990 to 2000, internet communication enabled the nation-wide energy management; (3) from 2008, wireless sensors were developed for EMS; (4) from 2010, the energy information system initiated the evolution of cloud EMS. The ISO standard management, big data and data mining technology were also introduced for joint management of energy and resources; (5) from 2013, through integrating cloud computing technology, the capability of collecting and processing big data could be achieved. The developing history of EMS summarized in Table 1 actually demonstrates the revolution of cloud EMS.

2. From EMS to Cloud EMS

The evolution of cloud EMS could be illustrated schematically in 
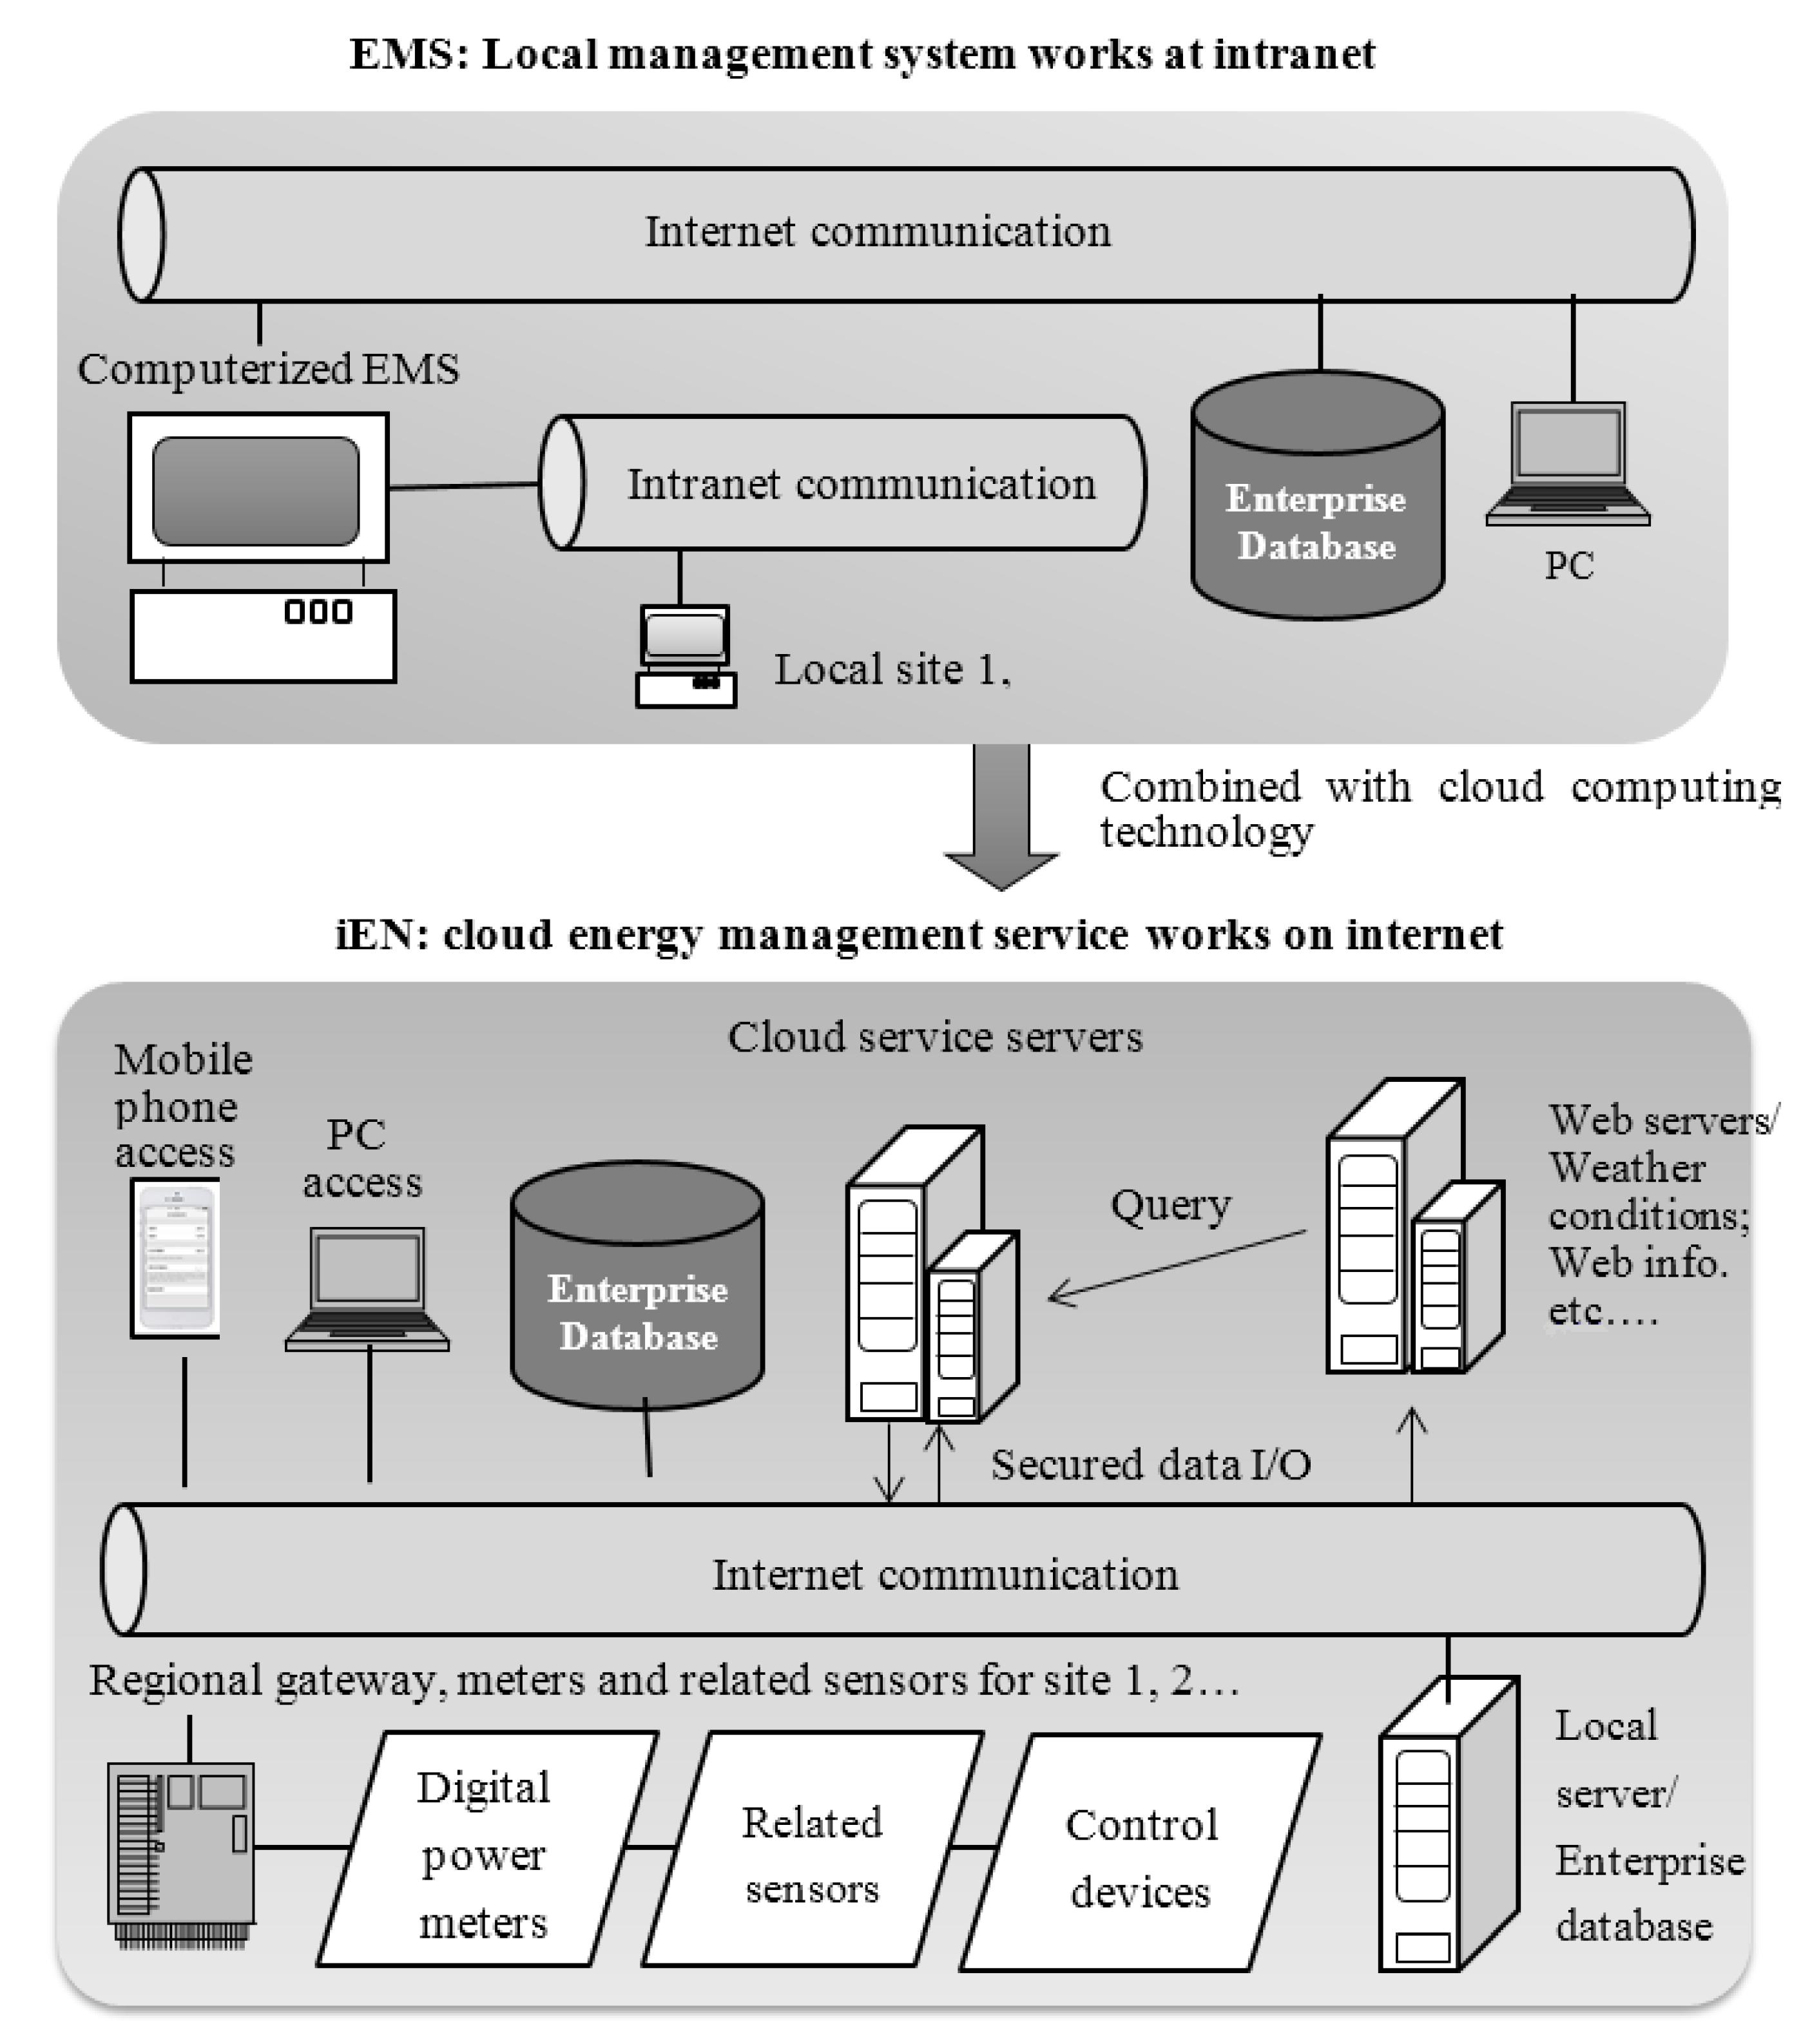
Figure 1. The EMS, working within intranet, is the information system for managing the site or facilities, and connects to the database of enterprise or remote PC through the internet. Yet, the cloud EMS adopts the cloud server as the core of management and connects the specific controllers and the related sensors, such as digital power meters, through the internet for the energy saving control. The cloud structure with secured data I/O is also applicable to the remote PC or mobile phone for easy access. Energy management can be spread widely by cloud.
Figure 1. The evolution of cloud EMS.
Energies 08 04357 g001
The main difference between the EMS and the cloud EMS is similar to that between the operating system (OS) of the traditional personal computer (PC) and the cloud APP of the smart phone or the tablet PC. The advantages of cloud EMS are: (1) shared software resources could reduce the facility cost; (2) with a cloud service, the cloud EMS could be upgraded continuously till the optimization of function. However, the disadvantage is from the normalized application layer of cloud server, because the energy management functions may not be tuned finely for the specific hardware of the distributed sites. How to promote the advantages, overcome the disadvantages and yield an evolution, i.e., a successful commercialization of cloud EMS, is the main issue in this study.

3. iEN, the Cloud EMS Developed and Deployed at Taiwan

iEN, the cloud EMS launched by Chunghwa Telecom, Taiwan in 2011, is a commercial cloud service system for energy management [12]. After one year pilot run, the Chunghwa Telecom cooperated with the academic team, Energy Technology Research Center (ETRC) of NTUT, for improving this product. The main goal of this cooperation was to overcome the disadvantage and promote the advantages as illustrated in the previous section. The modified results and the application of the improved cloud service on the distributed sites will be discussed in the following sections.

3.1. Three Integrated Service Modes of the Cloud EMS

The cloud EMS consists of three service modes, including the software as a service (SaaS), the platform as a service (PaaS), and the infrastructure as a service (IaaS). The SaaS was first demonstrated in February 2001 [13]. It is a software license and delivery model, in which the software is licensed on a subscription basis and hosted centrally on the cloud. With SaaS, the application software is guaranteed to work with hardware provided by the cloud service. The mentioned main disadvantage of the cloud EMS could be conquered by SaaS. The details will be presented in Section 3.5.
The PaaS denotes a computing platform and a solution stack as a service. In this model, the consumer could create an application or service by using the tools/libraries from the cloud service provider. PaaS provides the computing resources for application design, development, test, and deployment as well as web services.
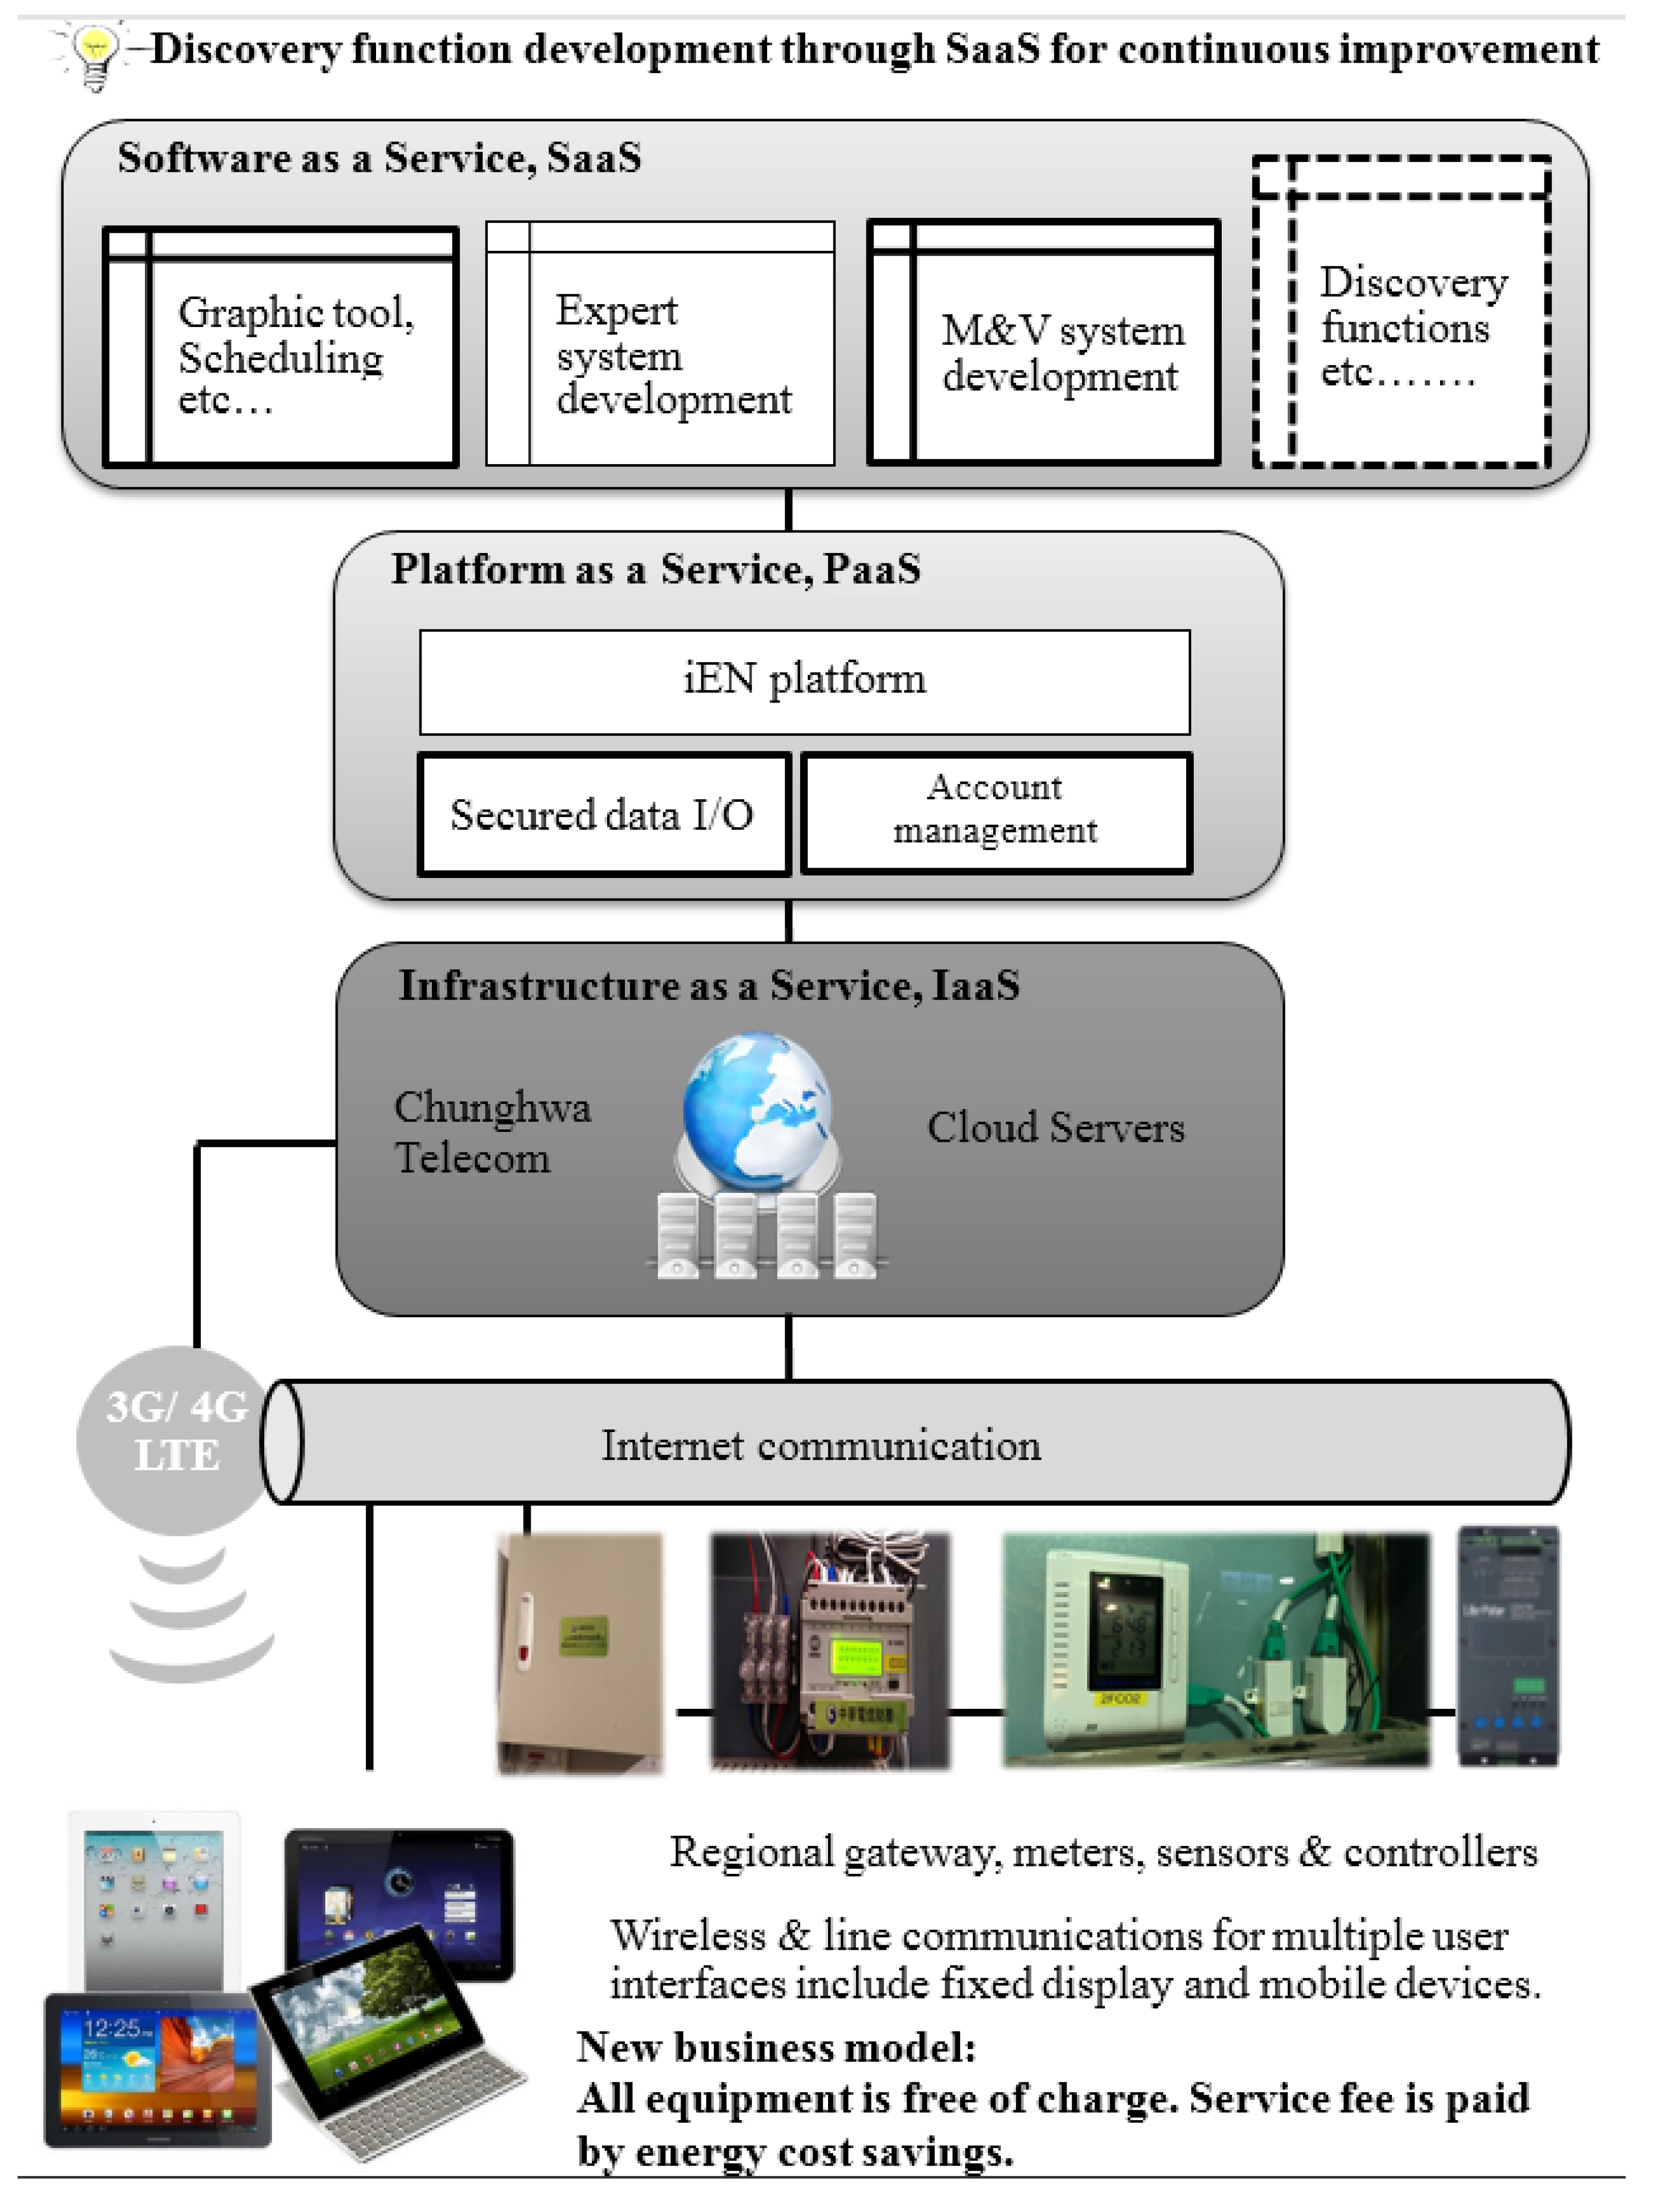
The IaaS is a provision model in which the equipment used for services is organized. IaaS offers additional resources, such as a virtual-machine disk image library, raw block storage, and file or object storage, firewalls, load balancers, IP addresses, virtual local area networks (VLANs), and software bundles. By integrating these three service models, the service structure of iEN is illustrated in Figure 2.
Figure 2. Cloud EMS and an iEN platform, consists of three service models, i.e., SaaS, PaaS, and IaaS.
Energies 08 04357 g002

3.2. Energy Management Functions Enabled by PaaS

As shown in Figure 2, PaaS works as the middle layer, which could provide the management of login and secured data for the energy saving management sites. Here, the iEN platform works as the core of performing energy management functions developed by the top layer of SaaS. Through reviewing the developing history of EMS, three main functions are identified for effective energy management and performed by the iEN platform as follows:
(1)
Energy usage and related information monitored by connecting to the gateway, digital power meters, related sensors and controllers.
(2)
Multi-graphic display function includes (a) real time power meter reading plot; (b) pie chart for energy usage analysis; (c) energy related sensor reading displays; and (d) statistical regression analysis.
(3)
Scheduling control function includes (a) setting energy saving target and scheduling on online calendar; and (b) setting time schedule and control parameters for energy saving of single facility.
The details for performing key energy management functions can be referred to Figures S1 and S2 in the supplementary file, “Key energy management functions for the effective energy savings.”

3.3. Optimized Service by SaaS

As illustrated in Section 2, the main advantage of the cloud EMS is its capability for upgrading continuously to the optimized version. The SaaS works as the core of this optimization. In this software layer, various energy saving operation models would be developed. The management structure of SaaS server is a hi-cloud system, denominated by Chunghwa Telecom. The developing program of the service platform and the database system are XML and the NoSQL system, respectively. The testing sites could also be connected with SaaS through the PaaS and IaaS for practicing energy management. The function development is achieved through SaaS as shown at the top of Figure 2.
In this study, two advanced functions, including an expert system for model-based control and a measurement and verification (M&V) system for measuring the saved energy, were developed in the layer of SaaS, and deployed by the iEN platform for testing energy conservation effects.

3.4. A new Business Model Created by the M&V System

The M&V system can measure the reserved energy under the management of cloud service. It creates a new business model for energy conservation. As shown at the bottom of Figure 2, all the equipment of cloud EMS is free of charge. Service fee is paid by the saved energy cost.
The reserved energy could be estimated according to the standard of the International Performance Measurement and Verification Protocol (IPMVP) [14]. Cloud EMS would assist users to build up enough sensing points for the calculation of energy conservation. The operation of the M&V system includes the following steps:
(1)
Login: users should log in to the system here.
(2)
Target type: choose the target type, such as company, institute, and building, for calculating the energy saving amount. At the same time, the users could choose the measuring point of energy saving efficiency.
(3)
Energy baseline period: according to the monitoring condition of iEN, this is a complete recording period before the application of energy saving procedure.
(4)
Modeling list: if there is no data for calculating the energy baseline, the program would provide the modeling method for calculating it.
(5)
Defined reporting period: after the application of energy saving procedure, the energy saving amount could be calculated according to the energy usage difference between the energy baseline period and the defined reporting period. This period could be short as three months, or similar to the energy baseline period. The starting point of defined reporting period would be decided based on the differential method. After the application of energy saving procedure, the energy saving effect would be manifested by the increment of differential value of energy usage. Therefore, after the application of energy saving procedure, the timing of the maximum differential value of energy usage would be the starting point of the defined reporting period.
The energy saving amount is the deduced amount of energy usage after adopting the energy saving instrument or procedure. The calculated energy saving results may include the information of energy saving amount and saved energy usage. Some details related to energy savings comparison between the sensor platform and IPMVP can be referred to our previous work [15].

3.5. Fine-Tuned Service by Expert System

As illustrated in Section 2, the disadvantage of cloud EMS may be due to the normalized application layer of cloud server. Energy management functions may not be fine-tuned to meet the specific hardware of the distributed sites. In order to conquer this situation, the expert system was developed to perform the modeling control. Based on proper model, the scheduling and related control can be tuned finely to fit the requirements of the distributed sites.
Based on the operational conditions, the expert system could simulate a simplified factory energy management system. This model treats a factory as a grey box with energy cost, E, raw materials, R, and the created product value, V. The unit of the energy cost, E, raw materials, R, and the created product value, V is US$. Referring to the optional pricing model, a modified Black-Scholes equation [16] could be used to simulate the factory energy usages by:
V t + γ E E V E + γ R R V R + 1 2 σ ( E 2 2 V E 2 + R 2 2 V R 2 ) γ V V = 0
If there are several products manufactured by the same factory with several raw material, the model would be enlarged as a multi-parameters one. The utilized energy could be electricity, gasoline, oil or other energy types. Three coefficients, γ E ,   γ R ,   γ V , denote the increment rates of energy consumption, material usages and product values, respectively. The coefficient, σ , denotes the economic fluctuation of the product market.
The cloud service could gather the energy usage information automatically. By connecting to the enterprise resources planning (ERP) system, the product values and raw material usages could be obtained. All coefficients would be determined from websites, including future price, stock’s price and economic signs announced by government. With all these data, daily energy usage target can be calculated by:
n V E M a x ,   δ 2 V δ E 2 0
For modeling and optimization of buildings, including residential, commercial and complex buildings, the software development could refer to a review work for building optimization [17]. The algorithms of air conditioning system were modified based on the hot and humid weathers at Taiwan. The optimal energy supply of the air conditioner could be calculated by Linear Quadratic Gaussian (LQG) method. The predictive control based on mobile communication is suggested for the air conditioning energy conservation. The calculating details and smart sensors with their contribution on smart air conditioning control for providing a comfortable environment and achieving the goals of energy conservation and environmental protection could be obtained from our previous work [18].
For lighting systems of buildings, the optimization of light intensity is based on the adjustable luminance control with the feedback from the light intensity sensors distributed at the site. Not only is the light intensity, according to the Chinese National Standard (CNS) 12112 for the lighting requirement of indoor work places, the light bulb number is also required to fit a suitable indoor light intensity. The Chinese National Standard (CNS) 12112 is published by the Bureau of Standards, Metrology and Inspection (BSMI), Ministry of Economic Affairs, Taiwan. The fine-tuned service of the expert system could be practiced by an APP program to reduce the energy consumption. The example of improving the service quality by SaaS would be illustrated in Section 5.

4. Energy Savings by EMS and Cloud EMS—A Comparative Analysis

It is impossible to replace the existed EMS system of the testing site by the cloud EMS for evaluating the performance difference. Therefore, in this study, some EMS cases from the references and the demo sites of iEN with the similar scale, the same kind of machines and approaching conditions were chosen to compare the performance. The chosen principles of the testing sites for applying iEN were: (1) the type of target: whole site or single facility; (2) the building area, rooms, occupants number of whole site; (3) the scale, kind, approaching conditions of single facility. The energy savings of the selected EMS cases could be referred to the published results in Table 2 and Table 3. Those of the demo sites of iEN were collected from a two-year experiment. The comparative analysis of energy savings between EMS and cloud EMS was based on these results.
Table 2. The selected EMS cases of whole site.
ItemsContents of EMS cases
SitesEMS integrated into the quality system of Grimstad Konservesfabrik (GK) company [19]. The company has 40 employees. The capital turnover for 1996 was 8.5 mill. EURO. It preserves fruit and vegetables. The adopted energy carriers are oil and electricity.
EMS for Linyun Iron and Steel Group [20]
EMS for fine chemistry industrial park [21]
Energy management in Swedish iron and steel industry [22]
EMS for electrical energy conservation of complex building in Saubi Arabia [23]
EMS integrated design for sustainable buildings [24]
Office equipment power management [25]
EMS for complex buildings [26]
EMS for university campus [27]
Intelligent decision support tool for building energy saving [28]
Home EMS [29]
Home EMS for assessing overall lifecycle [30]
Energy-consumption information system for home energy conservation [31]
Home EMS based on automatic meter reading [32]
Energy saving methodologies1. Graphic tool; 2. Optimization; 3. Scheduling; 4. Demand response control; 5. Modeling; 6. Energy audit
Energy savingsThe energy saving range of factory is 11%–29%. The saving rates of complex buildings, including the campus, are 1%–43%. The saving rates of residential buildings are 2%–9%.
Table 3. The selected EMS cases of single facility.
ItemsContents of EMS cases
EquipmentEMS for HVAC system at a shopping center [33]
EMS for HVAC system optimization [34]
Enthalpy estimation for thermal comfort control and energy saving in air conditioning system [35]
Neural temperature control and management system in subtropical Hong Kong [36]
Occupancy detection based control for HVAC system [37]
Optimization of HVAC system [38]
Behavioral pattern for air conditioning energy saving [39]
Energy saving potential and strategies for electric lighting [40]
Occupancy detection for lighting system control [41]
EMS development for adjustable luminance control at each location of the building [42]
Integration strategies between daylight and electric lighting and strategies based on the occupancy of spaces [43]
Lighting control technologies in commercial buildings [44]
Building automation and control system [45]
Energy saving methodologies1. Graphic tool; 3. Site specific strategies; 4. Scheduling; 6. Thermal comfort control; 8. Occupancy detection; 10. Dimmer control.
Energy savingsThe energy saving rates of HVAC system are 12%–32%. The energy saving rates of lighting system are 15%–32%.

4.1. For EMS Cases

From the literature review, the selected EMS cases of whole site and single facility are sorted in Table 2 and Table 3, respectively. It is noted that the energy saving methodologies mentioned in Table 2 and Table 3 are illustrated in Figures S1 and S2 of the supplementary file, “Key energy management functions for the effective energy savings”. The EMS cases, summarized in Table 2 and Table 3, majorly account their energy saving ratios, and are presented in Table S1. In additional to the mentioned energy saving effect, the payback rate is also important for the EMS performance. Several EMS cases investigating the payback rate are illustrated as follows: EMS at a meat packing facility [46]; EMS in the food and kindred products industries [46]; EMS in a fish-processing plant [47]; Large distributed EMS in a magnetic tape plant [48]; Implementation of EMS for an integrated steel plant [49]; EMS installed at the factory of Kjøttcentralen Co. [19]; and Energy audit of an industrial site [50].

4.2. For Cloud EMS Cases

There were 35 iEN demo sites, including factories, complex buildings and residential buildings, under the test of energy saving rate from 2012 to 2013. The iEN was also deployed for energy saving control on the additional 12 lighting systems and 8 air conditioning systems. These sites were chosen because their specifications were very similar with those illustrated in Table 2 and Table 3. The demo sites information (photographs), the energy management methodology and savings of factories, complex buildings, residential buildings, HVAC and lighting systems are presented in Table 4, Table 5, Table 6, Table 7 and Table 8, respectively. In Table 4, Table 5, Table 6, Table 7 and Table 8, most of the demo sites and facilities managed by cloud EMS have the obvious energy savings. Several measured energy usage data of the 35 iEN demo sites for demonstrating the variation of sites are shown in Figures S3–S6.
Table 4. Factories managed by cloud EMS.
ItemsContents
Demo sitesCNC machining factory Energies 08 04357 i009International bearing company and assembly factory Energies 08 04357 i010Chemical factory Energies 08 04357 i011
Methodologies
  • Energy usage and related information monitoring.
  • SaaS expert system gives daily energy management targets by Black-Scholes model.
  • Scheduling control.
  • M&V system for calculating saved energy cost day by day.
  • Multi-graphic display for management.
Energy savingsCNC machining factory saved 12.5% energy by improving compressed air system.Assemble company saved 30% energy by management of day and night office hour energy consumption.Chemical factor saved 5.5% energy by improving the heater control.
Table 5. Complex buildings managed by cloud EMS.
ItemsContents
Demo sitesBus station Energies 08 04357 i012Complex building Energies 08 04357 i013Office building Energies 08 04357 i014
Library Energies 08 04357 i015Department store Energies 08 04357 i016Store case 1 Energies 08 04357 i017
Store case 2 Energies 08 04357 i018Store case 3
Energies 08 04357 i019
Methodologies
  • SaaS expert system adjusts chiller, package air conditioner and air conditioner settings according to thermal comfort level.
  • Scheduling control.
  • Optimizing luminance distribution by expert system.
Energy savingsBus station achieved 2.3% energy saving. Others had distributed savings range from 0%–11.7%.
Table 6. Residential buildings managed by cloud EMS.
ItemsContents
Demo sitesResidual building 1 Energies 08 04357 i020Residual building 2 Energies 08 04357 i021Residual building 3 Energies 08 04357 i022
Dormitory Energies 08 04357 i023
Methodologies
  • SaaS expert system adjusts air conditioner settings according to thermal comfort level.
  • Scheduling control of lighting system.
  • Scheduling control of elevators.
  • Optimizing luminance distribution by expert system.
  • Multi-graphic reports to energy managers of buildings.
Energy savingsWhole site of residential buildings had 4.16%–21% energy savings.
Table 7. HVCA systems managed by cloud EMS.
ItemsContents
Equipment photographsMulti-set of split type air conditioners Energies 08 04357 i024Package air conditioner case 1 Energies 08 04357 i025Package air conditioner case 2 Energies 08 04357 i026
Chiller case 1 Energies 08 04357 i027Chiller case 2 Energies 08 04357 i028Chiller case 3 Energies 08 04357 i029
Smart home air conditioner Energies 08 04357 i030Store air conditioner Energies 08 04357 i031
MethodsSaaS expert system adjusts air conditioning settings according to thermal comfort level automatically.
Energy savingsAir conditioners had energy savings range from 10%–30%. Chiller had energy savings range from 5.5%–18%
Table 8. Lighting systems managed by cloud EMS.
ItemsContents
Equipment photographsStore lighting case 1 Energies 08 04357 i032Store lighting case 2 Energies 08 04357 i033Store lighting case 3 Energies 08 04357 i034
Store lighting case 4 Energies 08 04357 i035Store lighting case 5 Energies 08 04357 i036Store lighting case 6 Energies 08 04357 i037
Store lighting case 7 Energies 08 04357 i038Store lighting case 8 Energies 08 04357 i039Store lighting case 9 Energies 08 04357 i040
Office lighting case 1 Energies 08 04357 i041Office lighting case 2 Energies 08 04357 i042Office case 3 Energies 08 04357 i043
Residual building 1 Energies 08 04357 i044Residual building 2 Energies 08 04357 i045Factory case Energies 08 04357 i046
Restaurant case Energies 08 04357 i047Hospital case Energies 08 04357 i048Conference room Energies 08 04357 i049
MethodsScheduling + Occupancy detection control
Energy savingsLighting system had energy savings range from 0%–51.52%.

5. Results and Discussion

It is interesting to compare the energy savings of sites and facilities managed by EMS and cloud EMS. The comparing results are presented in Figure 3, Figure 4, Figure 5, Figure 6 and Figure 7 for the factory, commercial and complex building, home, and single facility, including HVAC equipment and light system, respectively.
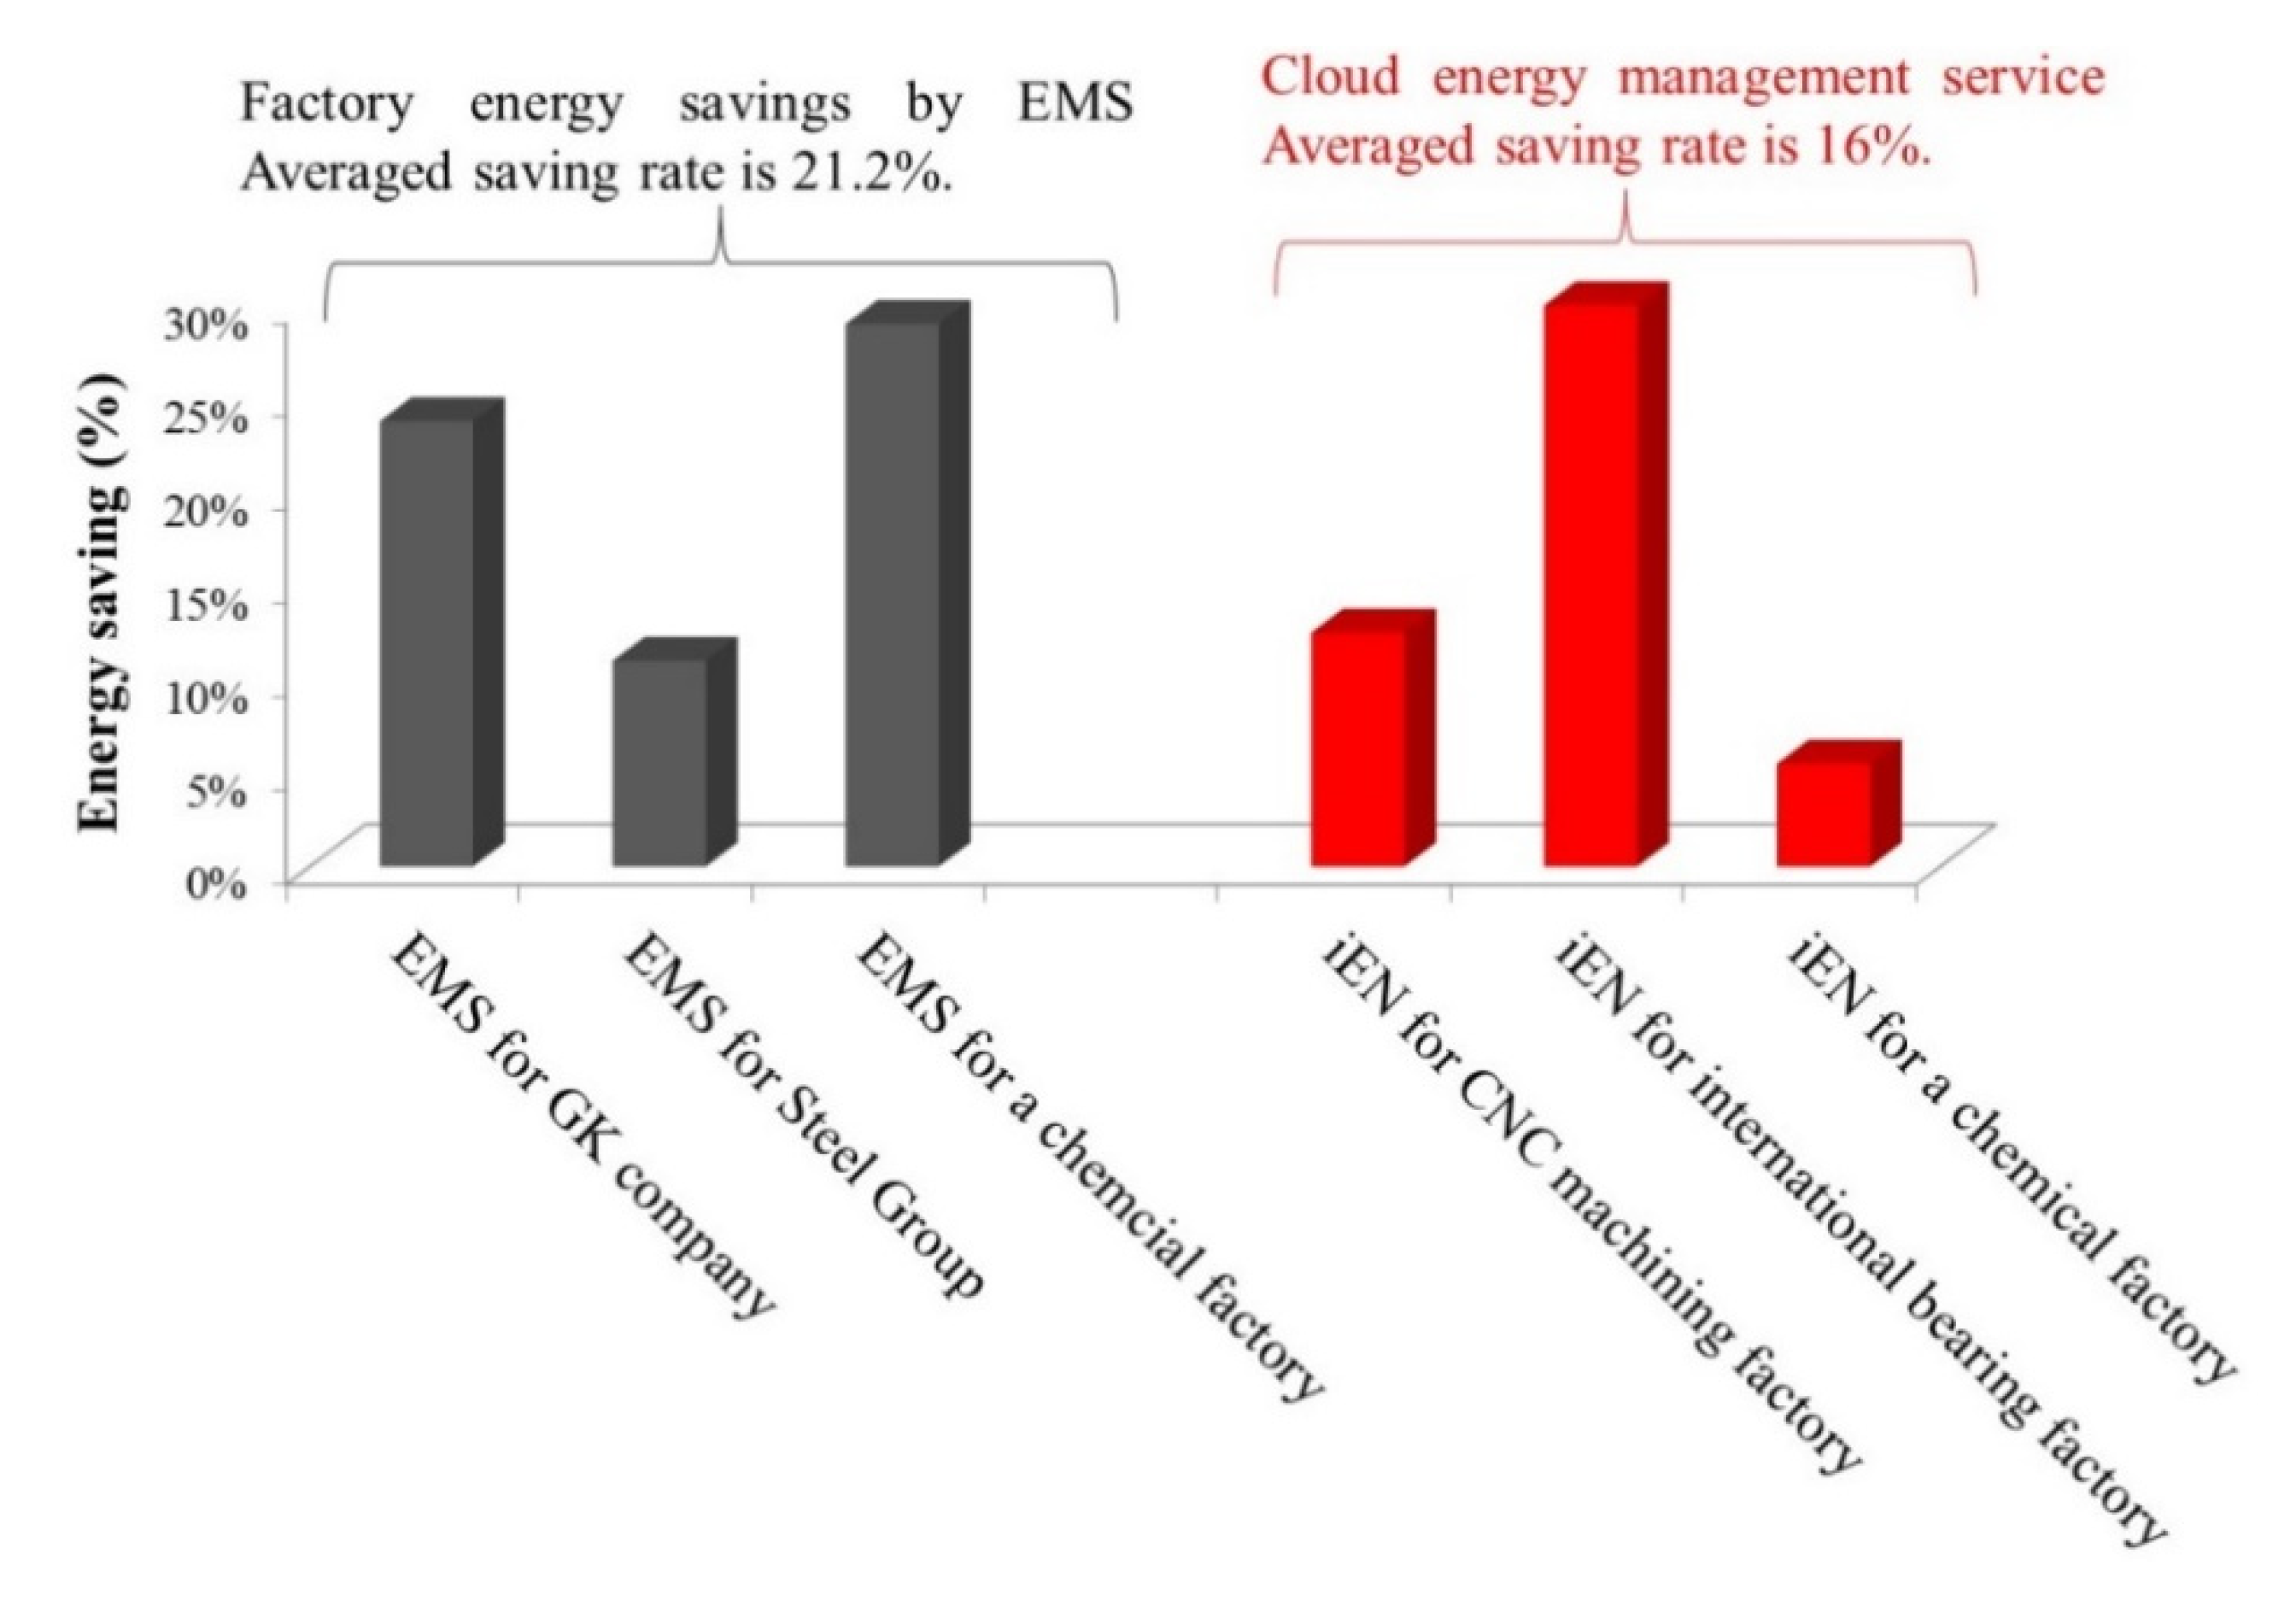
The comparison of energy savings of factories in Figure 3 includes company, steel group, chemical factory, machining factory, and bearing factory. The highest energy saving effect is the bearing factory, 30%, by applying cloud service of iEN. The averaged energy savings of factory is 21.2% and 16% for applying EMS and iEN, respectively.
Figure 3. Comparison of energy savings of factories by applying EMS and iEN.
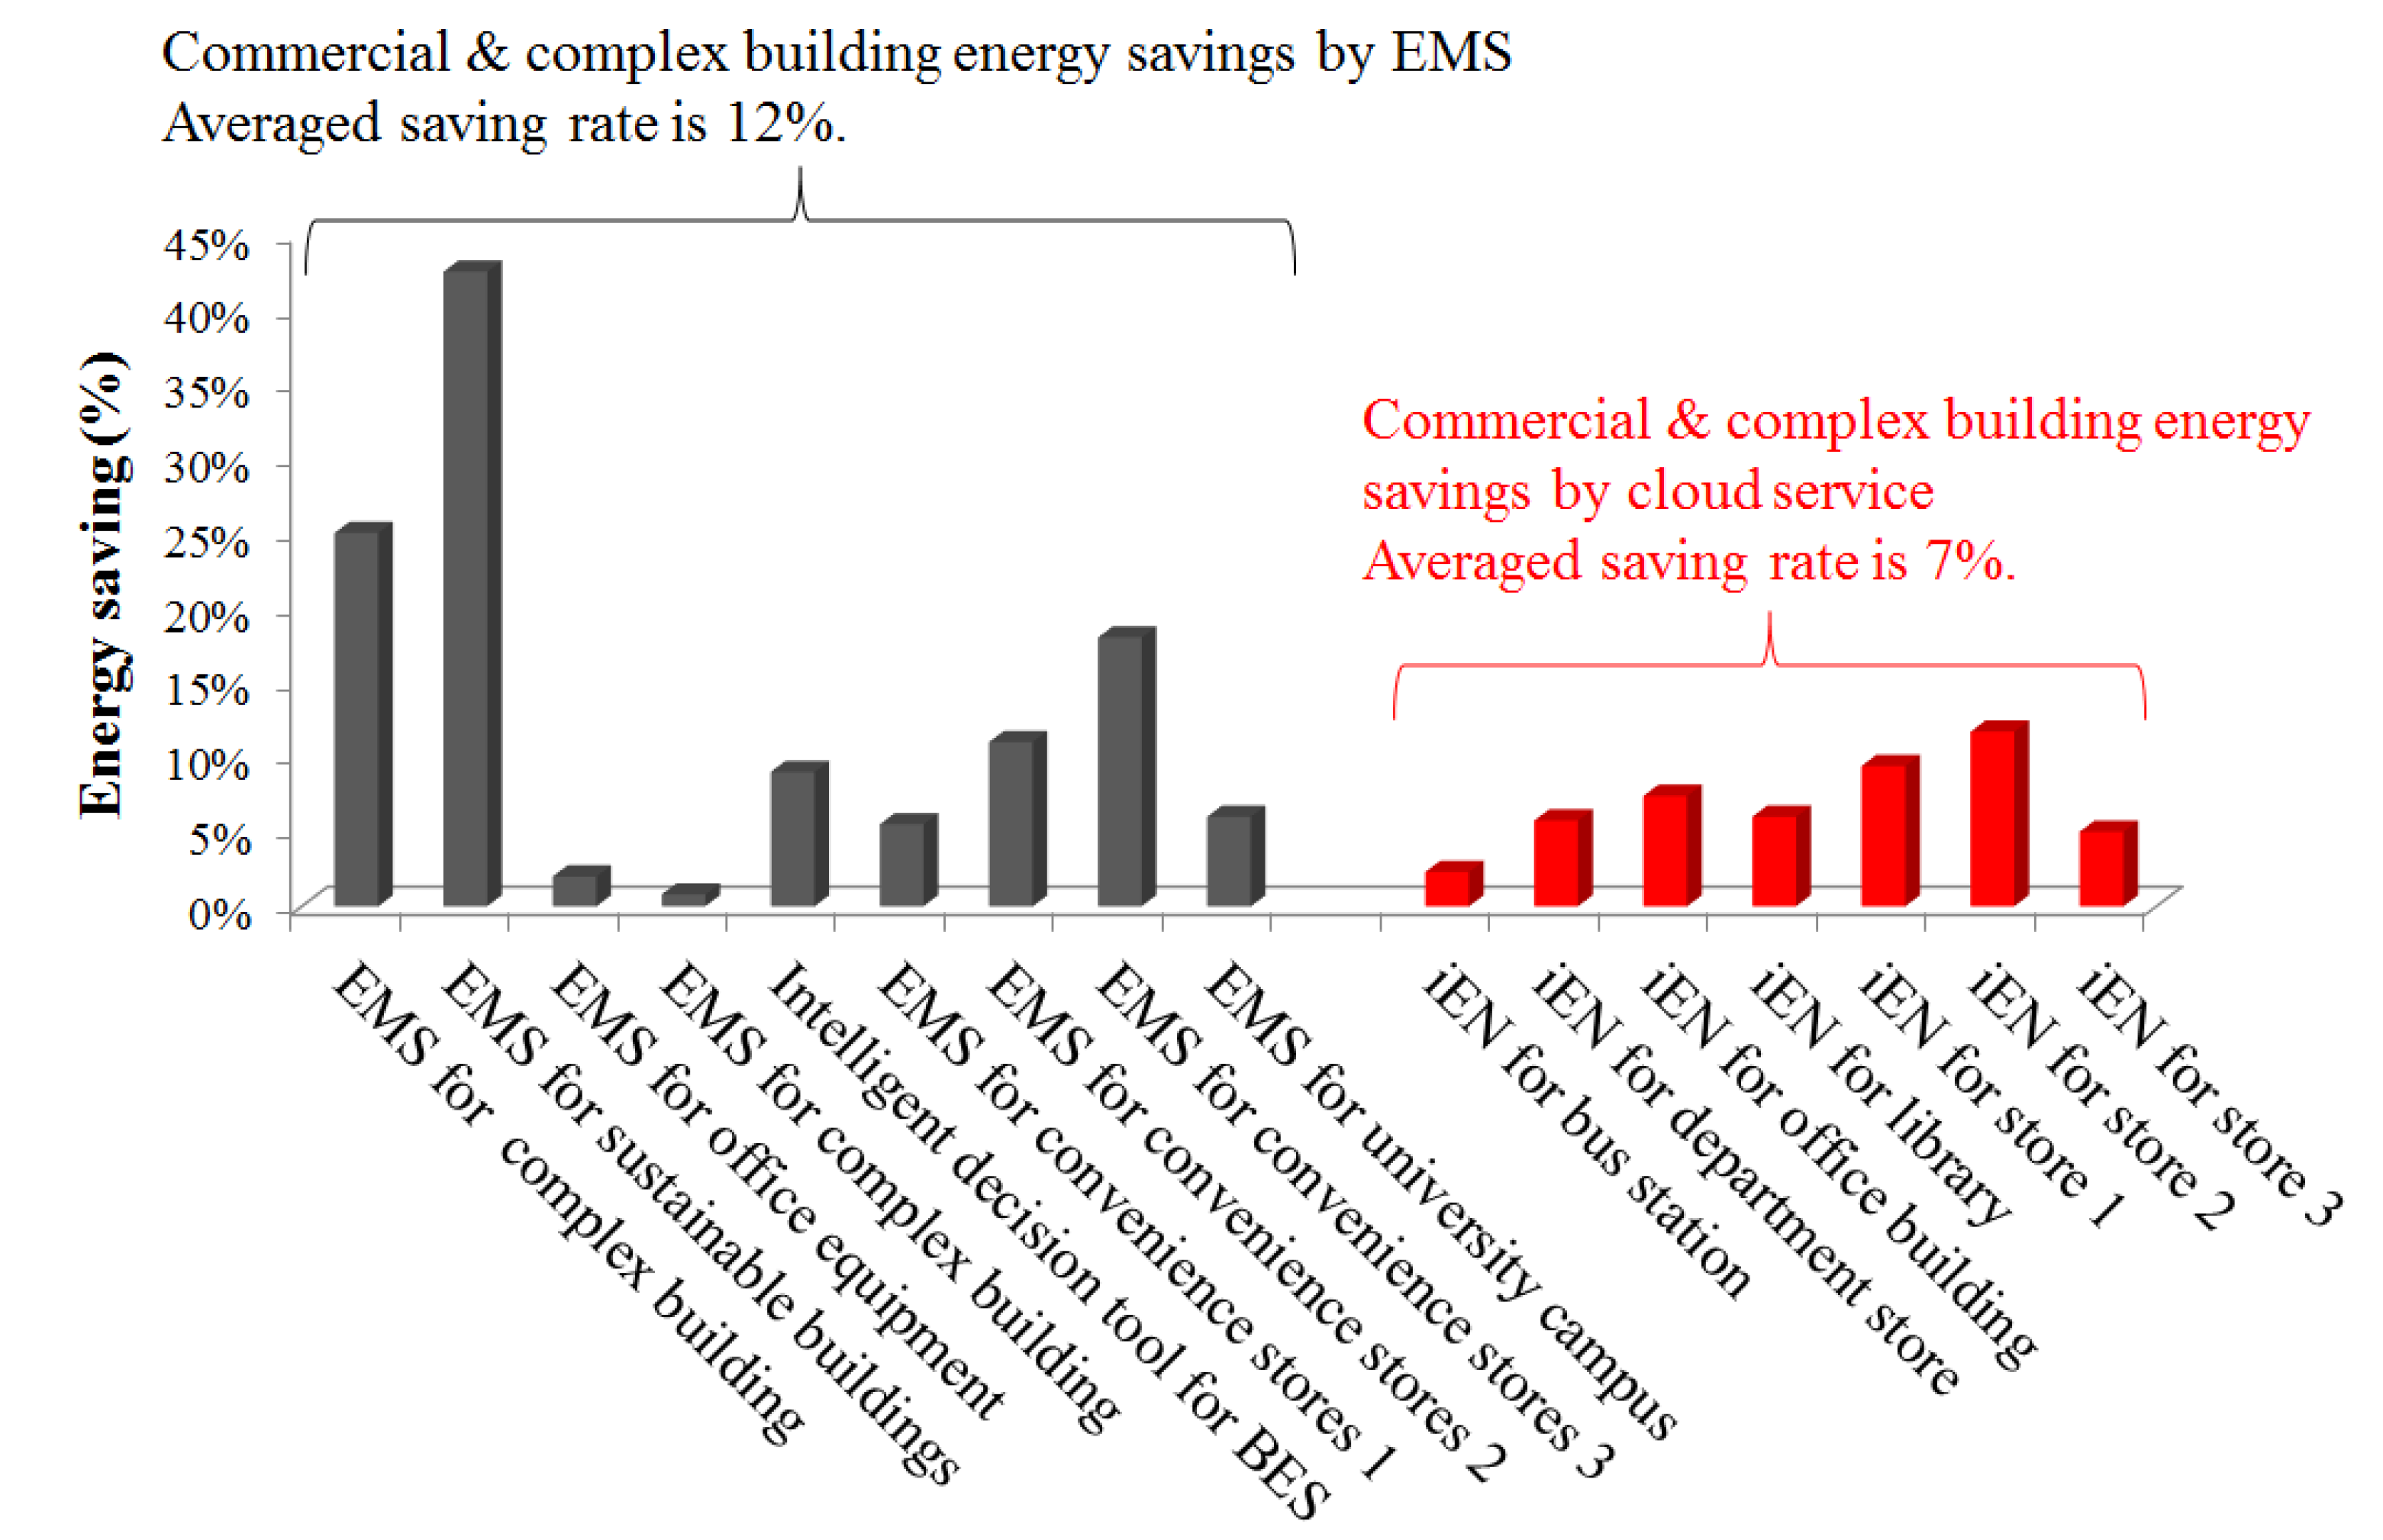
Energies 08 04357 g003
Figure 4. Comparison of energy savings of commercial and complex buildings by applying EMS and iEN.
Energies 08 04357 g004
The comparing results of the commercial and complex building are shown in Figure 4. Those sites include EMS for a complex building in Saudi Arabia, EMS integrated design for sustainable buildings, EMS for office equipment, intelligent decision support tools for building energy saving, and EMS for convenience stores and for university campus. Sites also include iEN for a bus station, department store, office building, library and convenience stores. The site with the highest energy saving effect, 43%, is the EMS integrated design for a sustainable building. The average energy savings of commercial and complex buildings are 12% and 7% for applying EMS and iEN, respectively.
Figure 5. Comparison of energy savings for home-type buildings by applying EMS and iEN.
Energies 08 04357 g005
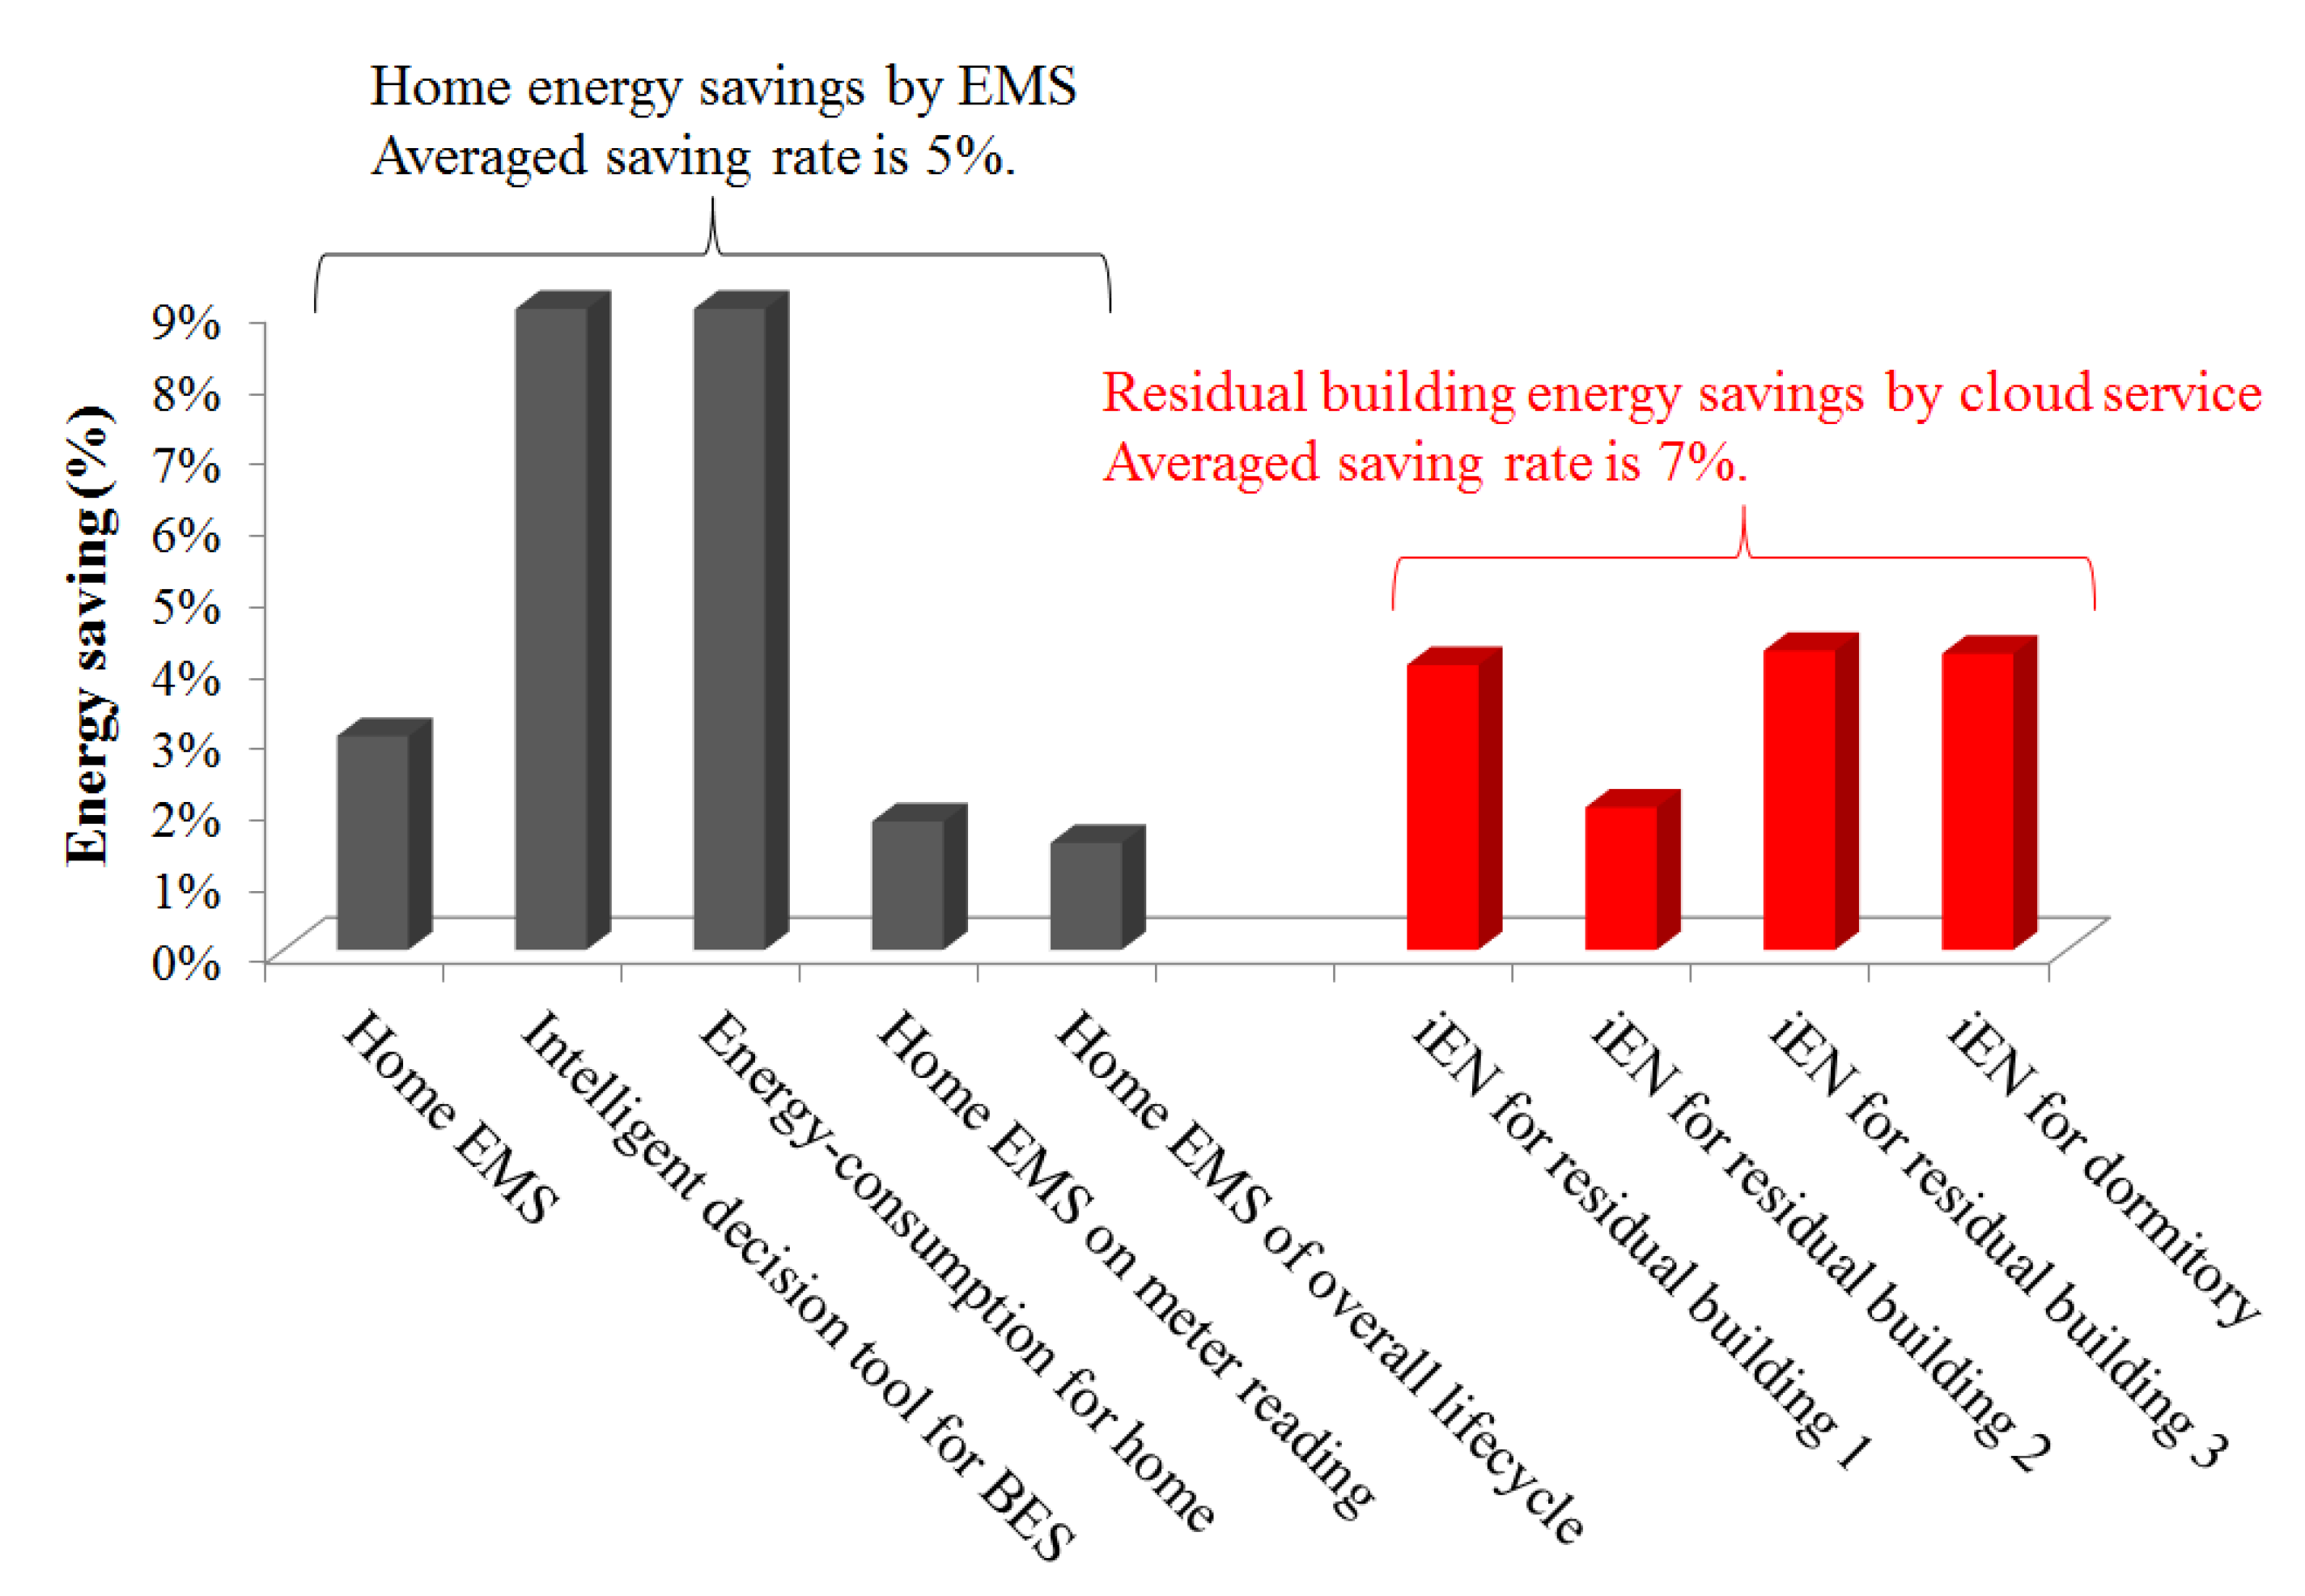
The home-type buildings in Figure 5 include home EMS, intelligent decision support tools for building energy saving, energy-consumption information system for home energy conservation, home EMS based on automatic meter reading and home EMS for assessing overall lifecycle. The sites also include iEN for three residential buildings and for a dormitory. The highest energy saving effect is the intelligent decision support tool, 9%, by applying EMS. The average energy savings of home-type buildings are 5% and 7% for applying EMS and iEN, respectively.
Figure 6. Comparison of energy savings of HVAC equipment by applying EMS and iEN.
Energies 08 04357 g006
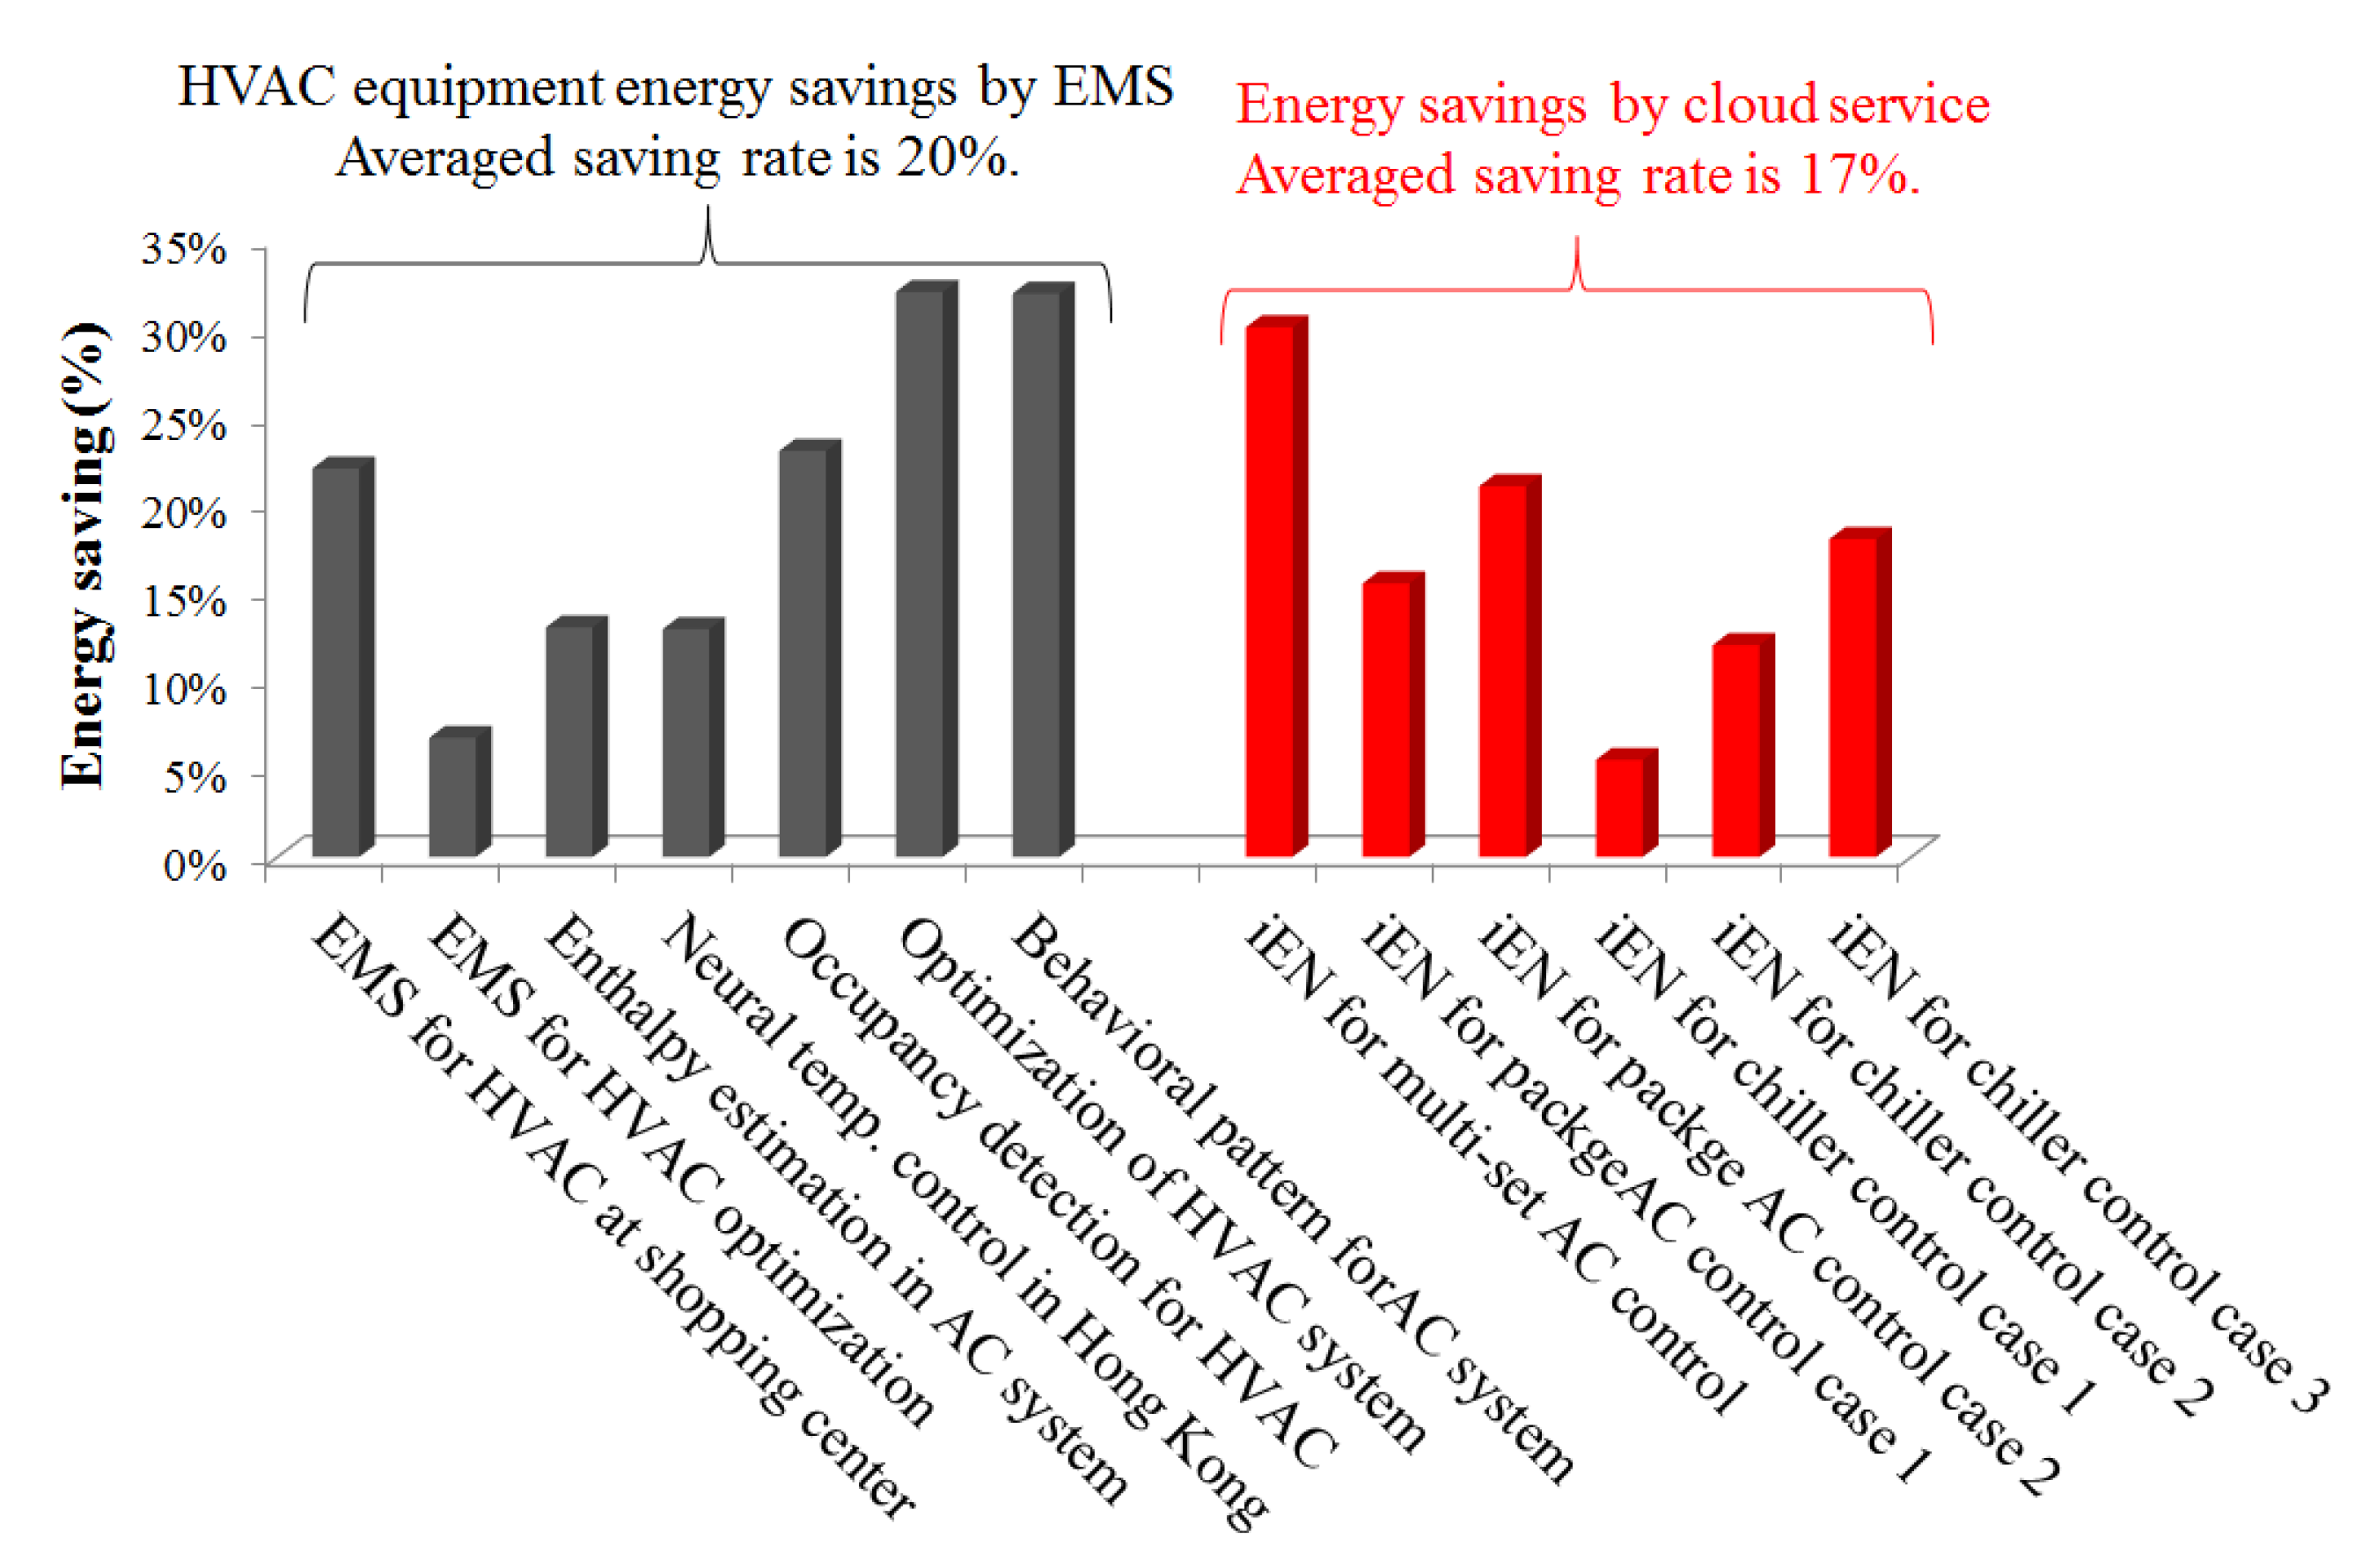
The energy saving control cases of HVAC equipment, in Figure 6, include the EMS for a HVAC system at a shopping center, the EMS for HVAC system optimization, enthalpy estimation for thermal comfort control and energy saving in an air conditioning system, neural temperature control and a management system in subtropical Hong Kong, occupancy detection based control for a HVAC system, optimization of a HVAC system, and a behavioral pattern for air conditioning energy saving. The cases also include iEN for multi-set air conditioners control, iEN for three package air conditioner control cases and for chiller control cases. The highest energy saving effect is, 32%, the optimization of HVAC system by applying EMS. The average energy savings of HVAC equipment are 20% and 17% for applying EMS and iEN, respectively.
Figure 7. Comparison of energy savings of lighting system by applying EMS and iEN.
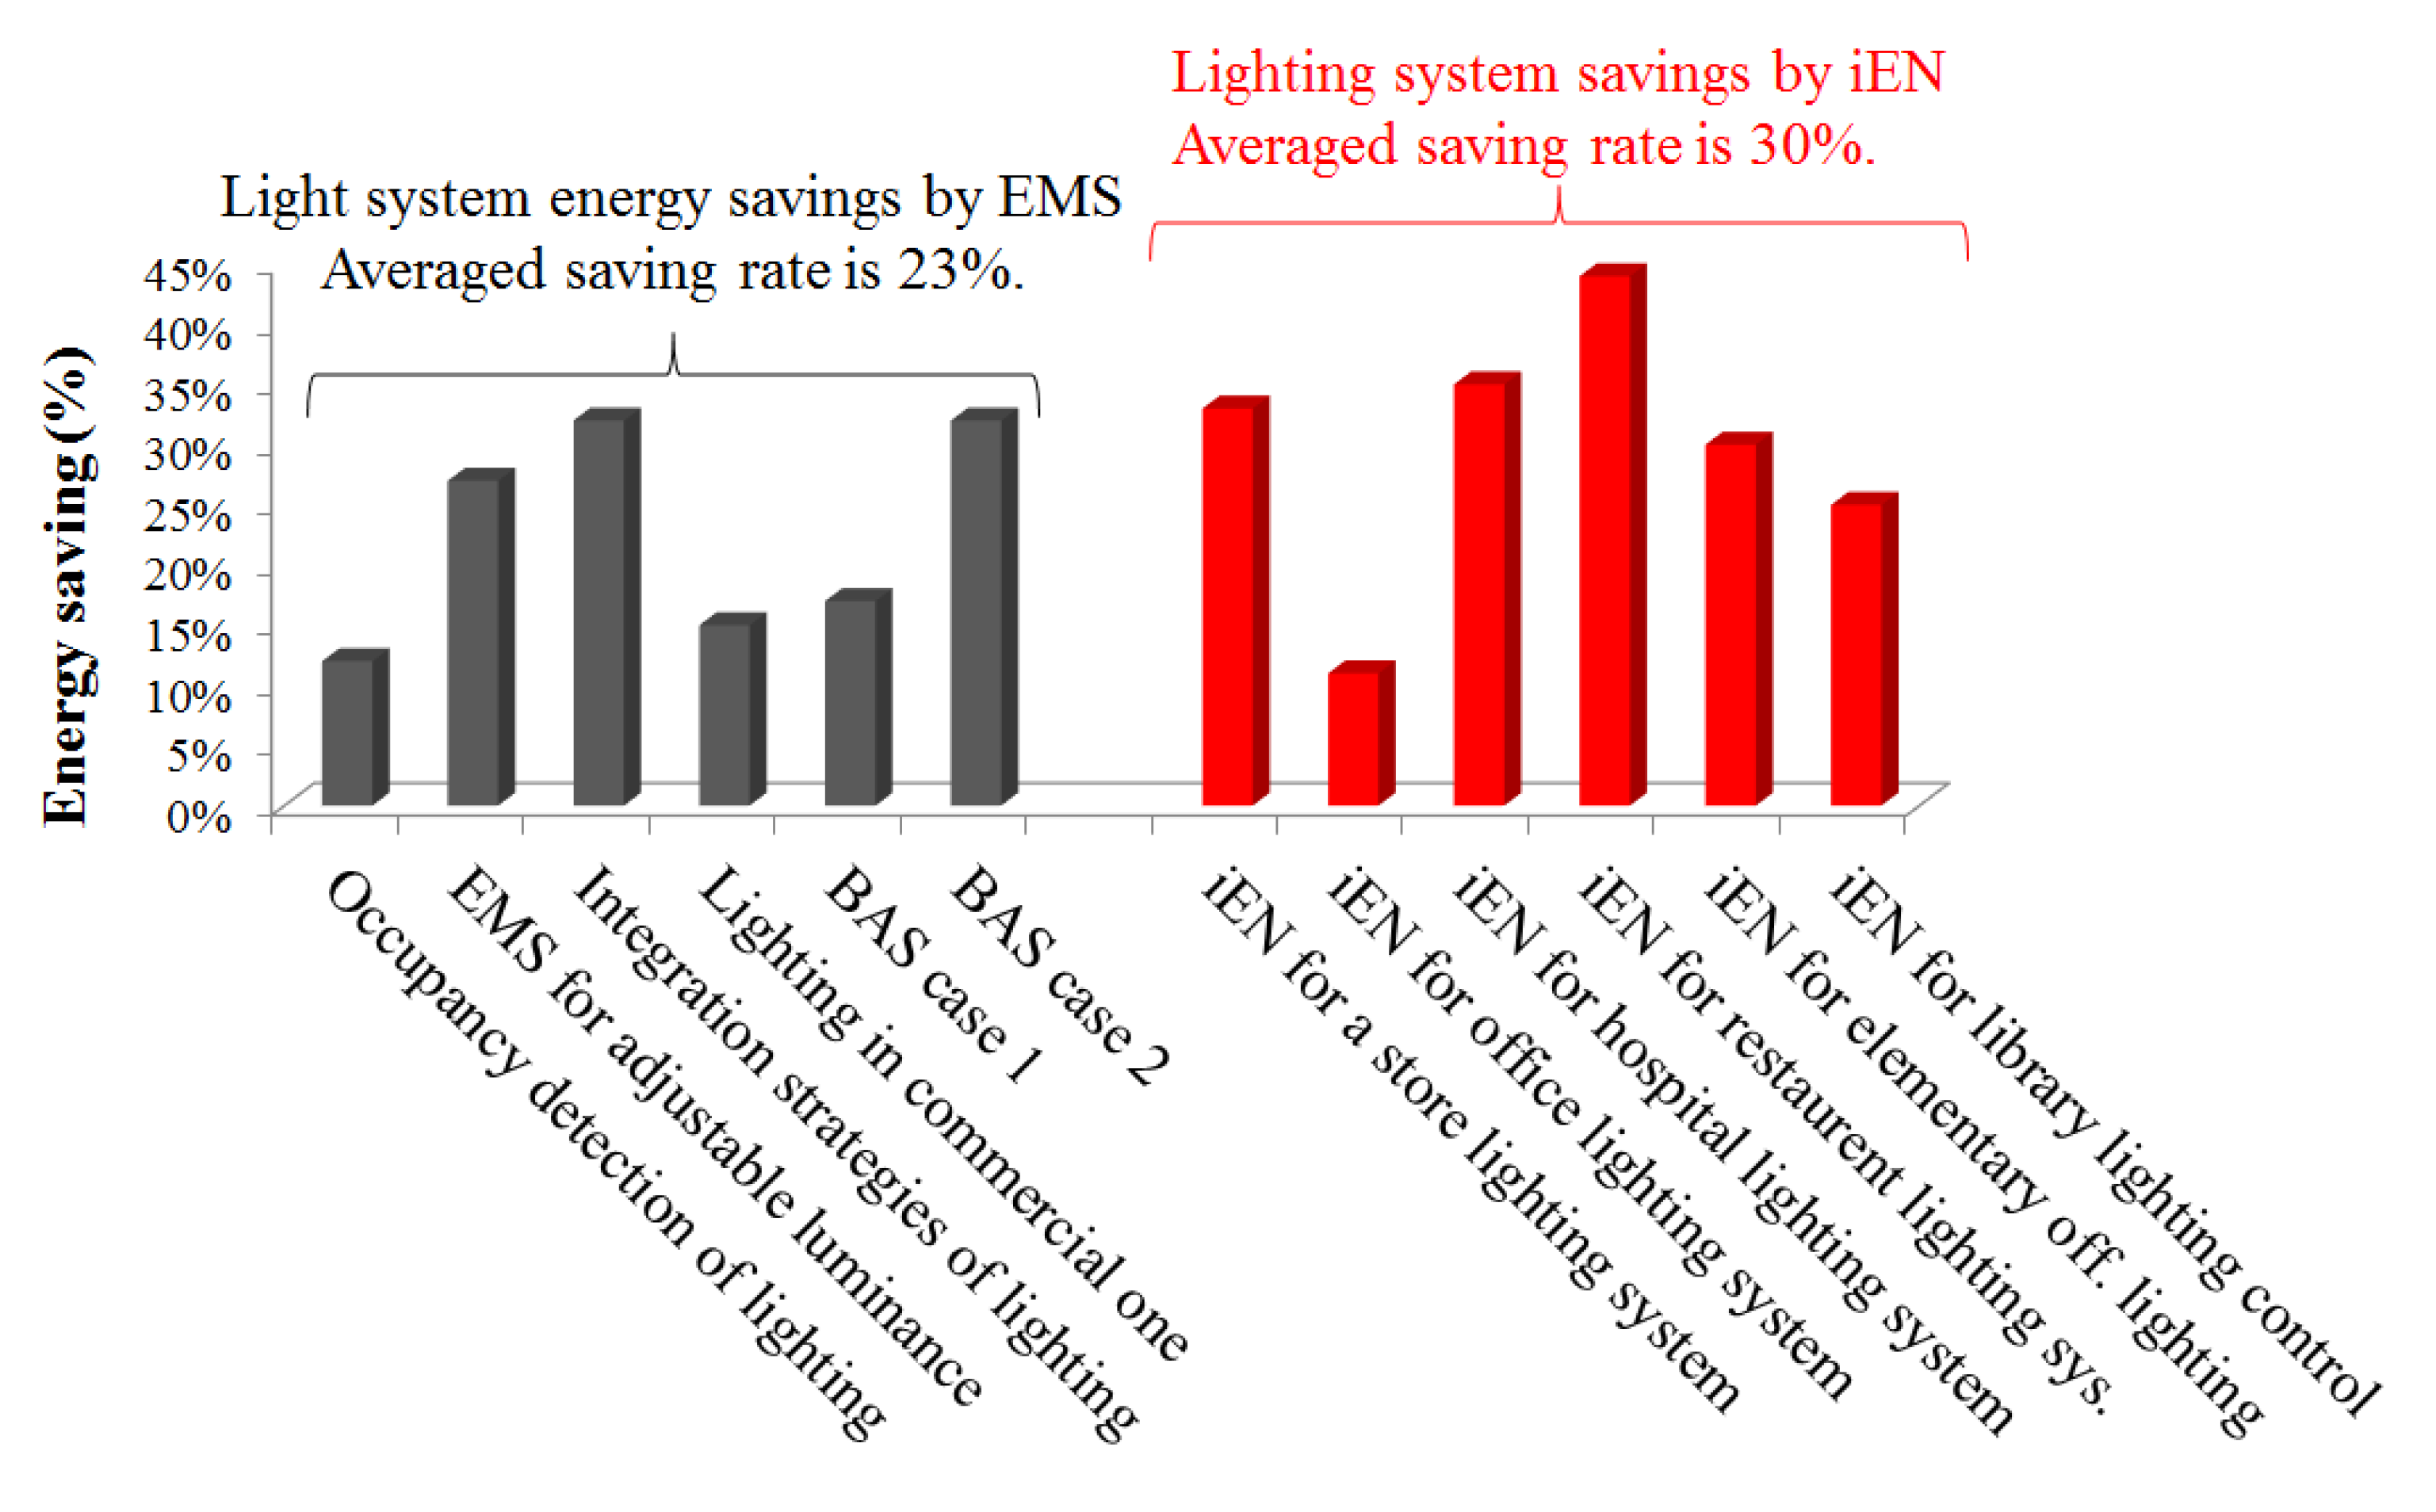
Energies 08 04357 g007
Lighting systems in Figure 7 include EMS development for adjustable luminance control at each location of the building, integration strategies between daylight and electric lighting and strategies based on the occupancy of spaces, building automation and control system in commercial buildings. The other cases are iEN for a store lighting system control, iEN for office lighting system control, iEN for hospital lighting system control, iEN for restaurant lighting system control, iEN for elementary school lighting control and iEN for library lighting control. The highest energy saving effect is, 44%, the restaurant lighting system control by applying cloud service of iEN. The average energy savings of lighting system are 23% and 30% for applying EMS and iEN, respectively.
In summary, the comparative analysis results indicate that the average energy savings by applying iEN are 8.9% and 23.5% for the whole site and single facility, respectively. Those by applying EMS are 11.6% and 21.4%, respectively. Compared with the EMS cases, it is found that the energy savings of the whole site by applying the cloud service are 76% of that by applying EMS.
Even though the energy savings by applying cloud EMS are not the same as those by applying EMS, the significant contribution of cloud EMS is to provide an evaluation structure, including a M&V system. It helps users to calculate the energy savings in real-time, and creates a new business model. For the cloud energy management service, users do not need to purchase the energy saving equipment, and only need to pay the monthly service fee. The energy management related hardware and software are provided by the telecom company, such as the Chunghwa Telecom in this study. Since the equipment belongs to Telecom Company, only depreciation expenses are counted on monthly billing charged with telecom fee. If the monthly service fee is around 80% ± 5% of the saved energy cost, the cloud energy management service is recommended to keep. This is due to that the monthly service fee is almost equal to the energy saving fee. This is the immediate payback case.
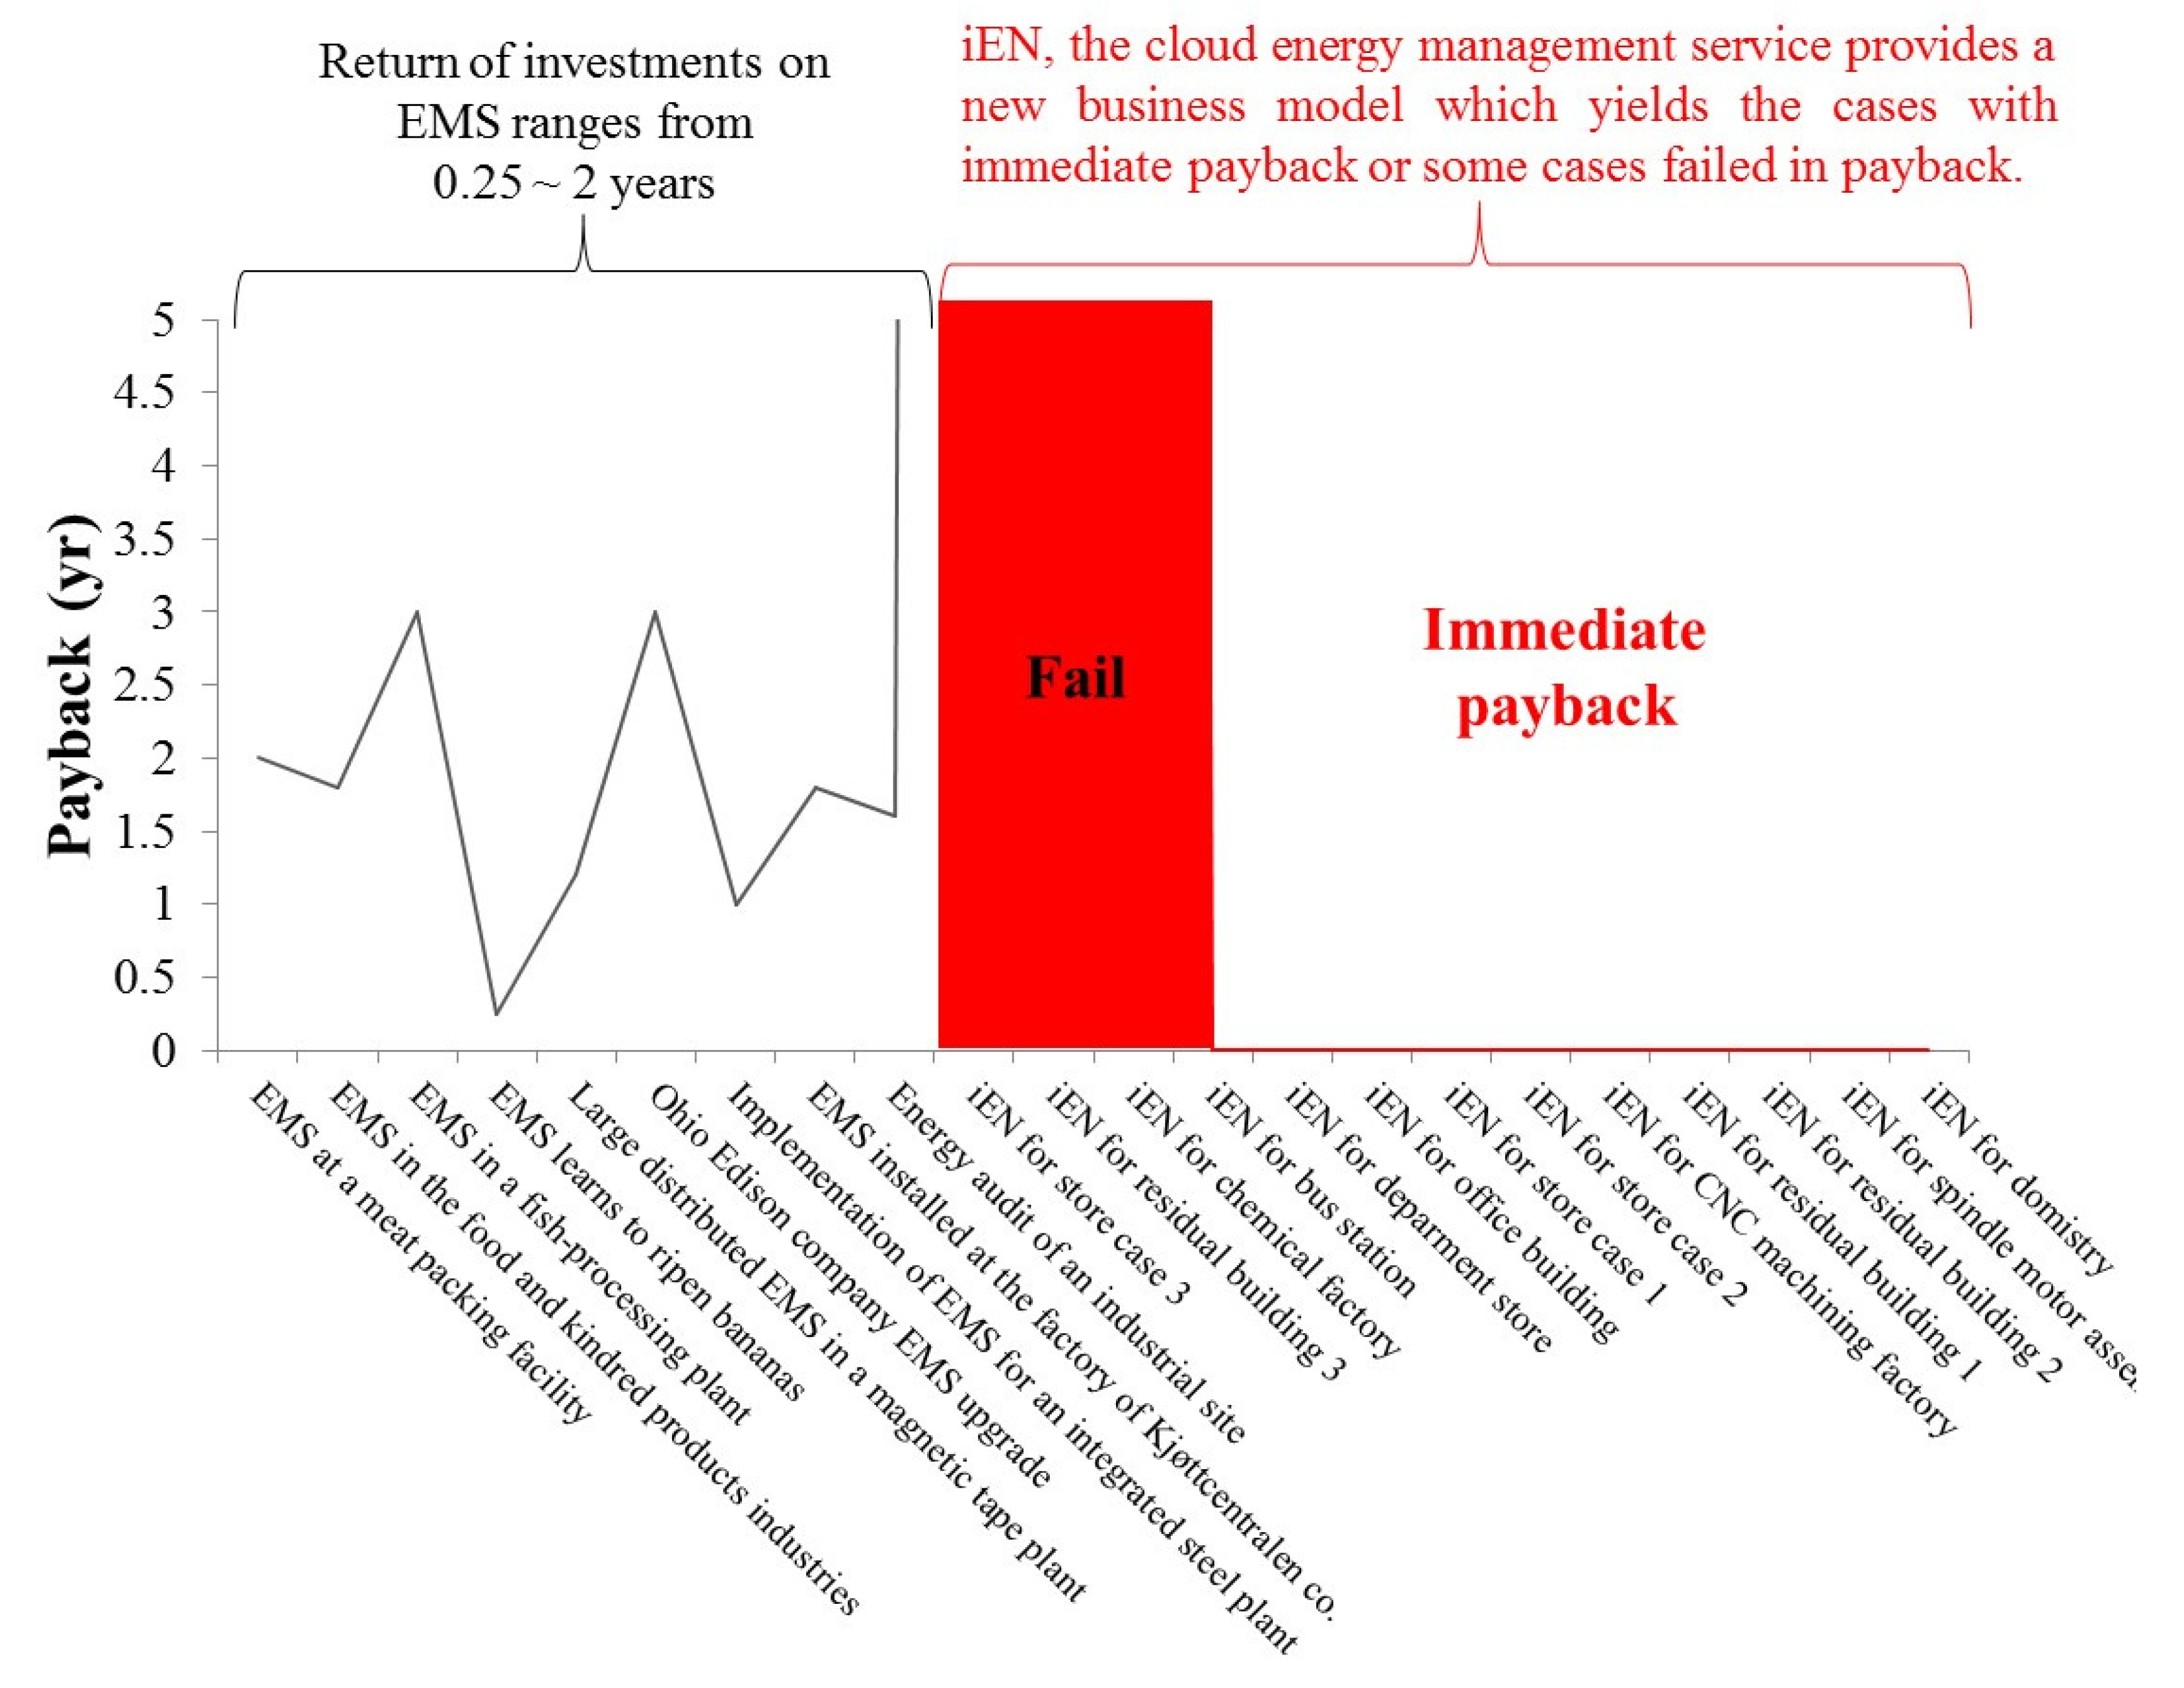
Figure 8 shows the payback period of investment by applying EMS and cloud EMS, iEN. The payback range of the cases applying EMS is 0.25–2 years, with the average of 1.7 years. However, iEN, the cloud energy management service, provides a new business model, which yields the cases with immediate payback or never payback (monthly service fee >80% ± 5% of the saved energy cost). Over 70% of the specific sites and facilities are the cases of immediate payback, whose monthly service fee may return back from the energy saving fee. The major benefit of the cloud EMS is the innovation of the business model, which could cost down the energy saving service, and approach the immediate payback for the popularization of energy saving management service.
Figure 8. Payback period of investment by applying EMS and cloud EMS. The payback time of EMS is 0.25–2 years. However, the Cloud EMS, iEN, yields the cases with immediate payback or never payback (Fail cases as shown in Red bar).
Energies 08 04357 g008

6. Conclusions

The development of cloud EMS demonstrated an innovative tool, iEN, launched by Chunghwa Telecom in 2011, for energy conservation. It was composed of three service modes, including Infrastructure as a Service (IaaS), Platform as a Service (PaaS) and Software as a Service (SaaS). IaaS is a provision model in which organizes the equipment used for services. PaaS offered the deployment of applications or services without the complexity of buying and managing the underlying hardware and software. SaaS presented a development platform for improving cloud service continuously. The expert system was developed for optimizing the energy saving control. Furthermore, based on IPMVP, the M&V system was included in iEN to create a new business model.
In total, 55 test sites distributed in Taiwan were effectively managed by the cloud EMS. The experimental results indicated that the cloud EMS may have relatively poor energy savings as compared with the EMS cases. However, over 70% of the managed sites and facilities by iEN are the cases of immediate payback, whose monthly service fee may return back from the saved energy cost. Therefore, the major benefit of cloud EMS is the innovation of the business model, which could cost down the service and approach the immediate payback for the popularization of energy saving management service.

Supplementary Materials

Supplementary materials can be accessed at: https://www.mdpi.com/1996-1073/8/5/4357/s1.

Acknowledgments

The authors would like to acknowledge the financial support from the Ministry of Science and Technology (project number: NSC 103-2622-E-027-001), and the Institute for Information Industry (Ministry of Economy Affairs, China).

Author Contributions

Chin-Chi Cheng coordinated the experimental work, analyzed the experimental data, and prepared the initial draft of the manuscript. Dasheng Lee proposed the research topic, survey the papers and supervised the study. He also contributed significantly to the writing and organization of the manuscript. Ching Hung Wang provided the resources for building the iEN system. Shu Fen Lin coordinated for practicing the iEN system. Hung-Peng Chang assisted the experimental work on sites. Shang-Te Fang coordinated the funding for the research.

Conflicts of Interest

The authors declare no conflict of interest.

References

  1. Capehart, B.L.; Muth, E.J.; Storin, M.O. Minimizing residential electrical energy costs using microcomputer energy management systems. Comput. Ind. Eng. 1982, 6, 261–269. [Google Scholar] [CrossRef]
  2. Rahman, S.; Bhatnagar, R. Computerized energy management systems–why and how. J. Microcomput. Appl. 1986, 9, 261–270. [Google Scholar] [CrossRef]
  3. Chapman, D.J.; Palmer, A.H.; Leuer, J.F. A case study in change from a centralized energy management system to a decentralized one. In Proceedings of the Power Industry Computer Application Conference (PICA), Seattle, WA, USA, 1–5 May 1989; pp. 446–452.
  4. Pillai, M.K.G.; Ramakrishna, V.; Agrawai, V.K. Real time data acquisition and energy management system using distributed computer architecture. In Proceedings of the IEEE/IAS International Conference on Industrial Automation and Control, Hyderabad, India, 5–7 January 1995; pp. 427–434.
  5. Sjoberg, S.; Hedberg, T.; Selberg, L.; Wikstrom, R. Implementing a nationwide energy management system. In Proceedings of the Telecommunications Energy Conference, Phoenix, AZ, USA, 10–14 September 2000; pp. 163–166. [CrossRef]
  6. Lee, D.S. Energy harvesting chip and the chip based power supply development for a wireless sensor network. Sensors 2008, 8, 7690–7714. [Google Scholar] [CrossRef]
  7. Swords, B.; Coyle, E.; Norton, B. An enterprise energy-information system. Appl. Energy 2008, 85, 61–69. [Google Scholar] [CrossRef]
  8. Fiedler, T.; Mircea, P.M. Energy management systems according to the ISO 50001 standard—Challenges and benefits. In Proceedings of the Applied and Theoretical Electricity (ICATE). University of Craiova, Faculty of Electrical Engineering, Craiova, Craiova, Romania, 25–27 October 2012; pp. 1–4. [CrossRef]
  9. Muller, E.; Poller, R.; Hopf, H.; Krones, M. Enabling energy management for planning energy-efficient factories. Procedia CIRP 2013, 7, 622–627. [Google Scholar] [CrossRef]
  10. Velazquex, D.; Gonzalez-Falcon, R.; Perez-Lombard, L.; Gallego, L.M.; Monedero, I.; Biscarri, F. Development of an energy management system for a naphtha reforming plant: A data mining approach. Energy Convers. Manag. 2013, 67, 217–225. [Google Scholar] [CrossRef]
  11. Ma, S. A review on cloud computing development. J. Netw. 2012, 7, 305–309. [Google Scholar]
  12. iEN-ASP. Available online: http://ienet.net.tw/index.en-us.aspx (accessed on 23 July 2014).
  13. Explanation of Software as a service (SaaS), Wikipedia. Available online: http://en.wikipedia.org/wiki/Software_as_a_service (accessed on 23 July 2014).
  14. U.S. Department of Energy. International Performance Measurement and Verification Protocol: Concepts and Options for Determining Energy and Water Savings; DOE: Washington, DC, USA, 2012; Volume 1, pp. 1–121.
  15. Tseng, Y.C.; Lee, D.S.; Lin, C.F.; Chang, C.Y. A novel sensor platform matching the improved version of IPMVP option C for measuring energy savings. Sensors 2013, 13, 6811–6831. [Google Scholar] [CrossRef] [PubMed]
  16. Black, F.; Scholes, M. The pricing of option and corporate liabilities. J. Polit. Econ. 1973, 81, 637–659. [Google Scholar] [CrossRef]
  17. Machairas, V.; Tsangrassoulis, A.; Axarli, K. Algorithms for optimization of building design: A review. Renew. Sustain. Energy Rev. 2014, 31, 101–112. [Google Scholar] [CrossRef]
  18. Cheng, C.C.; Lee, D.S. Smart sensors enable smart air conditioning control. Sensors 2014, 14, 11179–11203. [Google Scholar] [CrossRef] [PubMed]
  19. NHO, WEB server. Confederation of Norwegian Business and Industry (NHO), Oslo, Norway. 2000. Available online: http://www.nho.no (accessed on 23 July 2014).
  20. Ma, X. Study on realization of energy monitoring and management system for metallurgical enterprise. In Proceedings of the IEEE International Conference on E-Business and Information System Security, Wuhan, China, 23–24 May 2009; pp. 1–4. [CrossRef]
  21. Tian, J.; Shi, H.; Li, X.; Chen, L. Measures and potentials of energy saving in a Chinese fine chemical industrial park. Energy 2012, 46, 459–470. [Google Scholar] [CrossRef]
  22. Brunke, J.C.; Johansson, M.; Thollander, P. Empirical investigation of barriers and drivers to the adoption of energy conservation measures, energy management practices and energy services in the Swedish iron and steel industry. J. Clean. Prod. 2014, 84, 509–525. [Google Scholar] [CrossRef]
  23. Alajian, S.A.; Smiai, M.; Elani, U.A. Effective tools toward electrical energy conservation in Saudi Arabia. Energy Convers. Manag. 1998, 13, 1337–1349. [Google Scholar] [CrossRef]
  24. Lewis, M. Integrated design for sustainable buildings. Building for the future. ASHRAE J. 2004, 46, 22–30. [Google Scholar]
  25. Kawamoto, K.; Shimoda, Y.; Mizuno, M. Energy saving potential of office equipment power management. Energy Build. 2004, 36, 915–923. [Google Scholar] [CrossRef]
  26. Ziebik, A.; Hoinka, K.; Kolokotroni, M. System approach to the energy analysis of complex buildings. Energy Build. 2005, 37, 930–938. [Google Scholar] [CrossRef]
  27. Chung, M.H.; Rhee, E.K. Potential opportunities for energy conservation in existing buildings on university campus: A field survey in Korea. Energy Build. 2014, 78, 176–182. [Google Scholar] [CrossRef]
  28. Doukas, H.; Nychtis, C.; Psarras, J. Assessing energy-saving measures in buildings through an intelligent decision support model. Build. Environ. 2009, 44, 290–298. [Google Scholar] [CrossRef]
  29. Fuselli, D.; Angelis, F.D.; Boaro, M.; Squartini, S.; Wei, Q.; Lin, D.; Piazza, F. Action dependent heuristic dynamic programming for home energy resource scheduling. Int. J. Electr. Power Energy Syst. 2013, 48, 148–160. [Google Scholar] [CrossRef]
  30. Van Dam, S.S.; Bakker, C.A.; Buiter, J.C. Do home energy management system make sense? Assessing their overall lifecycle impact. Energy Policy 2013, 63, 398–407. [Google Scholar] [CrossRef]
  31. Ueno, T.; Sano, F.; Saeki, O.; Tsuji, K. Effectiveness of an energy-consumption information system on energy savings in residential houses based on monitored data. Appl. Energy 2006, 83, 166–183. [Google Scholar] [CrossRef]
  32. Ju, S.H.; Lim, Y.H.; Choi, M.S.; Baek, J.M.; Lee, S.Y. An efficient home energy management system based on automatic meter reading. In Proceeding of the IEEE International Symposium on Power Line Communication and its Applications, Udine, Italy, 3–6 April 2011; pp. 479–484.
  33. Canbay, C.S.; Hepbasli, A.; Gokcen, G. Evaluating performance indices of a shopping center and implementing HVAC control principals to minimize energy usage. Energy Build. 2004, 36, 587–598. [Google Scholar] [CrossRef]
  34. Fonh, K.F.; Hanby, V.I.; Chow, T.T. HVAC system optimization for energy management by evolutionary program. Energy Build. 2006, 38, 220–231. [Google Scholar] [CrossRef]
  35. Chu, C.H.; Jong, T.L. Enthalpy estimation for thermal comfort and energy saving in air conditioning system. Energy Convers. Manag. 2008, 49, 1620–1628. [Google Scholar] [CrossRef]
  36. Fong, K.F.; Chow, T.T.; Li, C.; Lin, Z.; Chan, L.S. Effect of neutral temperature on energy saving of centralized air-conditioning systems in subtropical Hong Kong. Appl. Therm. Eng. 2010, 30, 1659–1665. [Google Scholar] [CrossRef]
  37. Budaiwi, I.; Abdou, A. HVAC system operational strategies for reduced energy consumption in buildings with intermittent occupancy: The case study of Mosques. Energy Convers. Manag. 2013, 73, 37–50. [Google Scholar] [CrossRef]
  38. Seo, J.; Ooka, R.; Kim, J.T.; Nam, Y. Optimization of the HVAC system design to minimize primary energy demand. Energy Build. 2014, 76, 102–108. [Google Scholar] [CrossRef]
  39. Zhuang, X.; Wu, C. Saving energy when using air conditioners in offices—Behavioral pattern and design indications. Energy Build. 2014, 76, 661–668. [Google Scholar] [CrossRef]
  40. Dubois, M.C.; Blomsterberg, A. Energy saving potential and strategies for electric lighting in future North European, low energy office buildings: A literature review. Energy Build. 2011, 43, 2572–2582. [Google Scholar] [CrossRef]
  41. Zhou, D.; Park, S.H. Simulation-assisted management and control over building energy efficiency—A case study. Energy Procedia 2012, 14, 592–600. [Google Scholar] [CrossRef]
  42. Fathabadi, H. Ultra high benefits system for electric energy saving and management of lighting energy in buildings. Energy Convers. Manag. 2014, 80, 543–549. [Google Scholar] [CrossRef]
  43. Aghemo, C.; Blaso, L.; Pellegrino, A. Building automation and control systems: A case study to evaluate the energy and environmental performances of lighting system in office. Autom. Constr. 2014, 43, 10–22. [Google Scholar] [CrossRef]
  44. Haq, M.A.; Hassan, M.Y.; Abdullah, H.; Rahman, H.A.; Abdullah, M.P.; Hussin, F.; Mat Said, D. A review on lighting control technologies in commercial buildings, their performances and affecting factors. Renew. Sustain. Energy Rev. 2014, 33, 268–279. [Google Scholar] [CrossRef]
  45. Cooper Controls. BACnet Automation Interface Module. Installation Sheet. Available online: http://www.cooperindustries.com/content/dam/public/lighting/controls/products/documents/greengate/instruction_sheets/bacnet_installation_instructions_networked.pdf (accessed on 23 July 2014).
  46. Consonni, A.; Lesourd, J.B. Industrial energy accounting and control systems: A survey. Energy Convers. Manag. 1986, 26, 357–361. [Google Scholar] [CrossRef]
  47. Akbari, H.; Warren, M.; Almeida, A.D.; Connell, D.; Harris, J. Use of energy management systems for performance monitoring of industrial load-shaping measures. Energy 1988, 13, 253–263. [Google Scholar] [CrossRef]
  48. Berutti, A. Practical guide to applying, installing and maintaining transformers. Electr. Constr. Maint. 1985, 84, 49–57. [Google Scholar]
  49. Valsalam, S.R.; Muralidharan, V.; Krishnan, N.; Sarkar, T.K.; Khincha, H.P. Implementation of energy management system for an integrated steel plant. In Proceedings of the 1998 International Conference on Energy Management and Power Delivery, Singapore, Singapore, 3–5 March 1998; pp. 661–666, IEEE Catalogue No: 98EX137.
  50. Dongellini, M.; Marinosci, C.; Morini, G.L. Energy Audit of an Industrial Site: A Case Study. Energy Procedia 2014, 45, 424–433. [Google Scholar] [CrossRef]

