Article

Evaluation of Fermentative Hydrogen Production from Single and Mixed Fruit Wastes

by
Julius Akinbomi
* and
Mohammad J. Taherzadeh
Swedish Centre for Resource Recovery, University of Borås, 501 90 Borås, Sweden
*
Author to whom correspondence should be addressed.
Energies 2015, 8(5), 4253-4272; https://doi.org/10.3390/en8054253
Submission received: 5 February 2015 / Revised: 14 April 2015 / Accepted: 5 May 2015 / Published: 12 May 2015

Abstract

:
The economic viability of employing dark fermentative hydrogen from whole fruit wastes as a green alternative to fossil fuels is limited by low hydrogen yield due to the inhibitory effect of some metabolites in the fermentation medium. In exploring means of increasing hydrogen production from fruit wastes, including orange, apple, banana, grape and melon, the present study assessed the hydrogen production potential of singly-fermented fruits as compared to the fermentation of mixed fruits. The fruit feedstock was subjected to varying hydraulic retention times (HRTs) in a continuous fermentation process at 55 °C for 47 days. The weight distributions of the first, second and third fruit mixtures were 70%, 50% and 20% orange share, respectively, while the residual weight was shared equally by the other fruits. The results indicated that there was an improvement in cumulative hydrogen yield from all of the feedstock when the HRT was five days. Based on the results obtained, apple as a single fruit and a fruit mixture with 20% orange share have the most improved cumulative hydrogen yields of 504 (29.5% of theoretical yield) and 513 mL/g volatile solid (VS) (30% of theoretical yield ), respectively, when compared to other fruits.

Graphical Abstract

1. Introduction

The quest for renewable, efficient and environmentally-friendly alternative energy sources to fossil fuels has stimulated intense research studies on fermentative hydrogen (H2) production from biomass. Among other renewable energy sources (solar, hydro-power, wind and geothermal), fermentative H2 production has received remarkable interest due to its striking properties, including having very high energy content per unit mass and being a clean energy carrier, as it forms only water vapor during combustion [1,2,3]. Fermentative H2 production can facilitate the quick transition of the hydrocarbon-based economy to a hydrogen-based economy, especially in the transport sector. Fuel cell electric vehicles powered by fermentative H2 are zero emission vehicles that could be used as green energy technology to tackle the challenge of depleted fossil fuel reserves and pollution associated with conventional transport fuels. Furthermore, the considerable attention on fermentative H2 is also due to the reliability of the continuous supply of feedstock, which is inevitably generated from daily human and animal activities. Among the feedstock available for H2 production, fruit wastes have relative great economic and environmental potential due to the large quantities of wastes generated from fruit consumption and industrial processing (10%–65% of raw fruit) [4]. The application of fruit wastes as feedstock for H2 production is an eco-friendly process, since littered fruit wastes could constitute a health nuisance to people and the environment. Meanwhile, due to low H2 yield from the fermentation process, most of the hydrogen currently used in various industrial applications is obtained from non-green sources, including steam reforming of natural gas, water electrolysis and coal gasification [5,6,7]. Low H2 yield during the fermentation process is attributed to, among other factors, the natural tendency of the fermentation process to be optimized to produce cell biomass instead of H2. In a dark fermentation process, 12 mol H2/mol glucose could be theoretically obtained from complete conversion of glucose to H2 and carbon dioxide (Equation (1)), but the reaction is thermodynamically impossible due to the production of a large quantity of by-products (volatile fatty acids (VFAs), alcohols and lactate) associated with H2 production. The thermodynamic constraints make the maximum attainable H2 yields to be 4 and 2 mol/mol glucose if the associated by-products are acetate and butyrate, respectively (Equations (2) and (3)) [8,9]:
C 6 H 12 O 6 + 6H 2 0 12 H 2 + 6 CO 2   ( = + 3.2 kJ )
C 6 H 12 O 6 + 2H 2 0 4 H 2 + 2 CO 2 + 2 CH 3 COOH ( a c e t a t e )   ( = 206 kJ )
C 6 H 12 O 6 2 H 2 + 2 CO 2 + CH 3 CH 2 CH 2 COOH ( b u t y r a t e )   ( = 254 kJ )
The low H2 from the fermentation process could also be attributed to feedstock inhibition including the antimicrobial inhibition of flavor compounds in fruit. During the ripening process, fruits usually produce flavor compounds (esters, alcohols, aldehydes, ketones, lactones and terpenoids), which are used as natural defense mechanisms in plants against microbial invasion (Table 1) [10,11,12,13,14,15,16,17,18,19,20,21,22,23,24]. Although the amount of fruit flavors in fruits is not high (usually 0.001%–0.01% of the fruit’s fresh weight), the antimicrobial effect of the flavor compounds cannot be ignored. The positive effect of the flavor compounds in fruit is responsible for fruit freshness and the long shelf life of fruits, while a negative effect has been observed to be responsible for the inhibition of bacterial activities during the fermentation process. For instance, D-limonene, which is a citrus flavor belonging to a class of terpenoids, was found to have an antimicrobial effect at a very low concentration of 0.01% w/v [11,25,26,27] and to cause the failure of the anaerobic digestion process, even at a very low concentration of 400 µL/L [26]. As a result, some strategic approaches have been developed to mitigate the antimicrobial effect of limonene and, consequently, to improve bioenergy production during anaerobic digestion. In a study by Youngsukkasem et al. [28], an encapsulated membrane was effectively used to reduce the inhibitory effect of D-limonene on the fermentative bacteria. Membrane-encased bacteria were observed to tolerate up to 3% limonene in the synthetic medium with consequent higher methane production than free cells. Wikandiri et al. [29] also developed a membrane bioreactor that could tolerate between 5 and 10 g/L of limonene in the feedstock for biomethane generation. Similarly, various techniques, including feedstock and inoculum pretreatment, optimal inoculum-to-substrate ratio, gas sparging, bioreactor design and a two-stage fermentation system, among others, have been employed for improving the recovery efficiency of fermentative H2 from food wastes, especially fruit wastes [30,31,32,33].
Table 1. Fruit flavors in some fruits.
FruitFruit FlavorReferences
Flavor compoundFlavor group
OrangeHexanal and nonanalAldehydes[10]
Octanol, 3-methyl butanolAlcohols[10,23]
α-pinene, car-3-ene, myrcene and limoneneTerpenoid[10,11]
BananaPentanone, heptanone, undecanoneKetones[12,13]
Butanal, hexanal and E-2-hexanalAldehydes[12,13]
1-butanol, 2-pentanol, 3-methyl-1-butanol, 1-hexanol and eugenolAlcohol[12,13]
Ethyl acetate, butyl acetate, 2-methyl propyl acetate, hexyl acetate, hexyl butanoate and butyl butanoateEsters[12,13]
Applen-Hexanal, E-2-hexenal, nonanal, acetaldehydeAldehydes[10,14]
Hexanol and butanolAlcohols[14]
Car-3-eneTerpenoid[10]
Ethyl butanoate, ethyl -2-methylbutanoate, hexyl acetate, etc.Ester[14,15,23]
EpicatechinPolyphenol[16,17]
GrapeHexanalAldehyde[10]
Octanol and hexanolAlcohols[14,18]
Hexyl acetate, ethyl acetate and ethyl hexanoateEsters[10,18,19]
Quercetin and epicatechinPolyphenol[16]
MelonNonanal, benzaldehyde and E-2-nonenalAldehydes[20,21,22]
Ethyl 2-methyl propyl acetate and 2-methyl butyl acetateEsters[20,21,22]
Meanwhile, in most research work on fermentative H2 from fruit wastes, fruit peels are often used as feedstock, since they are discarded during consumption and industrial processing. However, research should also be focused on the application of whole fruit wastes as feedstock, since large quantities of whole fruit wastes are generated during harvest, transportation and storage, due to microbial or pest attack. The objective of this study was therefore to investigate the effect of combined varying hydraulic retention time (HRT) and fruit mixing ratio on fermentative H2 yield from whole fruit wastes in order to have an idea of how to manage whole fruit wastes feedstock for optimal fermentative hydrogen production. The potential of fruit biodegradability and fermentative hydrogen production could be enhanced or lessened by the characteristics of fruit mixtures (nutrient composition, carbon to nitrogen ratio, toxicity) obtained when two or more fruits were combined. Besides nutrient composition, the inherent antimicrobial flavor compounds in fruits could also be a decisive factor in the overall effect. Unlike single fruit waste, mixed fruit wastes have the advantage of mutual interaction between various fruits in the fruit mixture, which might result in varying degrees of inhibitory and enhanced effects due to factors, such as additive (a combined effect equal to the sum of the individual effects), synergistic (a combined effect greater than the sum of the individual effects) and antagonistic effects (a combined effect less than the individual effects).

2. Results and Discussion

The performance of the fermentative H2 production process from the whole fruit wastes of orange, banana, apple, grape and melon was evaluated by measuring the hydrogen yield and volatile fatty acid (VFA) productions. The hydraulic retention times (HRTs) were reduced as the organic loading rates (OLR) were subsequently increased in the experiments. Although the mass of the different fruit wastes fed to the reactors were equal, their OLRs were not the same, because of different percentages of volatile solids in each fruit waste. The fermentation process was in three phases, Phase 1, 2 and 3, which corresponded to HRT of 8.6, 5 and 3 days, respectively. The continuous stirred tank reactors (CSTRs) were started up with an initial HRT of 8.6 days, which was the first phase of the fermentation process spanning a period of 15 days. During the second phase, which covered the period between the 16th and 30th days, the HRT was decreased from 8.6 down to five days. The HRT was furthered reduced to three days during the third phase, which spanned the period between the 31st and 47th days.

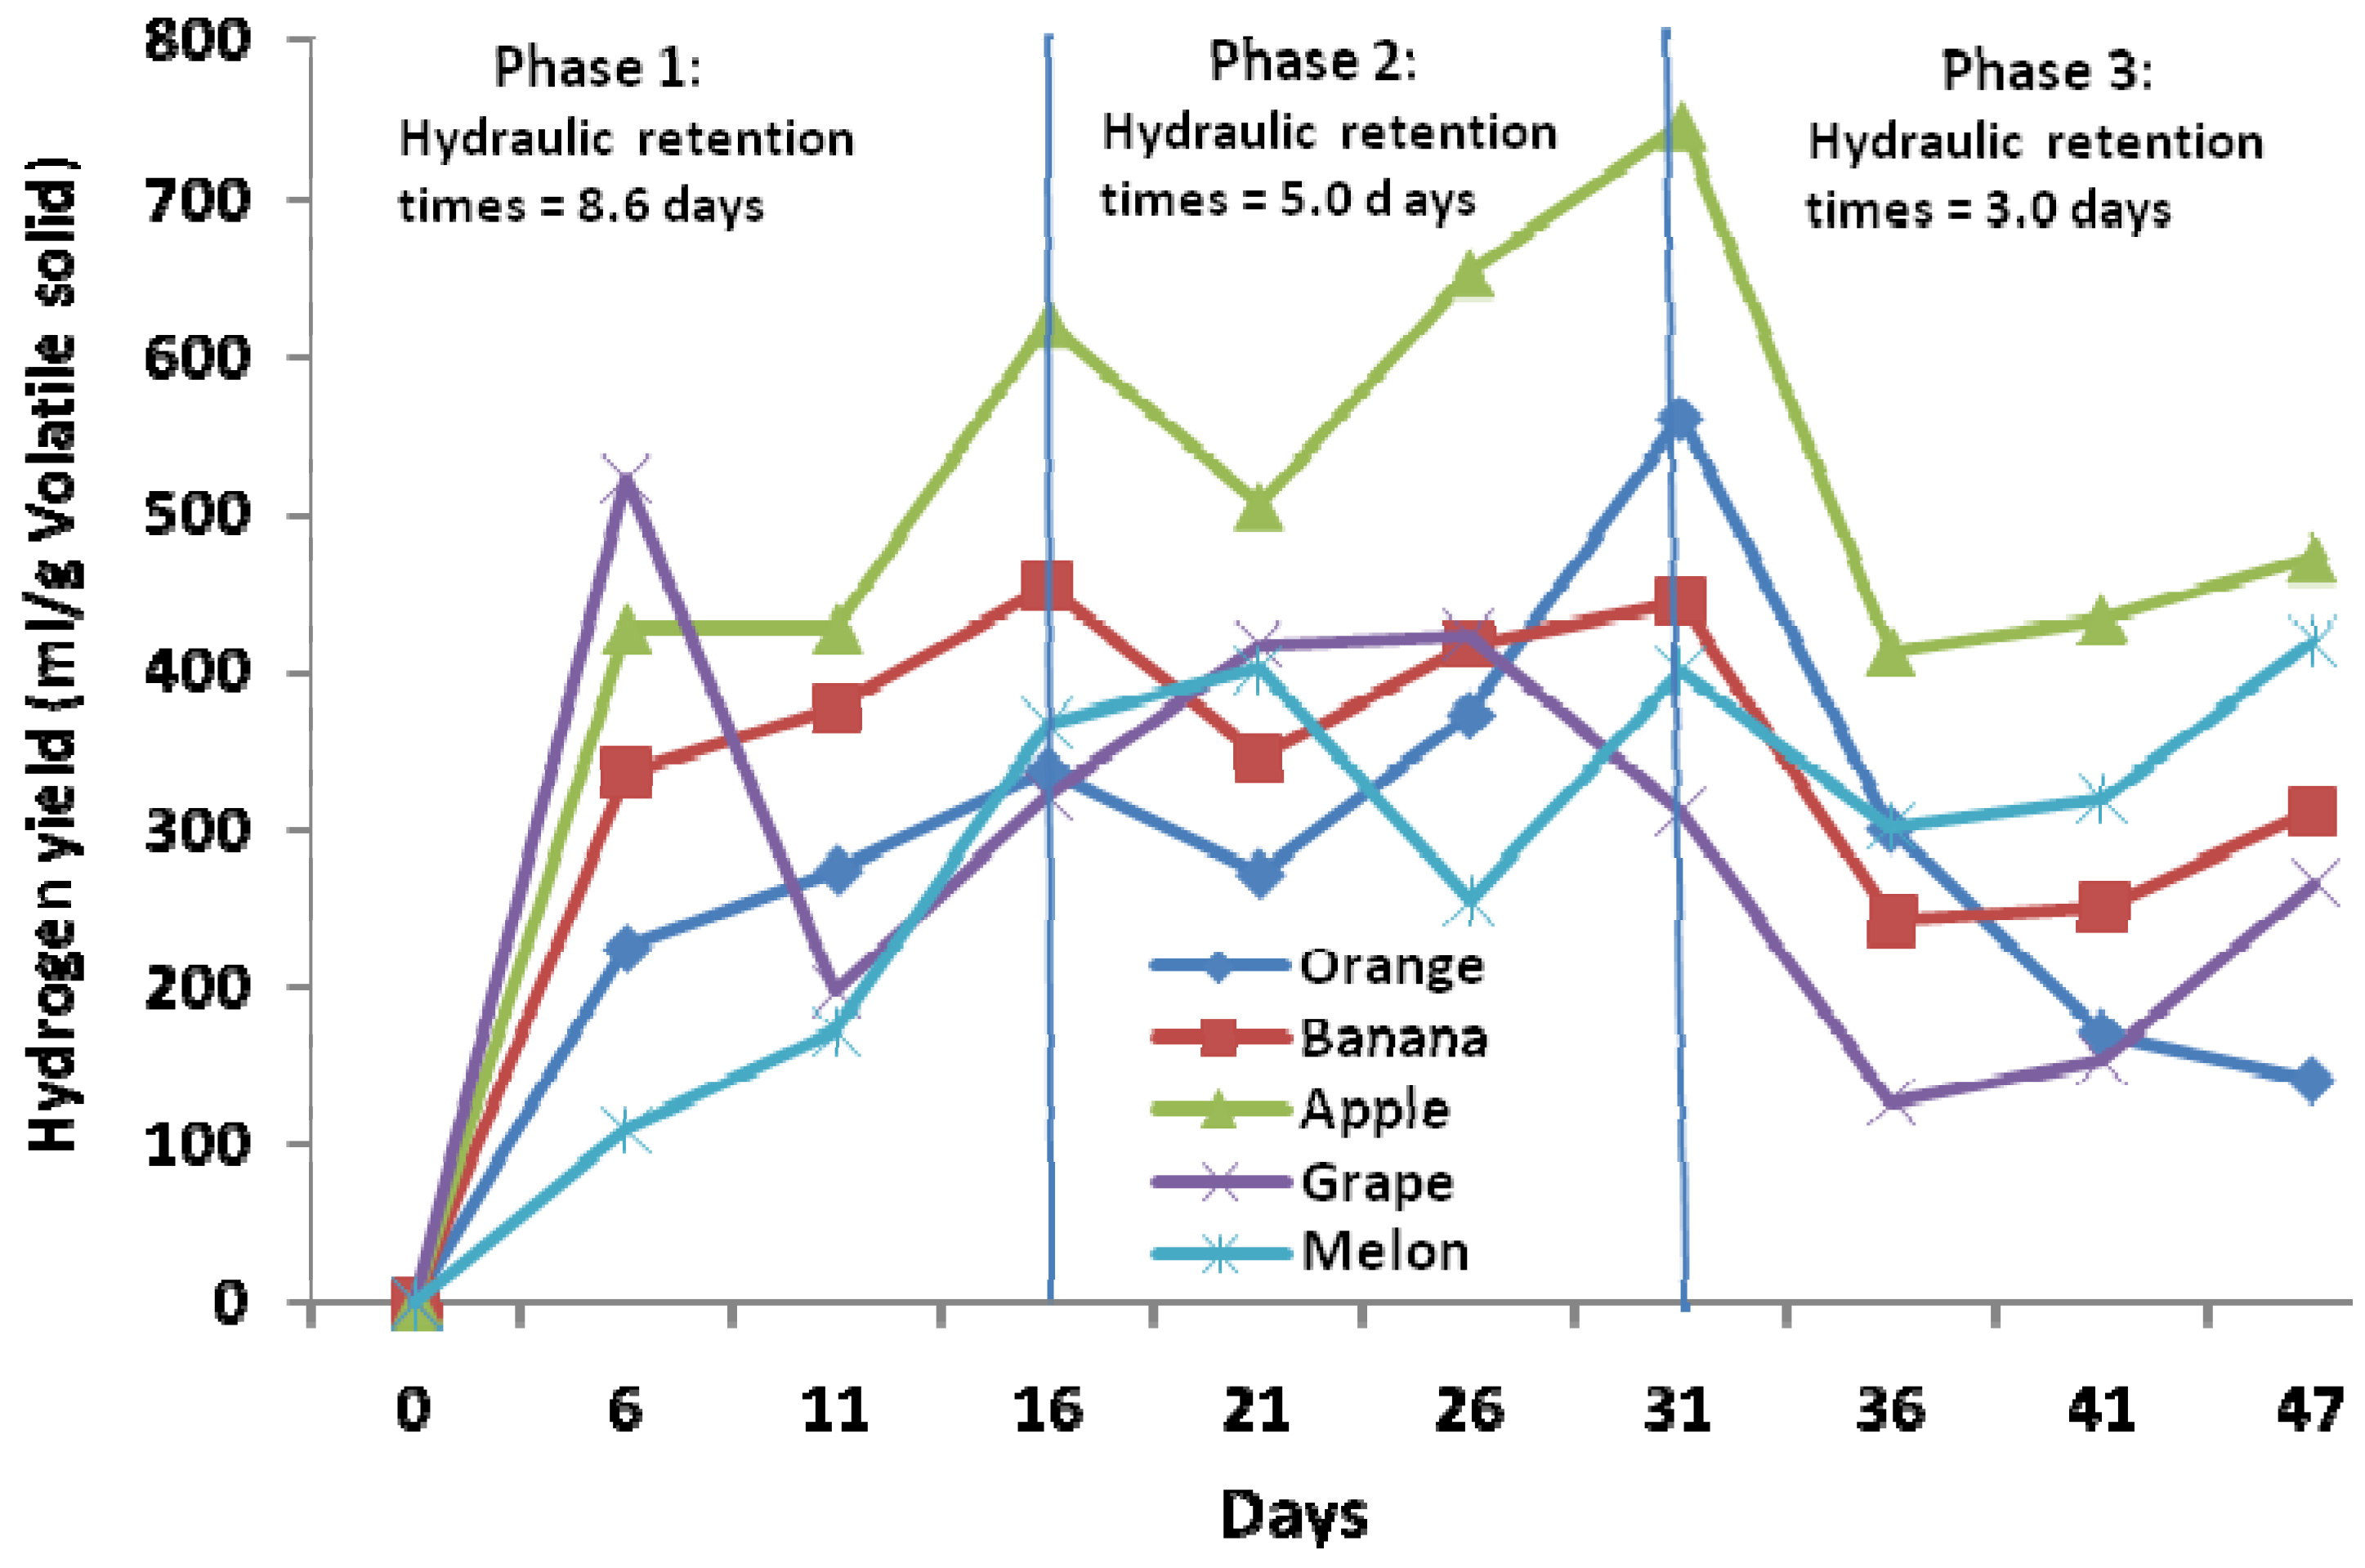
2.1. Hydrogen Production Yields from Singly-Digested Fruits

The hydrogen production from the singly-digested fruits was monitored throughout the three phases of the 47-day period. During the first phase (HRT of 8.6 days), hydrogen yields from the fermentation of individual fruits increased, except the yield from grape, which decreased sharply (Figure 1) due to the decrease in pH values. The highest (493 mL/gVSadded; VS, volatile solid) and lowest (216 mL/gVSadded) average hydrogen yields during the first phase were obtained from apple and melon, respectively. The hydrogen yields of all of the fruits increased during the second phase (HRT of five days), with apple and melon still producing the highest and lowest average hydrogen yields of 635 and 352 mL/gVSadded, respectively. The average hydrogen yields during the third phase (HRT of three days), however, decreased with apple and grape, producing the highest and lowest yields of 440 and 182 mL/gVS, respectively.
Figure 1. Hydrogen yields from the fermentation of single fruits.
Energies 08 04253 g001

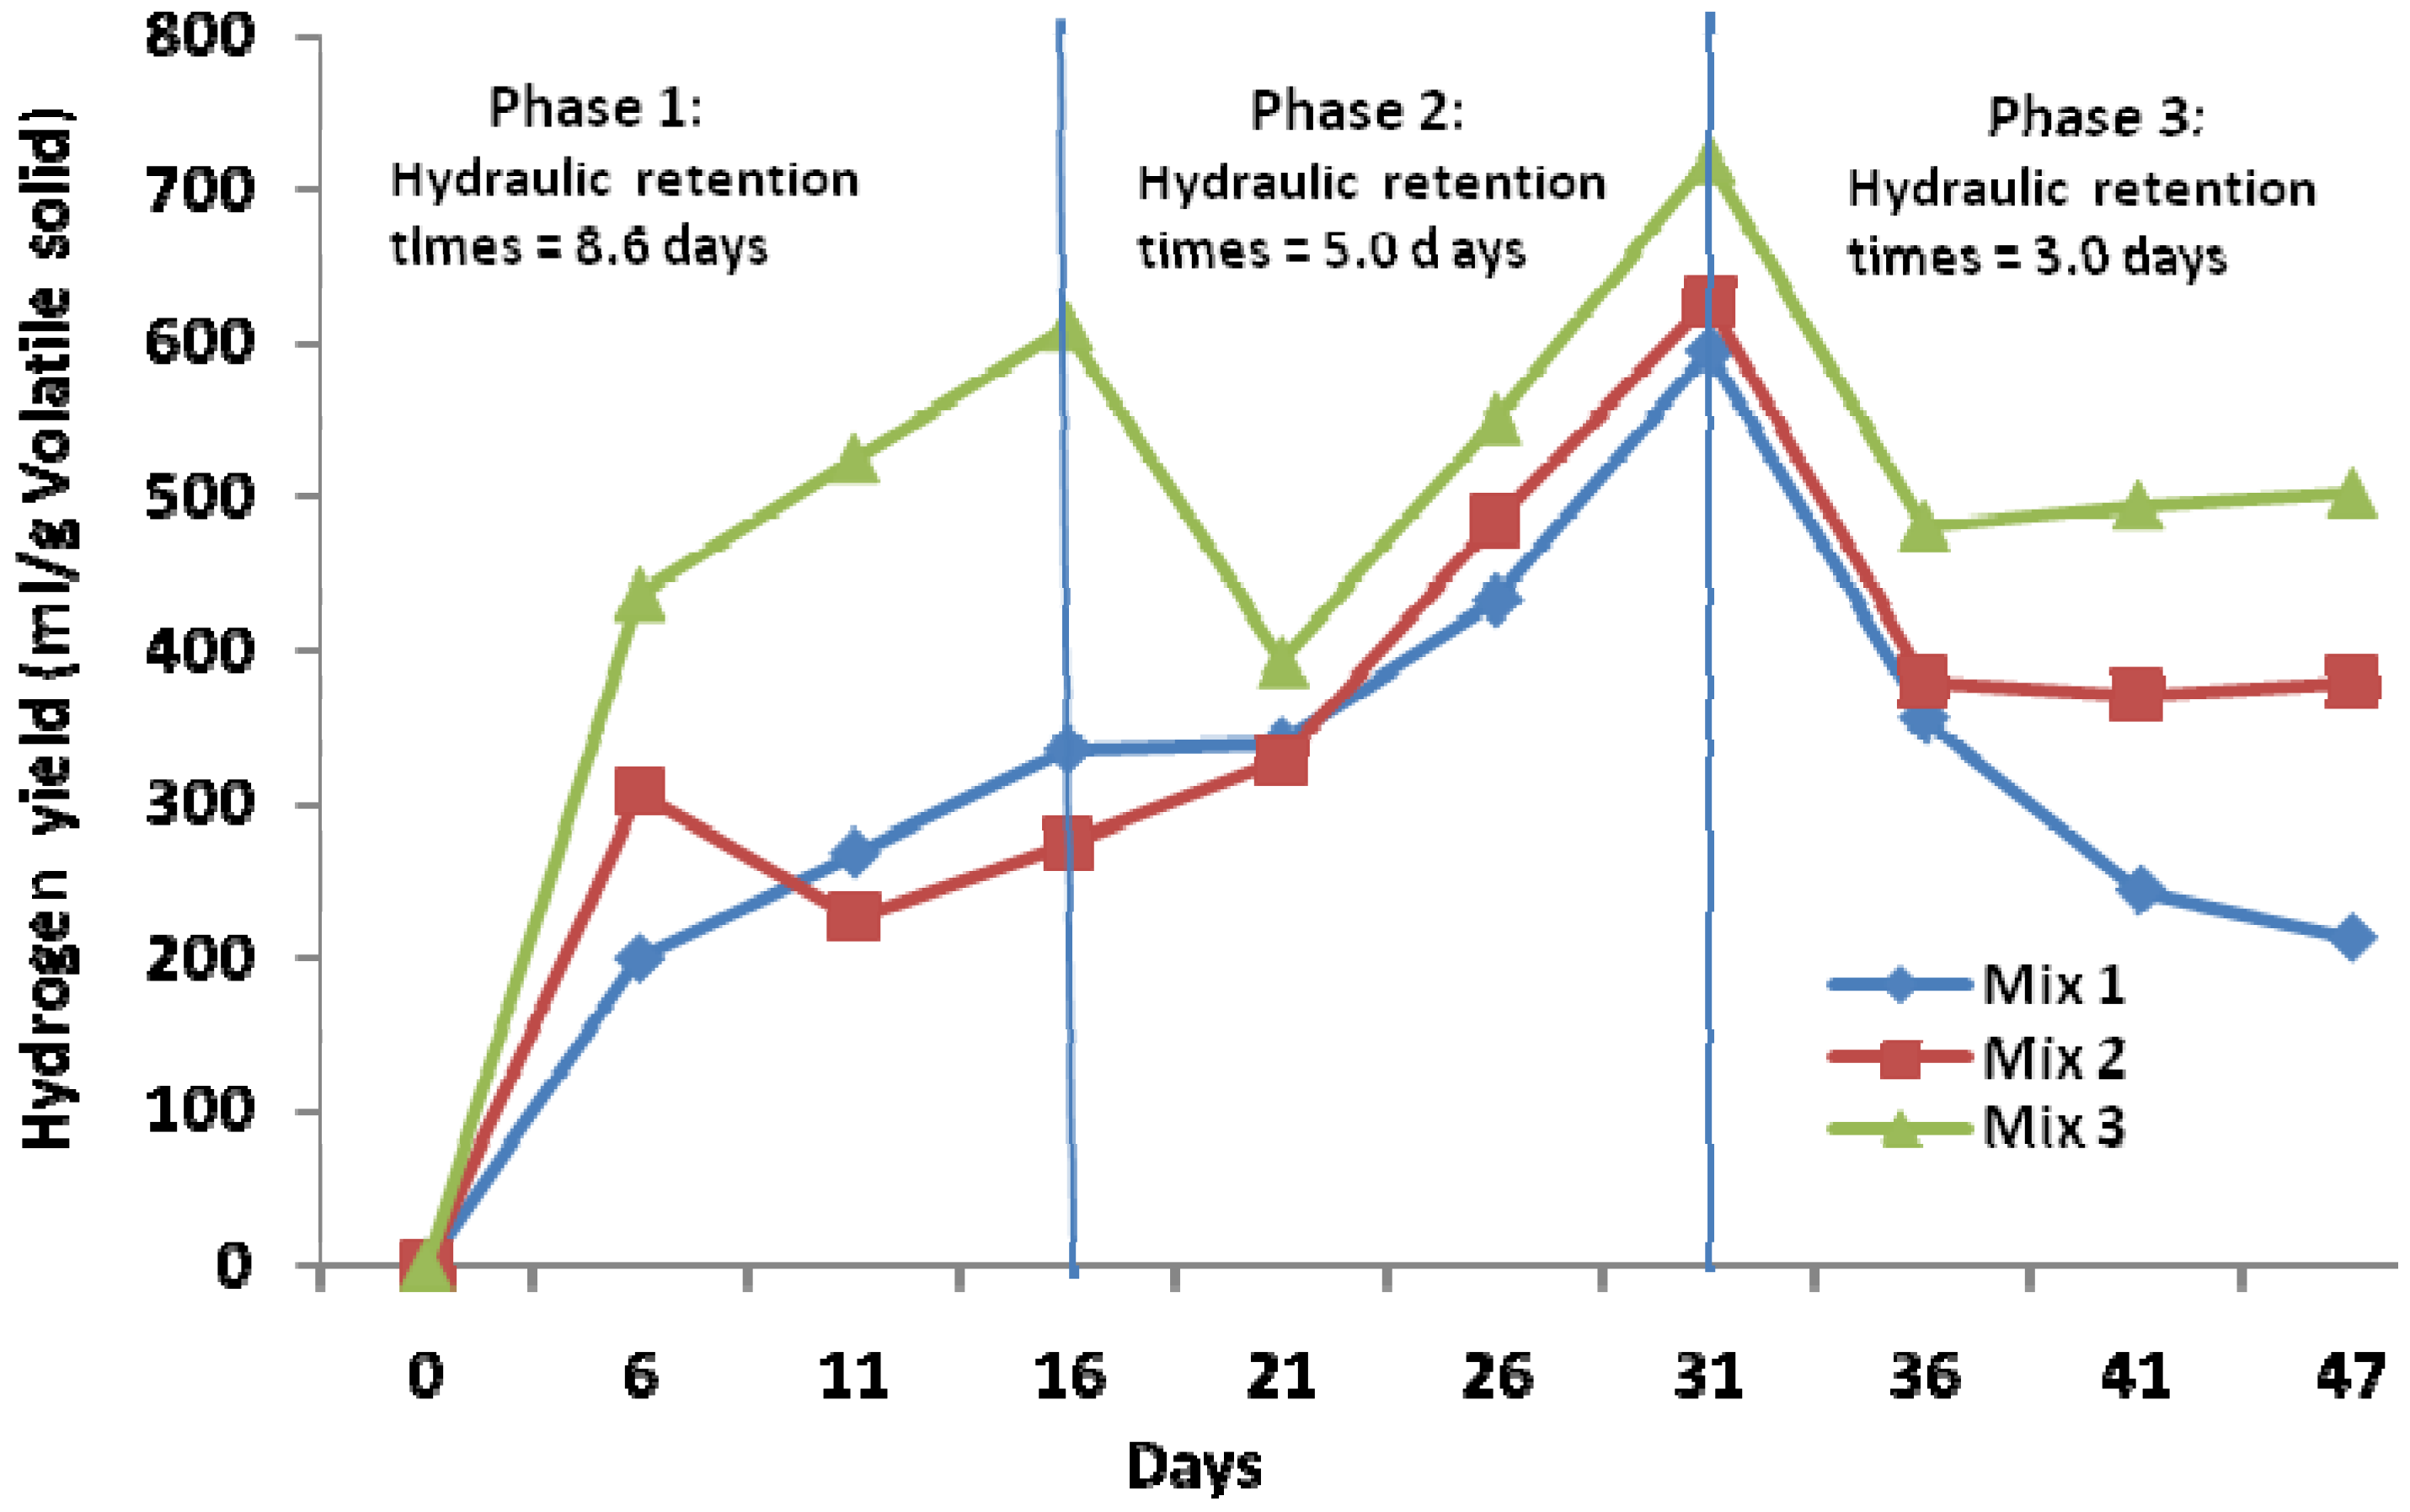
2.2. Hydrogen Production Yields from Mixed Fruits

Hydrogen yields from the fermentation of the three fruit mixtures, including 70% (Mix 1), 50% (Mix 2) and 20% (Mix 3) orange share, also followed a similar pattern, but with better performance than the fermentation of individual fruits, except apple (Figure 2). During the first phase, hydrogen yields from Mix 1 and Mix 3 increased, but there was a slight decrease in hydrogen yield from Mix 2. The highest average hydrogen yield of 523 mL/gVS obtained during the first phase was from the fermentation of Mix 3. In the second phase, hydrogen yields from Mix 1 and Mix 2 increased, while there was a slight reduction in hydrogen yield from Mix 3. However, Mix 3 produced the highest average hydrogen yield of 553 mL/gVS at the end of the second phase. The hydrogen yields from the three fruit mixtures decreased during the last phase, with Mix 3 still producing the highest yield of 491 mL/gVS. Mix 3 seemed to perform averagely better than other mixed fruits in terms of hydrogen yield. This might be due to the ineffectiveness of the toxicity of the individual inhibitors as a consequent effect of the mutual interaction of the different flavor compounds in the fruit mixture. Besides, since limonene constitutes the major component of citrus essential oils, the reduction of orange percentage in Mix 3 could also impact the reduced antimicrobial effect of limonene in the mixture. Moreover, the use of an appropriate amount of nutrient combination in any mixture of fruit waste is necessary for optimal hydrogen yields from the fermentation process, as excess or insufficient nutrients may affect the stability and gas productivity of the process [34]. The macronutrients (Na, K, Ca and Mg), micronutrients (Fe, Co, Ni and Mo) and some vitamins are necessary for the cell growth and metabolic activities of fermentative microorganism [34,35,36,37].
Figure 2. Hydrogen yields from the fermentation of mixed fruits.
Energies 08 04253 g002

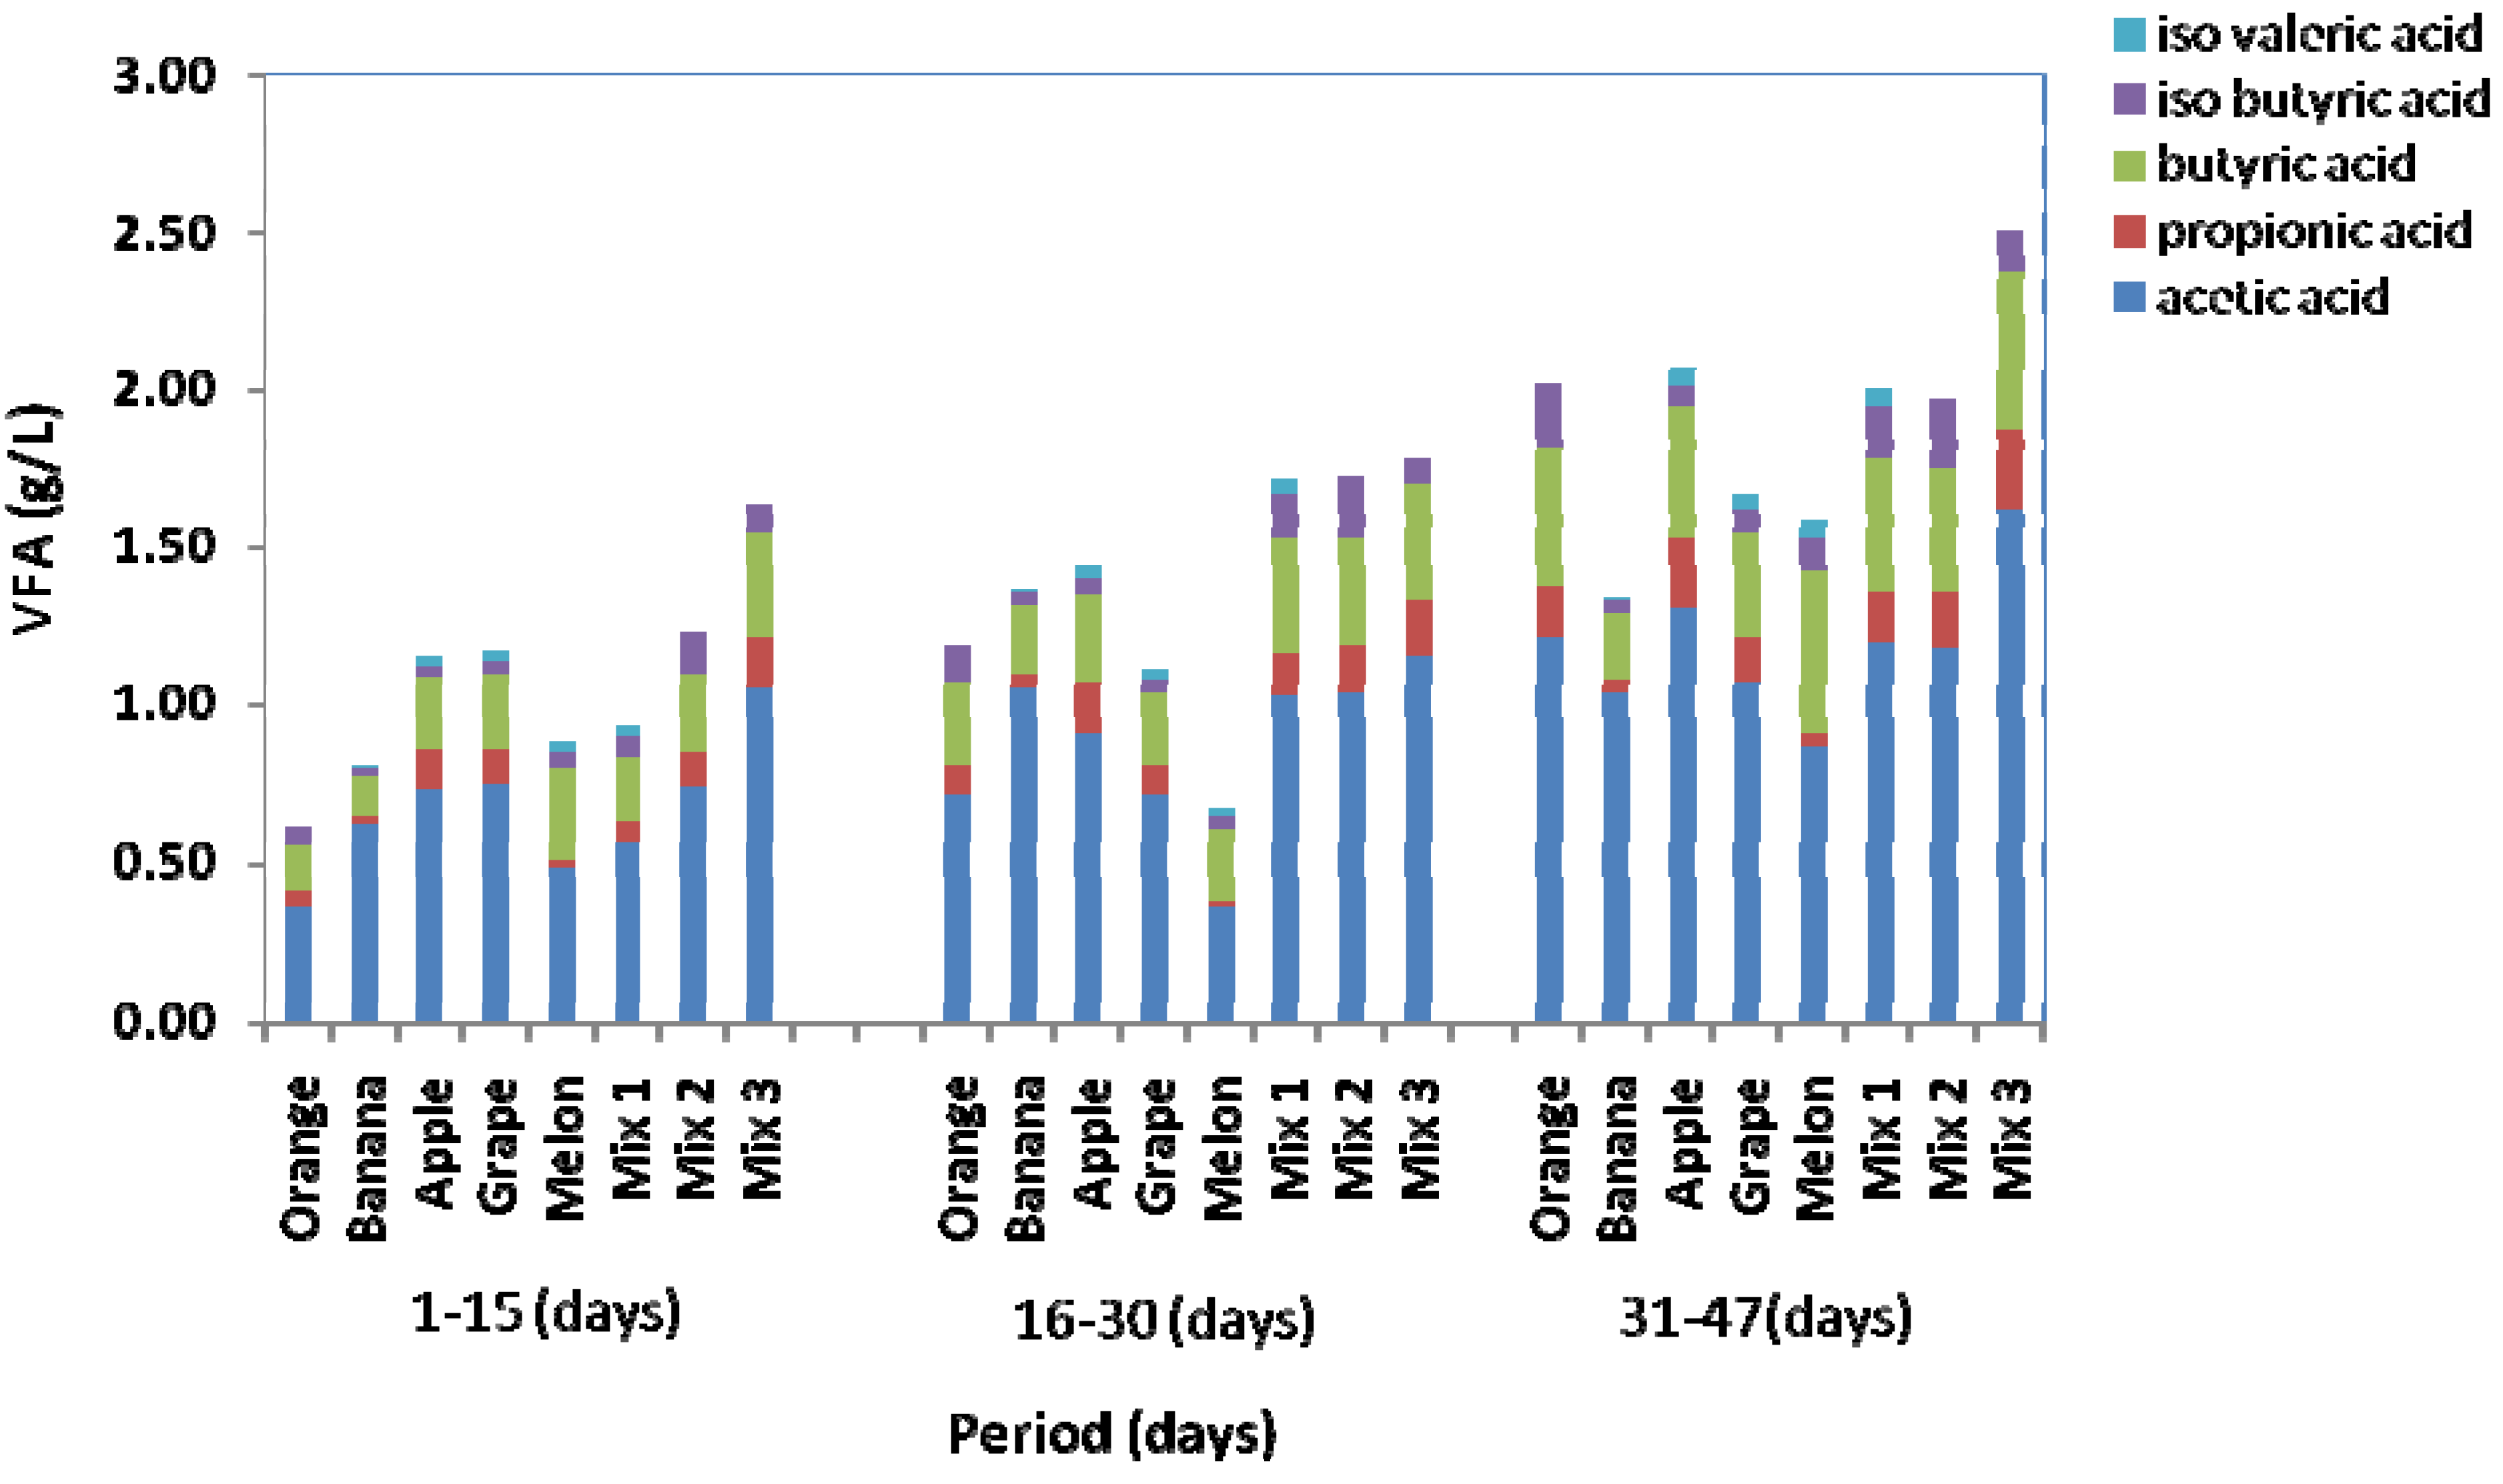
2.3. VFAs Production

The knowledge of the distribution of VFA compositions formed during the fermentation process is important, as it provides information about the metabolic pathways involved in the process. The distribution of VFA compositions produced during the fermentation of the fruit wastes showed that acetic and butyric acids were the dominant VFAs, while propionic, iso-butyric and iso-valeric were produced in very low amounts (Figure 3). At the end of the first phase of the initial OLR, the acetic acids produced from orange, banana, apple, grape, melon, Mix 1, Mix 2 and Mix 3 were 0.37, 0.62, 0.73, 0.75, 0.48, 0.56, 0.74 and 1.05 g/L, respectively. As the HRT decreased, the values of the acetic acid increased, except for grape and melon, which decreased during the second phase. At the end of the fermentation process, apple and Mix 3 produced significant amounts of acetic acids, which might be connected to their high cumulative hydrogen yields, as acetic acid production is often associated with hydrogen production [38,39].
Figure 3. Volatile fatty acid (VFA) composition of the fermentation process.
Energies 08 04253 g003

2.4. Comparison of Hydrogen Yields and Acetic Acid Productions with Theoretical Values

In a biological in vivo system, the theoretical maximum hydrogen yield that could be obtained from glucose at standard temperature and pressure is 4 mol H2/mol glucose when acetic acid is the only soluble metabolite [40,41]. However, during dark fermentation, hydrogen production is often produced along with reduced metabolites, including alcohols, lactic, propionic and valeric acids, which are involved in the hydrogen consuming pathway, thereby leading to actual hydrogen yields being significantly lower than the theoretical values [42,43,44,45,46]. On the other hand, high hydrogen yields are usually linked with the moderate accumulation of a mixture of acetic and butyric acids though accumulation of butyric acids, and its branched isomer could be an indication of process instability [47]. In the present study, the hydrogen yields from the fermentation of all of the fruit substrates, except grape and melon, increased with the increase in acetic acid production as the HRT decreased from 8.6 down to five days (Table 2). This was expected as the concentration of volatile fatty acids usually increased with the increase in substrate loading, which correlated with the decrease in HRT from 8.6 down to five days [39]. Meanwhile, the hydrogen yields decreased with the increase in acetic acid production, as the HRT was further decreased from five down to three days. In the comparison of actual yields to theoretical yields, the relative yield was calculated as given in Equation (4).
Re l a t i v e   i e l d = ( A c t u a l   y i e l d T h e o r e t i c a l   y i e l d ) × 100

2.4.1. Relative Yield of Hydrogen Production

The theoretical yield of hydrogen was based on Equation (2) with the assumption that at standard temperature and pressure (STP), a maximum of four moles of hydrogen (H2) could be produced from one mole of glucose when acetic acid was produced as the only reduced metabolite. The chemical oxygen demand (COD) equivalent of four moles of hydrogen is 1.4 LH2/g COD of glucose at STP. In other words, 1.4 L of hydrogen gas could be generated through complete anaerobic degradation of 1 g COD of glucose at STP. The total COD of the individual fruit waste was calculated, and the equivalent theoretical yield was determined. The theoretical yield estimated and the actual yields obtained experimentally were then used to calculate the relative yield using Equation (4).
Table 2. Comparison of hydrogen yields and acetic acid production with theoretical values.
ParameterAverage hydrogen yieldsAverage acetic acid production
Period (d)1–1516–3031–471–1516–3031–47
HRT (d)8.65.03.08.65.03.0
FruitAY (mL/gVS)RY (%)AY (mL/gVS)RY (%)AY (mL/gVS)RY (%)AY (g/L)RY (%)AY (g/L)RY (%)AY (g/L)RY (%)
Orange27916.140323.320411.80.37550.711181.21181
Banana38922.740323.526815.70.62931.051571.04155
Apple49328.963537.344025.80.731090.911361.30194
Grape34720.538422.618210.70.751120.711061.07160
Melon21612.635220.534720.20.48720.37550.86128
Mix 126815.545626.427115.70.56841.031541.20179
Mix 227015.747928.037722.00.741101.031541.18176
Mix 352330.555332.349128.61.051571.151721.62242
AY, actual yield; RY, relative yield.
Comparing the actual yields to theoretical yields, maximum relative yields of hydrogen production obtained during the three phases were 37.3% and 32.3% from apple (single fruit fermentation) and Mix 3 (mixed fruit fermentation), respectively. For the whole fermentation period of 47 days, the maximum relative yields of hydrogen production were 29.5% and 30.0% from apple and Mix 3, respectively. On average, this indicates that only 30% of the chemical oxygen demand in the fruit mixture with Mix 3 could be converted into hydrogen (assuming the fruit wastes could be utilized as glucose). This low value might be due to the effects of the toxicity of the fruit flavors and soluble metabolites.

2.4.2. Relative Yield of Volatile Fatty Acids

The theoretical yield of acetic acid production was also based on Equation 2 with the assumption that at standard temperature and pressure (STP), a maximum of two moles of acetic acid (CH3COOH) could be produced from one mole of glucose as the only reduced metabolite. The chemical oxygen demand (COD) equivalent of two moles of acetic acid is 0.666 g-O2/L. In the case of acetic acid, the theoretical yield was based on 1 g COD of the fruit waste. The estimated values of the theoretical acetic acid production and the actual production of acetic acid were then used to calculate the relative yield.
Throughout the whole fermentation period of 47 days, the maximum acetic acid concentration was 1.62 g/L from Mix 3. Although the maximum acetic acid concentration was less than the inhibiting acetic concentration (greater than 2 g/L) [48], the decrease in hydrogen yield during the last fermentation period could have been due to the organic loading exceeding its threshold limit. At a high loading rate, acetic acid might accumulate and permeate the cell membrane of the hydrogen-producing bacteria with subsequent disruption in the activities of the bacteria.
The relative acetic acid yields corresponding to the maximum hydrogen yields were 136% and 172% for apple and 20% orange share, respectively. It appeared that the fermentative bacteria involved in the fermentation of apple and 20% orange share were able to maintain their cell physiological balance in the presence of extra acetic acids. The reason that some relative yields of acetic acid production were higher than 100% could be due to the fact that the theoretical yield was based on 1 g COD of glucose as feedstock, whereas in the real fruit feedstock, the nutrient composition included carbohydrate, protein and lipids that could have been converted into acetic acids.

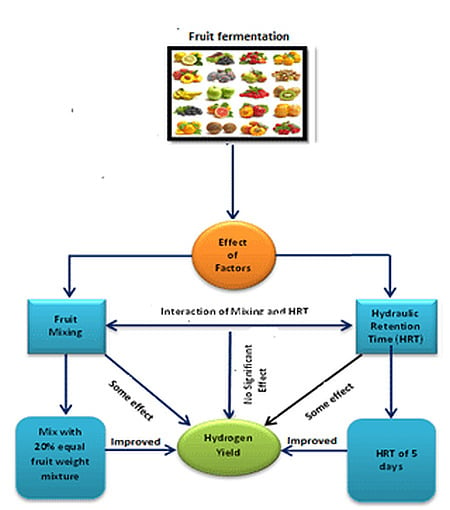
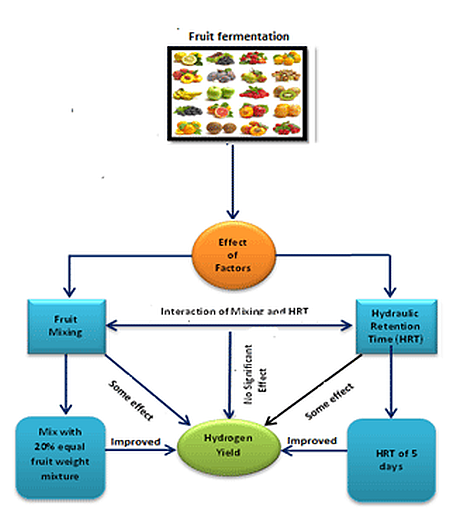
2.5. Significant Effects of Varying Hydraulic Retention Times, Fruit Mixing and Their Interaction on Hydrogen Yield and Acetic Acid Production

The experiment was conducted to investigate the effects of hydraulic retention time (HRT) and fruit mixing, as well as their interactions on hydrogen yield and acetic acid production. The results of the two-way analysis of variance (ANOVA) are summarized in Table 3 and Table 4. Based on the results obtained, the hypothesis tests on the effects of hydraulic retention time (HRT) and fruit mixing, as well as their interactions (HRT and fruit mixing interaction) on hydrogen yield indicated that the factors did not have significant effects since their p-values, 0.061, 0.259 and 0.763 (Table 3) for HRT, fruit mixing and HRT and fruit mixing interaction, respectively, were all greater than the chosen α-level (0.05). The results were further corroborated with the Turkey pairwise comparisons for the difference in means (Table 4), which showed that the difference in means of hydrogen yield due to all of the factor levels were not significantly different, since their adjusted p-values were all greater than the chosen α-level (0.05). Regarding the effects of the factors on acetic acid production, the hypothesis tests (Table 3) showed that HRT and fruit mixing really had significant effects on the production of acetic acids, since their p-values of 0.000 and 0.009 for HRT and fruit mixing, respectively, were lower than the chosen α-level (0.05). On the contrary, the effect of the interaction of HRT and fruit mixing on acetic acid production was not statistically significant, since its p-value (0.830) was greater than the chosen α-level (0.05).
The Tukey pairwise comparisons for the difference in means due to HRT (Table 4) showed that the adjusted p-values for the differences between the mean for HRT of three days and the means for HRT of five days (0.024) and 8.6 days (0.000) were all lower than the chosen α-level (0.05), which indicated that these differences were significant. In the comparison of the difference in means for acetic acid production due to fruit mixing, the adjusted p-value (0.009) was lower than the chosen α-level (0.05), indicating that the difference was statistically significant.
For the effect of the interaction of HRT and fruit mixing on acetic acid production, the adjusted p-values for the difference between the mean for mixed fruit operated at HRT of three days and the means for single fruits operated at HRT of five days (0.010) and 8.6 days (0.001) were lower than the chosen α-level (0.05). Similarly, the adjusted p-values for single fruits (0.010) and mixed fruits (0.037), when operated separately at HRT of three and 8.6 days, were lower than the chosen α-level (0.05). Furthermore, the adjusted p-value (0.044) for the difference between the mean for mixed fruit operated at HRT of five days and the mean for single fruit operated at HRT of 8.6 days was lower than the chosen α-level (0.05), which indicated that the difference was statistically significant.
Meanwhile, as a consequence of the insignificant effect of fruit mixing on hydrogen yield, the fruit feedstock was further considered as individual substrates for analysis of variance (Table 5). Based on the results obtained, the hypothesis tests showed that both HRT and individual substrates had significant effects on hydrogen yields, since their p-values (0.001) were lower than the chosen α-level (0.05). Similarly, the effects of HRT and individual substrates on acetic acid production were statistically significant, since their p-values, 0.000 and 0.001 for HRT and individual substrate, respectively, were lower than the chosen α-level (0.05).
Table 3. Summary of two-way analysis of variance (ANOVA) for the effects of hydraulic retention time (HRT) and fruit mixing (Mix) on hydrogen yield and acetic acid production.
ResponseFactorFactor TypeFactor LevelsFactor ValuesdFAdj SSAdj MSF-Valuep-Value
Hydrogen yieldHRTFixed33.0; 5.0; 8.623,89513.283.280.061
MixFixed2N; Y116,1871.361.360.259
HRT and mix interaction 23,2660.270.270.763
Error 1811,890
Total 23
Acetic acid productionHRTFixed33.0; 5.0: 8.621.053710.52685412.820.000
MixFixed2N, Y10.352190.3521888.570.009
HRT and mix interaction 20.015510.0077540.190.830
Error 180.739850.041103
Total 23
Table 4. Tukey pairwise comparisons: response = H2 yield, acetic acid production; factor = HRT, mix and mix and HRT interaction.
ResponseFactorDifference of factor levelsDifference of meansSE of differenceSimultaneous 95% CIt-valueAdjusted p-value
H2 yieldHRT5.0–3.0131.856.3(−12.0; 275.5)2.340.076
8.6–3.015.356.3(−128.4; 159.0)0.270.960
8.6–5.0−116.556.3(−260.2; 27.3)−2.070.125
MixYES–NO53.646.0(−42.9; 150.2)1.170.259
Mix and HRT interaction(NO 5.0)–(NO 3.0)147.269.0(−71.8; 366.2)2.130.314
(NO 8.6)–(NO 3.0)56.669.0(−162.4; 275.6)0.820.960
(YES 3.0)–(NO 3.0)91.579.6(−161.4; 344.3)1.150.855
(YES 5.0)–(NO 3.0)207.879.6(−45.0; 460.6)2.610.145
(YES 8.6)–(NO 3.0)65.579.6(−187.4; 318.3)0.820.960
(NO 8.6)–(NO 5.0)−90.669.0(−309.6; 128.4)−1.310.774
(YES 3.0)–(NO 5.0)−55.779.6(−308.6; 197.1)−0.700.980
(YES 5.0)–(NO 5.0)60.679.6(−192.2; 313.4)0.760.971
(YES 8.6)–(NO 5.0)−81.779.6(−334.6; 171.1)−1.030.903
(YES 3.0)–(NO 8.6)34.979.6(−218.0; 287.7)0.440.998
(YES 5.0)–(NO 8.6)151.279.6(−101.6; 404.0)1.900.434
(YES 8.6)–(NO 8.6)8.979.6(−244.0; 261.7)0.111.000
(YES 5.0)–(YES 3.0)116.389.0(−166.3; 399.0)1.310.778
(YES 8.6)–(YES 3.0)−26.089.0(−308.7; 256.7)−0.291.000
(YES 8.6)–(YES 5.0)−142.389.0(−425.0; 140.3)−1.600.610
Acetic acidHRT5.0–3.0−0.3050.105(−0.572; −0.037)−2.910.024
8.6–3.0−0.5280.105(−0.795; −0.261)−5.040.000
8.6–5.0−0.2230.105(−0.491; 0.044)−2.130.111
MixYES–NO0.25020.0855(0.0706; 0.4298)2.930.124
Mix and HRT interaction(NO 5.0)–(NO 3.0)−0.3460.128(−0.753; 0.061)−2.700.124
(NO 8.6)–(NO 3.0)−0.5060.128(−0.913; −0.099)−3.950.010
(YES 3.0)–(NO 3.0)0.2370.148(−0.233; 0.707)1.600.607
(YES 5.0)–(NO 3.0)−0.0260.148(−0.496; 0.444)−0.181.000
(YES 8.6)–(NO 3.0)−0.3130.148(−0.783; 0.157)−2.110.325
(NO 8.6)–(NO 5.0)−0.1600.128(−0.567; 0.247)−1.250.808
(YES 3.0)–(NO 5.0)0.5830.148(0.113; 1.053)3.940.010
(YES 5.0)–(NO 5.0)0.3200.148(−0.150; 0.790)2.160.302
(YES 8.6)–(NO 5.0)0.0330.148(−0.437; 0.503)0.231.000
(YES 3.0)–(NO 8.6)0.7430.148(0.273; 1.213) 5.020.001
(YES 5.0)–(NO 8.6)0.4800.148(0.010; 0.950)3.240.044
(YES 8.6)–(NO 8.6)0.1930.148(−0.227; 0.663)1.310.778
(YES 5.0)–(YES 3.0)−0.2630.166(−0.789; 0.262)−1.590.614
(YES 8.6)–(YES 3.0)−0.5500.166(−1.076; −0.024)−3.320.037
(YES 8.6)–(YES 5.0)−0.2870.166(−0.812; 0.239)−1.730.530
Table 5. Summary of two-way analysis of variance (ANOVA) for the effects of hydraulic retention time (HRT) and substrate.
ResponseFactorFactor TypeFactor LevelsFactor ValuesdFAdj SSAdj MSF-Valuep-Value
Hydrogen yieldHRTFixed33.0; 5.0; 8.6283,06941,53411.520.001
SubstrateFixed8Apple; Banana; Grape; Melon; Mix1; Mix 2; Mix 3; Orange7186,26426,6097.380.001
Error 1450,4723,605
Total 23319,805
Acetic acid productionHRTFixed33.0; 5.0; 8.621.10740.5537230.390.000
MixFixed8Apple; Banana; Grape; Melon; Mix1; Mix 2; Mix 3; Orange70.85240.121786.680.001
Error 140.25510.01822
Total 23
The Tukey pairwise comparisons for the difference in means of hydrogen yield due to HRT (Table 6) showed that the adjusted p-values for the differences between the mean for HRT of five days and the means for HRT of three days (0.001) and 8.6 days (0.007) were lower than the chosen α-level (0.05), which indicated that these differences were significant. For the effects of individual substrates on hydrogen yield, the Turkey pairwise comparisons showed that the adjusted p-values for the differences between the mean for apple and the means for grape (0.010), melon (0.010), Mix 1 (0.026) and orange (0.007) were all lower than the chosen α-level (0.05). In the same vein, the adjusted p-values for the difference between the mean for Mix 3 and the means for grape (0.010), melon (0.010), Mix 1 (0.026) and orange (0.007) were lower than the chosen α-level (0.05), which indicated that the mean differences were significant. Meanwhile, the Tukey comparison for the difference in means of acetic acid production due to HRT showed that the adjusted p-values for the differences between the mean for HRT of three days and the means for HRT of five days (0.001) and 8.6 days (0.0022) were lower than the chosen α-level (0.05). Furthermore, the adjusted p-value (0.021) for the difference between the mean for HRT of five days and 8.6 days was lower than the chosen α-level (0.05), which indicated that the difference was significant. In the case of the effects of individual substrates on acetic acid production, the adjusted p-values for the differences between the mean for Mix 3 and the means for grape (0.026), melon (0.000) and orange (0.007) were below the chosen α-level (0.05). Similarly, the adjusted p-values for the difference between the mean for melon and the means for apple (0.036) and Mix 2 (0.034) were below the chosen α-level (0.05), which showed that the mean differences were significant.
Table 6. Tukey pairwise comparisons: Response = H2 yield, acetic acid production; factor = HRT, substrate.
ResponseFactorDifference of Factor LevelsDifference of MeansSE of DifferenceSimultaneous 95% CIt-ValueAdjusted p-Value
H2 yieldHRT5.0–3.0135.630.0(57.1; 214.2)4.520.001
8.6–3.025.630.0(−52.9; 104.2)0.850.677
8.6–5.0−110.030.0(−188.5; −31.5)−3.660.007
SubstrateBanana-Apple−169.349.0(−342.3; 3.6)−3.450.057
Grape-apple−218.349.0(−391.3; −45.4)−4.450.010
Melon-Apple−217.749.0(−390.6; −44.7)−4.440.010
Mix 1-Apple−191.049.0(−364.0; −18.0)−3.900.026
Mix 2-Apple−147.349.0(−320.3; 25.6)−3.010.123
Mix 3-Apple−0.349.0(−173.3; 172.6)−0.011.000
Orange-Apple−227.349.0(−400.3; −54.4)−4.640.007
Grape-Banana−49.049.0(−222.0; 124.6)−1.000.967
Melon-Banana−48.349.0(−221.3; 124.6)−0.990.969
Mix 1-Banana−21.749.0(−194.6; 151.3)−0.441.000
Mix 2-Banana22.049.0(−151.0; 195.0)0.451.000
Mix 3-Banana169.049.0(−4.0; 342.0)3.450.058
Orange-Banana−58.049.0(−231.0; 115.0)−1.180.924
Melon-Grape0.749.0(−172.3; 173.6)0.011.000
Mix 1-Grape27.349.0(−145.6; 200.3)0.560.999
Mix 2-Grape71.049.0(−102.0; 244.0)1.450.821
Mix 3-Grape218.049.0(45.0; 391.0)4.450.010
Orange− Grape−9.049.0(−182.0; 164.0)−0.181.000
Mix 1-Melon26.749.0(−146.3; 199.6)0.540.999
Mix 2-Melon70.349.0(−102.6; 243.3)1.430.827
Mix 3-Melon217.349.0(44.4; 390.3)4.430.010
Orange-Melon−9.749.0(−182.6; 163.3)−0.201.000
Mix 2-Mix 143.749.0(−129.3; 216.6)0.890.982
Mix 3-Mix 1190.749.0(17.7; 363.6) 3.890.026
Orange-Mix 1−36.349.0(−209.3; 136.6)−0.740.994
Mix 3-Mix 2147.049.0(−26.0; 320.0)3.000.124
Orange-Mix 2−80.049.0(−253.0; 93.0)−1.630.726
Orange-Mix 3−227.049.0(−400.0; −54.0)−4.630.007
Acetic acidHRT5.0–3.0−0.31500.0675(−0.4916; −0.1384)−4.670.001
8.6–3.0−0.52250.0675(−0.6991; −0.3459)−7.740.002
8.6–5.0−0.20750.0675(−0.3841; −0.0309)−3.070.021
SubstrateBanana-Apple−0.0770.110(−0.466; 0.312)−0.700.996
Grape-apple−0.1370.110(−0.526; 0.252)−1.240.906
Melon-Apple−0.4100.110(−0.799; −0.021)−3.720.036
Mix 1-Apple−0.0500.110(−0.439; 0.339)−0.451.000
Mix 2-Apple0.0030.110(−0.386; 0.392)0.031.000
Mix 3-Apple0.2930.110(−0.096; 0.682)2.660.213
Orange-Apple−0.2170.110(−0.606; 0.172)−1.970.534
Grape-Banana−0.0600.110(−0.449; 0.329)−0.540.999
Melon-Banana−0.3330.110(−0.722; 0.056)−3.020.119
Mix 1-Banana0.0270.110(−0.362; 0.416)0.241.000
Mix 2-Banana0.0800.110(−0.309; 0.469)0.730.995
Mix 3-Banana0.3700.110(−0.019; 0.759)3.360.068
Orange-Banana−0.1400.110(−0.529; 0.249)−1.270.896
Melon-Grape−0.2730.110(−0.662; 0.116)−2.480.278
Mix 1-Grape0.0870.110(−0.302; 0.476)0.790.991
Mix 2-Grape0.1400.110(−0.249; 0.529)1.270.896
Mix 3-Grape0.4300.110(0.041; 0.819)3.900.026
Orange− Grape−0.0800.110(−0.469; 0.309)−0.730.995
Mix 1-Melon0.3600.110(−0.029; 0.749)3.270.079
Mix 2-Melon0.4130.110(0.024; 0.802)3.750.034
Mix 3-Melon0.7030.110(0.314; 1.092)6.380.000
Orange-Melon0.1930.110(−0.196; 0.582)1.750.657
Mix 2-Mix 10.0530.110(−0.336; 0.422)0.481.000
Mix 3-Mix 10.3430.110(−0.046; 0.732)3.120.102
Orange-Mix 1−0.1670.110(−0.556; 0.222)−1.510.790
Mix 3-Mix 20.2900.110(−0.099; 0.679)2.630.223
Orange-Mix 2−0.2200.110(−0.609; 0.169)−2.000.516
Orange-Mix 3−0.5100.110(−0.899; −0.121)−4.630.007

3. Experimental Section

3.1. Experimental Materials (Feedstock, Seed Sludge and Nutrient)

Whole fruit wastes, including apple (Malus sp.), banana (Musa sp.), grape (Vitis sp.), melon (Cucumis sp.) and orange (Citrus sp.), obtained from a local shop (Borås, Sweden), were used as feedstock for the anaerobic digestion process. The fruits as a whole (rind and inner part of the fruits) were ground separately in a kitchen blender (Waring Commercial, Torrington, CT, USA) before they were stored in a cold room (5 °C) to reduce their deterioration prior to the fermentation process. The hydrogen-producing microorganism (HPM) was prepared from sludge obtained from a thermophilic (55 °C) biogas plant (Borås Energi & Miljö AB, Borås, Sweden) that utilized the organic fraction of municipal solid waste as feedstock for biogas production. The HPM was enriched by adjusting the pH to 5.0 ± 0.1 coupled with heat treatment at 105 °C for 1 h. The nutrients used for the growth of HPM were a mixture of macro- and micronutrients, including (g/L): FeCl2. 4H2O, 11.401; KH2PO4, 4.681; NH4Cl, 0.814; NaHCO3, 3.000; MgSO4.7H2O, 0.320; NiSO4.6H2O, 0.032; CaCl2, 0.050; Na2B4O7.10H2O, 0.007; (NH4)6Mo7O24.4H2O, 0.014: ZnCl2, 0.023; CoCl6.H2O, 0.021; CuCl2.2H2O, 0.010.

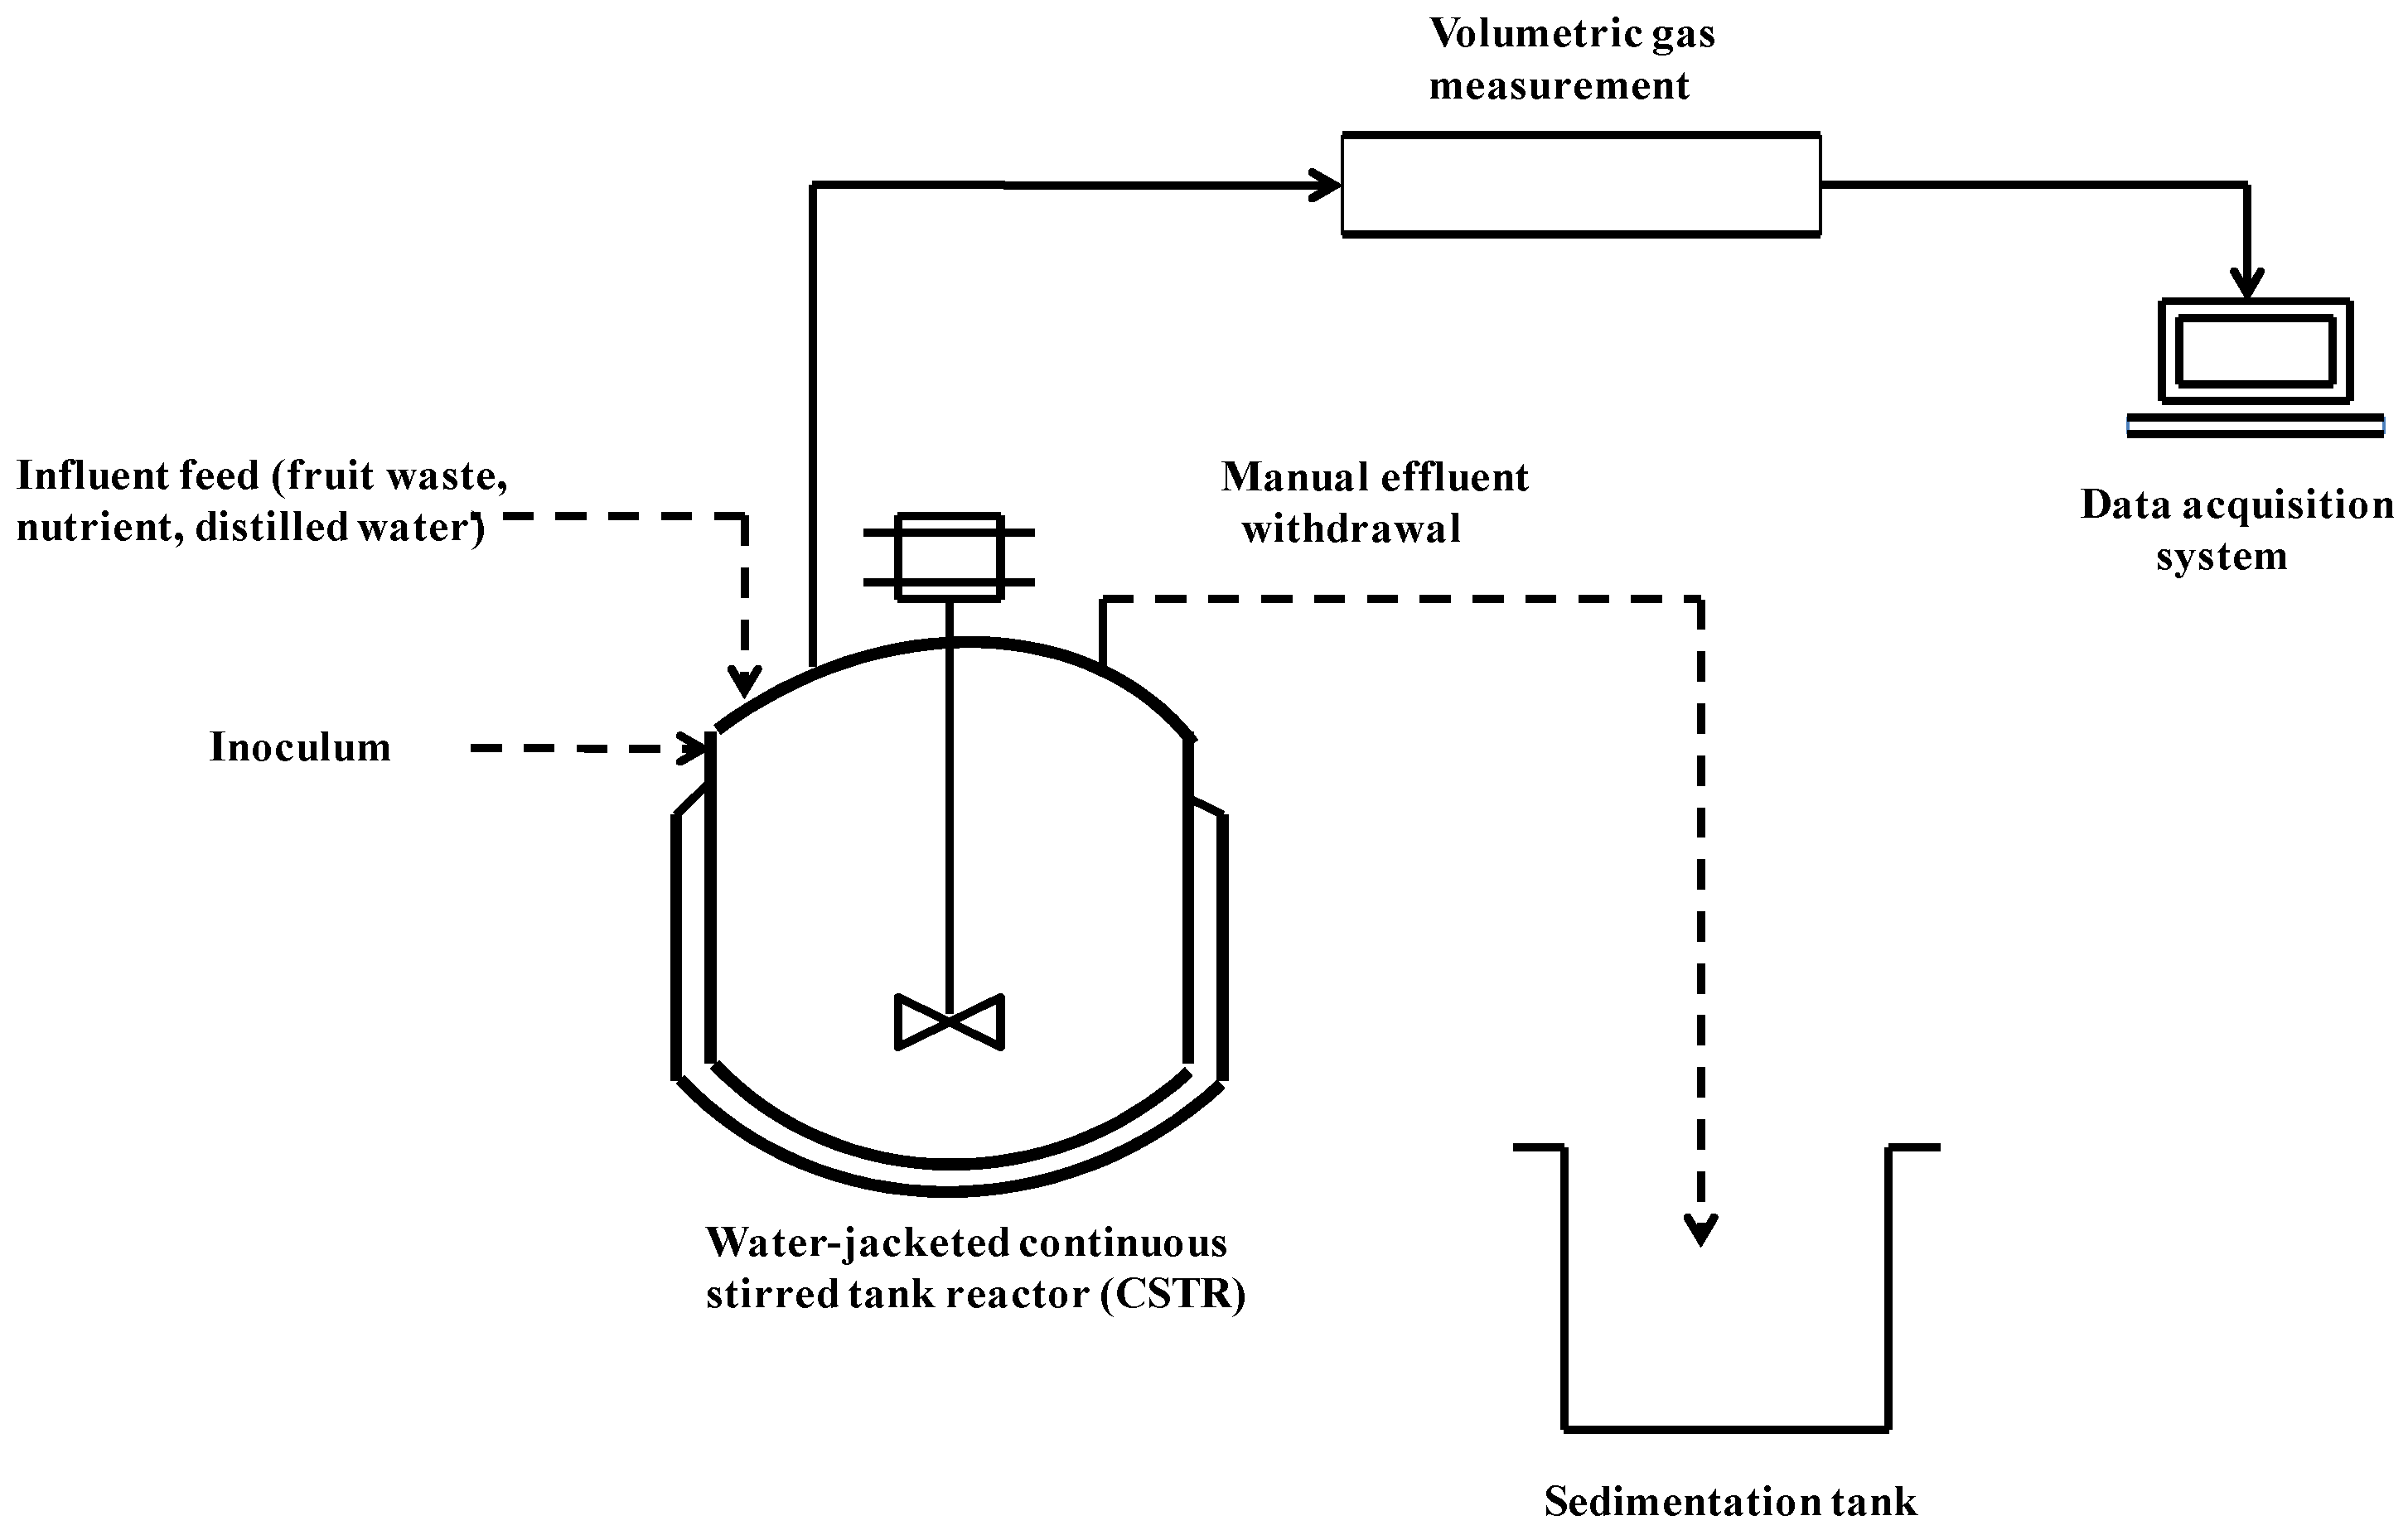
3.2. Experimental Setup and Procedures

The fermentative production of hydrogen was carried out using eight continuous stirred tank bioreactors (CSTR) in order to evaluate the performance, in terms of hydrogen yields and VFA production, of the fermentative hydrogen production process from the whole fruit wastes. Each CSTR reactor (active volume of 3 L and headspace of 1 L) contained fermentation medium at 55 °C and a pH of 5.0 (Figure 4). Eight different fruit substrates were used, including single fruits (banana, apple, grape, melon, orange) and mixed fruits, which differed in the amount of orange in the mixtures. The weight distribution of the first, second and third fruit mixtures were 70%, 50% and 20% orange share, respectively, while the residual weight was shared equally by banana, apple, grape, melon and orange. A thermostatic water bath (GD 100, Grant instruments Ltd., Cambridgeshire, UK) was employed to provide the heating energy needed to maintain the required temperatures in the CSTRs. Prior to the start of the fermentation process, the fruit slurries were left to attain room temperature (22 °C) before they were fed into the bioreactors. A mixture of HPM, feedstock, distilled water, macro- and micro-nutrients in solution at a volumetric ratio of 8:2:6:4:1, respectively, was added to the CSTRs and left for three days without any daily feedstock feeding in order to adapt or acclimatize the inoculum to the fermentation environment. The fermentation process was started, after the third day, with the feeding of the fruit feedstock mixed with distilled water, buffer solution (1 M NaHCO3), macro- and micro-nutrients at a ratio of 10:60:3:20:7, respectively, into the CSTR. The whole experiment was run for 47 days with an increase in the organic loading rate (OLR).
Figure 4. Schematic diagram of the fermentative hydrogen production from single and mixed fruits.
Energies 08 04253 g004

3.3. Analytical Procedures

The characteristics of the feedstock for the two-stage fermentation process, including total solid (TS), volatile solid (VS) and pH (Table 7), were determined according to standard methods [49]. The main nutrient compositions of the fruit wastes and their mixtures are presented in Table 8 according to the nutrient database of the U.S. Department of Agriculture [50]. The gas produced was measured using the Automatic Methane Potential Testing System (AMPTS, Bioprocess Control AB, Lund, Sweden), which is based on the principle of water displacement and buoyancy, while the hydrogen composition of the gas produced was sampled with the aid of a 0.25-μL pressure-tight gas syringe (VICI, Baton Rouge, LA, USA) and analyzed using a gas chromatograph (GC, Perkin-Elmer, 710 Bridgeport Avenue, Shelton, CT, USA) equipped with a packed column (Perkin-Elmer, 6' × 1.8" OD, 80/100, Mesh, 710 Bridgeport Avenue, Shelton, CT, USA) and a thermal conductivity detector (TCD, PerkinElmer, 710 Bridgeport Avenue, Shelton, CT, USA) set at 200 °C. The temperatures of the oven and injector were set at 75 °C and 150 °C, respectively, while nitrogen gas at a flow rate, temperature and pressure of 20 mL/min, 60 °C and 1 bar, respectively, was used as the carrier gas. The volatile fatty acids (VFA) in the effluent samples were measured using a high-performance liquid chromatograph (HPLC, Waters 2695, Waters Corporation, Milford, MA, USA) equipped with an RI detector (Waters 2414, Waters Corporation, Milford, MA, USA) and a biohydrogen-ion exchange column (Aminex HPX-87H, Bio-Rad, Hercules, CA, USA) operating at 60 °C and 0.6 mL/min and with 5 mM sulfuric acid as the effluent.
Table 7. Measured characteristics of fruit wastes. TS, total solid.
ParametersAppleBananaGrapeMelonOrange
TS (%)11.72 ± 0.0216.36 ± 0.2419.32 ± 0.248.93 ± 0.2616.85 ± 0.30
VS (%)11.53 ± 0.3515.5 ± 0.0518.68 ± 0.068.39 ± 0.1616.26 ± 0.20
pH3.90 ± 0.015.06 ± 0.023.67 ± 0.024.88 ± 0.014.04 ± 0.02
Table 8. Nutrient composition in 100 g of fruit.
FruitCarbohydrateProteinLipidC:N Ratio *
g%g%g%
Apple14.06970.2720.20152:1
Melon9.09930.5460.14117:1
Banana22.84941.0950.33121:1
Orange15.50901.3080.30212:1
Grape18.10950.7240.16125:1
Mix 1 *15.71921.1060.28214:1
Mix 2 *15.77950.5930.26227:1
Mix 3 *15.92940.7850.23120:1
* Estimated value.

4. Conclusions

The present study assessed the effect of hydraulic retention times and fruit mixing on biohydrogen production from fruit wastes in continuous stirred tank bioreactors. The results of the two-way analysis of variance indicated that there was no statistically-significant effect of the interaction of hydraulic retention time and fruit mixing on hydrogen yields and acetic acid production. However, the results established that significant improvement in hydrogen yields could be obtained when apple and Mix 3 were used as individual substrates. The results also indicated that operating the fermentative hydrogen production at a hydraulic retention time of 5 days could greatly increase hydrogen yield, as it reduced the amount of acetic acid accumulated during the fermentation process. It could therefore be inferred that fermentation of apple or Mix 3 at hydraulic retention time of 5 days could be used to reduce the effect of bacterial inhibition due to flavor compounds in the fruits and thereby enhance hydrogen production from the fruit wastes.

Acknowledgments

The authors wish to express their gratitude to the Swedish Research Council (Sweden) and Lagos State University (Nigeria) for providing financial support during the research work. We are also grateful for the assistance given by Magnus Lundin on statistical analysis of the data and to Khamdan Cahyari for his support during the study.

Acronyms

AY
Actual yield
CIs
Confidence intervals
COD
Chemical oxygen demand
dF
degree of freedom
HPM
Hydrogen producing microorganism
HRT
Hydraulic retention time
MS
Mean square
Mix
Mixing
Mix 1
70% orange mixed fruit
Mix 2
50% orange mixed fruit
Mix 3
20% orange mixed fruit
OLR
Organic loading rate
PY
Percent yield
SS
Sum of squares
SV
Source of variation
TS
Total solid
TVFA
Total volatile fatty acids
VFA
Volatile fatty acids
VS
Volatile solid

Conflicts of Interest

The authors declare no conflicts of interest

References

  1. Benemann, J. Hydrogen biotechnology: Progress and prospects. Nat. Biotechnol. 1996, 14, 1101–1103. [Google Scholar] [CrossRef] [PubMed]
  2. Bockris, J.O.M. The economics of hydrogen as a fuel. Int. J. Hydrog. Energy 1981, 6, 223–241. [Google Scholar] [CrossRef]
  3. Mormirlan, M.; Veziroglu, T.N. Current status of hydrogen energy. Renew. Sustain. Energy Rev. 2002, 6, 141–179. [Google Scholar] [CrossRef]
  4. Ros, M.; Franke-Whittle, I.H.; Morales, A.B.; Insam, H.; Ayuso, M.; Pascual, J.A. Archael community dynamics and abiotic characteristics in a mesophilic anaerobic co-digestion process treating fruit and vegetable processing waste sludge with chopped fresh artichoke waste. Bioresour. Technol. 2013, 136, 1–7. [Google Scholar] [CrossRef] [PubMed]
  5. Ueno, Y.; Haruta, S.; Ishii, M.; Igarashi, Y. Microbial community in anaerobic hydrogen-producing microflora enriched from sludge compost. Appl. Microbiol. Biotechnol. 2001, 57, 555–562. [Google Scholar] [CrossRef] [PubMed]
  6. Kapdan, I.K.; Kargi, F. Biohydrogen production from waste materialk. Enzyme Microb. Technol. 2006, 38, 569–582. [Google Scholar] [CrossRef]
  7. Levin, D.B.; Chahine, R. Challenges for renewable hydrogen production processes. Int. J. Hydrog. Energy 2008, 33, 279–286. [Google Scholar] [CrossRef]
  8. Westermann, P.; Jørgensen, B.; Lange, L.; Ahring, B.K.; Christensen, C.H. Maximizing renewable hydrogen production from biomass in a bio/catalytic refinery. Int. J. Hydrog. Energy 2007, 32, 4135–4141. [Google Scholar] [CrossRef]
  9. Nandi, R.; Sengupta, S. Microbial production of hydrogen: An Overview. Crit. Rev. Microbiol. 1998, 24, 61–84. [Google Scholar] [CrossRef] [PubMed]
  10. Nursten, H.E.; Williams, A.A. Fruit aromas: A survey of compounds identified. Chem. Ind. 1967, 486–497. [Google Scholar]
  11. Winniczuk, P.P.; Parish, M.E. Minimum inhibitory concentrations of antimicrobials against micro-organisms related to citrus juice. Food Microbiol. 1997, 14, 373–381. [Google Scholar]
  12. Jordan, M.J.; Tandon, K.; Shaw, P.E.; Goodner, K.I. Aromatic profile aqueous banana essence and banana fruit by gas-chromatography-mass spectrometry (GC-MS) and gas-chromatography-olfactometry. J. Agric. Food Chem. 2001, 49, 4813–4817. [Google Scholar] [CrossRef] [PubMed]
  13. Nogueira, J.M.F.; Fernandes, P.J.P.; Nascimento, A.M.D.C. Composition of volatiles of banana cultivars from Madeira island. Phytochem. Anal. 2003, 14, 82–90. [Google Scholar] [CrossRef]
  14. Rizzolo, J.; Polesello, A.; Teleky-Vamossy, G. CGC/Sensory analysis of volatile compounds developed from ripening apple fruit. J. High Resolut. Chrom. 1989, 12, 824–827. [Google Scholar] [CrossRef]
  15. Holland, D.; Larkov, O.; Bar-Yaákov, I.; Bar, E.; Zax, A.; Brandeis, E. Developmental and varietal differences in volatile ester formation and acetyl-CoA: Alcohol acetyl transferase activities in apple (Malus domestica Borkh.) fruit. J. Agric. Food Chem. 2005, 53, 7198–7203. [Google Scholar] [CrossRef] [PubMed]
  16. Tsanova-Savova, S.; Fany, R.; Maria, G. (+)- Catechin and (-) Epicatechin in Bulgarian Fruits. J. Food Comp. Anal. 2005, 18, 691–698. [Google Scholar] [CrossRef]
  17. Schieber, A.; Petra, K.; Reinhold, C. Determination of phenolic acids and flavonoids of apple and pear by high-performance liquid chromatography. J. Chromatogr. 2000, 910, 265–273. [Google Scholar] [CrossRef]
  18. Dieguez, S.C.; Lois, L.C.; Gomez, E.F.; de Ia Pena, M.L.G. Aromatic composition of the Vitis vinifera grape Albariño. Lebensm. Wiss. Und. Technol. 2003, 36, 585–590. [Google Scholar] [CrossRef]
  19. Aubert, C.; Baumann, S.; Arguel, H. Optimisation of the analysis of flavour volatile compounds by liquid-liquid microextraction (LLME). Apllication to the aroma analysis of melons, peaches, grapes, strawberries, and tomatoes. J. Agric. Food Chem. 2005, 53, 8881–8895. [Google Scholar] [CrossRef] [PubMed]
  20. Perry, P.L.; Wang, Y.; Lin, J.M. Analysis of honeydew melon (Cucumis melo var. Inodorus) flavor and GC/MS identification of (E,Z)-2,6-nonadienyl acetate. Flav. Frag. J. 2009, 24, 341–347. [Google Scholar] [CrossRef]
  21. Portnoy, V.; Benyamini, Y.; Bar, E. The molecular and biochemical basis for varietal variation in sesquiterpene content in melon (Cucumis melo L.) rinds. Plant Mol. Biol. 2008, 66, 647–661. [Google Scholar] [CrossRef] [PubMed]
  22. Aubert, C.; Pitrat, M. Volatile compounds in the skin and pulp of Queen Anne’s pocket melon. J. Agric. Food Chem. 2006, 54, 8177–8182. [Google Scholar] [CrossRef] [PubMed]
  23. Hui, Y.H. Handbook of Fruit and Vegetable Flavours; John Wiley & Sons: Hoboken, NJ, USA, 2010. [Google Scholar]
  24. Utama, I.; Made, S.; Wills, R.B.H.; Ben-yehoshua, S.; Kuek, C. In vitro efficacy of plant volatiles for inhibiting the growth of fruit and vegetable decay microorganisms. J. Agric. Food Chem. 2002, 50, 6371–6377. [Google Scholar] [CrossRef]
  25. Grohmann, K.; Baldwin, E.; Buslig, B. Production of ethanol from enzymatically hydrolyzed orange peel by the yeast Saccharomyces cerevisiae. Appl. Biochem. Biotechnol. 1994, 45–46, 315–327. [Google Scholar] [CrossRef] [PubMed]
  26. Mizuki, E.; Akao, T.; Saruwatari, T. Inhibitory effect of citrus Unshu peel om anaerobic digestion. Biol. Wastes 1990, 33, 161–168. [Google Scholar] [CrossRef]
  27. Martin, M.A.; Siles, J.A.; China, A.F.; Martin, A. Biomethanization of orange peel waste. Bioresour. Technol. 2010, 101, 8993–8999. [Google Scholar] [CrossRef] [PubMed]
  28. Youngsukkasem, S.; Akinbomi, J.; Rakshit, S.; Taherzadeh, M.J. Biogas production by encased bacteria in synthetic membranes: Protective effects in toxic media and high loading rates. Environ. Technol. 2013, 34, 2077–2084. [Google Scholar] [CrossRef] [PubMed]
  29. Wikandari, R.; Youngsukkasem, S.; Millati, R.; Taherzadeh, M.J. Performance of semi-continuous membrane bioreactors in biogas production from toxic feedstock containing D-limonene. Bioresour. Technol. 2014, 170, 350–355. [Google Scholar] [CrossRef] [PubMed]
  30. Pan, J.; Zhang, R.; el-Mashad, H.M.; Sun, H.; Yimg, Y. Effect of food to microorganism ratio on biohydrogen production from food waste via anaerobic fermentation. Int. J. Hydrog. Energy 2008, 33, 6968–6975. [Google Scholar] [CrossRef]
  31. Liu, D.; Zeng, R.J.; Angelidaki, I. Hydrogen and methane production from household solid waste in the two-stage fermentation process. Water Res. 2006, 40, 2230–2236. [Google Scholar] [CrossRef] [PubMed]
  32. Kim, S.H.; Han, S.K.; Shin, H.S. Optimization of continuous hydrogen fermentation of food waste as a function of solids retention time independent of hydraulic retention time. Process Biochem. 2008, 43, 213–218. [Google Scholar] [CrossRef]
  33. Chu, C.F.; Xu, K.Q.; Li, Y.Y.; Inamori, Y. Hydrogen and methane potential based on the nature of food waste materials in a two-stage thermophilic fermentation process. Int. J. Hydrog. Energy 2012, 37, 10611–10618. [Google Scholar] [CrossRef]
  34. Lin, C.; Lay, C. A nutrient formulation for fermentative hydrogen production using anaerobic sewage sludge microflora. Int. J. Hydrog. Energy 2005, 30, 285–292. [Google Scholar] [CrossRef]
  35. Demirel, B.; Scherer, P. Trace element requirements of agricultural biogas digesters during biological conversion of renewable biomass to methane. Biomass Bioenergy 2011, 35, 992–998. [Google Scholar] [CrossRef]
  36. Demirel, B.; Scherer, P. Production of methane from sugar beet sludge without manure addition by a single stage anaerobic digestion process. Biomass Bioenergy 2008, 32, 203–209. [Google Scholar] [CrossRef]
  37. Pobeheim, H.; Munk, B.; Johansson, J.; Guebitz, G.M. Influence of trace elements on methane formation from a synthetic model substrate for maize silage. Bioresour. Technol. 2010, 101, 836–839. [Google Scholar] [CrossRef] [PubMed]
  38. Thauer, R.K.; Jungermann, K.; Decker, K. Energy conservation in chemotrophic anaerobic bacteria. Microbiol.Mol. Biol. Rev. 1977, 41, 100–180. [Google Scholar]
  39. Dohanyos, M.; Kosova, B.; Zabranska, J.; Grau, P. Production and utilization of volatile fatty acids in various types of anaerobic reactors. Water Sci. Technol. 1985, 17, 191–205. [Google Scholar]
  40. Vardar, S.G.; Maeda, T.; Wood, T.K. Metabolically engineered bacteria for producing hydrogen via fermentation. Microb. Biotechnol. 2008, 1, 107–125. [Google Scholar] [CrossRef] [PubMed]
  41. Thauer, R.K. Limitation of microbial H2-formation via fermentation. In Microbial Energy Conversion; Schlegel, H.G., Barnea, J., Eds.; Pergamon Press: New York, NY, USA, 1977. [Google Scholar]
  42. Hawkes, F.R.; Hussy, I.; Kyazze, G.; Dinsdale, R.; Hawkes, D.L. Continuous dark fermentative hydrogen production by mesophilic microflora: Principles and progress. Int. J. Hydrog. Energy 2007, 32, 172–184. [Google Scholar] [CrossRef]
  43. Hawkes, F.R.; Dinsdale, R.; Hawkes, D.L.; Hussy, I. Sustainable fermentative hydrogen production: Challenges for process optimisation. Int. J. Hydrog. Energy 2002, 27, 1339–1347. [Google Scholar] [CrossRef]
  44. Ren, N.; Li, J.; Li, B.; Wang, Y.; Liu, S. Biohydrogen production from molasses by anaerobic fermentation with a pilot-scale bioreactor system. Int. J. Hydrog. Energy 2006, 31, 2147–2157. [Google Scholar] [CrossRef]
  45. Buyukkamaci, N.; Filibeli, A. Volatile fatty acid formation in an anaerobic hybrid reactor. Process Biochem. 2004, 39, 1491–1494. [Google Scholar] [CrossRef]
  46. Hallenbeck, P.C.; Benemann, J.R. Biological hydrogen production: Fundamentals and limiting processes. Int. J. Hydrog. Energy 2002, 27, 1185–1193. [Google Scholar] [CrossRef]
  47. Levin, D.B.; Pitt, L.; Love, M. Biohydrogen production: Prospects and limitations to practical application. Int. J. Hydrog. Energy 2004, 29, 173–185. [Google Scholar] [CrossRef]
  48. Polprasert, C. Organic Waste Recycling: Technology and Management; John Wiley & Sons: Chichester, UK, 1996. [Google Scholar]
  49. American Public Health Association Inc. (APHA). Standard Methods for the Examination of Water and Wastewater, 20th ed.; APHA: Washington, DC, USA, 1998. [Google Scholar]
  50. USDA National Nutrient Database for Standard Reference, Release 27; US Department of Agriculture, Agricultural Research Service, Nutrient Data Laboratory: Beltsville, MD, USA, August 2014.

