1. Introduction
Electric vehicles (EVs) are presented as an alternative to current internal combustion vehicles powered by fossil fuels. Increasing oil prices, greenhouse gas emissions and environmental concerns of citizens boost interest in this technology. Energy supply from power networks is required and the impact on the distribution grids in a massive EV integration scenario has to be analyzed in detail [
1]. Thus, studies about EV impact on power networks are needed to ensure the viability of the systems [
2–
4].
The EV charging demand model should allow the analysis of possible effects of this new demand supplied in present-day power networks.
In order to do so, an EV charging model should include specific characteristics for each case, such as mobility, and it should allow one to compare different cases. Moreover, it should consider probability distribution functions (PDF) to analyze the uncertainties of possible EV charges. In addition, this model should be designed to analyze the application of control strategies and enable their comparison.
Literature proposes models to calculate the demand with respect to vehicle, charging infrastructure, mobility, and social parameters. [
5–
9] use different parameters such as EV model, distance, and charging process among others to determine the EV charging demand.
1.1. EV Type
From the point of view of EV charging demand, EVs main characteristics are the vehicle type: Plug-in Hybrid Electric Vehicle (PHEV) or Battery Electric Vehicle (BEV), battery capacity, battery technology, EV range and energy consumption. Amjad
et al. [
10] expose an analysis about EV design considerations. Different authors only consider PHEV [
2,
3,
5,
11–
15]. Others only BEV [
16–
20] or a combination of both [
9,
21–
23]. Another option is to suppose average EV models, BEV and PHEV, with average characteristics like different authors do [
5,
6,
18]. Pang
et al. [
24] simulate only two representative EV models: Chevy Volt (PHEV) and Nissan Leaf (BEV) and Valsera
et al. [
17] simulate Mitsubishi i-MiEV (BEV) only.
Soares
et al. [
9] proposed a stochastic model with mobility variables, but the vehicle characteristics are determined by a Gaussian distribution with standard values for the capacity, energy consumption and charging power of EVs.
The majority of papers simplify the EV model selection, but the capacity and the energy consumption are significant variables to be considered. The model presented proposes using real EV models and their technical data to define the battery capacity and energy consumption of each EV model. Moreover, the probability of each EV model is based on sales forecasting [
25] to decide which EV model is more probable.
1.2. Battery and Charging Process
Regarding EV batteries, there are three variables linked: capacity (kWh), range (km) and energy consumption (kWh/km). [
19,
26] consider the battery characteristics of real models and [
15,
20,
27,
28] consider average battery characteristics. Moreover, it is important to take into account the relation between the power consumed and the State-of-Charge (SoC). Valsera
et al. [
17] determine a relation between EV model, battery characteristics (Li-ion, 50 Ah, 16 kWh and 330 V) and its charging process.
The charging process standards of IEC 61851 [
29] from Europe and SAE J1772 [
30] from the USA could also change the impact in the power system. Maitra
et al. [
22] compare the impact of each SAE standard. The voltage level in Europe for slow charges is 230 V and a maximum current of 16 or 20 A. In Belgium, houses have a protection up to 20 A [
31] and in Spain, the common protection is up to 16 A [
17]. Valsera
et al. use the power ratio of Mitsubishi i-MiEV when the initial SoC is 20% and the EV needs 4 h to reach 100%. Zhang
et al. [
32] use level 1 (120 V–15 or 20 A) in the studio located in the United States. To compare, Grenier
et al. [
33] use 230 V and 15 A and the study is located in New Zealand. The efficiency used in the studies is around 90%, as Collins
et al. proposed [
34] in 1983 and this assumption was recently confirmed by Shuang
et al. [
12] and Clement
et al. [
2,
35].
Different authors, such as Clement
et al. [
2] and Guo
et al. [
36], use constant power profiles. On the other hand, Maitra
et al. [
22] consider variable power during the charging profiles. Qian
et al. [
37] propose a charging process model which links the power of the charger and SoC. Gao
et al. [
38] link the SoC and the charging time. Different authors use the specific EV charging profile of a real EV. For example, Qian
et al. [
37] and Lojowska
et al. [
39] use the charging profile of the Nissan Altra EV with a battery of 29 kWh, while Multin
et al. [
40] use a three-phase charging profile of Opel Meriva, which has a battery of 16 kWh.
1.3. Charging Infrastructure
Charging infrastructure parameters include the EV charging point’s socket and availability to charge. The majority of works do not consider the EV infrastructure when calculating the EV charging demand. Inherent to this hypothesis is to neglect the effect of the queues at charging points by supposing there are enough charging stations, and the assumption of full compatibility between charging stations and EV connectors. Both could be reasonable in future scenarios with massive presence of EV, but could be a problem for fast chargers. García-Valle
et al. [
41] introduce the queue theory with exponential distribution function to simulate EV charging time and relate it to the maximum charging power of the EV.
1.4. Mobility
Mobility is the third key point of EV charging demand. There is a strong link between energy consumption of EV and urban mobility. For example, Keirstead
et al. [
42] reviewed the energy consumption in urban areas, including electric mobility.
Some authors employ the NHTS (National Household Travel Survey) to analyse the United States, such as [
21,
32,
36,
43–
45]. In the United Kingdom, studies use NTS (National Travel Survey) and UKTUS (United Kingdom Time Use Survey), for instance [
3,
46,
47]. In Germany, there is the MID (
Mobilität in Deutschland) which Schroeder
et al. [
48] and Loise [
20] apply. The MON (
Mobiliteitsonderzoek Nederland) is utilised by Dutch studies, as Lojowska
et al. [
39]. The DTU
Transport, DTU. Transportvaneundersøgelsen is used by Jull
et al. [
49] for a case study of Denmark. In the case of Spain, there are different databases, for example
Dades Bàsiques de Mobilitat 2008 for Barcelona city [
17] and
MOVILIA for the whole Spain [
50].
Metz [
27] makes use of the Deutsches Mobilitätspanel to simulate 1000 mobility of household profiles and this includes day and time of departure and arrival, travel distance, vehicle used, and destination. Loise [
20] makes projections of EV hourly charging profiles based on MID 2008.
The present work proposes that the reason of displacement be included to determine the destination and the instant of the day to displace. Due to that, it is possible to distinguish between professional and personal mobility.
1.5. Social
There are social variables related to the EV driver profile that could influence EV charging demand as GDP. Kelly
et al. [
43] analyze the EV charging demand considering the income, age and gender of drivers as well as the location (urban or rural). Sikai
et al. [
46] use the number of members of each household and the corresponding number of vehicles based on the UKTUS database. Valsera
et al. [
8] define the number of displacements, the number of houses, and the number of vehicles per house. The proposal of the present work is to combine these three approaches of the previous work to consider social aspects to calculate the EV charging demand.
1.6. Simulation Techniques
To define the characteristics of simulations, there are different details set out by each author. The first one is the data processing, after that the emulation of parameters and lastly, the driver behavior emulation.
Considering data processing, there are different types of simulation models to emulate the EV charging demand and the most used is agent-based. This type of model considers each EV driver autonomously defining the internal (e.g., energy consumption) and external (e.g., power demand to supply EV battery) variables. The bottom-up approach simulates the system coupling all the agents of the system. Different examples of agent-based and bottom-up approach studies are [
44,
51,
52]. On the other hand, the bottom-down approach simulates the EV driver behavior with the average parameters [
17,
22].
As concerns the emulation of parameters, some models use deterministic variables and others stochastic ones. The deterministic approach considers just average values of parameters and stochastic models use probability distribution functions. The Monte Carlo technique is used to simulate stochastic variables in many applications and it is also used in modeling load, EV charging demand and distributed generation to determine their variability. The majority of studies set out a deterministic approach, but some of them include stochastic variables such as [
3,
17,
20,
36,
39,
46,
47]. Some of them use Monte Carlo techniques to simulate the total demand.
EV driver behavior also influences the EV charging demand. This parameter is linked to time of day and location for EV charging, such as public stations between trips, at charging points at work or just home charging.
Venkatesan
et al. [
53] define user profiles related to estimated behavior in the function of mobility, current electricity price and price forecasting. Waraich
et al. [
51] use microsimulation techniques to emulate the driver behavior. Galus and Waraich [
54,
55] use MATSim (Multi-Agent Transport Simulation) and this tool allows the creation of more than a million connections between agents in transport issues. Balmer [
56] uses evolutionary algorithms; Hedegaard
et al. [
57] propose using the Balmorel program to include distribution network, district heating, optimization, taxes and geographical data.
[
58] proposes including the game theory to simulate the interaction between agents and including sale of electricity with V2G service. Smith
et al. [
59] use GPS data and EV metering to calculate the energy consumption and later to optimize the battery sizing of future PHEV.
The present work proposes combining some characteristics presented in literature. The methodology presented is a bottom-up approach to process the data with stochastic variables following the Monte Carlo formulation to emulate the parameters. And the driver behavior is defined in function of the range anxiety, the mobility needs and the energy price.
1.7. Power System Impact
Possible effects on power networks caused by EVs are related to power quality or grid saturation. The majority of studies analyze the voltage drop or transformer load, like Valsera
et al. [
8,
17]. Clement
et al. [
2] include Joule losses and Maitra
et al. [
22] include overloading and unbalances. Kleiwegt
et al. [
60] propose a methodology to detect overloads in the course of a year. Moreover, vehicle-to-grid possibility is analyzed in many studies such as [
26,
61,
62]. Another possible impact on the power system is economic and this is reviewed by Dallinger
et al. [
63]. The present work analyses the distribution network in terms of the HV/MV and MV/LV transformer capacities and the voltage of each node.
1.8. Contribution
The state-of-the-art analysis defined seven subjects to be determined in the EV charging demand problem formulation:
EV type and model: the majority of current models simplifies this aspect with one model or an averaged model to represent a group of models.
Battery and the corresponding charging process: according to the literature review, the main difference found in literature is the charging process. The most common simplification is to consider a constant power but the appropriate way is to consider the relation between the SoC and the power consumed.
Power infrastructure: the majority of articles consider the AC slow charging and the current limit depends in function on the country analyzed.
Mobility: the papers which consider it try to use the public data according to the country analysed.
Social: the majority of the papers do not consider any economic or social variables.
Simulation technique: the majority of papers take a bottom-down deterministic approach.analyzed
How to analyze the impact on the power system: the majority of EV charging models avoid this issue and some of them try to optimize the EV charges to reduce some negative consequences.
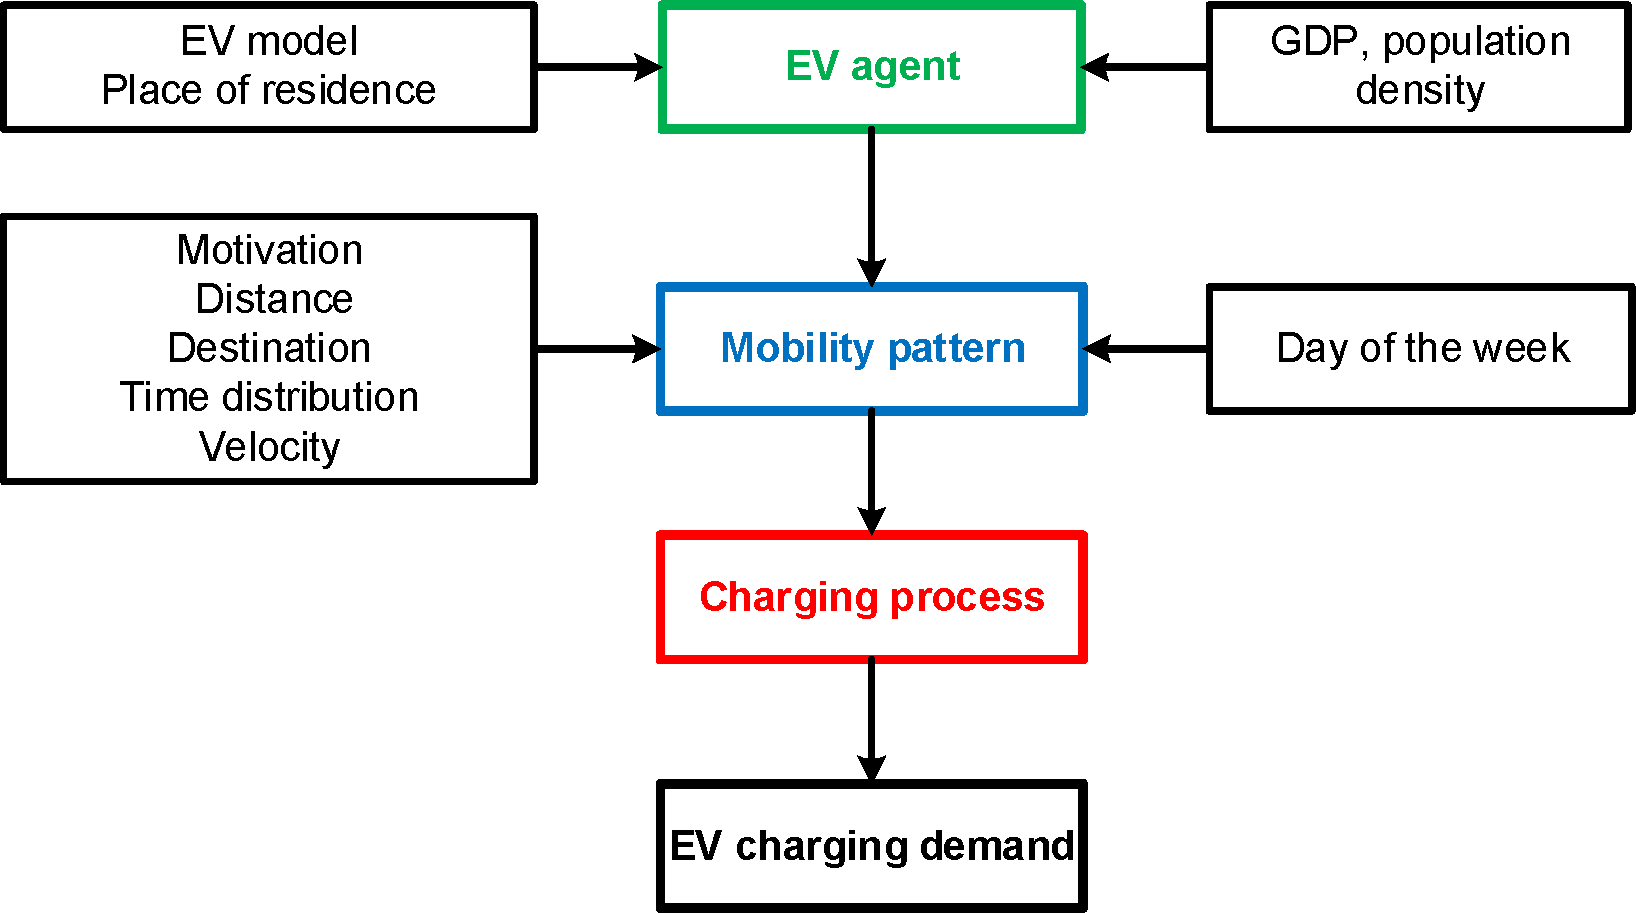
The objective of this paper is to define a methodology based on agents to determine EV charging demand. The main contribution of this paper is to propose a methodology based on open data and combining social, technical and economic variables to calculate the EV charging demand and then determine the effects on the distribution networks. To do so, the parameters in literature were used separately; however, this paper proposes that all of them be combined in a single model in order to obtain more precise and realistic results.
Figure 1 shows the relation among the variables that are implemented in the present model. For example, EV agents have a set of constant parameters as EV model (technical), place of residence (social), GDP (economic) and others, as well as variable parameters of mobility such as distance, day of the week and others.
Finally, the result of this methodology leads to the charging process model for each EV agent, the total EV charging demand and consequently, it allows the impact on power networks to be analyzed. The methodology proposed uses all sources from public data and it is applied using statistics from the city of Barcelona.
The EV charging demand model is defined as the electric demand from EVs during a certain time period, such as a day or week, to supply their batteries. EV charging demand depends on EV user driving needs and it is linked to EV characteristics and mobility of users.
The methodology proposed in this paper is the Agent-Based Modeling and Simulation (ABMS). The main strengths and applications of ABMS are listed as follows:
Heterogeneous individual components: EV model and mobility pattern of each EV owner.
Flexible systems: to manage the charging demand of each EV.
Influence of location: to consider the effects of the charging point location in the power network.
Representation of social interactions: different types of EV owners could have different influences on the total system.
For these reasons, this methodology has been used for obtaining EV mobility patterns with an heuristic approach [
64]. Furthermore, this methodology enables to simulate complex systems; for instance, load demand in power systems [
7] or virtual power plants to include different types of agents [
65]. Thus, agent-based modeling has been selected for this research.
In this work, the EVs are a set of agents that has been defined as autonomous entities with their attributes and their processes are dynamic and time-dependent [
66,
67]. It allows defining each EV driver as an agent considering the usage of each vehicle. Each agent is simulated individually including possible interactions through the relationships between agents. Section 2 describes the characteristics of the agent-based model to obtain the charging demand from EVs and their impact on the distribution network.
2. EV Charging Demand Model
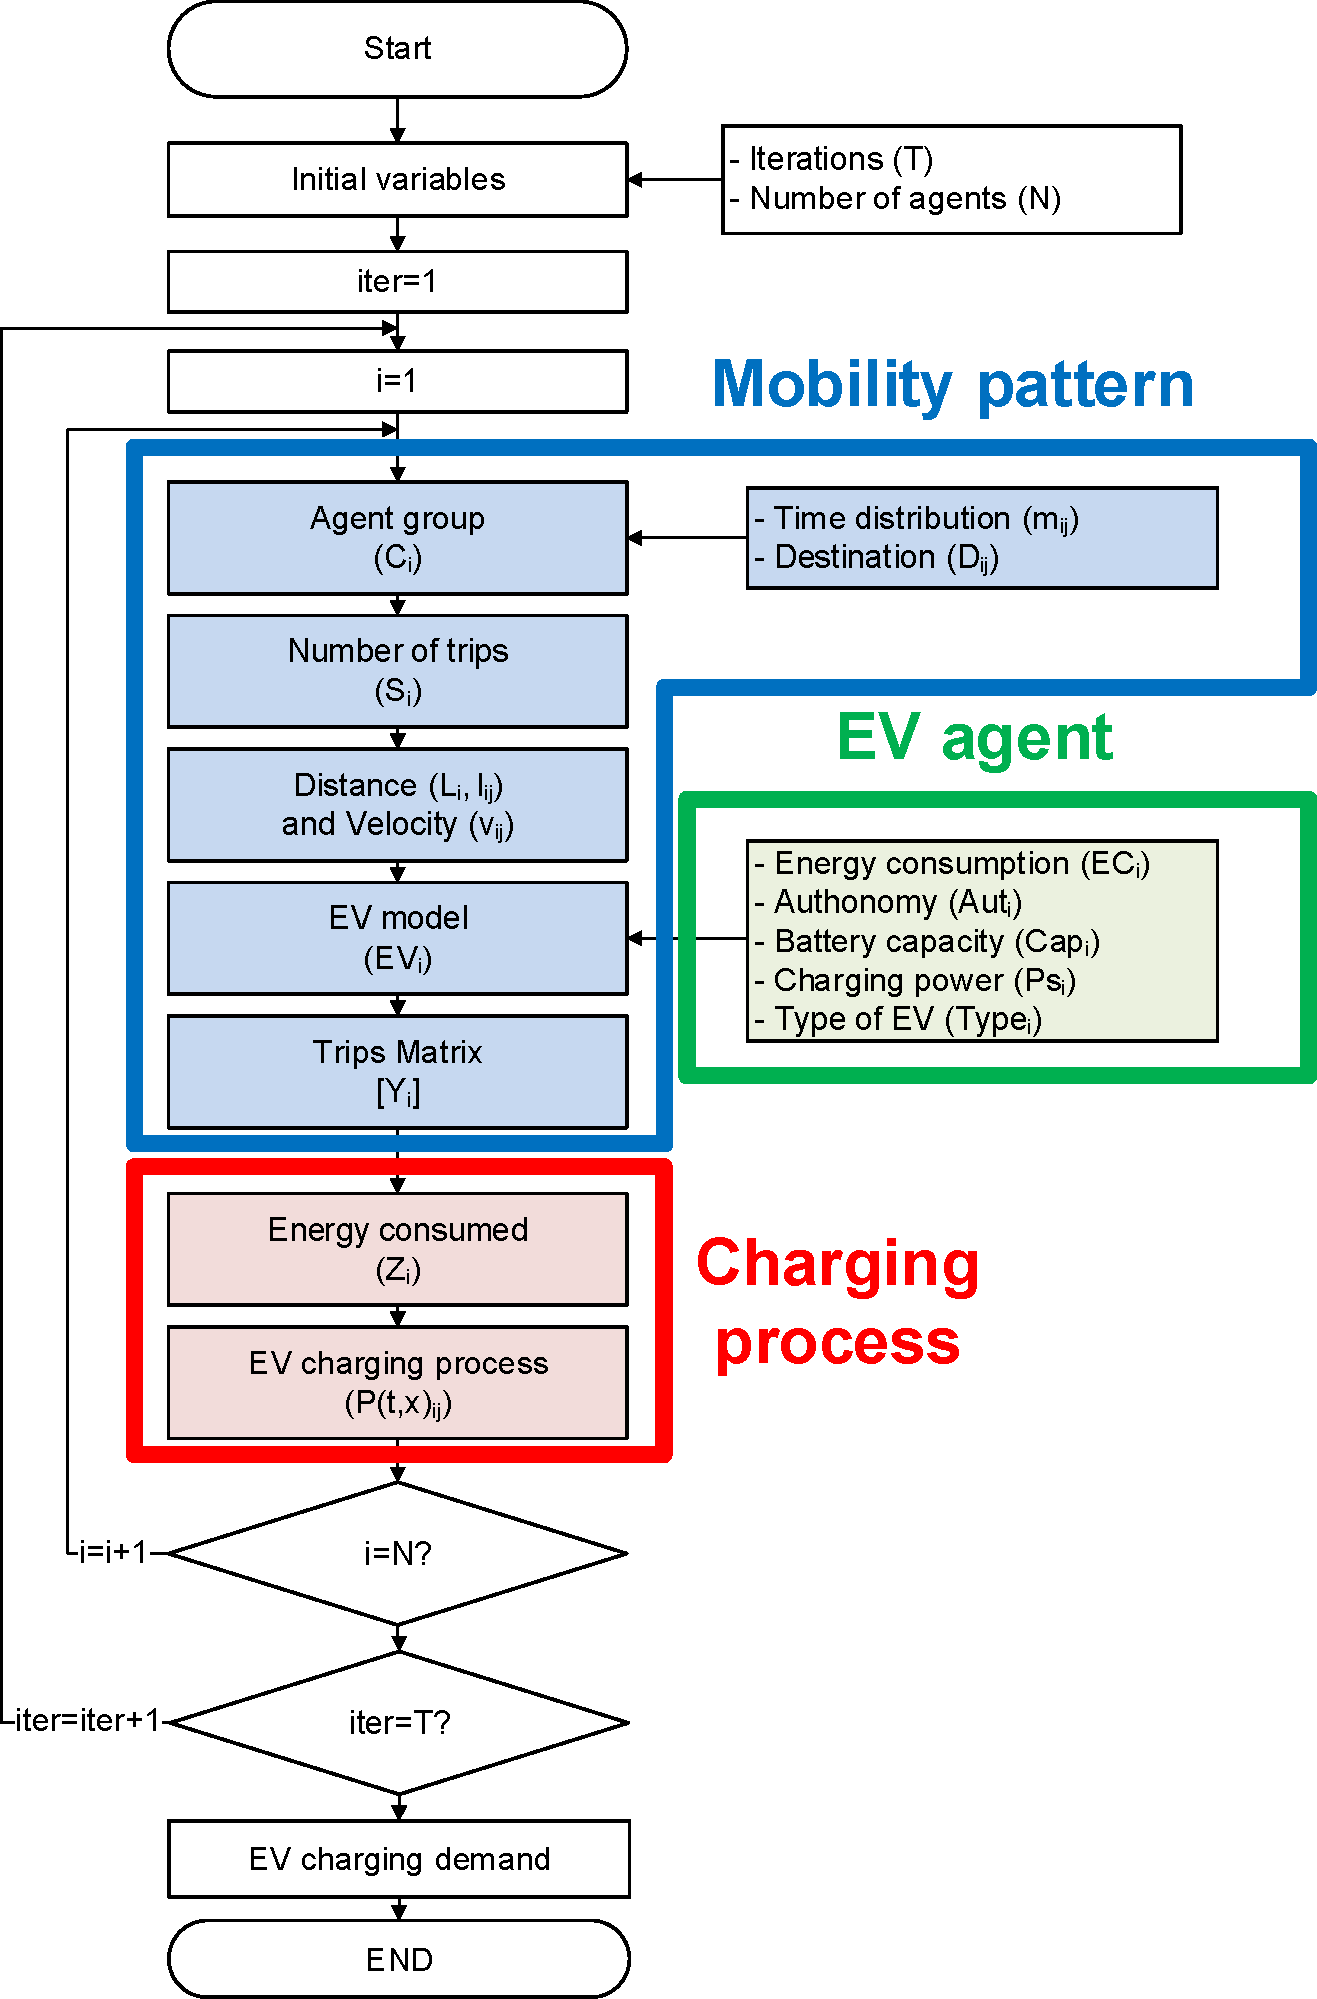
According to the
Figure 1, the parameters needed to model the EV charging demand can be clustered in three groups: the EV agent (Section 2.1), mobility pattern (Section 2.2) and the charging process (Section 2.3). All these parameters permit the determination of all charging processes needed to reach each destination.
2.1. EV Agent
In the model developed, every EV agent represents an EV driver and its vehicle. The EV agent attributes are the EV model, the mobility needs, and the charging preferences. The EV agent behaviors are the trips taken (mobility), their corresponding energy consumption from their battery, the energy consumed from the electricity network to charge the battery, and the charging decision. For instance, when EV agents reach their destination, their charging process begin depending on the EV agent preferences and the energy price. The EV agent states with their corresponding variables are: waiting, driving, and charging.
Moreover, there are two other agents that influence on EV agents behavior: the Electricity Retailer Agent, who determines the electricity price for each instant, and the EV Aggregator Agent, who control the EV charges to reduce the electricity price. In the scenarios A, B and C, explained in the Section 3, there is no EV aggregator and the price is determined by the Electricity Retailer Agent. In contrast, in the scenario D, also explained in Section 3, the price is determined by the EV Aggregator Agent and the Electricity Retailer Agent does not influence on EV agents.
The main rule is that each EV agent, after each trip, takes the decision of charging in function of the battery state-of-charge, the electricity price and, in scenario D, the signal from the EV aggregator. Moreover, before changing the state of an EV agent from waiting to driving state, it is necessary that the battery has enough energy to reach the destination. The EV agents structure, their relationships with other agents and their environment are shown in
Figure 2. Note that there are two environments related to the EV agents: spatial distribution and electricity network. Furthermore, the electricity market is the environment of Electricity Retailer Agent and EV Aggregator Agent.
When the simulation begins, the system computes the EV agent mobility needs and the battery state-of-charge variation.
The first step to define the EV agents is the definition of EV agent groups (
Ci) and their variables. For each group, it is necessary to define the number of agents (N), spatial distribution of influence and charging preferences. And the EV model of each agent is defined with variables
ECi,
Auti,
Capi,
Psi and
Typei. The place of residence, defined in
Ri, is considered for each agent, and this depends on the power network scenario and is modeled as a constant probability, based on public data such as [
68].
Ri is linked with the charging point in home usage.
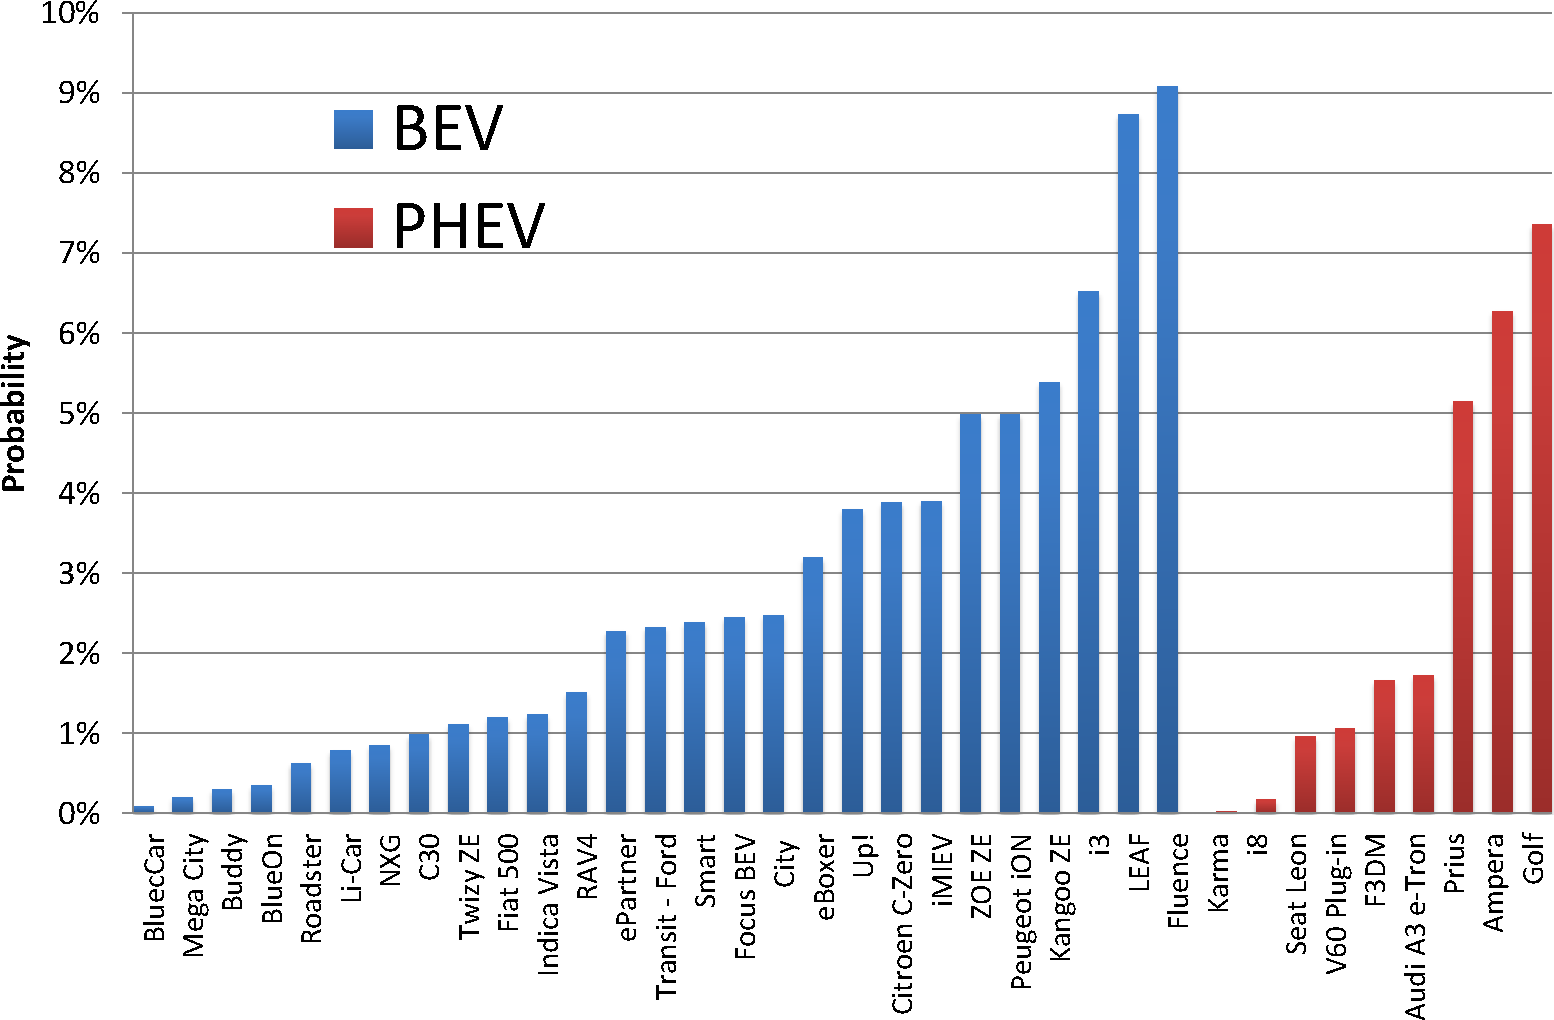
The PDF of each EV model is based on [
25] data and it just considers passenger vehicles and
Typei. This data was filtered for the case study in relation to EV model characteristics and technical data available from automakers. It is shown in
Figure 3.
In this model it is assumed that the PHEV drive is fully electric until the end of the energy stored in the battery, when they consume gasoline as hybrid electric vehicles. Other assumptions are exhibited in Section 2.4.
2.2. Mobility Pattern
Mobility variables are assigned to each EV agent in order to model its mobility behaviour. Different mobility patterns are based on open data sources. The variables considered to define a mobility pattern are defined as follows:
Trips per day (
Si). The total trips are determined using a probabilistic variable which is generated through a Poisson distribution function, which is defined as [
69] proposes with Poisson parameter (λ) of
Equation (1).
This parameter is based on the average statistic value. It should ensure at least two trips per day and is defined by
Equation (2).
In the present study analyzed,
trips/day are based on [
70].
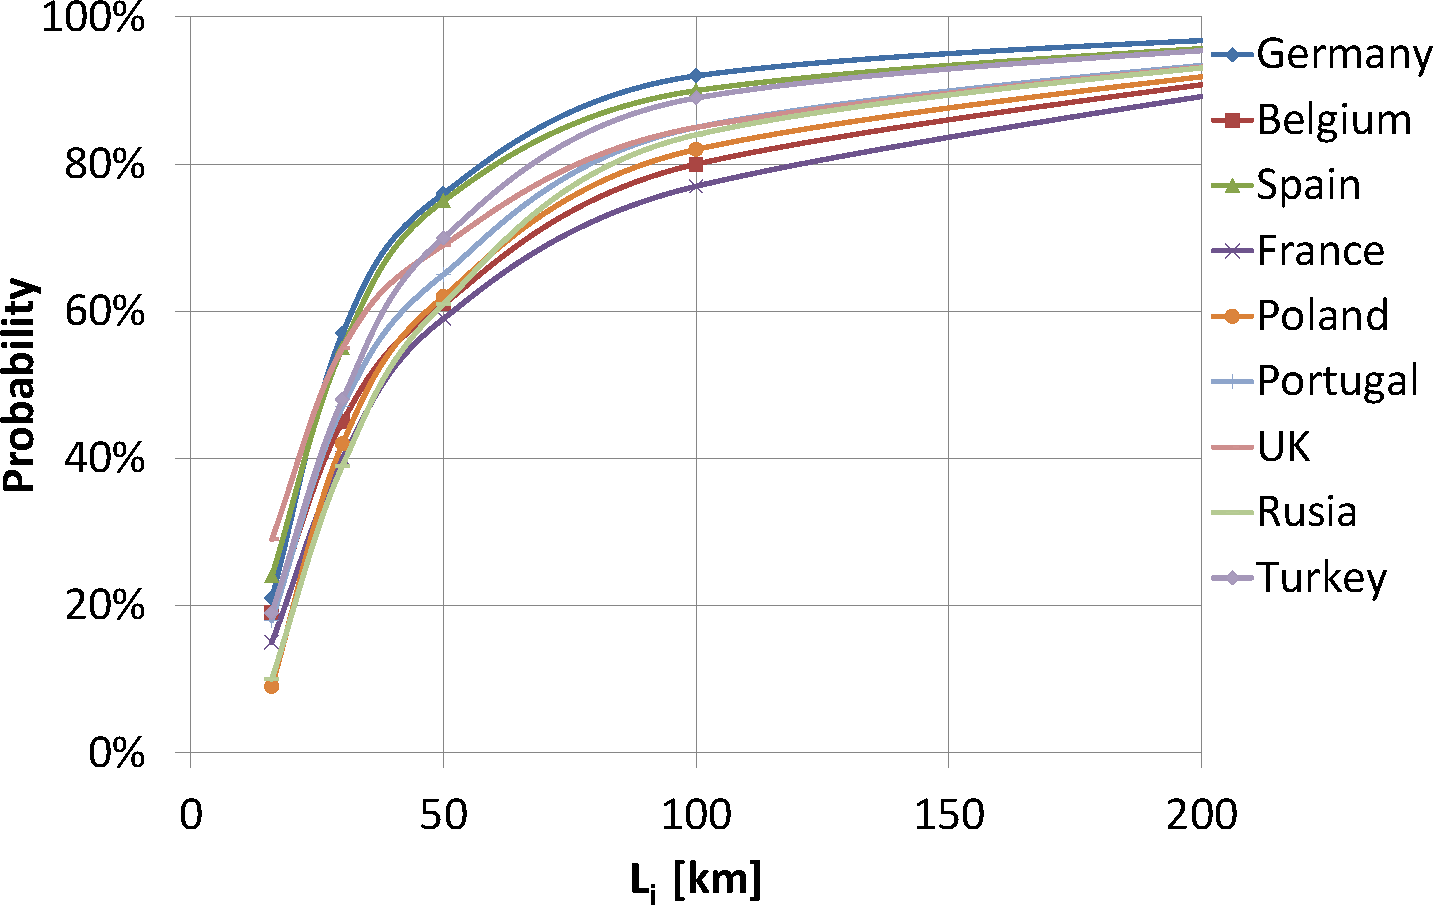
Distance (
Li) and
Distance per trip (
lij). They are calculated using the exponential distribution function from public reports.
Figure 4 shows cumulative exponential distribution functions of distance traveled per day from different countries and the relation between
Li and
lij is shown the following equation:
In the case study analyzed,
km/day is based on [
71]. If
lij > 10 km, the trip
j is considered as metropolitan considering Barcelona characteristics.
Destination (Dij). The model considers the reason of displacement to determine the destination. The reasons considered for the case study are based on the destination of each trip: for personal issues and for commuting. It is strongly linked to grid node, where the EV is connected in relation to social data and mobility pattern. The destination is modeled with a constant PDF according to the power network topology.
Day of the week (
di) and
Time distribution (
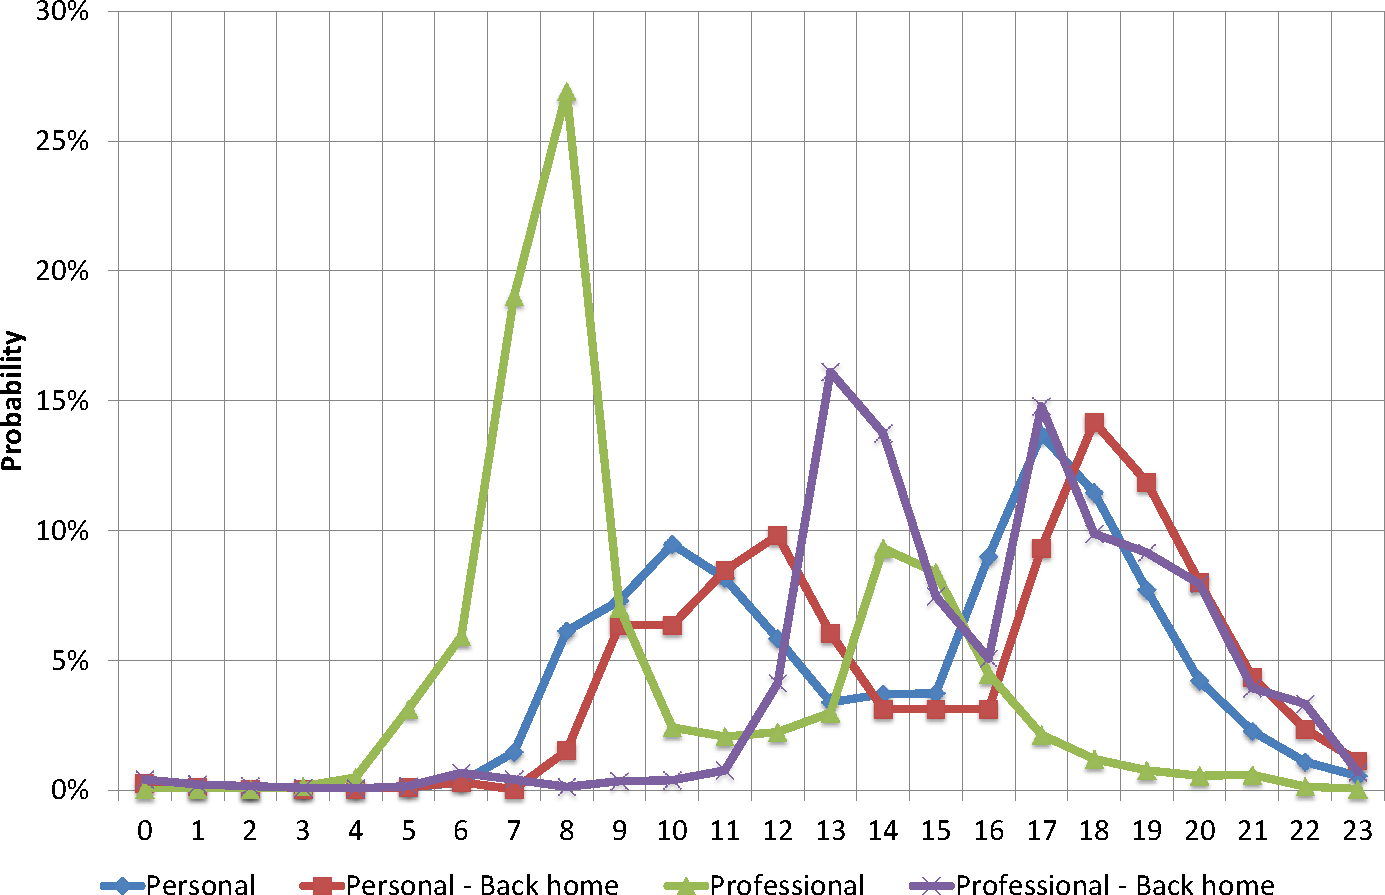
mij). These parameters allow knowing when an EV consumes energy as a function of the EV user’s motivation to travel on a specific day. It is implemented in a PDF, as shown in
Figure 5 and
Table 1 as an example applied in the case study.
Velocity (
vij). According to mobility data, velocity is modelled as a constant value, depending if the trip is urban or metropolitan. The average velocity from [
70] and
vurban = 22.2 km/h and
vmetrop = 59.3 km/h are applied.
Initial/Final time (
t0,
t1). The relation between them is the average velocity (
vij) and distance (
lij). Each pair of time variables is grouped in the matrix
Yi, which stores the mobility data of an EV agent.
Social variables. Regarding the case study, it is necessary to take into account different variables such as Gross Domestic Product (GDP) and population density to determine the total number of agents (N) that could charge the EV at the same connection point. Ci definition was described in Section 2.1 and applied in Section 3.1.
2.3. Charging Process
The charging process considered is slow charging—AC single-phase, depending on EV model, battery capacity, SoC, Energy required to arrive to next destination and time between displacements.
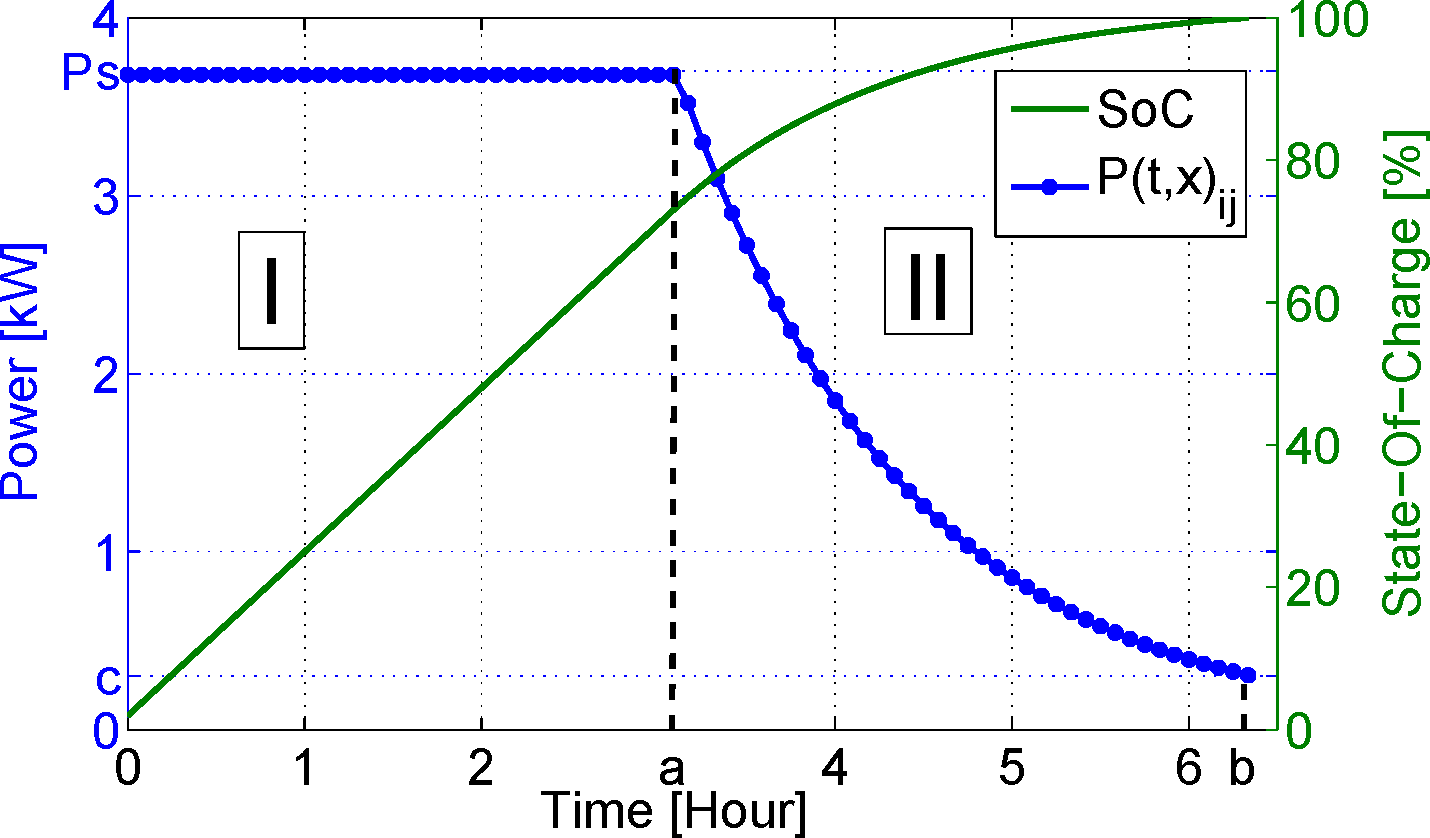
All the EV models are supposed to have Li-ion batteries and the slow charging process corresponds to a typical charging curve with two periods: constant period I and descendant period II [
72]. The power rate
Psi considered for charging is 3.7 kW (230 V, 16 A) because it is commonly available in residential and commercial areas in Europe [
73] and it is also used by Marra
et al. [
72]. The charging process depends on initial SoC and energy required (
Ereq) in the process.
Figure 6 shows the charging process of a battery with
Capi and
Ereq of 16.5 kWh.
In this model, it is assumed that period I requires 50% of time for a full charge and period II finishes when the power output reaches 8% of
Psi.
The equations of EV charging process described before are:
Period I is described by the following equations:
Period II is described by the following equations:
where:
The initial SoC depends on the EV agent consumption. In the first simulation, the battery starts fully charged.
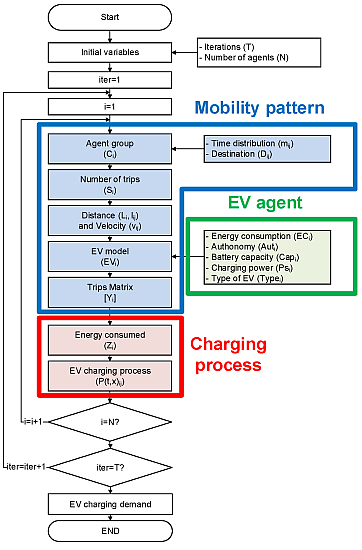
2.4. Monte Carlo Simulation
Based on
Figure 2, this paper proposes using the algorithm shown in
Figure 7 to calculate the EV charging demand in a certain power network. This algorithm is based on Monte Carlo Methodology to include stochastic variables per agent and they are:
Ri,
Si,
Li,
lij,
Di,
t0,
t1 and
EVi. For this reason, it is necessary to define the number of iterations (T). Furthermore, to start the algorithm, it is necessary to define the number of agents (N) that charge the EV in the network analyzed. The time step used is 5 min.
The algorithm is used to define the EV agent group, the mobility variables and then the charging process for each EV agent.
3. Case Study
The proposed EV charging demand model is applied in a case study with a 37-node IEEE test feeder adapted to a typical distribution network and mobility data of Barcelona (Spain) [
70]. The modeling of the case study was implemented in MATLAB and the power flow is solved by means of the Newton-Raphson method.
Four charging scenarios (A-D) were defined to model EV agent behavior, which are described in the following sections. The results are the energy (Zi) and charging demand from EVs (P(t, x)) and the voltage profile in the distribution network.
3.1. Distribution Network
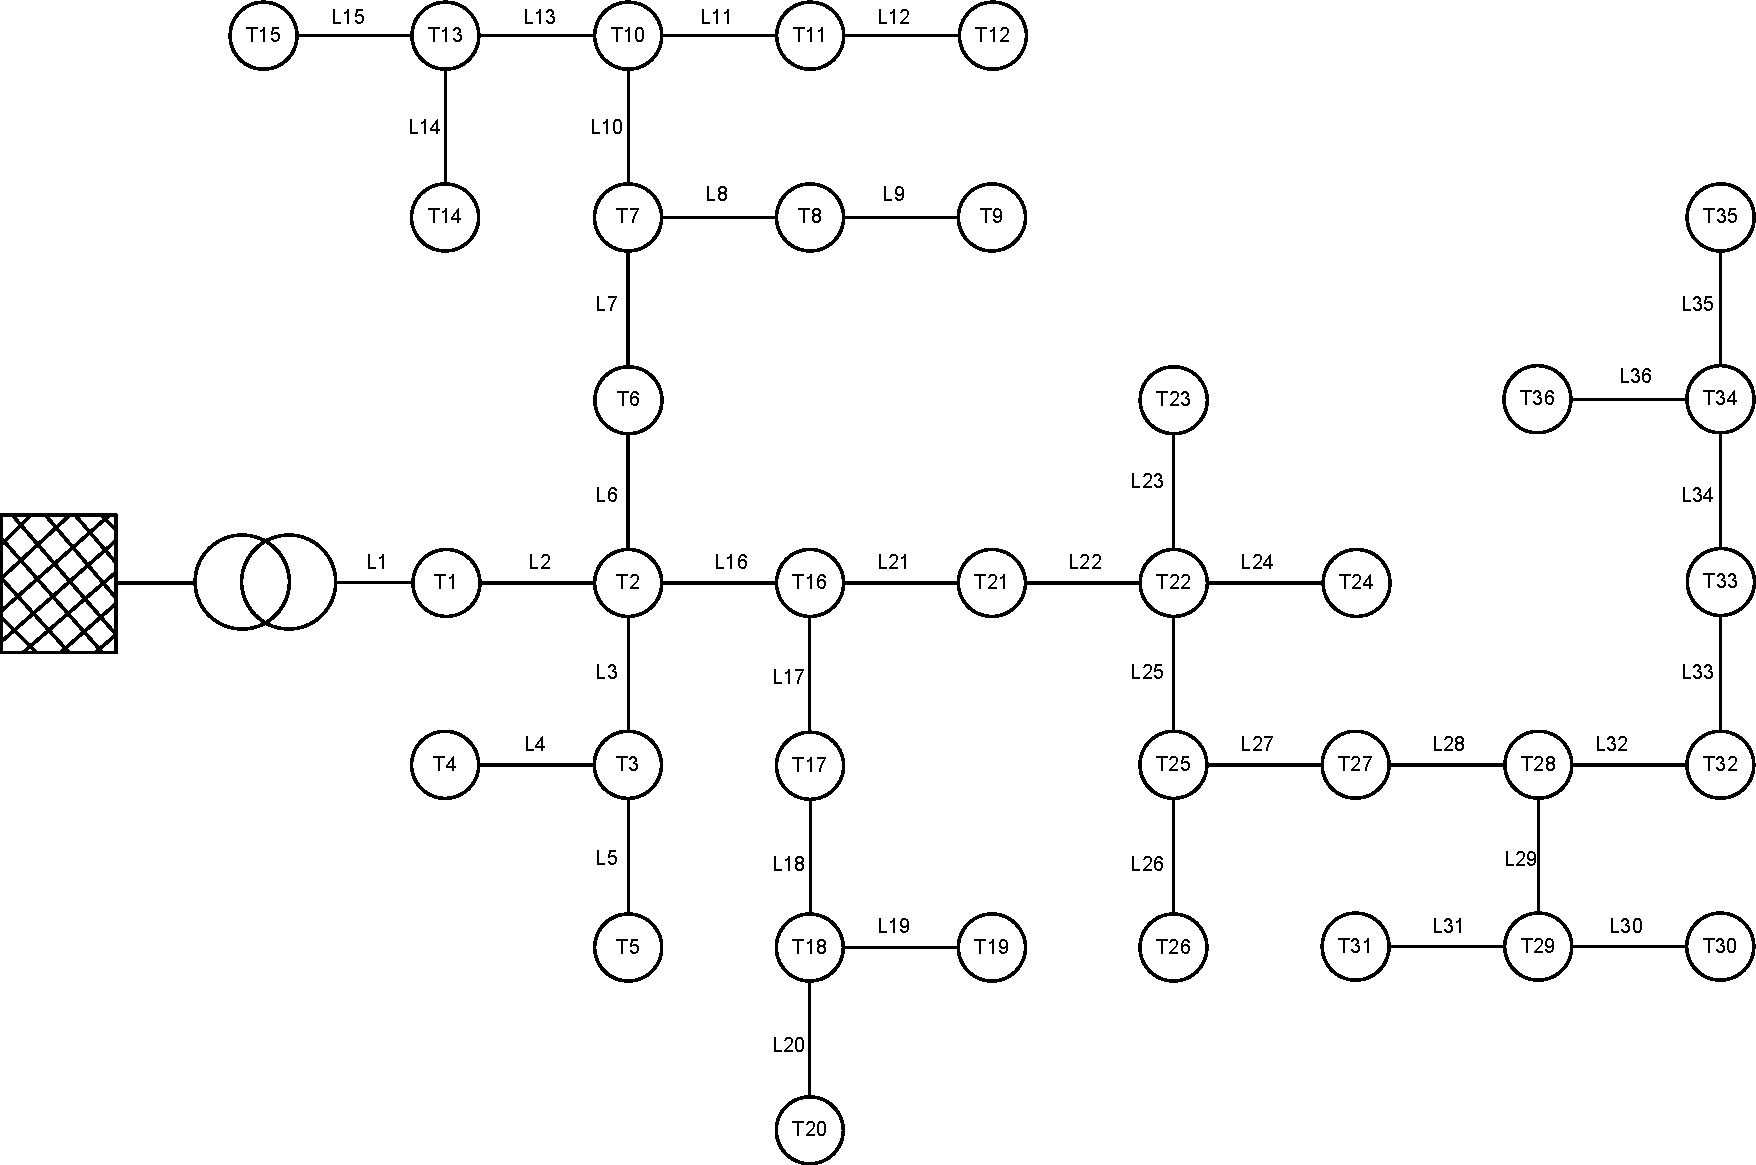
This case study is an adapted MV network 37-node IEEE test feeder, which is seen in
Figure 8, and it applies Barcelona’s mobility data. This network is adapted to a typical 25 kV MV network of Barcelona and the number of houses connected at the same MV/LV transformer [
8]. In order to do that, it is necessary to consider social variables such as population density and technical regulation [
74]. The maximum voltage drop permitted by the distribution system operator is 10% according to the EN 50160.
The total number of agents of group
Ci is defined in relation to network topology and population density of different neighborhoods. According to social data from Barcelona and network branches, there are three zones: high, medium and low inhabitants per house and vehicles per inhabitant density. The farthest branch is linked with the high density zone. In this way,
Dij of group
C1 at the end of the day is the corresponding network node. In Barcelona, 38% of vehicles are driven each day and this percentage is used to determine active vehicles [
70].
Table 2 shows calculations to get N of group C1.
Load demand: Base load demand in this distribution network is based on system operator data [
75] from national demand and it is adapted to network power capacity as 80% of HV/MV transformer power. Analyzing the consumption in Spain between 2007 and 2011, load demand used in the case study is from 17 December 2007, when the maximum energy demand reached 45,911 MWh between 18:00 and 19:00. This allows analyzing EV charging increase relative to this base load.
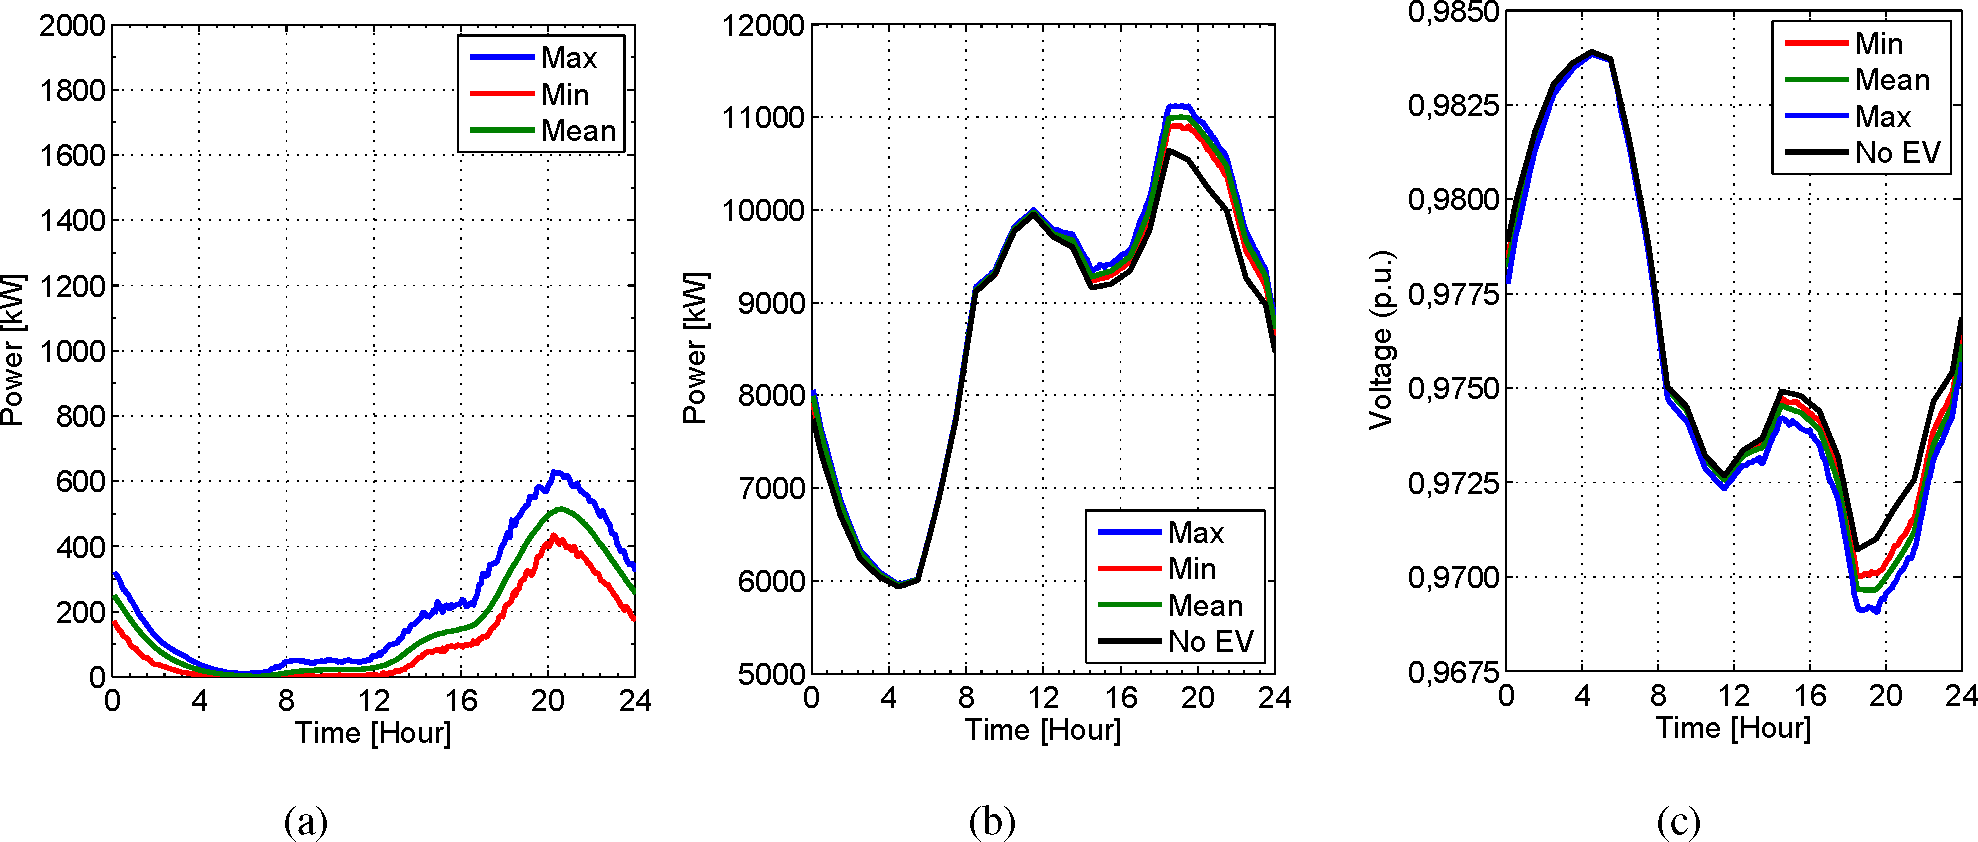
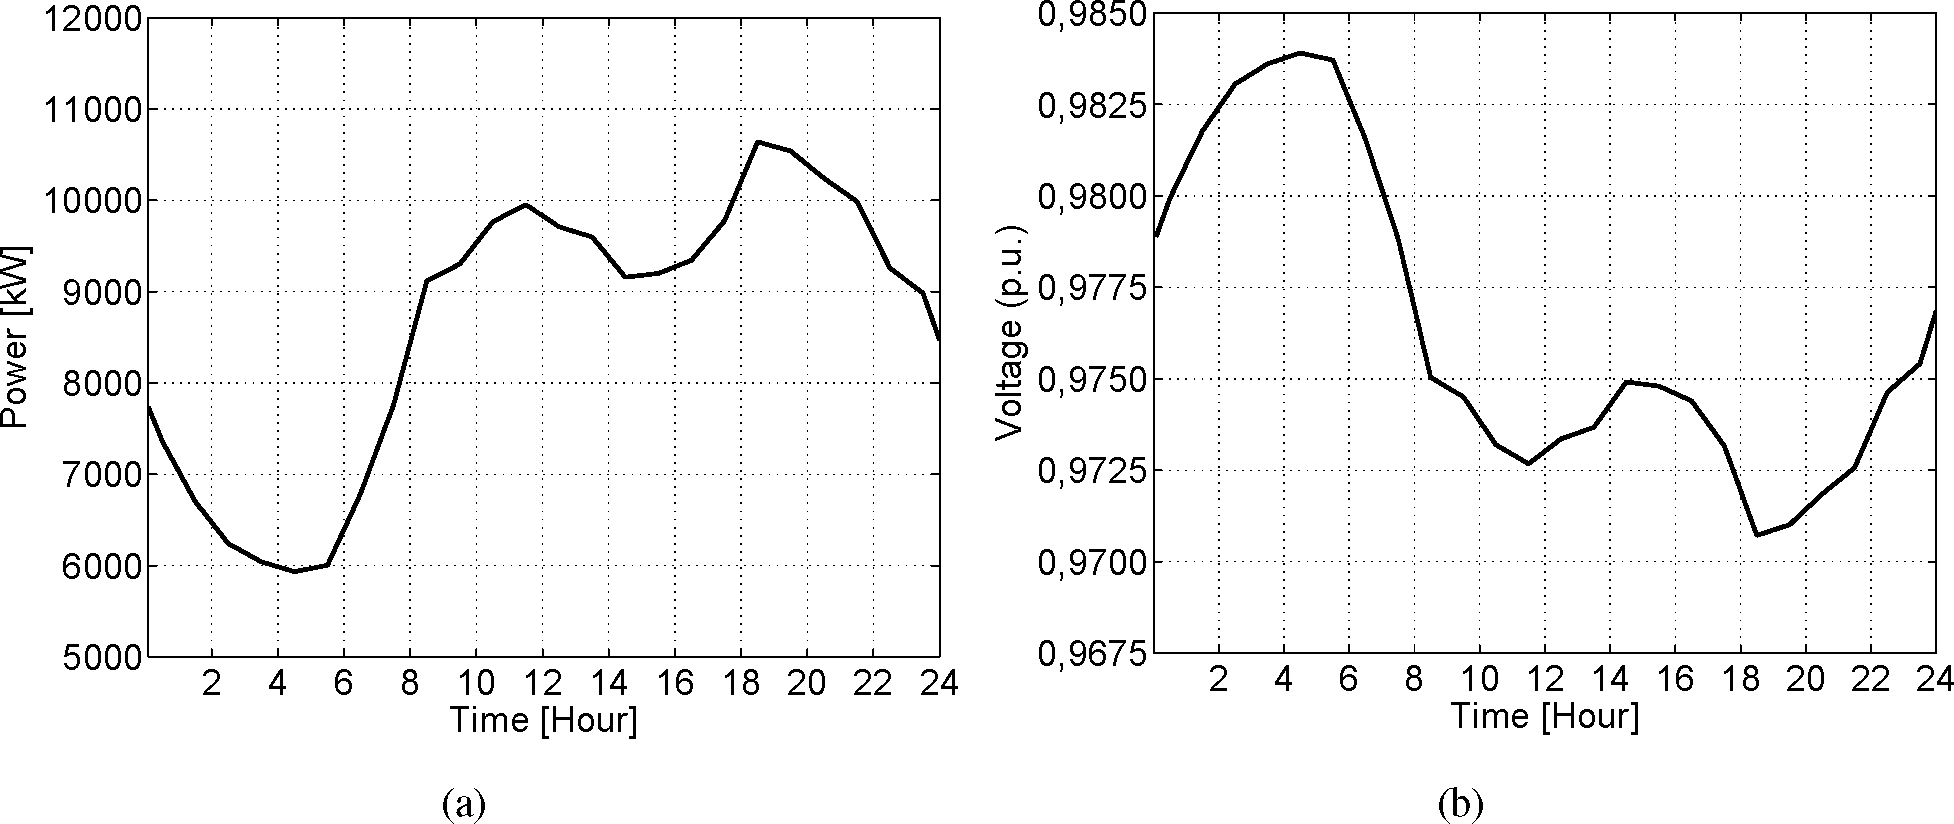
The load presented in
Figure 9a is the base case, without EVs, of the distribution system analyzed. The peak demand is 10,640 kW and it occurs at 18:30. The load demand of the distribution system increases during the morning (8–10 o’clock), decreases during lunch time (13–16 o’clock) and increases during the evening (19–21 o’clock), when people come back home. The peak period is 79% higher than the valley period and the energy consumed during the course of a single day is 207.36 MWh. The voltage in the worst node is shown in
Figure 9b; the minimum voltage is 0.9707 p.u. at 18:30 and the maximum is 0.9839 p.u. at 4:45. The voltage follows a similar behavior to the load demand. The lower limit of the voltage magnitude permitted by EN 50160 is 0.90 p.u.
3.2. Agent Profile
Six agent groups (C1–C6) were defined to consider mobility and residence. Mobility is divided between personal and professional reasons. According to the usual place where the EV is connected at the end of the day, three different areas of residence were defined: local, urban and metropolitan. Local area refers to the distribution network analyzed, urban refers to the city, and metropolitan is outside the city. Urban and metropolitan agents can plug in between displacements. On the other hand, local agents can charge at any time.
Table 3 shows the main characteristics of each group. N is the number of EVs of each agent that charge their batteries in the case study network.
Each group has specific energy requirements for charging (Ereq). Preferences are related to when to charge and they are described above relative to agent group definition. Regarding the Ereq for each feasible charge between displacements, it is defined as the energy required to reach the next destination (Dij) and distance (lij).
Mobility variables from Barcelona data [
70] are implemented in the case study.
Si depends on agent group,
di is the average weekday and
Li is according to [
71].
3.3. Charging Scenarios
According to agent preferences,
Ereq and electricity market assumptions, four scenarios of EV charging demand are described, shown in
Table 4.
Scenarios A and B consider constant electricity price for the whole day. In scenario A, EVs charge at the end of each trip due to the high range anxiety of EV agents. In scenario B, the EV agents have lower range anxiety and they charge the vehicle at home, when SoC is lower than 20% or lower than
Ereq. In scenario C it is considered that the EV agents have a Time-of-Use (TOU) tariff, special for EVs [
76]. The cheapest period of this tariff begins at 1:00 am, based on the Spanish regulation [
77], and then the EVs initiate the charge. The TOU tariff is an indirect control strategy to manage the EV charges. Scenario D considers one aggregator who manages all EV charges to consume the minimum power at the HV/MV transformer. This is based on an aggregator dedicated to reducing the impact in the transmission system, according to the Spanish regulation [
77]. This scenario shows a direct control strategy to manage the EV charges and the aggregator offers lower electricity prices for EV agents.
3.4. Results
The following discussion presents the results of the four scenarios simulated. The analysis is focused on the EV demand, total demand and the voltage drop in the worst node. Due to the probabilistic design of the model, the results are variable and the plots show the variation between the maximum and minimum energy consumption. Furthermore, the plots also show the average consumption as the most probable value.
All scenarios are simulated considering that 30% of active vehicles are electric (N), based on maximum scenarios in [
2,
22,
78].
EVi PDF is based on [
25]. What is also considered is that the EV agents with the value
Li greater than 100 km are only PHEV (
Typei).
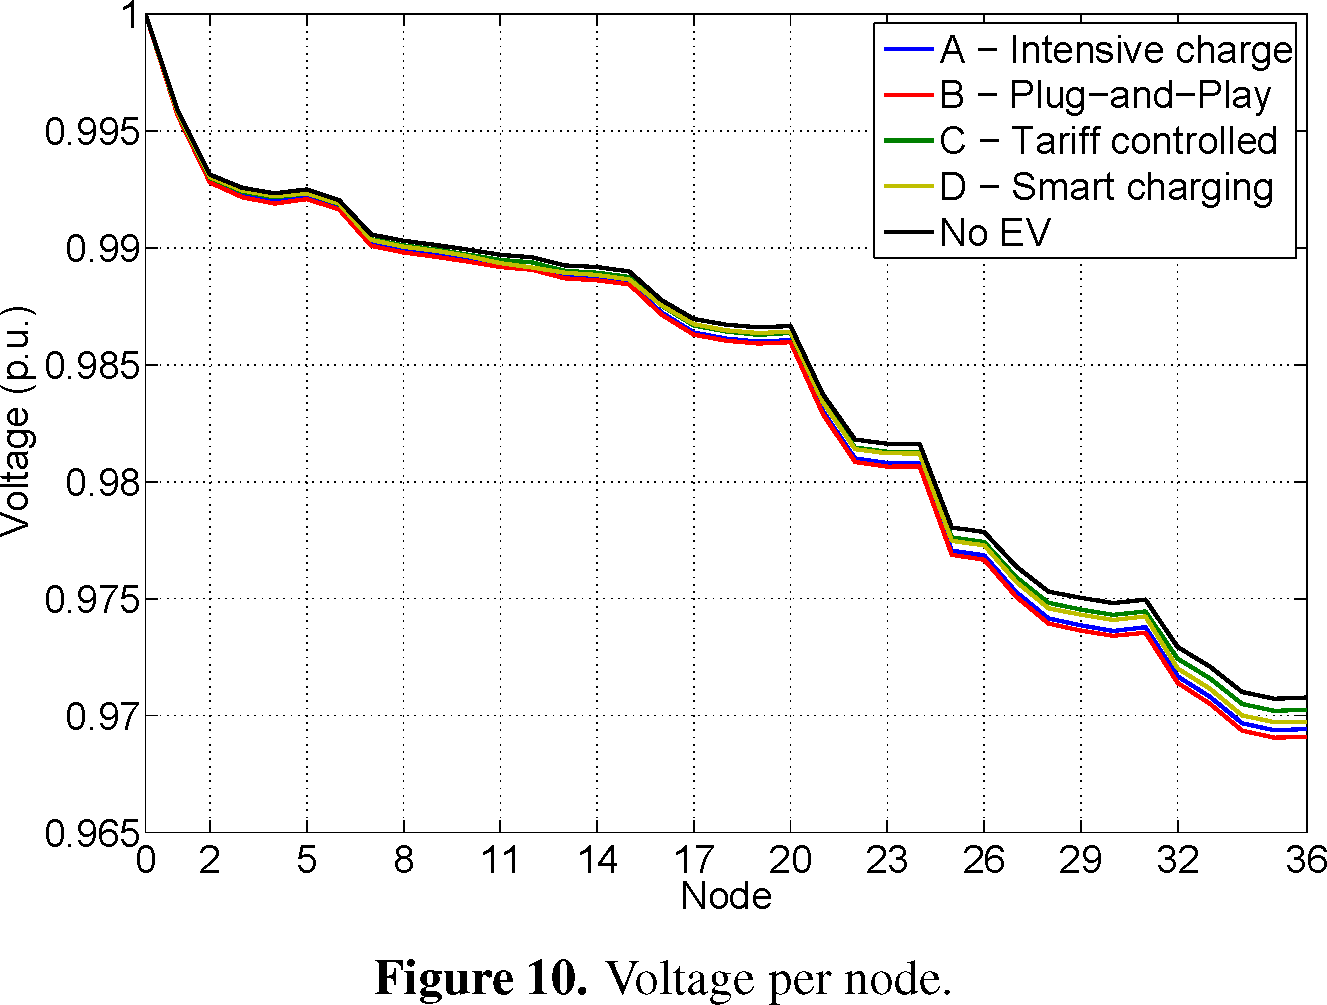
The impact on power system is analyzed through voltage drop located in the farthest node, which is the 35.
Figure 10 shows the minimum voltage per node during the whole day and the maximum voltage drop is located in node 35.
Iterations (iter). The standard deviations (std. dev.) of power demand are evaluated to determine the number of iterations (T) to obtain valid results. To do that, a simulation with 1200 iterations in scenario A for C1 group and with 30% of EVs was carried out.
Figure 11 shows the std. dev. around hour 21 and it varies during the first 100 iterations significantly; it is nearly stable from iteration 200 and is constant from iteration 600. The ideal should be to do 600 iterations for all the cases, but the computing time to do it is very high and the volume of results to be stored requires a huge amount of memory. For these reasons, it is not possible to simulate 600 iterations for all the scenarios and the number of iterations has to be lower. The std. dev. varies around 10 kW from iteration 100 and from iteration 200, the results are more stable than previously. According to this, the number of iterations applied in the case study is 200. Other instances and scenarios are also checked and they comply with the std. dev. analysis. The consumption variation is also checked and it behaves similarly to the std. dev.
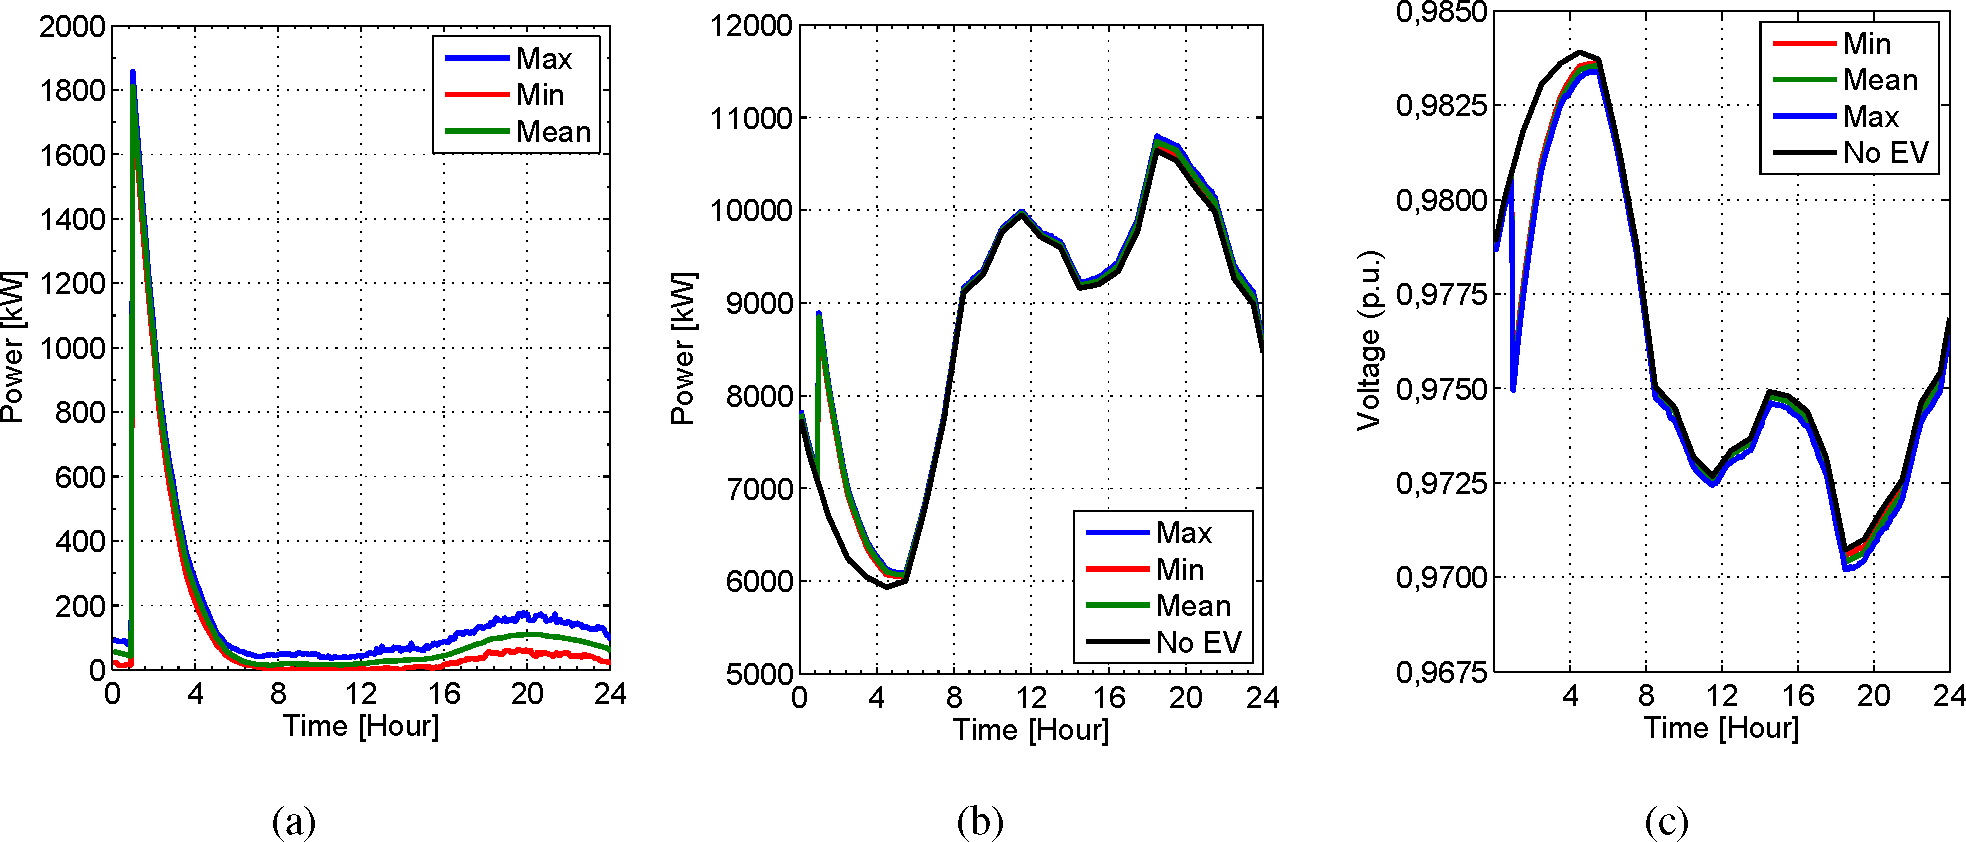
3.4.1. A—Intensive Charge
EV charging demand: As is shown in
Figure 12a, the EV charging demand presents two peaks with more consumption around 10:00 and 19:00. Both peaks are related to Barcelona’s mobility pattern illustrated in
Figure 5, which shows the same peaks: the peak during the morning is caused by professional mobility and the peak during the evening is caused by professional and personal back home reasons. The EV charging demand variability, the difference between the minimum and the maximum case, is significant in this scenario, and it can reach the 50% of the EV consumption as it occurs at 20:00.
The EV peak demand is near to 500 kW and the total peak demand is 11.04 MW, 3.75% higher than in the base case without EVs, as
Figure 12b demonstrates. Furthermore, the peak during the morning is coupled with the residential and commercial demand. This is reflected in
Figure 12b, where the active power increase is steeper from 6 to 12 hours due to the EV charging demand.
Impact on power system: Figure 12c shows that the minimum voltage in node 35 is 0.9694 p.u. and it is 0.13% lower than in the No EV case, which is higher than the lower limit of the standard of 0.9 p.u.
3.4.2. B—Plug-and-Play
EV charging demand: In this scenario, the EV agents prefer to charge at home, according to the back home time distributions (
mij). As shown in
Figure 13a, the first peak demand is lower than in scenario A because the agents do not charge at work. Moreover, the second peak demand is higher than before because the agents have not charged at work and the energy required by them is higher than in scenario A. In this scenario, the EV charging demand variability is also significant and it can reach the 33% of the EV consumption, as it occurs at 20:00.
As
Figure 13b shows, this effect causes that the peak during the morning in the total demand is lower than the previous case. And the peak during the evening is higher due to the energy required and the maximum power consumed is 11,12 MW at 18:35 and the relative increase from the case without EV is 4.51%. Moreover, the power consumption during the night is higher than in case A, because the SoC of EV agents when they arrive at home is lower than previously.
Impact on power system: Figure 13c shows that the combination of the peak from the residential demand with the EV demand causes a higher voltage drop than scenario A, due to the different behaviors of the EV agents. The minimum voltage reached during the peak demand is 0.9691 p.u., 0.16% lower than the case without EV, and higher than the lower limit of 0.90 p.u.
3.4.3. C—Tariff Controlled
EV charging demand: In this case, the TOU tariff causes that the EV agents begin to charge at 1:00, when the energy is cheaper. Therefore, the EV charging demand presents a peak of 1.86 MW at this moment due to the simultaneous EV charges, as seen in
Figure 14a. What is more, the control reduces the EV charging demand variability.
The consumption during the rest of the day is related to the energy required (Ereq) to reach the next destination (Dij) and the low SoC of each EV agent. The maximum power consumed is 10.8 MW at 18:30, which means an increase of 1.5% from the original case.
Figure 14b shows that this EV peak happens during the off-peak period and the total demand increase is not significant. Despite this, the power generation gradient could be a problem, which should be analysed from the point of view of the power generation and from the system stability point of view.
Impact on power system: The minimum voltage, shown in
Figure 14c, is similar to the original case without EVs. The minimum voltage reached is 0.9702 p.u., 0.05% lower than without EVs, and higher than 0.90 p.u. The voltage variation at 1:00 could be a problem, which could be analyzed in a transient analysis.
3.4.4. D—Smart Charging
EV charging demand: Figure 15a shows the EV charging demand controlled by the aggregator which controls domestic EV charges. The EV charging demand is shifted to the valley period to reduce the consumption through the HV/MV transformer and to minimize the impact on the transmission system. According to this, the EV charges occur between 2 and 8 o’clock and the variability, the difference between the minimum and the maximum case, is very small.
Figure 15b shows that the total demand increases during the valley periods and the power consumption is constant at 6.6 MW. During the rest of the day, sporadic charges could occur, but the mean curve is near to the case without EVs.
Impact on power system: The minimum voltage is not increased by the EV charges, as is exhibited in
Figure 15c. The voltage during the valley period is lower than in the original case according to the total demand, but this voltage is higher than during the peak hours, and the difference between the minimum voltages is 0.02%, and the minimum value of 0.90 p.u. is not reached.
The summary of all the scenarios is presented in
Table 5. Voltage value is the minimum and it means the maximum voltage drop.
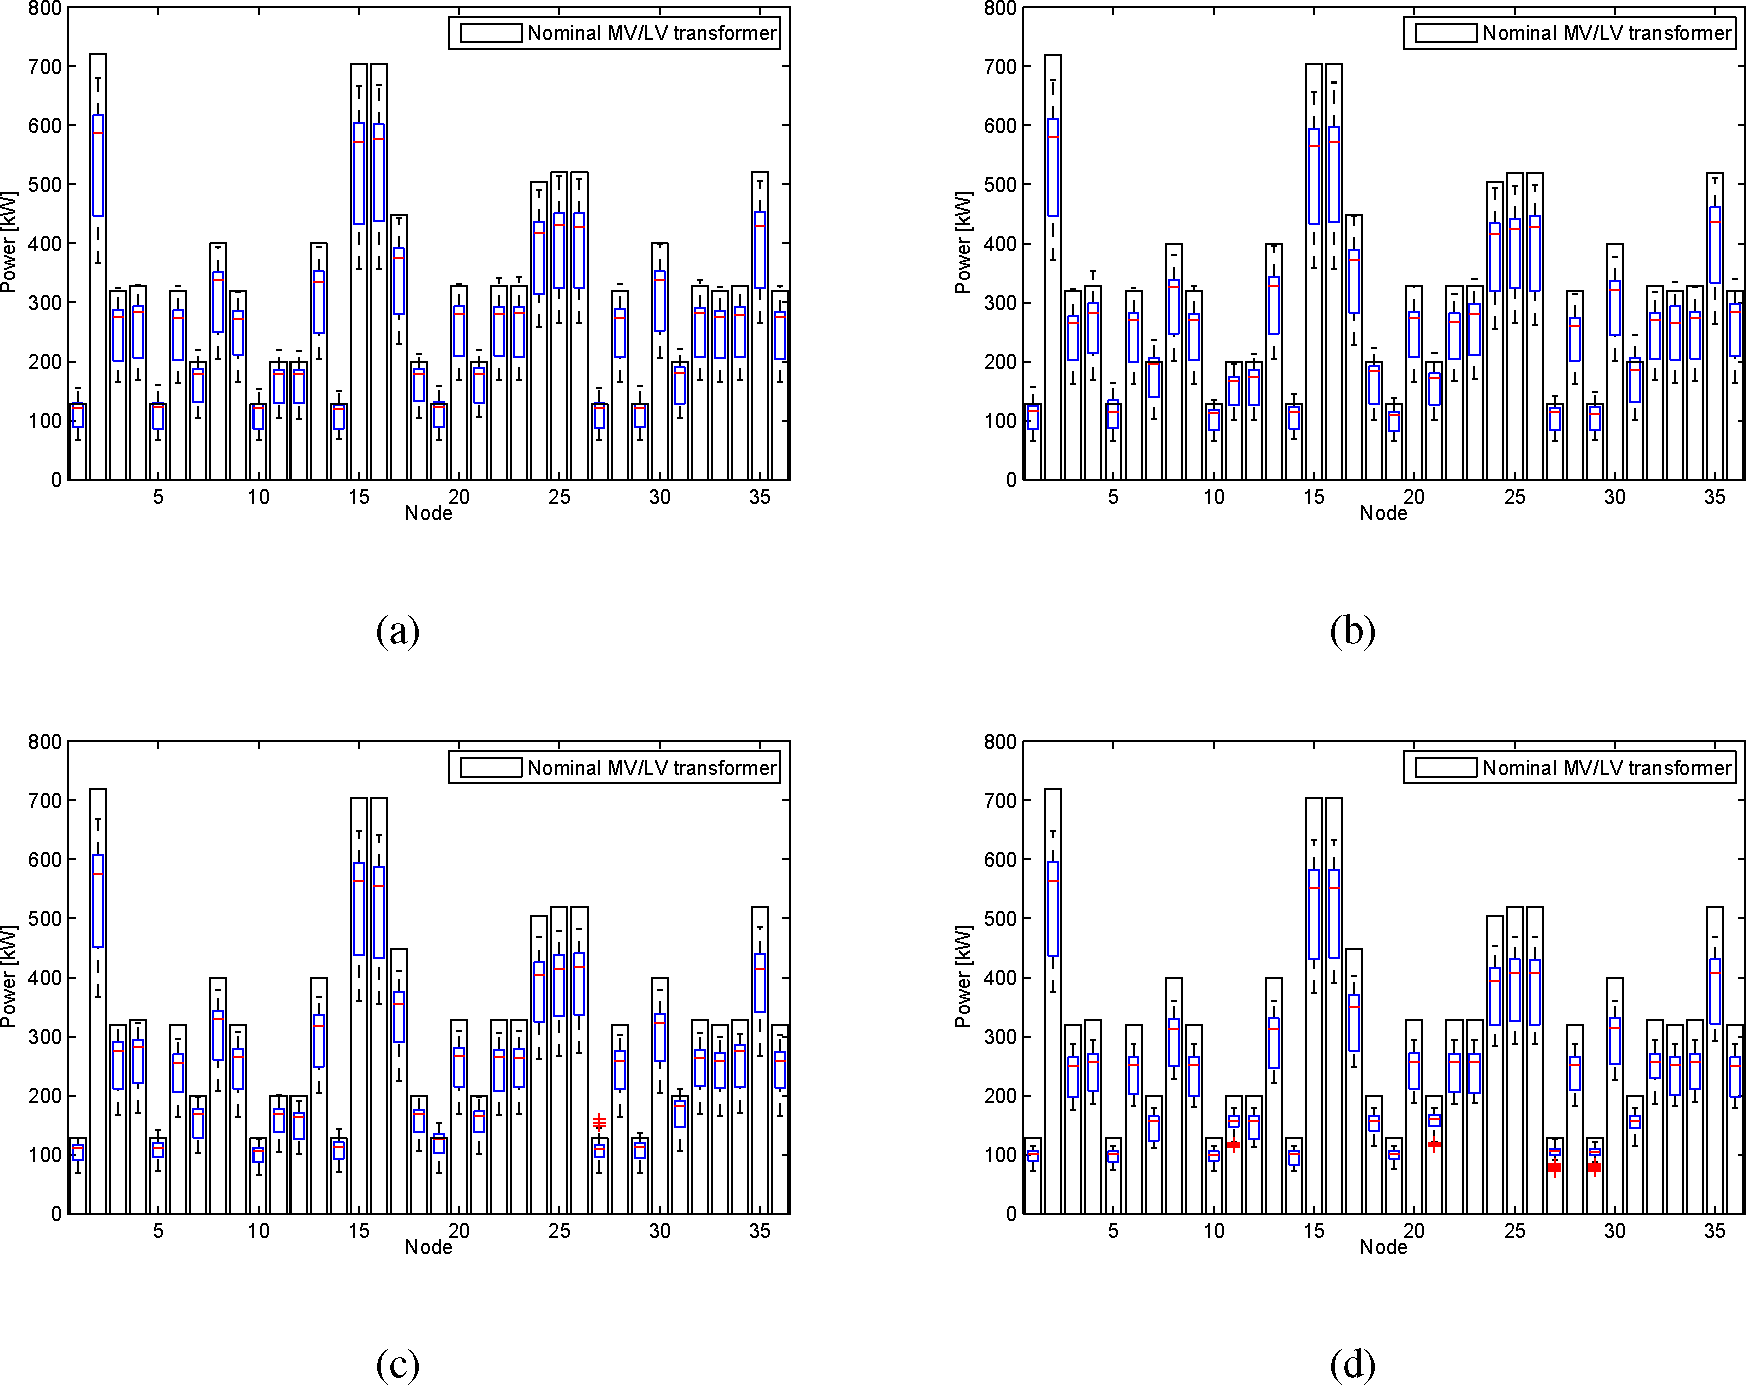
Box plots
Figure 16a–d show total consumption in each node and this is compared to MV/LV transformer capacity. The results show that the nodes with less capacity could reach the nominal value in some cases, but the average value is under nominal power. In the case of scenario D, total demand never exceeds the nominal capacity of transformers, which means that there is enough capacity to supply the EVs.
4. Conclusions
The probabilistic agent-based model (ABM) obtained in this paper allows the EV charging demand to be determined, taking into account different variables of EV characteristics such as battery capacity and energy consumption of each trip, economic and social attributes, mobility needs, and charging strategies of each agent. The model developed takes into account the interaction of these variables, allowing the obtainment of better accuracy in the results.
The probabilistic approach is useful to include the uncertainties related to the real behavior of EV users, like the time distribution and energy consumed on each trip. Therefore, the model permits the determination of the impact provoked on the grid by these uncertainties.
Moreover, the model proposed is a benchmark to compare case studies, such as different cities or areas in the same city. With this model, the weak regions of the grid or the areas with high EV density can be detected.
The case study presented shows that the uncertainties cause variability in the EV charging demand in scenarios without control on the EVs, as it is shown in scenarios A and B. In contrast, the consumption variability in scenarios with indirect and direct control on the EV charges, like scenarios C and D, respectively, is small.
The distribution feeder analyzed in the presented case study does not have a significant impact on the smart charging strategy (D) during the off-peak period and all EV agents can charge their EV. In contrast, some MV/LV transformers could exceed their nominal power in the scenarios without control. The voltage in all the scenarios is higher than the limit of 0.90 p.u. according to the EN 50160.
In further work, it could be very interesting to analyze the dynamic behavior of the system in case C during the connection of all EV at 1:00. Furthermore, the model permits analyzing the impact on distribution networks, but it can be applied for transmission and low voltage grids, too. Finally, this model could be applied and compared with a real distribution network with EVs to verify the accuracy of the model.
Nomenclature
| Auti | Autonomy |
| Capi | Battery capacity |
| Dij | Destination |
| EVi | EV model |
| iter | Iteration |
| Li | Distance |
| mij | Time distribution |
| Psi | Power supply |
| Si | Number of trips |
| Typei | Type of EV (BEV or PHEV) |
| Yi | Trips matrix |
| Ci | Agent group |
| di | Day of the week |
| ECi | Energy consumption |
| i | Agent |
| j | Trip |
| lij | Distance per trip |
| P(t, x)ij | Charging process |
| Ri | Place of residence |
| t0 | t1 Initial/Final time |
| vij | EV velocity |
| Zi | Energy consumed |
Acknowledgments
This research was co-financed by the Spanish Ministry of Economy and Competitiveness (MINECO) through the research project ENE2012-36337 “Micro redes con almacenamiento para la integración óptima de energías renovables y vehiculos electricos”. This project has received funding from the European Union’s Horizon 2020 research and innovation programme under grant agreement No 646476.
Author Contributions
Pol Olivella-Rosell, Roberto Villafafila-Robles and Andreas Sumper conceived the model; Pol Olivella-Rosell performed the simulations; Pol Olivella-Rosell, Roberto Villafafila-Robles, Andreas Sumper and Joan Bergas-Jané analysed the data; Pol Olivella-Rosell wrote the paper.
Conflicts of Interest
The authors declare no conflict of interest.
References
- Bullis, K. Could Electric Cars Threaten the Grid? In MIT Technology Review; Massachusetts Institute of Technology (MIT): Cambridge, MA, USA, 2013. [Google Scholar]
- Clement-Nyns, K.; Haesen, E.; Driesen, J. The Impact of Charging Plug-In Hybrid Electric Vehicles on a Residential Distribution Grid. IEEE Trans. Power Syst. 2010, 25, 371–380. [Google Scholar] [Green Version]
- Huang, S.; Infield, D. The impact of domestic Plug-in Hybrid Electric Vehicles on power distribution system loads, Proceedings of the 2010 International Conference on Power System Technology (POWERCON), Hangzhou, China, 24–28 October 2010.
- Villafafila-Robles, R.; Girbau-Llistuella, F.; Olivella-Rosell, P.; Sudria-Andreu, A.; Bergas-Jane, J. Assessment of the impact of charging infrastructure for electric vehicles on distribution networks, Proceedings of the 15th European Conference on Power Electronics and Applications, Lille, France, 2–6 September 2013.
- Watts, R.A.; Letendre, S. The Effects of Plug-in Hybrid Electric Vehicles on the Vermont Electric Transmission System, Proceedings of the Transportation Research Board 88th Annual Meeting, Washington, DC, USA, 11–15 January 2009.
- Soãres, J.; Canizes, B.; Lobo, C.; Vale, Z.; Morais, H. Electric Vehicle Scenario Simulator Tool for Smart Grid Operators. Energies 2012, 5, 1881–1899. [Google Scholar]
- Acha, S.; van Dam, K.H.; Shah, N. Modelling Spatial and Temporal Agent Travel Patterns for Optimal Charging of Electric Vehicles in Low Carbon Networks, Proceedings of the IEEE Power and Energy Society General Meeting, San Diego, CA, USA, 22–26 July 2012.
- Valsera-Naranjo, E.; Sumper, A.; Villafafila-Robles, R.; Martinez-Vicente, D. Probabilistic Method to Assess the Impact of Charging of Electric Vehicles on Distribution Grids. Energies 2012, 5, 1503–1531. [Google Scholar] [Green Version]
- Soares, F.J.; Lopes, J.A.P.; Almeida, P.M.R.; Moreira, C.L.; Seca, L. A stochastic model to simulate electric vehicles motion and quantify the energy required from the grid, Proceedings of the Power Systems Computation Conference (PSCC), Stockholm, Sweden, 22–26 August 2011.
- Amjad, S.; Neelakrishnan, S.; Rudramoorthy, R. Review of design considerations and technological challenges for successful development and deployment of plug-in hybrid electric vehicles. Renew. Sustain. Energy Rev. 2010, 14, 1104–1110. [Google Scholar]
- Peng, M.; Liu, L.; Jiang, C. A review on the economic dispatch and risk management of the large-scale plug-in electric vehicles PHEVs-penetrated power systems. Renew. Sustain. Energy Rev. 2012, 16, 1508–1515. [Google Scholar]
- Gao, S.; Chau, K.T.; Wu, D.; Chan, C.C. Modeling and coordinated control for integrating electric vehicles into the power grid, Proceedings of the 2011 International Conference on Electrical Machines and Systems (ICEMS), Beijing, China, 20–23 August 2011.
- Sortomme, E.; Hindi, M.M.; MacPherson, S.D.J.; Venkata, S.S. Coordinated Charging of Plug-In Hybrid Electric Vehicles to Minimize Distribution System Losses. IEEE Trans. Smart Grid. 2011, 2, 198–205. [Google Scholar]
- Wang, J.; Liu, C.; Ton, D.; Zhou, Y.; Kim, J.; Vyas, A. Impact of plug-in hybrid electric vehicles on power systems with demand response and wind power. Energy Policy 2011, 39, 4016–4021. [Google Scholar]
- Waraich, R.A.; Galus, M.D.; Dobler, C.; Balmer, M.; Andersson, G.; Axhausen, K.W. Plug-in hybrid electric vehicles and smart grids: Investigations based on a microsimulation. Transp. Res. Part C Emerg. Technol. 2013, 28, 74–86. [Google Scholar]
- Rahman, S.; Shrestha, G.B. An investigation into the impact of electric vehicle load on the electric utility distribution system. IEEE Trans. Power Deliv. 1993, 8, 591–597. [Google Scholar]
- Valsera-Naranjo, E.; Martinez-Vicente, D.; Sumper, A.; Villafafila-Robles, R.; Sudria-Andreu, A. Deterministic and probabilistic assessment of the impact of the electrical vehicles on the power grid, Proceedings of the 2011 IEEE Power and Energy Society General Meeting, San Diego, CA, USA, 24–29 July 2011.
- Mateo, A.R. Evaluación del impacto de los vehículos eléctricos en las redes de distribución. Master Thesis, Universidad Pontificia de Comillas—Escuela técnica superior de ingeniería ICAI, Madrid, Spain, 2010. [Google Scholar]
- Druitt, J.; Früh, W.G. Simulation of demand management and grid balancing with electric vehicles. J. Power Sources. 2012, 216, 104–116. [Google Scholar]
- Loisel, R.; Pasaoglu, G.; Thiel, C. Large-scale deployment of electric vehicles in Germany by 2030: An analysis of grid-to-vehicle and vehicle-to-grid concepts. Energy Policy 2014, 65, 432–443. [Google Scholar]
- Lyon, T.P.; Michelin, M.; Jongejan, A.; Leahy, T. Is smart charging policy for electric vehicles worthwhile? Energy Policy 2012, 41, 259–268. [Google Scholar]
- Maitra, A.; Taylor, J.; Brooks, D.; Alexander, M.; Duvall, M. Integrating plug-in-electric vehicles with the distribution system, Proceedings of the 20th International Conference and Exhibition on Electricity Distribution—Part 1, Prague, Czech Republic, 8–11 June 2009.
- Lopes, J.A.P.; Soares, F.J.; Almeida, P.M.R. Identifying management procedures to deal with connection of Electric Vehicles in the grid, Proceedings of the 2009 IEEE Bucharest PowerTech, Bucharest, Romania, 28 June–2 July 2009.
- Pang, C.; Dutta, P.; Kezunovic, M. BEVs-PHEVs as Dispersed Energy Storage for V2B Uses in the Smart Grid. IEEE Trans. Smart Grid. 2012, 3, 473–482. [Google Scholar]
- Frost & Sullivan, Executive Analysis of Global Electric Vehicle Forecast; Technical Report; Frost & Sullivan: Mountain View, CA, USA, 2012.
- Tomić, J.; Kempton, W. Using fleets of electric-drive vehicles for grid support. J. Power Sources. 2007, 168, 459–468. [Google Scholar]
- Metz, M.; Doetsch, C. Electric vehicles as flexible loads—A simulation approach using empirical mobility data. Energy 2012, 48, 369–374. [Google Scholar]
- López, M.; Martín, S.; Aguado, J.; de la Torre, S. V2G strategies for congestion management in microgrids with high penetration of electric vehicles. Electr. Power Syst. Res. 2013, 104, 28–34. [Google Scholar]
- Electric Vehicle Conductive Charging System—Part 1: General Requirements; IEC Standard 61851-1; International Electrotechnical Commission: Geneva, Switzerland, 2010.
- Vehicle Conductive Charge Coupler; SAE Standard J1772; Society of Automotive Engineers: California Air Resources Board, CA, USA, 2009.
- Geth, F.; Debreucker, S.; Clement, K.; Driesen, J. Charging Power Analysis for a Belgian Plug-in Hybrid Electric Vehicle Fleet, Proceedings of the 5th IEEE Young Researchers Symposium, Leuven, Belgium, 29–30 March 2010.
- Zhang, L.; Brown, T.; Samuelsen, G.S. Fuel reduction and electricity consumption impact of different charging scenarios for plug-in hybrid electric vehicles. J. Power Sources. 2011, 196, 6559–6566. [Google Scholar]
- Grenier, A.; Page, S. The impact of electrified transport on local grid infrastructure: A comparison between electric cars and light rail. Energy Policy 2012, 49, 355–364. [Google Scholar]
- Collins, M.M.; Mader, G.H. The timing of EV recharging and its effect on utilities. IEEE Trans. Veh. Technol. 1983, 32, 90–97. [Google Scholar]
- Clement-Nyns, K.; Haesen, E.; Driesen, J. The impact of vehicle-to-grid on the distribution grid. Electr. Power Syst. Res. 2011, 81, 185–192. [Google Scholar]
- Guo, Q.; Wang, Y.; Sun, H.; Li, Z.; Xin, S.; Zhang, B. Factor Analysis of the Aggregated Electric Vehicle Load Based on Data Mining. Energies 2012, 5, 2053–2070. [Google Scholar]
- Qian, K.; Zhou, C.; Allan, M.; Yuan, Y. Modeling of Load Demand Due to EV Battery Charging in Distribution Systems. IEEE Trans. Power Syst. 2011, 26, 802–810. [Google Scholar]
- Gao, S.; Chau, K.; Chan, C.C.; Liu, C.; Wu, D. Optimal Control Framework and Scheme for Integrating Plug-in Hybrid Electric Vehicles into Grid. J. Asia Electr. Veh. 2011, 9, 1473–1481. [Google Scholar]
- Lojowska, A.; Kurowicka, D.; Papaefthymiou, G.; van der Sluis, L. From transportation patterns to power demand: Stochastic modeling of uncontrolled domestic charging of electric vehicles, Proceedings of the 2011 IEEE Power and Energy Society General Meeting, San Diego, CA, USA, 24–29 July 2011.
- Multin, M.; Allerding, F.; Schmeck, H. Integration of electric vehicles in smart homes—An ICT-based solution for V2G scenarios, Proceedings of the 2012 IEEE PES Innovative Smart Grid Technologies (ISGT), Washington, DC, USA, 16–20 January 2012.
- Garcia-Valle, R.; Vlachogiannis, J.G. Letter to the Editor: Electric Vehicle Demand Model for Load Flow Studies. Electr. Power Compon. Syst. 2009, 37, 577–582. [Google Scholar]
- Keirstead, J.; Jennings, M.; Sivakumar, A. A review of urban energy system models: Approaches, challenges and opportunities. Renew. Sustain. Energy Rev. 2012, 16, 3847–3866. [Google Scholar] [Green Version]
- Kelly, J.C.; MacDonald, J.S.; Keoleian, G.A. Time-dependent plug-in hybrid electric vehicle charging based on national driving patterns and demographics. Appl. Energy 2012, 94, 395–405. [Google Scholar]
- Stephens, T. An Agent-Based Model of Energy Demand and Emissions From Plug-In Hybrid Electric Vehicle Use; Technical Report; University of Michigan: Ann Arbor, MI, USA, 2010. [Google Scholar]
- Weiller, C. Plug-in hybrid electric vehicle impacts on hourly electricity demand in the United States. Energy Policy 2011, 39, 3766–3778. [Google Scholar]
- Huang, S.; Infield, D. The potential of domestic electric vehicles to contribute to Power System Operation through vehicle to grid technology, Proceedings of the 44th International Universities Power Engineering Conference (UPEC), Glasgow, UK, 1–4 September 2009.
- Huang, S.; Infield, D. Demand side management for domestic plug-in electric vehicles in power distribution system operator, Proceedings of the 21st International Conference and Exhibitionon Electricity Distribution, Frankfurt, Geramny, 6–9 July 2011.
- Schroeder, A.; Traber, T. The economics of fast charging infrastructure for electric vehicles. Energy Policy 2012, 43, 136–144. [Google Scholar]
- Juul, N.; Meibom, P. Road transport and power system scenarios for Northern Europe in 2030. Appl. Energy 2012, 92, 573–582. [Google Scholar]
- Mora, R.; Oyarzabal, J.; Cruz-Zambrano, M.; Gonzalez, A.; Corera, J. E-car and economic impact: Enhancing the smart grids, Proceedings of the 2012 Workshop Integration of Renewables into the Distribution Grid, Lisbon, Portugal, 29–30 May 2012.
- Waraich, R.; Galus, M.D.; Dobler, C.; Balmer, M.; Andersson, G.; Axhausena, K.W. Plug-in Hybrid Electric Vehicles and Smart Grid: Investigations Based on a Micro-Simulation, Proceedings of the 12th International Conference on Travel Behaviour Research (IATBR), Jaipur, India, 13–18 December 2009.
- Galus, M.D.; Andersson, G. Demand Management of Grid Connected Plug-In Hybrid Electric Vehicles (PHEV), Proceedings of the Energy 2030 Conference, Atlanta, GA, USA, 17–18 November 2008.
- Venkatesan, N.; Solanki, J.; Solanki, S.K. Residential Demand Response model and impact on voltage profile and losses of an electric distribution network. Appl. Energy 2012, 96, 84–91. [Google Scholar]
- Galus, M.; Waraich, R.; Balmer, M.; Andersson, G.; Axhausen, K. A framework for investigating the impact of PHEVS, Proceedings of the International Advanced Mobility Forum (IAMF), ZurichETH, Swiss Federal Institute of Technology, IVT Institute for Transport Planning and Systems, Geneva, Switzerland, 10–12 March 2009.
- Galus, M.; Andersson, G. Integration of Plug-In Hybrid Electric Vehicles into energy networks, Proceedings of the 2009 IEEE PowerTech Bucharest, Bucharest, Romania, 28 June–2 July 2009.
- Balmer, M. Travel demand modeling for multi-agent traffic simulations: Algorithms and systems. Ph.D. Thesis, ETH Zurich, Zurich, Switzerland, 2007. [Google Scholar]
- Hedegaard, K.; Ravn, H.; Juul, N.; Meibom, P. Effects of electric vehicles on power systems in Northern Europe. Energy 2012, 48, 356–368. [Google Scholar]
- Mohsenian-Rad, A.; Wong, V.W.S.; Jatskevich, J.; Schober, R.; Leon-Garcia, A. Autonomous Demand-Side Management Based on Game-Theoretic Energy Consumption Scheduling for the Future Smart Grid. IEEE Trans. Smart Grid. 2010, 1, 320–331. [Google Scholar]
- Smith, R.; Shahidinejad, S.; Blair, D.; Bibeau, E.L. Characterization of urban commuter driving profiles to optimize battery size in light-duty plug-in electric vehicles. Transp. Res. Part D Transp. Environ. 2011, 16, 218–224. [Google Scholar]
- Kleiwegt, E.; Lukszo, Z. Grid Impact Analysis of Electric Mobility on a Local Electricity Grid, Proceedings of the 9th IEEE International Conference on Networking, Sensing and Control (ICNSC), Beijing, China, 11–14 April 2012.
- Kempton, W.; Tomic, J. Vehicle-to-grid power fundamentals: Calculating capacity and net revenue. J. Power Sources. 2005, 144, 268–279. [Google Scholar]
- Zakariazadeh, A.; Jadid, S.; Siano, P. Multi-objective scheduling of electric vehicles in smart distribution system. Energy Convers. Manag. 2014, 79, 43–53. [Google Scholar]
- Dallinger, D.; Wietschel, M. Grid integration of intermittent renewable energy sources using price-responsive plug-in electric vehicles. Renew. Sustain. Energy Rev. 2012, 16, 3370–3382. [Google Scholar]
- ElBanhawy, E.; Dalton, R.; Thompson, E.; Kotter, R. A heuristic approach for investigating the integration of electric mobility charging infrastructure in metropolitan areas: An agent-based modeling simulation, Proceedings of the 2012 2nd International Symposium on Environment Friendly Energies and Applications (EFEA), Newcastle upon Tyne, UK, 25–27 June 2012.
- Vale, Z.; Pinto, T.; Morais, H.; Praça, I.; Faria, P. VPP’s multi-level negotiation in smart grids and competitive electricity markets, Proceedings of the IEEE Power and Energy Society General Meeting, San Diego, CA, USA, 24–29 July 2011.
- Macal, C.; North, M. Tutorial on agent-based modelling and simulation. J. Simul. 2010, 4, 151–162. [Google Scholar]
- Bonabeau, E. Agent-based modeling: Methods and techniques for simulating human systems. Proc. Natl. Acad. Sci. USA 2002, 99, 7280–7287. [Google Scholar]
- Barcelona Council, Barcelona Statistical Guidelines and Districts; Technical Report; Department of Statistics: Barcelona, Spain, 2012.
- Xu, Y. Effective GPS-Based Panel Survey Sample Size for Urban Travel Behavior Studies. Ph.D. Thesis, Georgia Institute of Technology and School of Civil and Environmental Engineering, Atlanta, GA, USA, 2010.
- Institut d’Estudis Regionals i Metropolitans de Barcelona (IERMB) and Autoritat del Transport Metropolità (ATM), Enquesta de Mobilitat Quotidiana; Technical Report; IERMB & ATM: Barcelona, Spain, 2006.
- Cetelem PARIBAS Grupo B. N. P. The electric vehicle and the europeans. (El coche eléctrico y los europeos); Technical Report; Cetelem PARIBAS Grupo B. N. P.: Madrid, Spain, 2012.
- Marra, F.; Yang, G.Y.; Traholt, C.; Larsen, E.; Rasmussen, C.N.; You, S. Demand profile study of battery electric vehicle under different charging options, Proceedings of the 2012 IEEE Power and Energy Society General Meeting, San Diego, CA, USA, 22–26 July 2012.
- Valsera-Naranjo, E.; Sumper, A.; Lloret-Gallego, P.; Villafafila-Robles, R.; Sudria-Andreu, A. Electrical vehicles: State of art and issues for their connection to the network, Proceedings of the 10th International Conference on Electrical Power Quality and Utilisation, Lodz, Poland, 15–17 September 2009.
- Load Forecasting for Low Voltage Supply; ITC-BT-10 Stanadard; Ministerio de Industria, Energía y Turismo: Madrid, Spain, 2002.
- Red Eléctrica de España—Spanish Transmission System Operator. Available online: http://www.ree.es accessed on 7 July 2014.
- Kostková, K.; Omelina, L.; Kyčina, P.; Jamrich, P. An introduction to load management. Electr. Power Syst. Res. 2013, 95, 184–191. [Google Scholar]
- Royal Decree (Real Decreto) 647/2011, of May 9, which regulates aggregator activities (Gestor de carga) and Time-Of-Use tariff for EV; National Law; Ministerio de Industria, Energía y Turismo: Madrid, Spain, 2011.
- Putrus, G.A.; Suwanapingkarl, P.; Johnston, D.; Bentley, E.C.; Narayana, M. Impact of electric vehicles on power distribution networks, Proceedings of the IEEE Vehicle Power and Propulsion Conference, Dearborn, MI, USA, 7–10 September 2009.
© 2015 by the authors; licensee MDPI, Basel, Switzerland This article is an open access article distributed under the terms and conditions of the Creative Commons Attribution license (http://creativecommons.org/licenses/by/4.0/).


 ,
, 


