1. Introduction
Due to issues such as air pollution and global warming, and concerns of fossil energy reserves and energy prices, electric vehicles (EVs) are gaining increasing attention to reduce dependency on fossil fuels as well as environmental pollution. In China, a considerable amount of work, such as technical research and planning of EV development, has been done by the government, academic institutes and the automobile industry [
1]. However, issues such as high initial cost, short driving range, and long charging time constrain EV development [
2,
3].
As EVs rely on the electricity from the power grid, they could bring negative impacts on power generation, transmission, and distribution if their charging and schedules are not properly managed [
4,
5]. Smart operation of grids considering intelligent charging/discharging of EVs in distributed networks and load environment to reduce both cost and emission simultaneously is a very complex task [
6]. Soares
et al. [
7] presented a simulator for EVs in the context of smart grids and distribution networks to support network operators’ planning and operations. The work in [
8] developed a detailed model of performance, energy use, manufacturing cost, retail cost, and lifecycle cost of EVs to address the issue of cost. Moreover, with the increasing penetration of EVs, the distributed feature of EV plug-in/off time has more significant impact on the aggregated load characteristics [
9,
10]. Since a sizable EV load can introduce a new peak in the early off-peak periods, in [
11] the optimization of the EV charging during the low-cost off-peak periods is formulated to minimize the cost of EV charging in the Singapore system. The work in [
12] investigated a tradeoff between user satisfaction fairness and the total cost of electricity for charging. Lin
et al. [
13] proposed the use of EVs as responsive demand to complement network stress relief by allowing EVs to absorb excessive renewable generation when they cause network pressure.
The performance of EVs is influenced by the energy capacity of the onboard energy storage system,
i.e., battery pack [
14]. Several factors such as deep depth-of-discharge, high or low temperature, extreme state-of-charge (SOC) levels,
etc., are generally acknowledged to accelerate capacity fade [
15,
16]. Sikha
et al. [
17] proposed a mathematical battery model that can be used to predict the drop in the voltage profile, change in the SOC, and the effects of charge and discharge rates during cycling. The work in [
18] presented evaluations and comparisons of different equivalent circuit models to improve the use of lithium-ion batteries in EV applications. SOC estimation is one of the most significant and difficult techniques to promote the commercialization of EVs [
19]. Hu
et al. [
20] presented an adaptive observer-based technique for estimating SOC of a lithium-ion battery pack used in an EV. In addition, a great deal of attention has been paid towards the influence of charging patterns on battery life for plug-in EVs [
21,
22]. In [
23], the proposed strategy not only seeks to minimize fuel consumption while maintaining the SOC of batteries within reasonable bounds but also to minimize wear of the batteries by penalizing the instantaneous battery usage.
Although EV advocates have spent decades on tackling all kinds of challenges, EV charging control strategies which can affect the impacts and benefits significantly are still under discussion [
24,
25]. Yilmaz
et al. [
26] reviewed the current status and implementation of battery chargers, charging power levels, and infrastructure for plug-in EVs. Obviously, EVs will introduce additional load to the power system, and consequently, they can challenge power quality and reliability of power systems if their charging is not coordinated properly [
27,
28,
29]. The impact of EVs on distribution networks can be determined by following aspects: driving patterns, charging characteristics, charge timing, and vehicle penetration,
etc. [
30,
31,
32]. A significant number of researches have focused on the design and optimization of energy management strategies for EVs [
33,
34]. Moreover, charging facilities are typically limited and must therefore be used efficiently [
35]. In [
36], an integrated rapid charging navigation strategy is presented that considers both traffic conditions and the status of power grids. Other studies propose solutions for charging autonomous EVs in parking places and using scarce charging facilities more efficiently, thus simplifying the life of customers and increasing the feasibility of EVs [
37,
38]. Another study proposes a multi-objective EV charging station planning method, which can ensure charging service while reducing power losses and voltage deviation of distribution systems [
39]. In addition, many studies focus on the charging scheduling of EVs at a charging station equipped with renewable energy generation devices, considering the uncertain arrival of EVs, the intermittence of renewable energy, and the variations of electricity prices [
40,
41].
In recent years, vehicle-to-grid (V2G) technology has drawn research attention to improve the performance of electricity grids in terms of efficiency, stability, and reliability,
etc. [
42,
43,
44]. The V2G facilitates a large pool of EV batteries to store the energy during off-peak hours and inject it back to the grid during peak hours, thus achieving valley filling and peak shaving [
45,
46].
A number of studies have investigated V2G technologies. The distributed generations is able to provide auxiliary services such as automatic generation control to the power system to maintain system security and power quality [
47]. The work in [
48] presented a strategy for grid power peak shaving and valley filling by using V2G systems, and the influences of the number of connected EVs and the average value of the target curve are analyzed. Other researches make use of the distributed power of EVs to produce grid-scale power to: (i) participate in primary frequency control considering charging demands from EV customers [
49,
50]; (ii) provide local voltage support, thereby reducing the need for voltage regulation at distribution networks [
51]. Another study analyses impacts of EVs on planning of transmission/distribution networks, and their utilization [
52]. Other studies focused on the economic analysis of integrating EVs to the grid [
53]. The work in [
54] focused on plug-in EVs integration on power system including EVs charging load modeling, simulation and calculation, EVs’ impacts on power system, and control and utilization of EVs charging and discharging.
Most previous researches focus on developing charging strategies, but one major challenge still remains, i.e., EV customers expect short charging times just like refueling traditional vehicles. Although rapid charging stations provide a good solution, it is very difficult to implement centralized charging control because much of the EV charging load coincides with normal residential load peaks. Therefore, there is an urgent need to study EVs batteries charging/exchanging stations and battery management. Moreover, little effort has been paid to the construction of charging stations with batteries exchanging service or the use of retired batteries, not to mention the optimal operation of charging stations considering local load profiles and EVs battery exchanging requests.
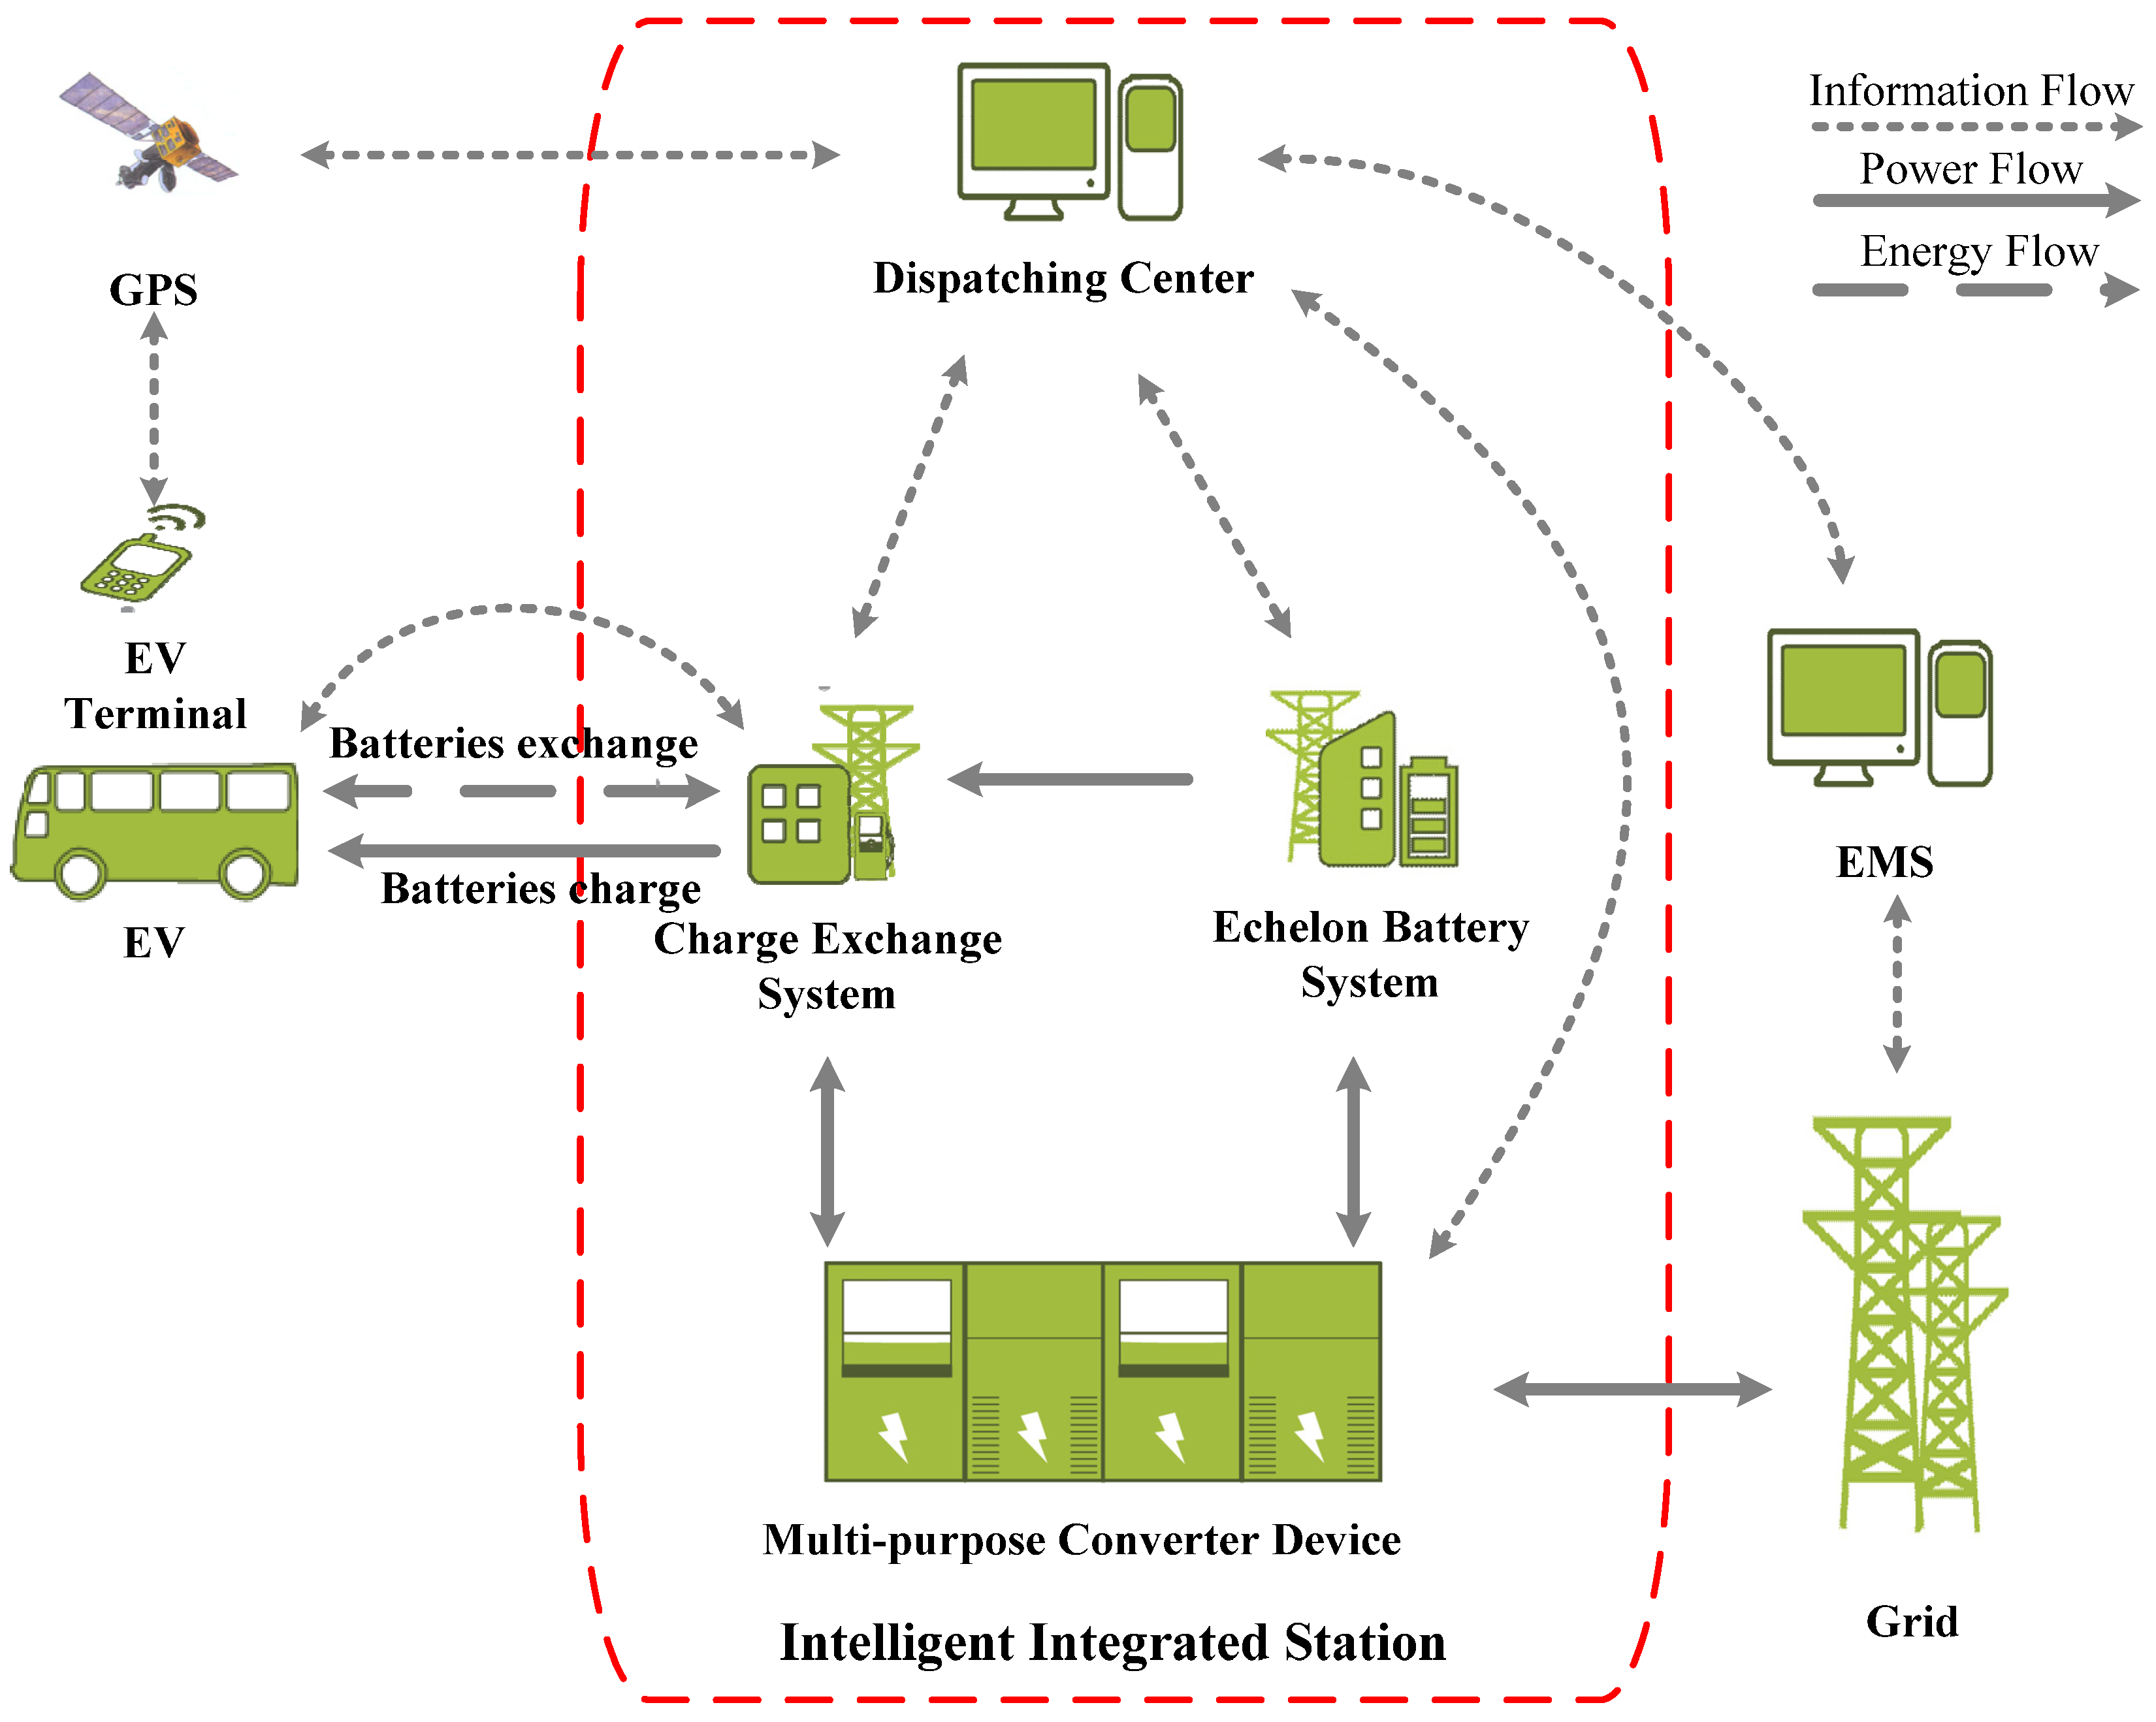
Most cities in China do not have public charging infrastructure networks to support EVs. This lack of infrastructure is one major barrier to mass household adoption of EVs. The EVs charging-discharging-storage intelligent integrated station project, funded by China’s Ministry of Science and Technology and started in 2011, aims to resolve these problems by combining the concept of optimal fusion of energy storage systems and public transportation with the convenience of autonomous parking and coordinated battery exchanging strategies. It develops an EV’s intelligent integrated station (IIS) to offer battery charging/exchanging services. The proposed IIS consists of multi-purpose converter devices, a dispatching center, a charge exchange system, and an echelon battery system. Compared with existing charging stations, the IIS provides both battery exchanging and battery charging services for EVs. The retired batteries are abandoned in most charging stations, but in IIS, they serve as an energy storage system in the echelon battery system. Furthermore, by properly controlling the IIS, it can provide grid-support services, such as reactive power support, primary frequency control, and peak shifting and valley filling, which are essential for smart network operation [
55,
56].
In this paper, we introduce the framework of IIS and analyze its information flow as well as power flow. In addition, we study the energy flow inside and outside the station and propose the concept of generalized energy to systematically investigate the energy distribution. In order to analyze the energy in batteries independently, we separate the energy into three parts: (i) energy in the charge exchange system; (ii) energy in the echelon battery system; and (iii) energy in EVs on-board batteries. The generalized energies of IIS and load level of network are important factors in determining the charging/discharging of IIS. According to the load level and the energy capacity of IIS, we propose a novel control strategy to optimize the charging and discharging of batteries. The echelon battery system serving as an energy storage system charges from the grid during off-peak periods and discharges to the grid during peak periods. Moreover, when the charge exchange system operates in charging mode during peak load periods, it is optimal to charge from the echelon battery system other than the grid if the energy capacity of the echelon battery system is high enough. In this way, batteries charging behavior is optimized to minimize charging costs and to achieve optimal power balancing. The simulation results show the effectiveness of the strategy.
The rest of the paper is organized as follows.
Section 2 introduces the framework of the intelligent integrated station and its power/information flow.
Section 3 discusses the function of the dispatching center and control strategy of energy flow in IIS. In addition, the operating modes of the charge exchange system and the echelon battery system are discussed in detail in this section.
Section 4 introduces the generalized energy based on the energy/power flow between the IIS and EVs, and between the IIS and the power grid. In
Section 5, the dispatching control strategy for batteries charging/discharging is discussed under different conditions.
Section 6 presents the simulation results of batteries charging/discharging in the IIS during two periods. Finally, conclusions are drawn in
Section 7.
3. Structure of the IIS
3.1. Dispatching Center
The dispatching center in the IIS is in charge of information collection/processing, condition monitoring, and operation control. It is capable of controlling the power flow between the grid and IIS based on the information about EVs’ operation, the grid dispatching, and the operation of IIS.
By collecting the information flow in
Table 1, the dispatching center is employed to develop proper control strategies for the sustainable and optimal operation of IIS. The dispatching center is able to obtain the EV’s location according to the EV terminal and calculate EVs on-board battery capacity. It forecasts an EV’s on-board battery capacity curve and issues dispatching orders for an EV’s management. Moreover, the dispatching center collects the grid operating information through EMS and adjusts the batteries’ charging/discharging process in IIS.
Table 1.
Information flow in intelligent integrated station (IIS).
Table 1.
Information flow in intelligent integrated station (IIS).
| Information Sender | Information Receiver | Information Flow | Information Code |
|---|
| EV terminal | CES | Information of battery uninstalled | I1 |
| GPS | Information of EV | I2 |
| CES | EV terminal | Information of battery installed | I3 |
| Dispatching center | SOC of CES | I4 |
| Dispatching center | Power flow between CES and grid | I5 |
| Dispatching center | Power flow between CES and EBS | I6 |
| EBS | Dispatching center | SOC of EBS | I7 |
| Dispatching center | Power flow between EBS and grid | I8 |
| Dispatching center | Power flow between EBS and CES | I9 |
| Converters of CES | Dispatching center | Power flow between CES and grid | I10 |
| Converters of EBS | Dispatching center | Power flow between EBS and grid | I11 |
| DC/DC converter | Dispatching center | Power flow between EBS and CES | I12 |
| EMS of grid | Dispatching center | Information of grid | I13 |
| Dispatching center | Power flow between CES and grid | I14 |
| Dispatching center | Power flow between EBS and grid | I15 |
| GPS | Dispatching center | Information of EV | I16 |
| EV terminal | Battery exchanging suggestion | I17 |
| Dispatching center | EMS of grid | IIS information | I18 |
| Converters | Power flow control | I19 |
| CES | Battery exchanging demands | I20 |
| EBS | Battery disposal | I21 |
| GPS | Battery exchanging suggestion | I22 |
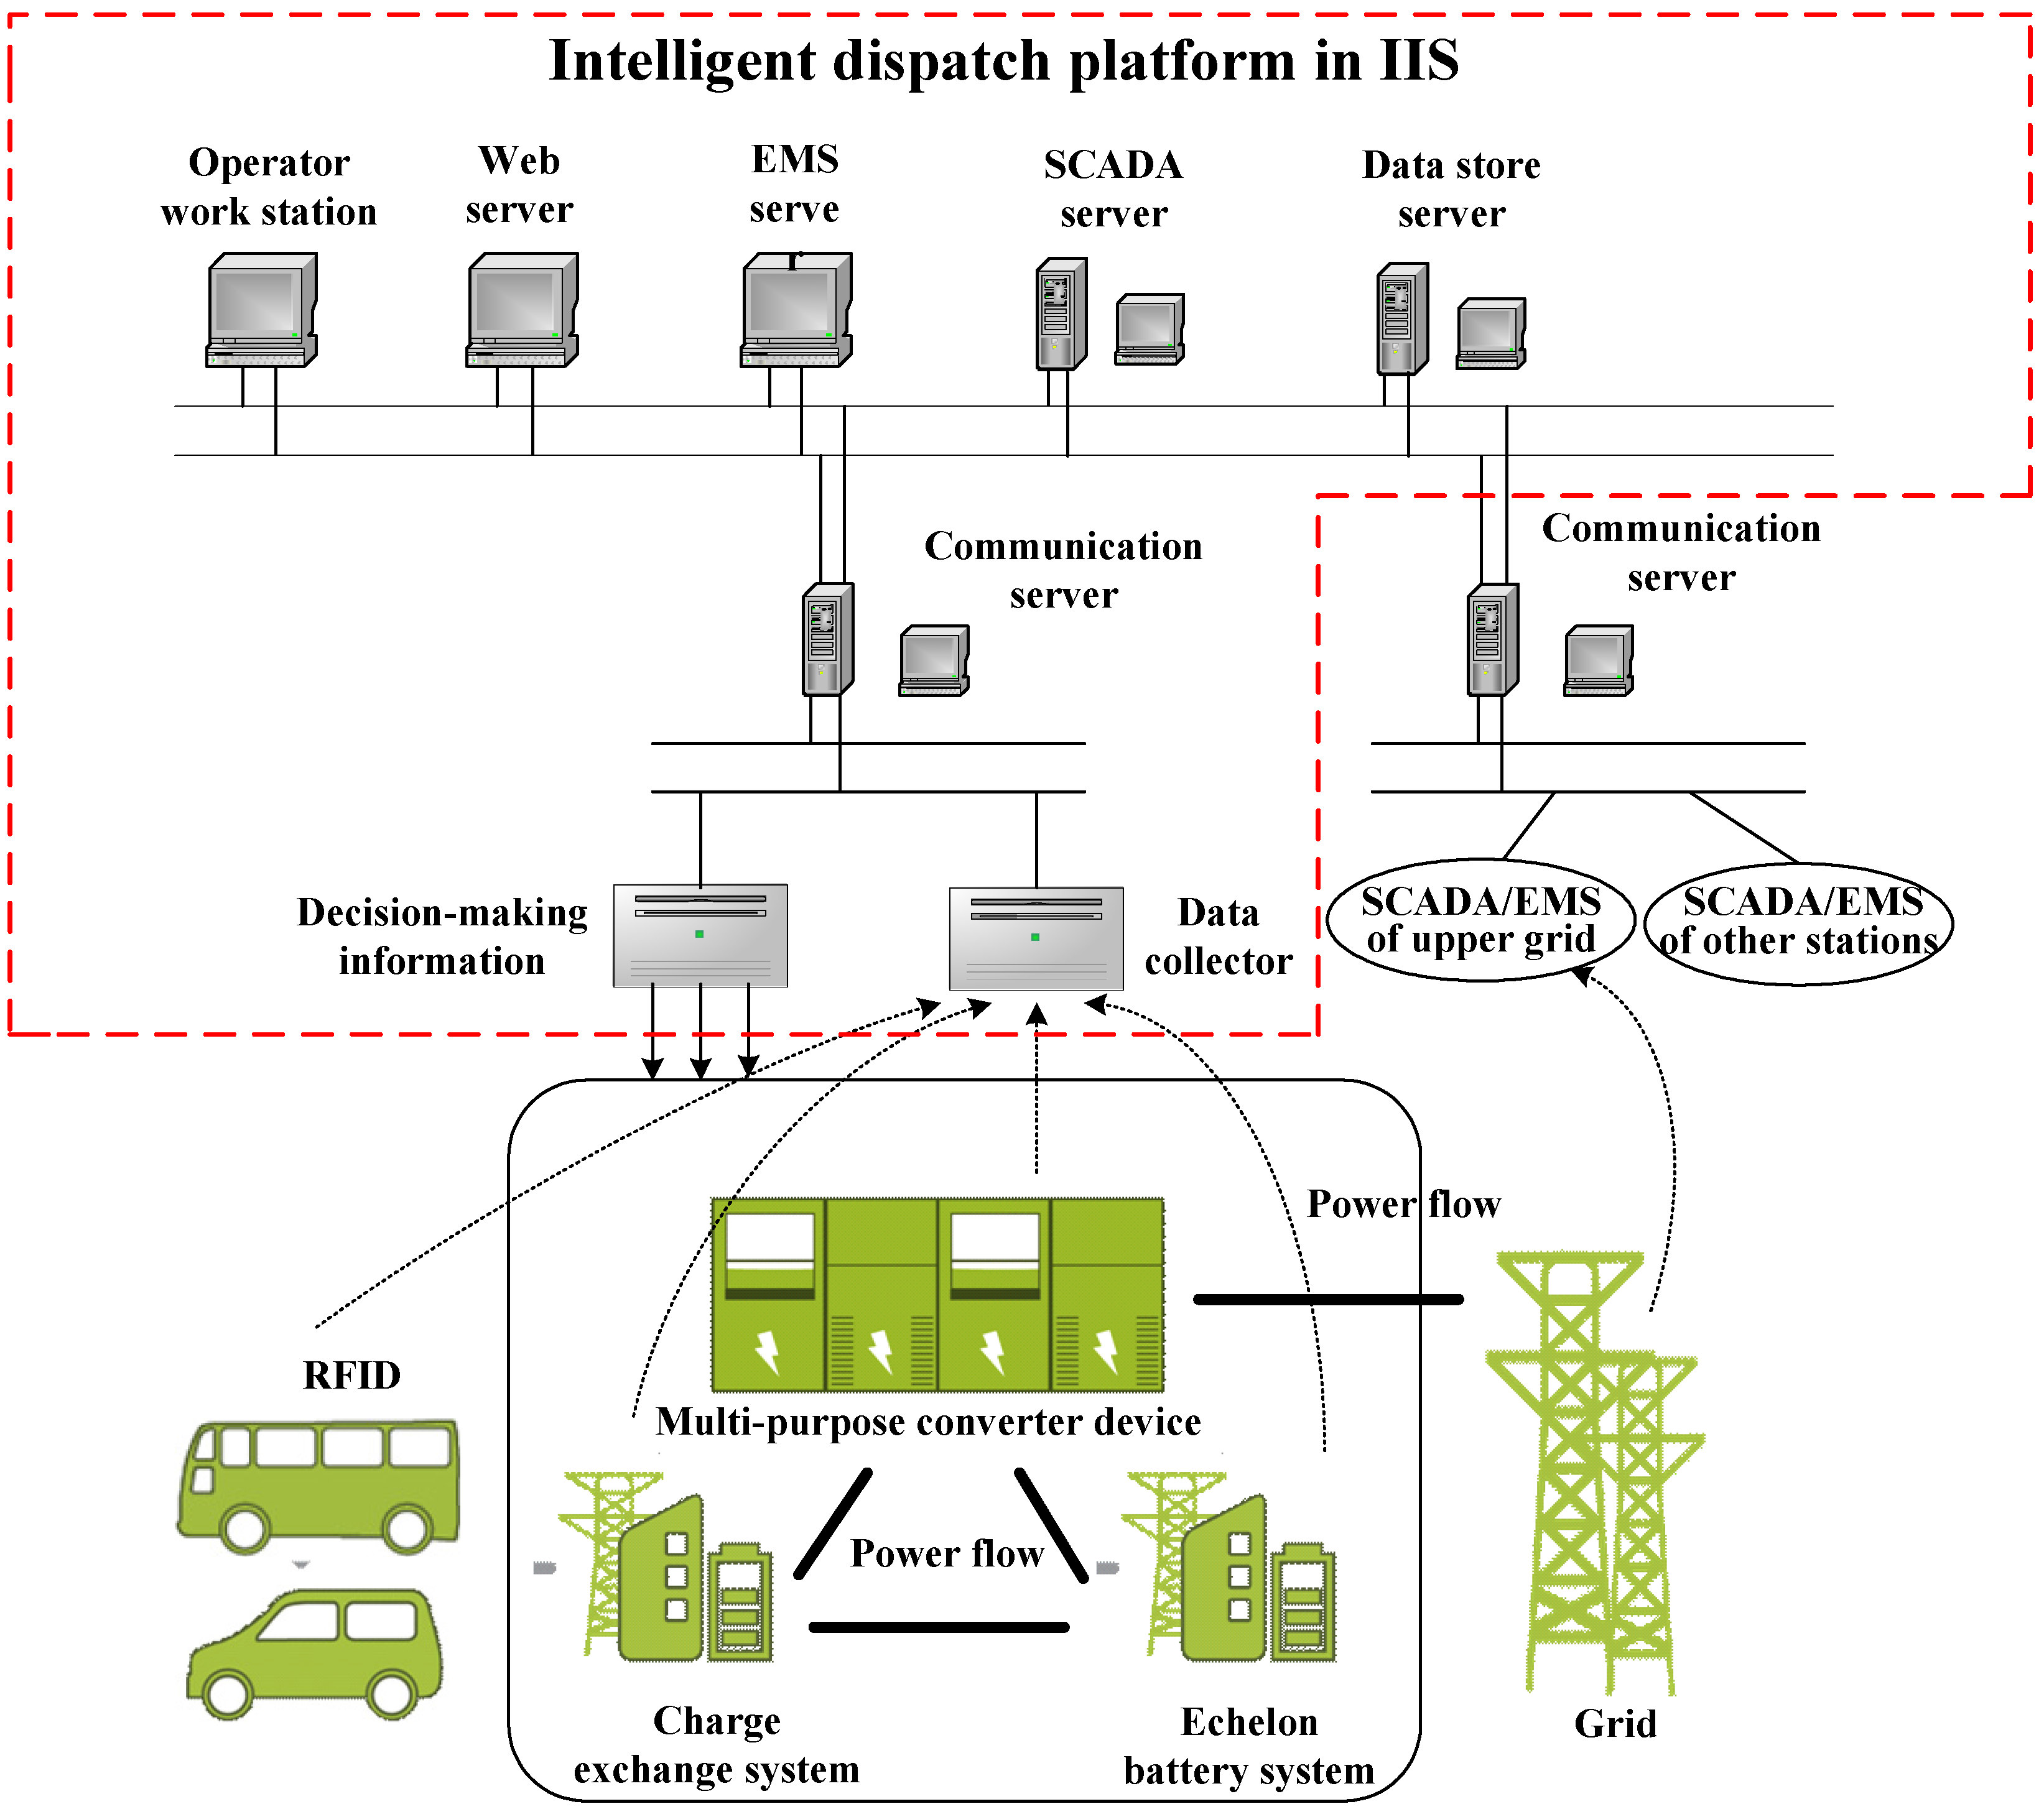
(1) Intelligent Dispatch Platform
To realize the fusion of multi-source information from the grid, EVs and IIS, a dispatch platform is needed to cooperate with EMS and the supervisory control and data acquisition (SCADA) system. The intelligent dispatch platform in IIS is circled by the red dotted square, as presented in
Figure 2.
The data collector in the dispatch platform is in charge of collecting operating information on the IIS and EVs for the operator work station. The operator work station also collects the grid operating information through the SCADA and EMS via the communication server. It includes the following key servers:
- ▪
The web server is able to obtain and upload information through internet;
- ▪
The EMS server is used to detect the load level of the grid and form smart dispatching strategies based on the grid operating information;
- ▪
The SCADA server in IIS is employed to acquire the scene information and send the decision-making information to corresponding systems;
- ▪
The data store server stores large number of data during the operation of IIS, which is of great value for establishing a dispatching strategy by analyzing and forecasting the changing trend. For example, by monitoring the information about EVs in operation, we can analyze and forecast batteries exchanging requests and send this message to the CES.
Figure 2.
Intelligent dispatching of IIS.
Figure 2.
Intelligent dispatching of IIS.
By combining the information above, the operator work station is able to make optimal operation decisions for the IIS and send the decision-making information to the IIS.
(2) Control Strategy of Energy/Power Flow in IIS
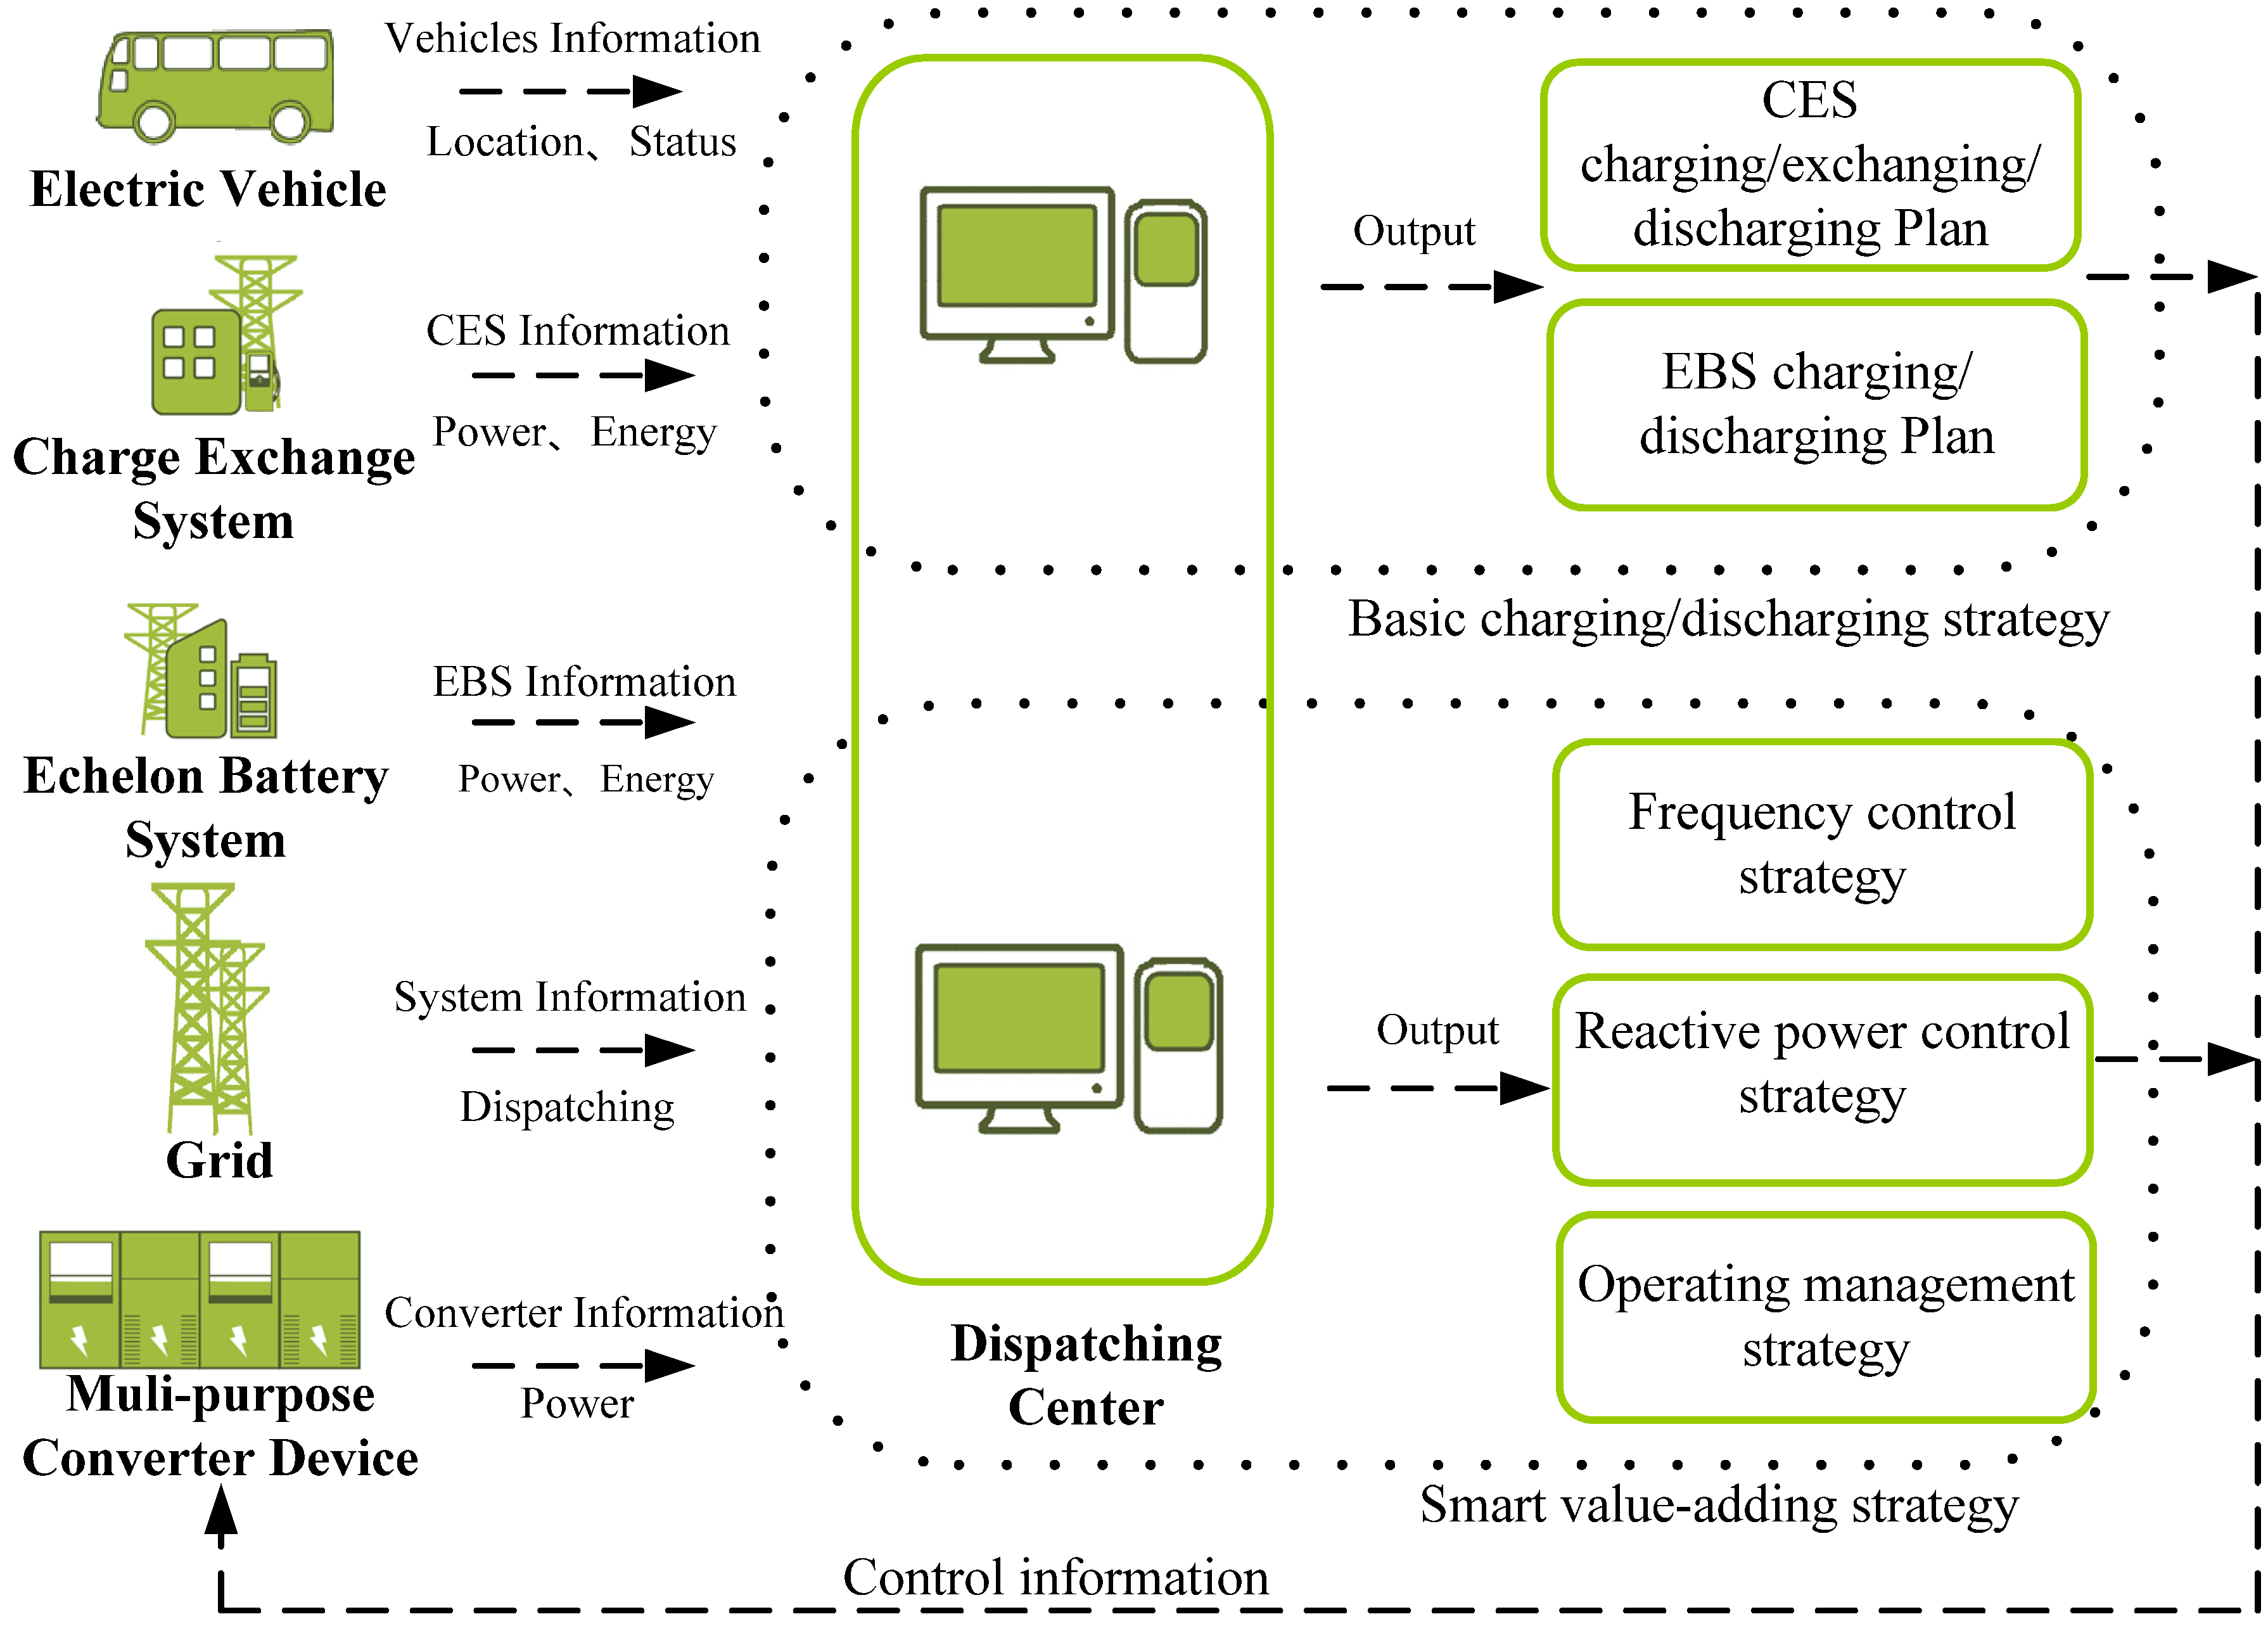
As shown in
Figure 3, the dispatching center is able to collect all kinds of information, such as the location and operating status of EVs, the energy capacity and charging/discharging power of CES/EBS, the dispatching order and operating status of the grid, and the information on power flow in each converter. Based on the information above, the control strategy of energy/power flow in IIS shown in
Figure 3 can achieve the optimality of peak load shifting to the grid.
The basic charging/discharging strategy aims to satisfy EVs batteries charging/exchanging requests and optimize charging/discharging process of IIS to achieve peak load shifting, which will be discussed in detail later.
Furthermore, according to the operating status of the grid and energy capacity of IIS, the IIS can provide auxiliary services to the power grid such as frequency control and reactive power control, by controlling the power flow between the power grid and IIS, called smart value-adding strategy. The frequency control strategy is applied to IIS when the deviation of frequency
is in a setting range. If
, the IIS charges from the grid in rated power. Otherwise, the IIS does not charge from the grid or even discharge to the grid. Moreover, the IIS can operate as a static var generator to compensate reactive power for the distribution grid [
55]. The smart value-adding strategy is not the emphasis of this paper.
Figure 3.
The control strategy of the energy/power flow in IIS.
Figure 3.
The control strategy of the energy/power flow in IIS.
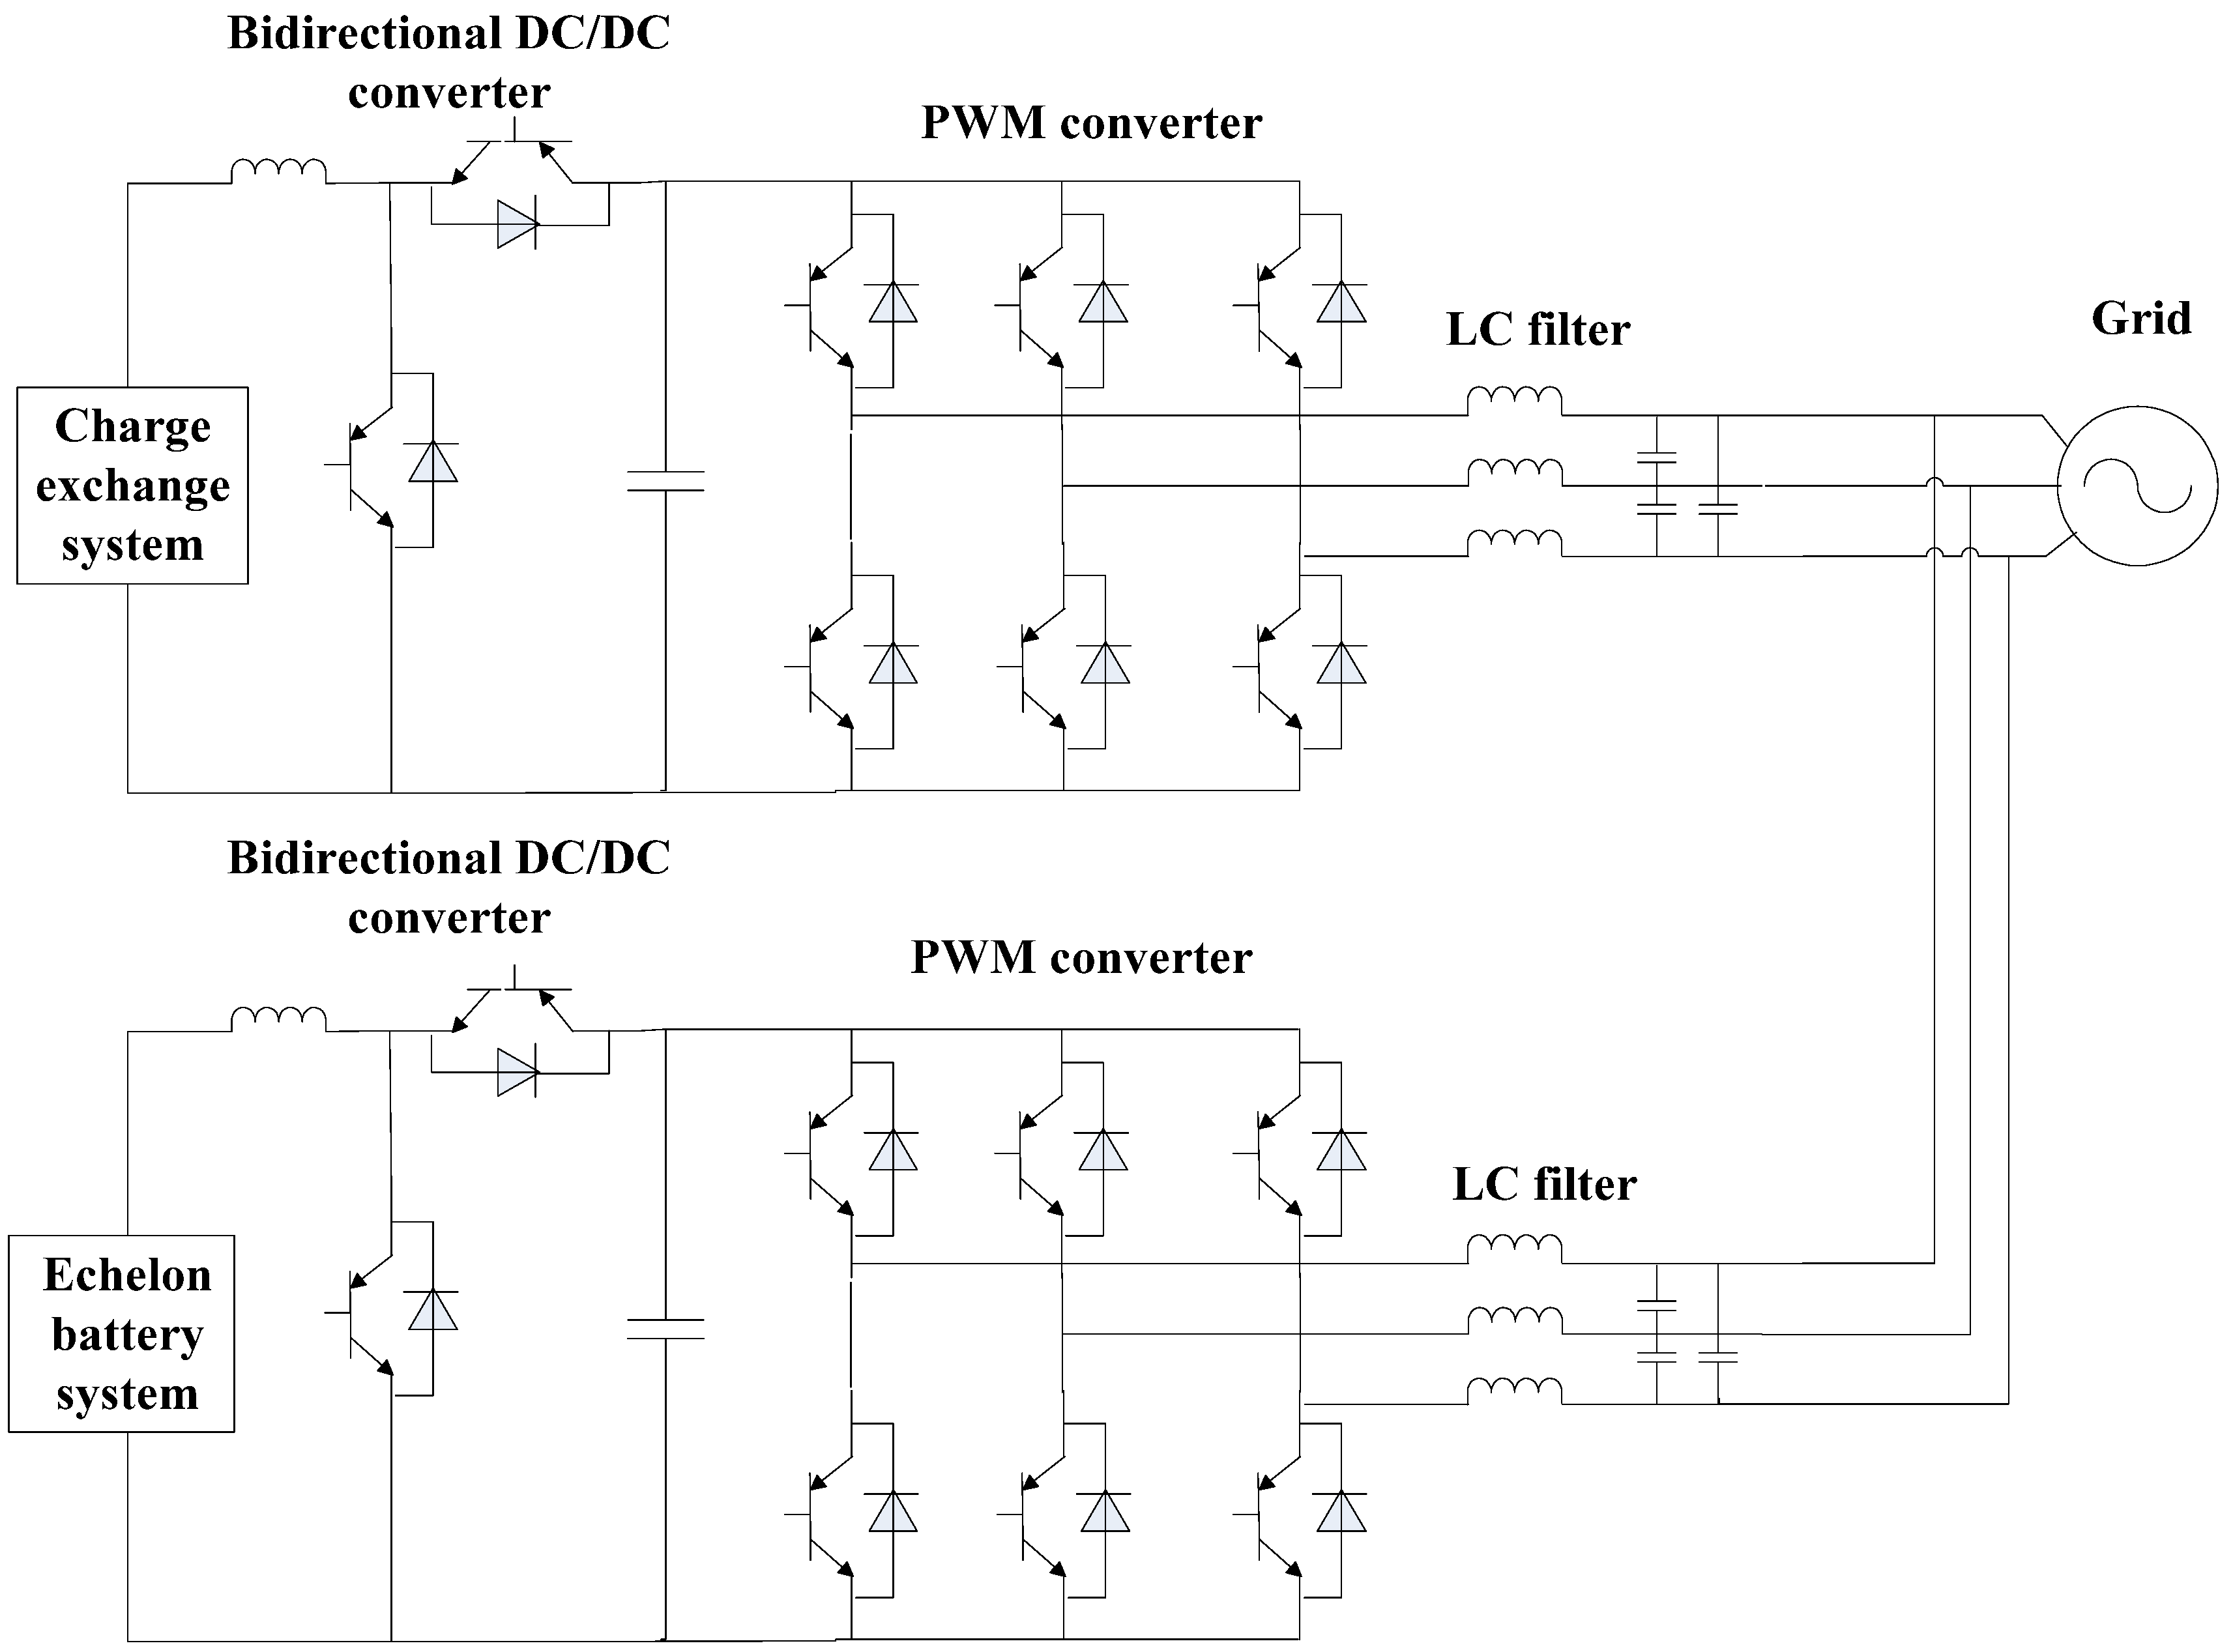
3.2. Multi-Purpose Converter Device
Essentially, the multi-purpose converter device is a combination of the voltage source converter, monitoring sensor, system controller and transformer. The energy capacity of the IIS is closely related to the direction and value of the power flow between the power grid and IIS through the multi-purpose converter device.
To manage the charging and discharging of batteries in the CES and EBS, we adopt a simple but practical converter device, which includes DC/DC and DC/AC circuits [
57], shown in
Figure 4.
It shows the basic structure of the multi-purpose converter device which consists of two sets of parallel converters connecting to the CES and EBS. The DC/DC part is a Buck-Boost circuit which avoids the use of an AC/AC transformer to obtain suitable voltage for the charging and discharging of batteries. The DC/AC part employs PWM converters operating in rectifier or inverter mode. This structure has widespread applicability to control the charging and discharging of two sets of batteries independently. Unavoidably, the conversion efficiency decreases due to the existence of the DC/DC part. The multi-purpose converter device in the CES works in two stages.
- ▪
Charging stage. In this stage, the power grid delivers electric power to batteries in the CES to maintain its energy capacity. The DC/AC part works in rectifier state and the DC/DC part works in Buck mode. It serves as a high power charger. Generally, the charging process is done during valley periods to provide valley filling service to the grid.
- ▪
Discharging stage. The CES can be used to provide peak shaving service to the grid when the energy capacity of the CES is high enough. Batteries discharge to the grid to alleviate the over-demand condition of the grid. In this condition, the DC/AC part works in inverter mode and the DC/DC part works in Boost mode.
Similarly, the multi-purpose converter device in the EBS can be controlled to operate in charging or discharging mode accordingly.
Figure 4.
Multi-purpose converter device.
Figure 4.
Multi-purpose converter device.
It should be emphasized that there is battery detecting device in the multi-purpose converter devices. Once the battery pack in the IIS connects to the converter, the battery detecting device is able to obtain the information of the battery pack and send it to the dispatching center. The dispatching center will take the battery information into consideration when charges for the battery pack in the IIS. It should be also emphasized that batteries are not suggested to be used for EVs if their capacity have dropped to 80% of their initial value. We take the factor as a constant constraint.
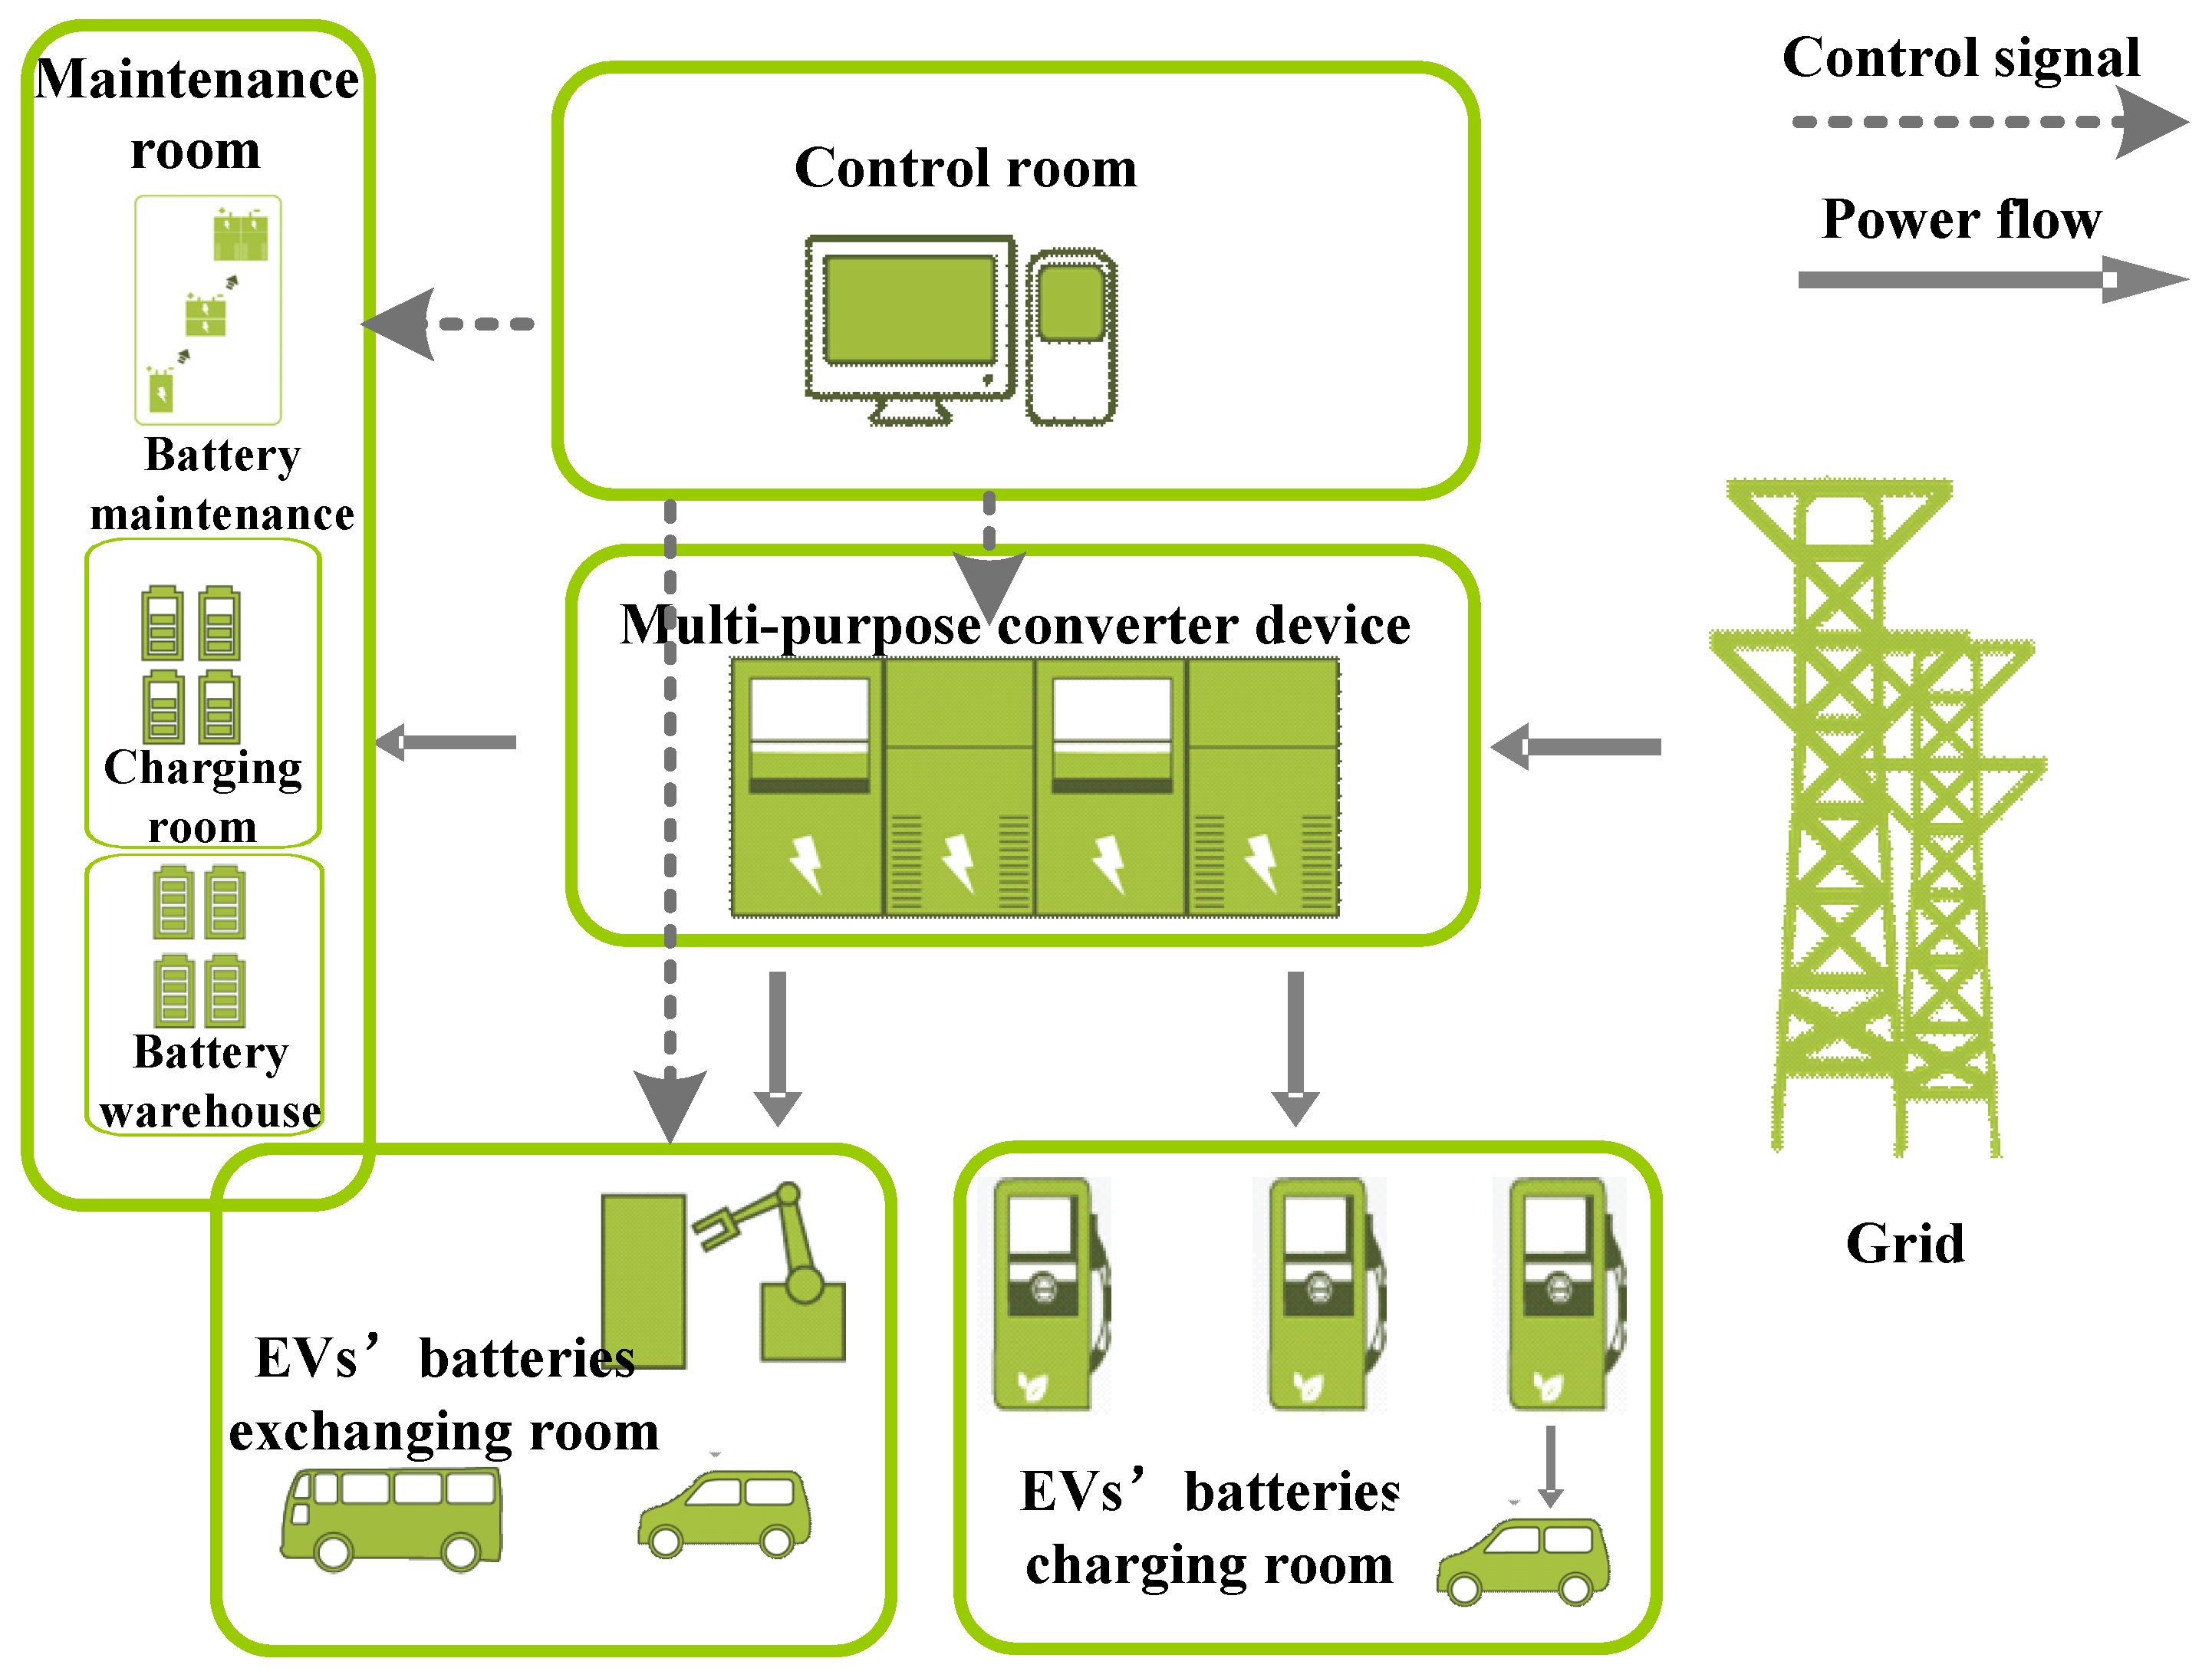
3.3. Charge Exchange System
To satisfy the EV batteries’ charging demand, the CES proposed in this paper can provide fast-charging and slow-charging services. Moreover, the CES is expected to provide full-capacity batteries for EVs in the batteries’ exchanging mode. Therefore, EV batteries can be replaced in a short time and the batteries in the CES can be charged during off-peak periods. The CES consists of EV batteries’ exchanging room and charging room, control room, and maintenance center, as shown in
Figure 5.
- ▪
EVs batteries’ charging/exchanging room provides batteries exchanging, fast-charging, and slow-charging services for EVs.
- ▪
The control room is in charge of monitoring and controlling the operation of the CES.
- ▪
The maintenance room provides charging, maintenance and storage service for batteries in the CES.
Therefore, the CES is supposed to provide maintenance service for batteries as well as the batteries’ exchanging/charging service for EVs.
Figure 5.
Layout of charge exchange system.
Figure 5.
Layout of charge exchange system.
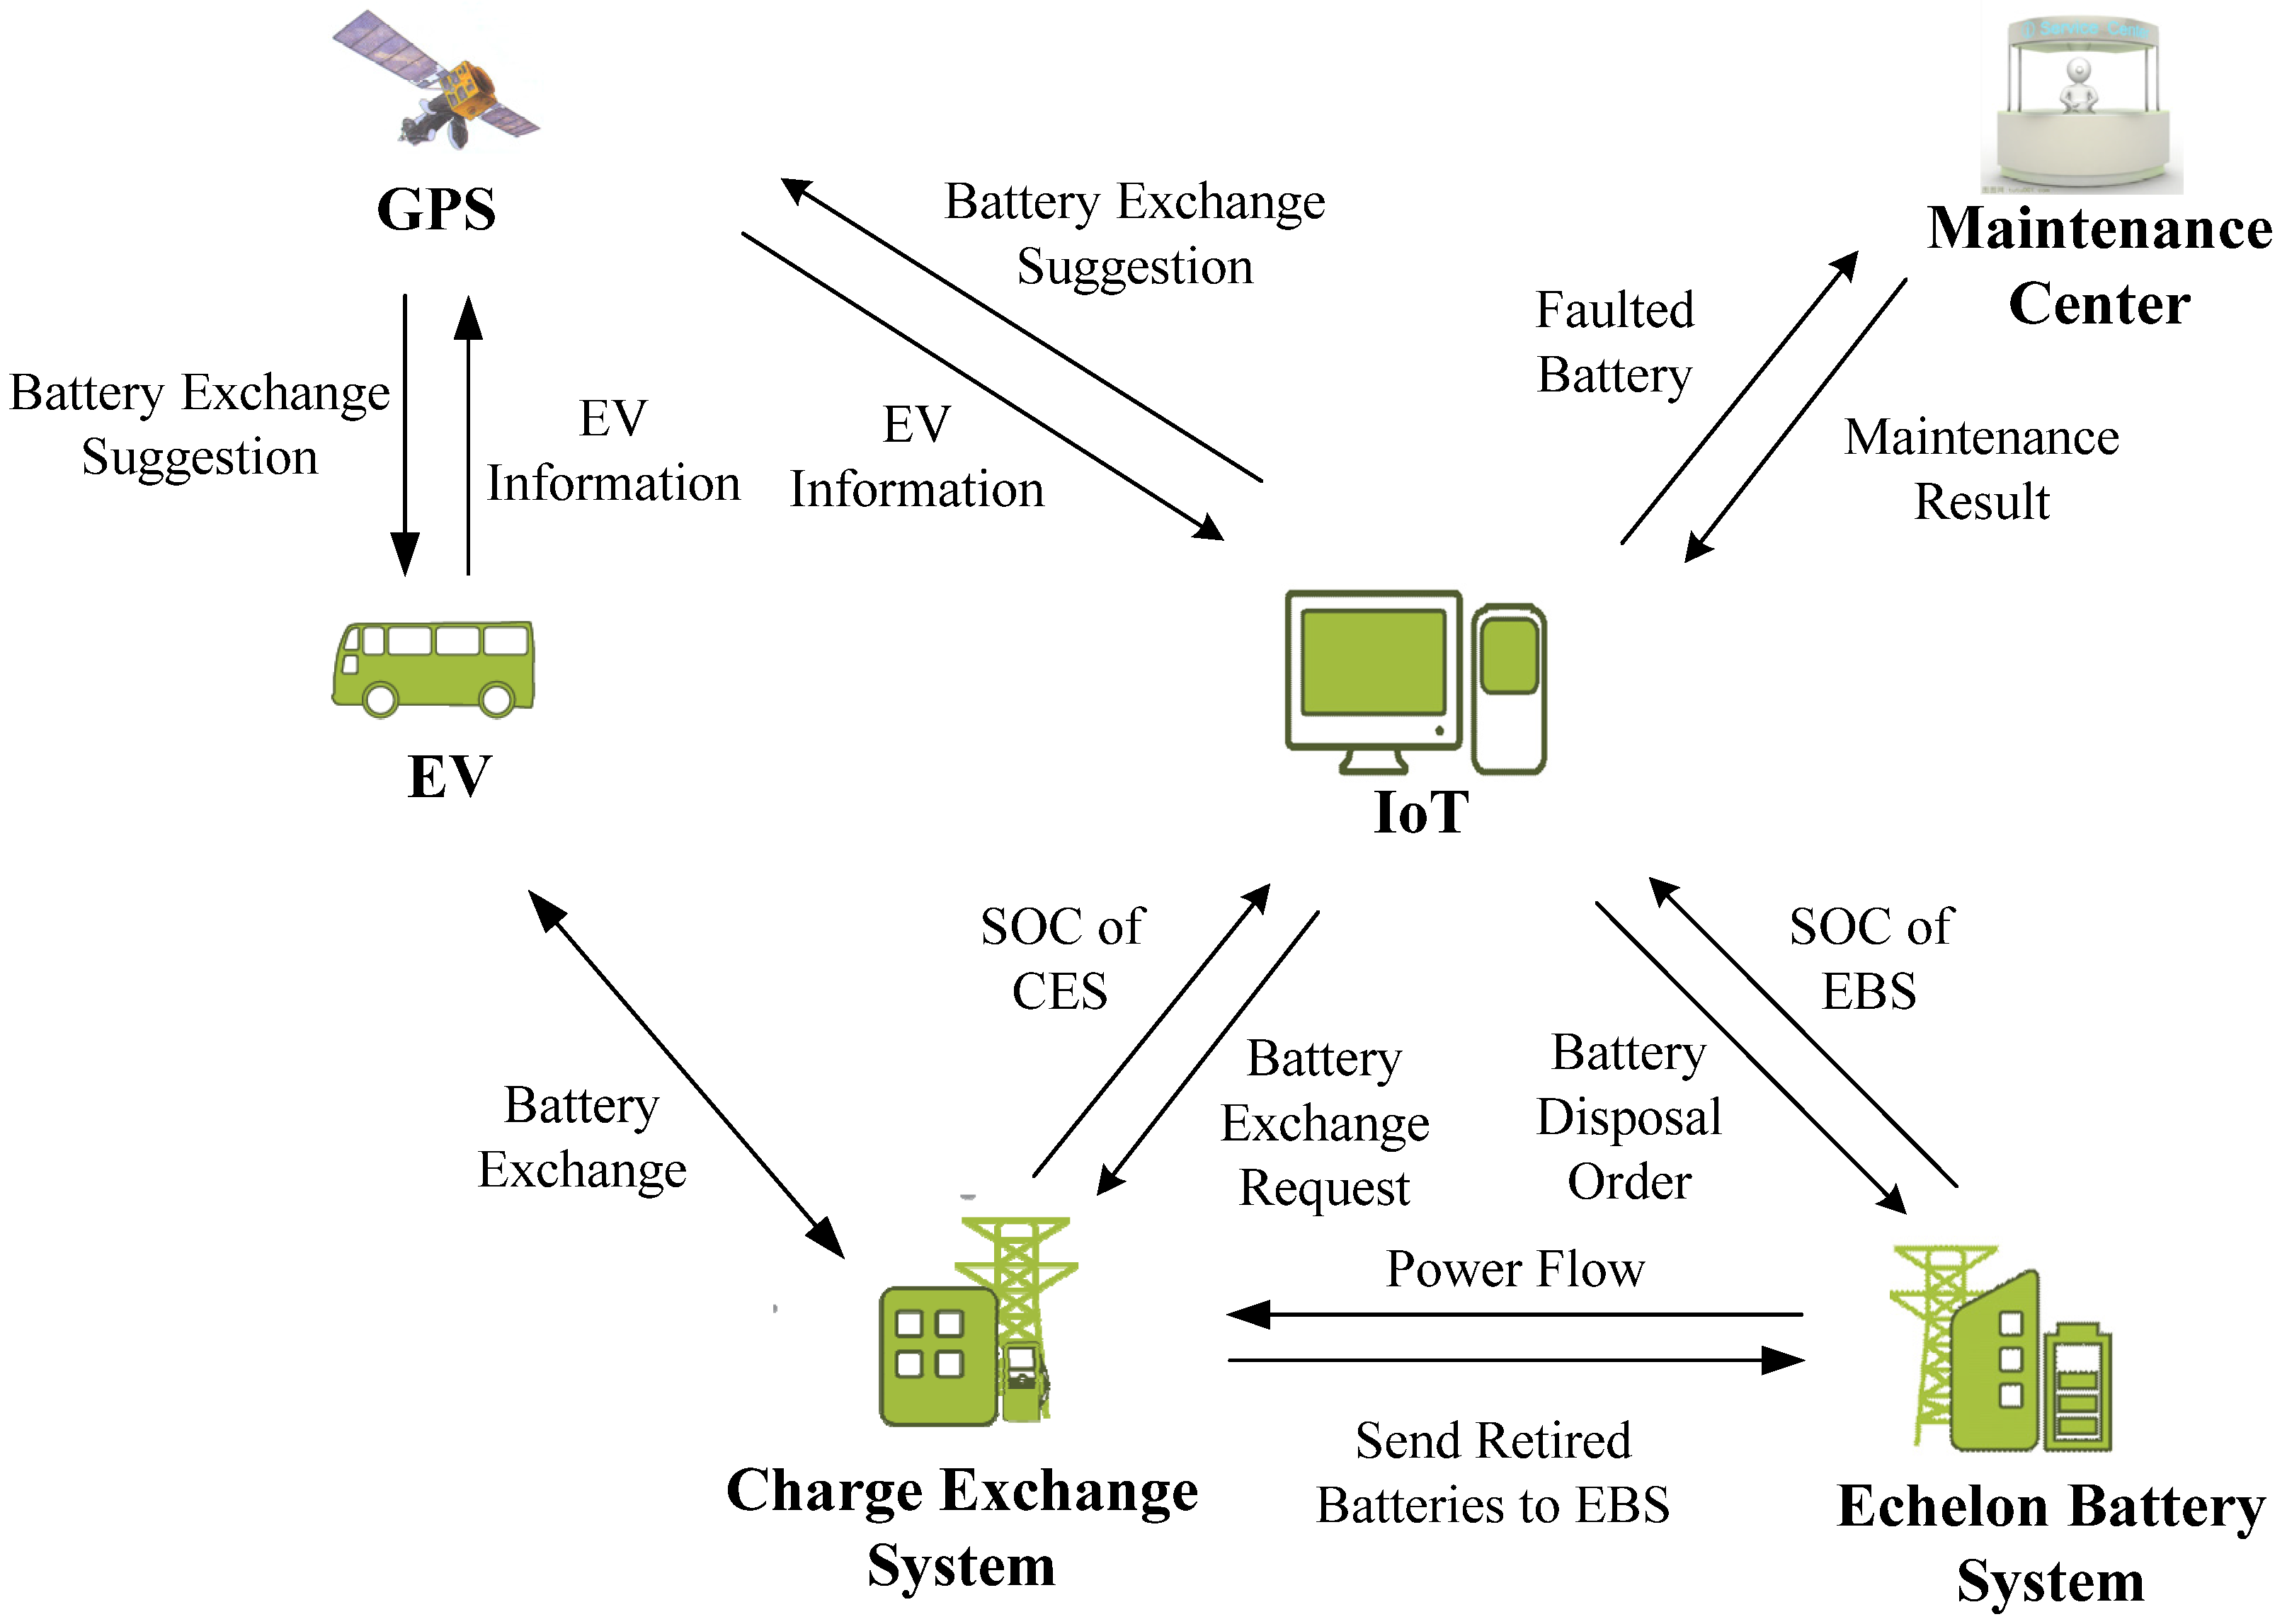
Aiming to overcome the significant exchanging demand of batteries caused by a large level of EV penetration, internet of things (IoT) and GPS technologies are used to monitor EVs’ operation in order to obtain batteries’ exchanging forecast information.
Figure 6 introduces the battery management in IIS. The IoT system collects information on batteries inside and outside IIS to provide good services for drivers and send dispatching orders to corresponding systems.
As shown in
Figure 6, GPS technology is used to monitor EV locations and collect driving information. IoT needs to estimate the SOC of EVs on-board batteries according to their driving information. Based on the energy capacity of EVs, IoT will provide batteries exchanging suggestions to EVs and send the messages of batteries’ exchanging requests to CES. Based on EVs’ driving information received from GPS, IoT provides additional important services, such as diagnosing EVs’ operating states and sending messages to the maintenance center when an EV is in trouble. Moreover, IoT is able to obtain information from CES/EBS, such as the energy capacity of CES and the operating state of each battery. By detecting the operating status of batteries in CES/EBS, IoT gives dispatching orders, such as sending retired batteries to EBS and transporting faulty batteries to the maintenance center.
Figure 6.
Battery management in IIS.
Figure 6.
Battery management in IIS.
Considering degradation, EV batteries are examined when charging in CES. The batteries in CES are examined periodically and the retired batteries will be sent to the EBS. The batteries in EBS are also checked periodically and some will be abandoned when reaching the end of their lifetime.
3.4. Echelon Battery System
In this paper, we adopted a throughput-based capacity fade model to make full use of retired batteries. The capacity fade model is based on the assumption that, under constant operating conditions, a battery can withstand a certain number of charge/discharge cycles, before reaching its end-of-life.
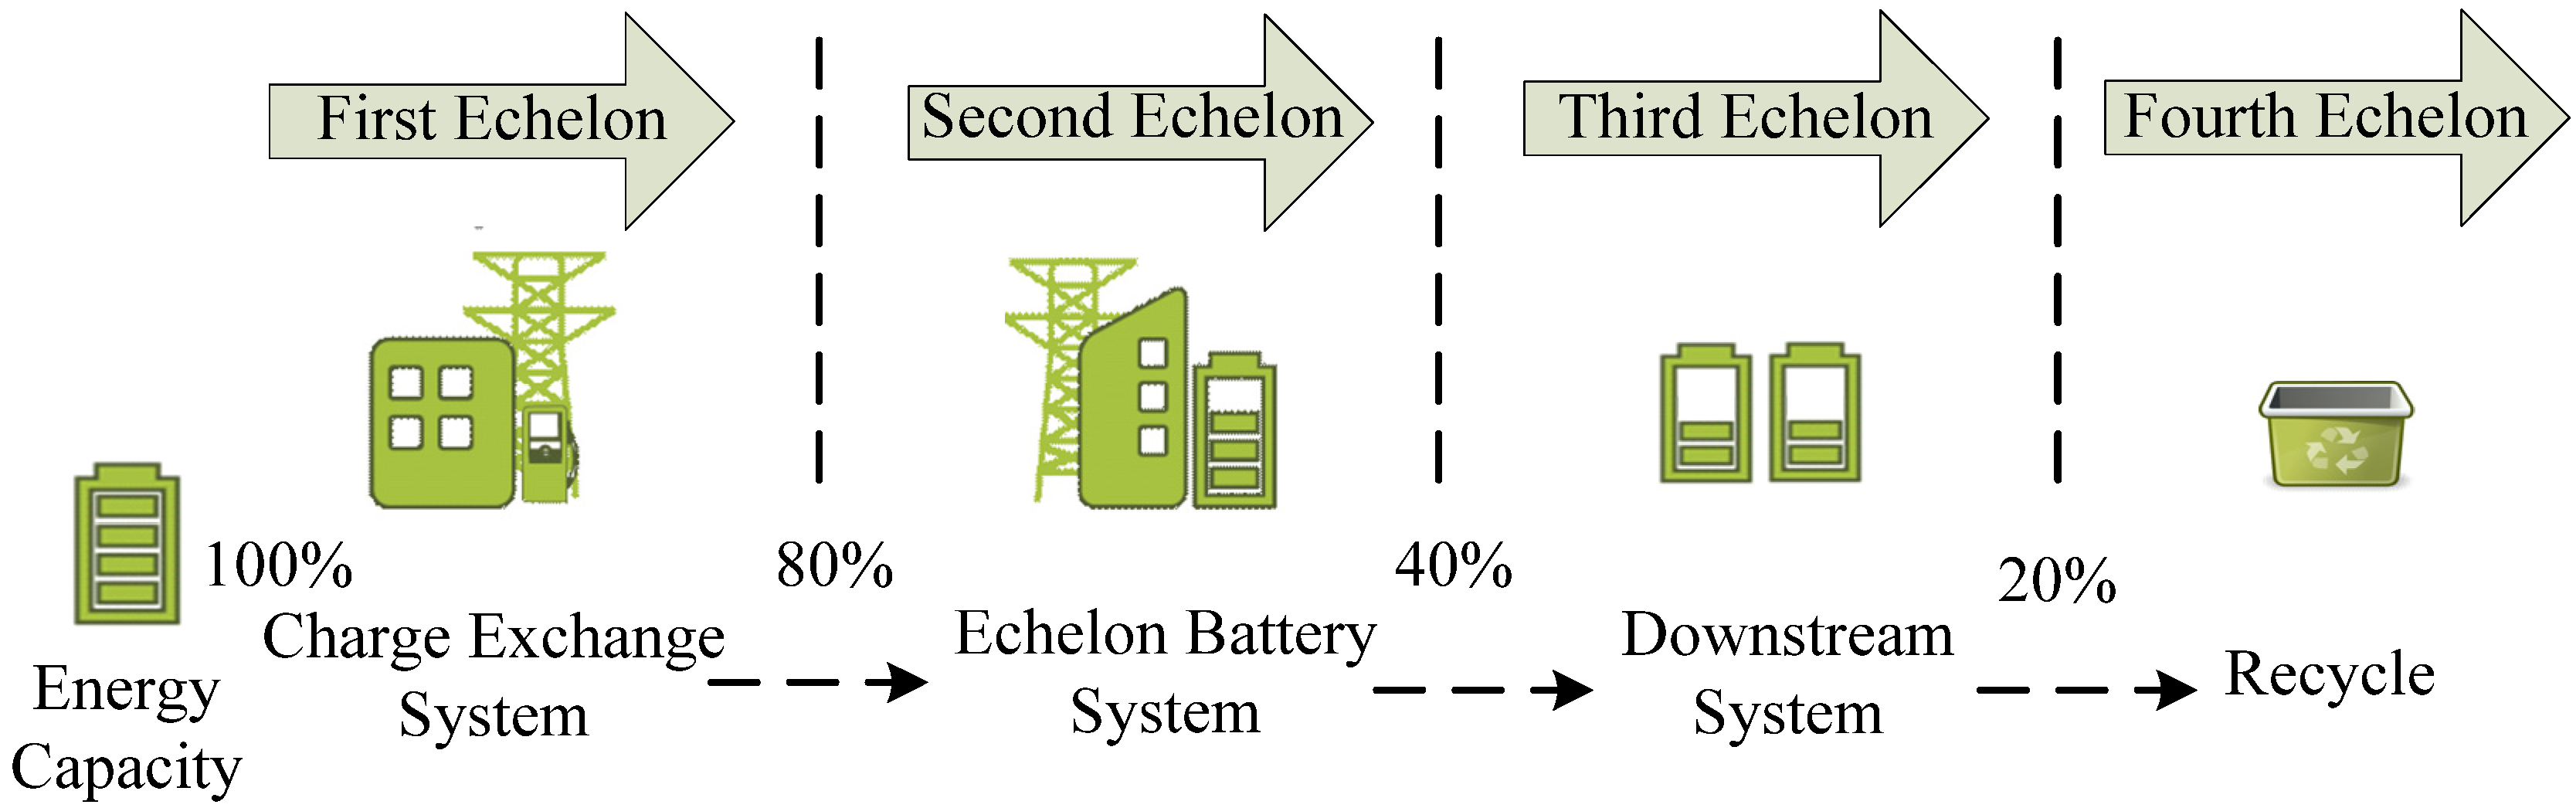
As shown in
Figure 7, according to the energy capacity of a battery, the capacity fade model divides batteries into four echelons:
- ▪
First echelon: batteries with energy throughout no less than 80% of the initial energy capacity. To improve the operating condition of EVs, the energy capacity of EVs on-board batteries should be no less than 80% of the initial value.
- ▪
Second echelon: batteries with energy throughout less than 80% but more than 40% of the initial energy capacity. This echelon is the collection of retired batteries from CES whose energy capacity is less than the service limit. These retired batteries can be used as energy storage device to support the grid.
- ▪
Third echelon: batteries with energy throughout less than 40% but more than 20% of the initial energy capacity. Batteries in this echelon are not suitable for frequent charging/discharging due to their low energy capacity. They can be used in downstream system which has no strict demand for battery capacity.
- ▪
Fourth echelon: batteries with energy throughout less than 20% of the initial energy capacity. Since the battery is not suitable for discharging over 20% of its initial capacity, batteries in this echelon should be recycled.
Figure 7.
Echelon exploitation of batteries.
Figure 7.
Echelon exploitation of batteries.
Here, we mainly consider batteries of the first two echelons in the IIS. The EBS is expected to provide backup energy supply for CES by delivering electric power to CES through DC/DC converters during high-demand exchanging periods. Clearly, as the EV penetration increases, high concentrations of charging requests over a restricted time period will inevitably cause a sharp drop in energy capacity of CES. In order to alleviate such a severe situation, IoT is employed to monitor the energy capacity of each part in IIS so as to deliver electric power to CES from EBS when needed.
4. Generalized Energy of the IIS
The batteries in IIS exchange electrical power with the power grid in charging/discharging mode. Smart strategies have to be scheduled to control the charging/discharging so as to optimize power flow and energy location. However, direct analysis of energy in IIS is difficult due to the complexity and multi-attributes of energy/power flow in it. In this study, the concept of generalized energy is introduced to analyze power/energy flow in the IIS.
4.1. Energy Distribution in IIS
The energy in IIS can be divided into three parts: (1) energy of all batteries inside and outside IIS; (2) energy exchanged between IIS and the grid; (3) energy consumption of EVs on-board batteries.
(1) Energy of All Batteries Inside and Outside IIS
The energy of batteries includes three parts: energy of batteries in CES, energy of EVs on-board batteries and energy of batteries in EBS. The total energy of all batteries at time
is written as:
where,
is the number of batteries in CES,
is the energy of the
ith battery in CES;
is the number of EVs on-board batteries;
is the energy of the
jth on-board battery;
is the number of batteries in EBS,
is the energy of the
kth battery in EBS.
(2) Exchanged Energy between IIS and the Grid
The energy exchanged between IIS and the grid from time
t0 to
t is written as:
where
m is the number of converters connecting IIS and the grid,
is the number of converters in CES,
is the number of converters in EBS, and we have
;
is the power flow through the
ith converter,
is the power exchanged between CES and the grid through the
jth converter in CES, and
is the power exchanged between EBS and the grid through the
kth converter in EBS. Negative power implies that energy is transferred to the grid from CES/EBS while positive power implies that energy is drawn from the grid to charge the batteries in CES/EBS.
(3) Energy Consumption of On-Board EV Batteries
The energy consumption of EVs’ on-board batteries is:
where
is the number of EVs,
is the electric power consumption of the
ith EV.
(4) Total Energy in IIS
By combining three kinds of energy above, the total energy in IIS at the time
t can be written as:
The total energy in IIS can be analyzed through centralized and decentralized approaches. One common centralized approach divides it into three parts according to the belonging of batteries to optimize the operation of IIS and the dispatching of EVs. Thus, the state Equation (4) becomes:
where
is the energy of CES at the time
t, respectively,
and
are the energy of EBS and EVs on-board batteries at the time
t.
It should be noted that EVs batteries’ exchanging requests and load level of the grid are almost the same every day. Therefore, in order to make the IIS operate in a steady state in the long run, the generalized energy in each system should be periodic; i.e., the energy absorbed and energy consumed are approximately the same in a 24-hour cycle.
4.2. Generalized Energy
The normal concept of energy is defined as the integral of power flow for a certain time interval. Here, we consider the abrupt change of energy in IIS and EVs in the batteries’ exchanging process. The concept of generalized energy proposed in this paper is defined as the combination of all types of electrical energies in IIS and EVs, including energy consumption of EVs, the integral of power flow in IIS and abruptly changing energy during the batteries’ exchanging process.
In order to analyze the energy flow systematically and make an optimal dispatch order, we distribute the generalized energy into three parts: energy in CES, energy in EBS and that of EVs on-board batteries. We consider the energy/power flow in one cycle (24 h), which can be divided into 24 time periods, with the time interval of one hour. Here, is the jth time interval, is the initial time of the time interval , is the end point of the time interval . is the generalized energy of CES at the time t in the time interval , respectively, and are the generalized energy of EBS and EVs on-board batteries.
(1) Generalized Energy of the Charge Exchange System
The generalized energy of CES is related to the current time
t and the time interval
written as:
where
is the number of batteries installed on-board from CES in the time interval
, and
is the energy of the
ith one;
is the energy of the
kth battery uninstalled from EVs;
is the number of converters in CES,
is the power exchanged between CES and the grid through the
lth converter. Negative power implies that energy is transferred to the grid from CES while positive power implies that energy is drawn from the grid to charge the batteries in CES.
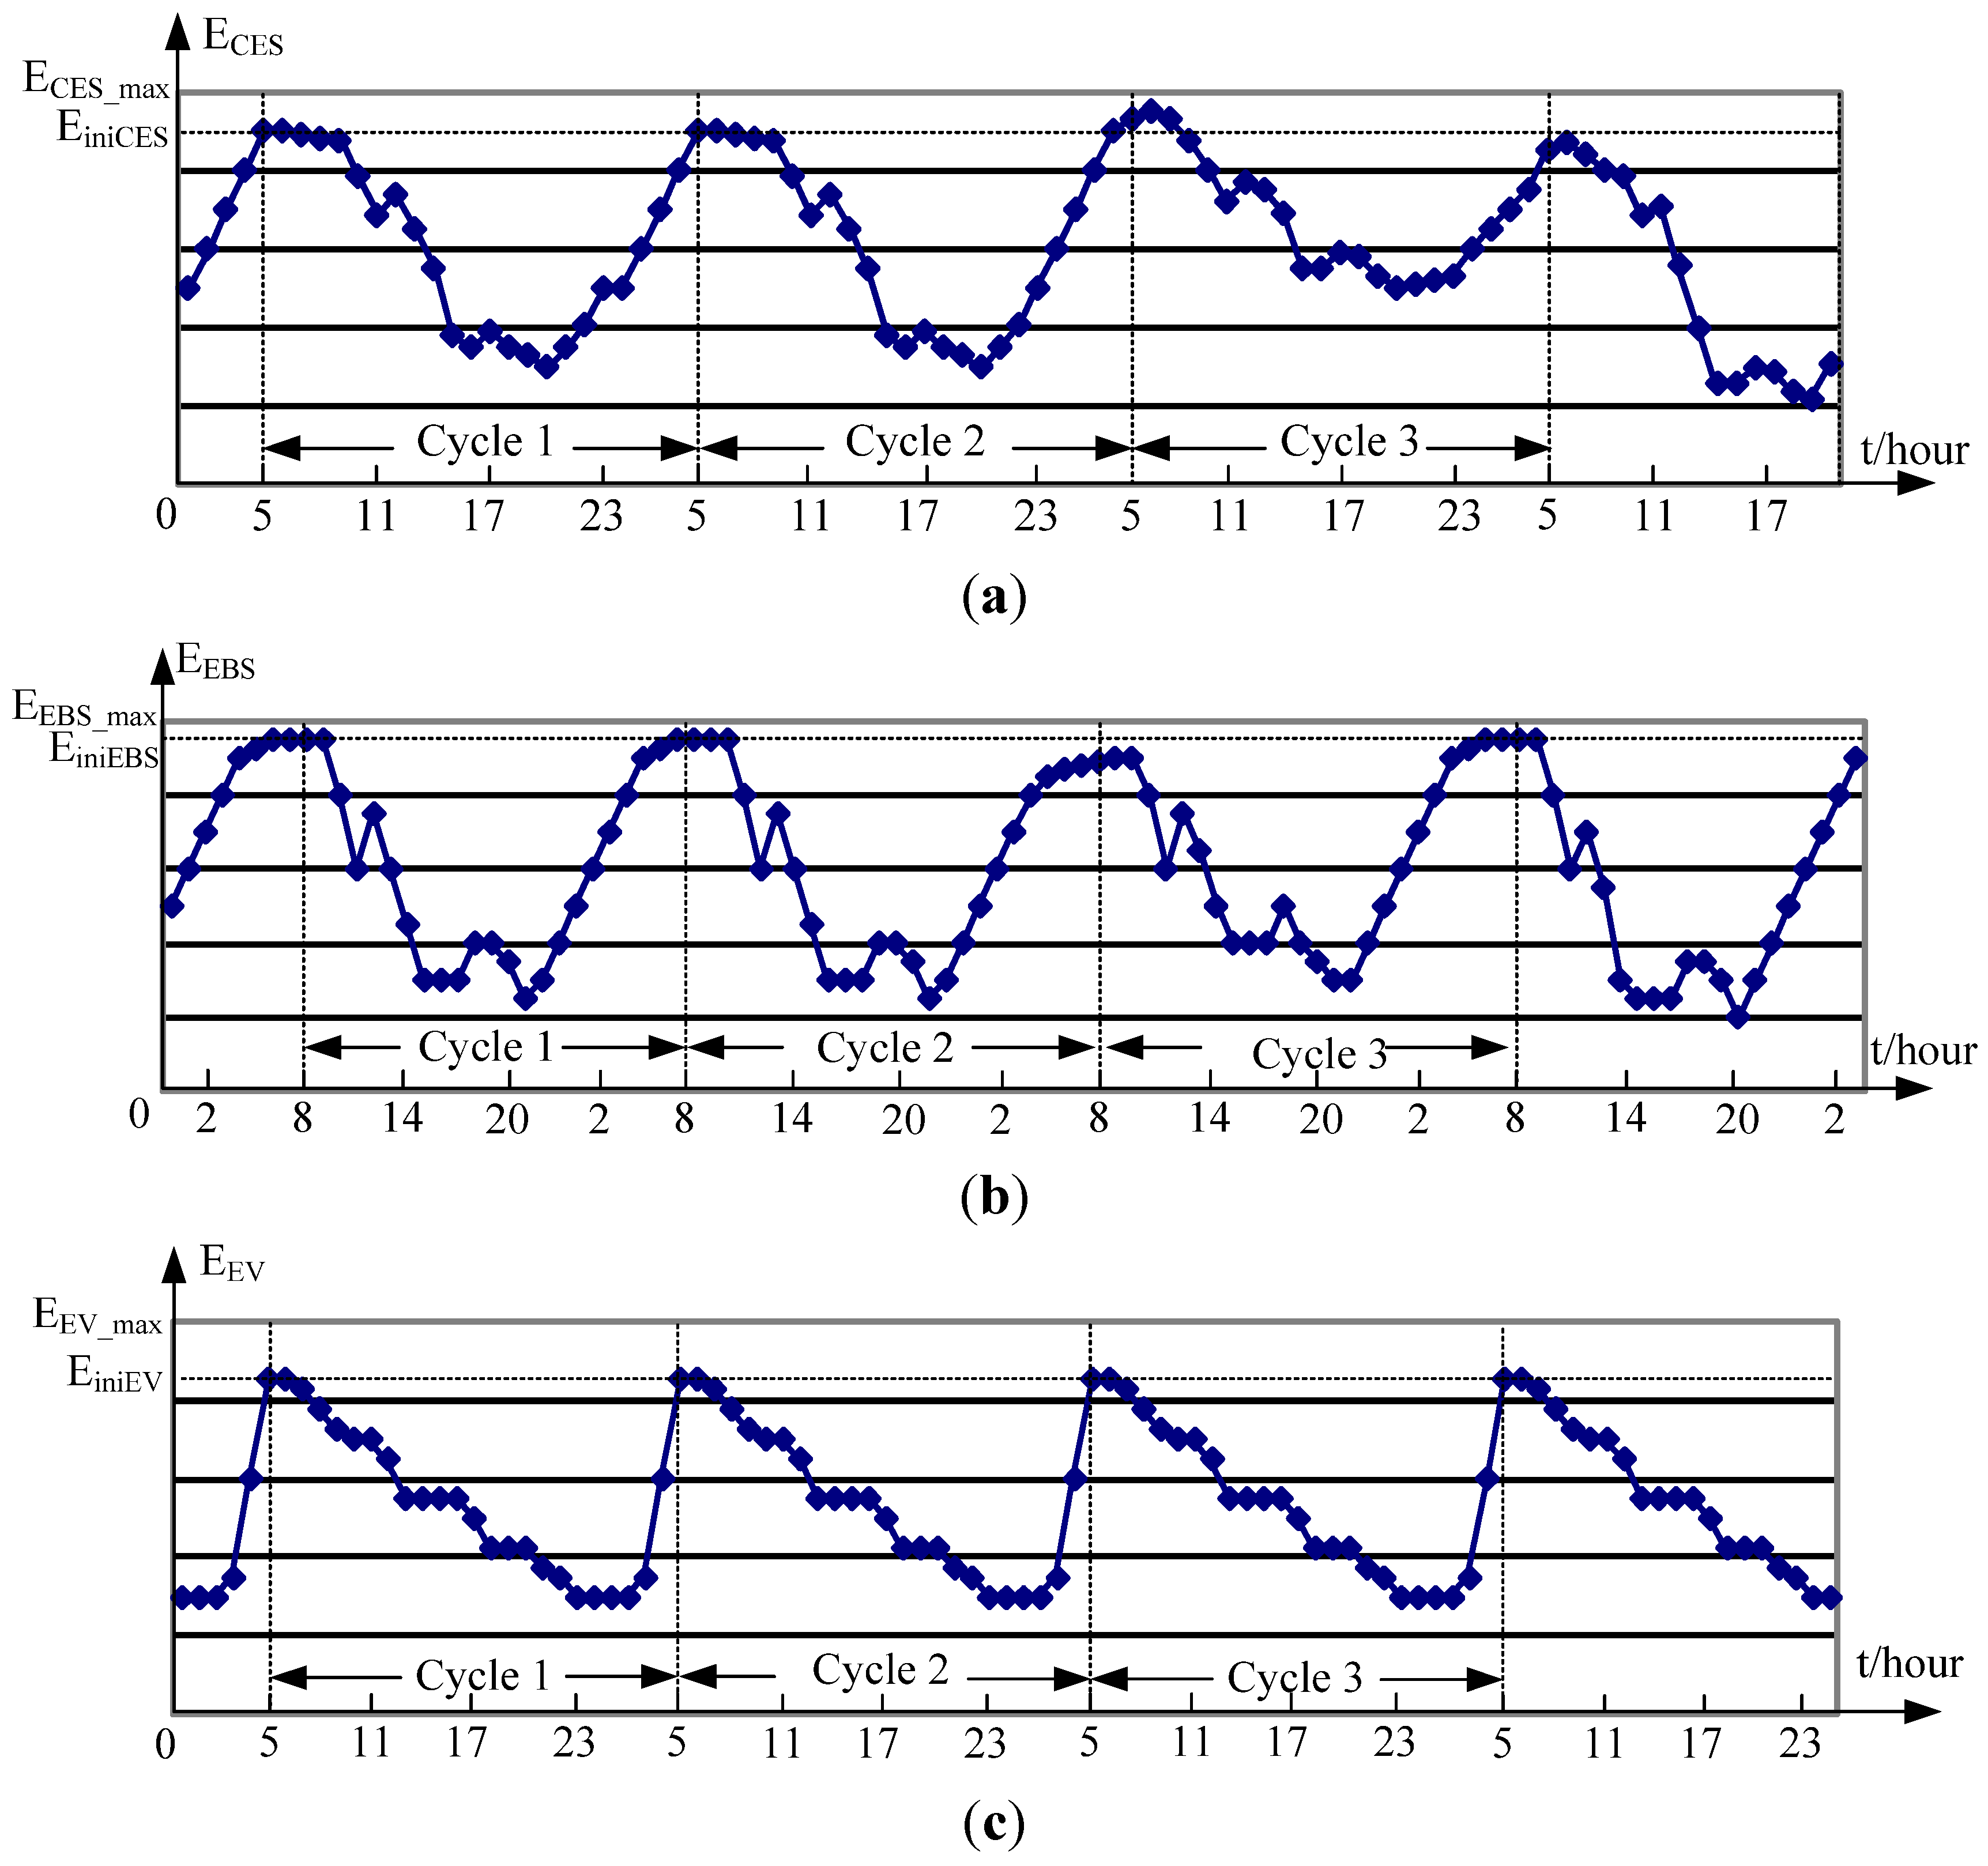
Figure 8 shows the typical energy curves of CES, EBS and EVs in China according to people’s travelling habits. The unit for the horizontal axis is hour. The vertical axis is the energy capacity of different systems and the peak value is the initial energy capacity in one period. It reveals the driving rule of the customers and the changing trends of energy in CES and EBS in two or three cycles. The profiles of generalized energy in different cycles are not exactly the same, but some important time points must be controlled at the same energy level for the long-term operation of IIS. We take the initial time point of each system as the beginning of each cycle and the corresponding value as the initial energy. To sustain the normal operation of IIS in the long run, the initial energy should be at the same level in different cycles. Therefore, the initial time point is an important factor for the charging/discharging process of batteries in IIS. For instance, if the generalized energy in the time point 5:00 is assumed to be the initial value of the day, named
, it should be approximately the same in different cycles.
Figure 8.
Typical operation curve of generalized energy. (a) Generalized energy curve of CES; (b) Generalized energy curve of EBS; (c) Generalized energy curve of EVs.
Figure 8.
Typical operation curve of generalized energy. (a) Generalized energy curve of CES; (b) Generalized energy curve of EBS; (c) Generalized energy curve of EVs.
The energy capacity of CES is closely related to the normal operation of IIS, and the following aspects should be considered: (1) the initial generalized energy of CES should satisfy EV batteries’ exchanging requests even without the support of the grid; (2) CES is able to coordinate with the grid to provide auxiliary services such as peak shaving and valley filling; (3) is less than the maximum capacity of CES. Therefore, should satisfy the following inequalities.
where
is the minimum capacity of CES to sustain its normal operation,
is the permitted maximum capacity.
As the full discharge and charge will have adverse effect on batteries, and therefore are not recommended. In practice,
is about 90% of
:
In Equation (8), is a variable set by operators according to the load level of the grid and EVs batteries exchanging requests in the previous cycle, where generally, .
(2) Generalized Energy of the Echelon Battery System
The generalized energy of EBS is related to the current time
t and the time interval
written as:
where
is the number of converters in EBS,
is the power exchanged between EBS and the grid through the
lth converter. Negative power implies that energy is transferred to the grid from EBS while positive power implies that energy is drawn from the grid to charge the batteries in EBS.
Figure 8b shows the typical generalized energy profile of EBS. According to the load profile of the grid, strategies are made for batteries in EBS to charge from the power grid before 8:00 and discharge to the grid after 8:00.
In accordance with CES, the full discharge/charge of batteries in EBS is not recommended. The initial value of generalized energy in EBS
is about 90% of
:
In Equation (10), is a variable set by operators according to the load level of the grid in the previous cycle, generally .
(3) Generalized Energy of EVs Batteries On-Board
The generalized energy of on-board batteries in time interval
can be written as:
where,
is the number of batteries exchanged from CES in time interval
,
is the energy of the
ith battery exchanged from CES,
is the energy of the
kth battery replaced from EVs,
is the number of EVs,
is the power consumed of the
nth EV.
Figure 8c shows the generalized energy curve of EVs in which the batteries are exchanged at 5:00 in every cycle.
5. Dispatching Control of IIS
The energy capacity of IIS is closely related to the charging/discharging rate, i.e., the power required/available to charge/discharge the batteries in IIS. In scheduling the power exchange between IIS and the grid, cost minimization and service quality improvement are two conflicting aspects. Thus, batteries charging behavior is required to minimize charging costs and achieve satisfactory energy levels.
The energy capacity of CES and load level of the power grid are important factors in determining the charging/discharging of CES. Moreover, the charging/discharging rate should consider EV batteries’ charging/exchanging requests. Considering the energy capacity of CES is closely related with EVs batteries charging/exchanging process, the factor of EVs charging/exchanging can be neglected. It should be emphasized that the charging/discharging rate varies during the charging/discharging process depending on the SOC of batteries and power price, except for grid load condition and energy capacity of the IIS.
Therefore, a novel dispatching strategy is proposed considering both load curves of the grid and energy capacity of IIS to optimize the charging/discharging process of IIS.
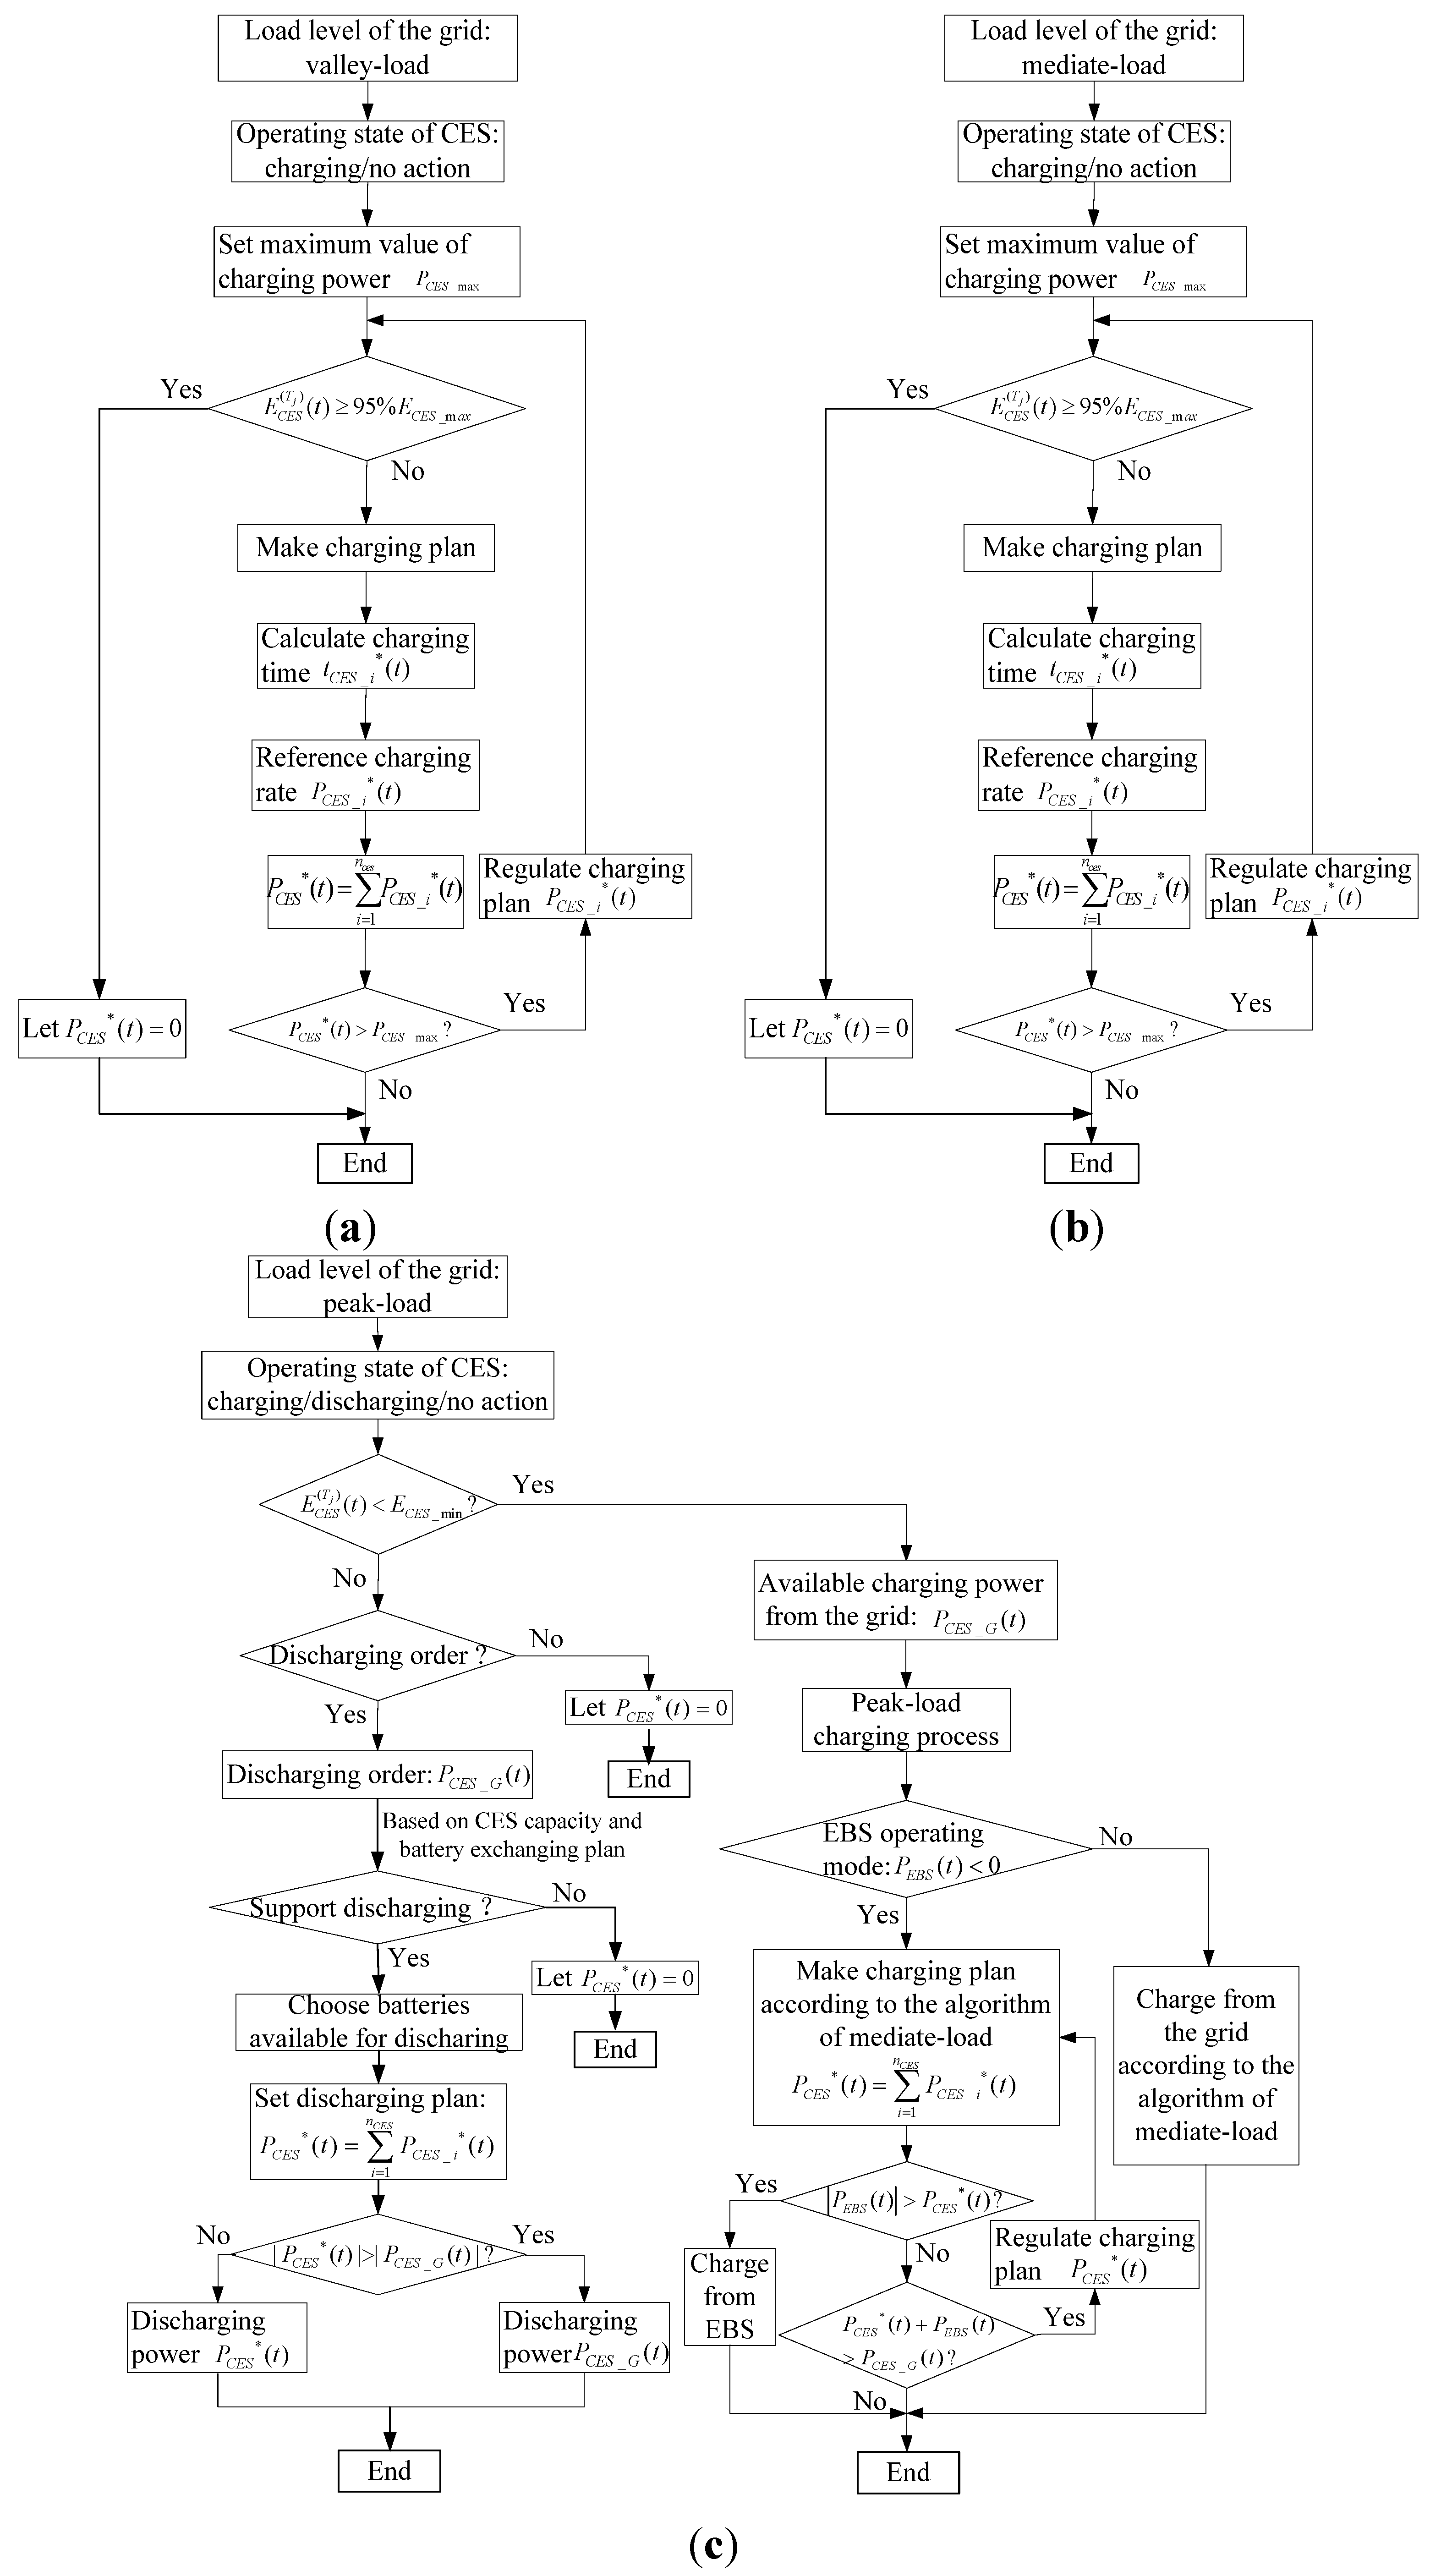
Figure 9 shows the charging/discharging algorithm flows of CES under different load conditions.
Figure 9a shows the charging/discharging flowchart of CES during valley load periods. In this case, the IIS would absorb as much electricity as possible from the grid to realize valley filling to the grid.
Figure 9b shows the charging/discharging flowchart of CES during mediate load periods. Under this condition, energy is drawn from the grid to charge the batteries in CES in limited charging rate until all the batteries are at full capacity.
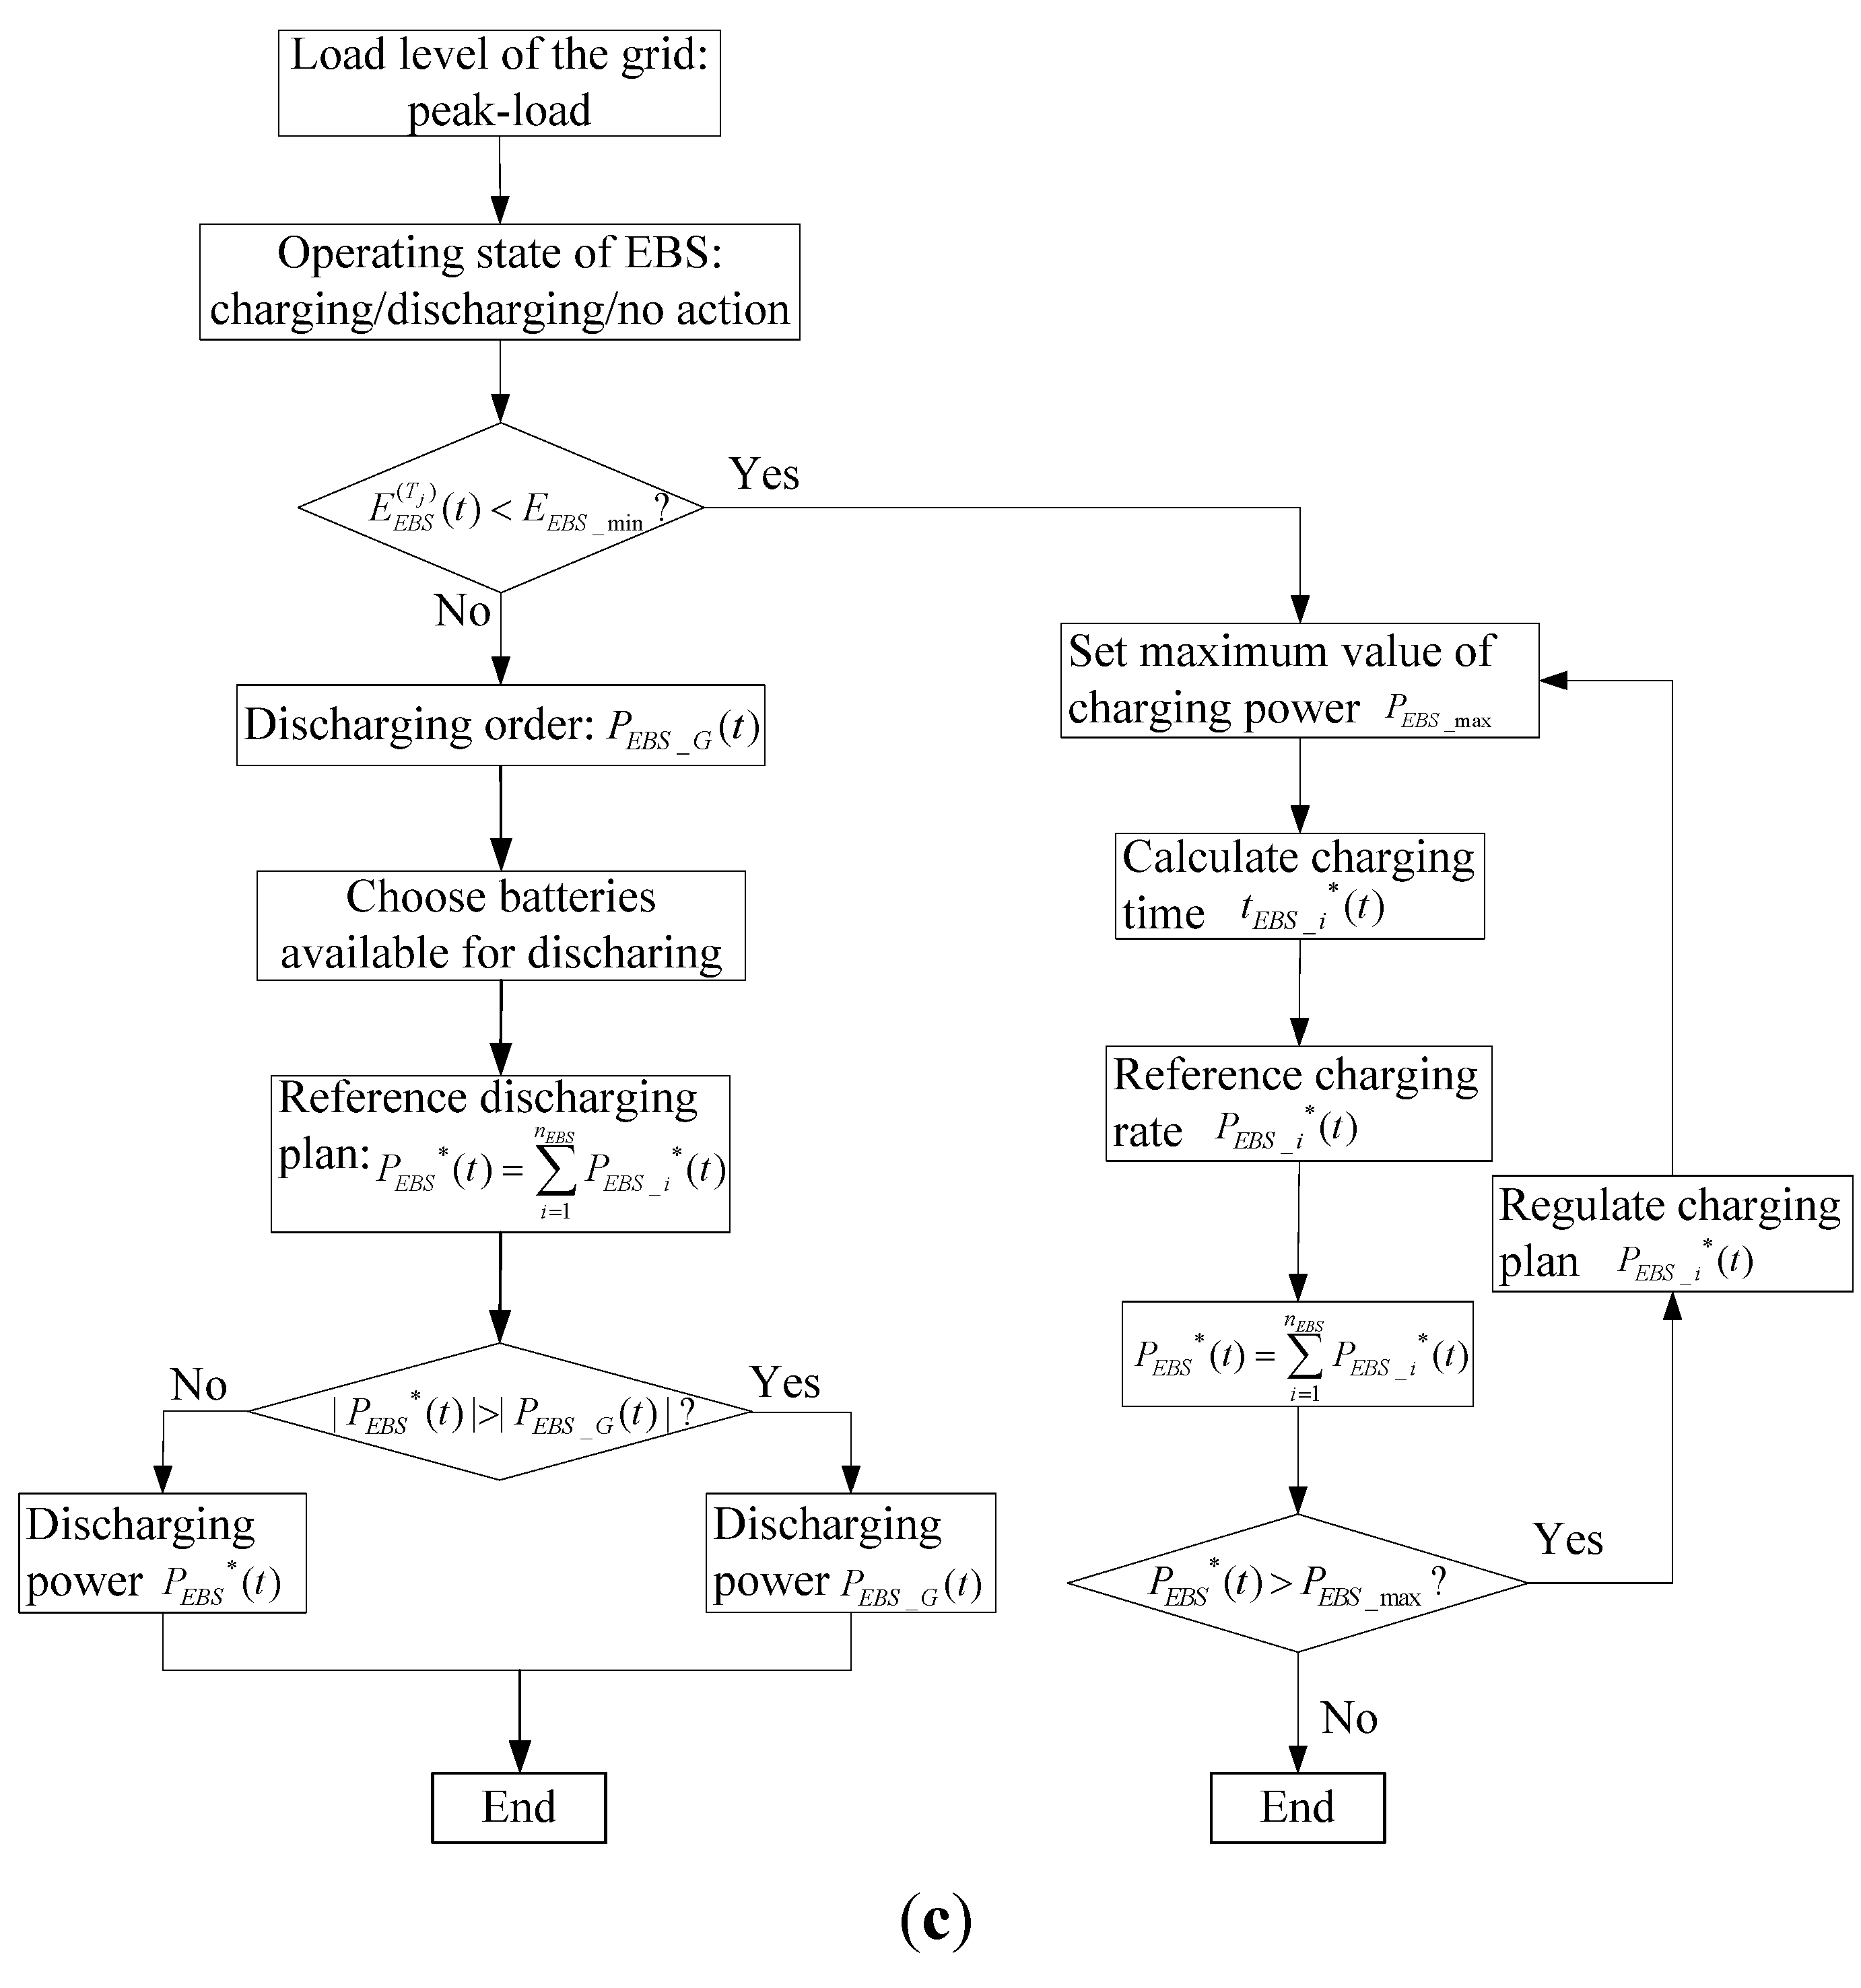
During peak load periods, CES is able to discharge to the grid according to the dispatching order if its energy capacity is high enough, as shown in
Figure 9c. However, when CES operates in charging mode during peak load periods to satisfy batteries exchanging requests, it is optimal to charge from EBS other than the grid to alleviate the burden of the grid. When the energy capacity of EBS is low enough, CES charges from the power grid in a reasonable charging rate, which is similar to the mediate load level condition.
Figure 9.
Charging discharging algorithm of CES at different load status. (a) During valley load periods (b) During mediate load periods; (c) During peak load period.
Figure 9.
Charging discharging algorithm of CES at different load status. (a) During valley load periods (b) During mediate load periods; (c) During peak load period.
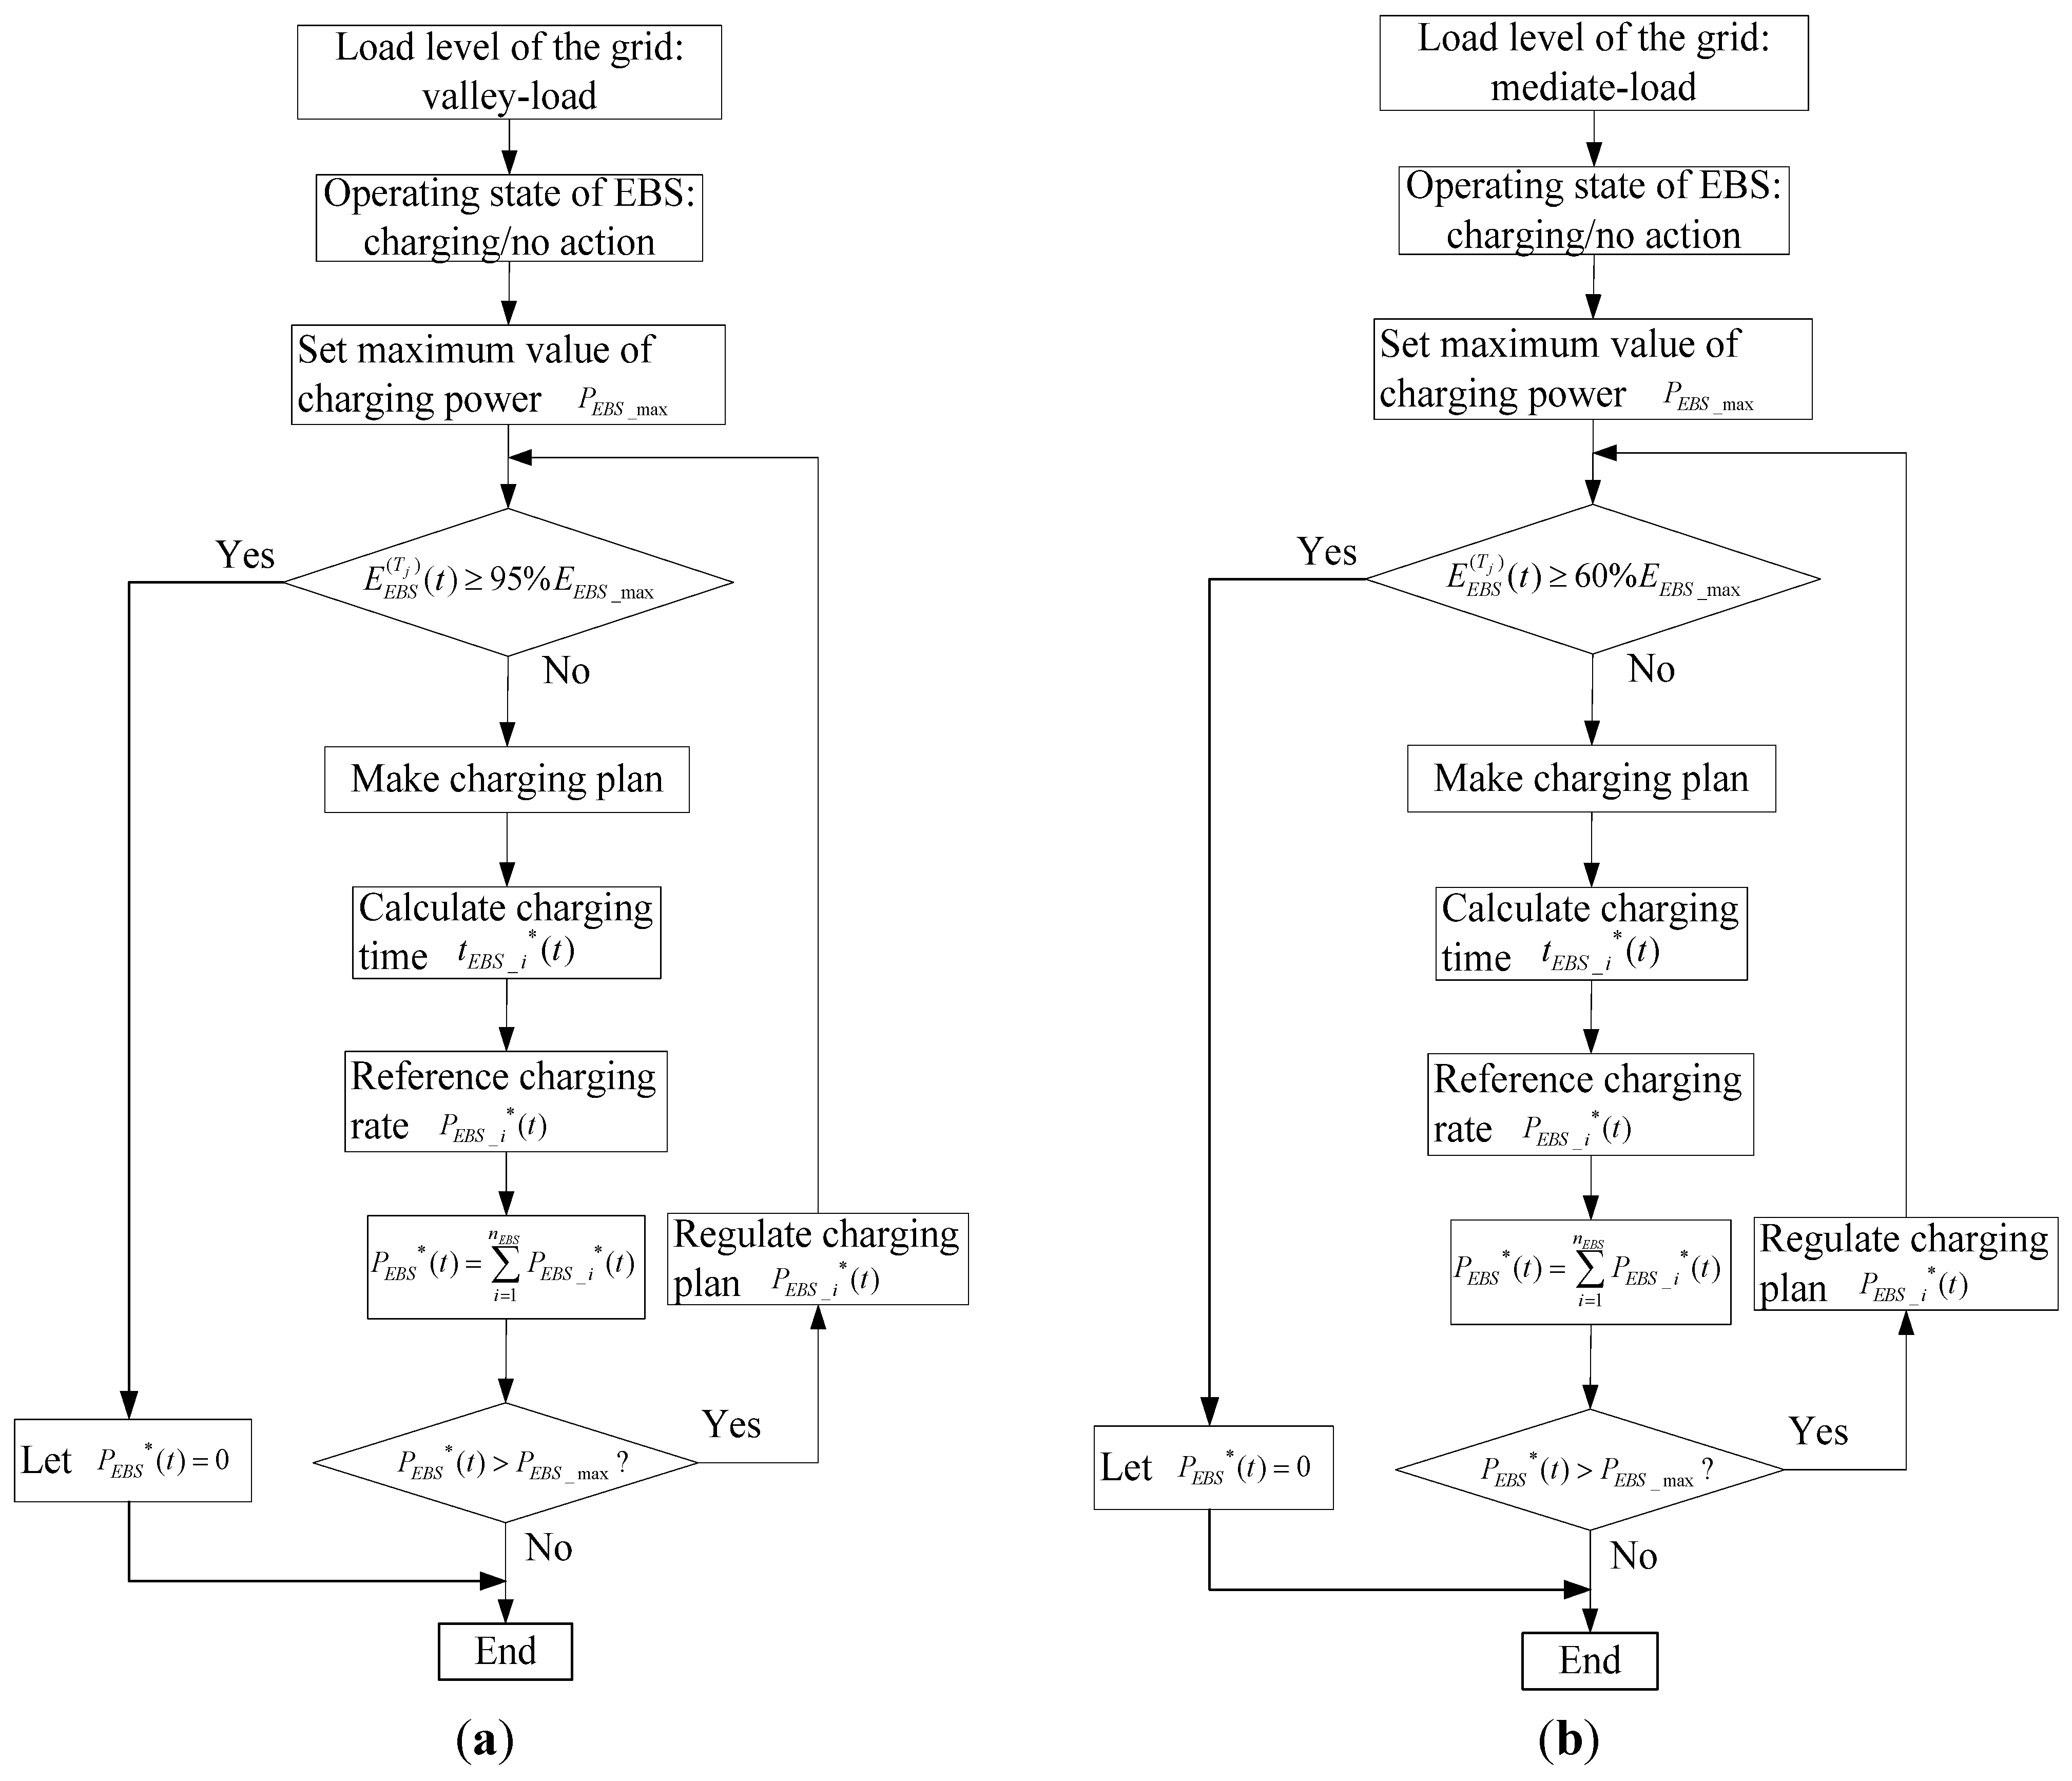
Similarly,
Figure 10 shows the charging/discharging chart flow of EBS under different load conditions. EBS charges from the grid in different charging rate during valley periods or mediate periods. Moreover, the batteries in EBS discharge to the grid during peak periods for shaving peak unless the energy capacity of EBS is low.
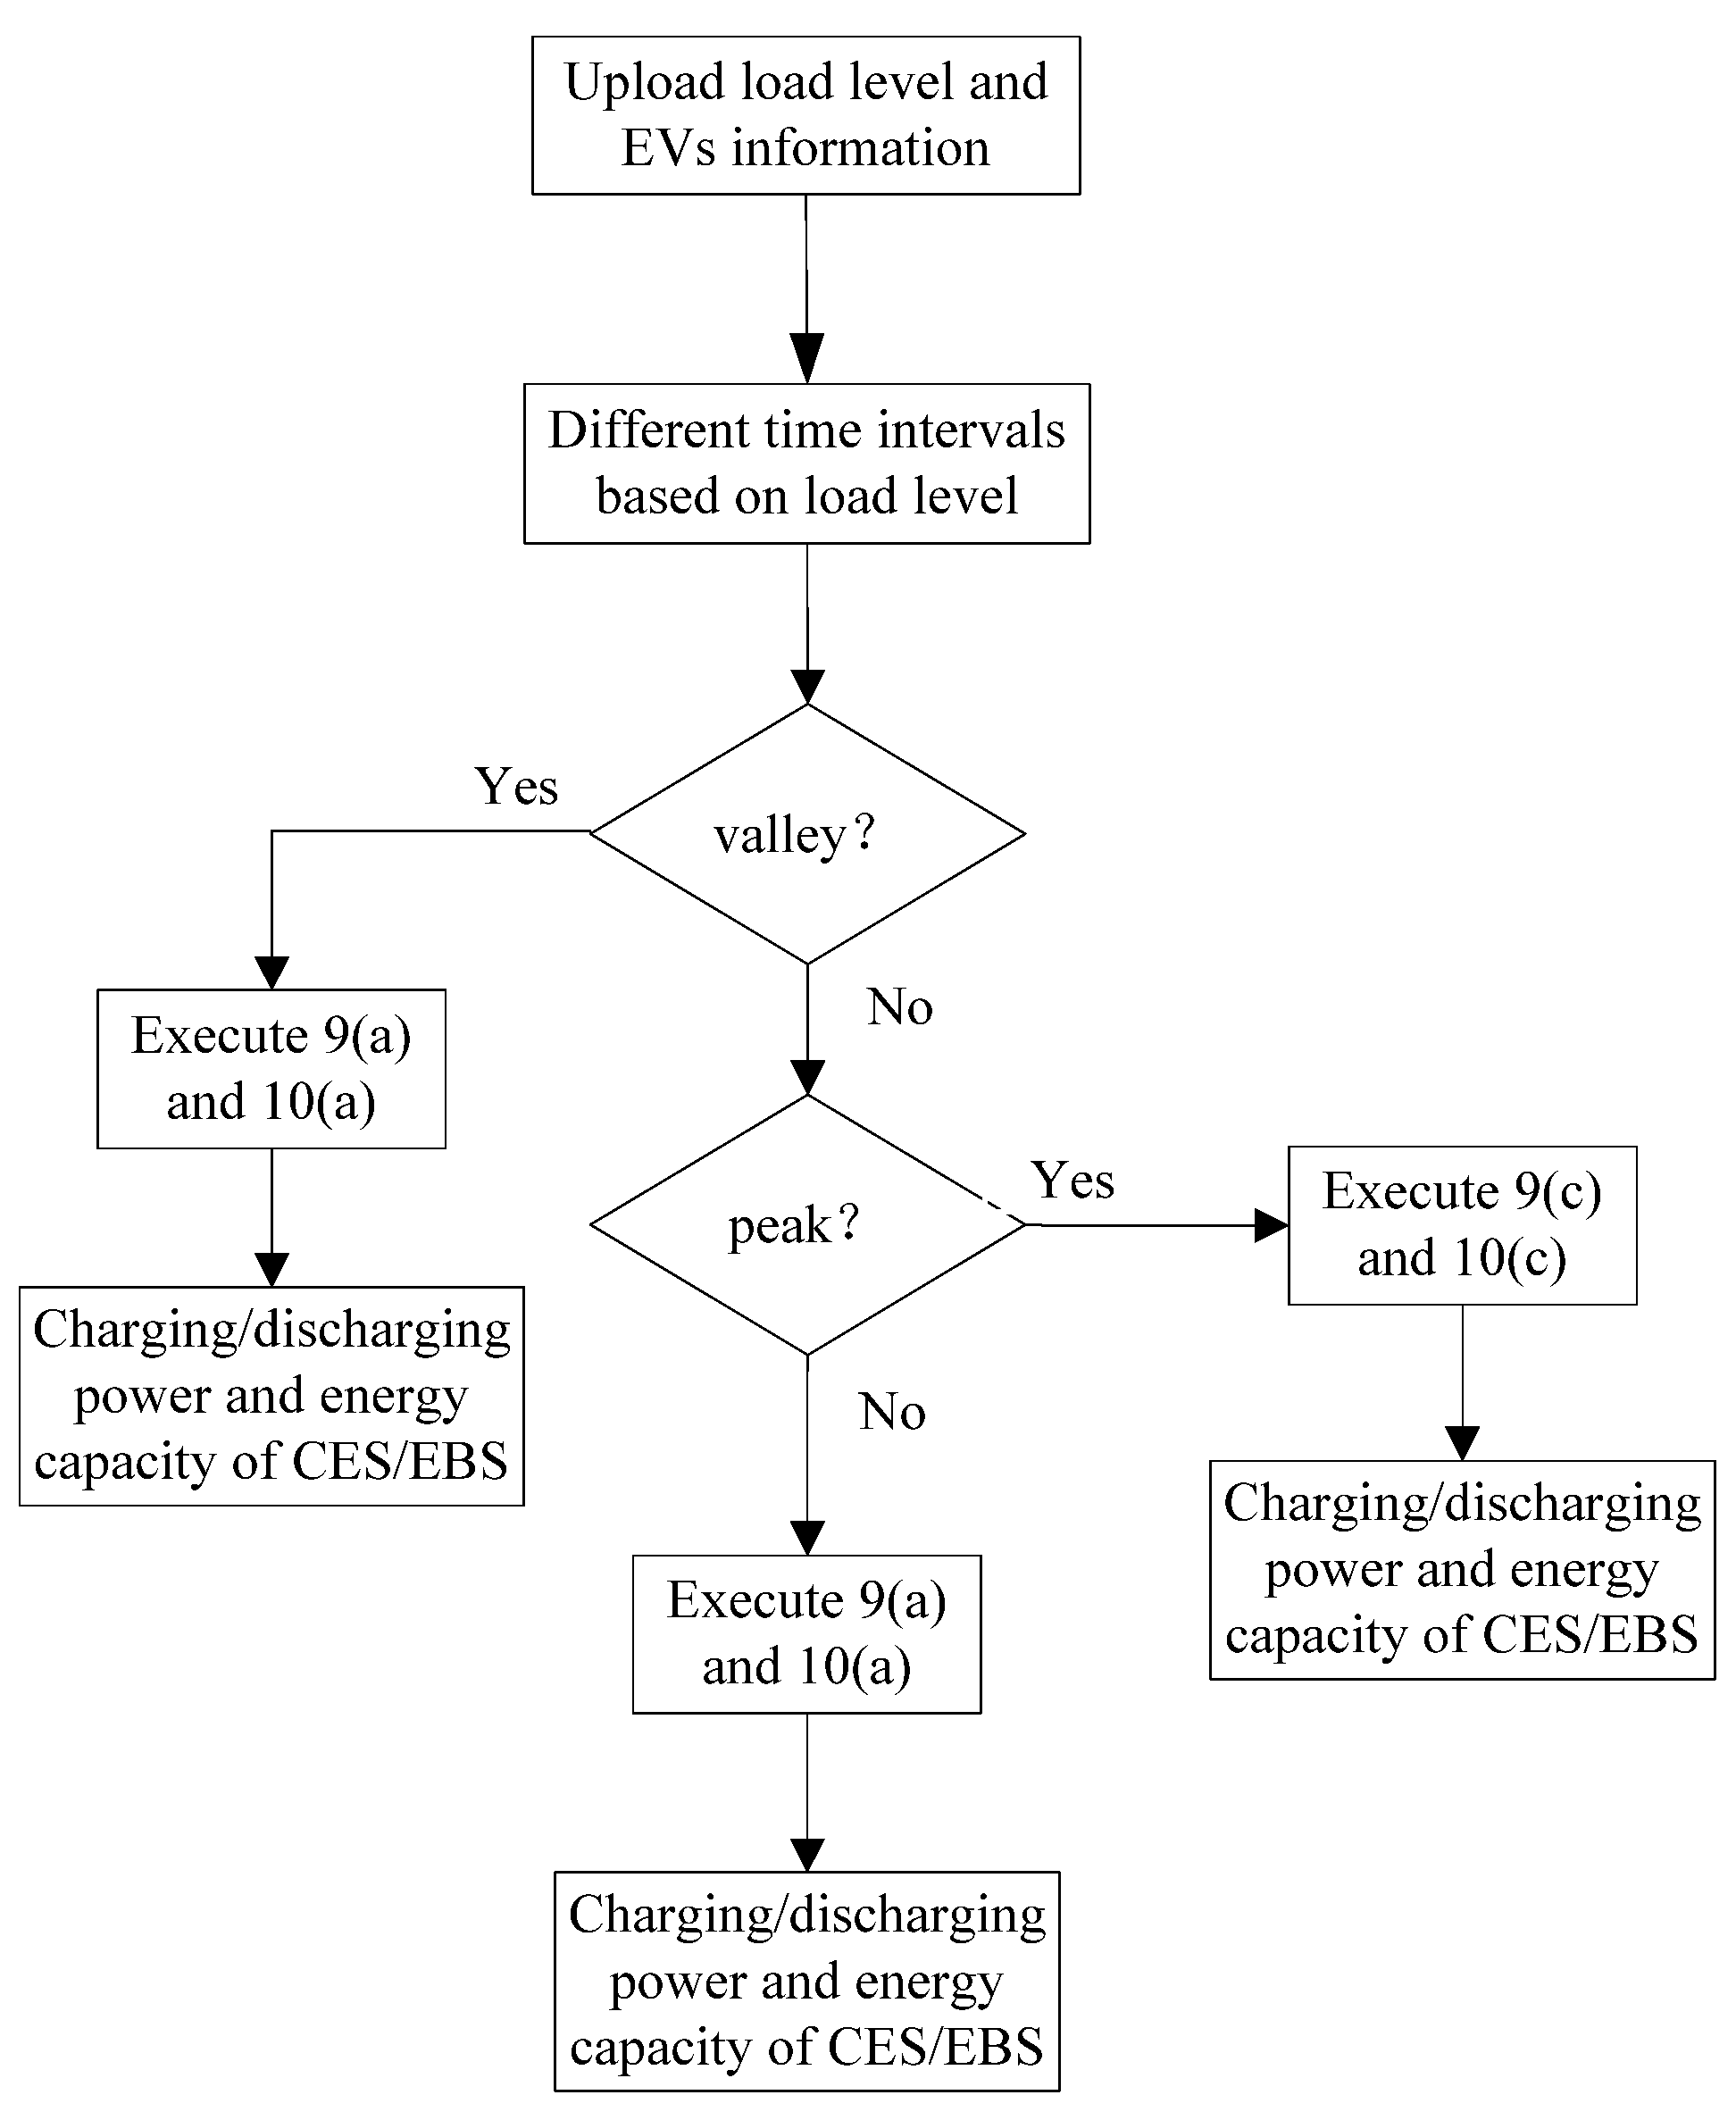
Therefore, we can obtain the charging/discharging flowchart of IIS overall, as shown in
Figure 11.
Due to the high cost of electricity during peak hours, batteries charging should avoid critical peak periods. Therefore, a prediction-based charging scheme is proposed. It predicts the load level based on information from the grid, thus able to control the charging rate according to the load level. The initial charging power
can be expressed by the relationship between the forecasting load curve
and present load level
, that is
where,
is the time interval in dynamic forecasting,
Tc is the available charging time,
Pc is the rated charging power.
Figure 10.
Charging discharging algorithm of EBS at different load status. (a) During valley load periods; (b) During mediate load periods; (c) During peak load period.
Figure 10.
Charging discharging algorithm of EBS at different load status. (a) During valley load periods; (b) During mediate load periods; (c) During peak load period.
Figure 11.
Charging discharging algorithm of IIS.
Figure 11.
Charging discharging algorithm of IIS.
Based on the initial charging power
and the actual load level
at the time
t,
, the optimal charging power in time interval
can be obtained, that is
It is assumed that
and
are constants at time
t. The regulation factor of charging power can be calculated by the deviation of forecasting load
at
and actual load level
at
t. Therefore,
in (13) can be derived. A separate paper is dedicated to the formulation of the optimization of energy estimation and resolving it [
58].
6. Simulation Results of the Charging/Discharging Strategy
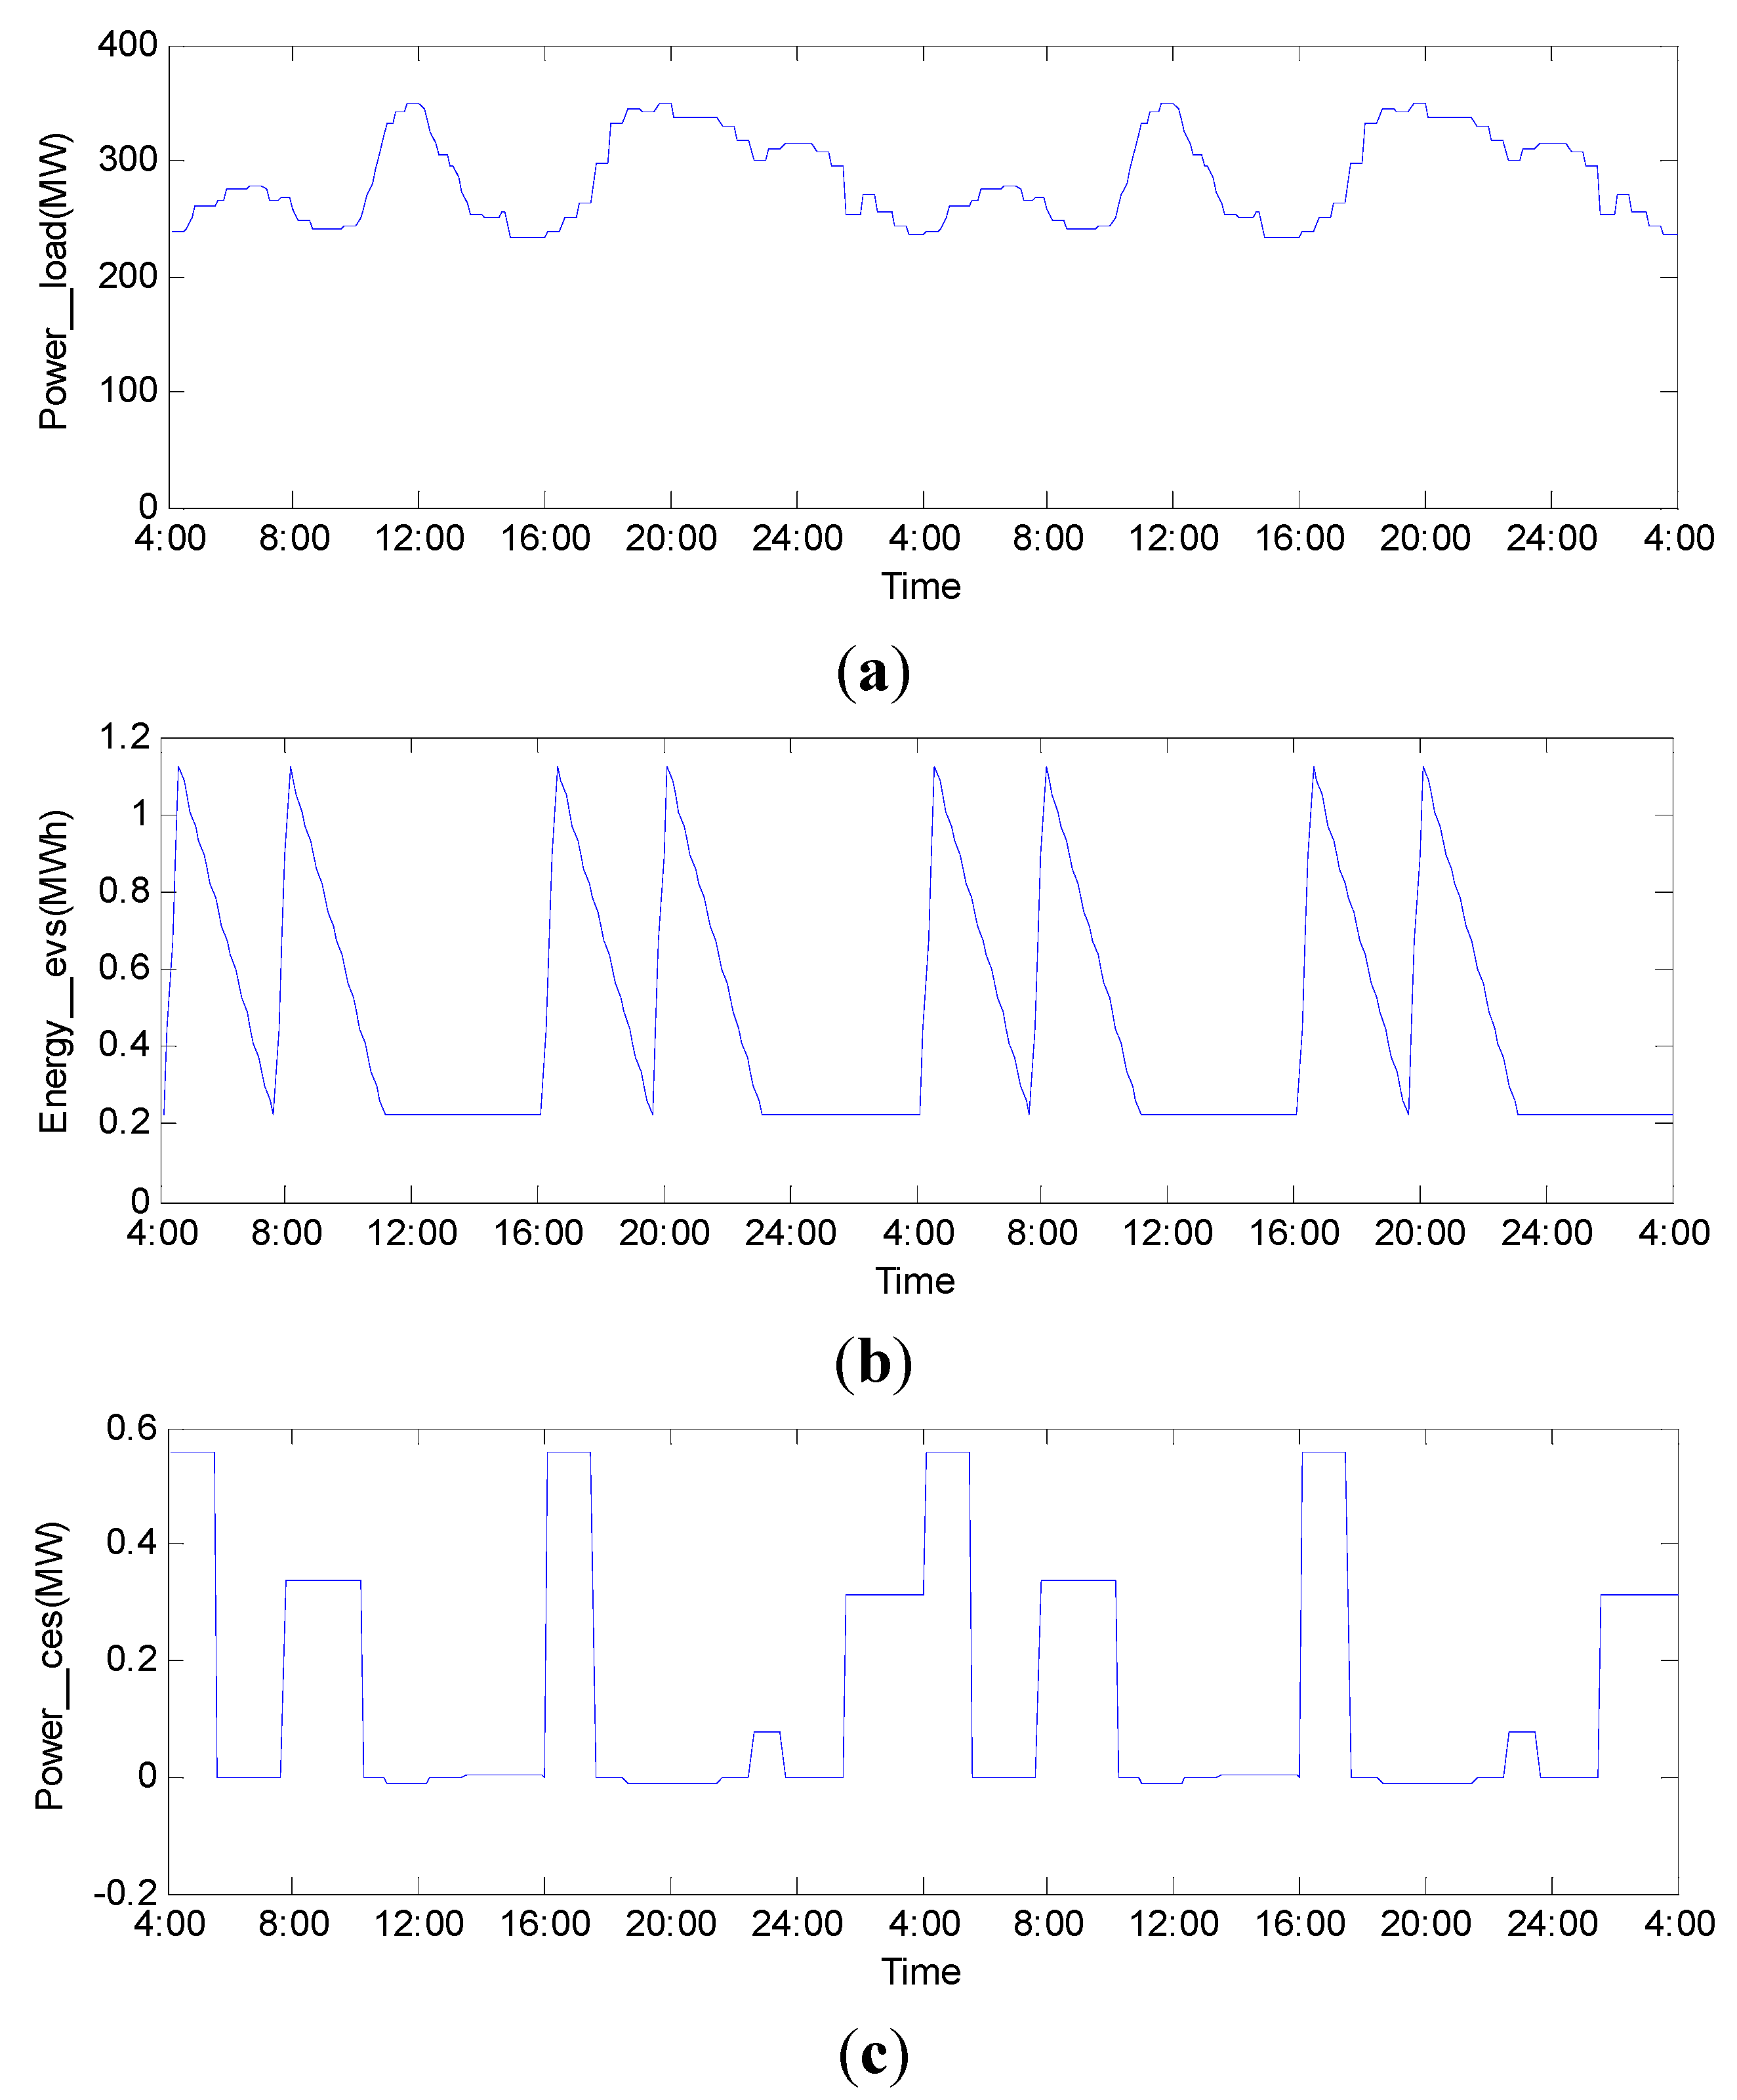
To verify the effectiveness of the proposed charging/discharging strategy, dynamic load profile in two cycles is shown in
Figure 12a for simulation. Ten EVs are divided into two sets, each with five EVs. The first set exchanges batteries twice in one cycle: one is at 4:00, another is at 7:00. Similarly, the second set exchanges batteries at 16:00 and 19:00. Respectively, the EVs energy capacity is shown in
Figure 12b.
Figure 12.
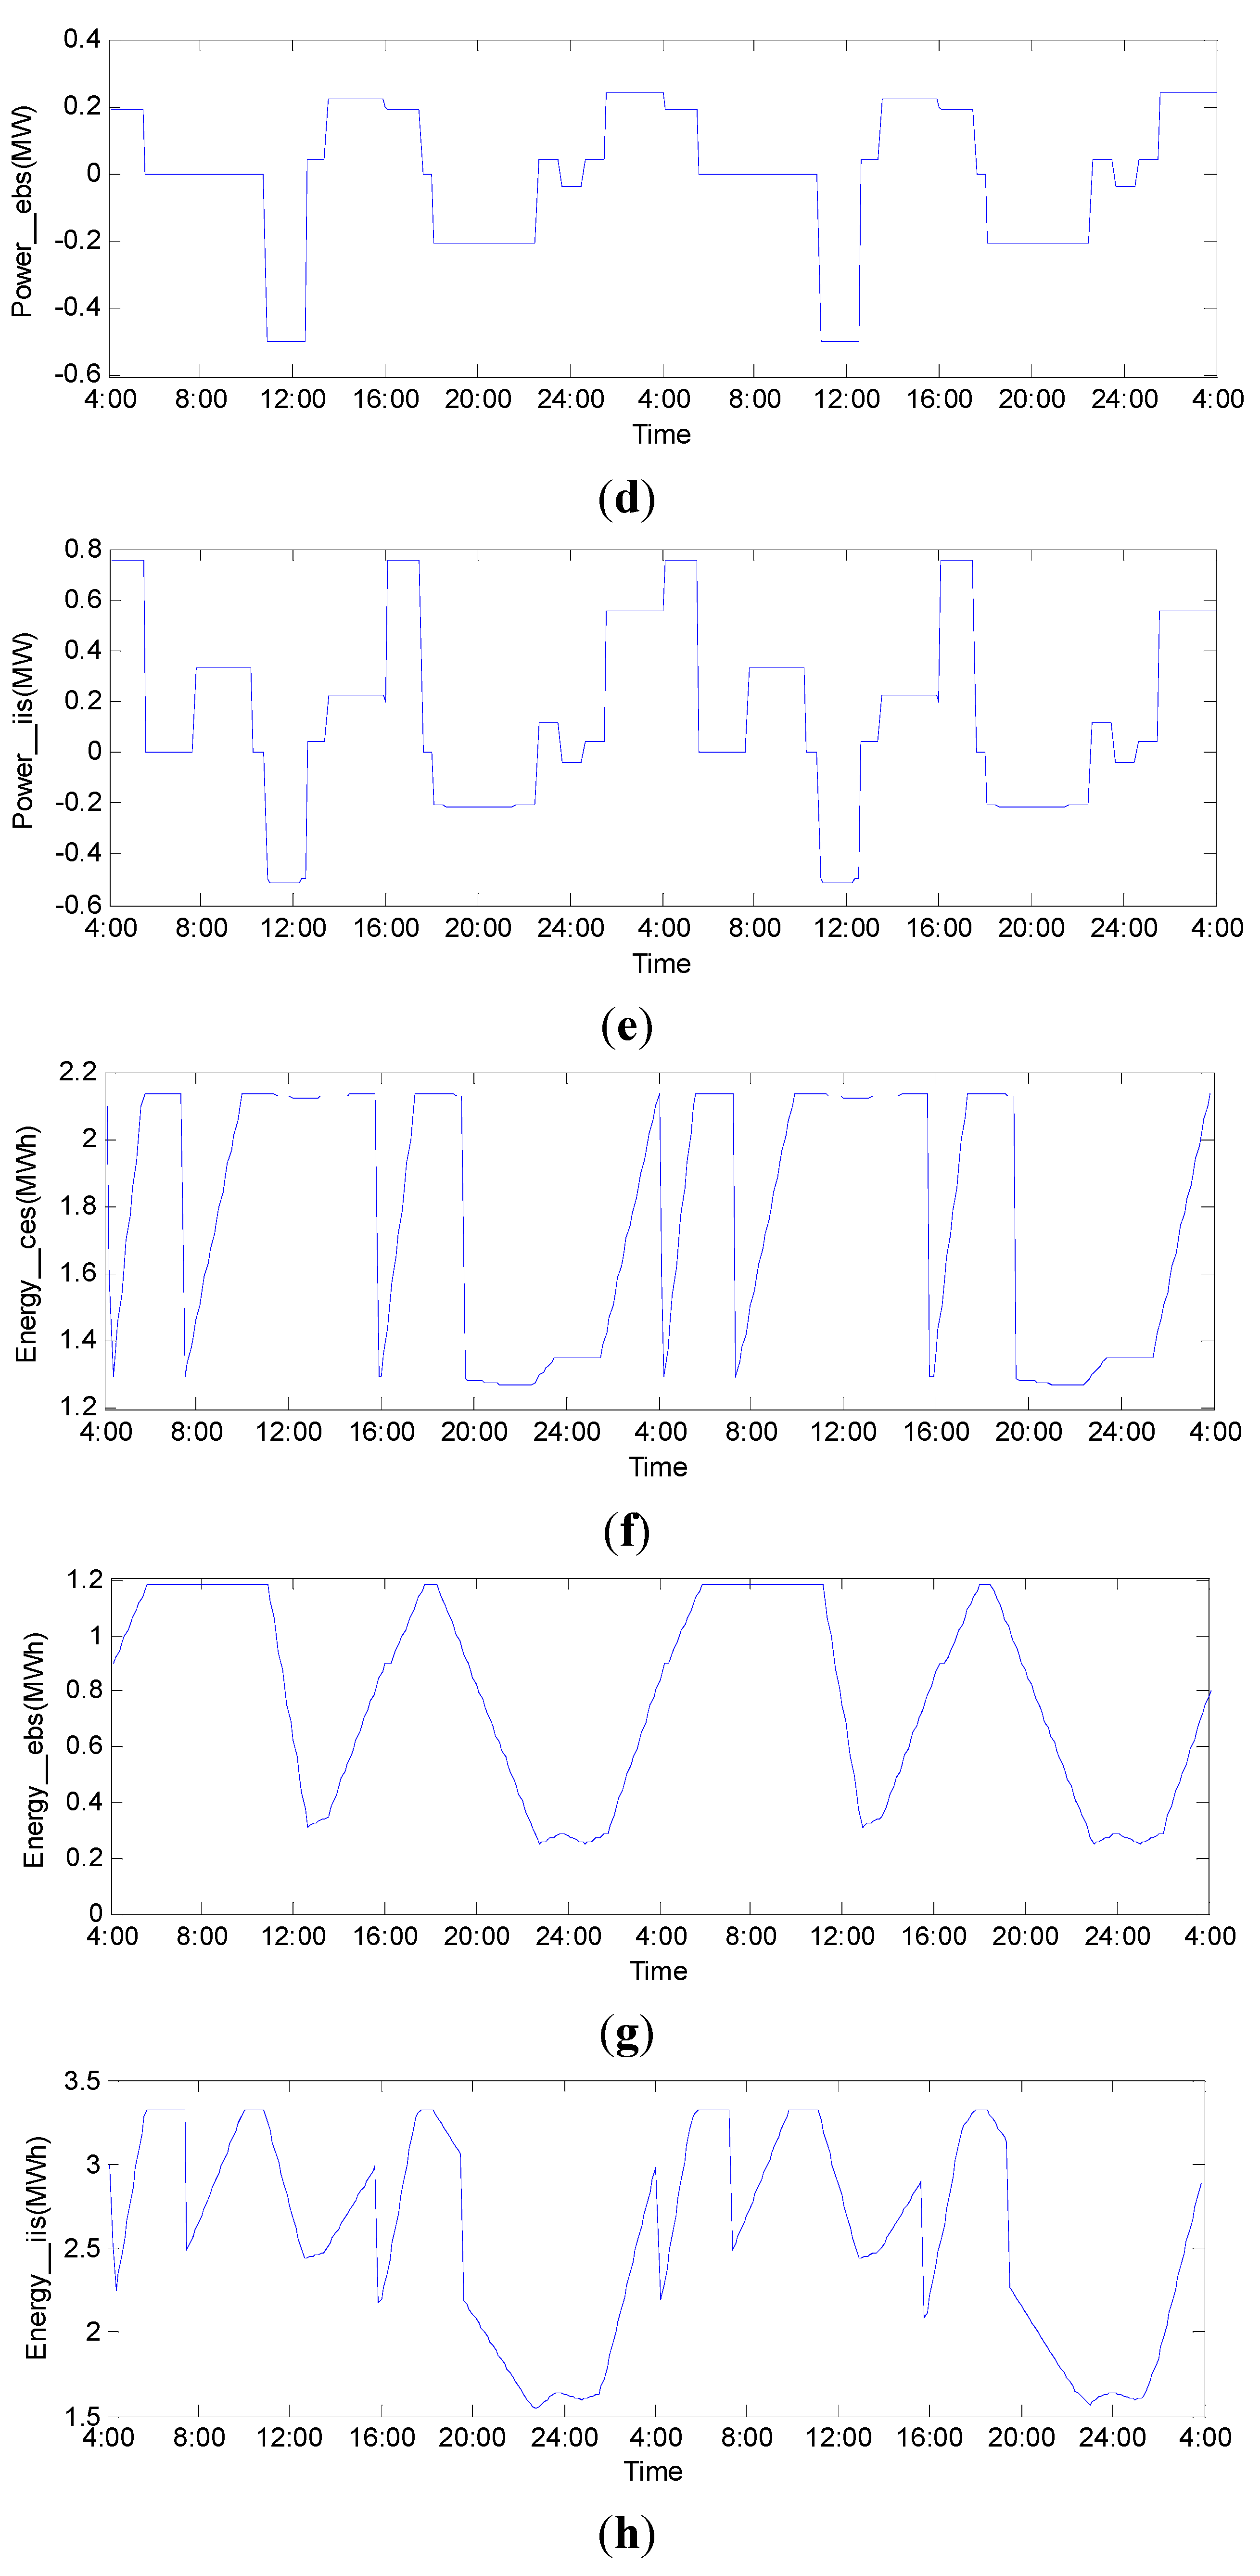
Simulation results of the proposed charging/discharging strategy. (a) load curve; (b) energy curve of EVs; (c) charging/discharging power of CES; (d) charging/discharging power of EBS; (e) charging/discharging power of IIS; (f) energy capacity of CES; (g) energy capacity of EBS; (h) energy capacity of IIS.
Figure 12.
Simulation results of the proposed charging/discharging strategy. (a) load curve; (b) energy curve of EVs; (c) charging/discharging power of CES; (d) charging/discharging power of EBS; (e) charging/discharging power of IIS; (f) energy capacity of CES; (g) energy capacity of EBS; (h) energy capacity of IIS.
The load curve in
Figure 12a shows that the system load is low before 10:00, and it rises markedly after 10:00 and reaches its peak at 12:00.
The aim of this simulation is to evaluate the behavior of the IIS applied the proposed charging/discharging strategy, regarding EVs battery exchanging requests and load level of the power grid.
Figure 12c presents the charging/discharging flow between the CES and the grid. Positive power implies that energy is drawn from the grid to charge the batteries in CES while negative power implies that energy is transferred to the grid from CES. Accordingly, the energy capacity of CES is shown in
Figure 12f.
Simulation results in
Figure 12f suggest that CES is able to satisfy batteries exchanging requests, and at the same time it is capable of charging from the power grid during valley load periods to sustain its normal operation. The load curve in
Figure 12a shows that the system load is low from 4:00–6:00. Correspondingly,
Figure 12c suggests that CES charges from the grid in rated charging power.
Figure 12b shows the batteries exchanging process of the first set batteries. Therefore, the energy capacity of CES drops from 4:00–4:30 and rises after 4:30. The
Figure 12f shows that the energy capacity reaches its peak at 6:00.
The load curve in
Figure 12a shows that the load curve is relatively high from 6:00 to 8:00.
Figure 12c,f suggest that there is no energy exchange between the grid and CES.
Figure 12b shows the batteries exchanging process of the second set batteries around 8:00. The energy capacity of CES decreases during the batteries exchanging process. The CES charges from the grid from 8:00 to 10:00 because the load level is relatively low.
Figure 12d presents the power flow between the EBS and the grid. The energy capacity of EBS is shown in
Figure 12g. It suggests that EBS discharges to the grid from 11:00 to 13:00 and from 18:00 to 22:00 when the grid operates during peak load periods. In order to maintain the energy level of EBS no less than 20% of the initial value, EBS is required to charge from the grid during time intervals from 13:30 to 16:00 and from 2:00 to 5:00 during valley periods. Moreover, it discharges to the grid in the rated discharging rate during the peak periods from 11:00 to 13:00. Simulation results show that EBS is capable of discharging to the power grid during peak periods for peak shifting, and at the same time it is able to charge from the grid during valley load periods to maintain its energy capacity.
Figure 12e shows the power flow between the grid and IIS, it suggests that IIS can act as distributed energy sources to smoothen the load profiles by providing peak shaving and valley filling.
Figure 12h presents the total energy trend of the IIS. It suggests that the IIS charges from the grid during valley periods, such as from 8:00–10:00, and discharges to the grid during peak periods, such as from 11:00–12:30.


