
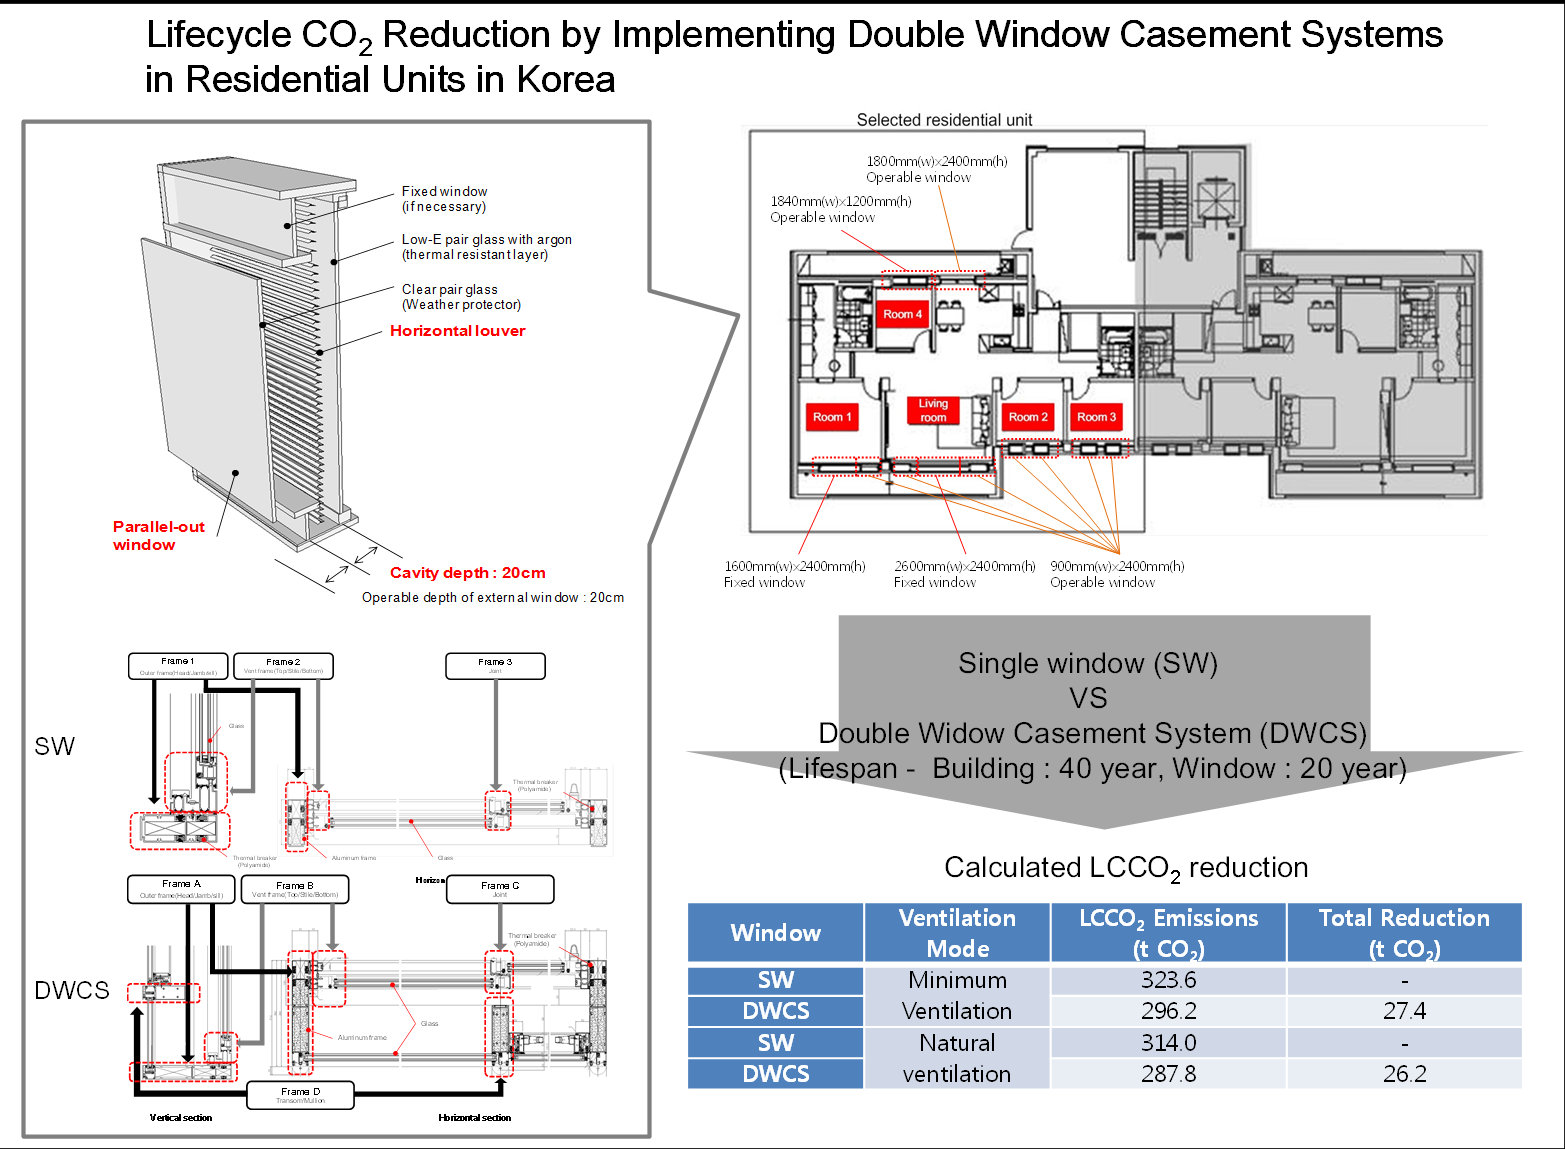
Lifecycle CO2 Reduction by Implementing Double Window Casement Systems in Residential Units in Korea

Abstract
:
1. Introduction
1.1. Background
1.2. Purpose
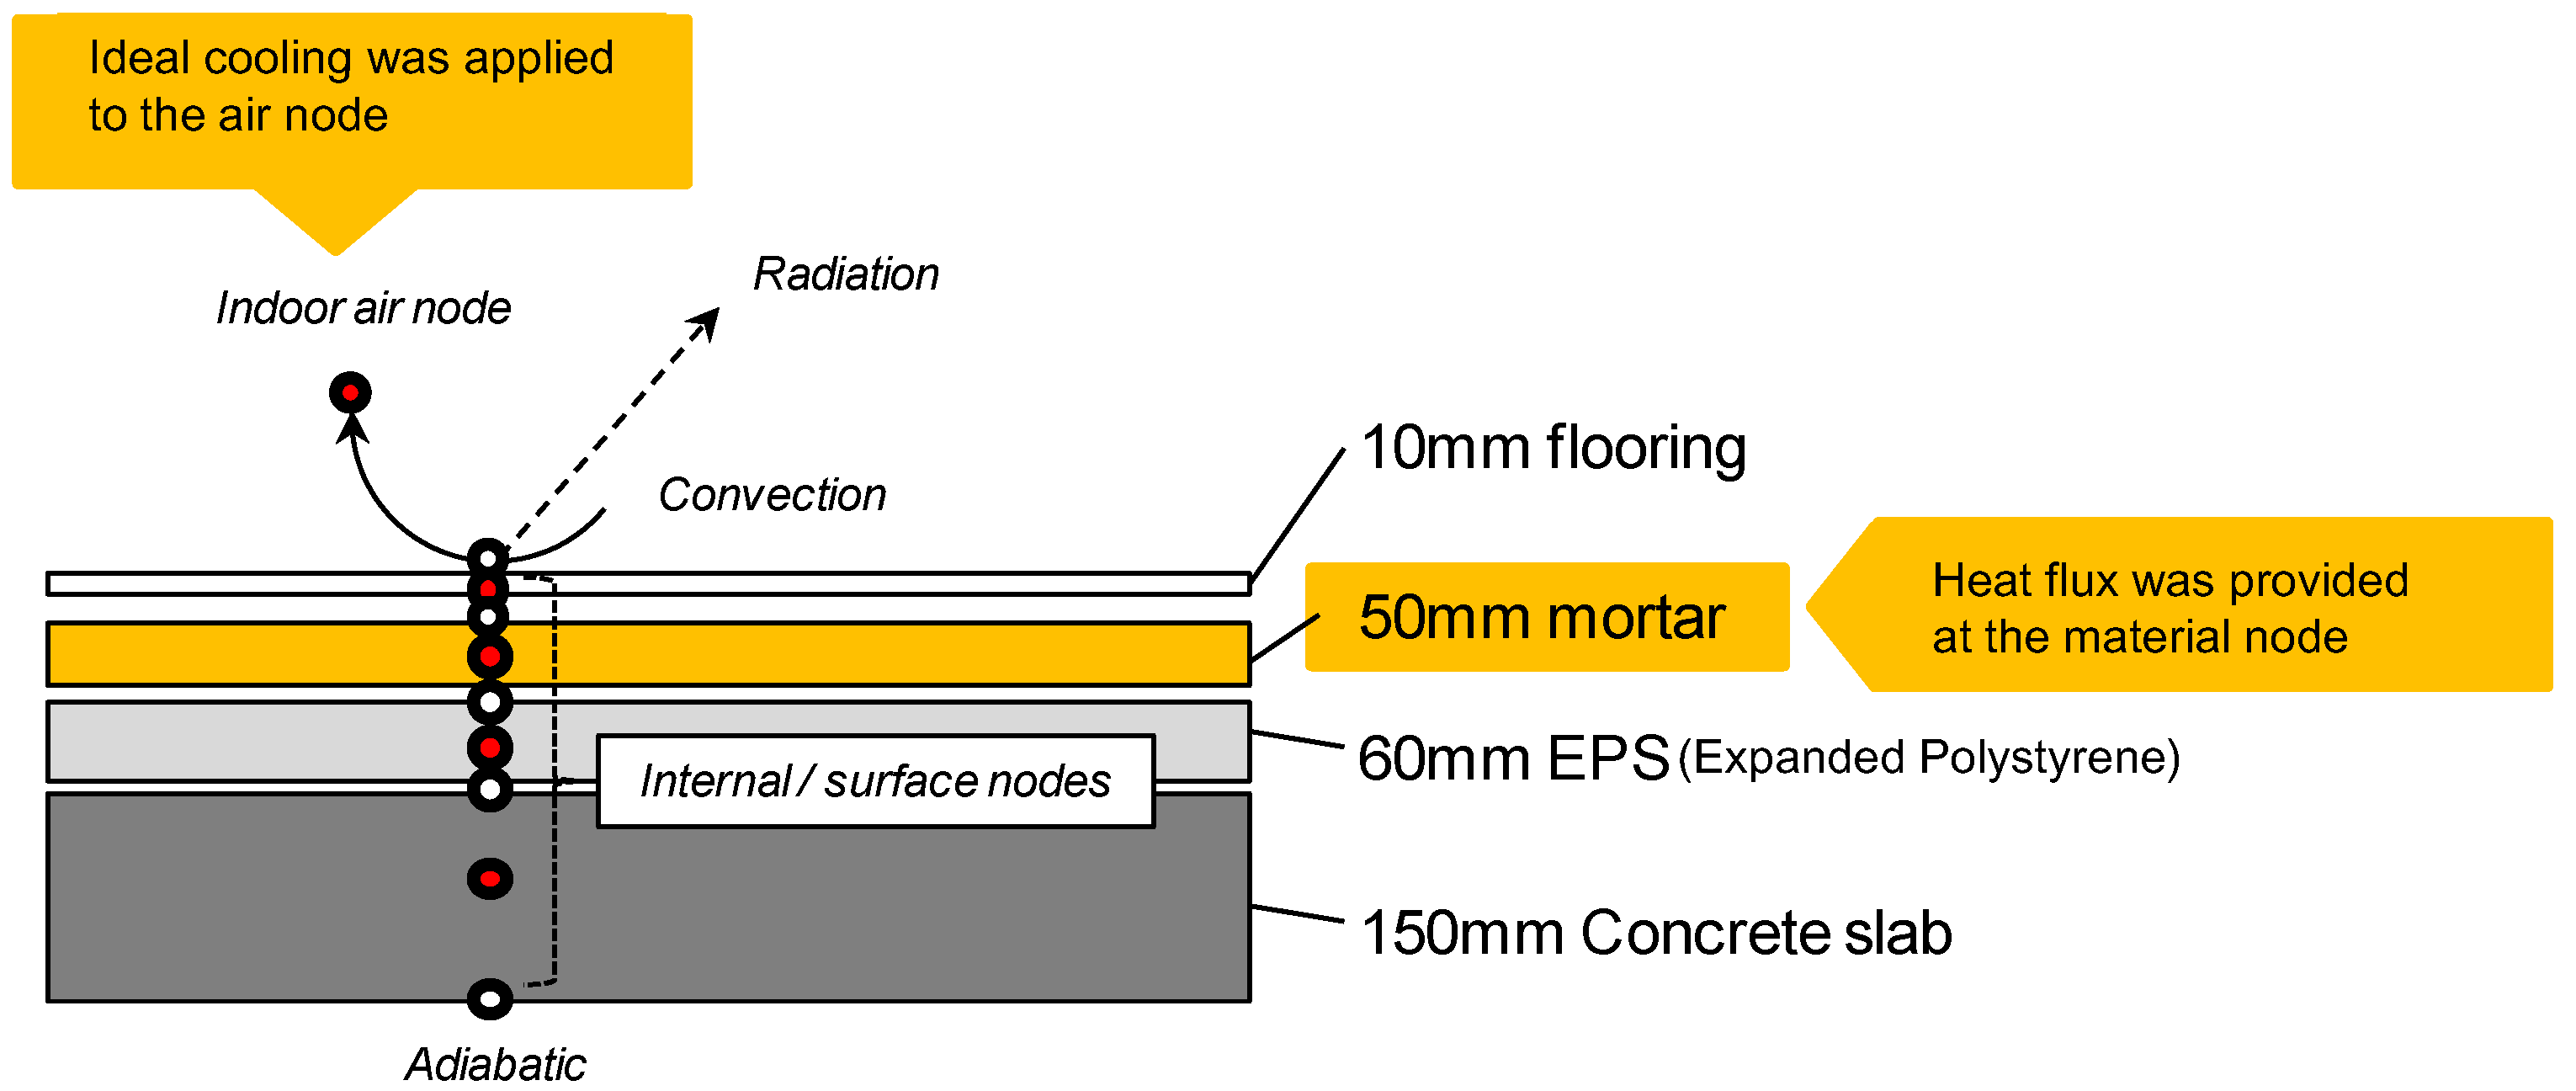
2. Methods
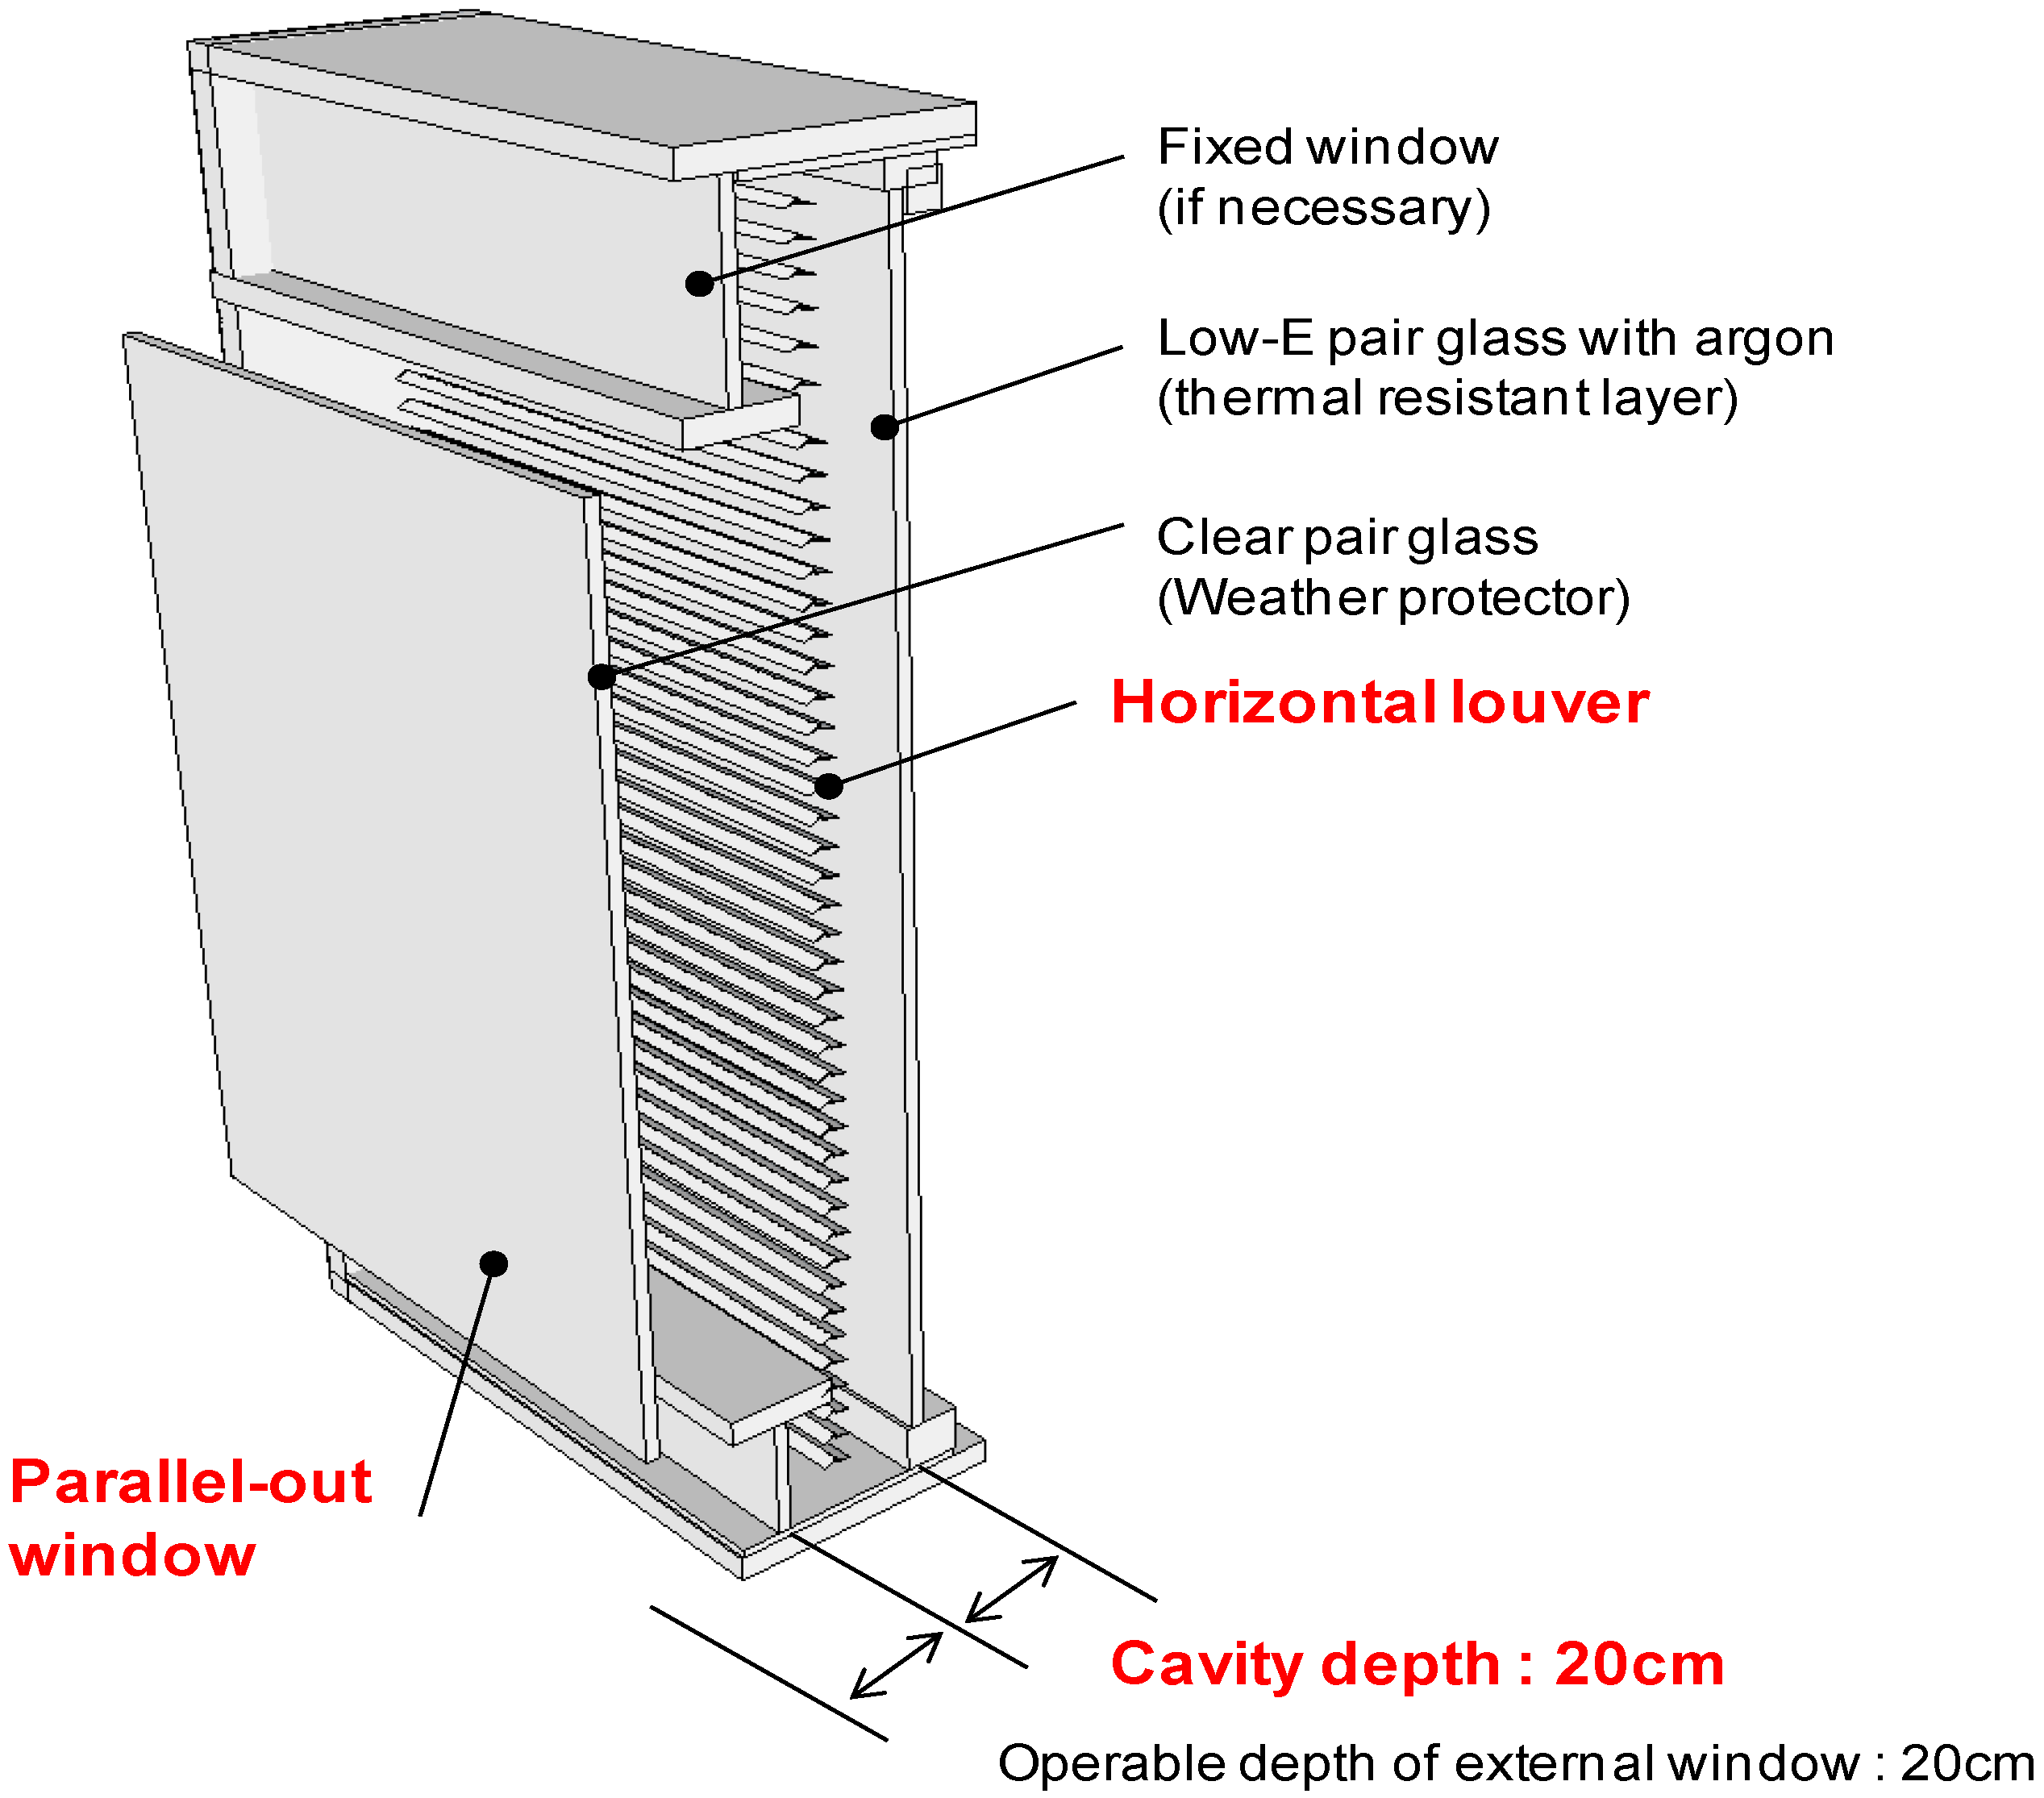
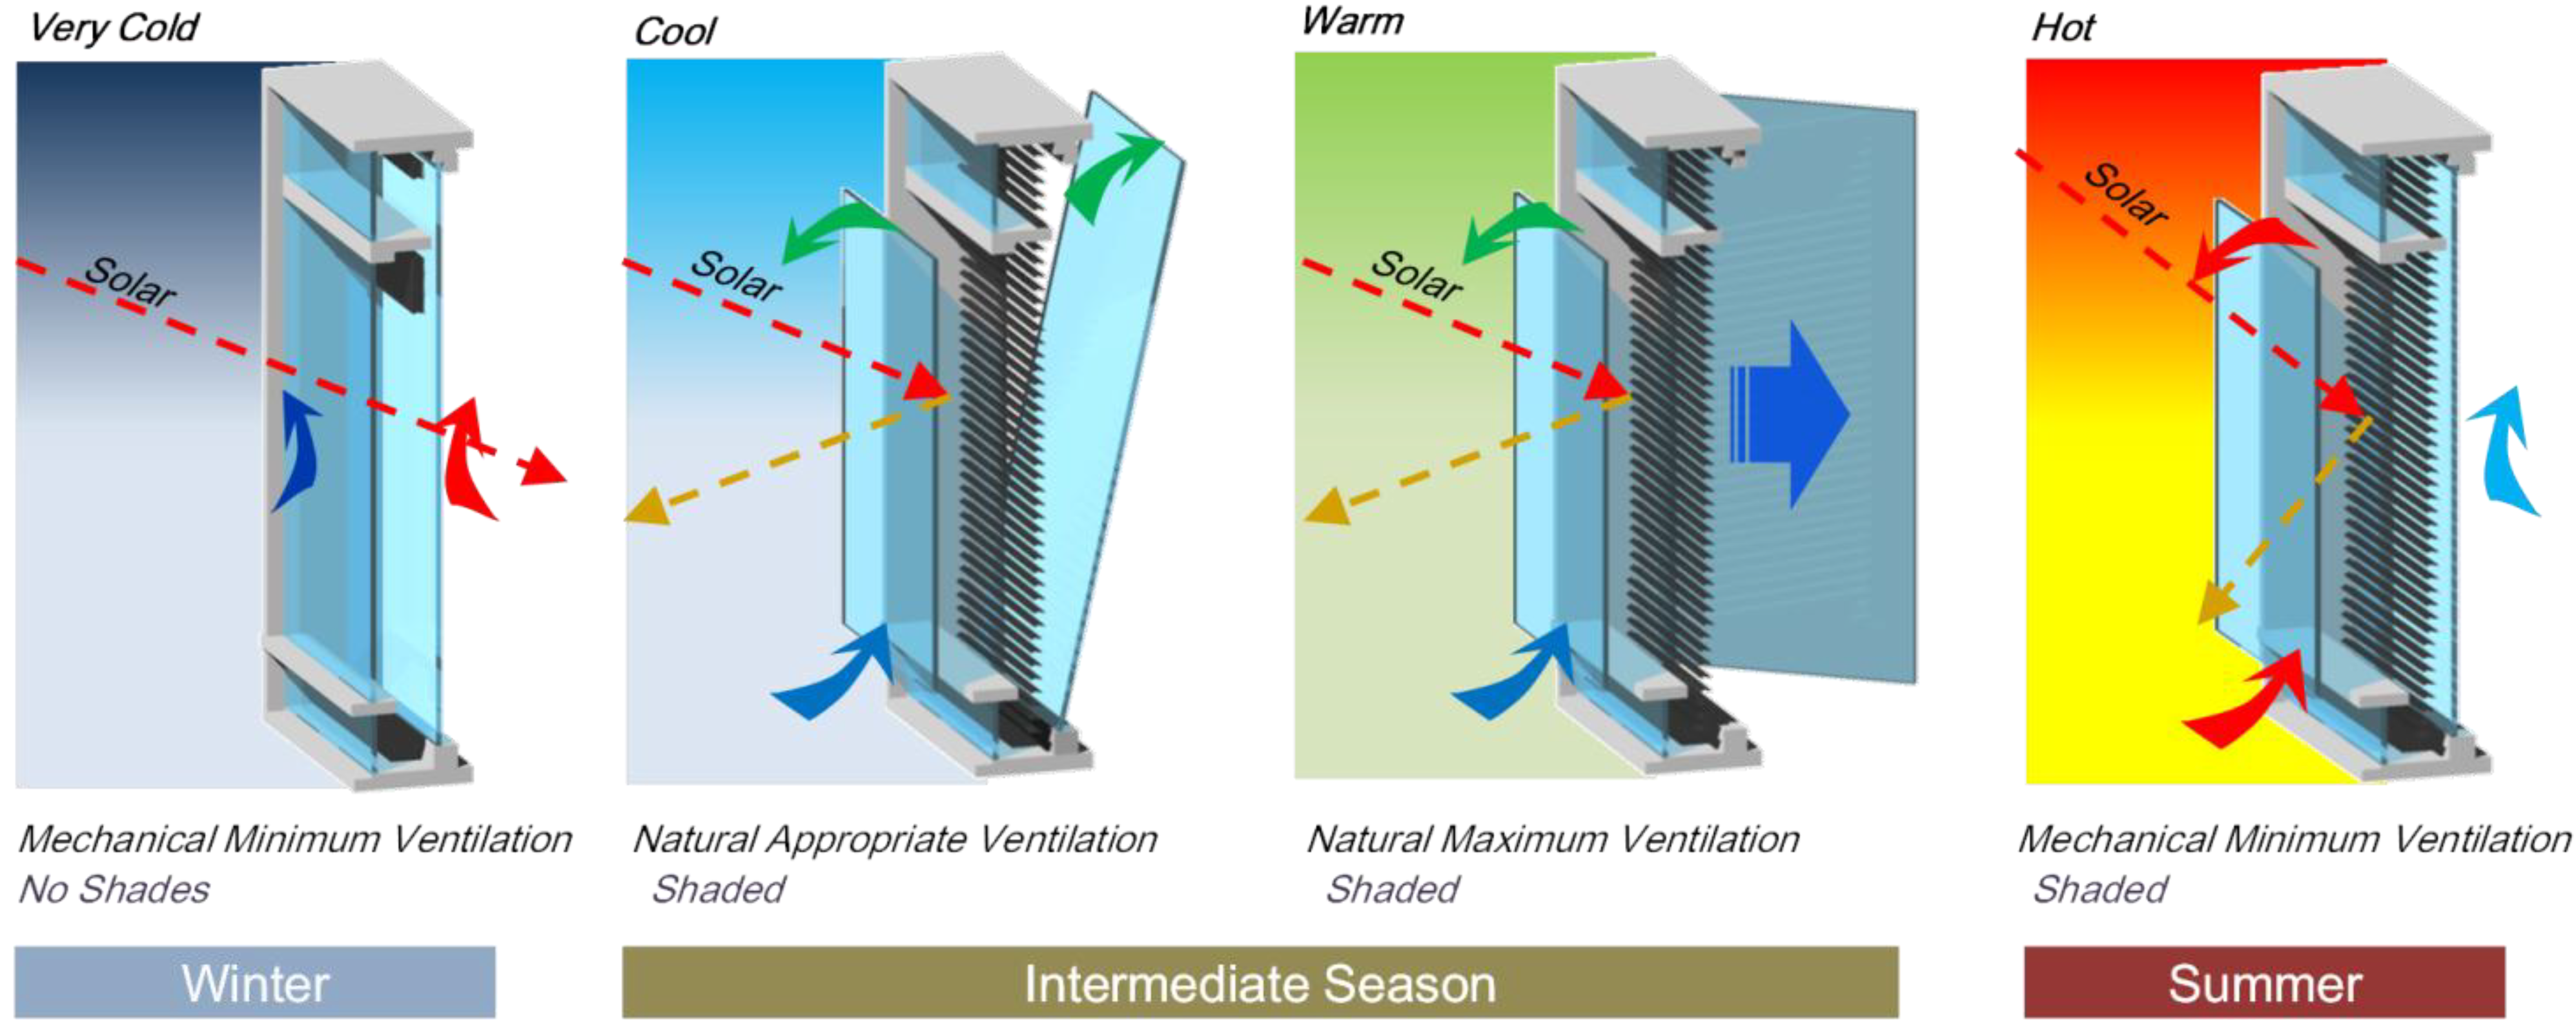
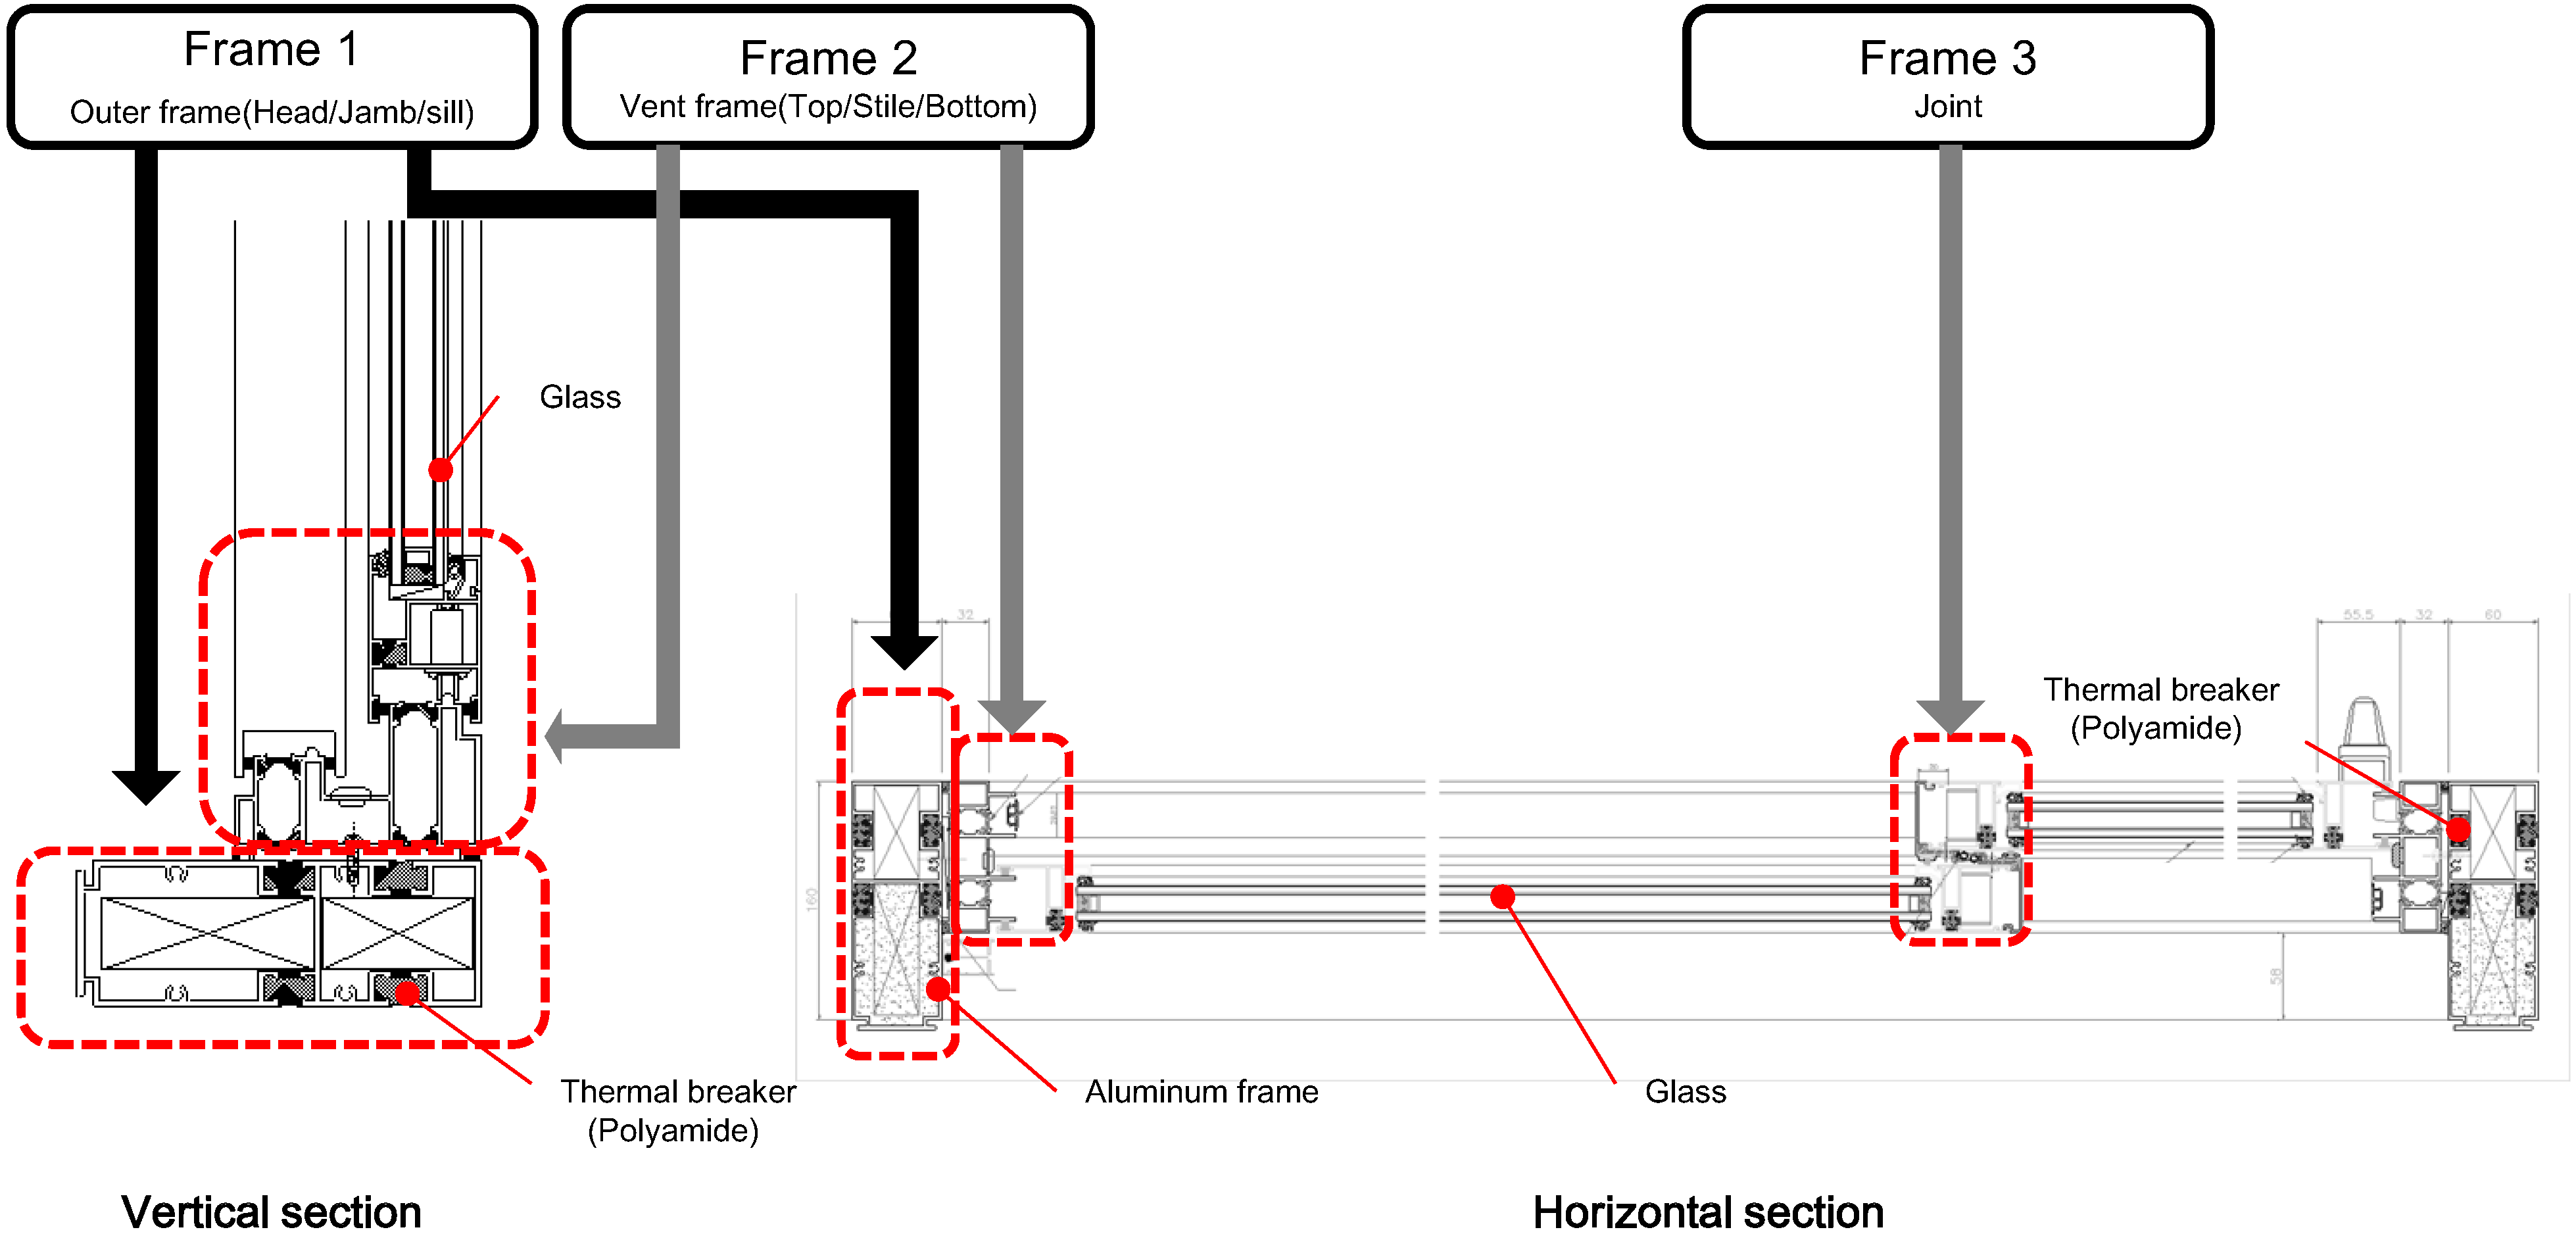
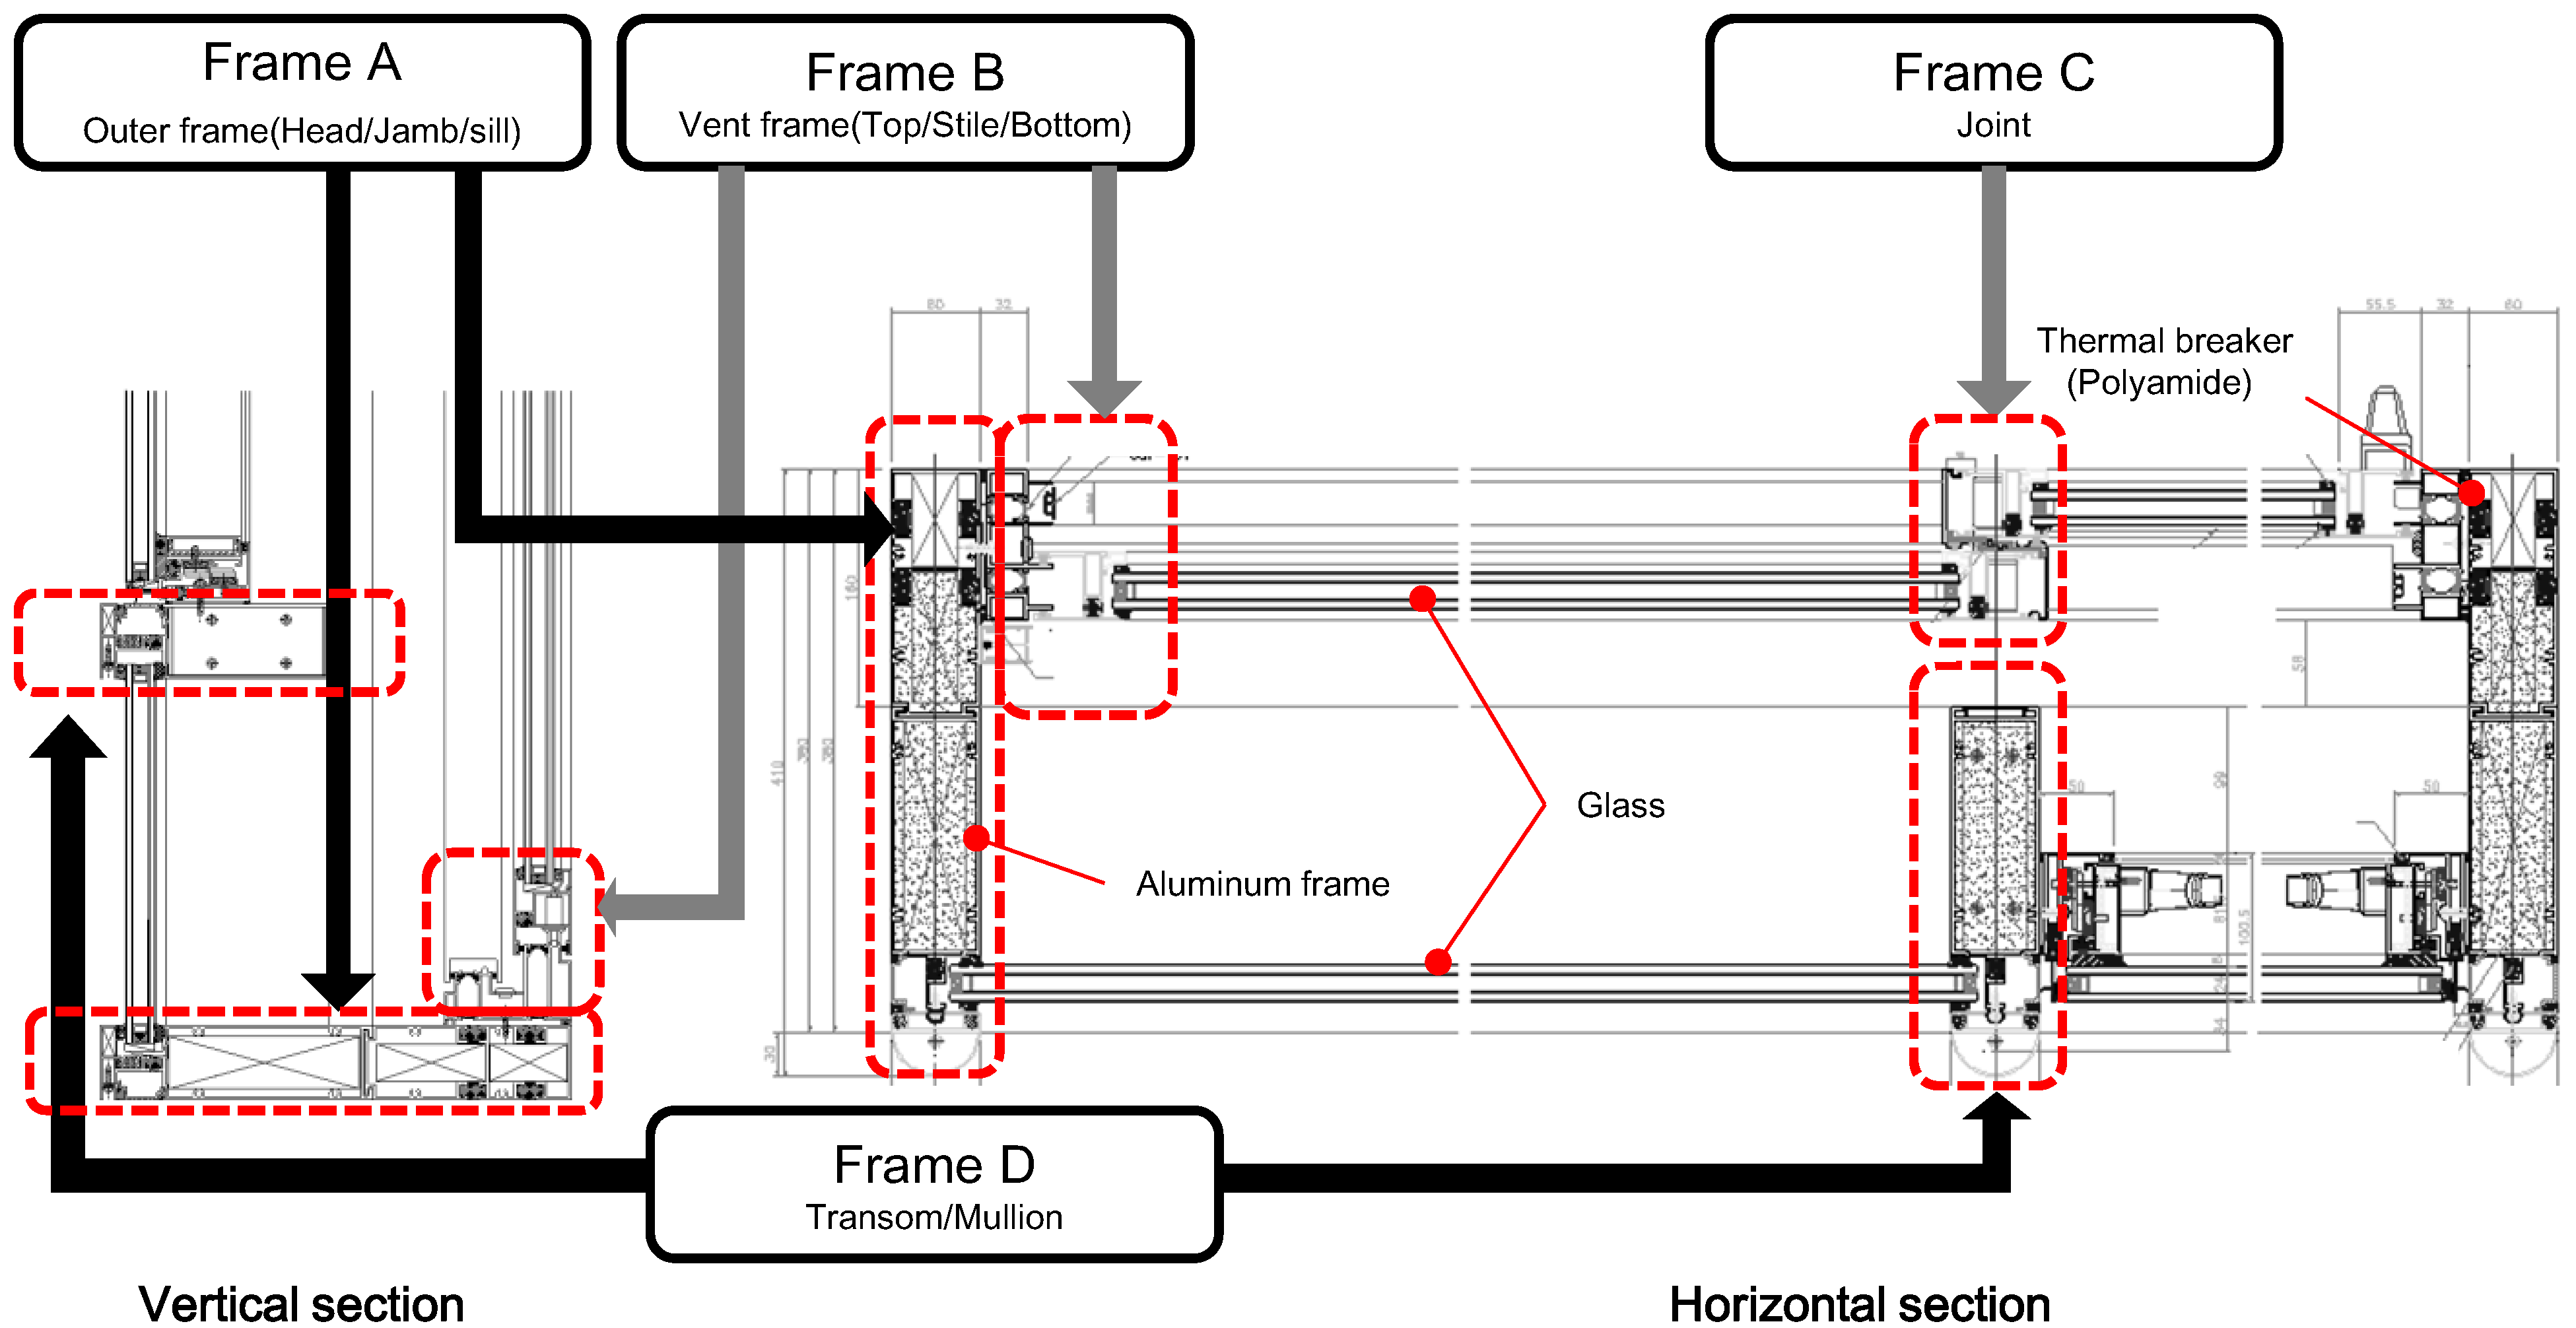
3. Window Systems


4. CO2 Emissions during Space Heating and Cooling
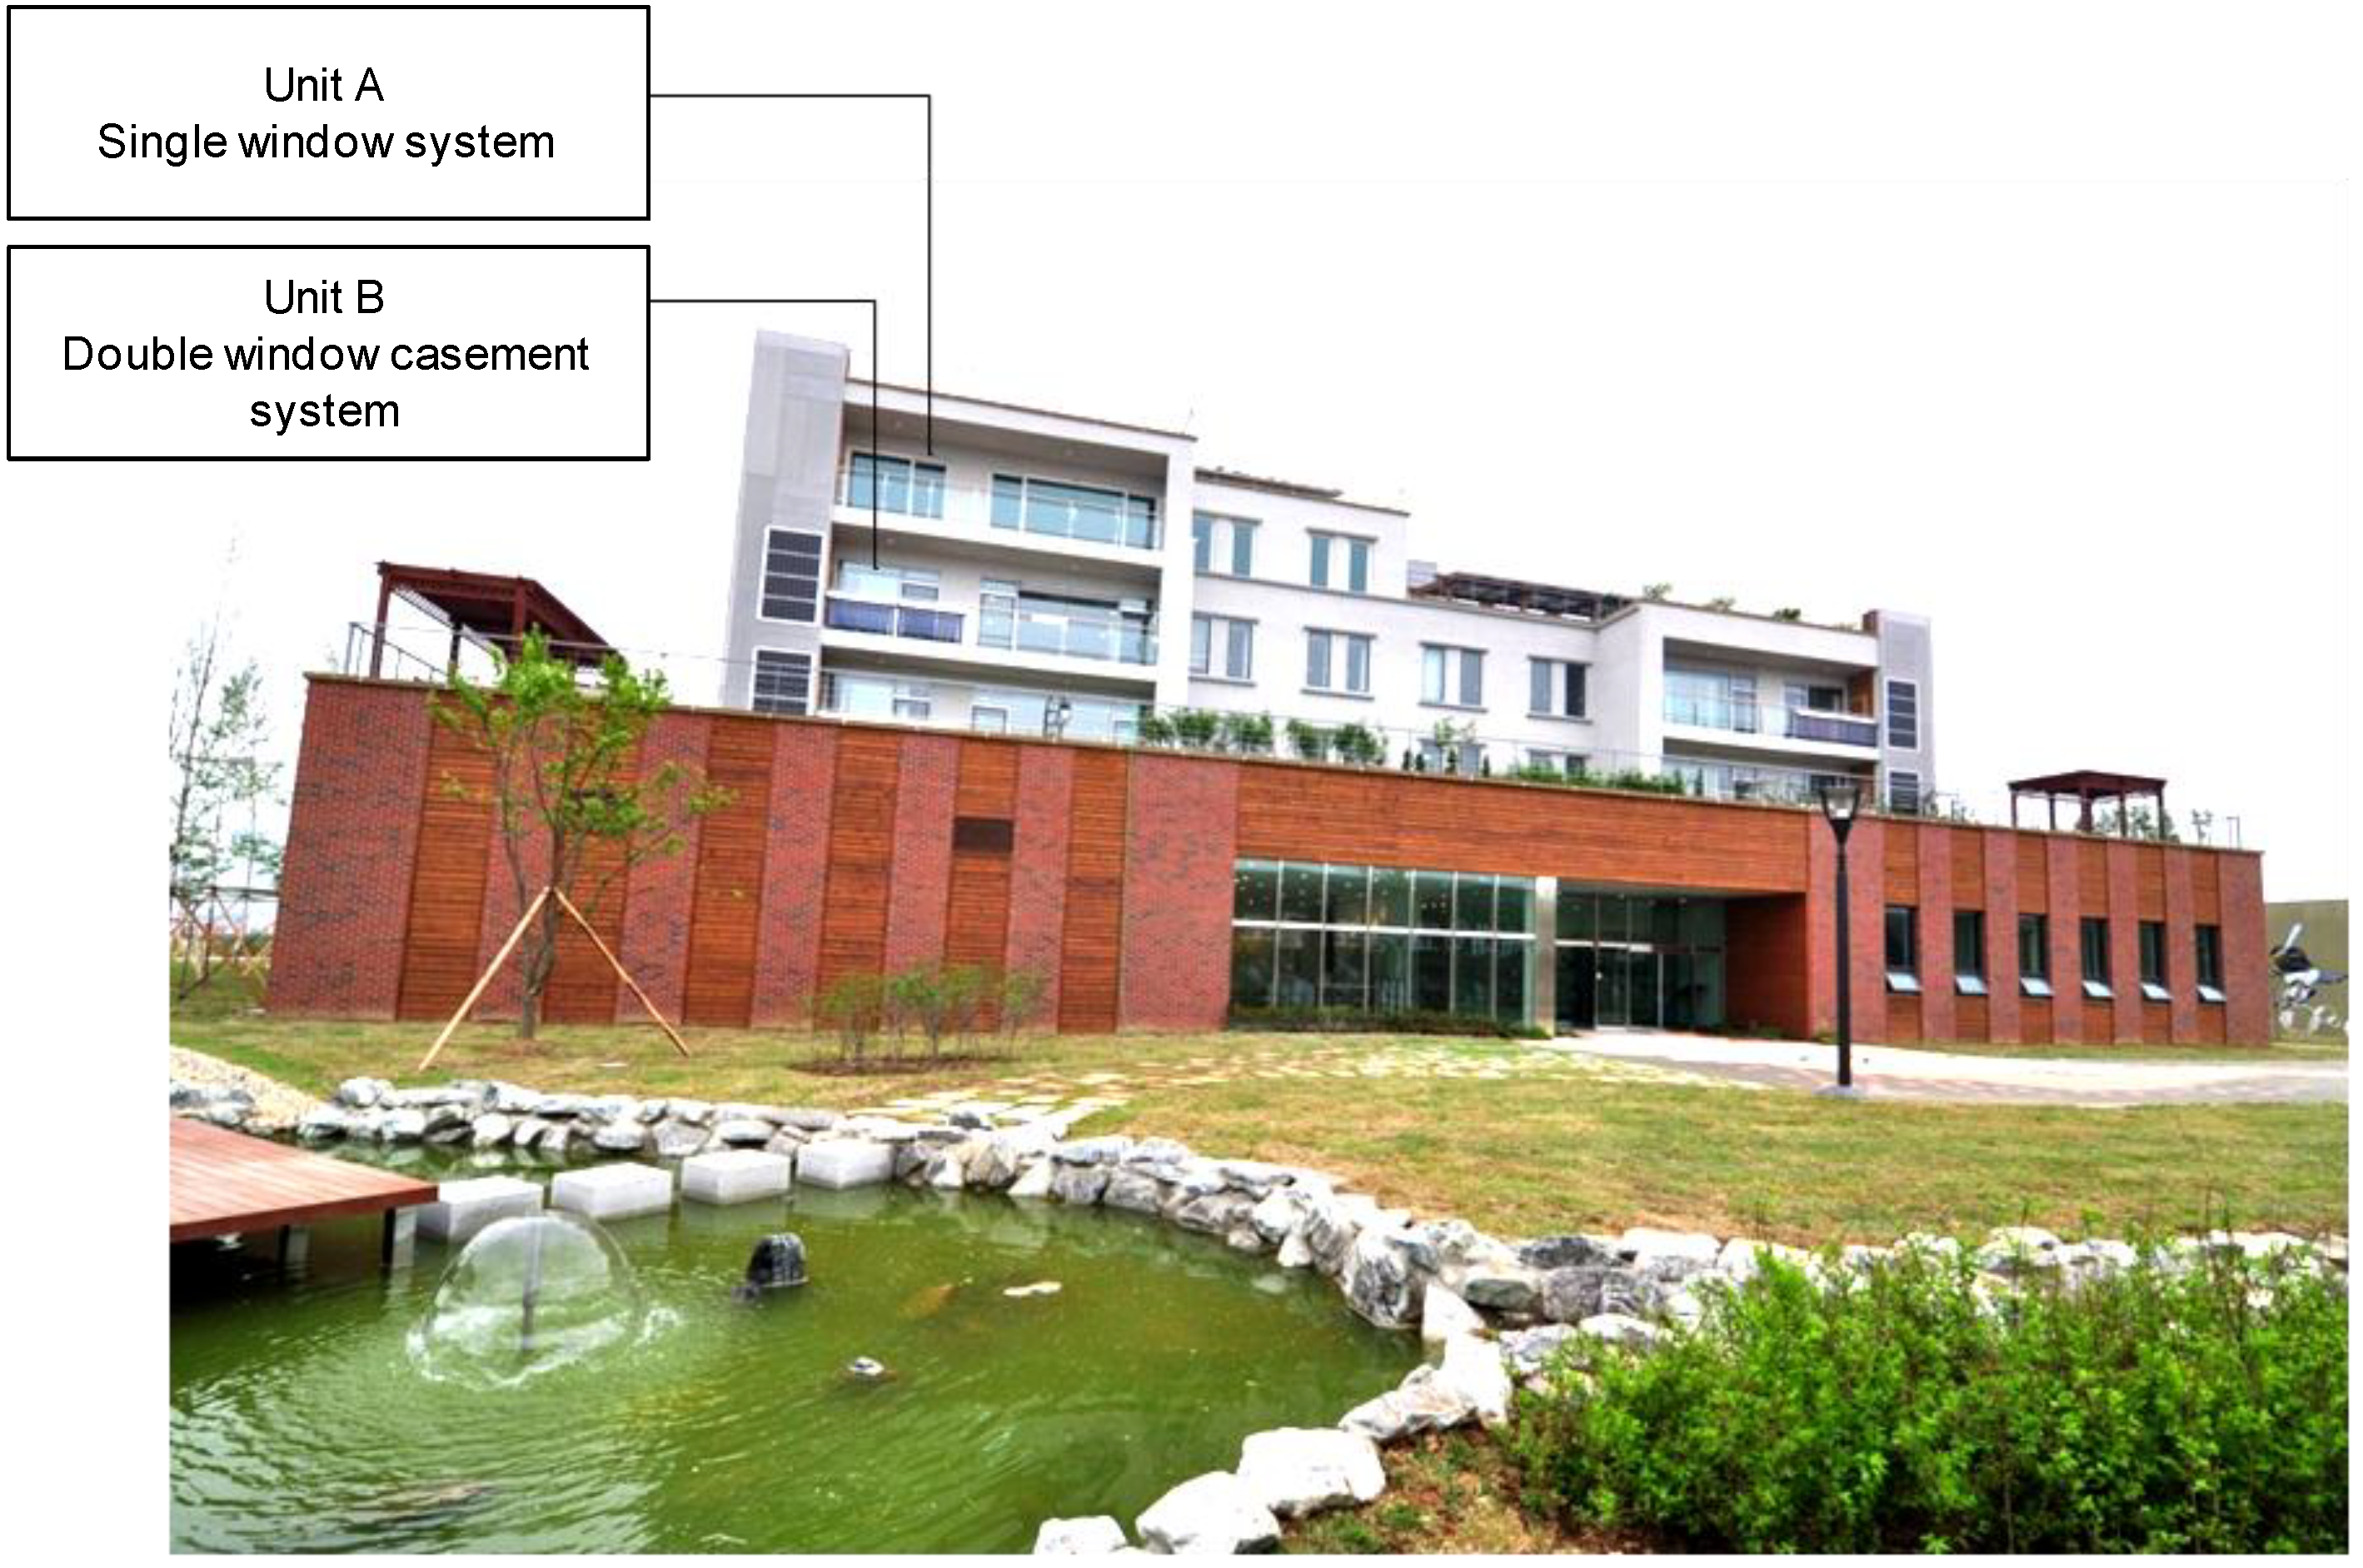
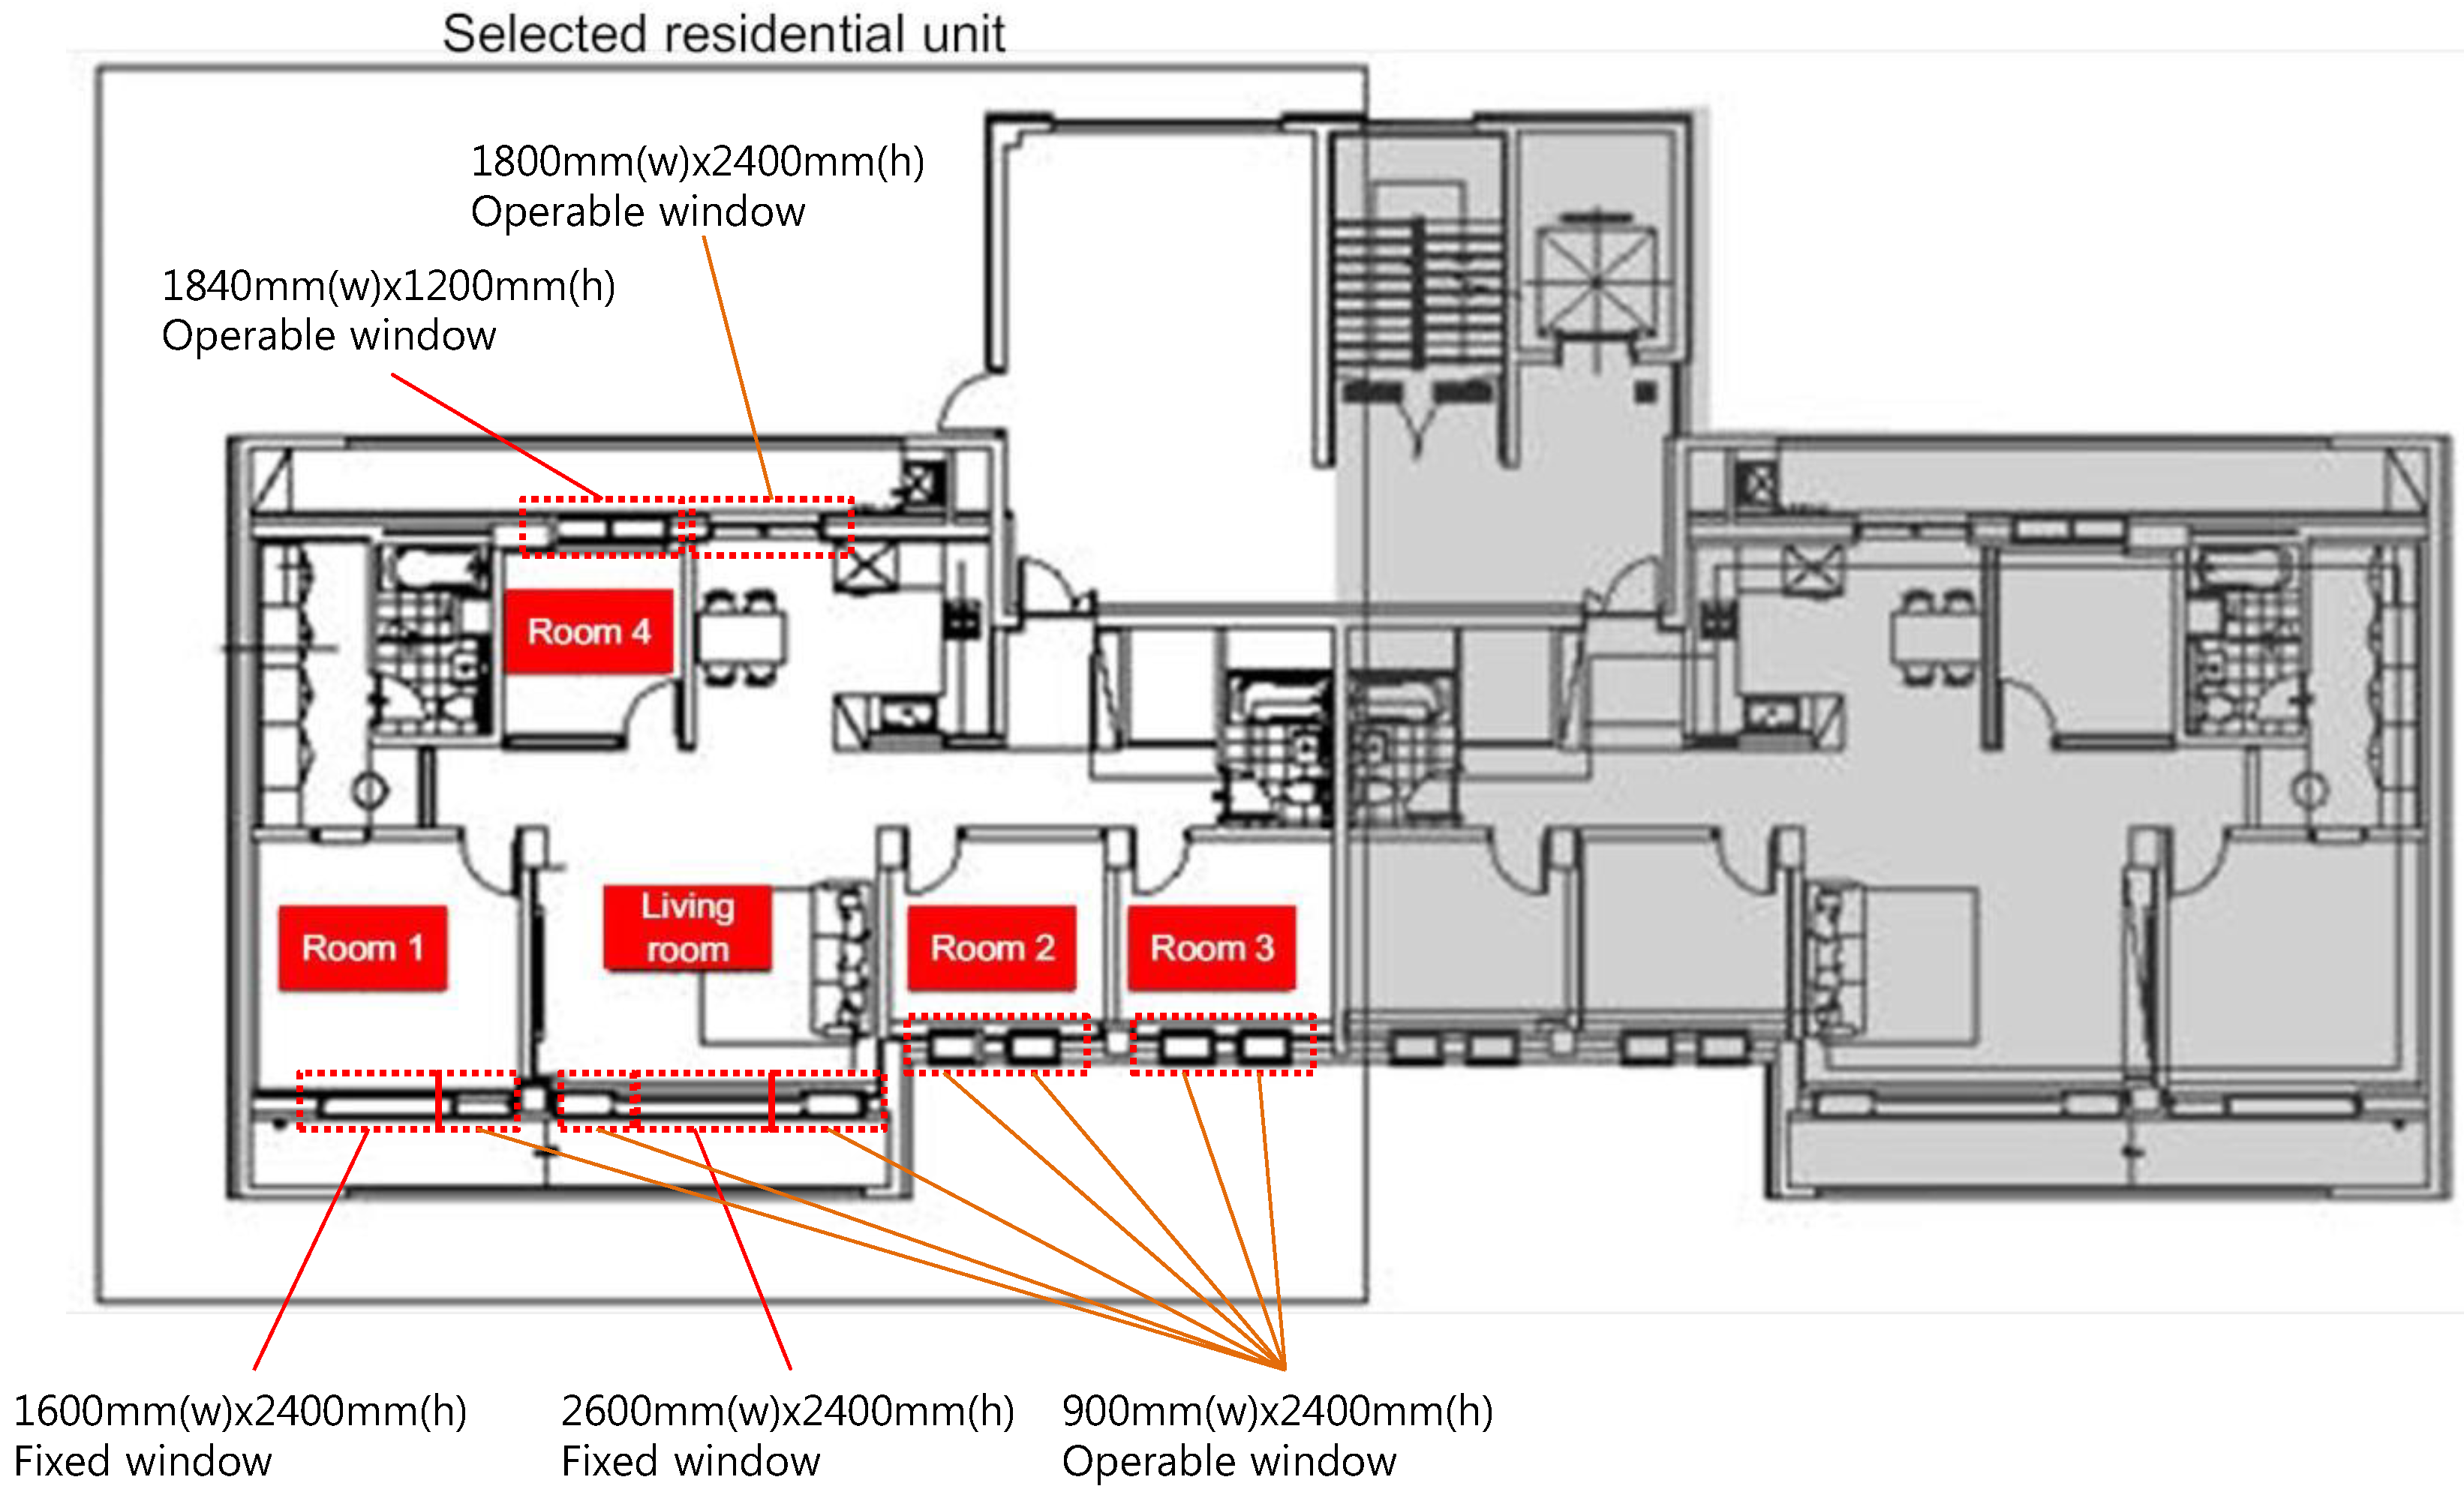
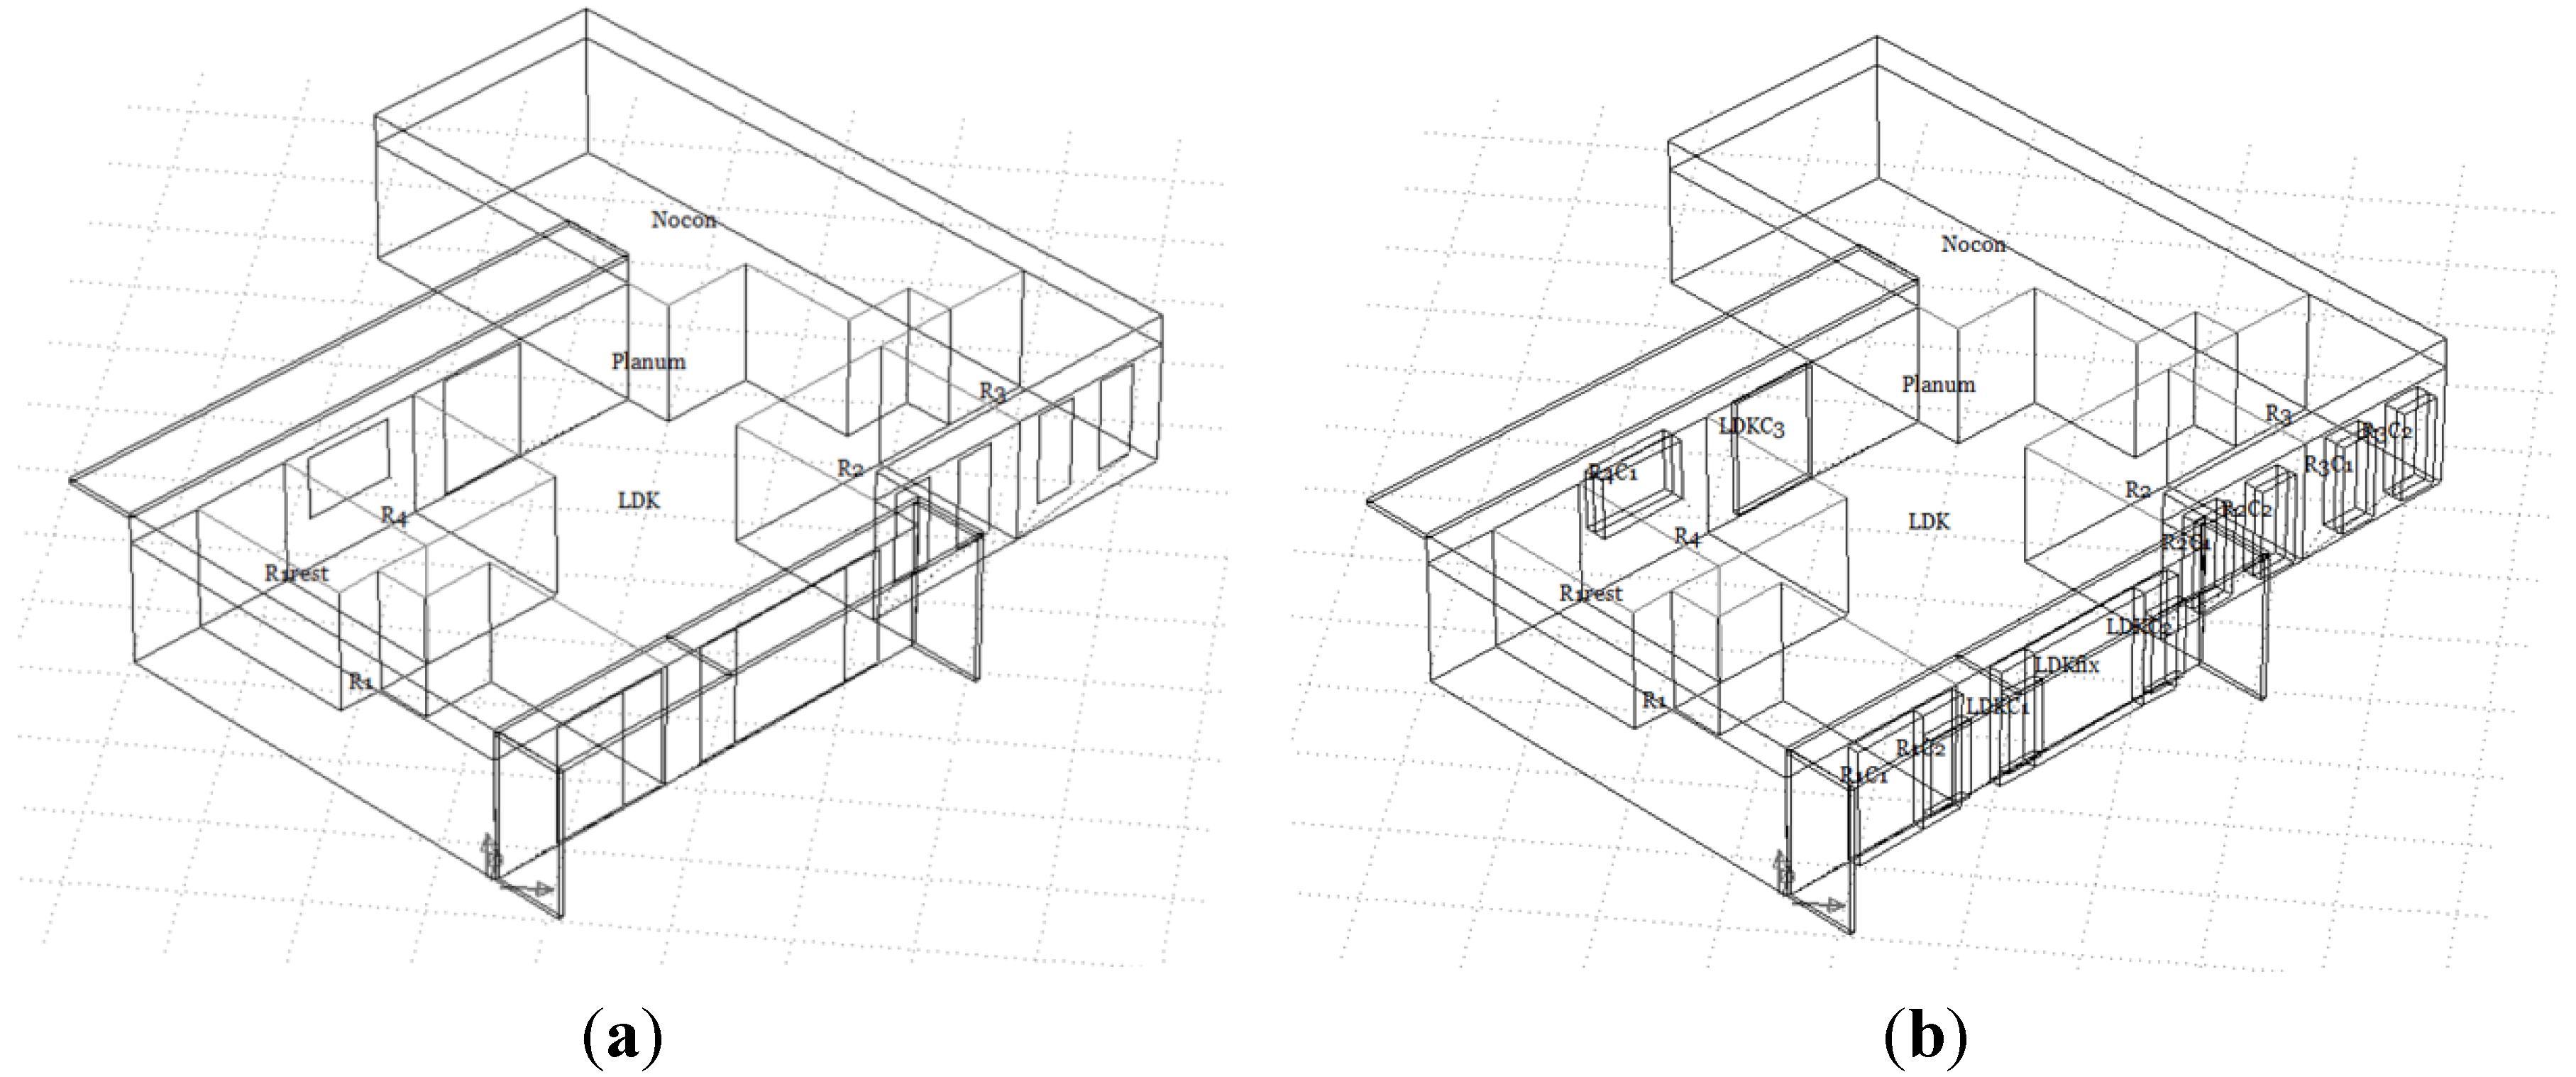
4.1. Target Building


| Item | SW | DWCS |
|---|---|---|
| Frame (cm3) | 177,643 | 271,156 |
| Glass (m2) | 45.6 | 91.2 |
| Polyamide (m3) | 0.09 | 0.33 |
4.2. Simulation Inputs

| Case | Window | Ventilation Mode |
|---|---|---|
| Case 1 | SWs | Minimum ventilation (0.7 ACH) |
| Case 2 | DWCS | |
| Case 3 | SWs | Natural ventilation |
| Case 4 | DWCS |
| Item | External Window |
|---|---|
| Modeling Module | CFC (Complex Fenestration Construction) |
| Outer glazing | Solar transmission: 0.771 |
| Reflection (front): 0.070 | |
| Reflection (back): 0.070 | |
| Inner glazing | Solar transmission: 0.771 |
| Reflection (front): 0.070 | |
| Reflection (back): 0.070 | |
| Shading device | Depth: 50 mm Angle: 45° |
| Overall U-factor (including frame) | 3.0 W/m2·K |
| Item | External Window | Internal Window |
|---|---|---|
| Module | CFC (Complex fenestration construction) | TMC (Transparent multi-layer construction) |
| Outer glazing | Solar transmission: 0.771 | Solar transmission: 0.514 Absorption (front): 0.182 Absorption (back): 0.138 |
| Reflection (front): 0.07 | ||
| Reflection (back): 0.07 | ||
| Inner glazing | Solar transmission: 0.771 | |
| Reflection (front): 0.07 | ||
| Reflection (back): 0.07 | ||
| Shading device | Depth: 50 mm Angle: 45° | - |
| Overall U-factor (including frame) | 3.0 W/m2·K | 2.0 W/m2·K |
| Category | Control Strategies |
|---|---|
| Cooling equipment | Set point temperature: 26 °C |
| Operating period: 00:00–24:00 | |
| Cooling device module for the simulation: Ideal cooling | |
| Ventilation strategy |
|
| Item | Living Room | R1 | R2 | R3 | R4 | |
|---|---|---|---|---|---|---|
| South | North | South | South | South | North | |
| Floor area (m2) | 60 | 24 | 12 | 12 | 11 | |
| Fully opened (m2) | 1.3 | 2.4 | 1.3 | 1.3 | 1.3 | 1.3 |
| Partially opened (m2) | 0.3 | 0.55 | 0.3 | 0.3 | 0.3 | 0.3 |
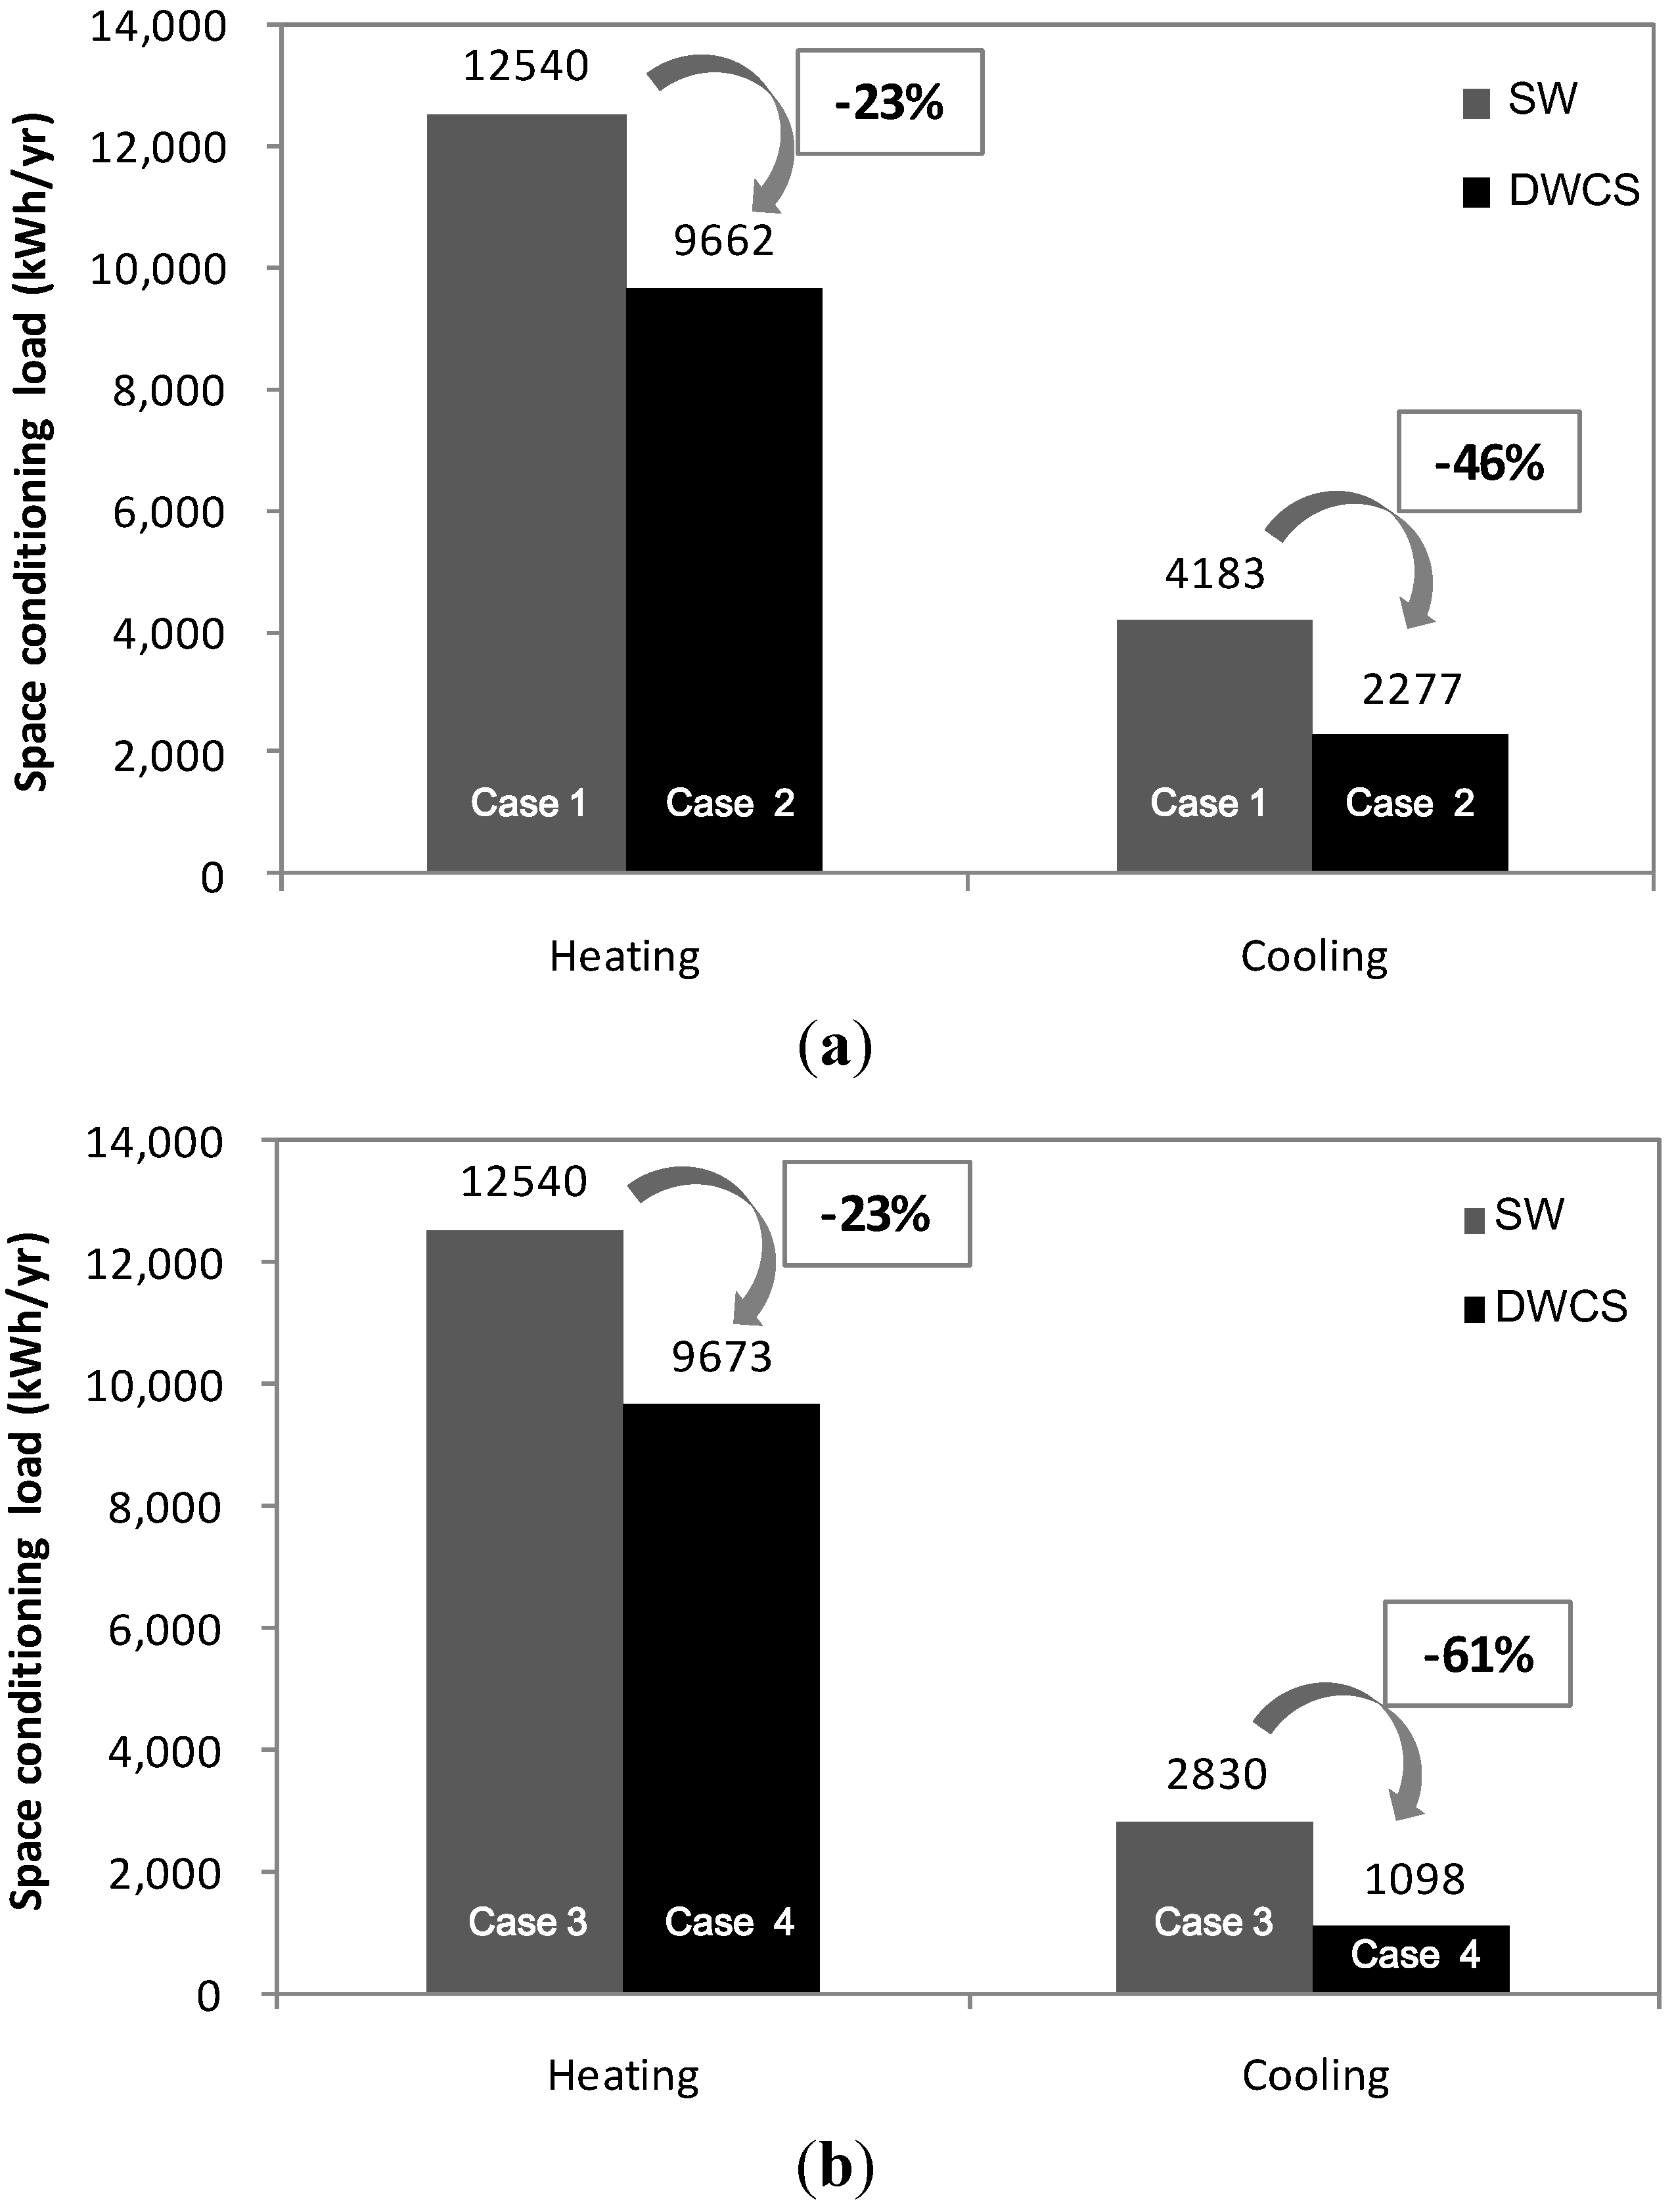
4.3. Results
| Case | Window Type | Ventilation Mode | Heating Load (kWh) | Cooling Load (kWh) |
|---|---|---|---|---|
| Case 1 | SW | Minimum | 12,540 | 4,183 |
| Case 2 | DWCS | Minimum | 9,662 | 2,277 |
| Case 3 | SW | Natural | 12,540 | 2,830 |
| Case 4 | DWCS | Natural | 9,673 | 1,098 |

5. Lifecycle CO2 Emissions Assessment
5.1. Lifecycle CO2 Assessment Overview
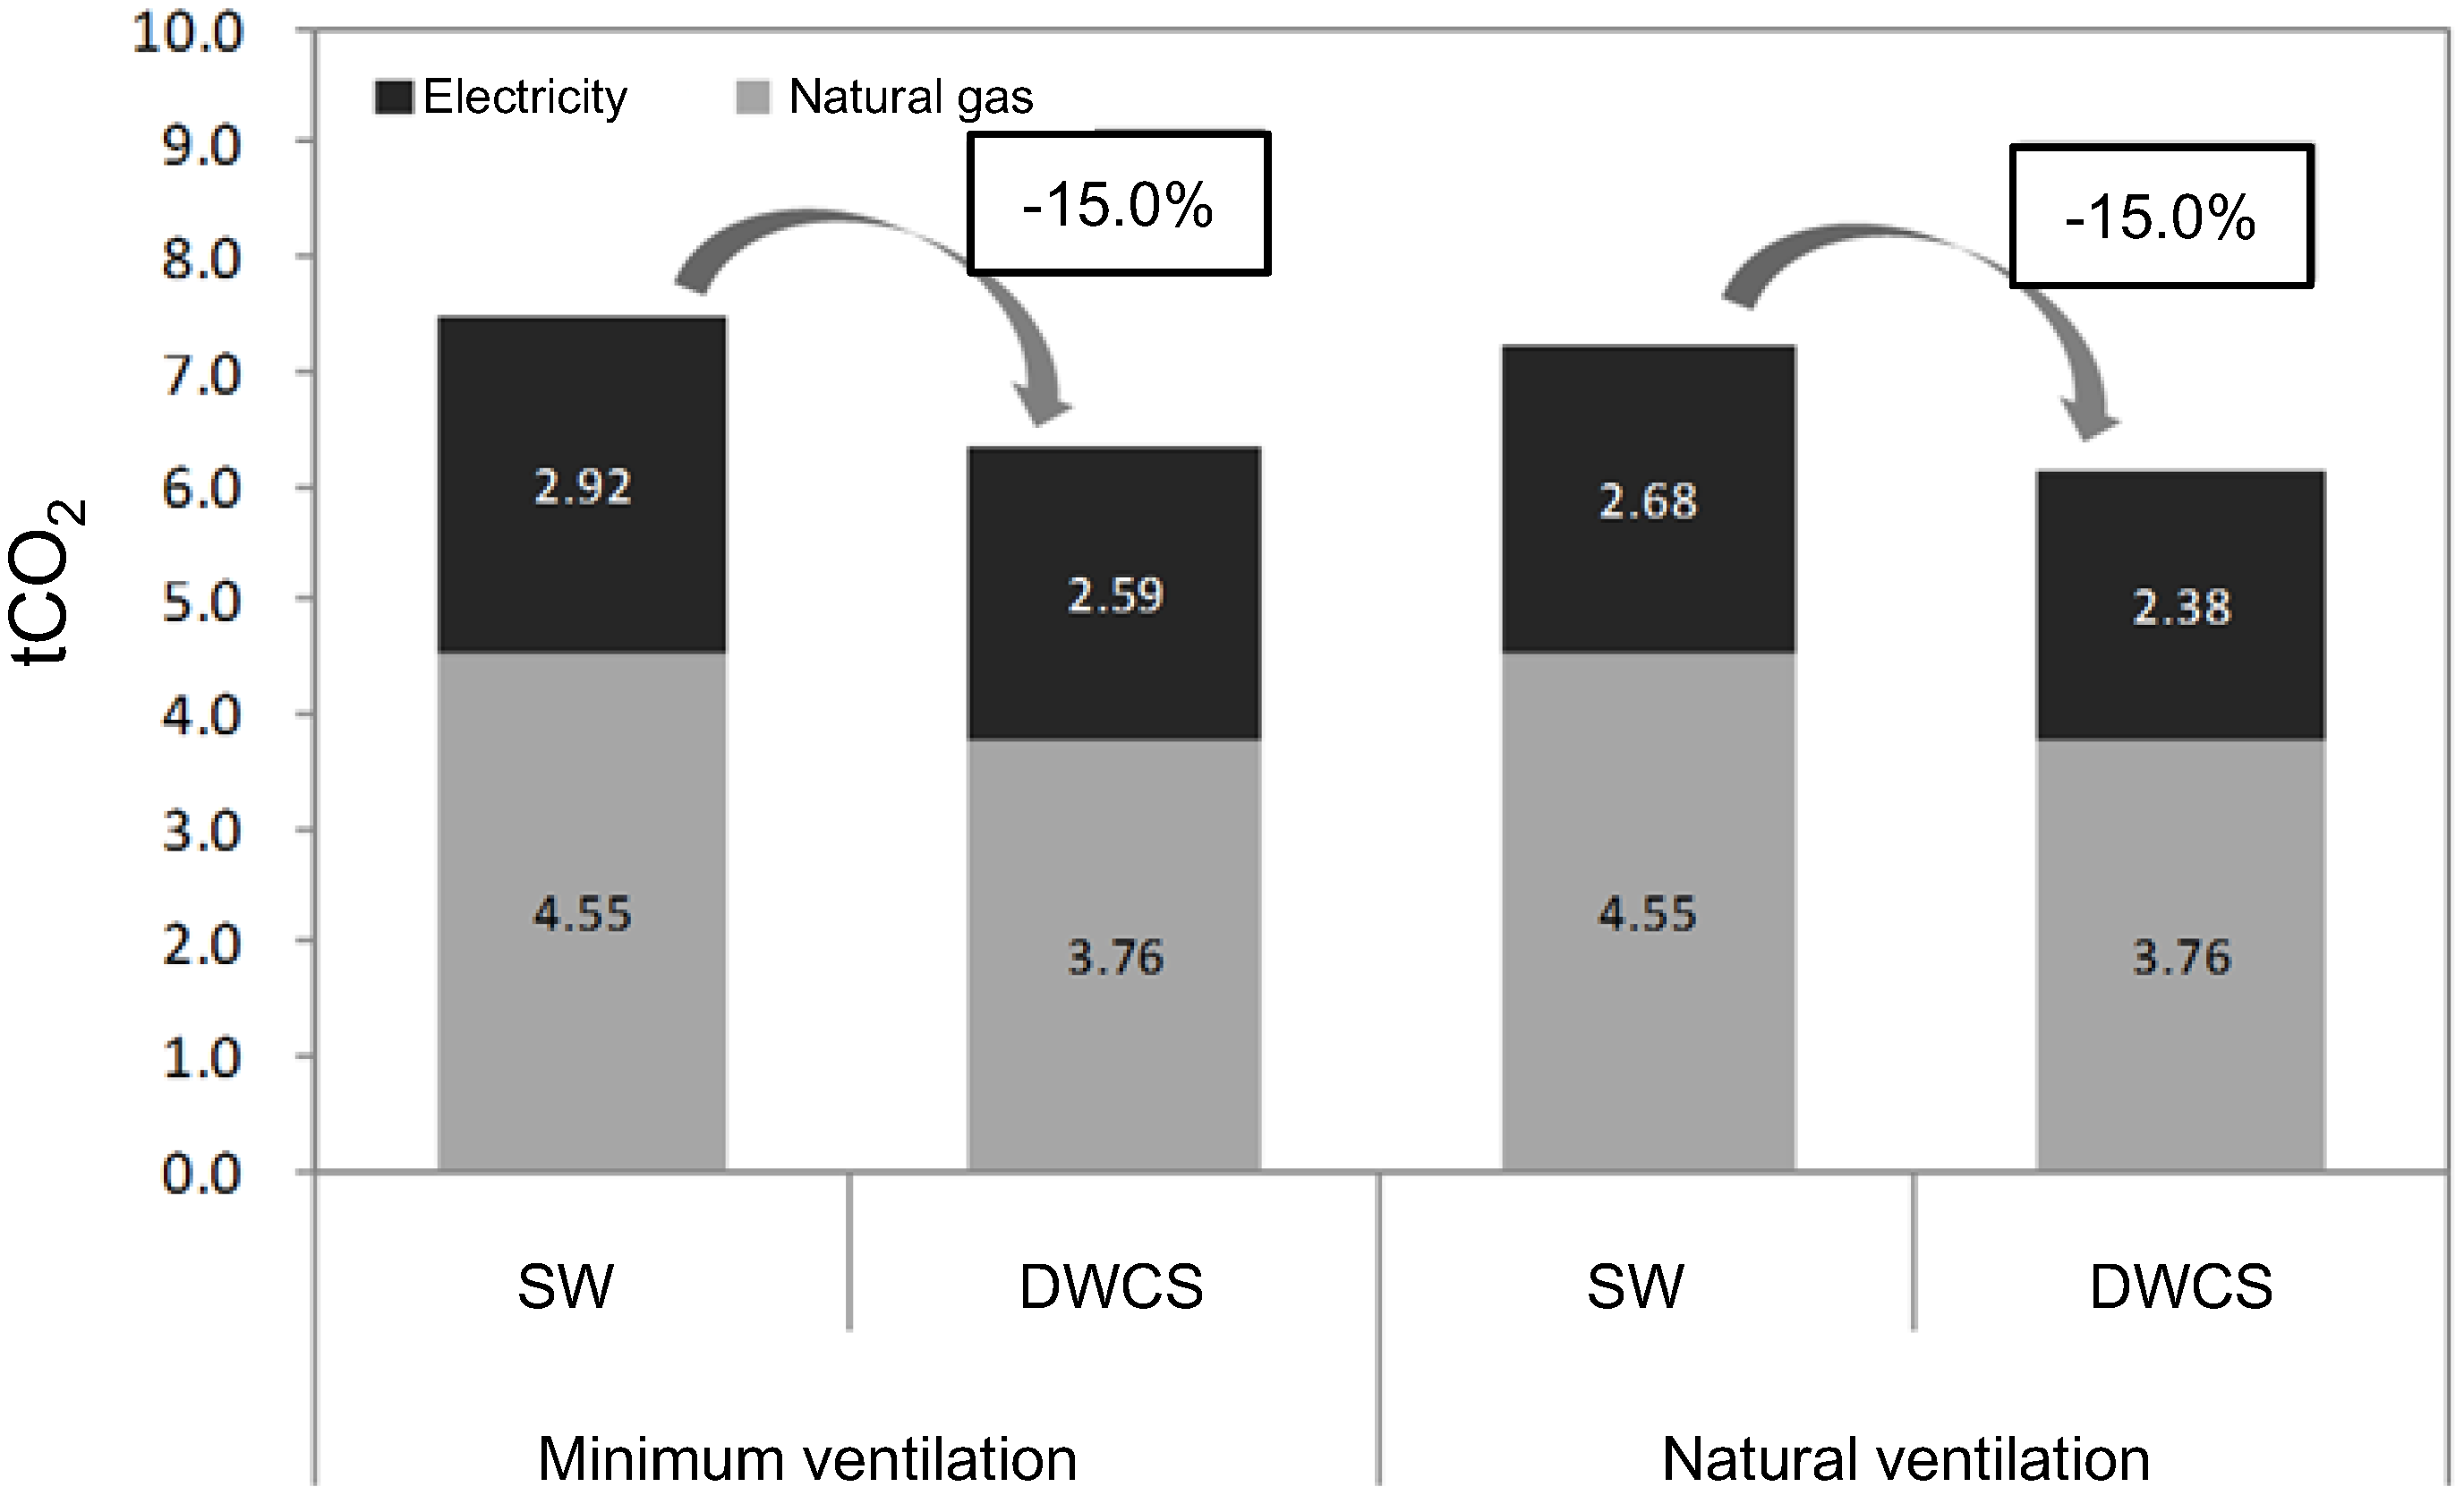
5.2. CO2 Emissions during Operation
| Factor | Input Value |
|---|---|
| Boiler efficiency | 85% |
| Coefficient of performance of the PAC system | 2.7 |
| Low calorific value of natural gas | 11.1 kWh/N·m3 |
| Energy Source | Emissions Rate |
|---|---|
| Natural gas | 0.00259 t CO2/N·m3 |
| Electricity | 0.469 t CO2/MWh |
| Case | Window Type | Ventilation Mode | Natural Gas (m3) | Electricity (kWh) |
|---|---|---|---|---|
| Case 1 | SW | Minimum | 1756 | 6218 |
| Case 2 | DWCS | Minimum | 1451 | 5513 |
| Case 3 | SW | Natural | 1756 | 5715 |
| Case 4 | DWCS | Natural | 1451 | 5076 |

5.3. Evaluation of Embodied CO2 Emissions
| Material | Unit | CO2 Emissions (domestic material) (kg CO2/unit) |
|---|---|---|
| Glass | m2 | 26.3690 |
| Metal window frame | kg | 17.3816 |
| Polyamide (thermal break) | kg | 751.5498 |
| Material | Density |
|---|---|
| Aluminum | 2.7 g/cm3 |
| Polyamide | 1.1 g/cm3 |
| CO2 Emissions (domestic material) t CO2 | SW | DWCS |
|---|---|---|
| Frame | 8.3 | 13.6 |
| Glass | 1.2 | 2.4 |
| Polyamide | 0.06 | 0.24 |
| Other | 2.87 | 4.80 |
| Total | 12.4 | 21.1 |
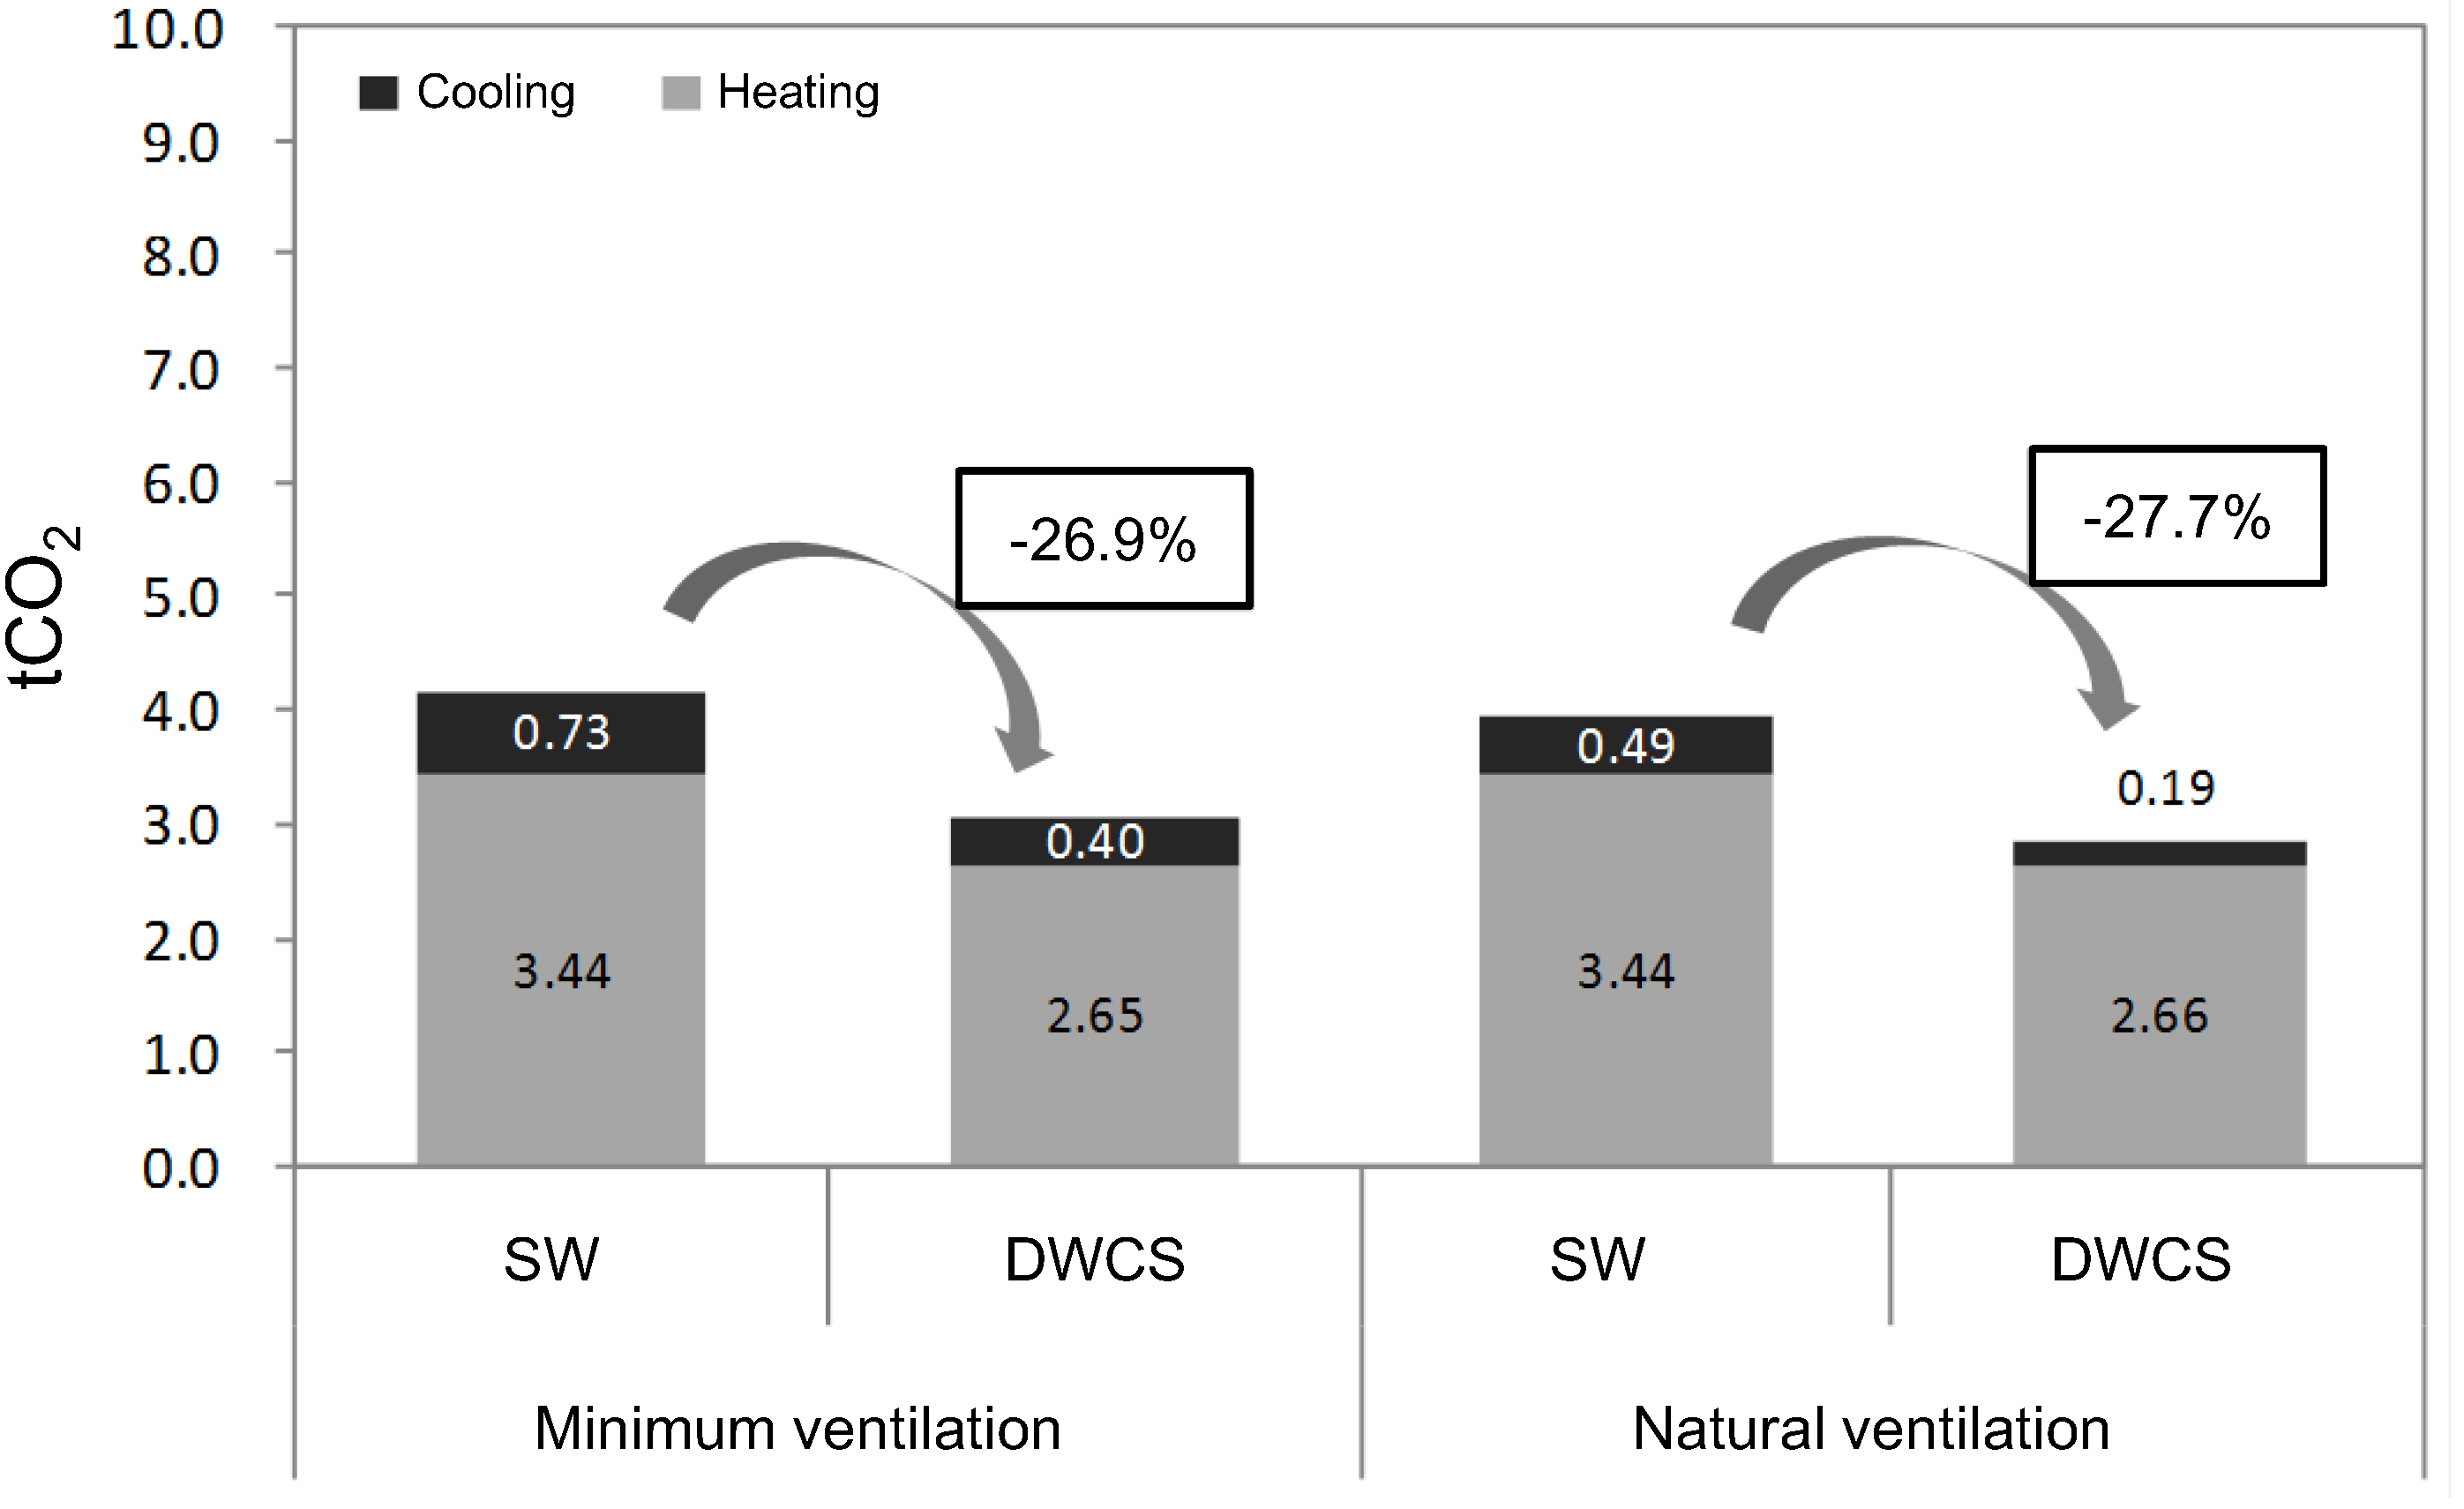
5.4. Assessment Results
| Window | Ventilation Mode | LCCO2 Emissions (t CO2) | |
|---|---|---|---|
| Operating | Embodied | ||
| SW | Minimum ventilation | 298.8 | 24.8 |
| DWCS | 254.0 | 42.2 | |
| SW | Natural | 289.2 | 24.8 |
| DWCS | Ventilation | 245.6 | 42.2 |
| Window | Ventilation Mode | LCCO2 Emissions (t CO2) | Total Reduction (t CO2) |
|---|---|---|---|
| SW | Minimum ventilation | 323.6 | - |
| DWCS | 296.2 | 27.4 | |
| SW | Natural ventilation | 314.0 | - |
| DWCS | 287.8 | 26.2 |
6. Conclusions
- (1)
- A total of 26.2–27.4 t CO2 was reduced by implementation of the DWCS rather than SWs in the residential unit in Korea.
- (2)
- Most of the reduction in LCCO2 emissions resulted from reduced heating energy consumption. Reductions in cooling energy were comparatively small for the residential unit.
- (3)
- The aluminum frame incorporated very high embodied CO2 emissions and reduced the LCCO2 benefits of the DWCS system.
Acknowledgments
Author Contributions
Conflicts of Interest
References
- Laustsen, J. Energy Efficient Requirements in Building Codes, Energy Efficiency Policies for New Buildings; Internal Energy Agency: Paris, France, 2009. [Google Scholar]
- The American Institute of Architects (AIA). Architects and Climate Change; AIA: Washington, DC, USA, 2008. [Google Scholar]
- Korea Energy Economics Institute (KEEI). Energy Consumption Survey (2008); KEEI: Seoul, Korea, 2009. [Google Scholar]
- Energy Saving Trust. Fabric First 2010; Energy Saving Trust: London, UK, 2010. [Google Scholar]
- Fallahi, A.; Haghighat, F.; Elsadi, H. Energy performance assessment of double-skin facade with thermal mass. Energy Build. 2010, 42, 1499–1509. [Google Scholar] [CrossRef]
- Hamza, N. Double versus single skin facades in hot arid areas. Energy Build. 2008, 40, 240–248. [Google Scholar] [CrossRef]
- Zhou, J.; Chen, Y. A review on applying ventilated double-skin facade to buildings in hot-summer and cold-winter zone in China. Renew. Sustain. Energy Rev. 2010, 14, 1321–1328. [Google Scholar] [CrossRef]
- Huckemann, V.; Kuchen, E.; Leão, M. Empirical thermal comfort evaluation of single and double skin facades. Build. Environ. 2010, 45, 976–982. [Google Scholar] [CrossRef]
- Høseggen, R.; Wachenfeldt, B.J.; Hanssen, S.O. Building simulation as an assisting tool in decision making: Case study: With or without a double-skin façade. Energy Build. 2008, 40, 821–827. [Google Scholar] [CrossRef]
- Wong, P.C.; Prasad, D.; Behnia, M. A new type of double-skin façade configuration for the hot and humid climate. Energy Build. 2008, 40, 1941–1945. [Google Scholar] [CrossRef]
- Yilmaz, Z.; Çetintas, F. Double skin façade’s effects on heat losses of office buildings in Istanbul. Energy Build. 2005, 37, 691–697. [Google Scholar] [CrossRef]
- Xu, L.; Ojima, T. Field experiments on natural energy utilization in a residential house with a double skin façade system. Build. Environ. 2007, 42, 2014–2023. [Google Scholar] [CrossRef]
- Joe, J.; Choi, W.; Kwon, H.; Huh, J.H. Load characteristics and operation strategies of building integrated with multi-story double skin façade. Energy Build. 2013, 60, 185–198. [Google Scholar] [CrossRef]
- Gratia, E.; de Herde, A. Natural cooling strategies efficiency in an office building with a double-skin façade. Energy Build. 2004, 36, 1139–1152. [Google Scholar] [CrossRef]
- Gratia, E.; de Herde, A. Guidelines for improving natural daytime ventilation in an office building with a double-skin façade. Sol. Energy 2007, 81, 435–448. [Google Scholar] [CrossRef]
- Saelens, D.; Roels, S.; Hens, H. On the Influence of the Inlet Temperature in Multiple-Skin Facade Modeling. In Proceedings of the 8th International IBPSA Conference, Eindhoven, The Netherlands, 11–14 August 2003; pp. 1139–1146.
- Ballestini, G.; Carli, M.D.; Masiero, N.; Tombola, G. Possibilities and limitations of natural ventilation in restored industrial archaeology buildings with a double-skin façade in Mediterranean climates. Build. Environ. 2005, 40, 983–995. [Google Scholar] [CrossRef]
- Park, C.S.; Augenbroe, G.; Sadegh, N.; Thitisawat, M.; Messadi, T. Real-time optimization of a double-skin façade based on lumped modeling and occupant preference. Build. Environ. 2004, 39, 939–948. [Google Scholar] [CrossRef]
- Onur, N.; Sivrioğlu, M.; Turgut, O. An experimental study on air window collector having a vertical blind for active solar heating. Sol. Energy 1996, 57, 375–380. [Google Scholar] [CrossRef]
- Baker, P.; McEvoy, M. Test cell analysis of the use of a supply air window as a passive solar component. Sol. Energy 2000, 69, 113–130. [Google Scholar] [CrossRef]
- Gosselin, J.R.; Chen, Q.Y. A computational method for calculating heat transfer and airflow through a dual-airflow window. Energy Build. 2008, 40, 452–458. [Google Scholar] [CrossRef]
- Wei, J.; Zhao, J.; Chen, Q. Energy performance of a dual airflow window under different climates. Energy Build. 2010, 42, 111–122. [Google Scholar]
- Almeida, F.; Naylor, D. Experimental study of free convection in a window with a heated between-panes blind. Energy Build. 2011, 43, 2647–2655. [Google Scholar] [CrossRef]
- Kim, J.; Kim, T.; Leigh, S.-B. Double window system with ventilation slits to prevent window surface condensation in residential buildings. Energy Build. 2011, 43, 3120–3130. [Google Scholar] [CrossRef]
- Appelfeld, D.; Svendsen, S. Experimental analysis of energy performance of a ventilated window for heat recovery under controlled conditions. Energy Build. 2011, 43, 3200–3207. [Google Scholar] [CrossRef]
- Carlos, J.S.; Corvacho, H. Ventilated double window for the pre-heating of the ventilation air. Comparison of its performance in a northern and in a southern European climate. J. Renew. Energy 2013, 2013, 290865:1–290865:11. [Google Scholar]
- Cheong, C.-H.; Kim, T.-Y.; Leigh, S.-B.; Hwang, S.-H. Indoor air flow pattern in the mixed-use apartment with double window system. J. Archit. Inst. Korea 2013, 12, 287–296. [Google Scholar]
- Carlos, J.S.; Corvacho, H.; Silva, P.D.; Castro-Gomes, J.P. Heat recovery versus solar collection in a ventilated double window. Appl. Therm. Eng. 2012, 37, 258–266. [Google Scholar] [CrossRef]
- Carlos, J.S.; Corvacho, H. Evaluation of the thermal performance indices of a ventilated double window through experimental and analytical procedures: Uw-values. Renew. Energy 2014, 63, 747–754. [Google Scholar] [CrossRef]
- Sung, U.-J.; Cho, S.; Song, K.-D. An analysis on the thermal performance of the venetian blind integrated with double-window system at night of heating period. J. Korean Soc. Living Environ. Syst. 2012, 19, 472–478. [Google Scholar]
- Tae, S.; Shin, S.; Woo, J.; Roh, S. The development of apartment house life cycle CO2 simple assessment system using standard apartment houses of South Korea. Renew. Sustain. Energy Rev. 2011, 15, 1454–1467. [Google Scholar] [CrossRef]
- Rule, B.; Worth, Z.J.; Boyle, C.A. Comparison of life cycle carbon dioxide emissions and embodied energy in four renewable electricity generation technologies in New Zealand. Environ. Sci. Technol. 2009, 43, 6406–6413. [Google Scholar] [CrossRef] [PubMed]
- Strachan, P.A.; Kokogiannakis, G.; Macdonald, I.A. History and development of validation with the ESP-r simulation program. Energy Build. 2008, 43, 601–609. [Google Scholar] [CrossRef] [Green Version]
- Strachan, P.A. ESP-r: Summary of Validation Studies; University of Strathclyde: Scotland, UK, 2000. [Google Scholar]
- Yoo, H.; Cho, K.; Lee, Y. A study on the appraisal of energy consumption of apartment building by LCA methodology. J. Archit. Inst. Korea 2005, 18, 117–184. [Google Scholar]
- Ministry of Land, Infrastructure and Transport. Guideline for Design and Evaluation of Sustainable Housing; Korean Government: Seoul, Korea, 2010.
- Korea Energy Management Corporation. Guideline for Carbon Neutral; Korea Energy Management Corporation: Yongin, Korea, 2010. [Google Scholar]
- Lee, K.H.; Yang, J.H. A study on the functional estimation of energy consumption and carbon dioxide emission in the construction material. J. Archit. Inst. Korea 2009, 25, 43–50. [Google Scholar]
- Kang, J.S.; Kwon, Y.S. A Study on the improvements of a strengthened term for the reconstruction approval of apartment house. J. Korean Reg. Dev. Assoc. 2012, 24, 43–62. [Google Scholar]
- Ministry of Land, Infrastructure and Transport. Korean Building Code; Korean Government: Seoul, Korea, 2012.
© 2015 by the authors; licensee MDPI, Basel, Switzerland. This article is an open access article distributed under the terms and conditions of the Creative Commons Attribution license (http://creativecommons.org/licenses/by/4.0/).
Share and Cite
Cheong, C.H.; Kim, T.; Leigh, S.-B. Lifecycle CO2 Reduction by Implementing Double Window Casement Systems in Residential Units in Korea. Energies 2015, 8, 1336-1352. https://doi.org/10.3390/en8021336
Cheong CH, Kim T, Leigh S-B. Lifecycle CO2 Reduction by Implementing Double Window Casement Systems in Residential Units in Korea. Energies. 2015; 8(2):1336-1352. https://doi.org/10.3390/en8021336
Chicago/Turabian StyleCheong, Chang Heon, Taeyeon Kim, and Seung-Bok Leigh. 2015. "Lifecycle CO2 Reduction by Implementing Double Window Casement Systems in Residential Units in Korea" Energies 8, no. 2: 1336-1352. https://doi.org/10.3390/en8021336