For example, in WSCC 3-machine-9-bus system [
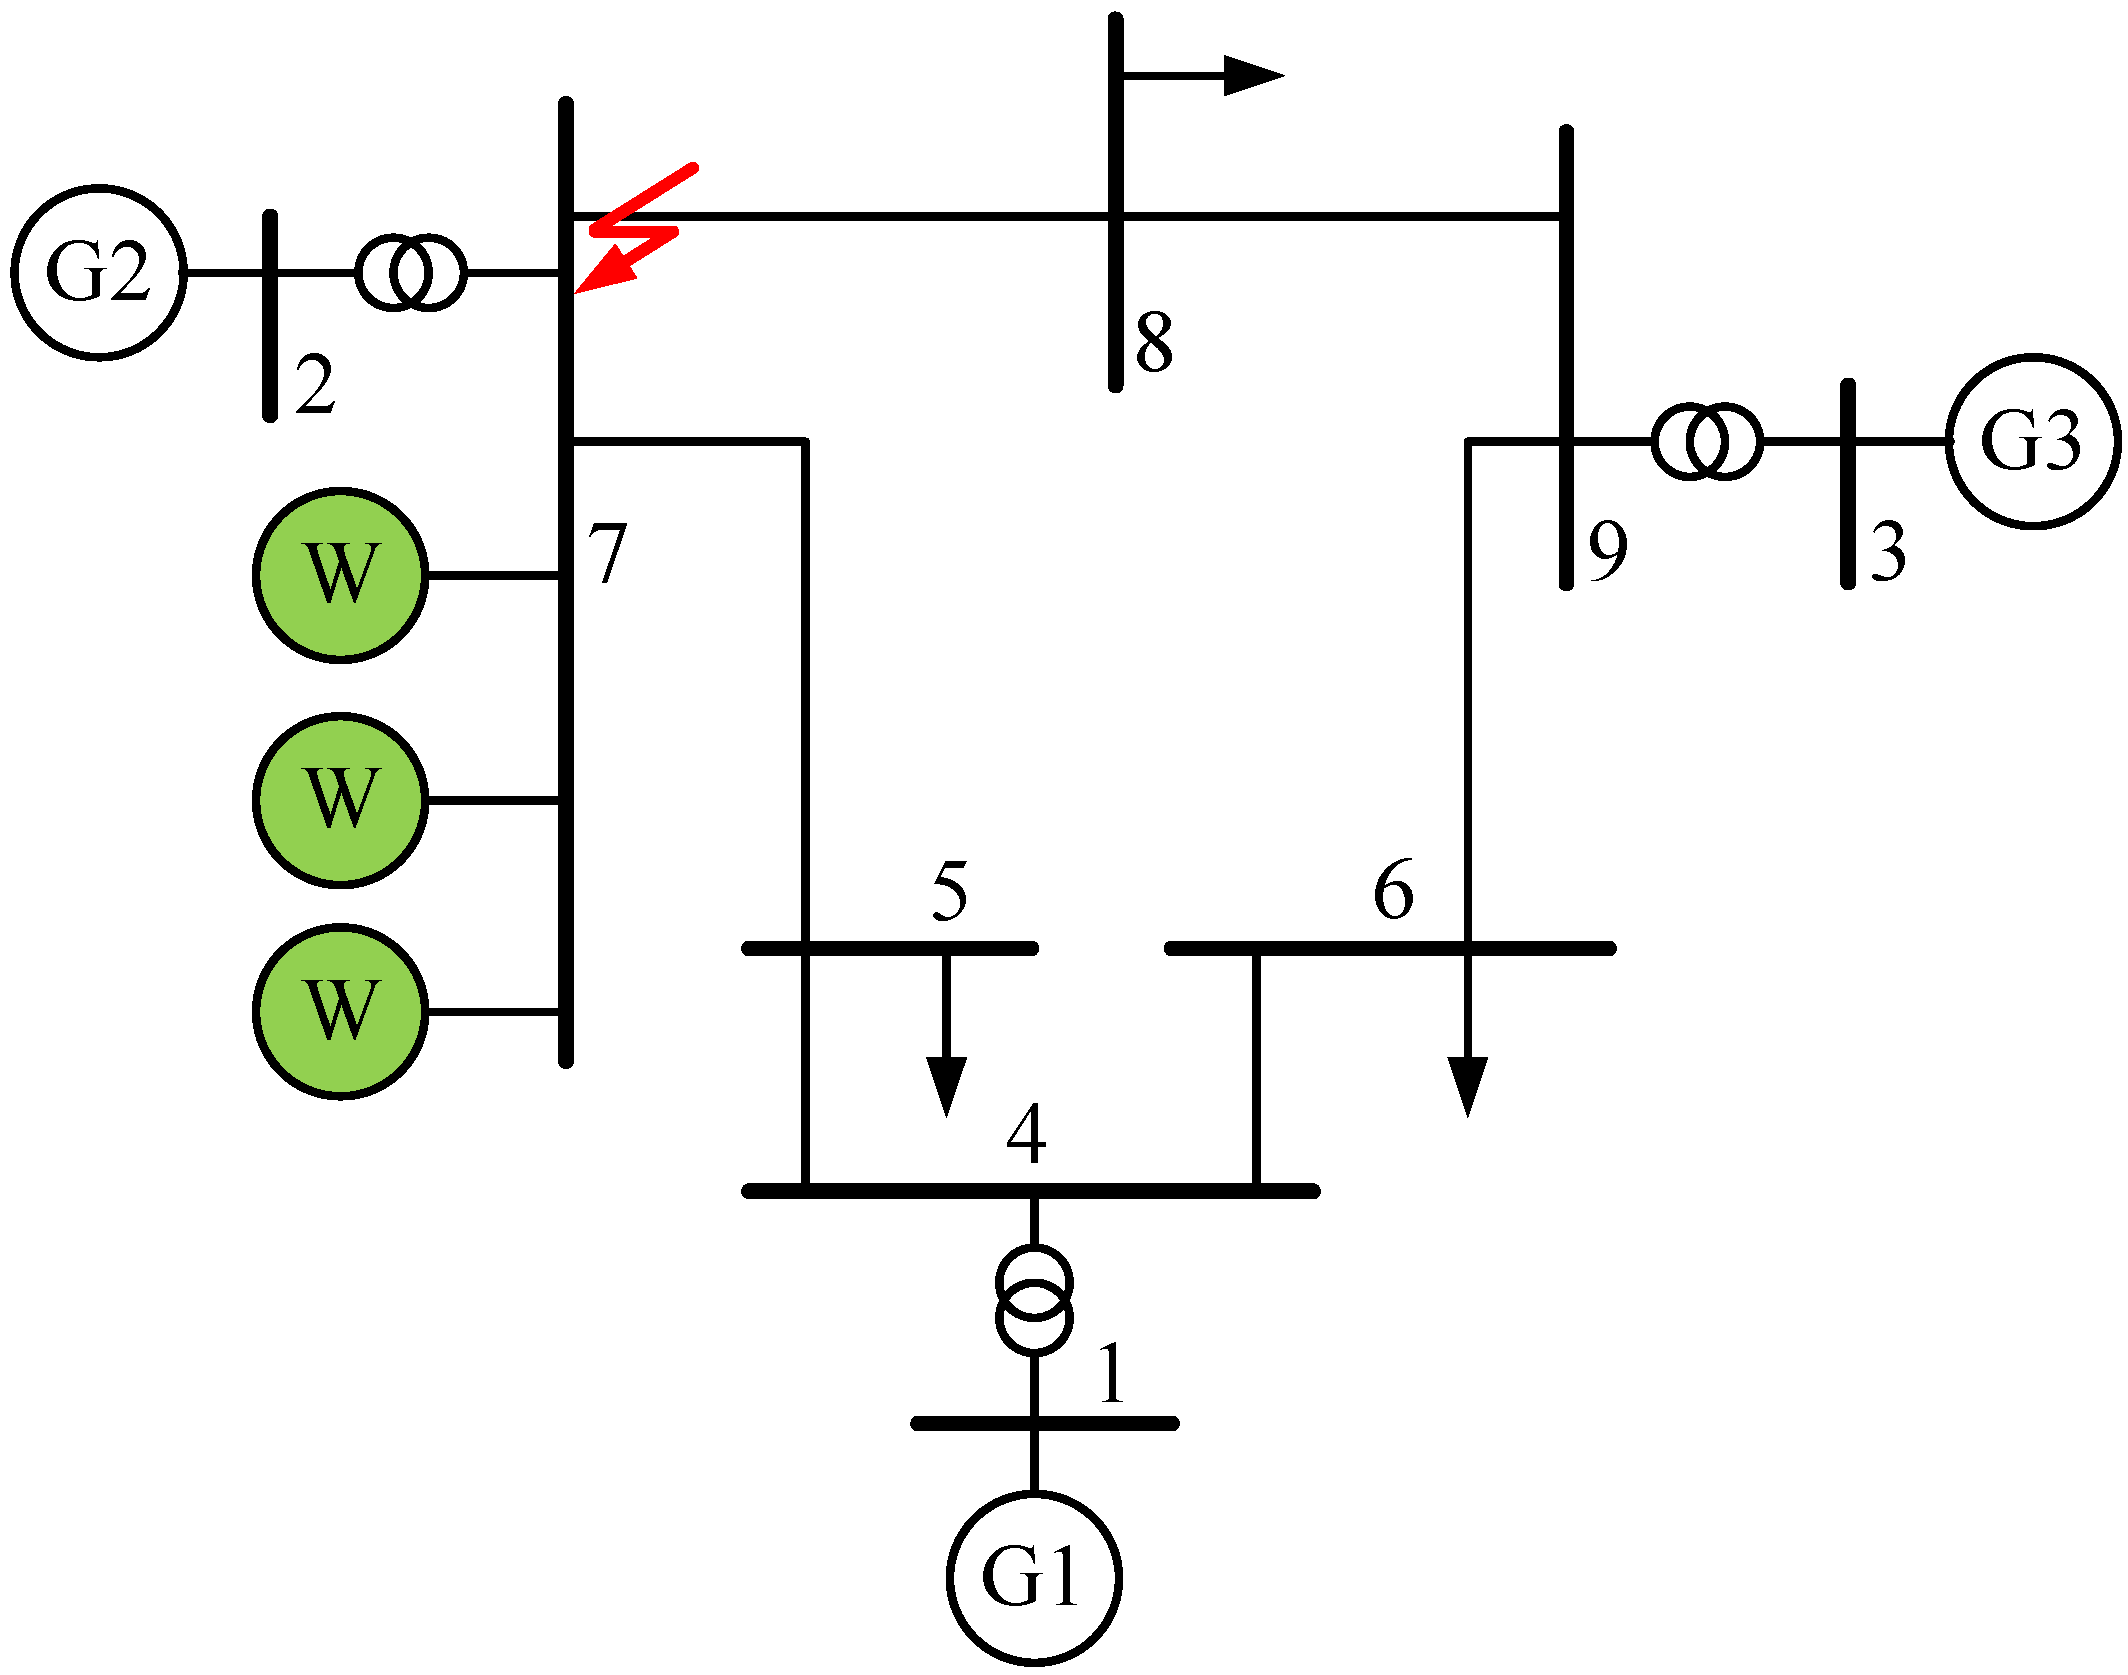
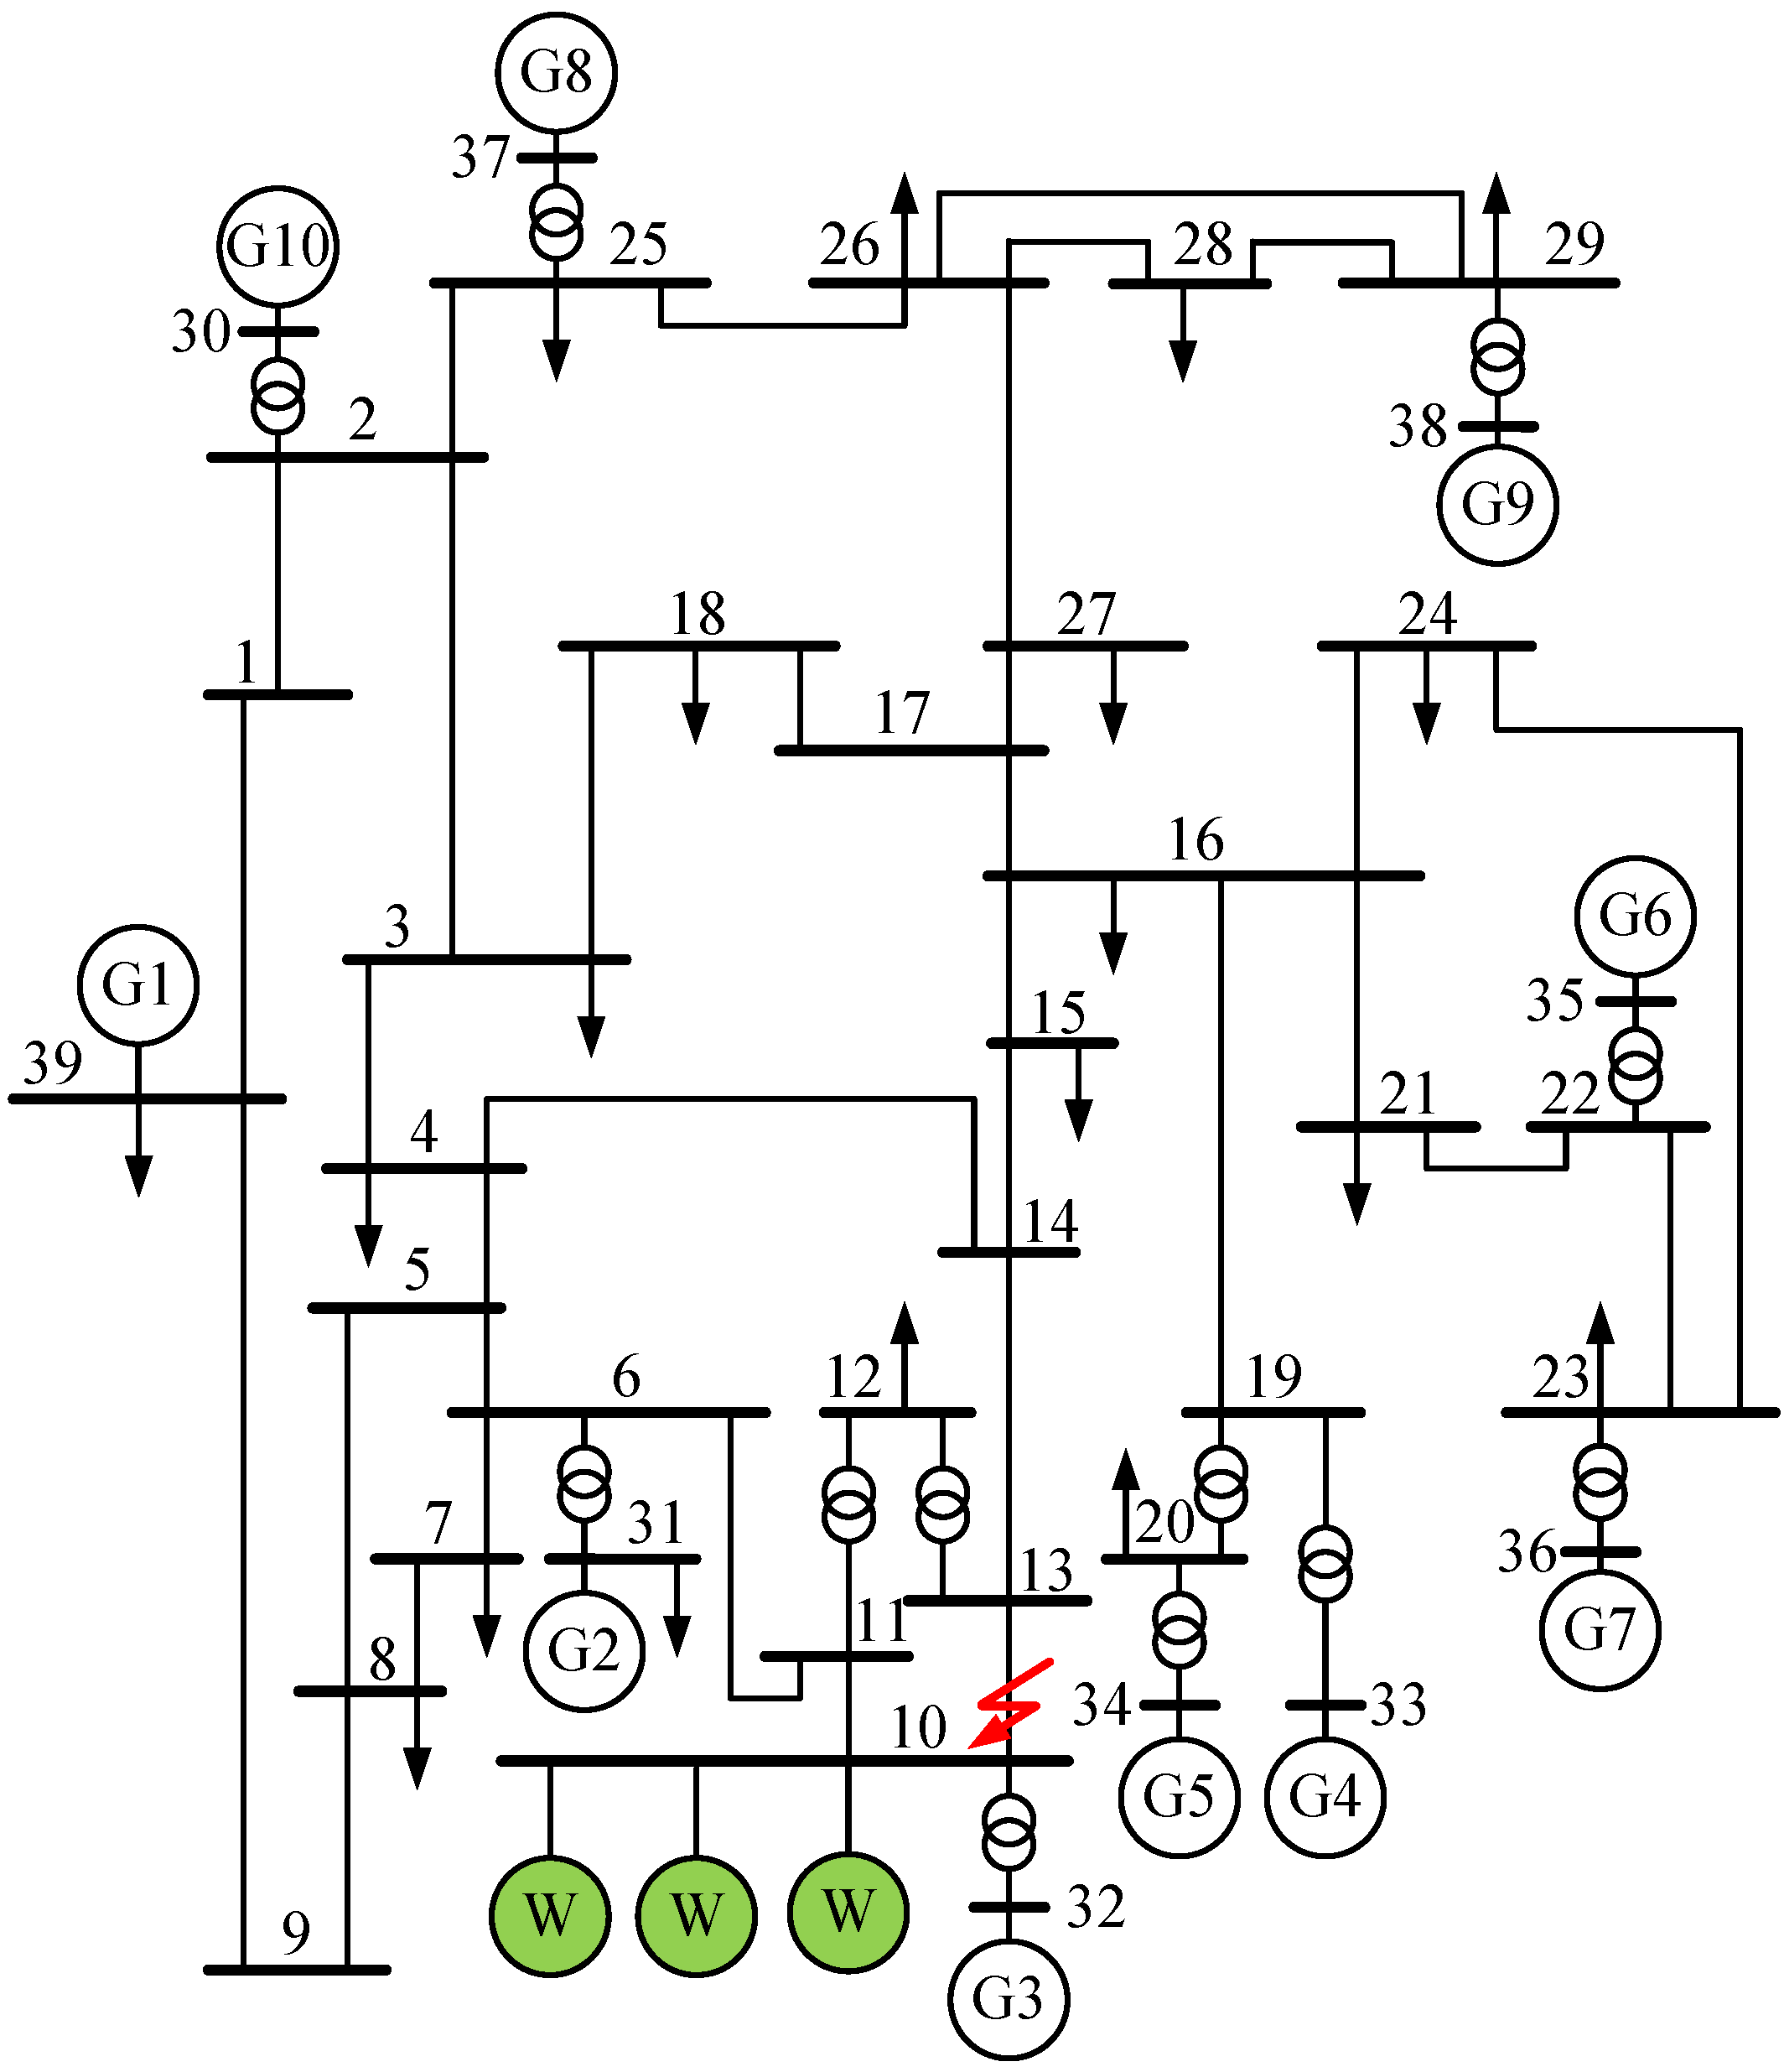
28], PMSG-based wind farms are integrated at bus 7 nearby generator G2, as shown in
Figure 5. Generator G2 can belong to cluster
S when a short-circuit fault occurs nearby bus 7. And generator G1, G3 can belong to cluster
A in the same fault condition. When the wind power is balanced by reducing the active power output of generator G1 or G3, the operation of the system presented in
Figure 5 will correspond to the scenario one or two. When the wind power is balanced by reducing the active power output of generator G2, the system operation will correspond to the scenario three or four. Naturally, the scenarios listed in
Table 1 can also occur in other systems.
Figure 5.
Western Systems Coordinating Council (WSCC) 3-machine-9-bus system integrated with PMSG-based wind farms.
4.1. Scenario One
As discussed in
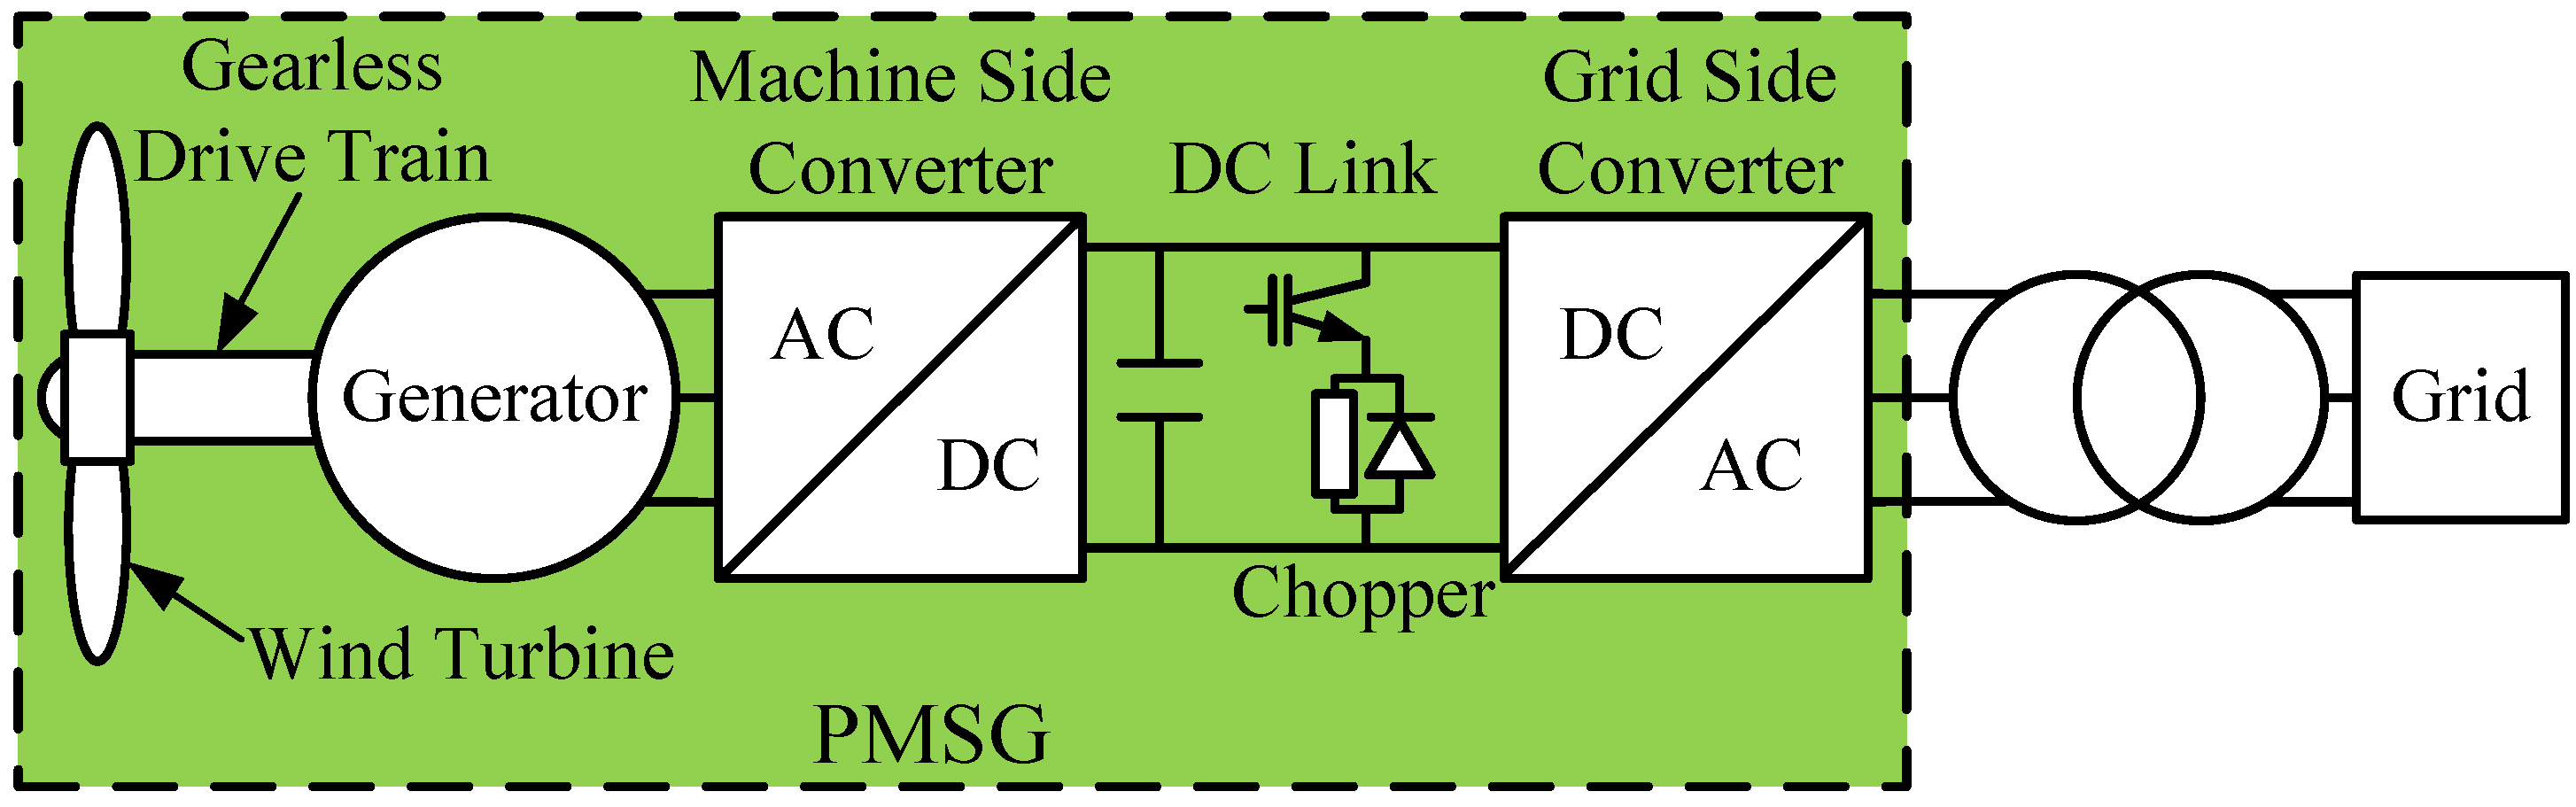
Section 2, a PMSG behaves as a controlled current source when it experiences grid faults, so a PMSG does not possess transient power-angle characteristics like a conventional synchronous generator or show any inertia to the grid. A PMSG has no problem of rotor angle stability itself and its generator does not synchronize with other conventional synchronous generators. As a result, after integrating PMSGs, the inertia of the whole system stays unchanged and the rotor motion equations of PMSGs will not be included in the expression derivation of the system’s equivalent power presented in
Section 3, which is still only based on the rotor motion equations of the original synchronous generators. Therefore, Equations (5) and (6) are applicable too in the wind case.
In scenario one, the synchronous generators used to balance wind power belong to the cluster
A. Their active power output is reduced through scaling down the mechanical input power. Other synchronous generators maintain the original operating states. Their mechanical input power is unchanged compared with the no-wind power case. The corresponding equations are described by:
where,
Pmi1,
Pmi0 are the mechanical input power of the
i-th synchronous generator of the wind case operating in scenario one and of the no-wind power case respectively.
Pmj1,
Pmj0 are the mechanical input power of the
j-th synchronous generator of the wind case operating in scenario one and of the no-wind power case respectively.
PePMSG is the pre-fault value of the sum of all the integrated PMSGs’ active power outputs.
According to Equations (5) and (9), it can be known that the value of
Pm of the wind case operating in scenario one, which is represented by
Pm1, is bigger than that of the no-wind power case, as described by:
where,
Pm0 is the value of
Pm of the no-wind power case.
As stated in
Section 3, the mechanical input power of every conventional synchronous generator is always assumed to be constant and keep its pre-fault value throughout the study period of transient stability. Therefore Equations (9) and (10) are valid throughout the same period.
Pm1 and
Pm0 are also constant like the
Pm plotted in
Figure 4. From Equation (10), it can be known that the incremental amount of
Pm1 compared with
Pm0 depends on the pre-fault value of the active power outputted by PMSGs. Considering the system’s most stressed pre-fault operating point, it is assumed that all the PMSGs operate at their rated active power before grid faults happen [
9], so
Pm1 can be determined by the wind power penetration level, which is the ratio between the rated values of the PMSGs’ active power output and the total load [
14]. The higher the wind power penetration level, the bigger the
Pm1.
Because the output current of a PMSG is variable during the study period of transient stability, it is difficult to figure out the impact of integrating PMSGs on the system’s equivalent electrical output power by directly comparing the wind case with the no-wind power case, so another case is added into the analysis as a reference case to solve this problem. This reference case is obtained by integrating ideal constant current sources (CCSs) into the system of the no-wind power case. It is thus denoted as the CCS case. At first, considering the same grid fault, the Pe curves of the wind case and the no-wind power case will be compared with those of the CCS case respectively, because these comparisons are easier to get results. Afterwards, the obtained comparison results will be analyzed together to find out the differences between the Pe curves of the wind and no-wind power cases.
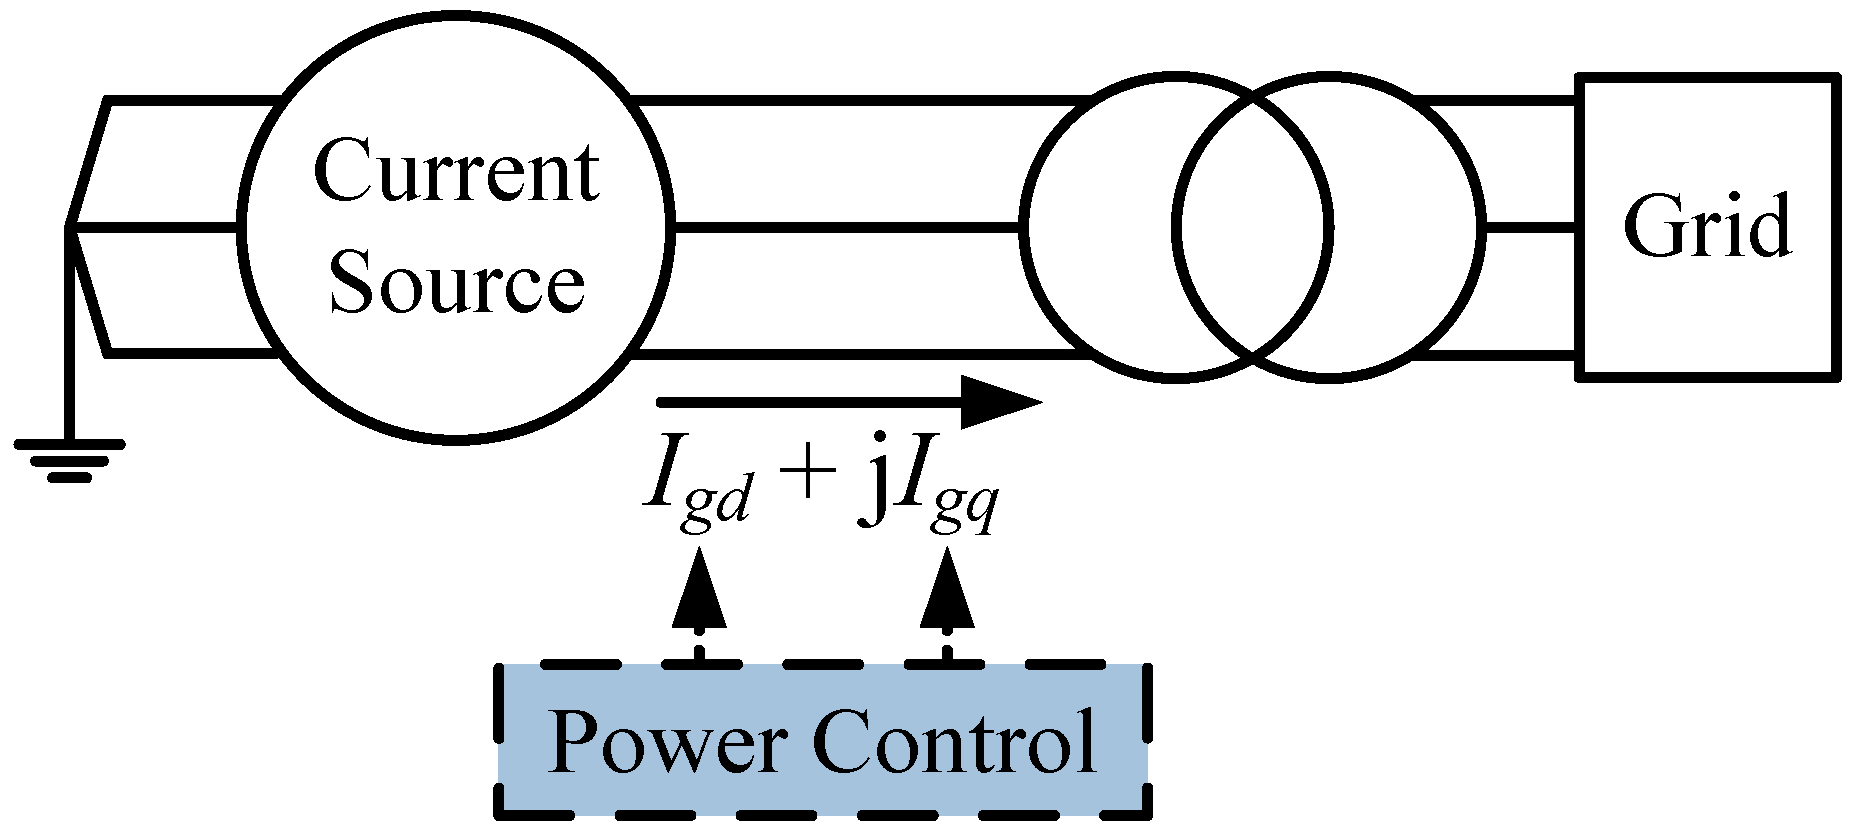
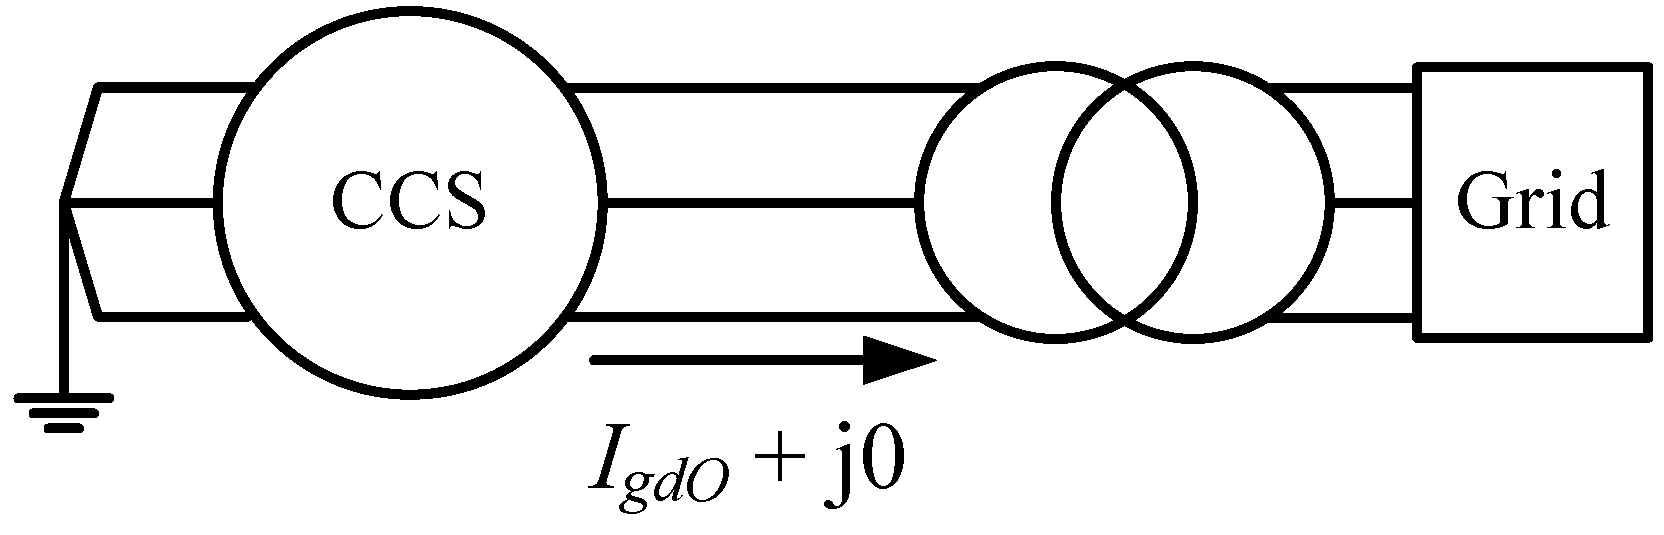
In the CCS case, the output current of a CCS is equal to the pre-fault value of the PMSG’s output current, as shown in
Figure 6. A CCS also has the same rated active power output as a PMSG. The integration points of CCSs, the CCS power penetration level that is the ratio between the rated values of the CCSs’ active power output and the total load, the machines used to balance the CCS power are all the same as those of the PMSGs in the wind case. Therefore, corresponding to the four operating scenarios of the wind case, the CCS case has two operating scenarios considered in the analysis, as shown in
Table 2. The CCS case operating in the scenario I or II is denoted by the CCS case I and the CCS case II respectively.
Figure 6.
A constant current source (CCS) integrated into the grid.
Figure 6.
A constant current source (CCS) integrated into the grid.
Table 2.
Two operating scenarios of the CCS case.
Table 2.
Two operating scenarios of the CCS case.
| Scenarios | Machines Used to Balance the CCS Power | Corresponding Operating Scenarios of the Wind Case |
|---|
| Scenario I | Remaining synchronous generators | Scenario one, Scenario two |
| Scenario II | Critical synchronous generators | Scenario three, Scenario four |
A CCS has no rotor or rotor motion equation. After integrating CCSs, the derivation of the system’s equivalent electrical output power is still only based on the rotor motion equations of the original synchronous generators. Equation (6) is thus also applicable in the CCS case. In addition, the integration of CCSs does not influence the system’s inertia and admittance matrix. According to Equations (6) and (7), it can be known that the
Pe curves of the CCS case remain the same as the ones of the no-wind power case, no matter which scenario the CCS case is operating in. The corresponding equations are described by:
where,
PeOI,
PeDI,
PePI are the values of the
PeO,
PeD and
PeP curves of the CCS case I respectively.
PeOII,
PeDII,
PePII are the values of the
PeO,
PeD and
PeP curves of the CCS case II respectively.
PeO0,
PeD0,
PeP0 are the values of the
PeO,
PeD and
PeP curves of the no-wind power case respectively.
As analyzed in
Section 2, a PMSG of the wind case behaves like a CCS of the CCS case during the pre-fault and the post-fault periods. Therefore, considering other same settings of the wind case and the CCS case, the values of the
PeO and
PeP curves of the wind case are equal to those of the CCS case. According to Equation (11), they are also equal to those of the no-wind power case. As a result, after integrating PMSGs, the system’s
PeO and
PeP curves will keep their original forms. In scenario one, the corresponding equations are described by:
where,
PeO1,
PeP1 are the values of the
PeO and
PeP curves of the wind case operating in scenario one respectively.
If grid faults occur, the output current of a PMSG will change to a different value from its pre-fault value. In the wind case operating in scenario one, the fault period output current of a PMSG is an active current that is bigger than
IgdO, while the fault period output current of a CCS in the CCS case I is still equal to
IgdO, so in the wind case, the bigger active current injection from PMSGs makes the transmission lines near PMSGs possess larger current magnitudes compared with the same lines in the CCS case I. These transmission lines in the wind case thus have more active and reactive power losses, which can cause the network near PMSGs to have a lower voltage. Therefore, the critical synchronous generators near PMSGs may output less active power during the fault period, compared with the same critical machines in the CCS case I, but the remaining synchronous generators in the wind case can barely be influenced due to their long electrical distances from the PMSGs [
14]. Their fault period active power generation may be equal to that of the remaining machines in the CCS case I, with considering the same settings of the wind case and the CCS case previously introduced. The corresponding equations are described by:
where,
PeDi1,
PeDj1 are the during fault values of the electrical output power of the
i-th and
j-th synchronous generators in the wind case operating in scenario one respectively.
PeDiI,
PeDjI are the during fault values of the electrical output power of the
i-th and
j-th synchronous generators in the CCS case I respectively.
According to Equations (6) and (13), it can be known that the
PeD curve value of the wind case operating in scenario one is smaller than that of the CCS case I, as described by:
where,
PeD1 is the value of the
PeD curve of the wind case operating in scenario one.
According to Equations (11) and (14),
PeD1 is also smaller than
PeD0. Therefore, the system’s
PeD curve can be brought down after integrating PMSGs with the unity power factor control mode, as described by:
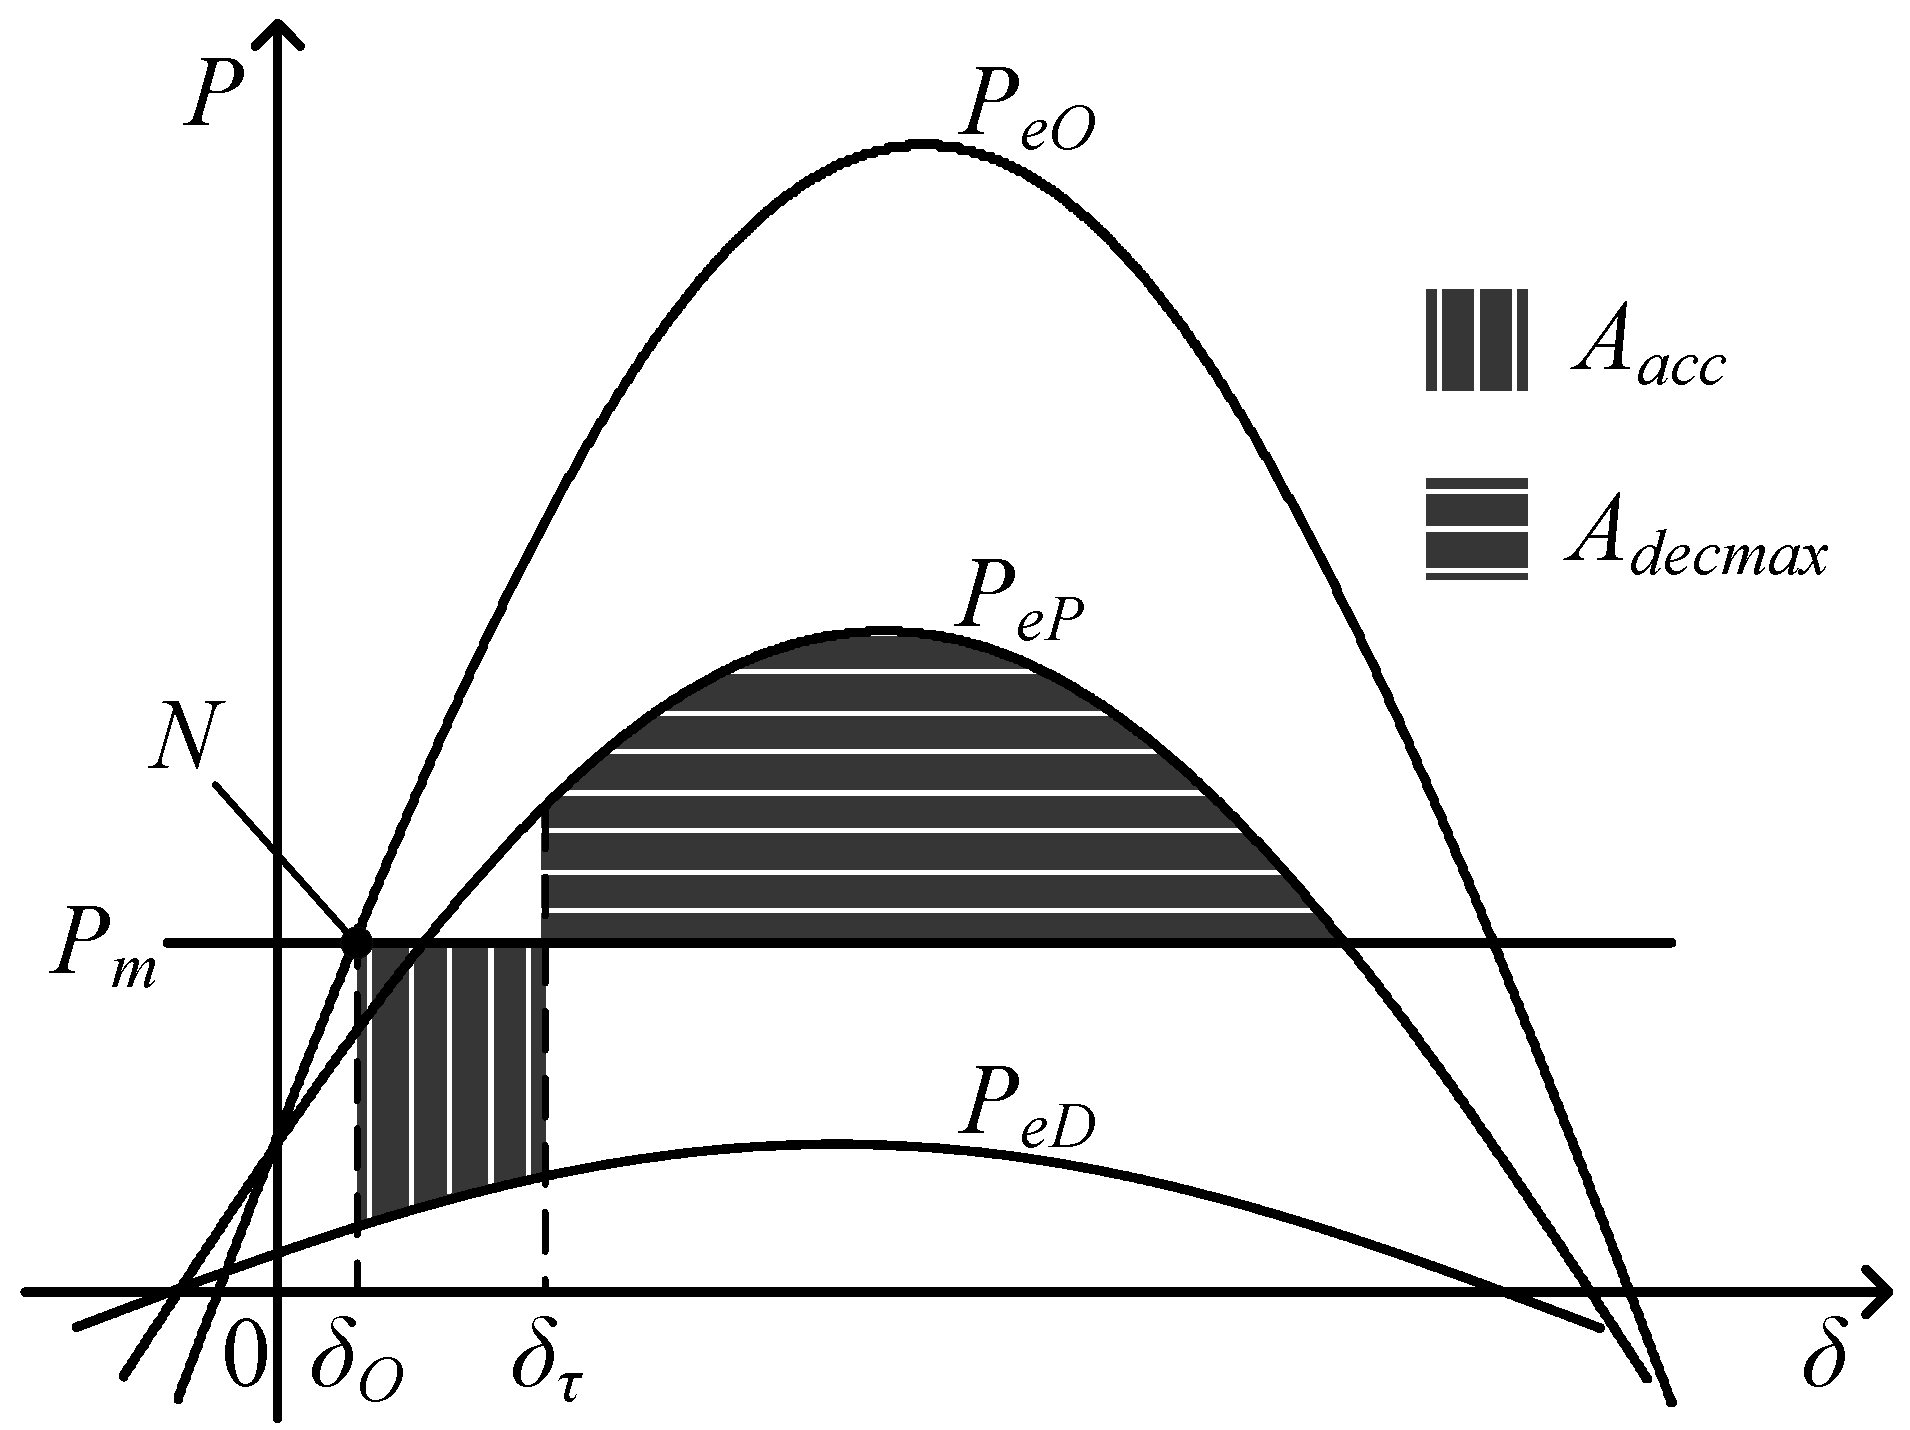
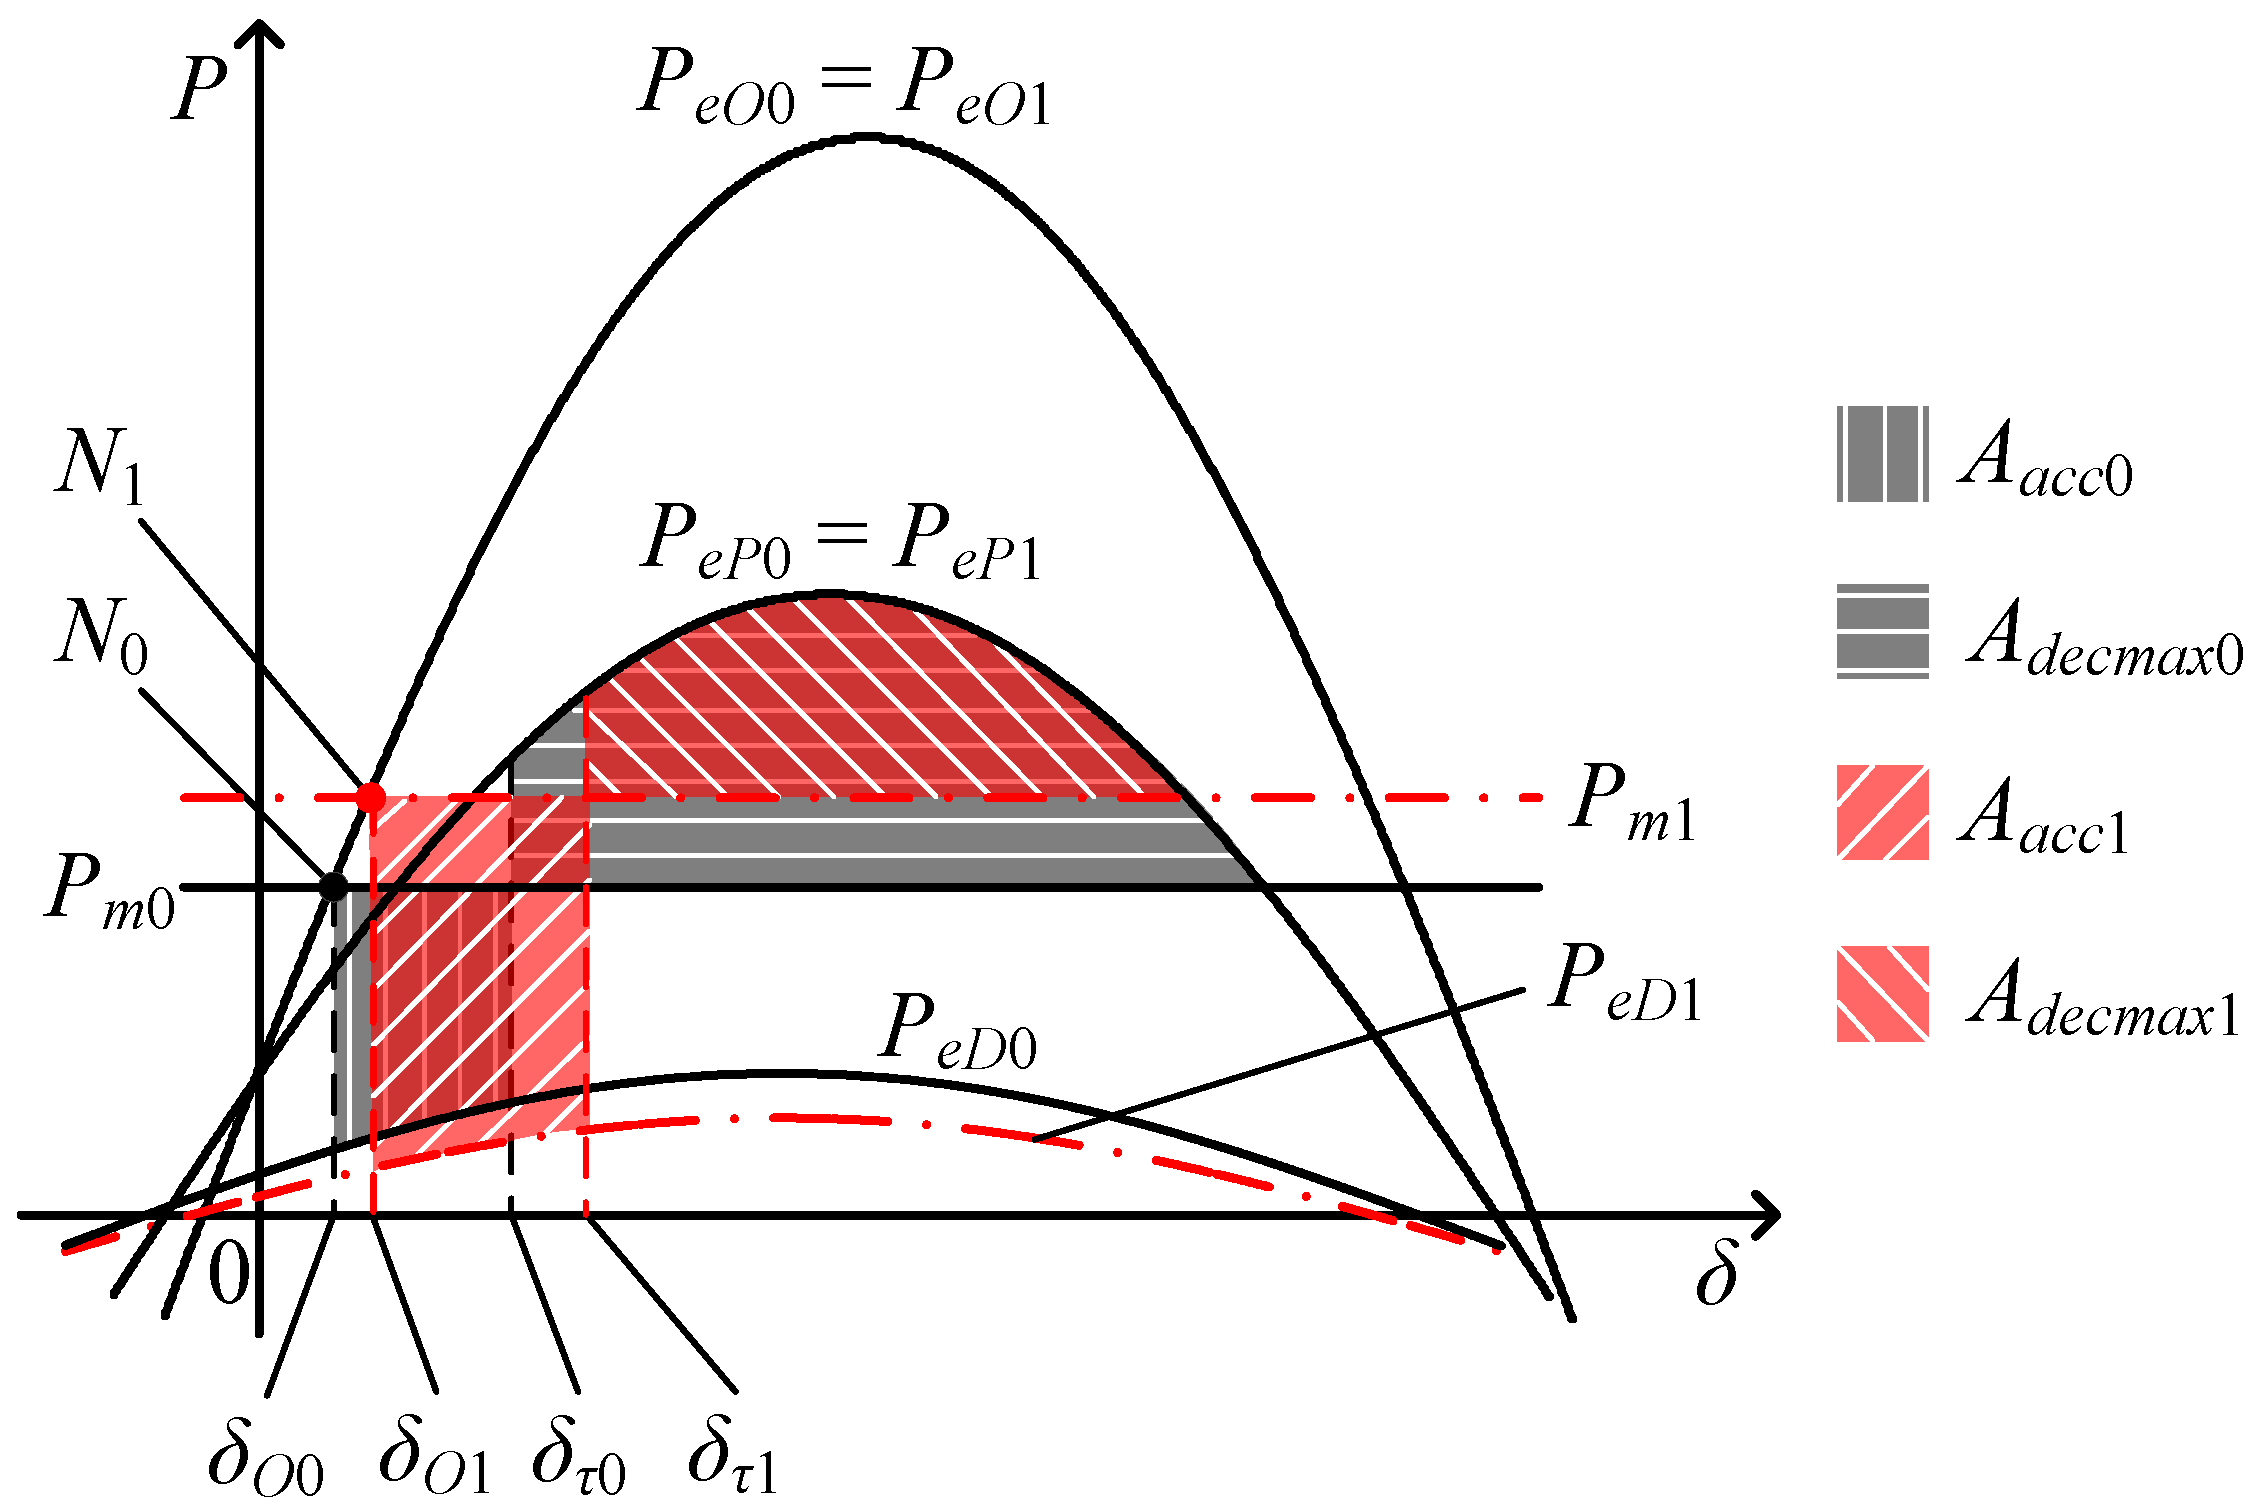
Based on Equations (10), (12) and (15), the comparison of the equivalent
P-δ curves between the wind and no-wind power cases is shown in
Figure 7.
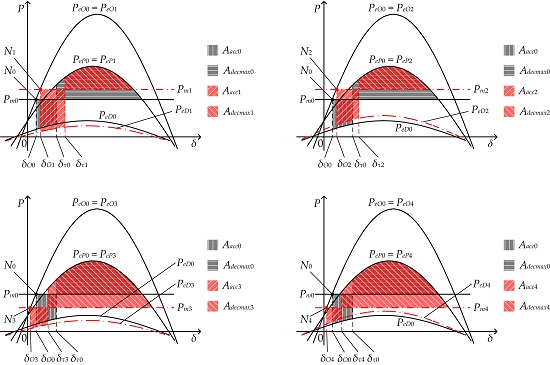
N0, δ
O0, δ
τ0,
Aacc0,
Adecmax0 are the variables of the no-wind power case. They represent the system’s pre-fault operating point, the pre-fault value of δ, the fault clearing moment value of δ, the equivalent accelerating area and the equivalent maximum decelerating area of the whole system, respectively.
N1, δ
O1, δ
τ1,
Aacc1,
Adecmax1 are the corresponding variables of the wind case operating in scenario one.
Figure 7.
The comparison of the equivalent P-δ curves between the wind case operating in scenario one and the no-wind power case.
Figure 7.
The comparison of the equivalent P-δ curves between the wind case operating in scenario one and the no-wind power case.
Observing
Figure 7, it can be seen that the pre-fault operating point of the wind case is higher than that of the no-wind power case because of the
Pm1 curve rise, so δ
O1 > δ
O0. The accelerating power of the wind case, (
Pm1 −
PeD1), is larger than that of the no-wind power case due to the
Pm1 curve rise and the
PeD1 curve drop. Therefore, according to Equation (3), it can be deduced that the equivalent rotor angle variation of the wind case is larger too during the fault period, with considering the same fault duration in these two cases. The corresponding equation is shown below:
Considering δ
O1 > δ
O0 and Equation (16), it can be known that δ
τ1 is bigger than δ
τ0. As a result, compared with the no-wind power case, it can be seen from
Figure 7 that the equivalent accelerating area of the wind case is increased due to the
Pm1 curve rise,
PeD1 curve drop and the increment of δ
τ1 − δ
O1. The equivalent maximum decelerating area of the wind case is decreased due to the
Pm1 curve rise and the increment of δ
τ1. The corresponding equation is shown below:
According to Equations (8) and (17), Equation (18) can be obtained. The transient stability of the wind case is worse than that of the no-wind power case:
where,
Vts0,
Vts1 are the transient stability indexes of the no-wind power case and the wind case operating in scenario one respectively.
Therefore, the PMSG-based wind power penetration has a detrimental impact on the system transient stability in this analyzed situation. When the wind power penetration level increases, the system transient stability will become worse due to the higher Pm1 curve and the lower PeD1 curve.
4.2. Scenario Two
In scenario two, the analysis of the system’s
Pm,
PeO and
PeP curves are similar to the scenario one. The analysis results are shown below:
where,
Pm2,
PeO2,
PeP2 are the values of the
Pm,
PeO and
PeP curves of the wind case operating in scenario two respectively.
If grid faults occur, a PMSG of the wind case operating in scenario two will output reactive current to improve the grid voltage, while a CCS of the CCS case I will still only output active current. So in the wind case, the network near PMSGs can possesses higher voltage compared with the same part of the grid in the CCS case I. As a result, the critical synchronous generators near PMSGs may output more active power during the fault period, compared with the same critical machines in the CCS case I. The remaining synchronous generators in the wind case still receive little impact from the fault period output current of PMSGs and have the same active power output as the remaining machines in the CCS case I. Therefore, according to Equations (6) and (11), the value of the
PeD curve of the wind case operating in scenario two is larger than that of the CCS case I, and is thus larger than that of the no-wind power case. The corresponding equation is shown below:
where,
PeD2 is the value of the
PeD curve of the wind case operating in scenario two.
Based on Equations (19) and (20), the comparison of the equivalent
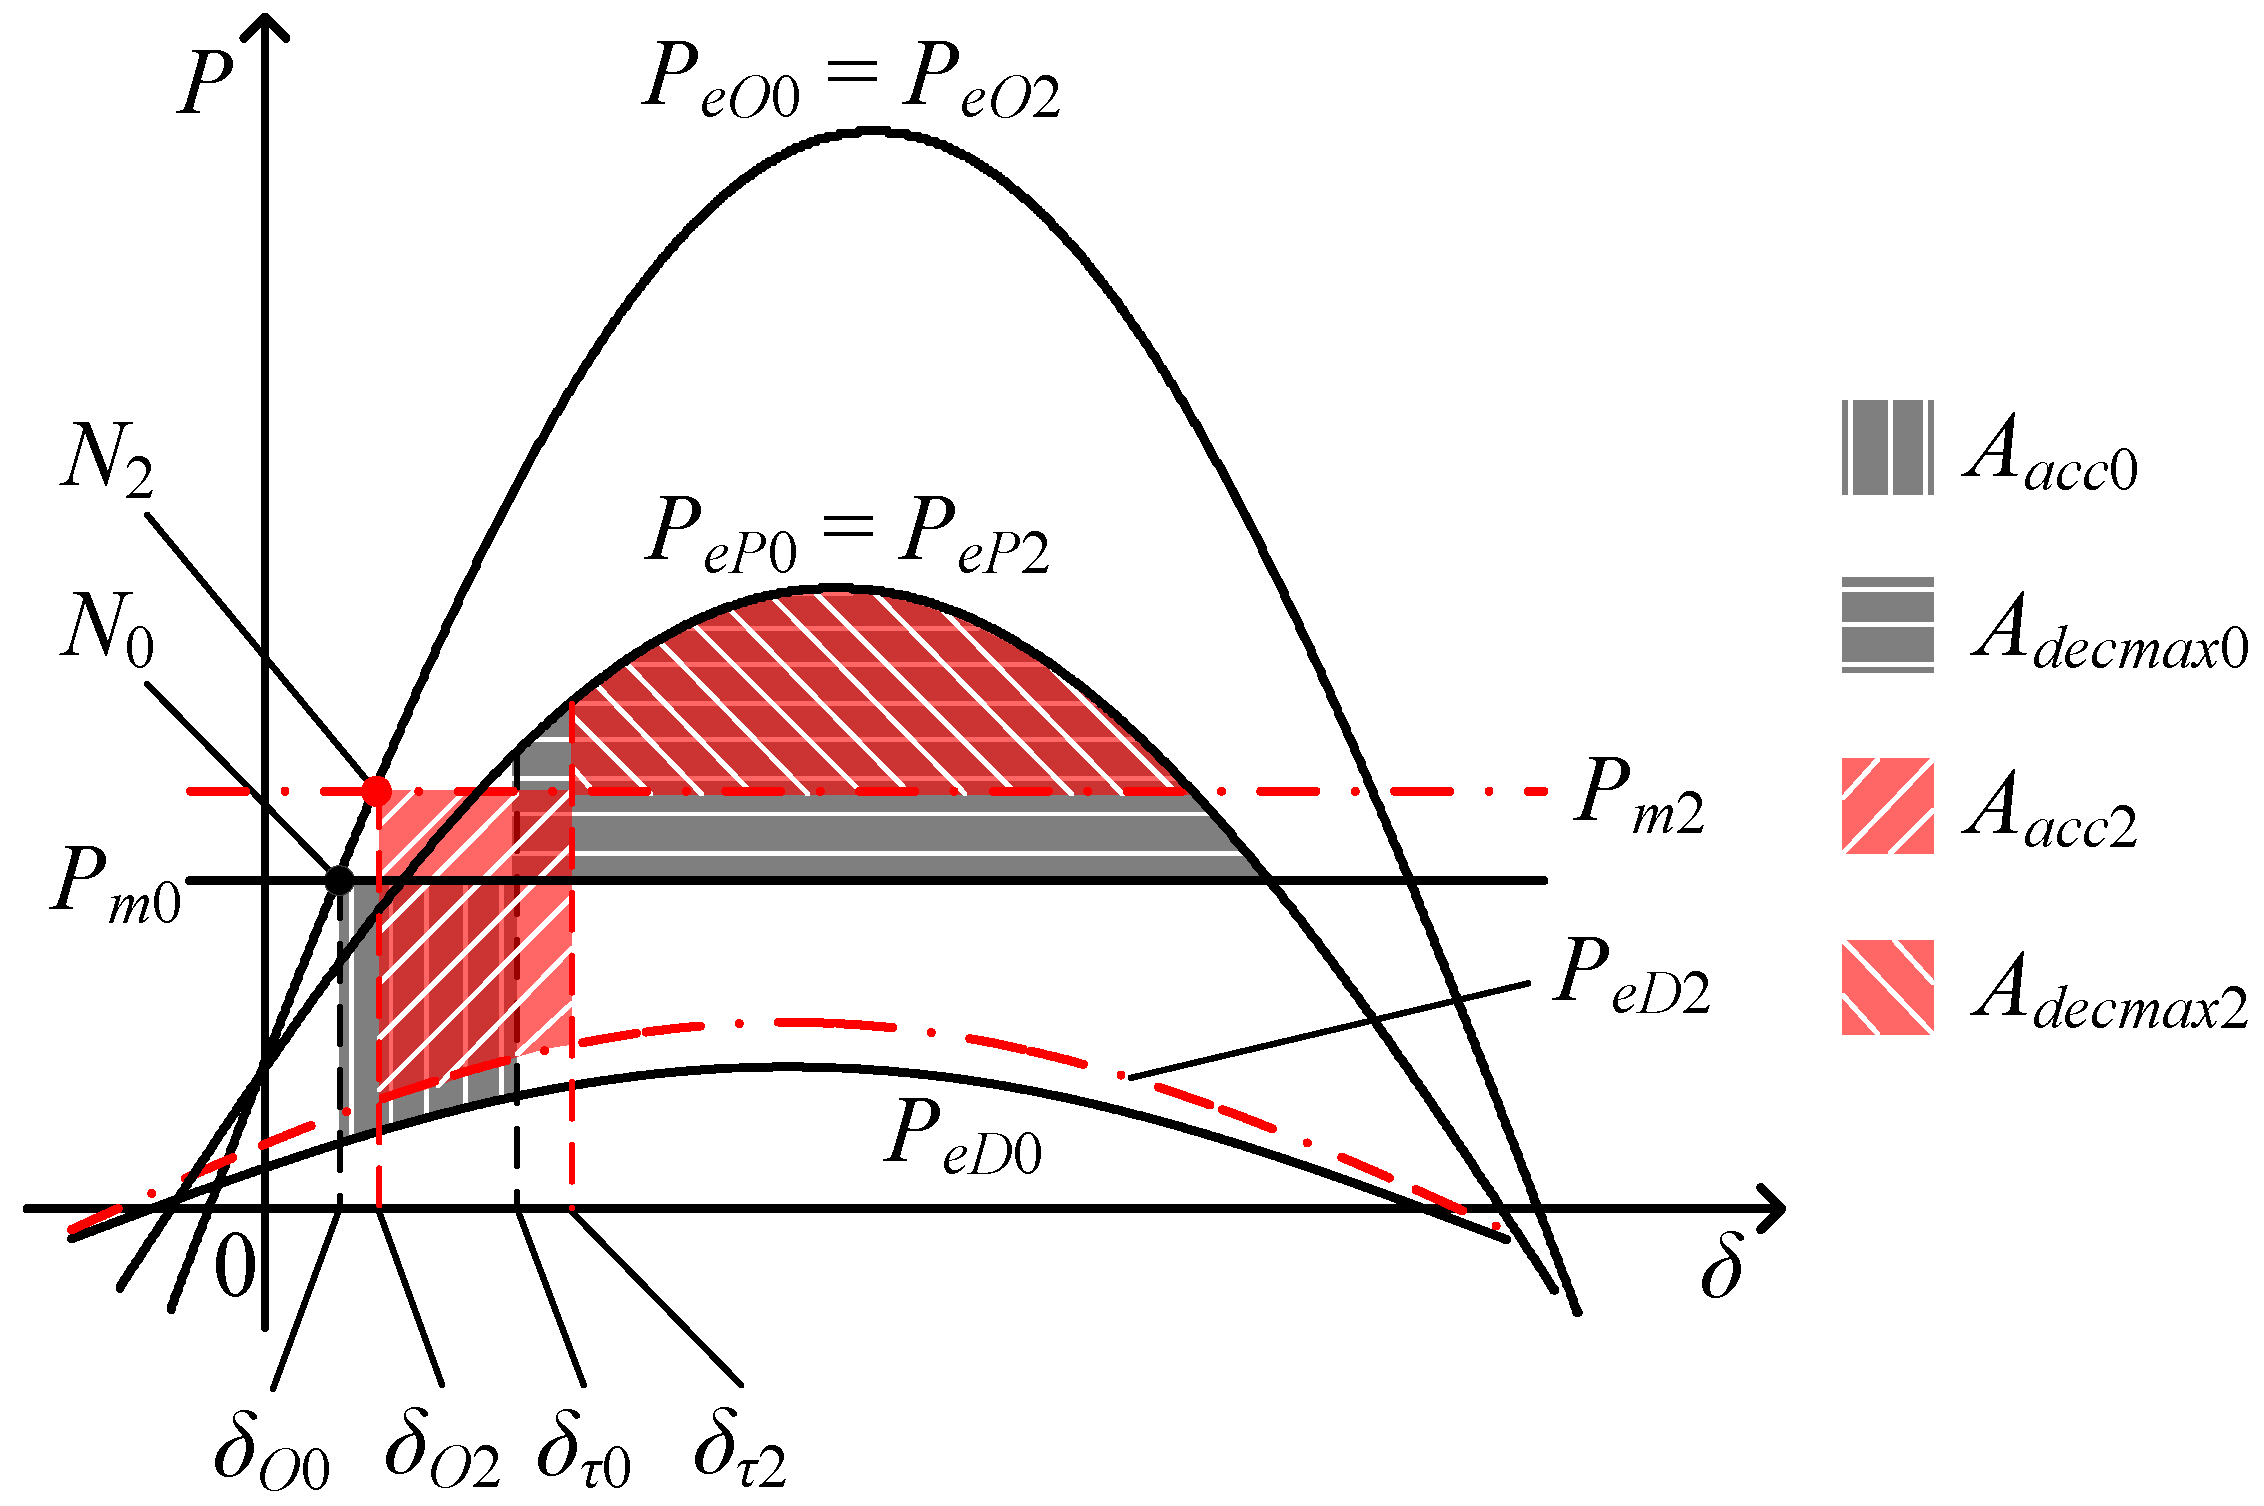
P-δ curves between the wind and no-wind power cases is shown in
Figure 8.
N2, δ
O2, δ
τ2,
Aacc2,
Adecmax2 are the variables of the wind case operating in scenario two. They represent the system’s pre-fault operating point, the pre-fault value of δ, the fault clearing moment value of δ, the equivalent accelerating area and the equivalent maximum decelerating area of the whole system, respectively.
Figure 8.
The comparison of the equivalent P-δ curves between the wind case operating in scenario two and the no-wind power case.
Figure 8.
The comparison of the equivalent P-δ curves between the wind case operating in scenario two and the no-wind power case.
Observing
Figure 8, compared with the no-wind power case, it can be seen that both the values of the
Pm2 and
PeD2 curves are increased. However, the reactive power support capability of PMSGs is restricted by the capacity of converters and the grid voltage drop [
10]. The voltage improvement of the network near PMSGs is limited and so is the rise of the
PeD2 curve. The
Pm2 curve thus has a larger rise amount. As a result, the accelerating power of the wind case, (
Pm2 −
PeD2), is still larger than that of the no-wind power case. During the fault period, the equivalent rotor angle of the wind case also has larger variation, as described by:
Compared with the no-wind power case, the equivalent accelerating area of the wind case is increased due to the increment of δ
τ2 − δ
O2 and the
Pm2 curve rise, which has greater effect than the
PeD2 curve rise. The equivalent maximum decelerating area of the wind case is decreased due to the
Pm2 curve rise and the increment of δ
τ2. Therefore, the transient stability of the wind case is still worse than that of the no-wind power case, as described by:
where,
Vts2 is the transient stability index of the wind case operating in scenario two. In this analyzed situation, the PMSG-based wind power penetration also has a detrimental impact on the system transient stability. When the wind power penetration level increases, the system transient stability will become worse too due to the higher
Pm2 curve, which has greater effect on the system than the higher
PeD2 curve.
Observing
Figure 7 and
Figure 8 together, the
Pm curves and the pre-fault operating points of the wind cases operating in scenario one and two will be the same when the wind power penetration level is equal in these two scenarios, but the accelerating power of the wind case operating in scenario two is smaller due to the
PeD2 curve rise compared with the
PeD1 curve drop. Therefore, the equivalent rotor angle of the wind case operating in scenario two has smaller variation during the fault period, as described by:
Considering the same pre-fault operating points of the wind cases operating in these two scenarios and Equation (23), it can be known that δτ2 is smaller than δτ1, so compared with scenario one, the equivalent accelerating area of the wind case operating in scenario two is decreased due to the higher PeD2 curve and the smaller δτ2 − δO2. The equivalent maximum decelerating area of the wind case operating in scenario two is increased due to the smaller δτ2. Therefore, the wind case operating in scenario two has better transient stability.
4.3. Scenario Three
In scenario three, the synchronous generators used to balance wind power belong to the cluster
S. Their active power output is also reduced through scaling down the mechanical input power. Other synchronous generators maintain the original operating states. The corresponding equations are described by:
where,
Pmi3,
Pmj3 are the mechanical input power of the
i-th and
j-th synchronous generators of the wind case operating in scenario three respectively.
According to Equations (5) and (24), it can be known that the value of
Pm of the wind case operating in scenario three, which is represented by
Pm3, is smaller than that of the no-wind power case, as described by:
Like the analysis results in scenario one, Equations (24) and (25) are also valid throughout the study period of transient stability. Pm3 is also constant and determined by the wind power penetration level. The higher the wind power penetration level, the smaller the Pm3.
The analysis of the
Pe curves of the wind case operating in scenario three is similar to the scenario one, but the CCS case II is adopted as the reference case. The analysis results are shown below:
where,
PeO3,
PeD3,
PeP3 are the values of the
PeO,
PeD and
PeP curves of the wind case operating in scenario three respectively.
Based on Equations (25) and (26), the comparison of the equivalent
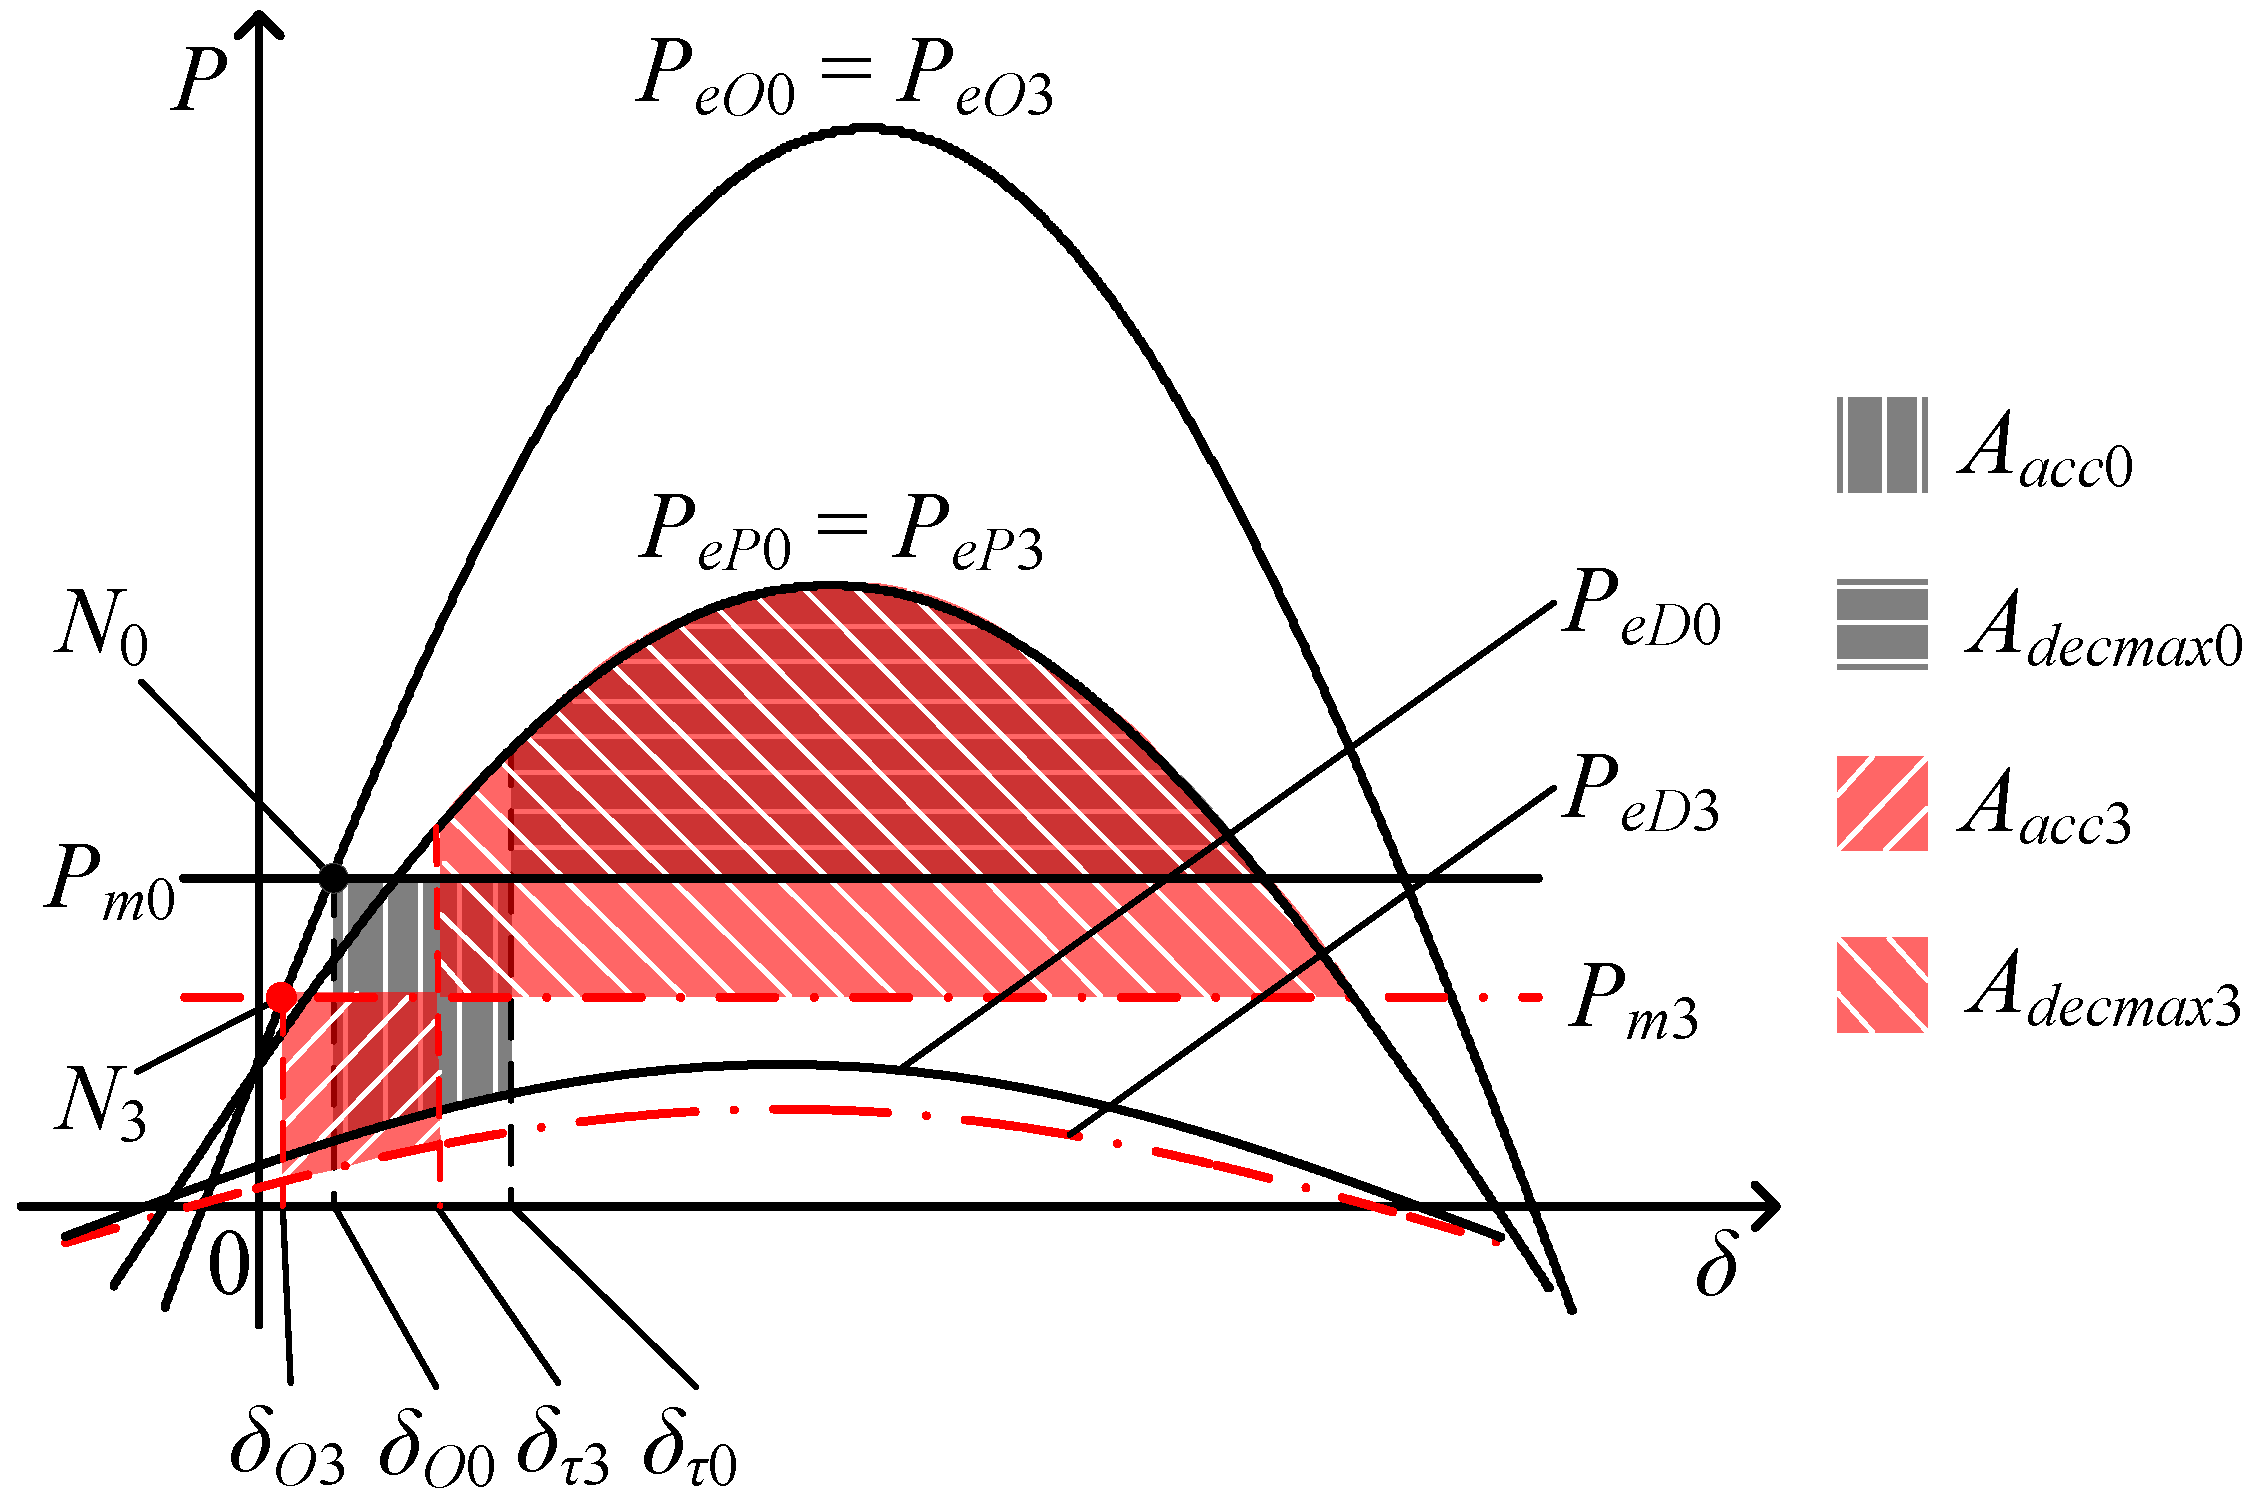
P-δ curves between the wind and no-wind power cases is shown in
Figure 9.
N3, δ
O3, δ
τ3,
Aacc3,
Adecmax3 are the variables of the wind case operating in scenario three. They represent the system’s pre-fault operating point, the pre-fault value of δ, the fault clearing moment value of δ, the equivalent accelerating area and the equivalent maximum decelerating area of the whole system, respectively.
Figure 9.
The comparison of the equivalent P-δ curves between the wind case operating in scenario three and the no-wind power case.
Figure 9.
The comparison of the equivalent P-δ curves between the wind case operating in scenario three and the no-wind power case.
Observing
Figure 9, it can be seen that the pre-fault operating point of the wind case is lower than that of the no-wind power case because of the
Pm3 curve drop. So δ
O3 < δ
O0. The value of the
PeD3 curve is also decreased compared with the
PeD0 curve. During the fault period, the output current increment of PMSGs with the unity power factor control mode is the main reason to cause the
PeD3 curve drop. But this current increment is limited especially in the high wind speed situation. So the drop of the
PeD3 curve may be not significant and the
Pm3 curve has larger drop amount. As a result, the accelerating power of the wind case, (
Pm3 −
PeD3), is smaller than that of the no-wind power case. The equivalent rotor angle of the wind case thus has smaller fault period variation, as described by:
Considering δ
O3 < δ
O0 and Equation (27), it can be known that δ
τ3 is smaller than δ
τ0. Compared with the no-wind power case, the equivalent accelerating area of the wind case is decreased due to the decrement of δ
τ3 − δ
O3 and the
Pm3 curve drop, which has greater effect than the
PeD3 curve drop. The equivalent maximum decelerating area of the wind case is increased due to the
Pm3 curve drop and the decrement of δ
τ3. Therefore, the transient stability of the wind case is better than that of the no-wind power case, as described by:
where,
Vts3 is the transient stability index of the wind case operating in scenario three. In this analyzed situation, the PMSG-based wind power penetration has a beneficial impact on the system transient stability. When the wind power penetration level increases, the system transient stability will become better due to the lower
Pm3 curve, which has greater effect on the system than the lower
PeD3 curve.
4.4. Scenario Four
In scenario four, the analysis of the system’s
Pm curve is similar to the scenario three and the analysis of the system’s
Pe curves is similar to the scenario two. The CCS case II is used as the reference case. The analysis results of scenario four are shown below:
where,
Pm4,
PeO4,
PeD4,
PeP4 are the values of the
Pm,
PeO,
PeD and
PeP curves of the wind case operating in scenario four respectively.
Pm4 is constant throughout the study period of transient stability.
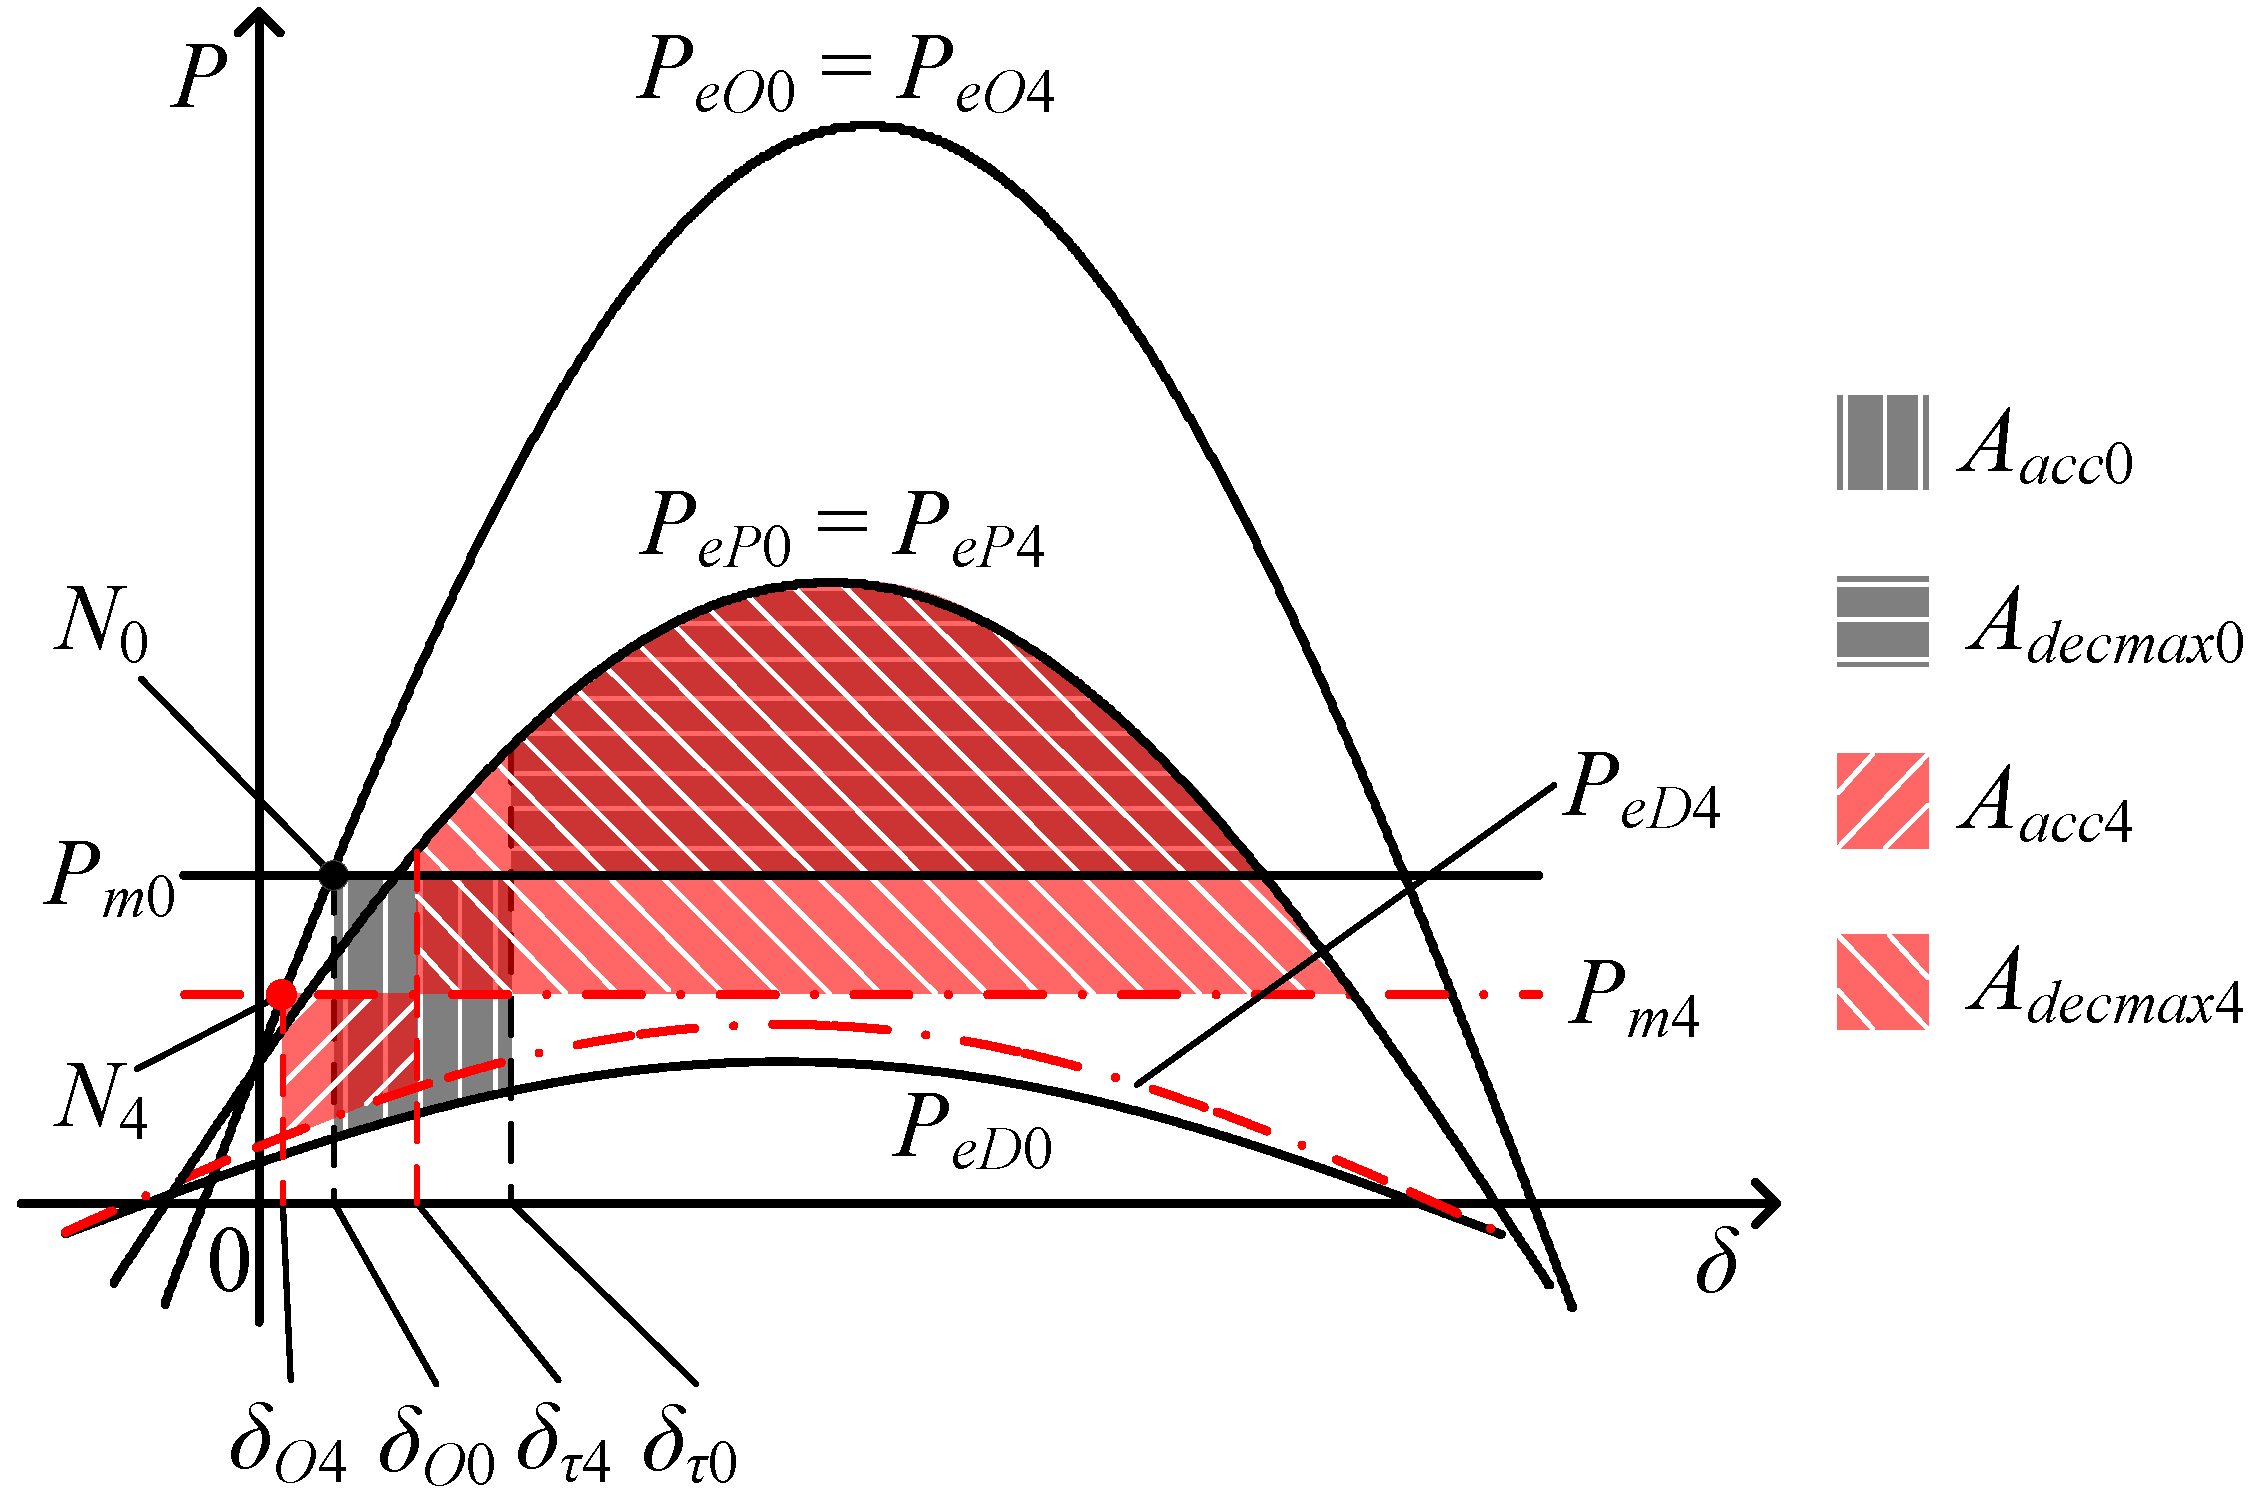
Based on Equation (29), the comparison of the equivalent
P-δ curves between the wind and no-wind power cases is shown in
Figure 10.
N4, δ
O4, δ
τ4,
Aacc4,
Adecmax4 are the variables of the wind case operating in scenario four. They represent the system’s pre-fault operating point, the pre-fault value of δ, the fault clearing moment value of δ, the equivalent accelerating area and the equivalent maximum decelerating area of the whole system, respectively.
Figure 10.
The comparison of the equivalent P-δ curves between the wind case operating in scenario four and the no-wind power case.
Figure 10.
The comparison of the equivalent P-δ curves between the wind case operating in scenario four and the no-wind power case.
Observing
Figure 10, it can be seen that the pre-fault operating point of the wind case is also lower than that of the no-wind power case because of the
Pm4 curve drop. The accelerating power of the wind case, (
Pm4 −
PeD4), is smaller than that of the no-wind power case due to the
Pm4 curve drop and the
PeD4 curve rise. As a result, during the fault period, the equivalent rotor angle of the wind case has smaller variation, as described by:
Compared with the no-wind power case, it can be seen from
Figure 10 that the equivalent accelerating area of the wind case is decreased due to the
Pm4 curve drop,
PeD4 curve rise and the decrement of δ
τ4 − δ
O4. The equivalent maximum decelerating area of the wind case is increased due to the
Pm4 curve drop and the decrement of δ
τ4. Therefore, the transient stability of the wind case is still better than that of the no-wind power case, as described by:
where,
Vts4 is the transient stability index of the wind case operating in scenario four. In this analyzed situation, the PMSG-based wind power penetration also has a beneficial impact on the system transient stability. When the wind power penetration level increases, the system transient stability will become better due to the lower
Pm4 curve and the higher
PeD4 curve.
Observing
Figure 9 and
Figure 10 together, the
Pm curves and the pre-fault operating points of the wind cases operating in scenario three and four will be the same when the wind power penetration level is equal in these two scenarios. The accelerating power of the wind case operating in scenario four is smaller due to the
PeD4 curve rise compared with the
PeD3 curve drop. Therefore, the equivalent rotor angle of the wind case operating in scenario four has smaller fault period variation, as described by:
Consequently, δτ4 is smaller than δτ3. Compared with scenario three, the equivalent accelerating area of the wind case operating in scenario four is decreased due to the higher PeD4 curve and the smaller δτ4 − δO4. The equivalent maximum decelerating area of the wind case operating in scenario four is increased due to the smaller δτ4. Therefore, the wind case operating in scenario four has better transient stability.


