
Study on the Performance of a Ground Source Heat Pump System Assisted by Solar Thermal Storage

Abstract
:1. Introduction
2. System Summary and Operation Strategy
2.1. System Summary
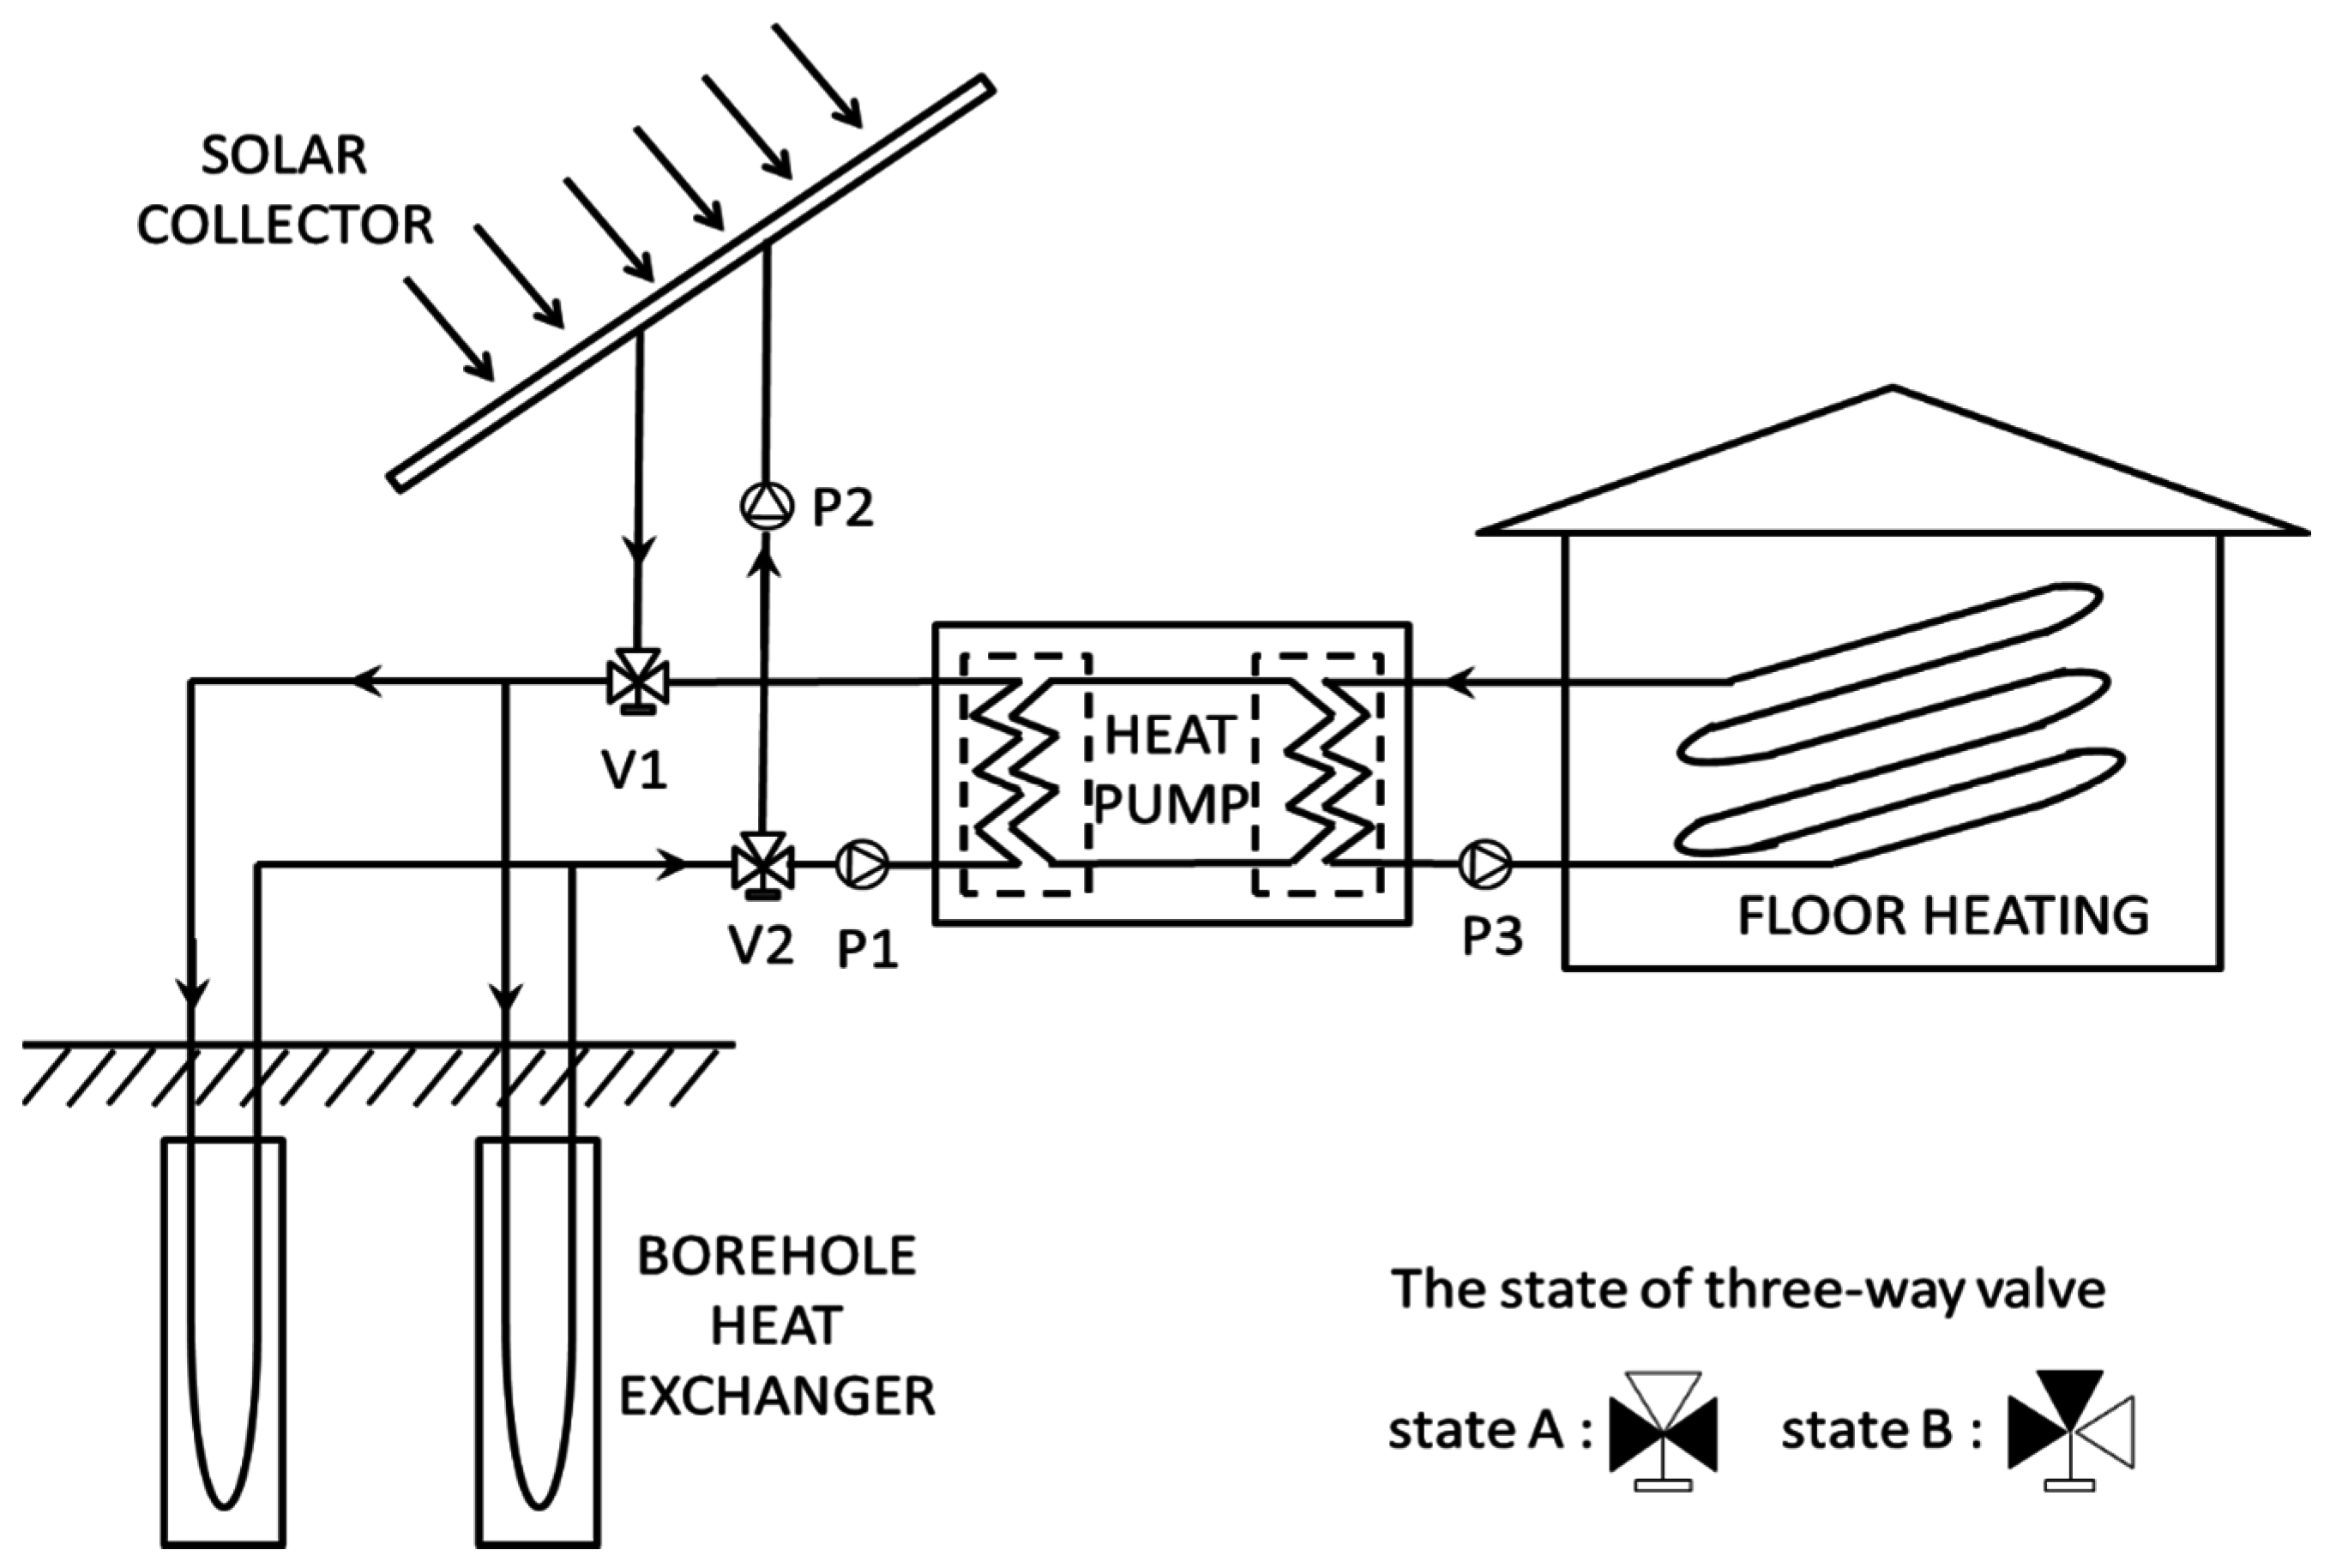
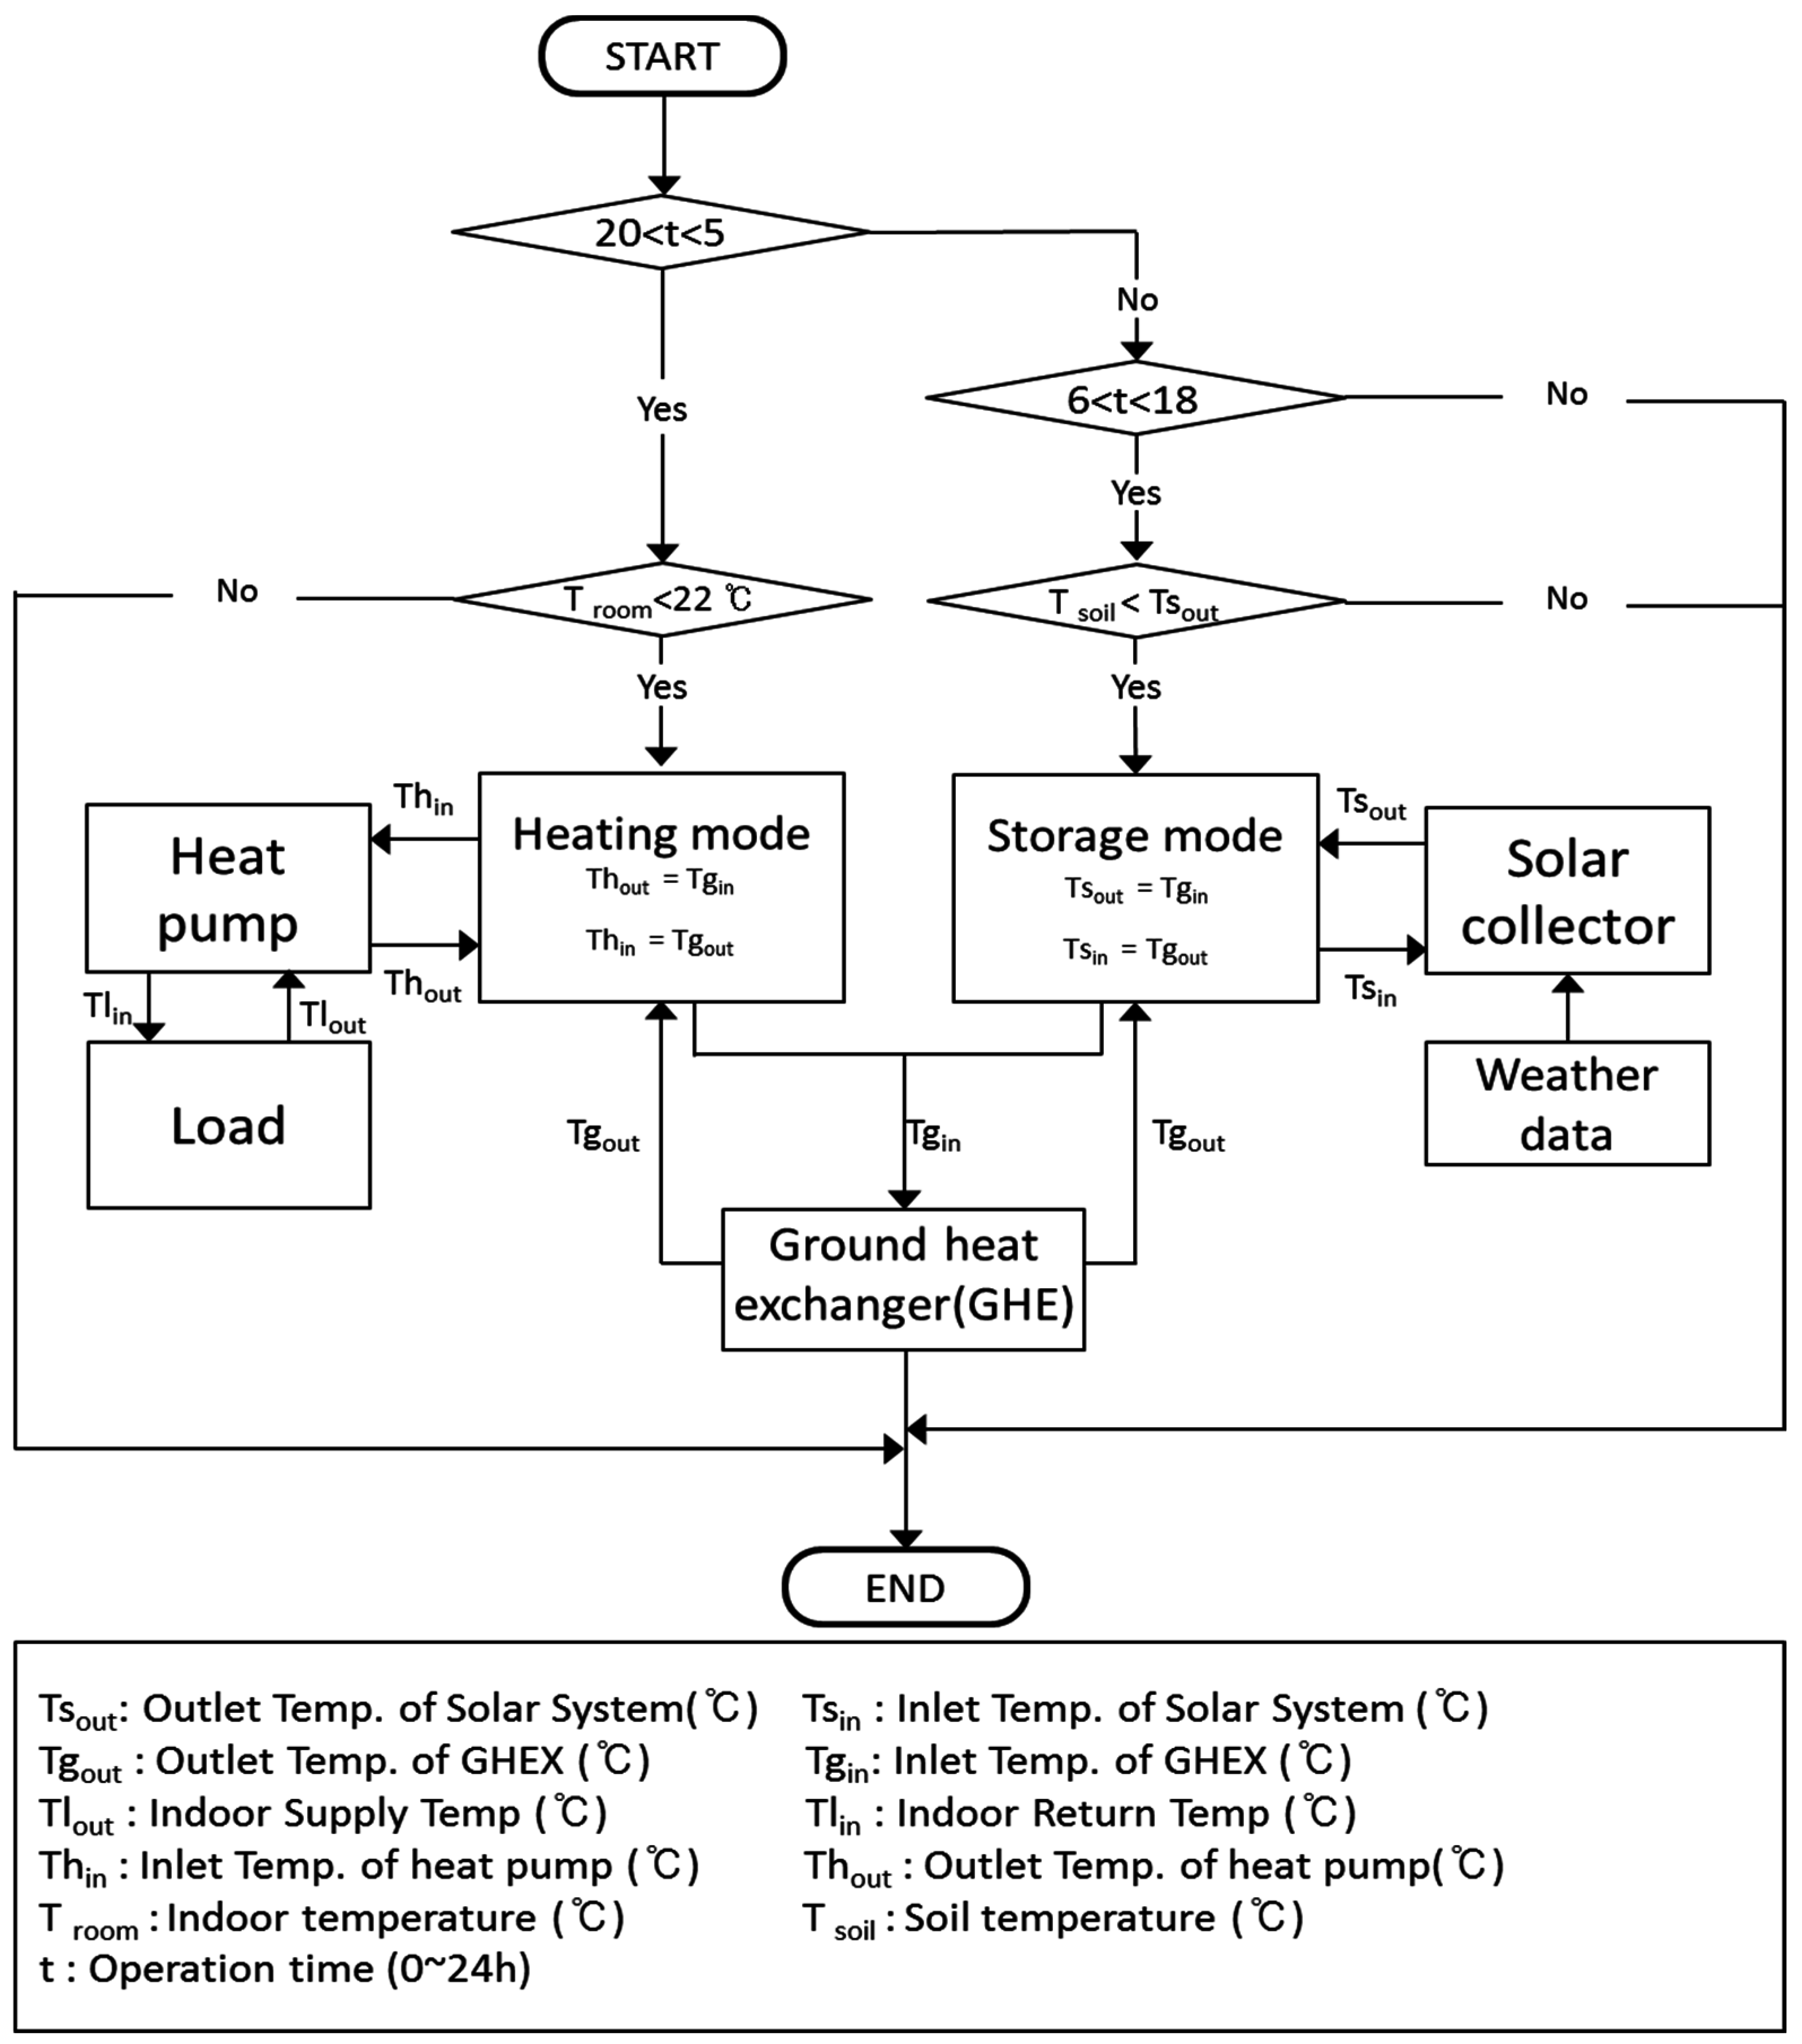
2.2. Operation Strategy
2.2.1. Heating Mode (8 P.M. < t < 5 A.M.)
2.2.2. Solar Thermal Storage Mode (6 A.M. < t < 6 P.M.)

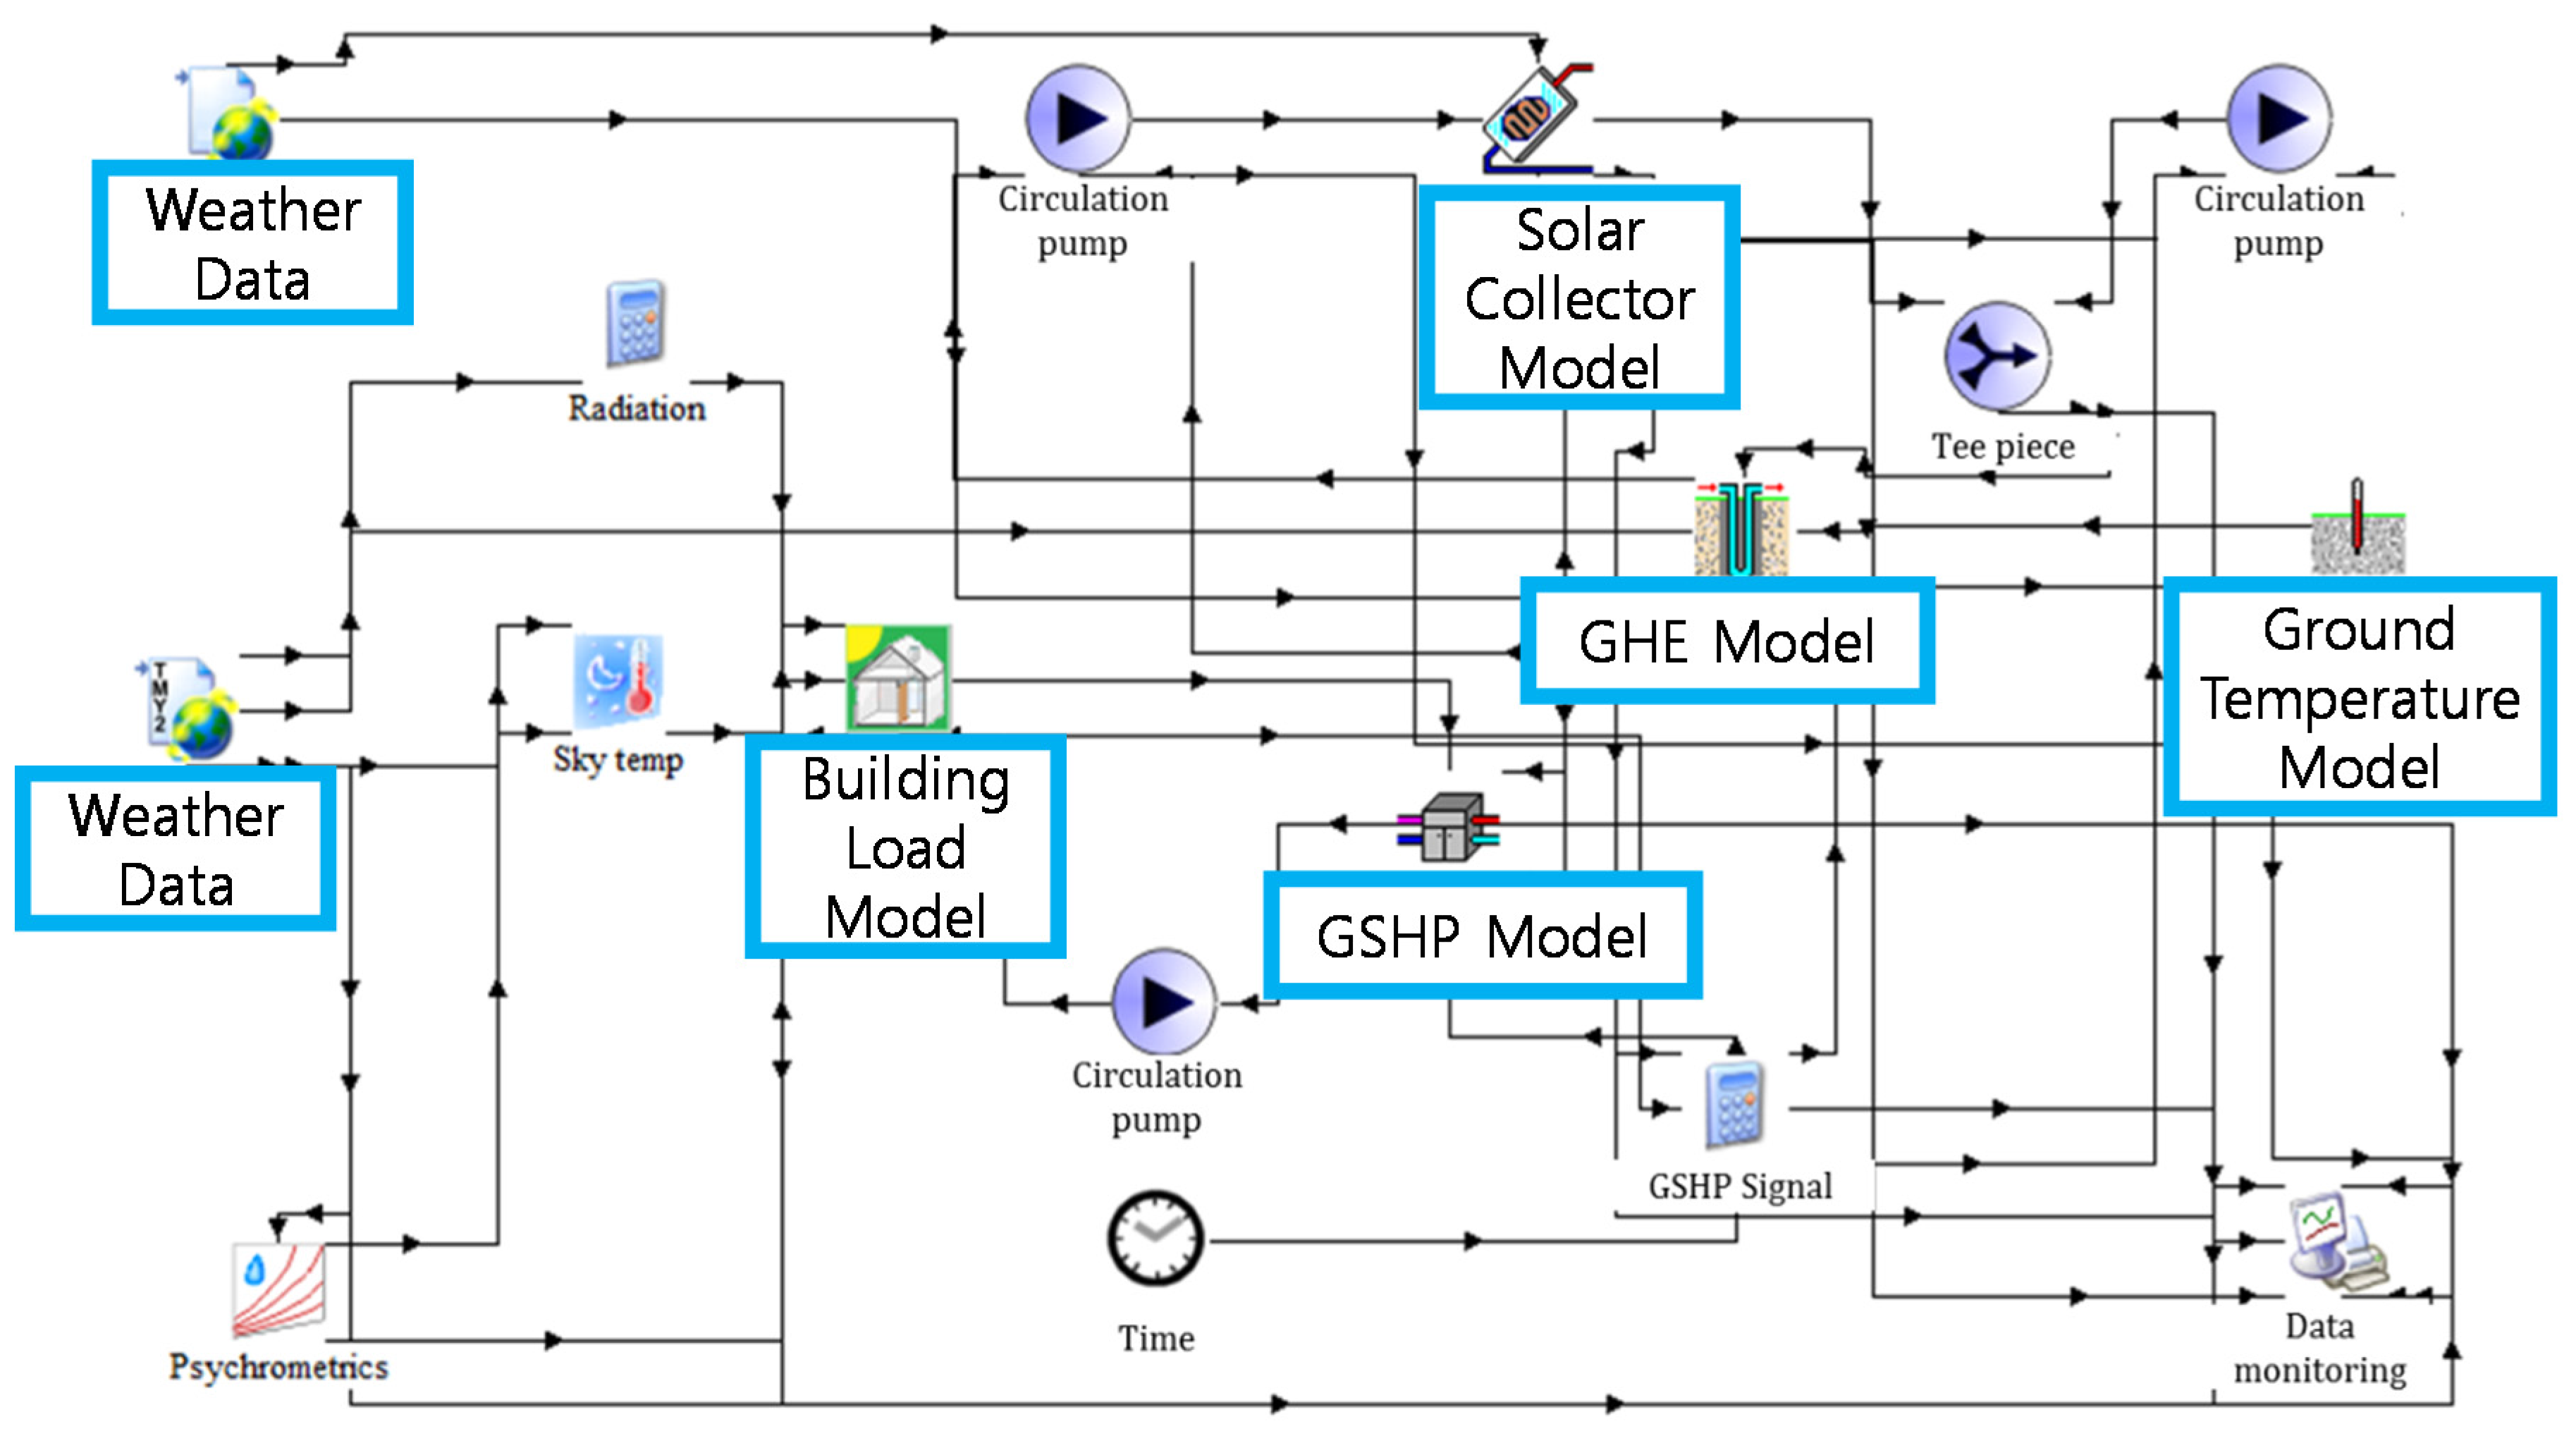
3. Simulation Introduction
3.1. System Summary


3.2. Simulation Conditions

| Items | Unit | Value |
|---|---|---|
| Building | ||
| Design temperature | °C | 22 |
| Scale | m | 10×10×3 |
| U-value of external wall, roof, floor | W/(m2K) | 0.418, 0.193, 0.583 |
| Solar collectors | ° | |
| Area | m2 | 50 |
| Titled angle | 45 | |
| Flow rate | kg/h | 3600 |
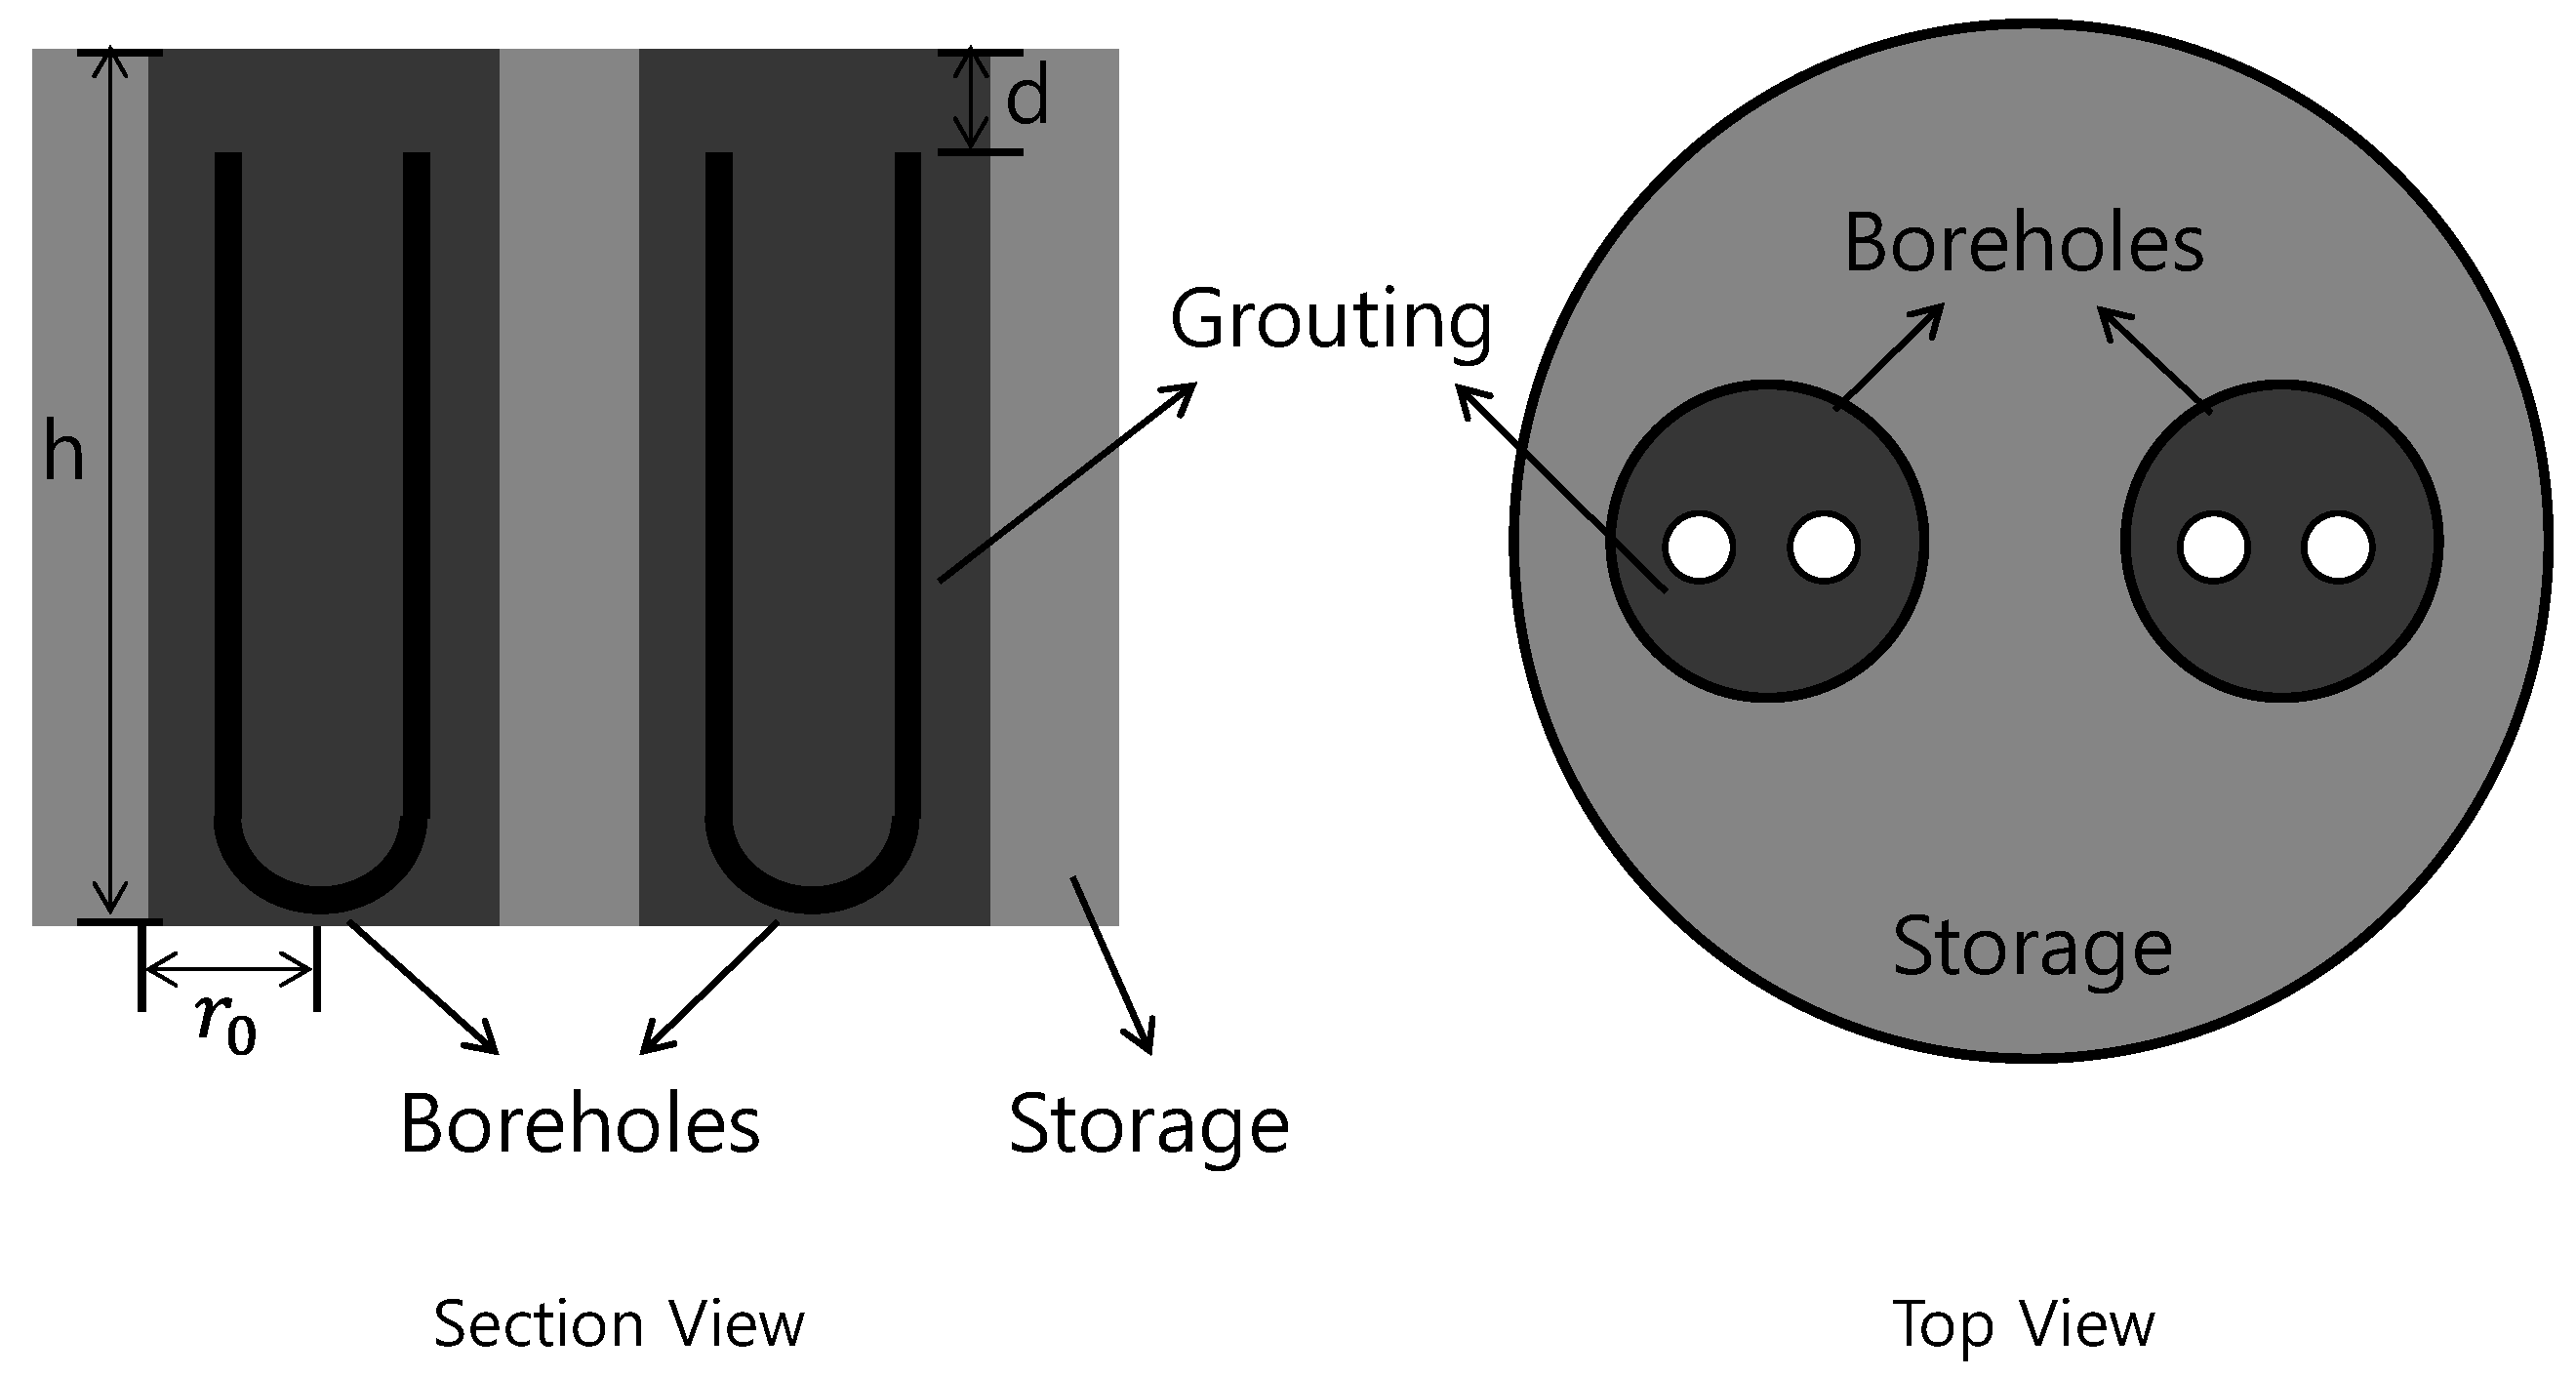
| Ground heat exchangers | ||
| Inner diameter | mm | 29 |
| Outer diameter | mm | 35 |
| Center -to-center half distance | mm | 50 |
| Pipe thermal conductivity | W/(m·K) | 0.41 |
| Flow rate(Heating mode) | kg/h | 2500 |
| Flow rate(Heat storage mode) | kg/h | 2000 |
| Boreholes | ||
| Fill thermal conductivity | W/(m·K) | 1.5 |
| Number | - | 3 |
| Depth | m | 100 |
| Diameter | mm | 200 |
| Ground | ||
| Soil thermal conductivity | W/(m·K) | 3.5 |
| Soil density | kg/m3 | 3000 |
| Heat capacity | kJ/(m3K) | 2920 |
| System operation time | ||
| Heating mode | h | 20:00~5:00 |
| Storage mode | h | 6:00~18:00 |
4. Results and Discussion
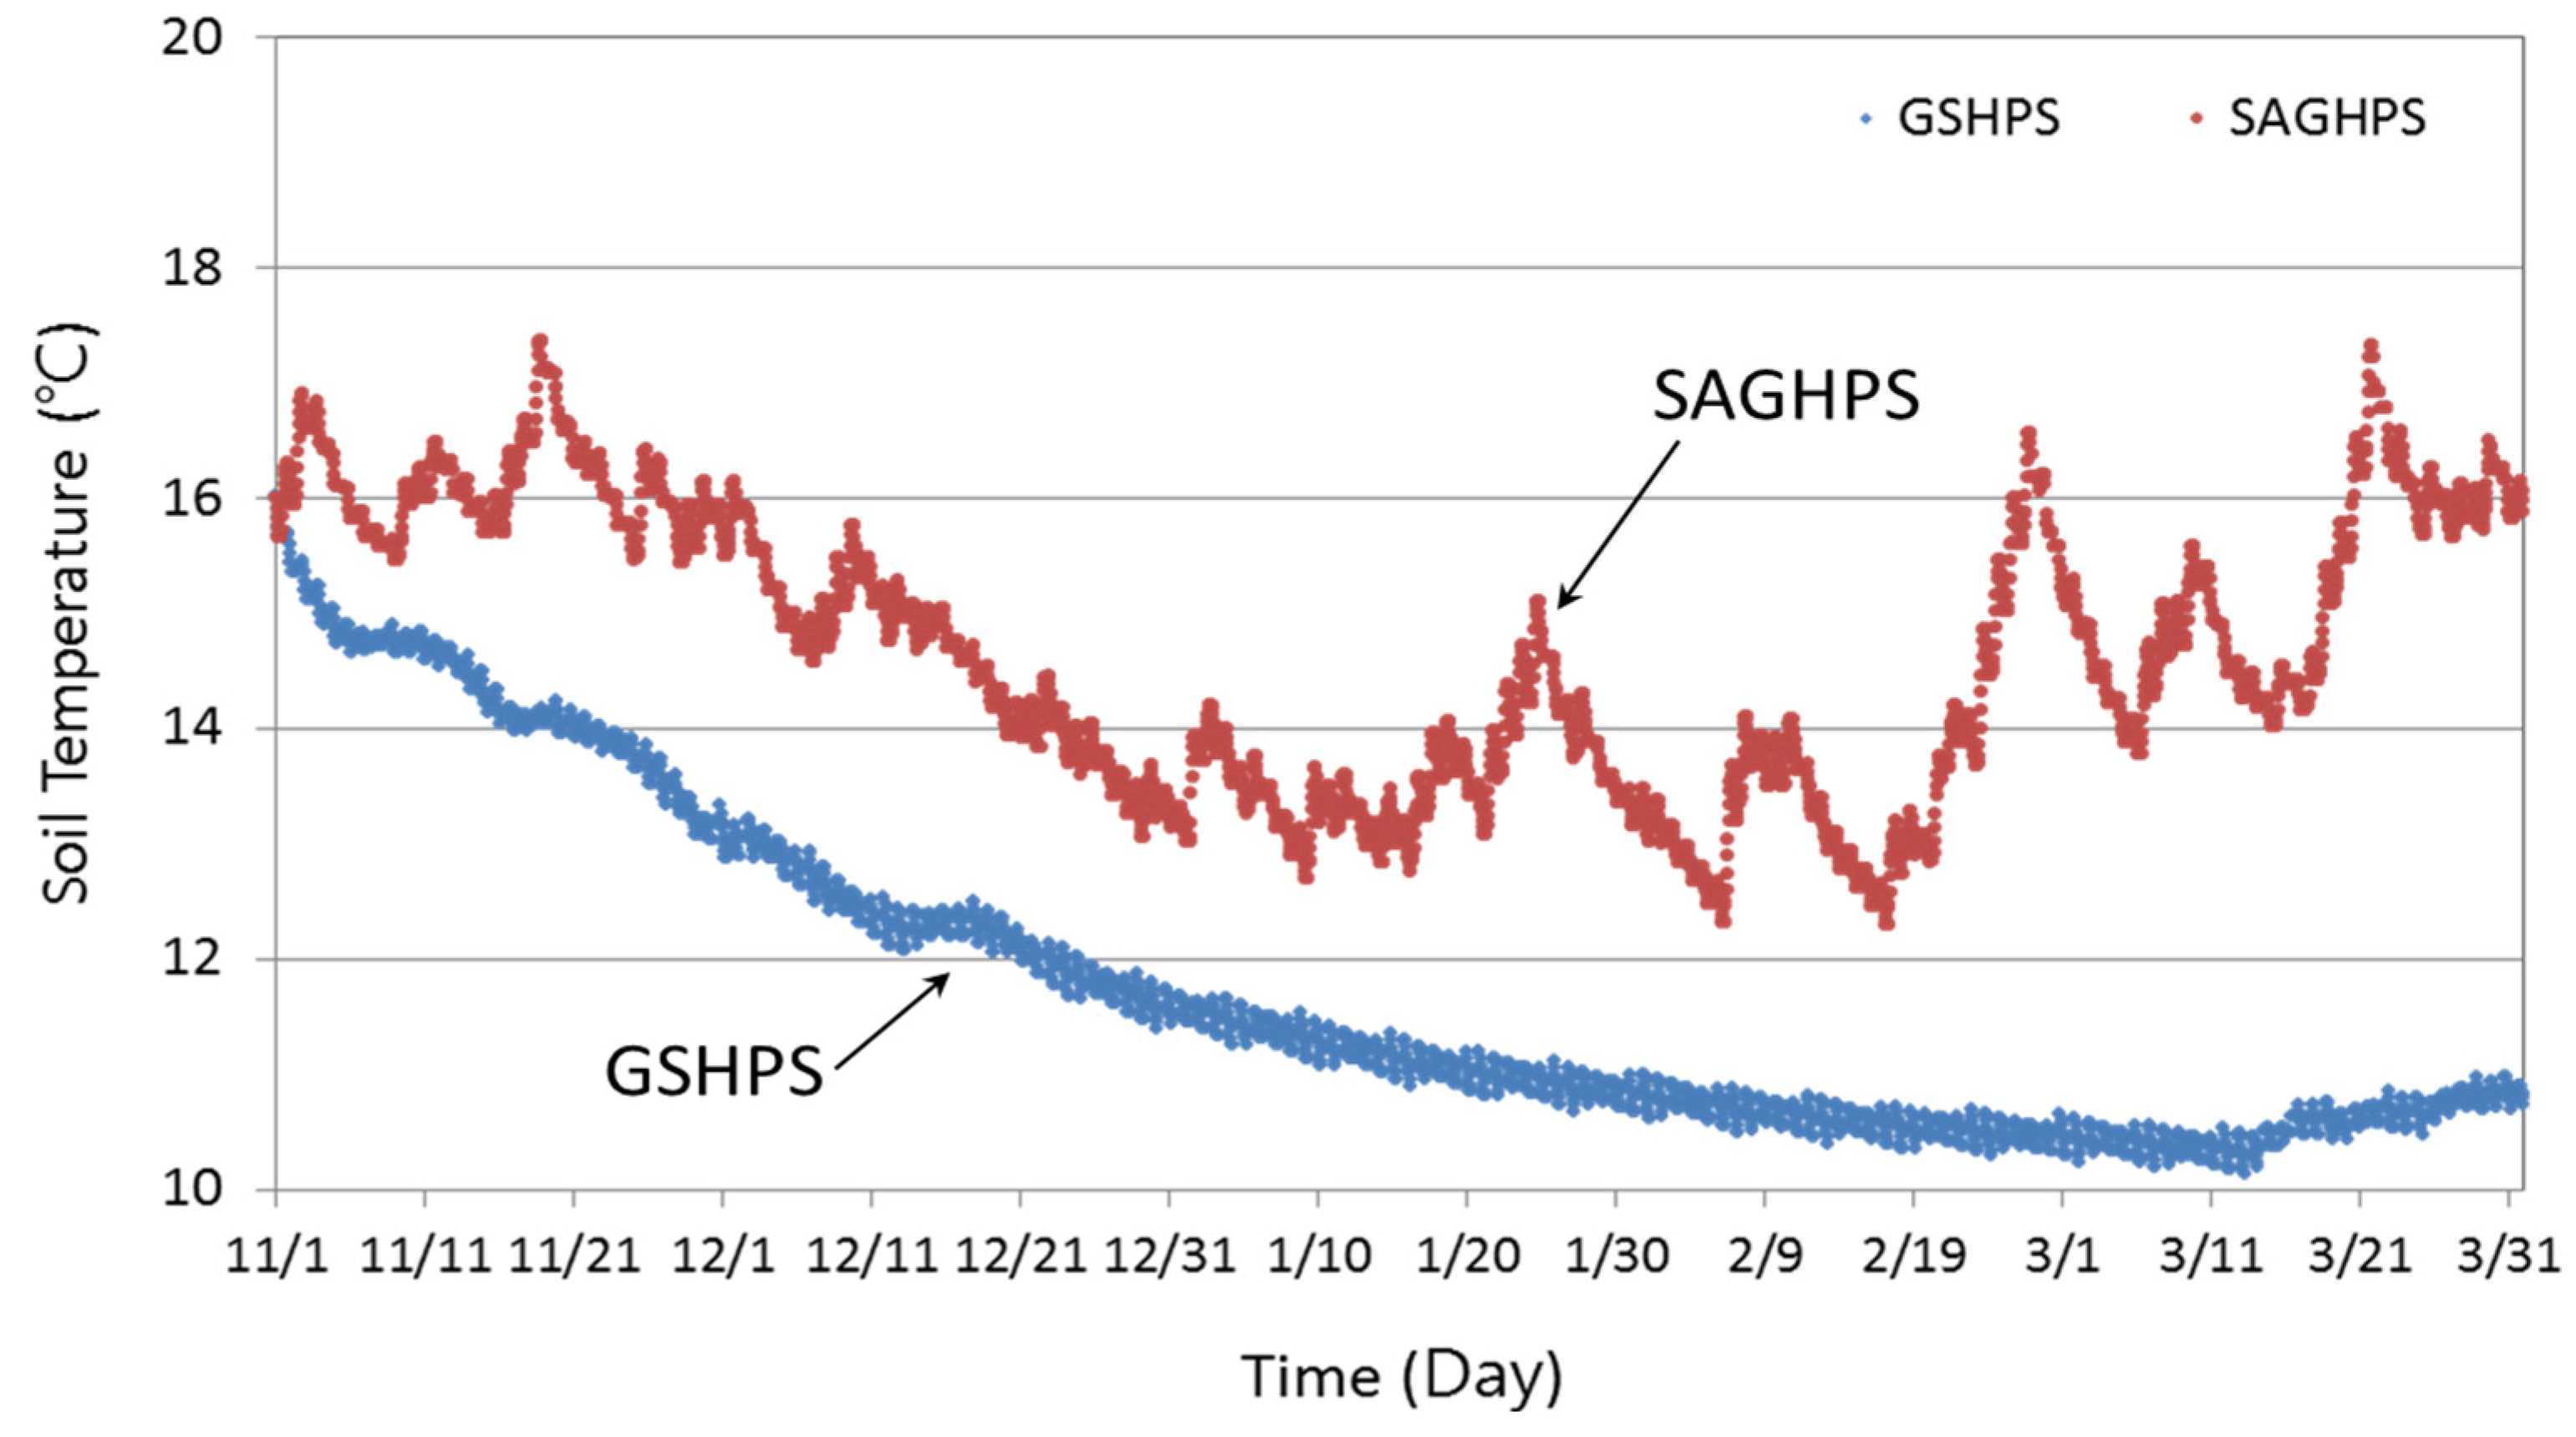
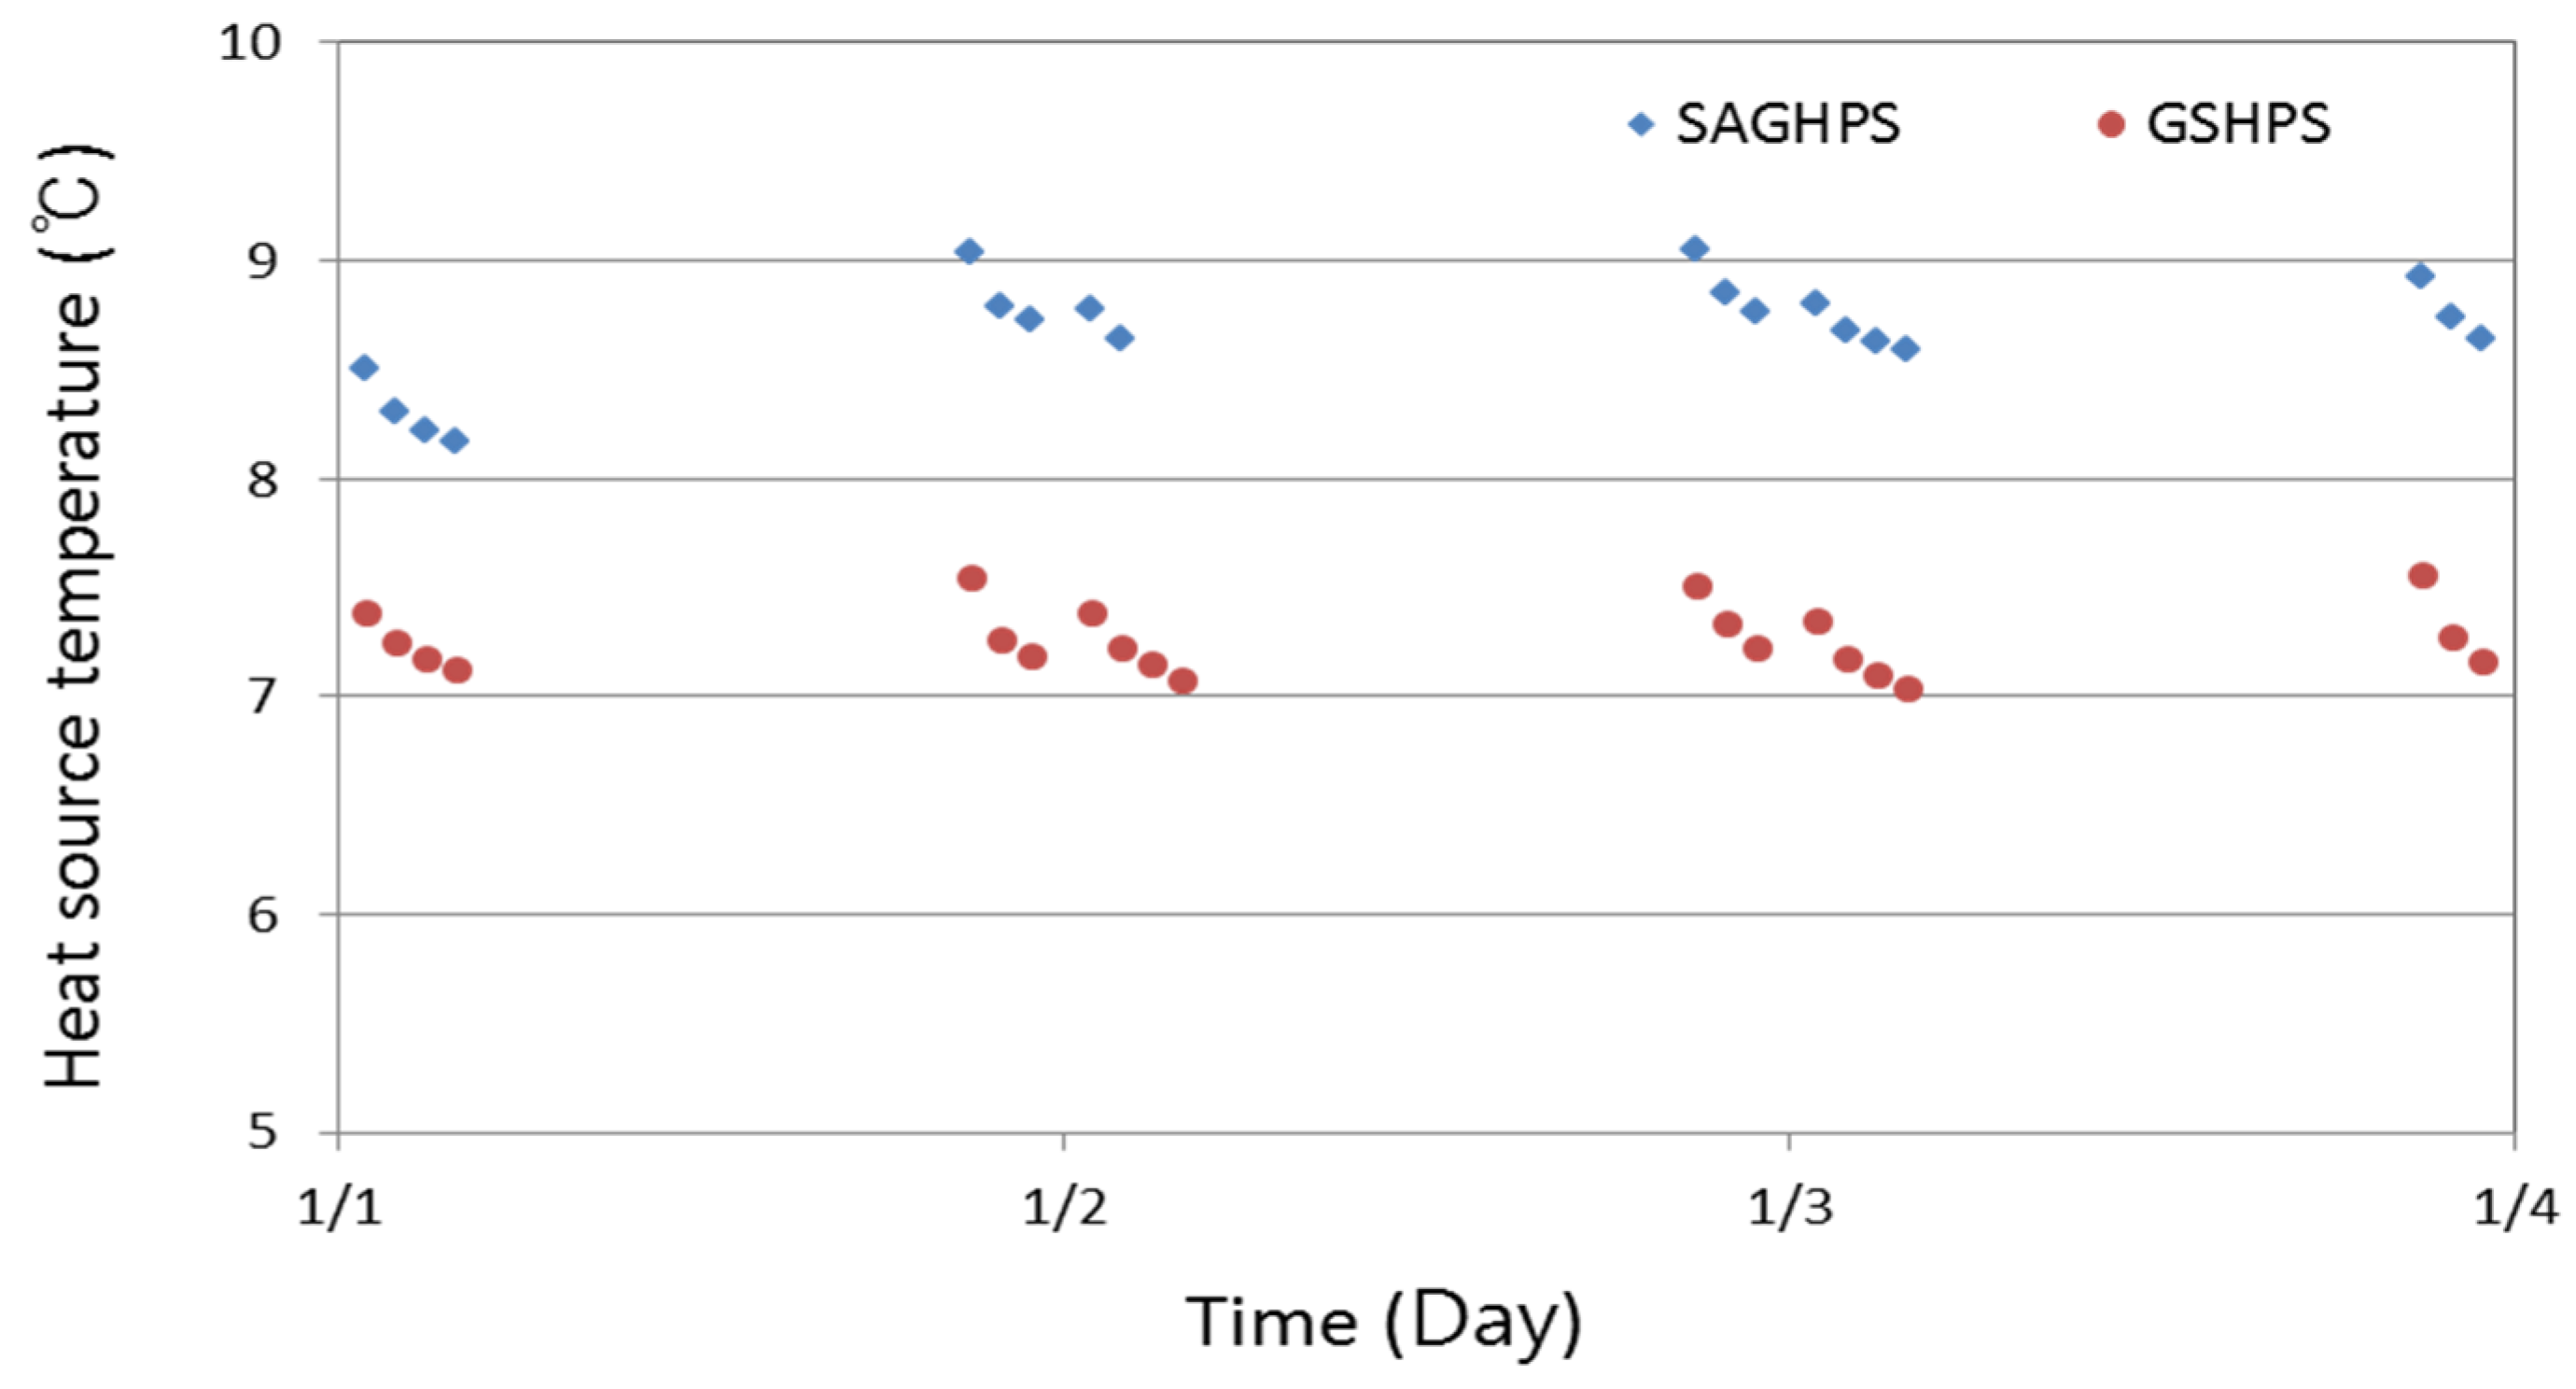
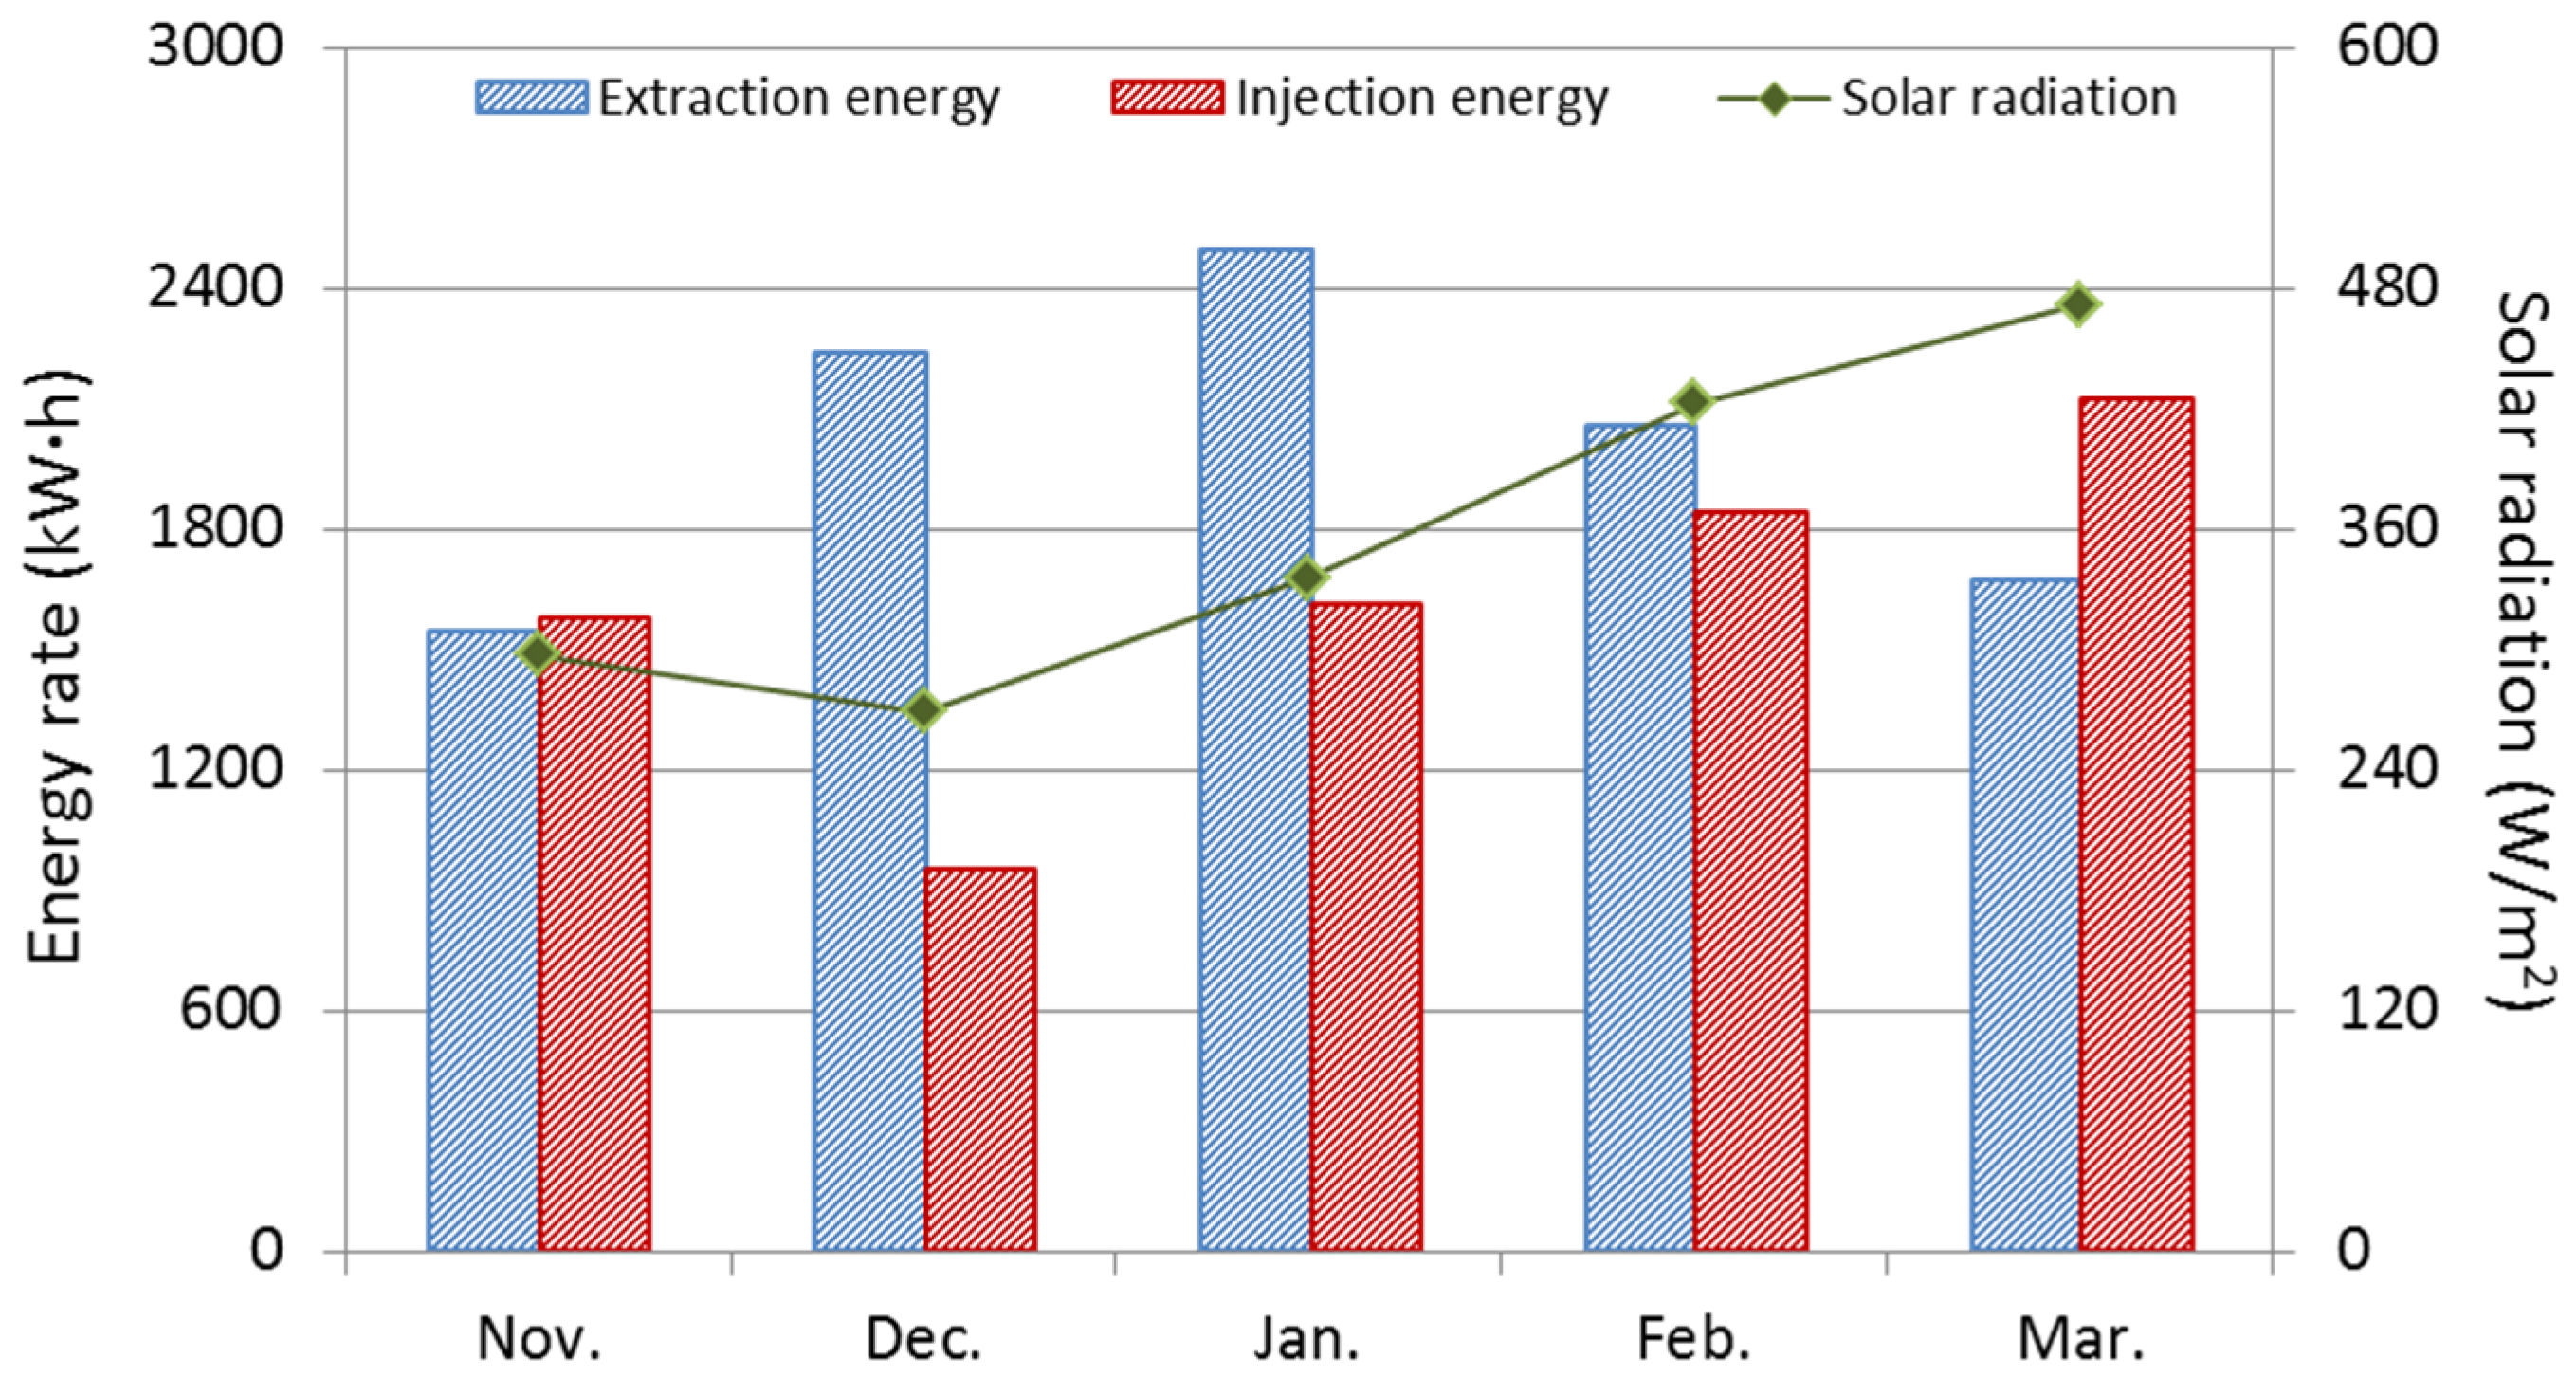
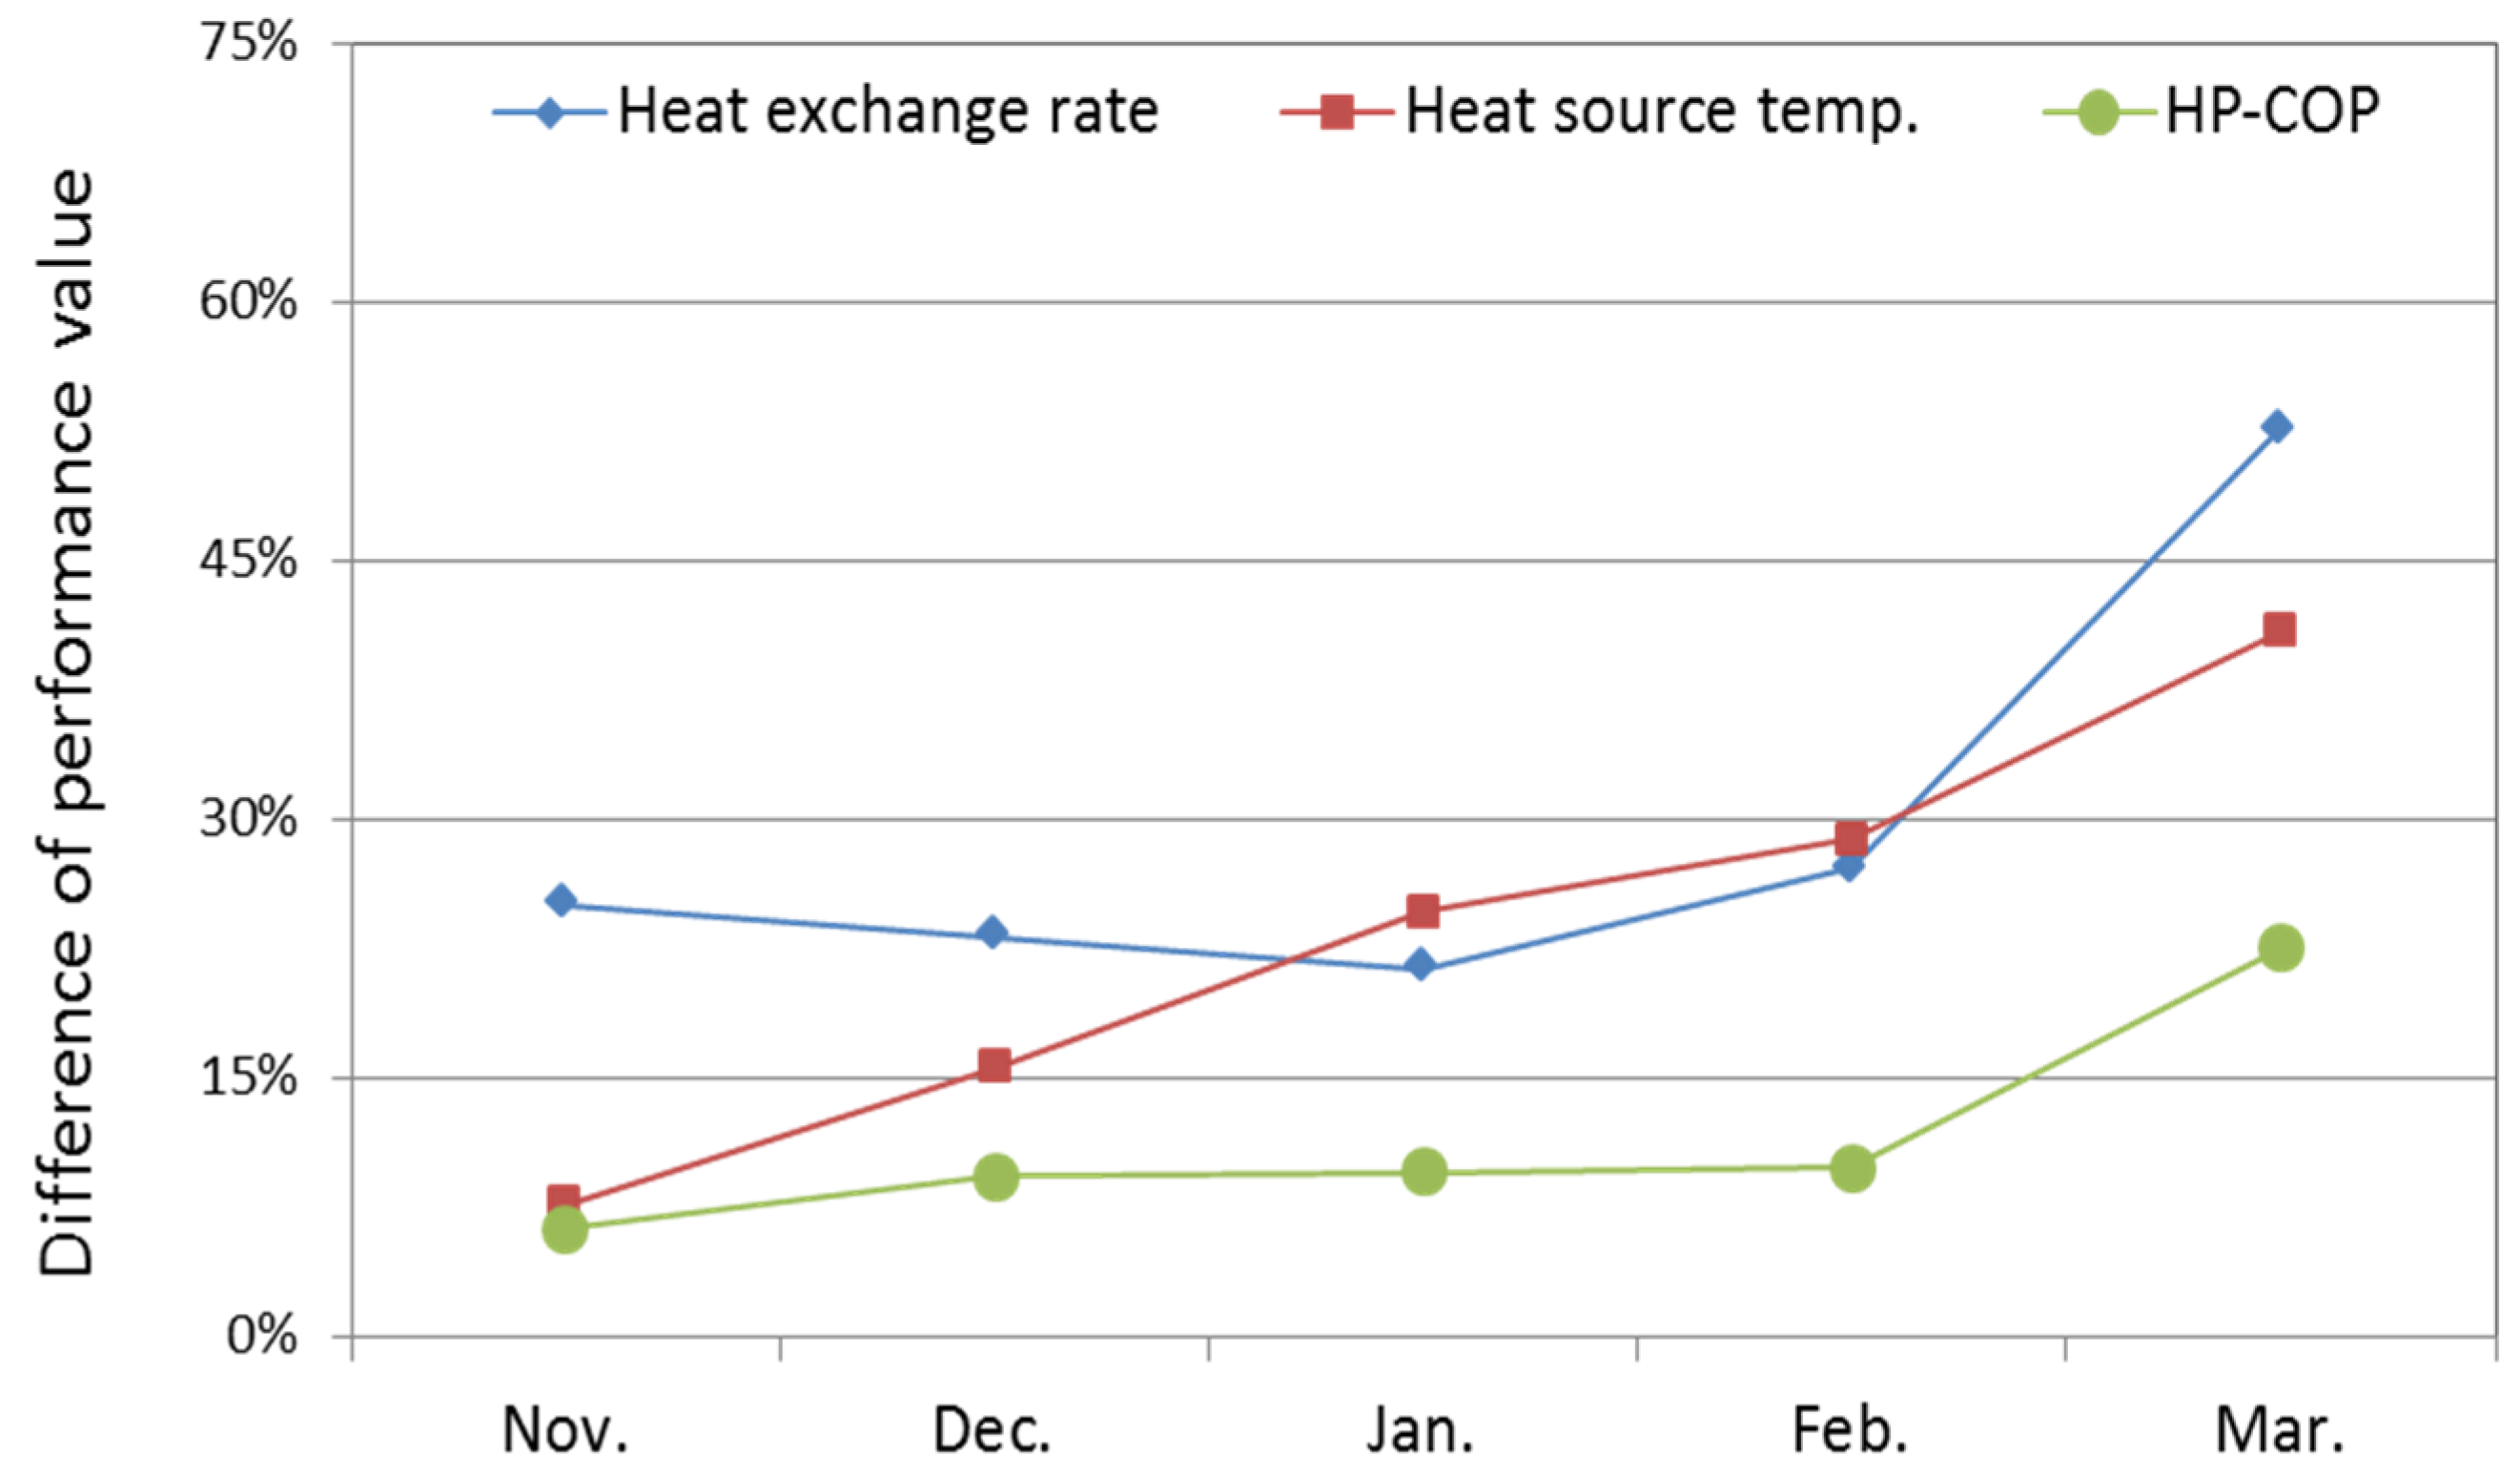
4.1. Comparison with a General Ground Source Heat Pump System


| Month | Heat Exchange Rate (W/m) | Heat Source Temperature (°C) | Heat Pump COP | |||
|---|---|---|---|---|---|---|
| GHPS | SAGHPS | GHPS | SAGHPS | GHPS | SAGHPS | |
| November | 41.1 | 51.4 | 9.1 | 9.8 | 4.8 | 5.1 |
| December | 35.4 | 43.6 | 7.7 | 8.9 | 4.3 | 4.7 |
| January | 32.8 | 39.8 | 6.9 | 8.6 | 4.2 | 4.6 |
| February | 31.3 | 39.8 | 6.6 | 8.5 | 4.1 | 4.5 |
| March | 30.8 | 47.0 | 6.6 | 9.3 | 4.0 | 4.9 |
| Average | 33.8 | 43.3 | 7.3 | 8.9 | 4.3 | 4.7 |


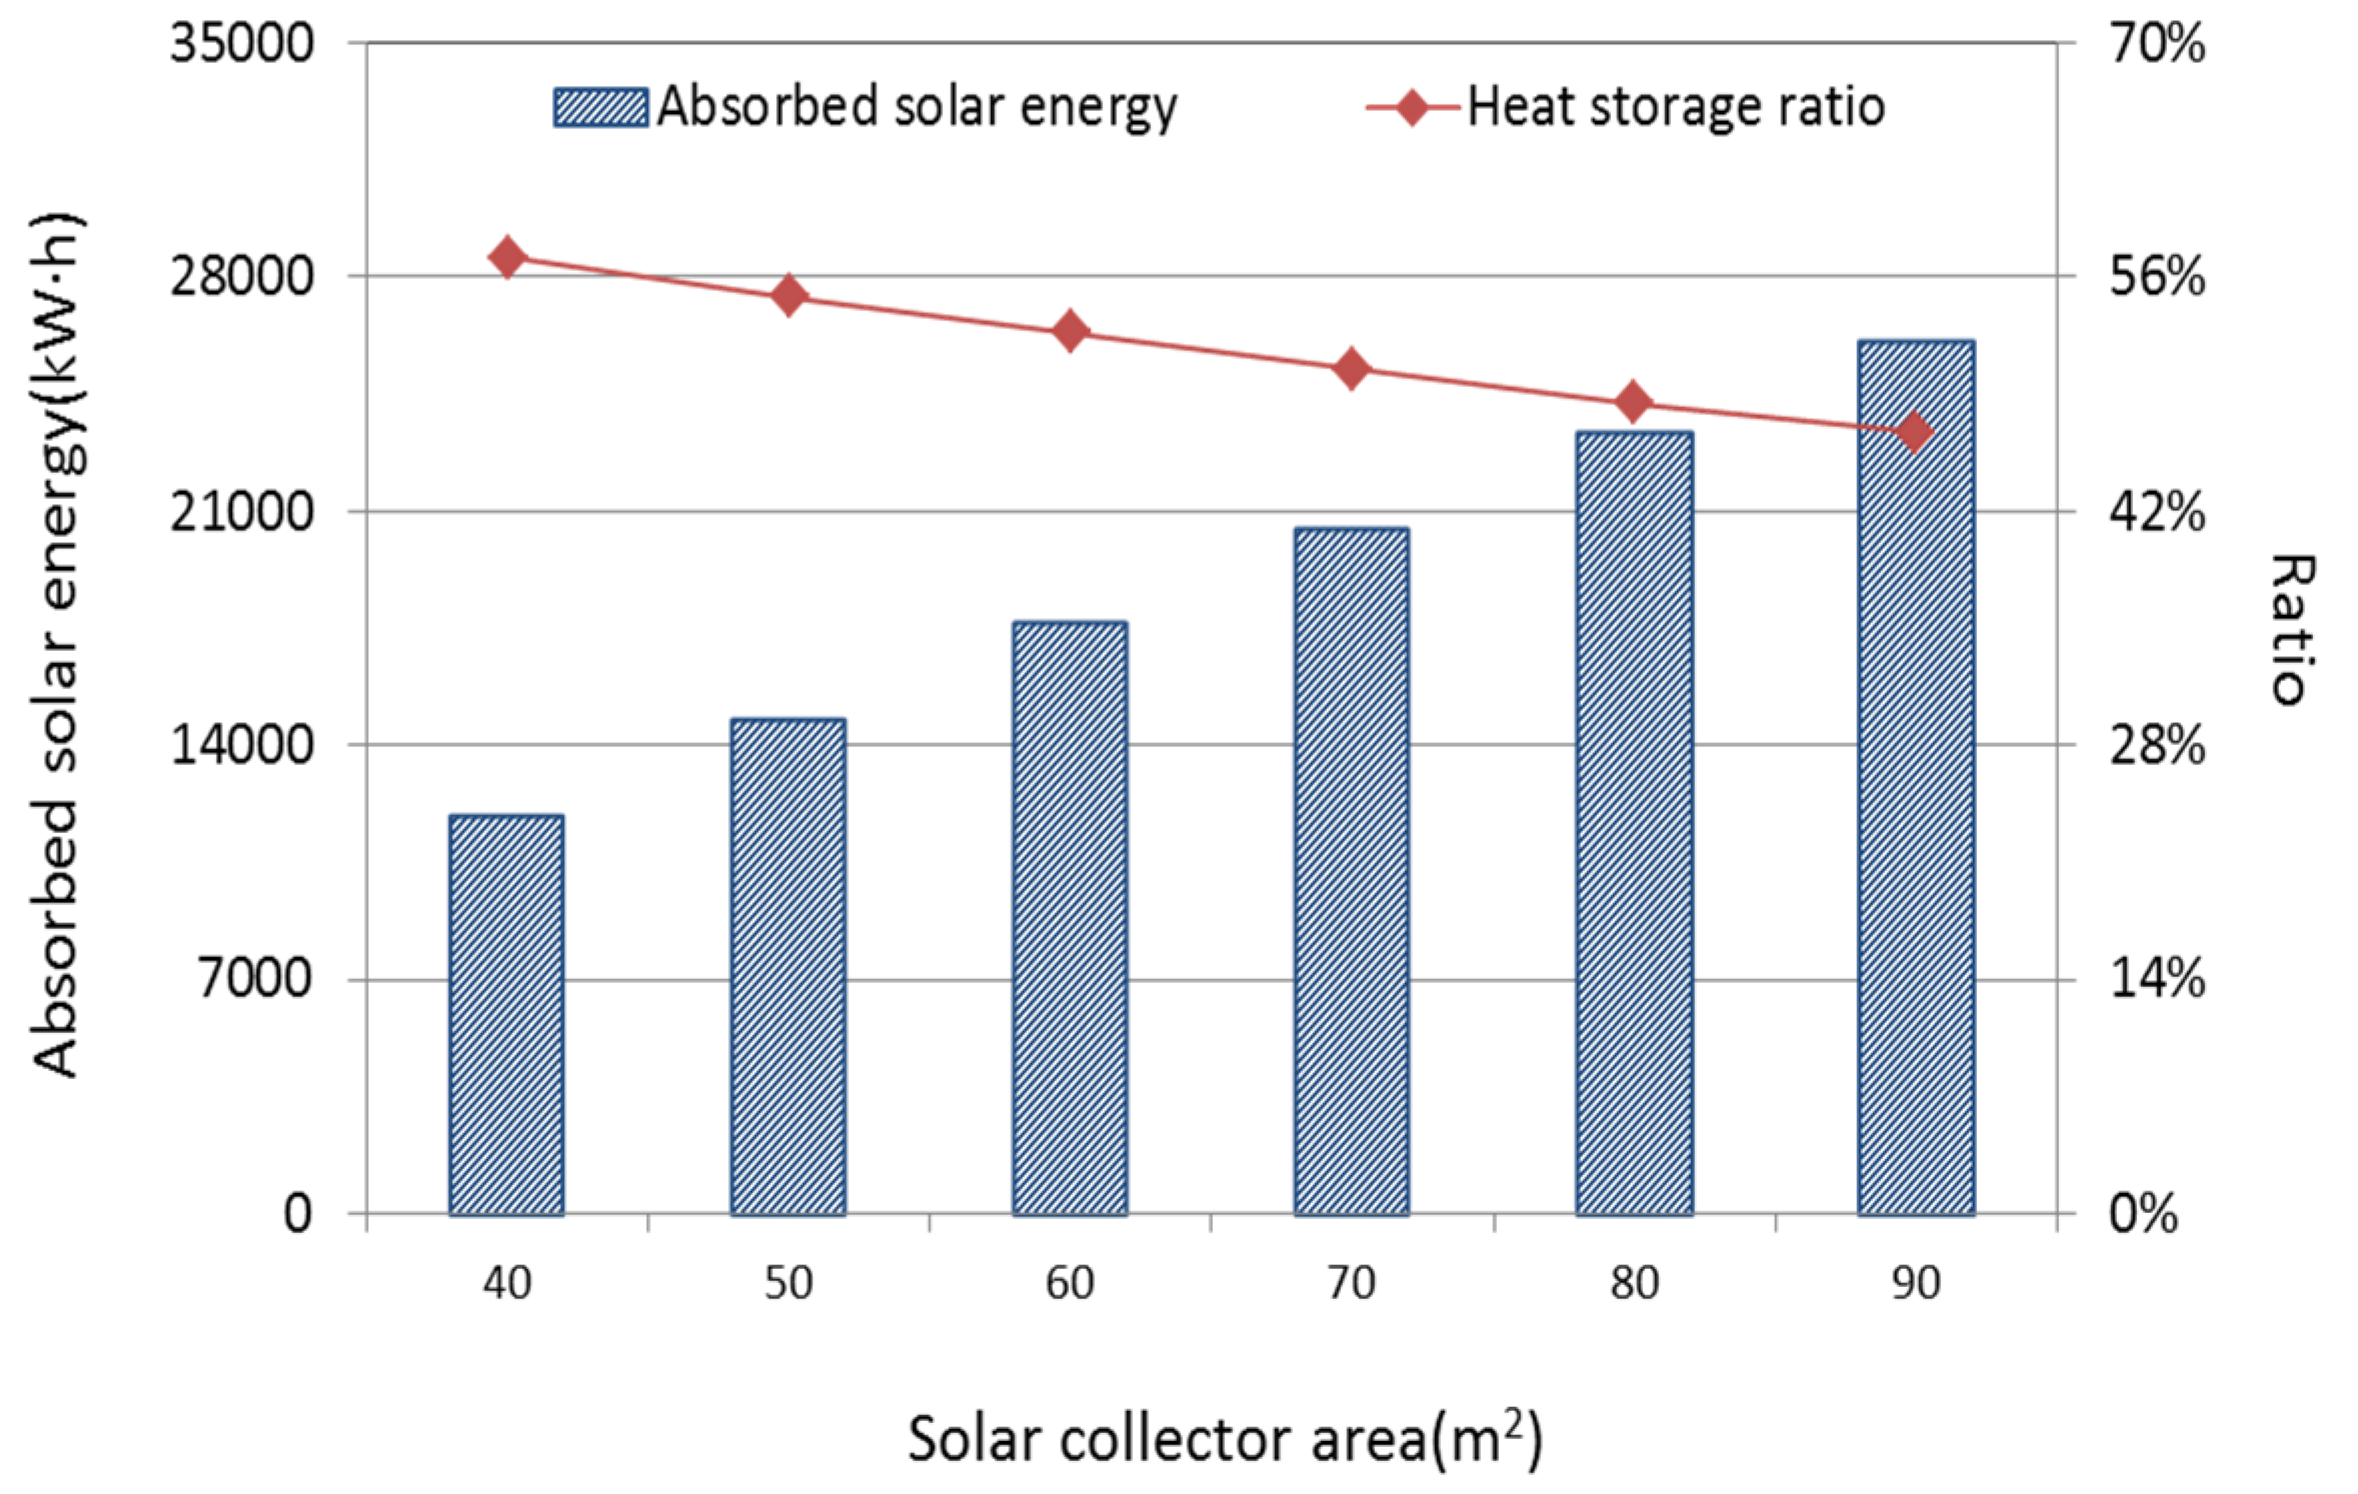
4.2. Performance Analysis with Different Solar Collector Areas
| Case | Collector Area (m2) | Heat Exchange Rate (W/m) | Heat Source Temperature (°C) | Heat Pump COP | Extraction Energy (kW∙h) | Injection Energy (kW∙h) |
|---|---|---|---|---|---|---|
| 1 | 40 | 41.3 | 8.64 | 4.60 | 9999.6 | 6829.7 |
| 2 | 50 | 43.3 | 8.91 | 4.69 | 10062.9 | 8110.0 |
| 3 | 60 | 44.8 | 9.11 | 4.75 | 10319.6 | 9286.6 |
| 4 | 70 | 46.4 | 9.33 | 4.81 | 10341.5 | 10333.2 |
| 5 | 80 | 47.6 | 9.52 | 4.86 | 10498.5 | 11299.1 |
| 6 | 90 | 48.9 | 9.70 | 4.90 | 10576.3 | 12164.9 |

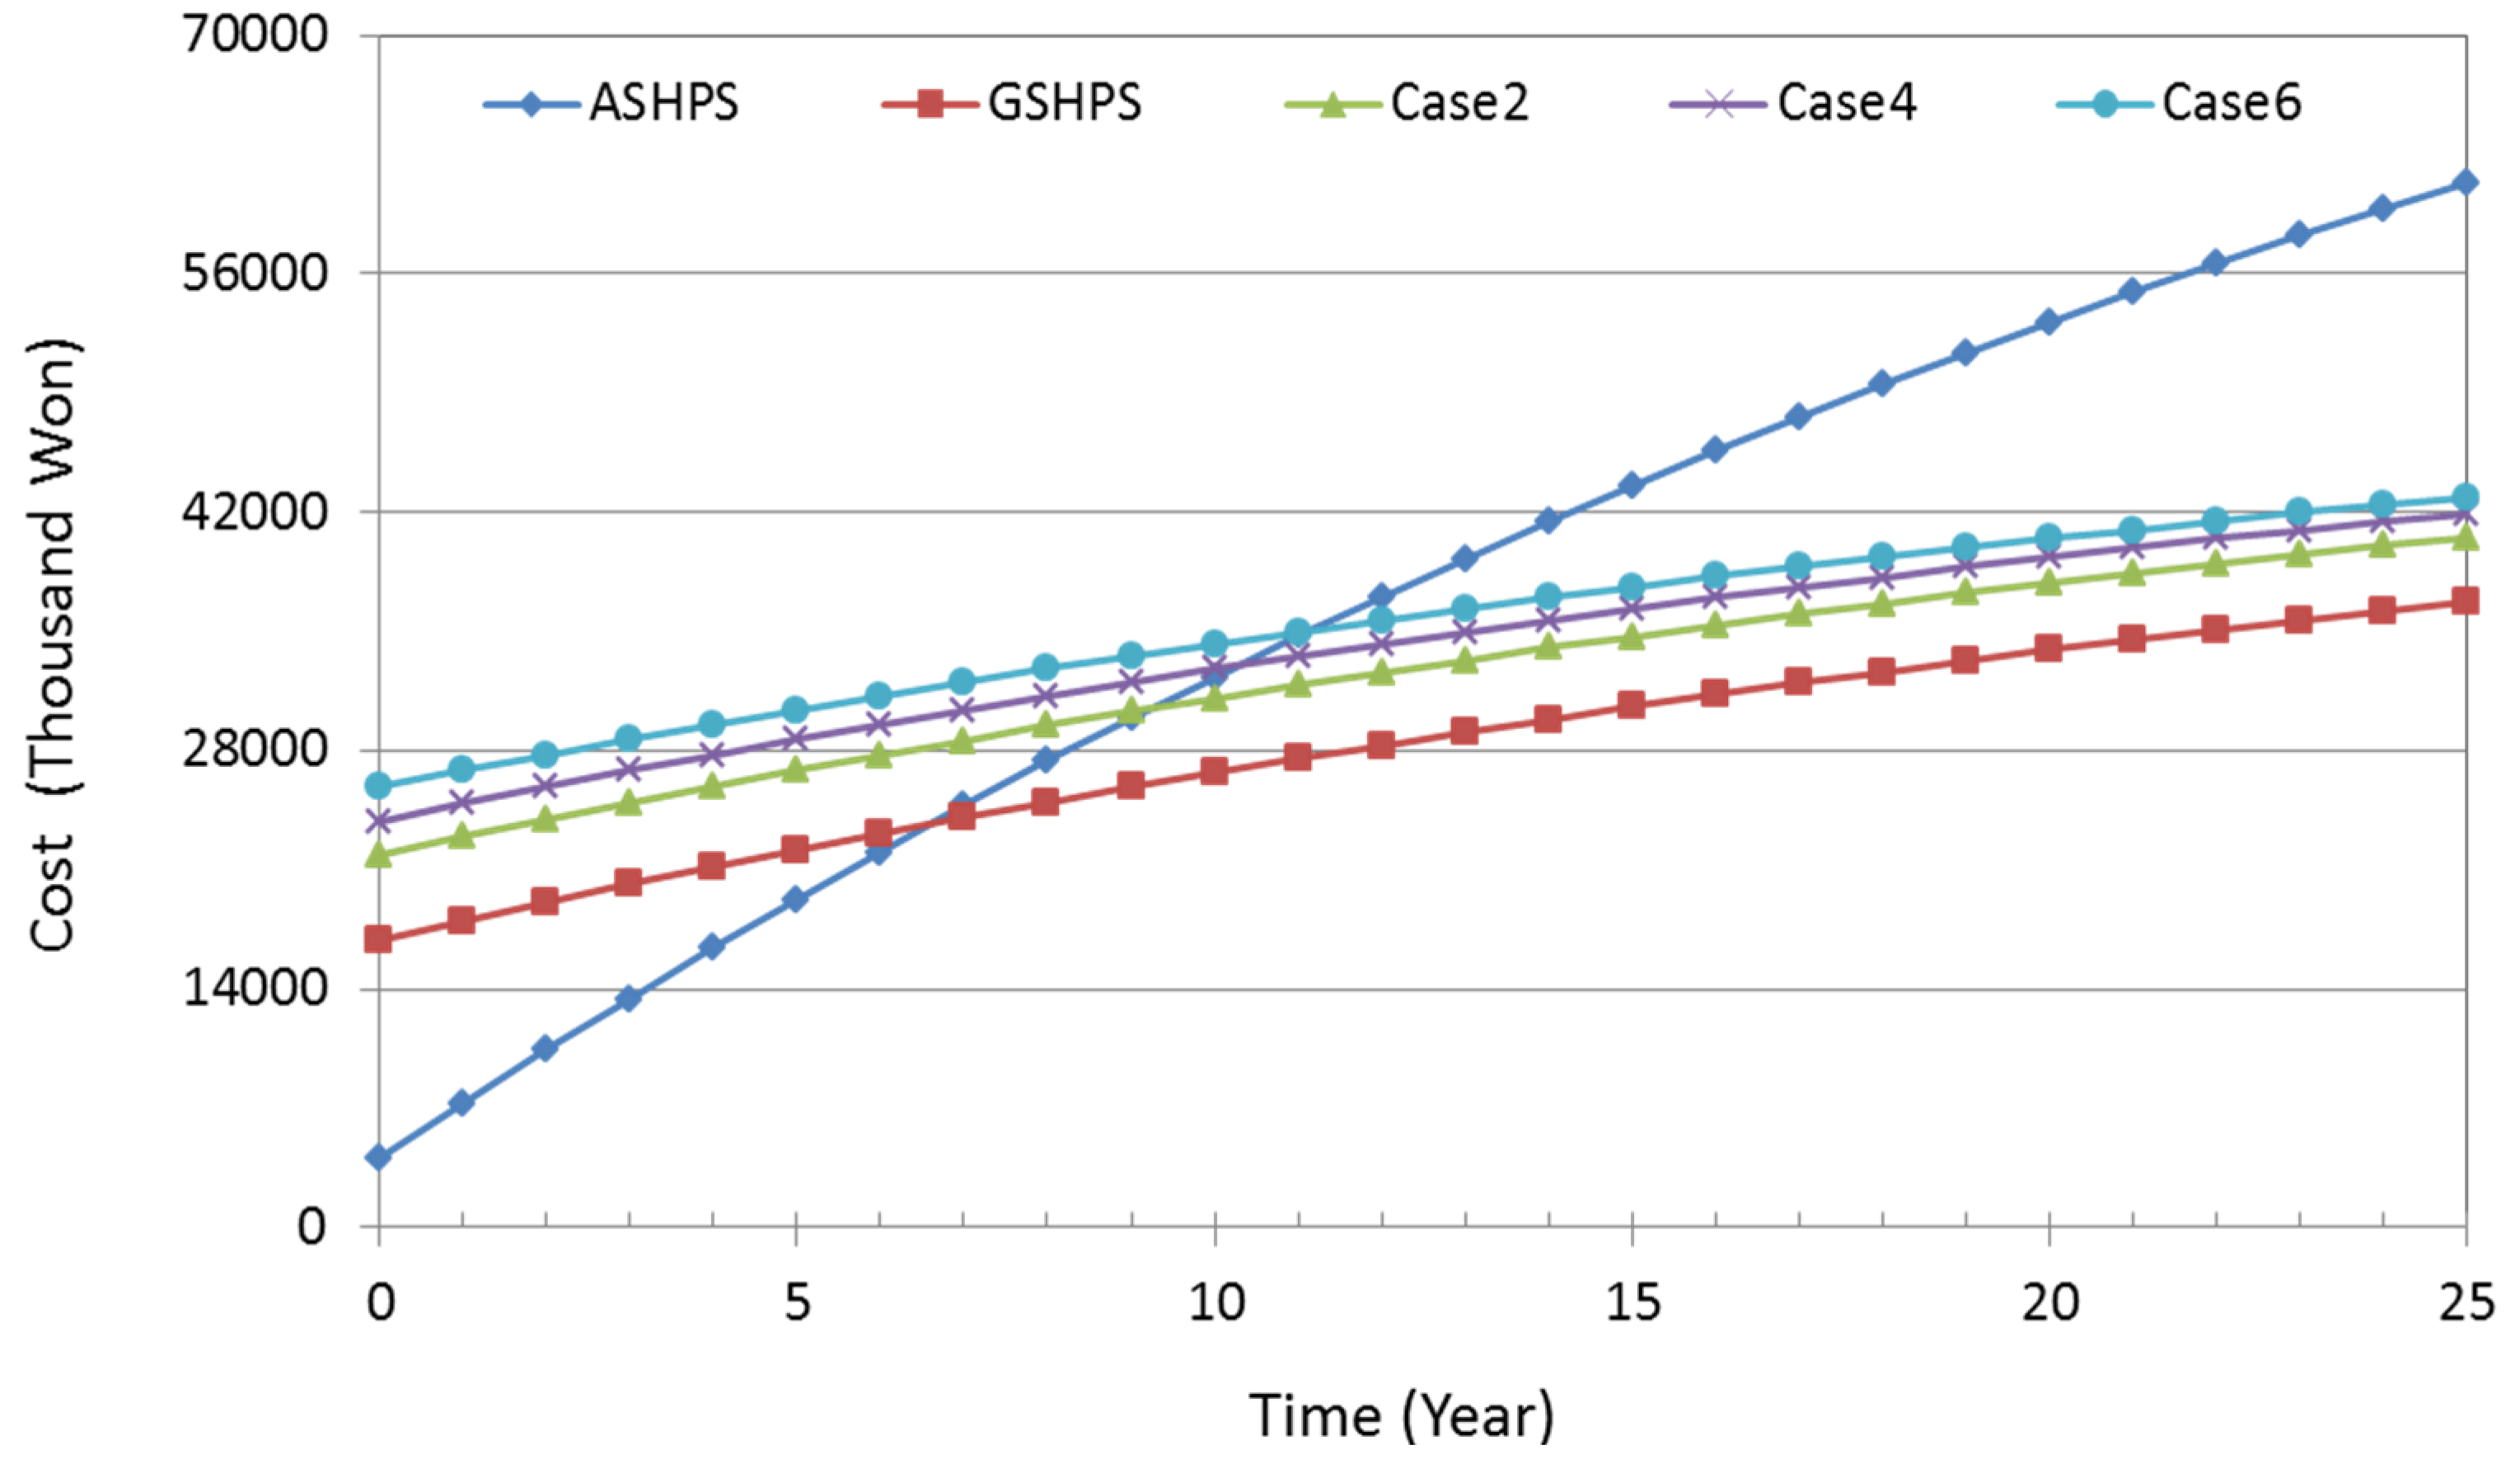
| System | Investment Costs (Thousand Won) | Operation Costs (Thousand Won) |
|---|---|---|
| ASHPS | 4000 | 3344.9 |
| GSHPS | 16858 | 1158.8 |
| Case 2 (50 m2) | 21858 | 1087.0 |
| Case 4 (70 m2) | 23858 | 1053.9 |
| Case 6 (90 m2) | 25858 | 992.6 |

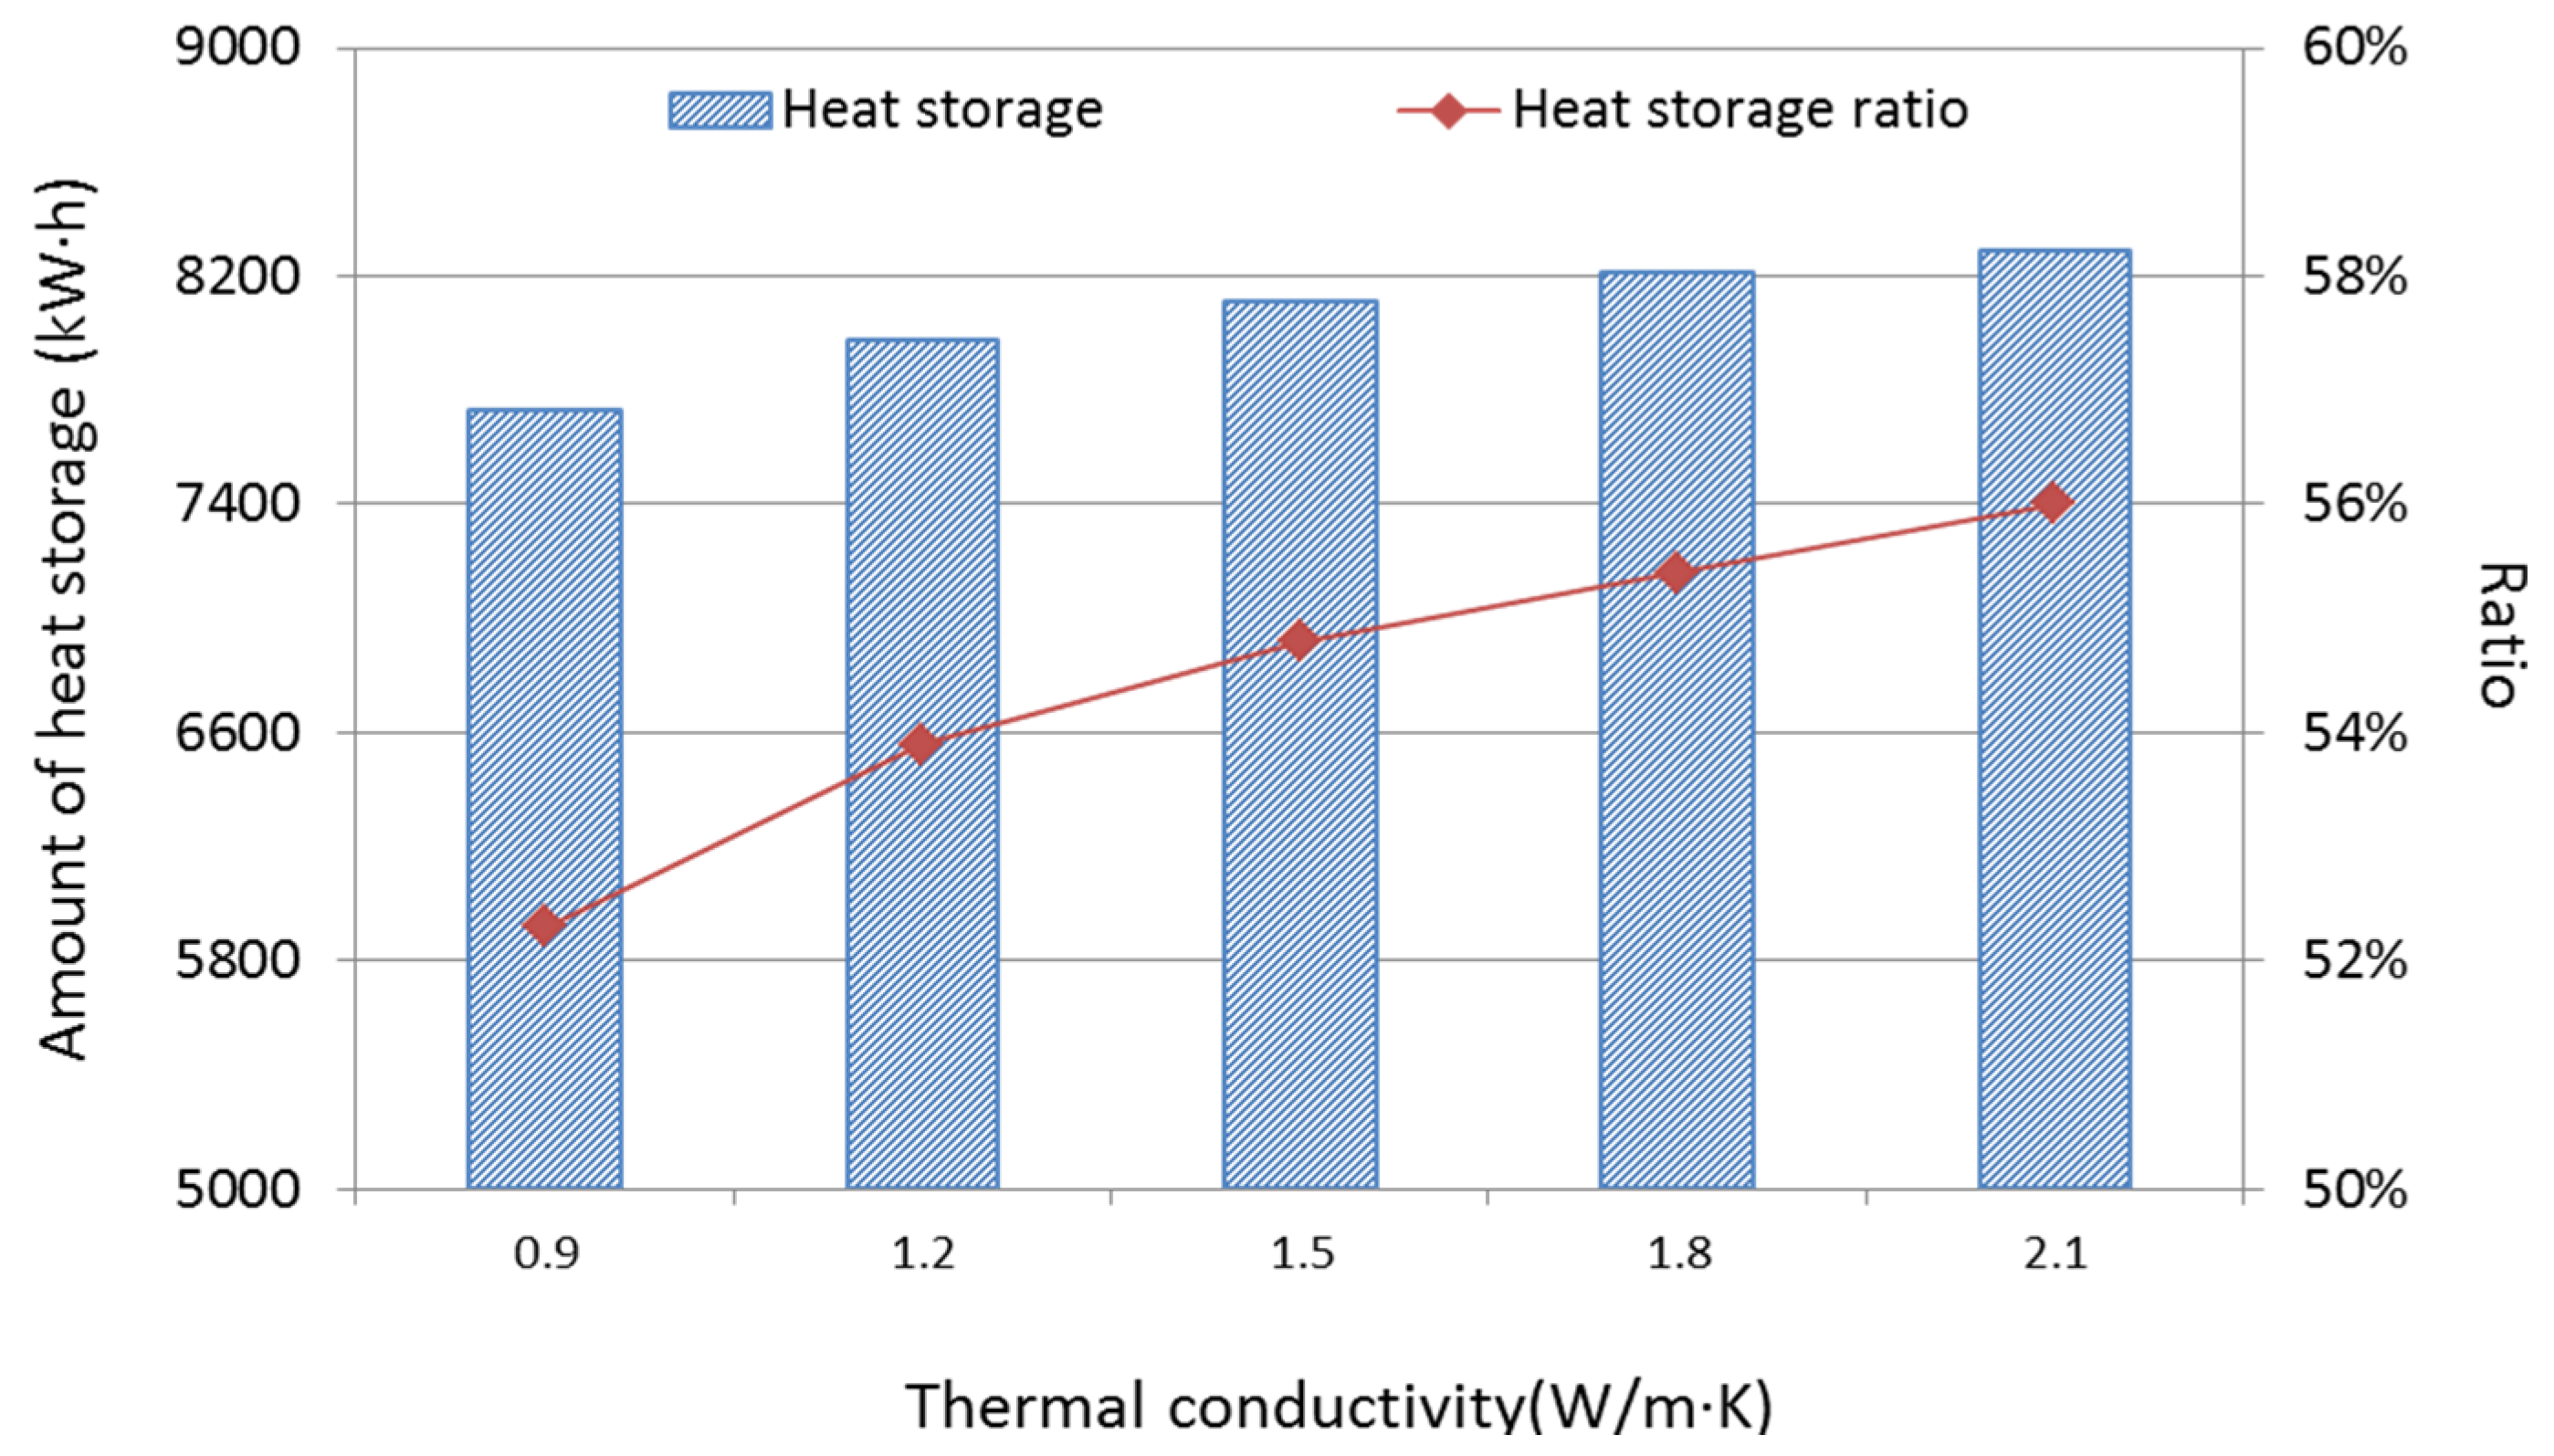
4.3. Performance Analysis with Different Conductivity of Grouting
| Case | Thermal Conductivity (W/(m∙K)) | Heat Exchange Rate (W/m) | Heat Source Temperature (°C) | Heat Pump COP | Extraction Energy (kW∙h) | Injection Energy (kW∙h) |
|---|---|---|---|---|---|---|
| 1 | 0.9 | 36.4 | 7.84 | 4.38 | 9511.4 | 7727.8 |
| 2 | 1.2 | 40.2 | 8.48 | 4.55 | 9941.7 | 7970.6 |
| 3 | 1.5 | 43.3 | 8.91 | 4.69 | 10,062.9 | 8110.0 |
| 4 | 1.8 | 45.5 | 9.22 | 4.77 | 10,265.6 | 8212.7 |
| 5 | 2.1 | 47.1 | 9.45 | 4.84 | 10,490.8 | 8291.5 |

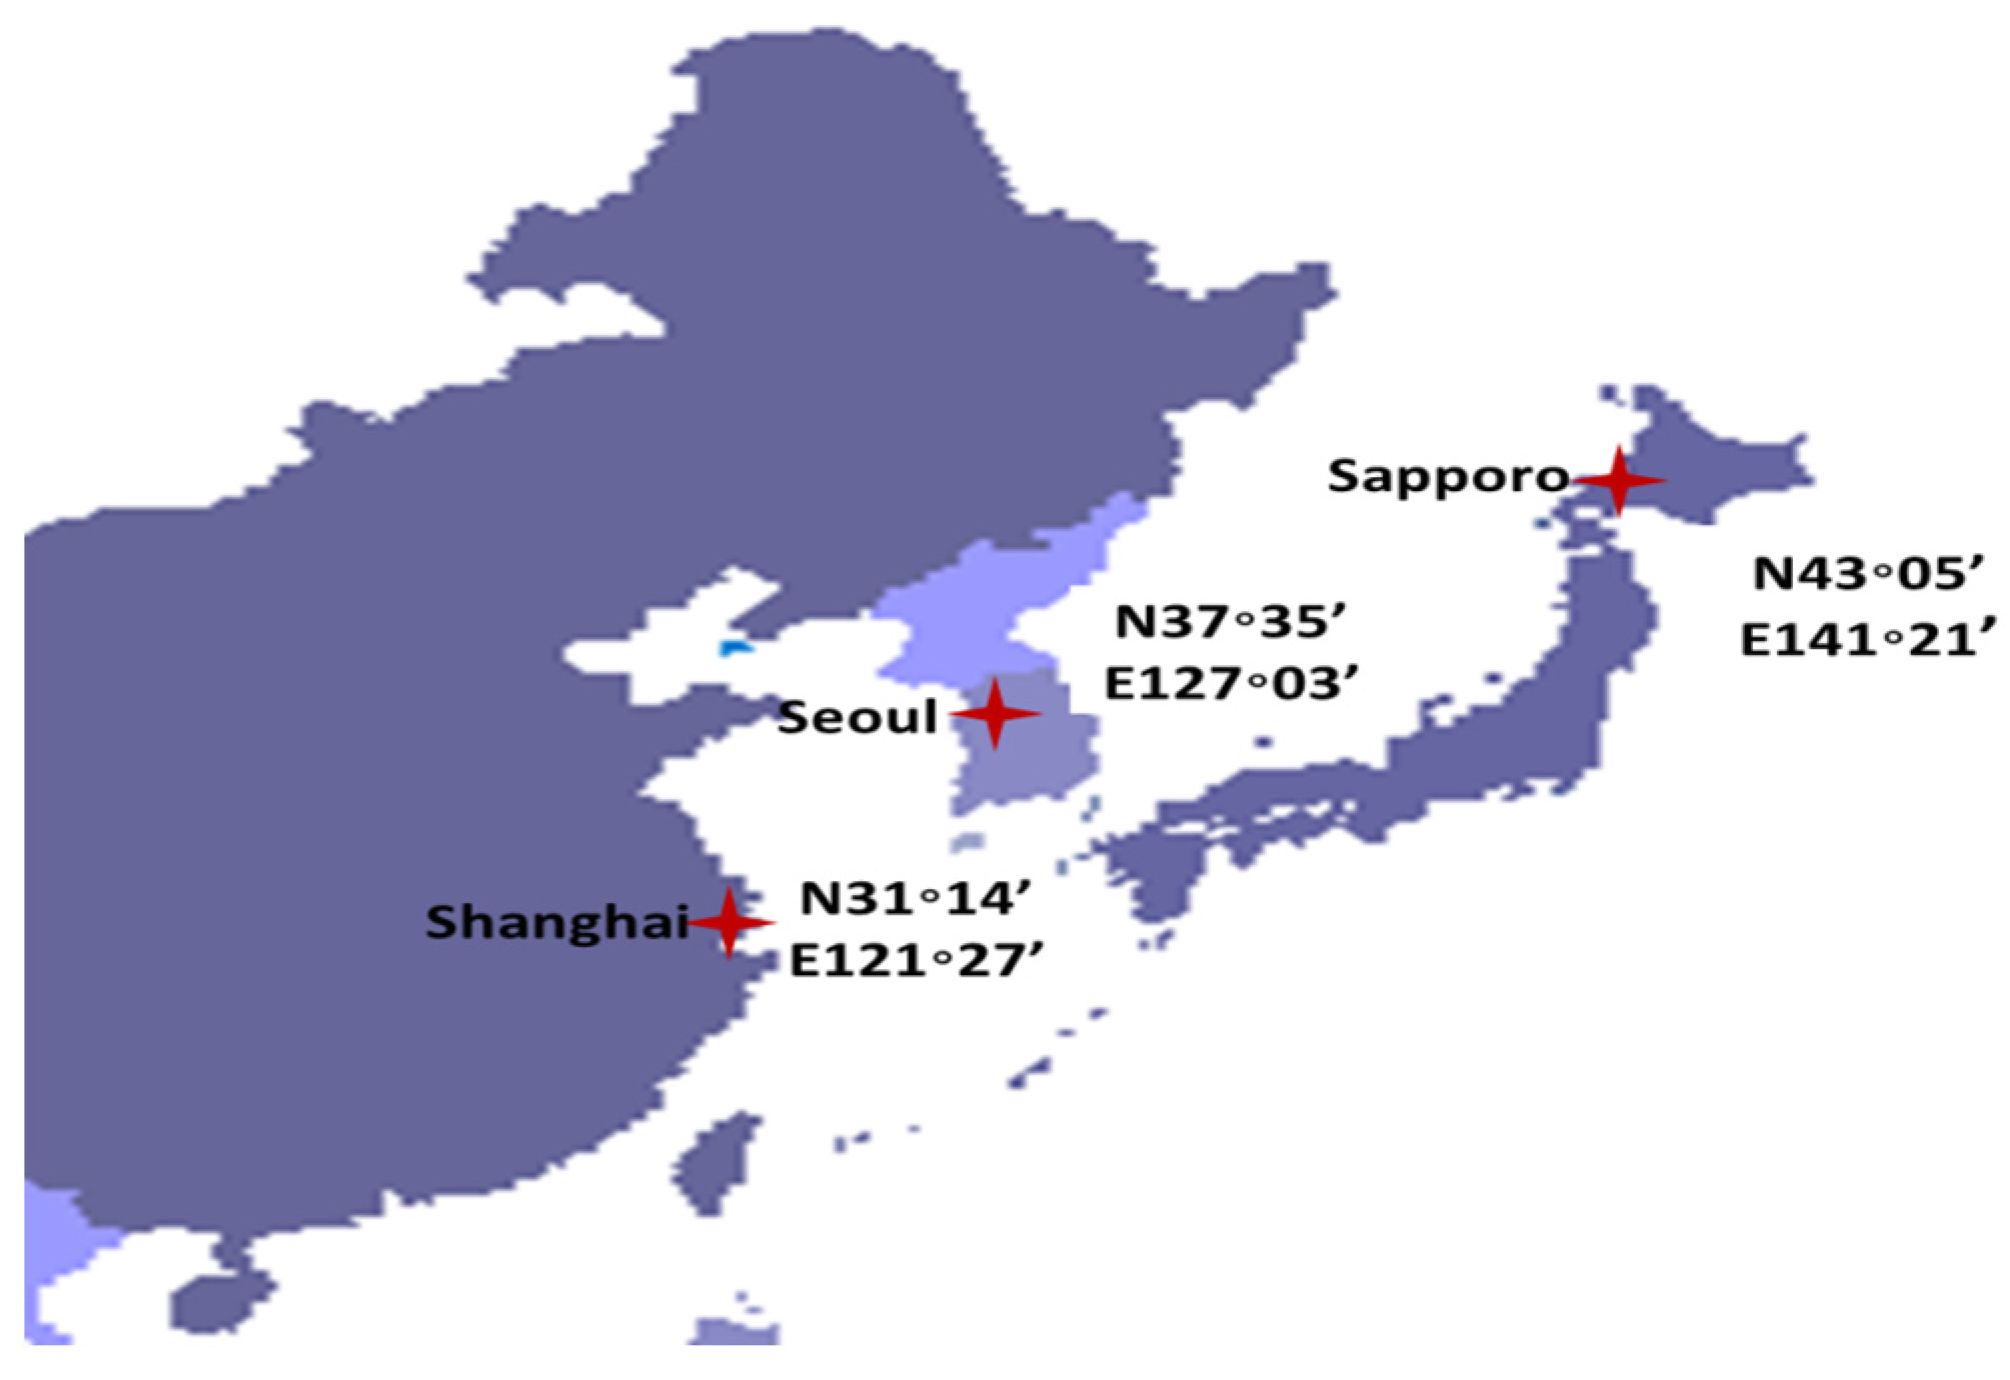
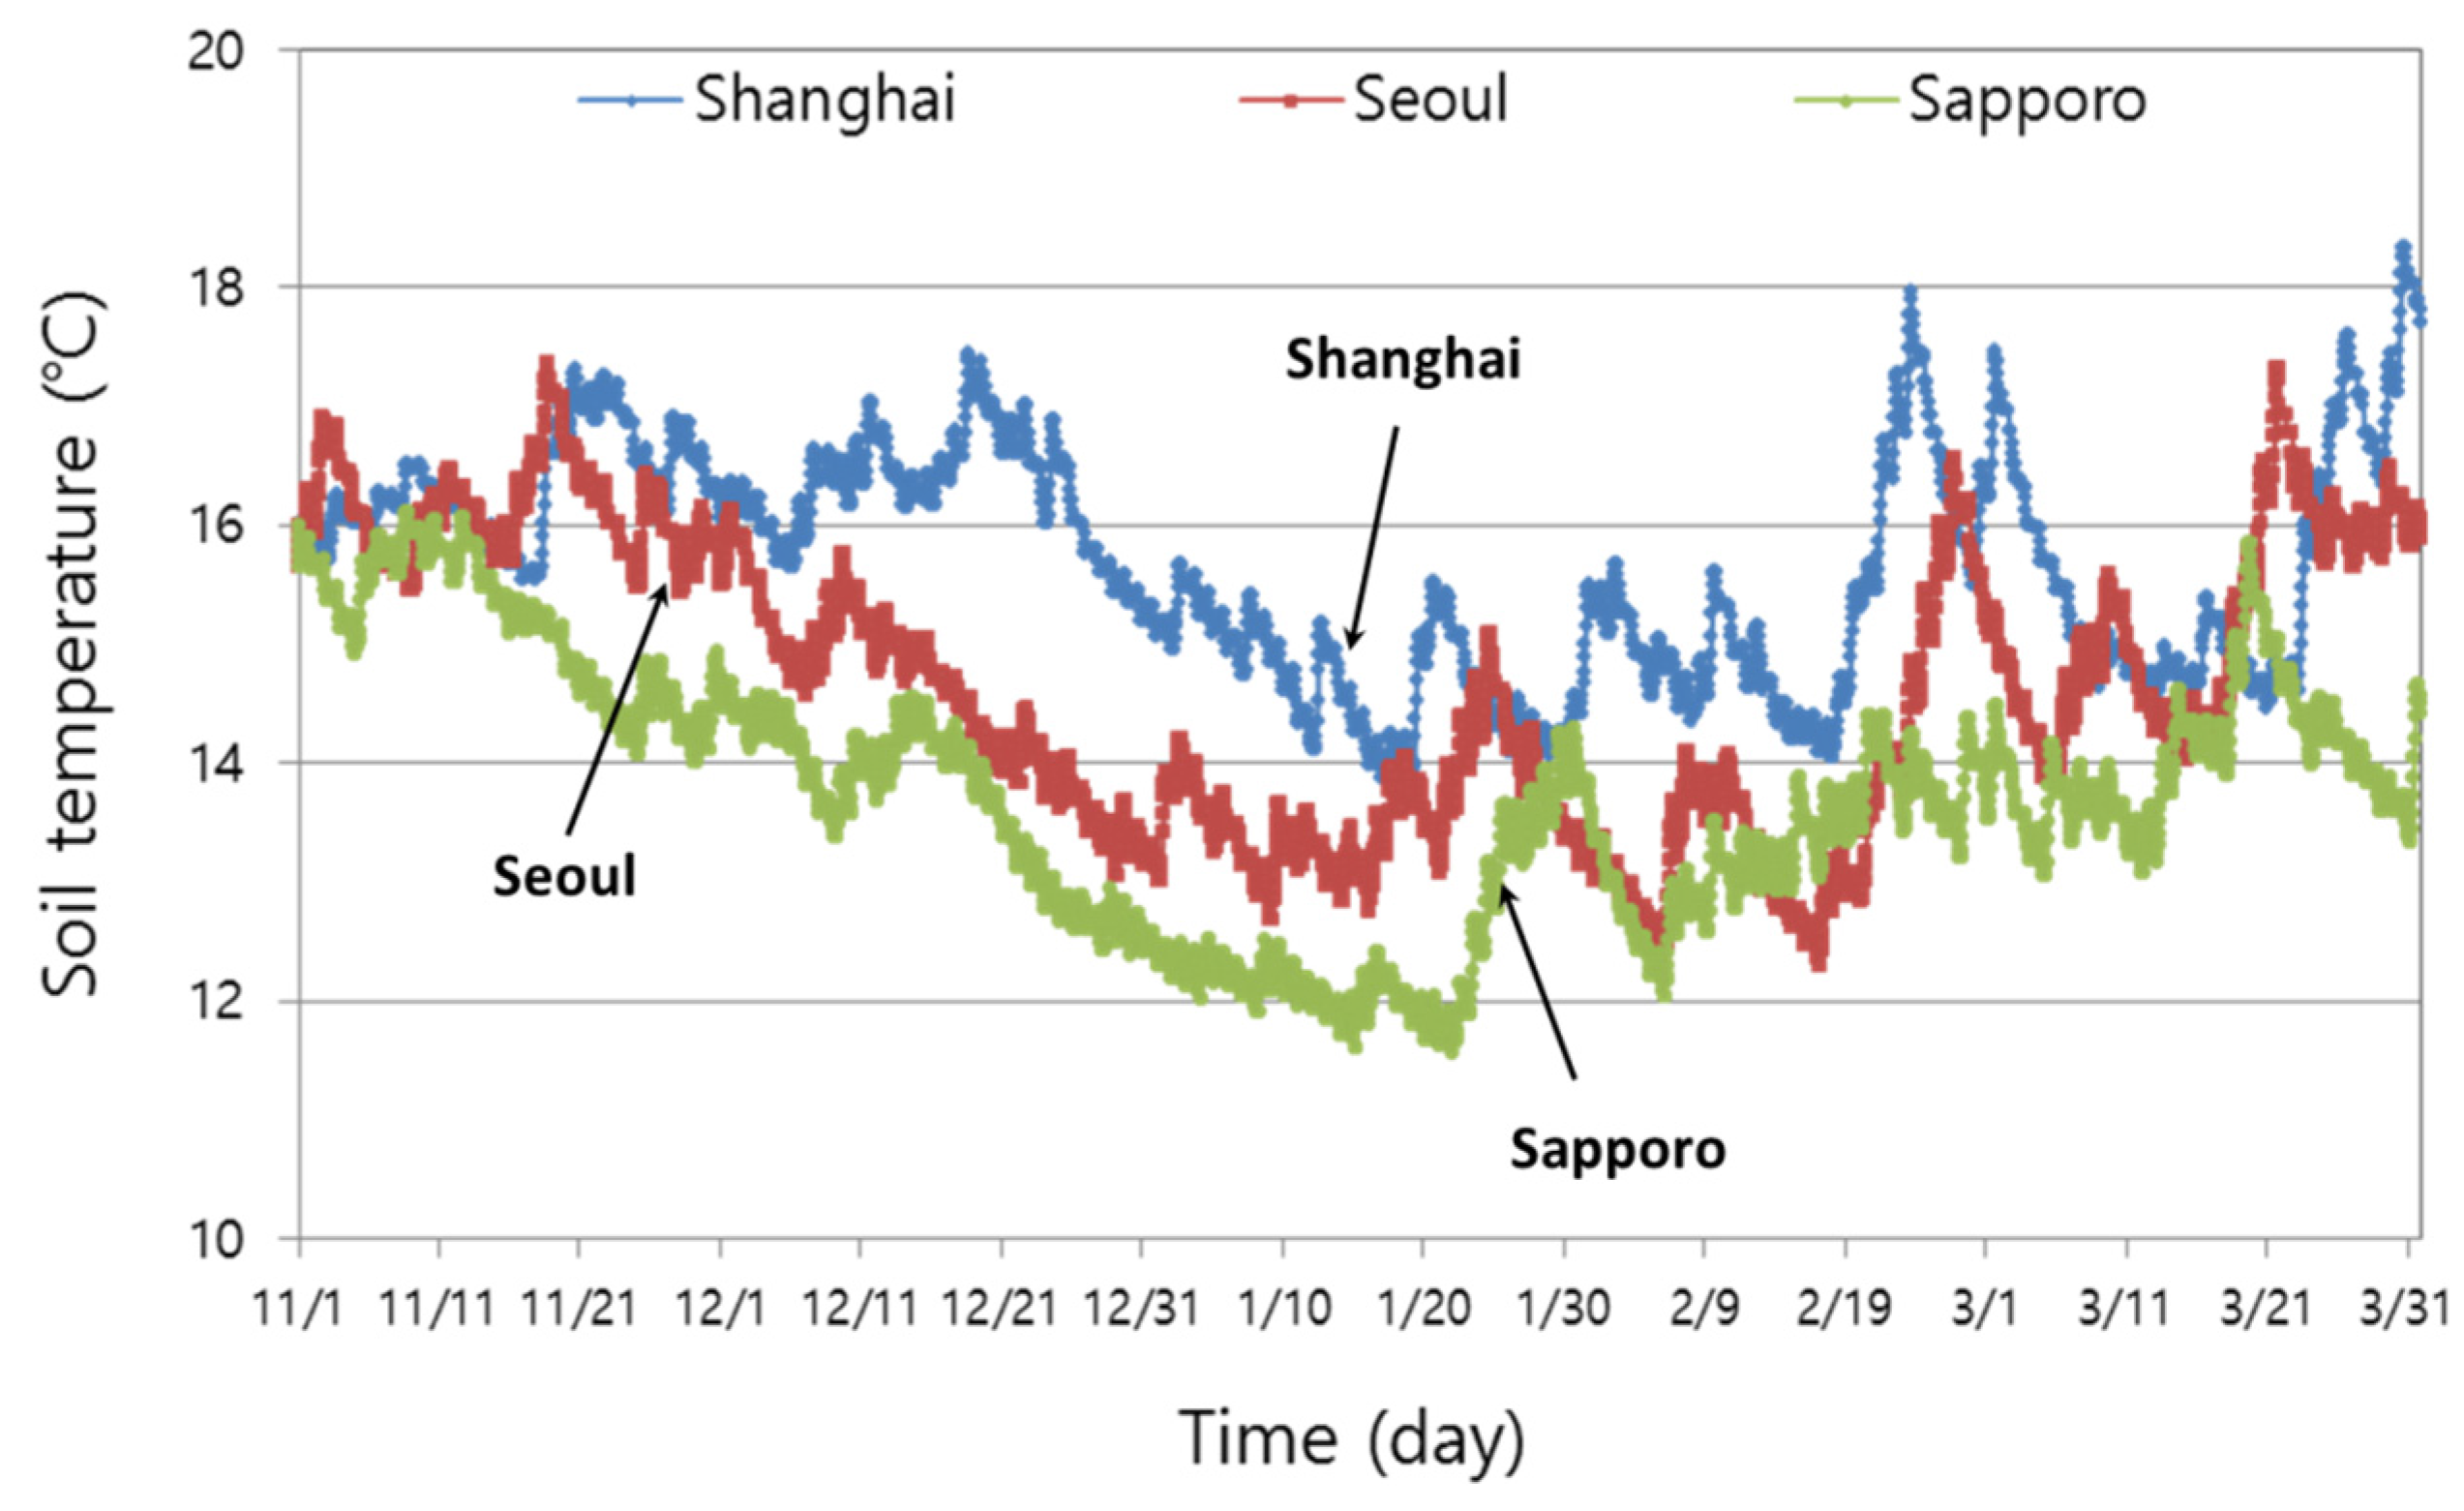
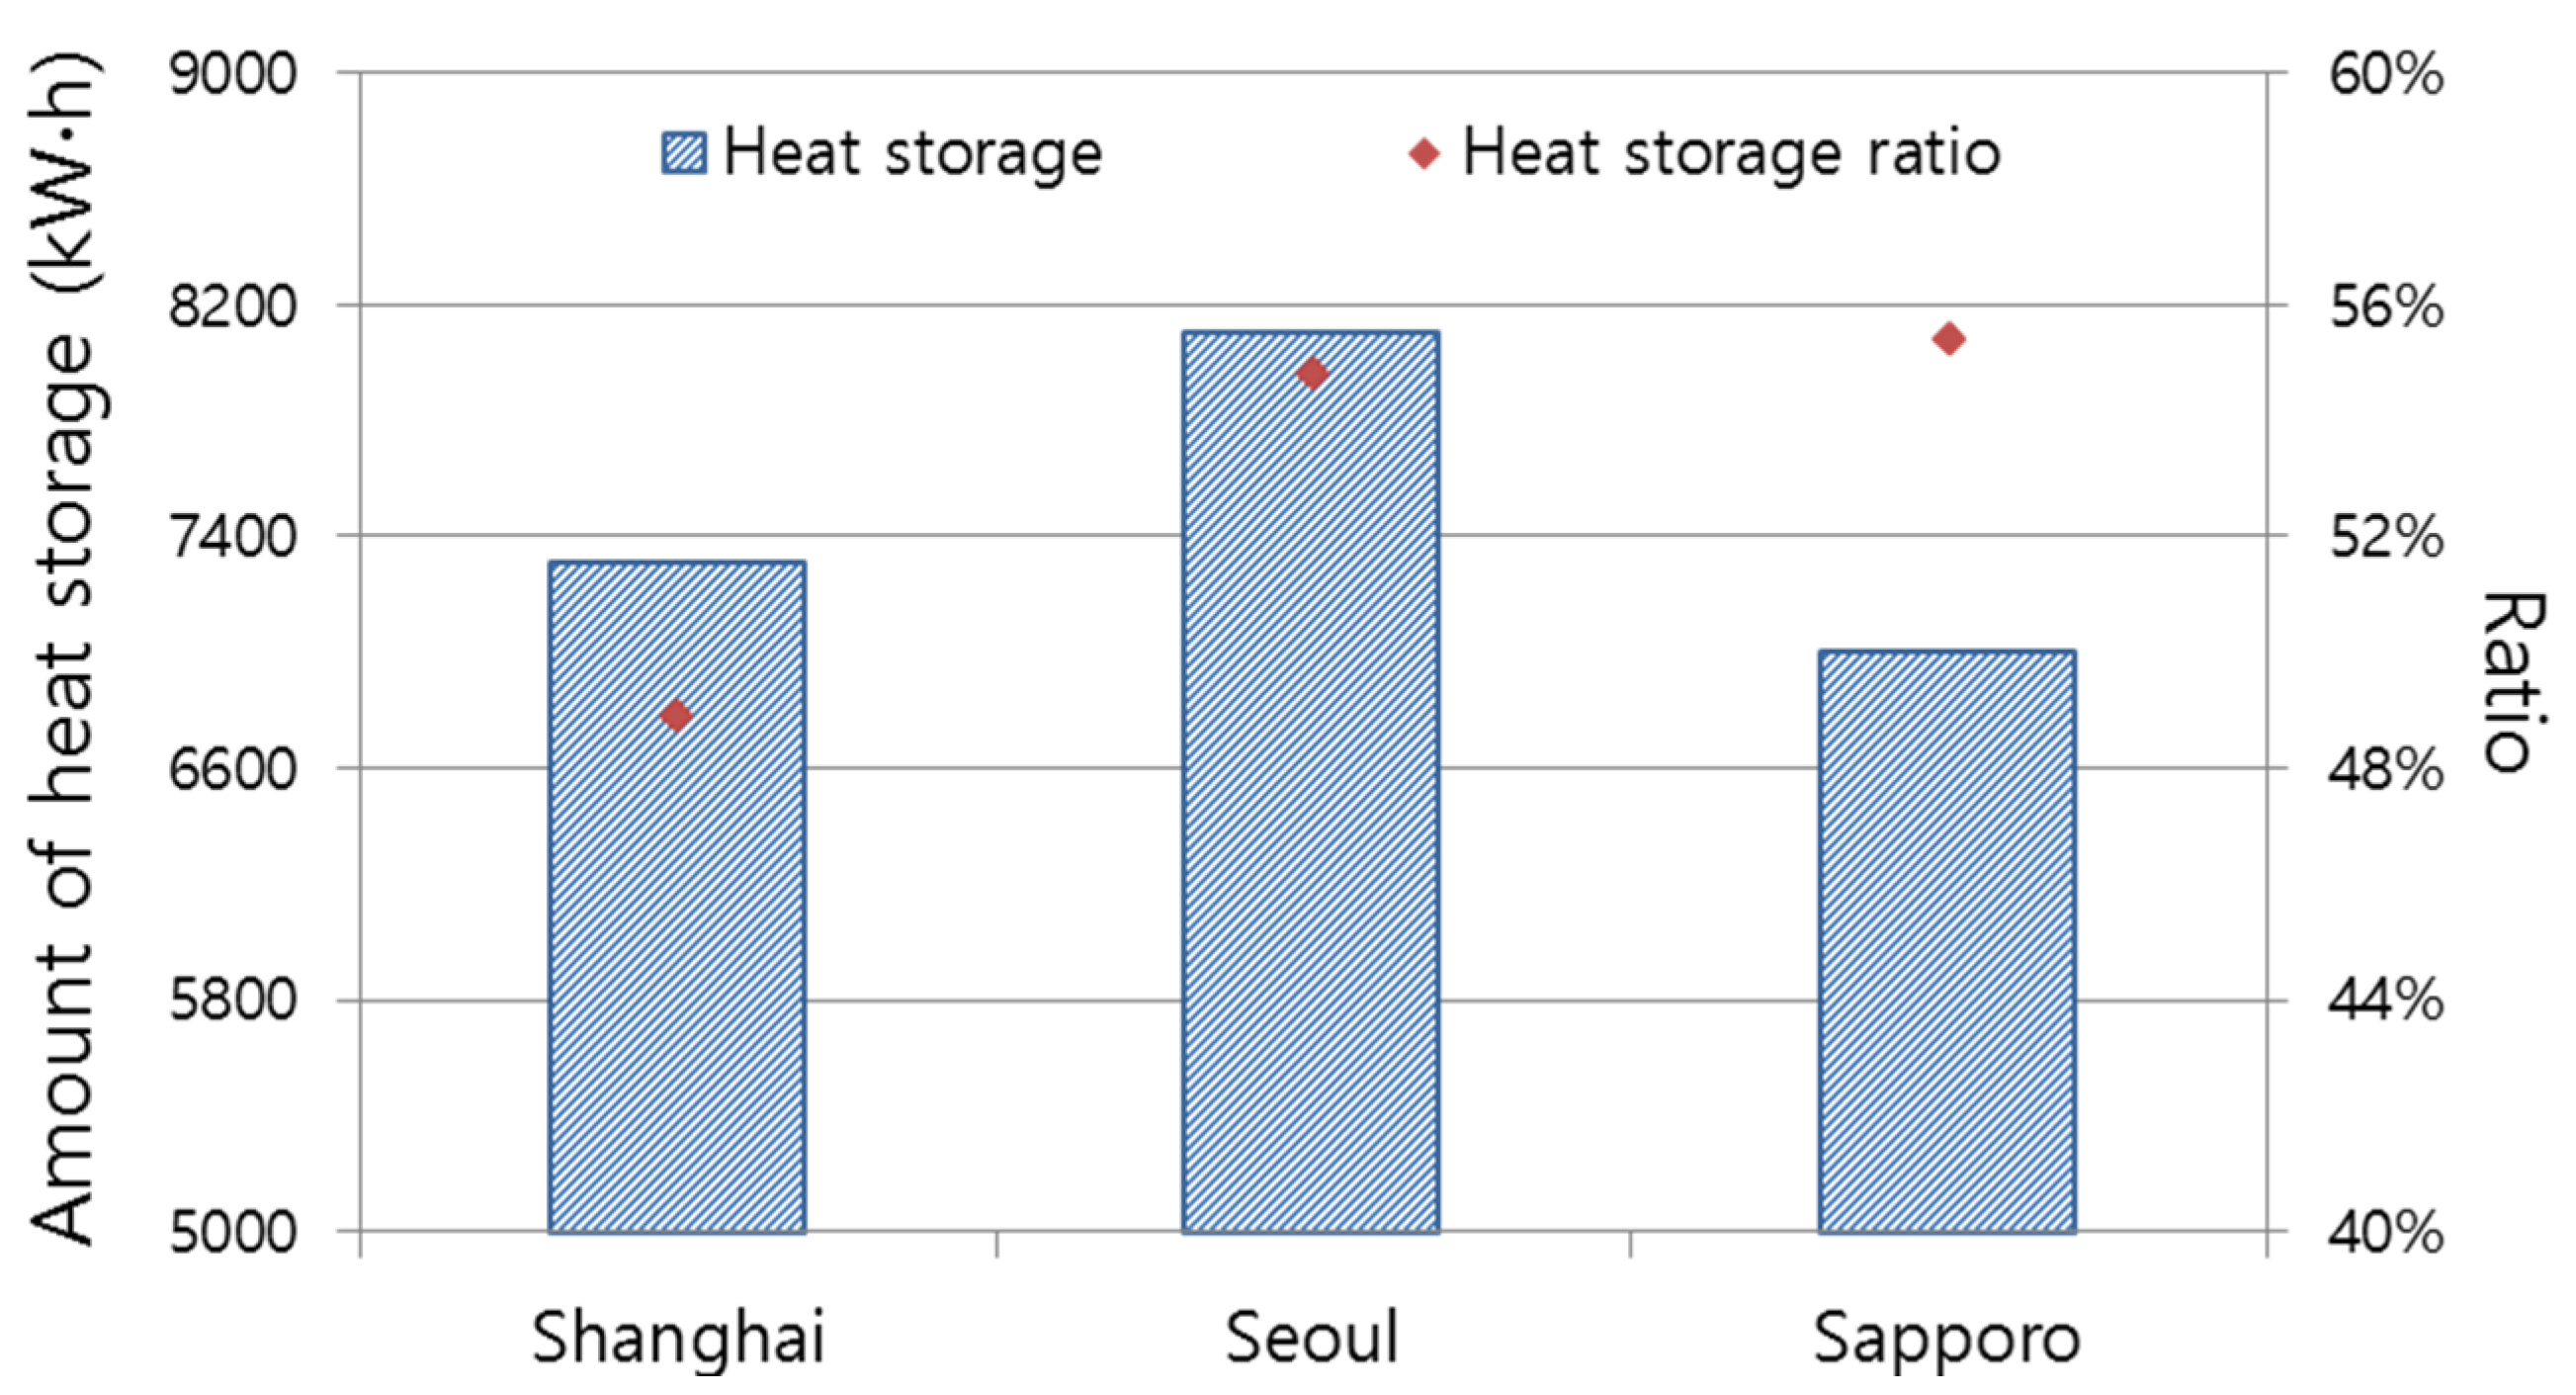
4.4. Performance Analysis with Different Weather Conditions

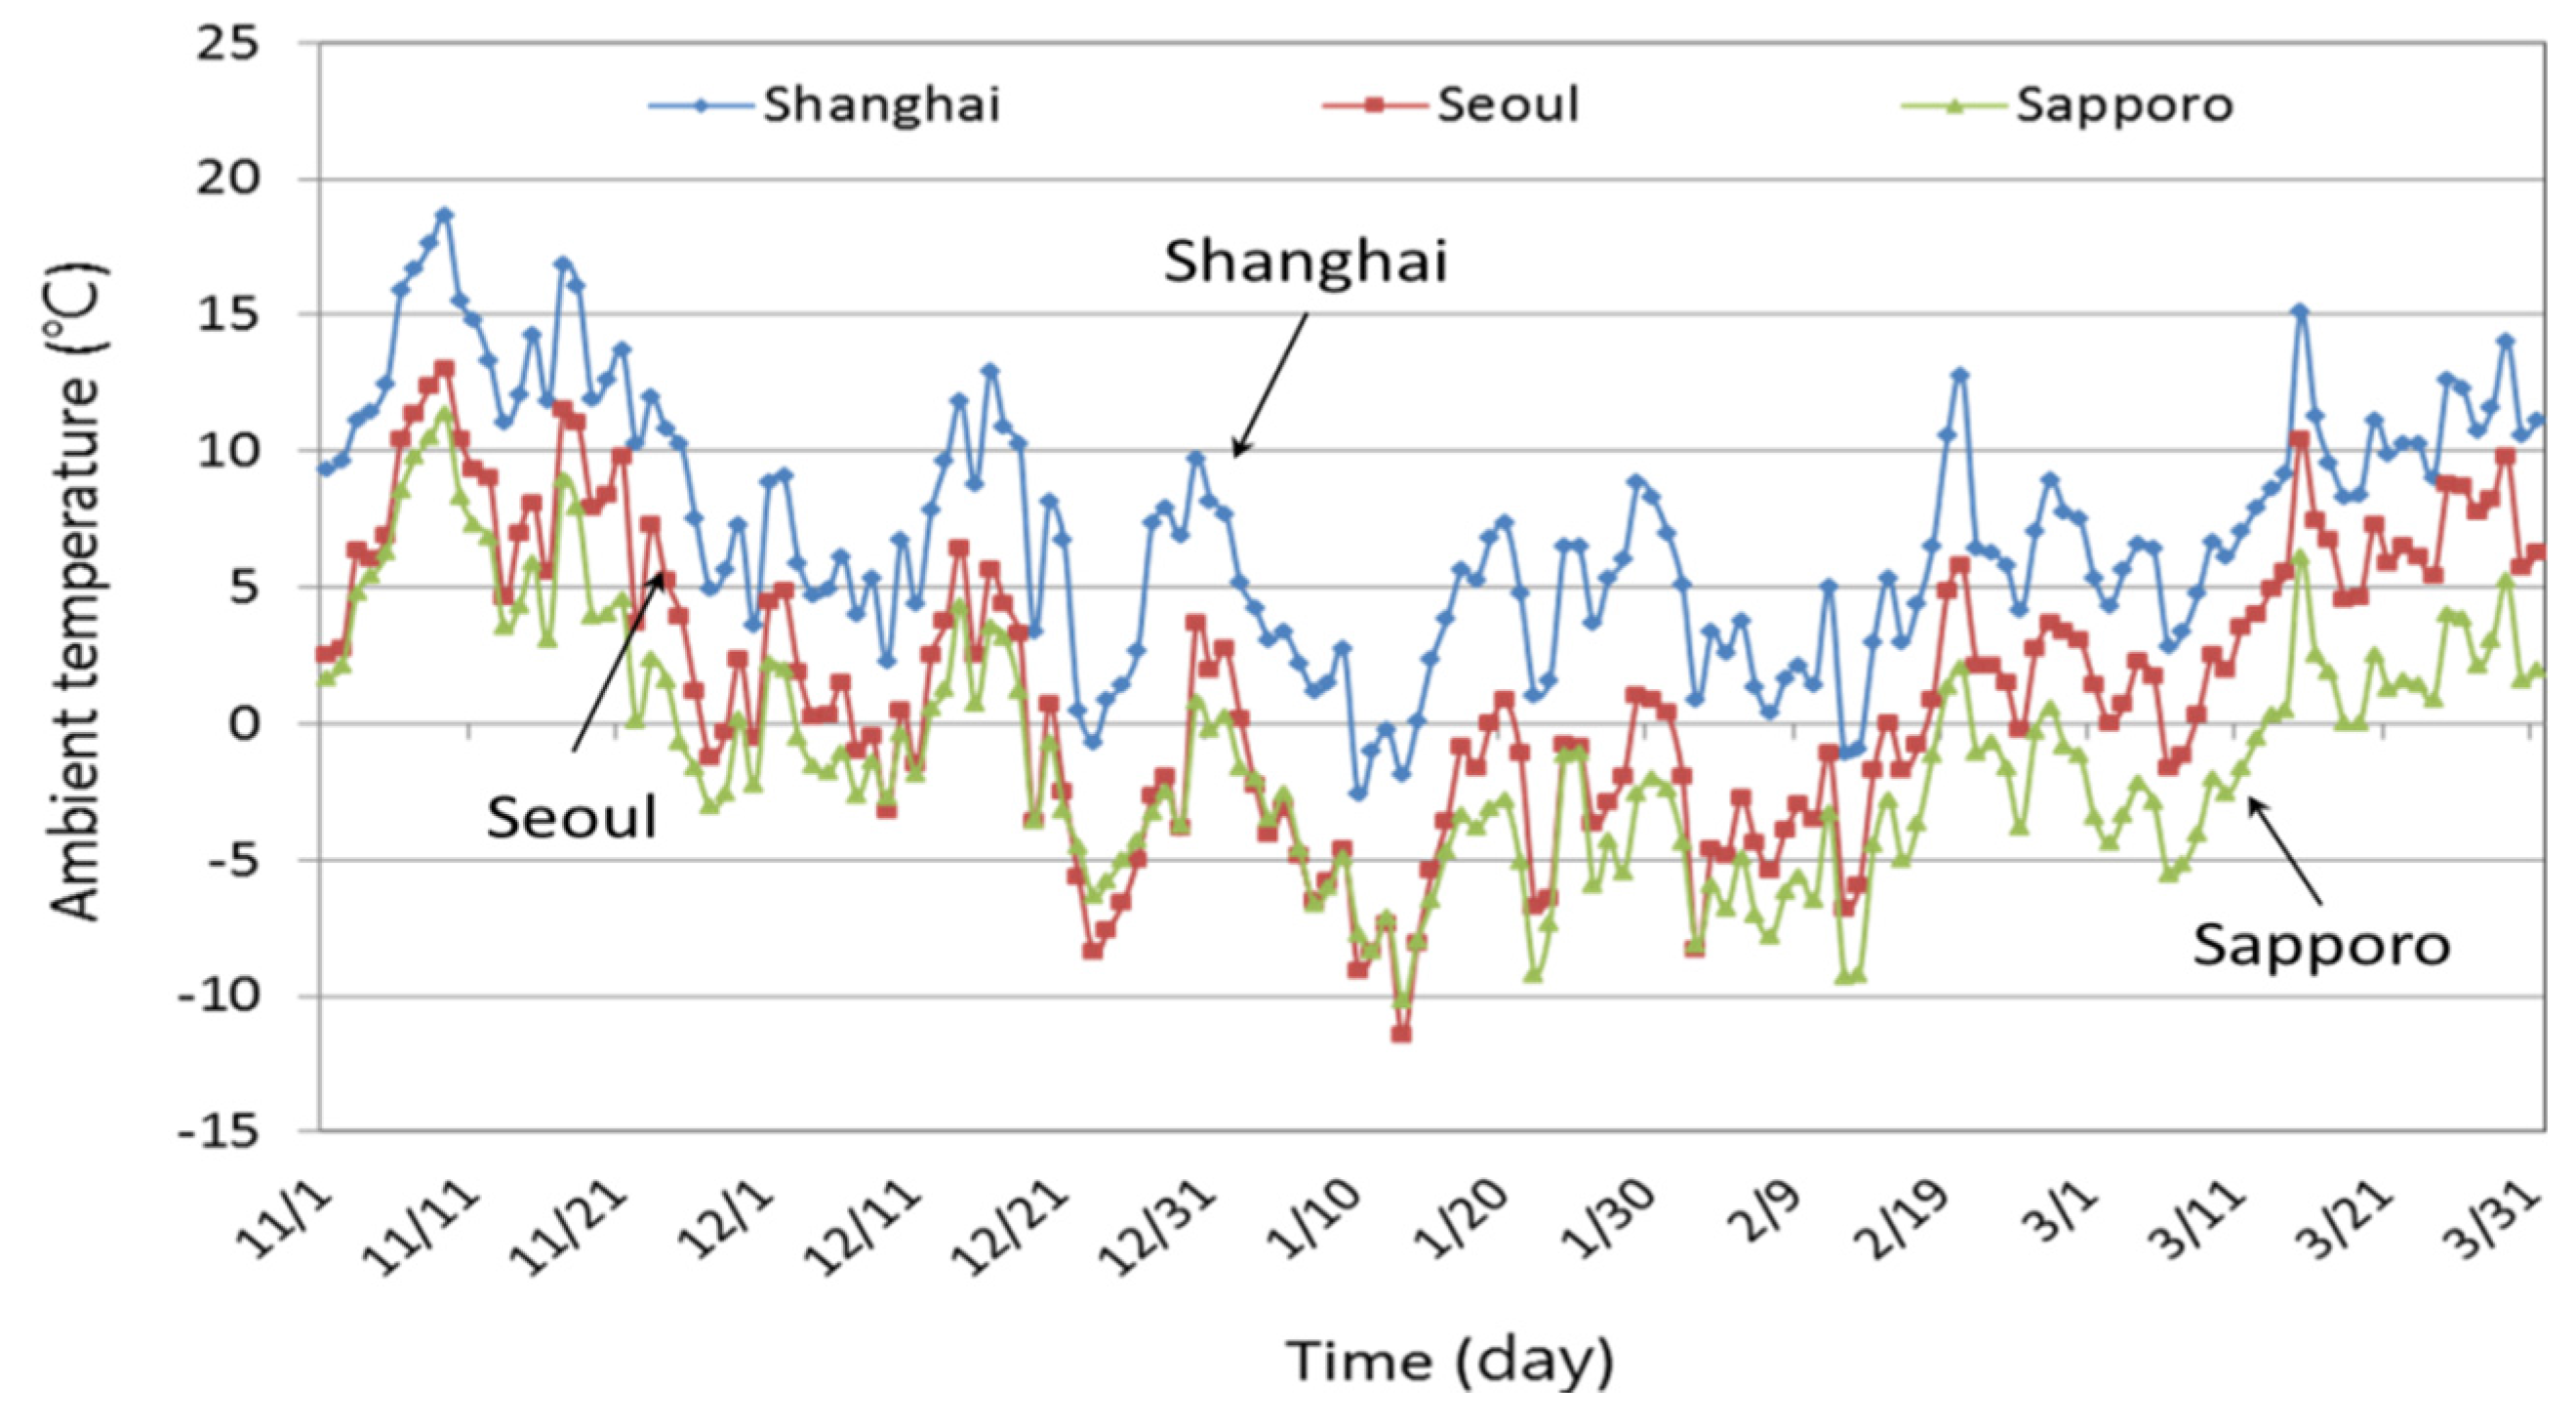
| City | Heat Exchange Rate (W/m) | Heat Source Temperature (°C) | Heat Pump COP | Extraction Energy (kW∙h) | Injection Energy (kW∙h) |
|---|---|---|---|---|---|
| Shanghai | 48.6 | 9.5 | 4.94 | 7348.5 | 7313.5 |
| Seoul | 43.3 | 8.9 | 4.69 | 10062.9 | 8110.0 |
| Sapporo | 40.1 | 8.5 | 4.56 | 10966.1 | 7000.2 |


5. Conclusions
- The ground heat pump system assisted by solar thermal can effectively maintain the soil temperature balance. In addition, under the same operation conditions, the performance of SAGHPS is better than that of GSHPS. During the entire operation time, the heat exchange rate and heat pump COP of SAGHPS were 43.3 W/m and 4.7. Compared with GSHPS, these values increased by 28.1% and 9.3%, respectively.
- With the increase of the collector area and the upgraded heating performance of the system, the investment costs increased relatively. From the result of the LCC assessment, when the solar collector area increased from 50 m2 to 90 m2, the payback period of SAGHPS would be in the range of 10 to 12 years.
- In contrast to other methods, using a high thermal conductivity grouting not only increases the heating performance of the heat pump, but also increases the energy use ratio.
- In different locations, because of the climatic differences, the performance of the system also differs. In a subtropical area (Shanghai), the system achieves a better heating performance than that in a cold area (Sapporo). However, in the cold area, the system achieved the best solar storage ratios, which were 55.4%, 0.6%, and 6.5% higher than those of Seoul and Shanghai.
- In the next research stage, the simulation results will be verified through a demonstration experiment. Also, in order to establish the optimum design method of the suggested system, more case studies will be conducted.
Acknowledgments
Author Contributions
Conflicts of Interest
Nomenclature
| VDST | The volume of the storage (m3) |
| n | Borehole number |
| h | The length of borehole (m) |
| B | Borehole spacing (m) |
| Tr | Indoor temperature (°C) |
| Tst | Average temperature of storage tank (°C) |
| Ts | Solar source temperature (°C) |
| Tg | Ground source temperature (°C) |
| COPHP | The heat pump coefficient of performance |
| Cap | Heat pump heating capacity (kW) |
| P | Power consumption of the system (kW) |
| PHP | Power consumption of the heat pump (kW) |
| Q | Energy production of system (kW) |
| Qheat | Heat transfer rate (kW) |
| Qabsorbed | Energy absorbed by the heat pump (kW) |
| Qinjection | Solar storage energy (kW) |
| Qsolar | Energy absorbed by solar collector (kW) |
| Tsource, in | Temperature of liquid entering the source side of the heat pump (°C) |
| Tsource, out | Temperature of liquid exiting the source side of the heat pump (°C) |
| Tload, in | Temperature of liquid entering the load side of the heat pump (°C) |
| Tload, out | Temperature of liquid exiting the load side of the heat pump (°C) |
| Tfluid, in | Inlet fluid temperature of the borehole (°C) |
| Tfluid, out | Outlet fluid temperature of the borehole (°C) |
| Tb | Temperature at borehole wall (°C) |
| m | Flow rate of the liquid (kg/h) |
| c | Specific heat of the liquid (kJ/kg·K) |
| t | Operation time(0~24 h) |
| q | Heat exchange rate of ground heat exchanger (W/m) |
| β | Damping factor |
| v | Three-way valve |
| P | Circulation pump |
| η | Solar storage ratio |
References
- Dincer, I. Renewable energy and sustainable development: A crucial review. Renew. Sustain. Energy Rev. 2000, 4, 157–175. [Google Scholar] [CrossRef]
- International Geothermal Association Home Page. Available online: http://www.geothermal-energy.org/ (accessed on 10 September 2015).
- Ozgener, O.; Hepbasli, A. A review on the energy and exergy analysis of solar assisted heat pump systems. Renew. Sustain. Energy Rev. 2007, 11, 482–496. [Google Scholar] [CrossRef]
- Bose, J.E.; Ledbetter, C.W.; Partin, J.R. Experimental results of a low cost solar-assisted heat pump system using earth coil and geo-thermal well storage. Available online: http://www.osti.gov/scitech/servlets/purl/6890048 (accessed on 10 September 2015).
- Ozgener, O.; Hepbasli, A. Experimental performance analysis of a solar assisted ground-source heat pump greenhouse heating system. Energy Build. 2005, 37, 101–110. [Google Scholar] [CrossRef]
- Bakirci, K.; Ozyurt, O.; Comakli, K.; Comakli, O. Energy analysis of a solar-ground source heat pump system with vertical closed-loop for heating applications. Energy 2011, 36, 3224–3232. [Google Scholar] [CrossRef]
- Trillat-Berdal, V.; Souyri, B.; Fraisse, G. Experimental study of a ground-coupled heat pump combined with thermal solar collectors. Energy Build. 2006, 38, 1477–1484. [Google Scholar] [CrossRef]
- Trillat-Berdal, V.; Souyri, B.; Achard, G. Coupling of geothermal heat pumps with thermal solar collectors. Appl. Ther. Eng. 2007, 27, 1750–1755. [Google Scholar] [CrossRef]
- Yang, W.B.; Shi, M.H.; Dong, H. Numerical simulation of the performance of a solar-earth source heat pump system. Appl. Ther. Eng. 2006, 26, 2367–2376. [Google Scholar] [CrossRef]
- Nam, Y.J. Study on the optimum design of a heat pump system using solar and ground heat. J. SAREK 2012, 24, 509–514. [Google Scholar] [CrossRef]
- Han, Z.; Zheng, M.; Kong, F.; Wang, F.; Li, Z.; Bai, T. Numerical simulation of solar assisted ground-source heat pump heating system with latent heat energy storage in severely cold area. Appl. Ther. Eng. 2008, 28, 1427–1436. [Google Scholar] [CrossRef]
- Lazzarin, R. Dual source heat pump systems: Operation and performance. Energy Build. 2012, 52, 77–85. [Google Scholar] [CrossRef]
- Busato, F.; Lazzarin, R.; Noro, M. Two years of recorded data for a multisource heat pump system: A performance analysis. Appl. Ther. Eng. 2013, 57, 39–47. [Google Scholar] [CrossRef]
- Busato, F.; Lazzarin, R.; Noro, M. Multisource heat pump system from design to operation: The case study of a new school building. Int. J. Low Carbon Technol. 2013, 8, 88–94. [Google Scholar] [CrossRef]
- Busato, F.; Lazzarin, R.; Noro, M. Ground or solar source heat pump systems for space heating: Which is better? Energetic assessment based on a case history. Energy Build. 2015, 102, 347–356. [Google Scholar] [CrossRef]
- D’Antoni, M.; Sparber, W. IEA-SHC Task 44/Annex 38 Solar and Heat Pump Systems. 2013. Available online: http://task44.iea-shc.org/ (accessed on 30 September 2015).
- Kim Young-Tag, A. Study on the Development of the Representing Day Heating Load Model for the Estimation of Energy Consumption in an Apartment House. J. Arch. Inst. Korea Plan. Des. 2005, 21, 287–294. [Google Scholar]
- Bernier, M.; Randriamiarinjatove, D. Annual simulations of heat pump systems with vertical ground heat exchangers. In Proceedings of the Conference on Building Energy Simulation, Ottawa, ON, Canada, 2001; pp. 163–170.
- Hellström, G. Duct Ground Heat Storage Model, Manual for Computer Code; Department of Mathematical Physics, University of Lund: Lund, Sweden, 1989. [Google Scholar]
- Pahud, D.; Hellström, G.; Mazzarella, L. Duct Ground Heat Storage Model for TRNSYS (TRNVDST); Laboratory of Energy Systems: Lausanne, Switzerland, 1997. [Google Scholar]
- Nam, Y.J.; Ooka, R.; Hwang, S. Development of a numerical model to predict heat exchange rates for a ground-source heat pump system. Energy Build. 2008, 40, 2133–2140. [Google Scholar] [CrossRef]
- Nam, Y.J.; Oh, J.H. Study on the characteristic of heat exchange for vertical geothermal system using the numerical simulation. J. Korean Solar Energy Soc. 2014, 34, 66–72. [Google Scholar] [CrossRef]
- Web Site of Korean Ministry of Trade, Industry and Energy. Available online: http://motie.go.kr/motie/ne/presse/press2/bbs/bbsView.do?bbs_seq_n=59155&bbs_cd_n=81 (accessed on 30 September 2015).
© 2015 by the authors; licensee MDPI, Basel, Switzerland. This article is an open access article distributed under the terms and conditions of the Creative Commons by Attribution (CC-BY) license (http://creativecommons.org/licenses/by/4.0/).
Share and Cite
Nam, Y.J.; Gao, X.Y.; Yoon, S.H.; Lee, K.H. Study on the Performance of a Ground Source Heat Pump System Assisted by Solar Thermal Storage. Energies 2015, 8, 13378-13394. https://doi.org/10.3390/en81212365
Nam YJ, Gao XY, Yoon SH, Lee KH. Study on the Performance of a Ground Source Heat Pump System Assisted by Solar Thermal Storage. Energies. 2015; 8(12):13378-13394. https://doi.org/10.3390/en81212365
Chicago/Turabian StyleNam, Yu Jin, Xin Yang Gao, Sung Hoon Yoon, and Kwang Ho Lee. 2015. "Study on the Performance of a Ground Source Heat Pump System Assisted by Solar Thermal Storage" Energies 8, no. 12: 13378-13394. https://doi.org/10.3390/en81212365