
A Numerical and Graphical Review of Energy Storage Technologies

Abstract
:
1. Introduction


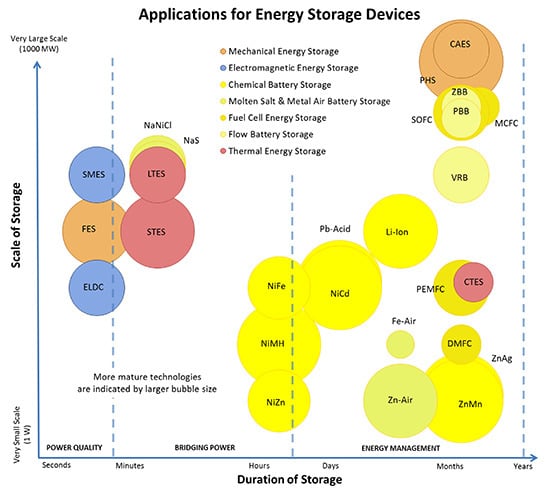
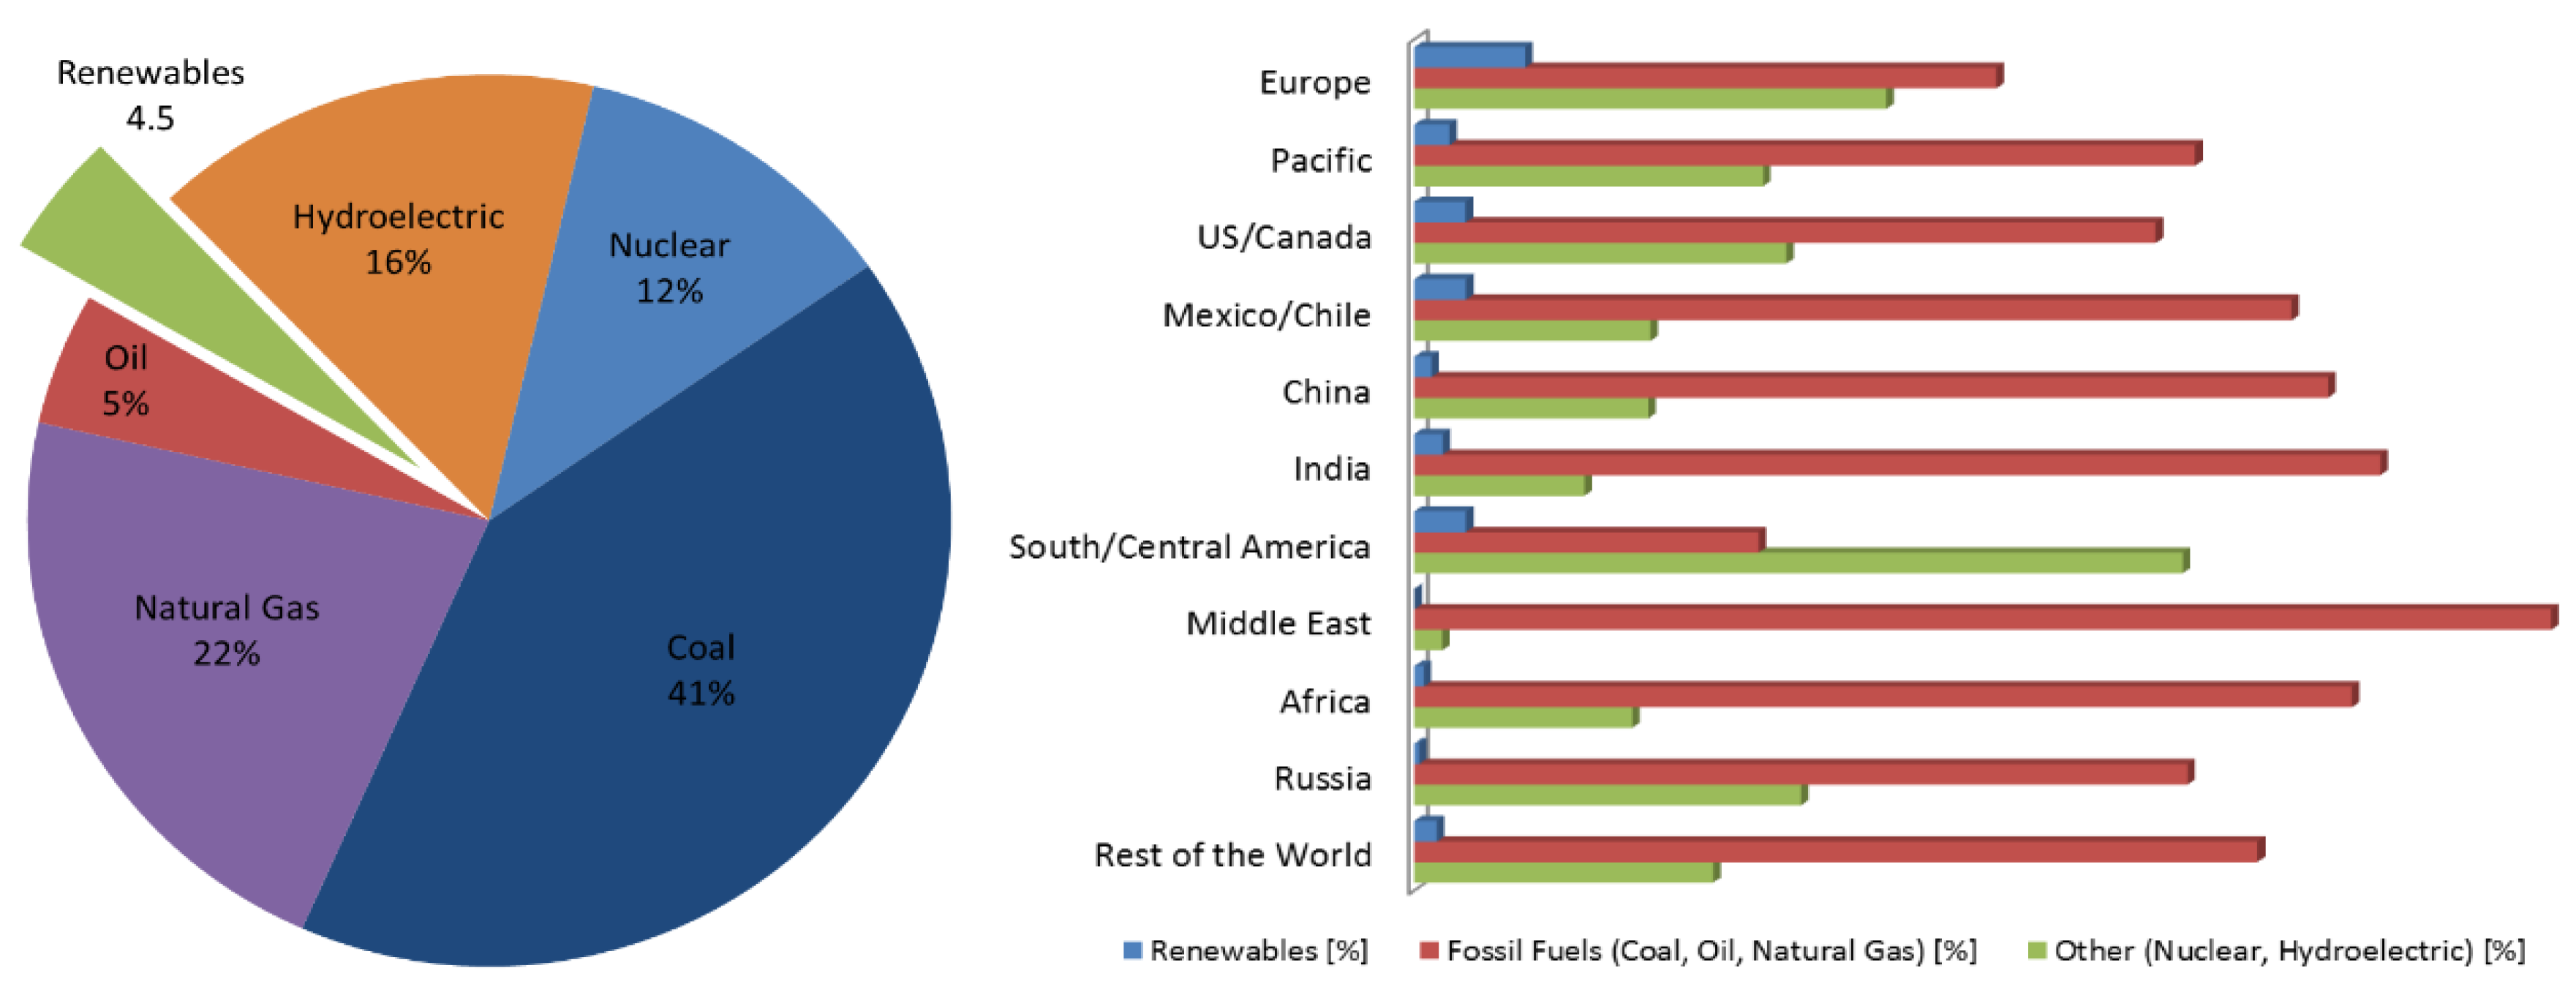
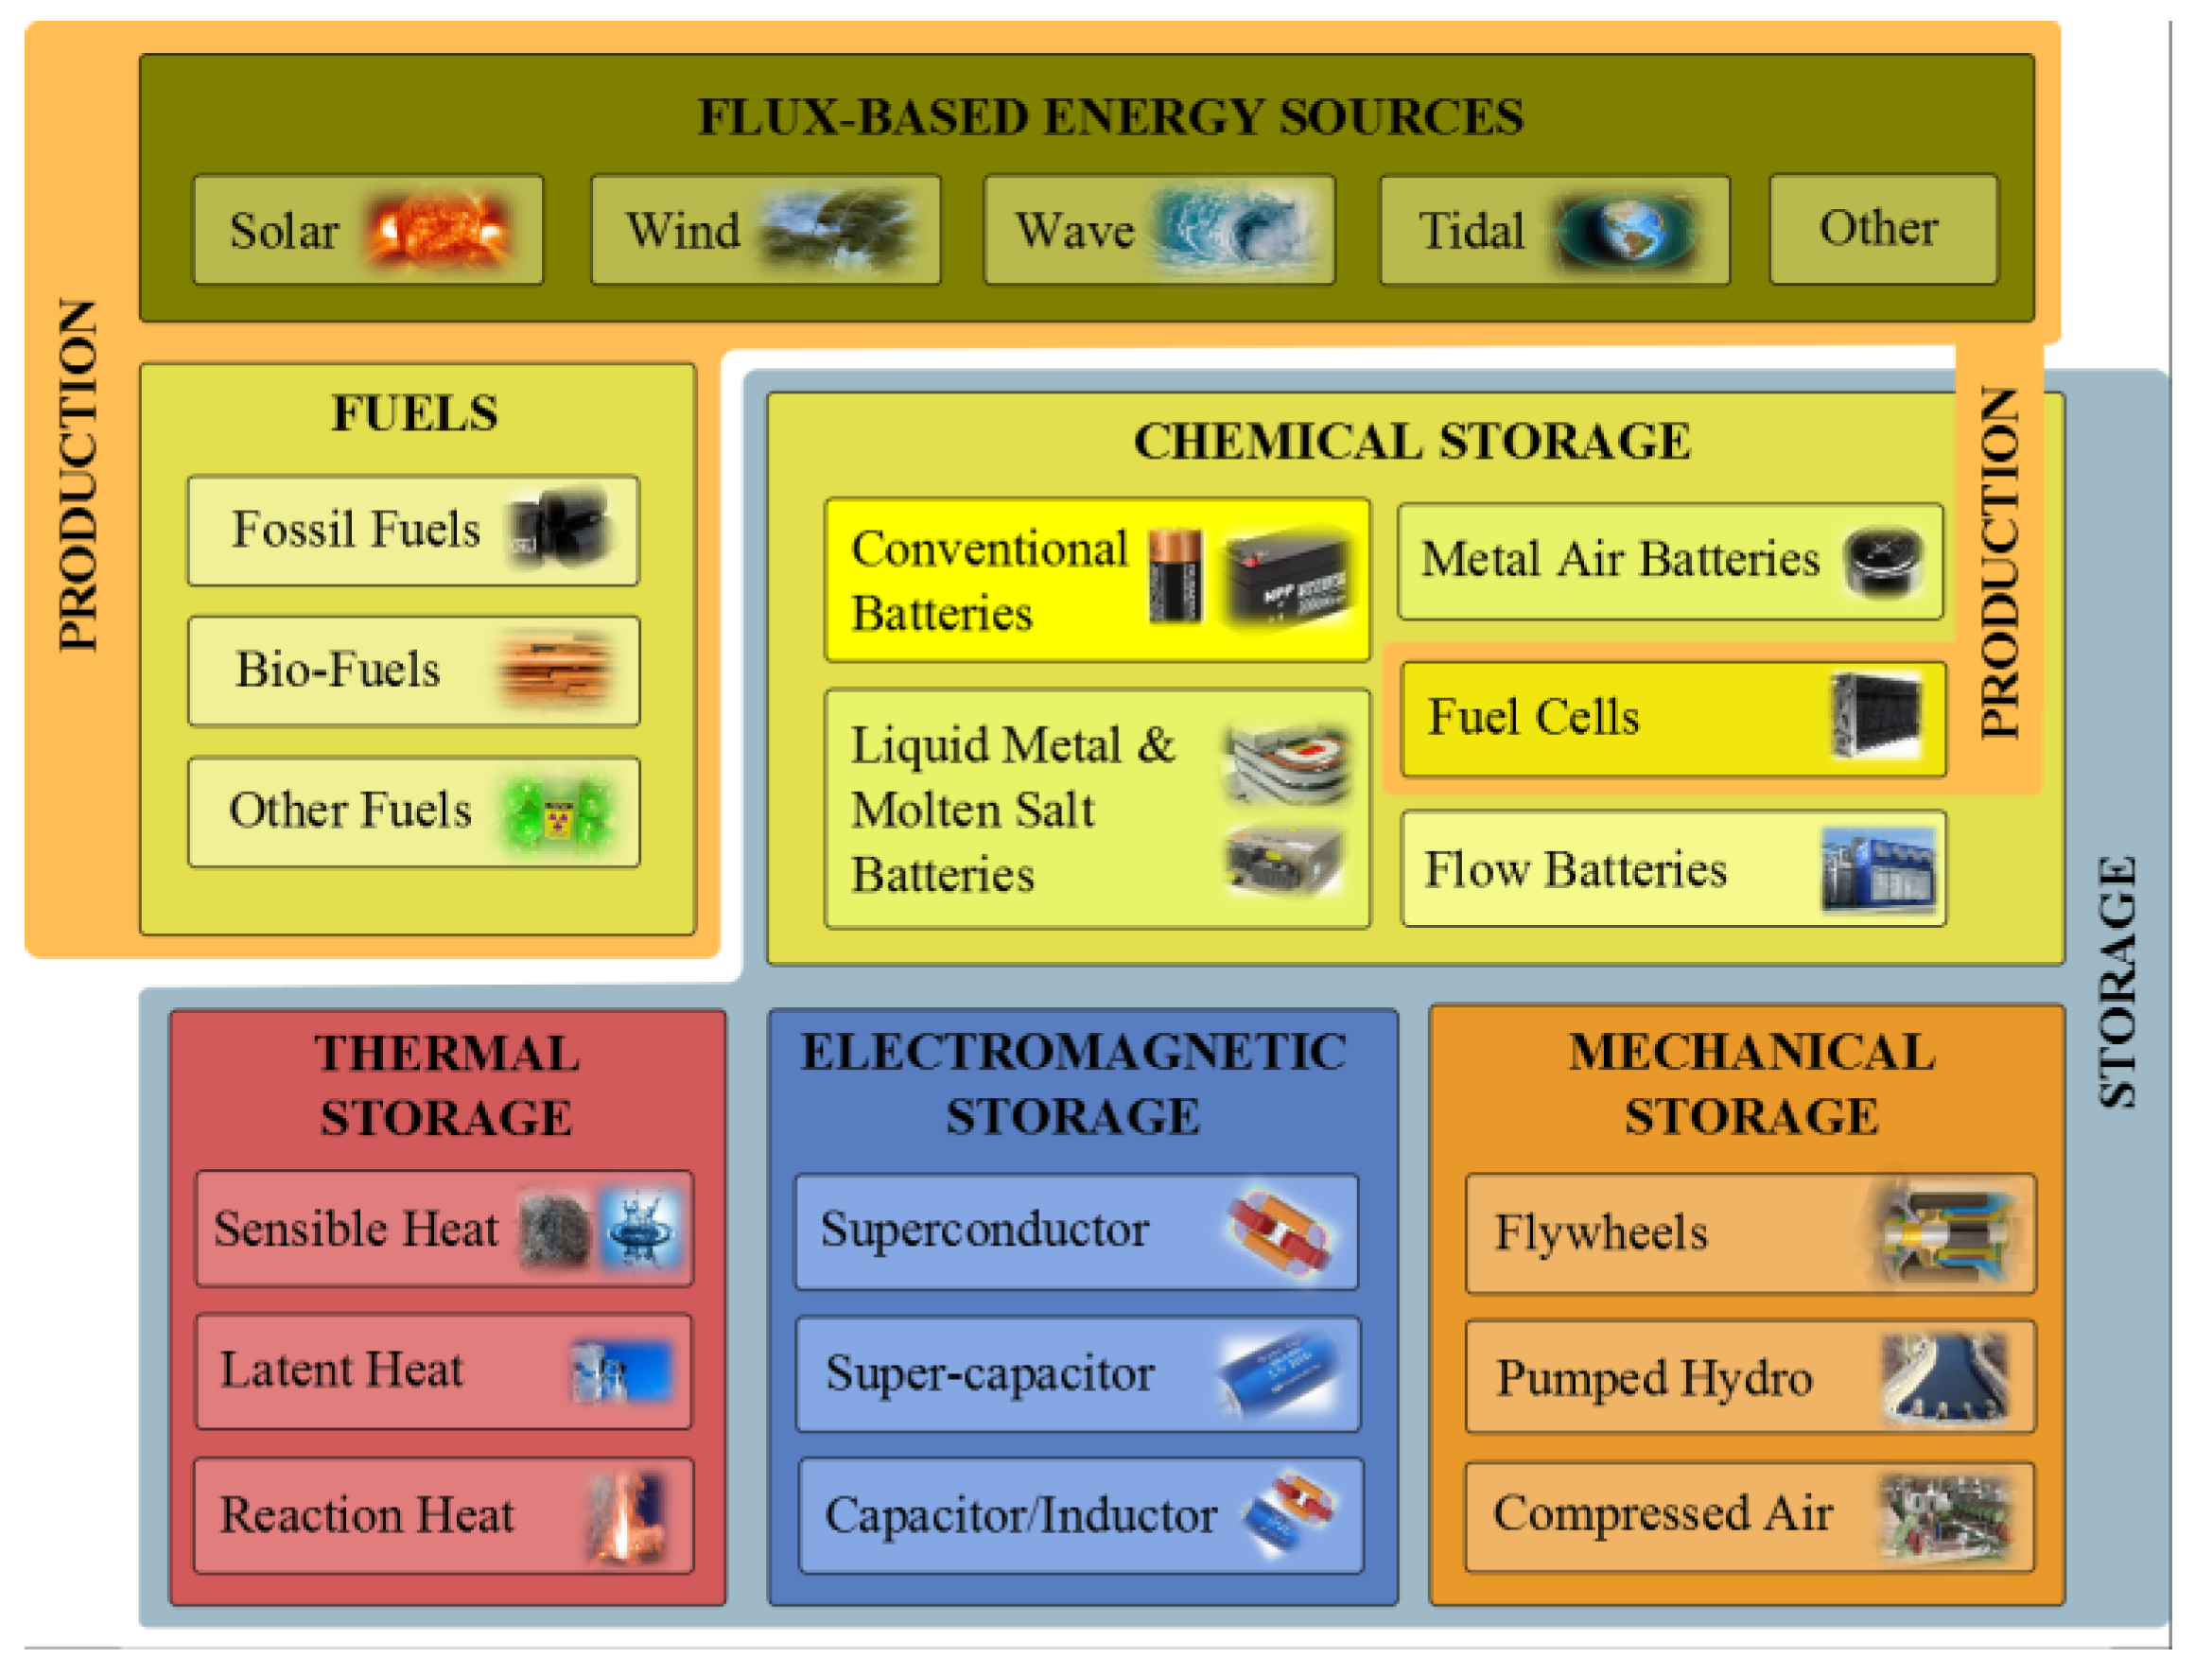
1.1. Energy Storage Technologies Overview

| Category | Applications | Power Rating |
|---|---|---|
| Small Scale | Mobile Devices, Electric Vehicles, Satellites, etc. | ≤1 MW |
| Medium Scale | Office buildings, Remote communities, etc. | 10–100 MW |
| Large Scale | Power Plants, etc. | ≥300 MW |
| Category | Applications | Storage Duration | |
|---|---|---|---|
| Power Quality & Regulation | Fluctuation Suppression/Smoothing | FS/S | ≤1 min |
| Dynamic Power Response | DPR | ||
| Low Voltage Ride Through | LVRT | ||
| Line Fault Ride Through | LFRT | ||
| Uninterruptable Power Supply | UPS | ||
| Voltage Control Support | VCS | ||
| Reactive Power Control | RPC | ||
| Oscillation Damping | OD | ||
| Transient Stability | TS | ||
| Bridging Power | Spinning/Contingency Reserves | S/CR | 1 min–1 h |
| Ramping | R | ||
| Emergency Backup | EB | ||
| Load Following | LF | ||
| Wind Power Smoothing | WPS | ||
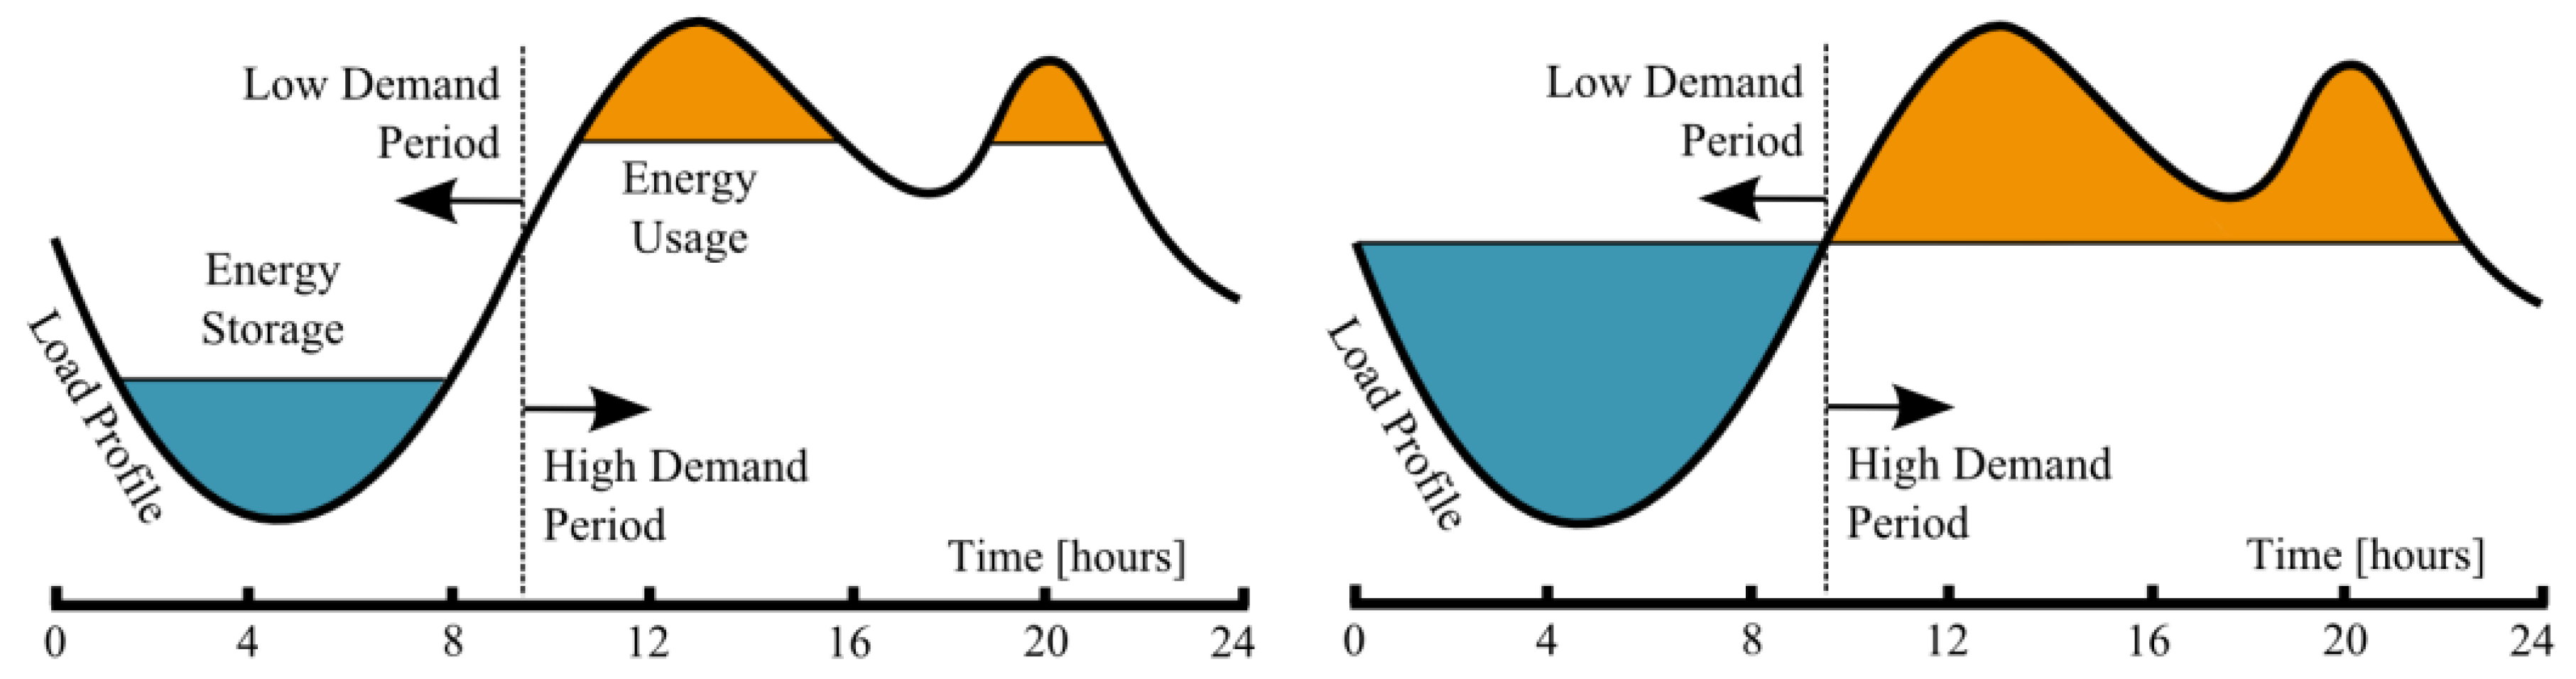
| Energy Management | Peak Shaving/Generation/Time Shifting | PS/G/TS | 1–10 h |
| Transmission Curtailment | TC | 5–12 h | |
| Energy Arbitrage | EA | ||
| Transmission & Distribution Deferral | TDD | ||
| Line Repair | LR | ||
| Load Cycling | LC | ||
| Weather Smoothing | WS | ||
| Unit Commitment | UC | hours–days | |
| Load Leveling | LL | ||
| Capacity Firming | CF | ||
| Renewable Integration and Backup | RIB | ||
| Seasonal Storage | SS | ≥4 months | |
| Annual Smoothing | AS |
1.2. Comments on Presented Data
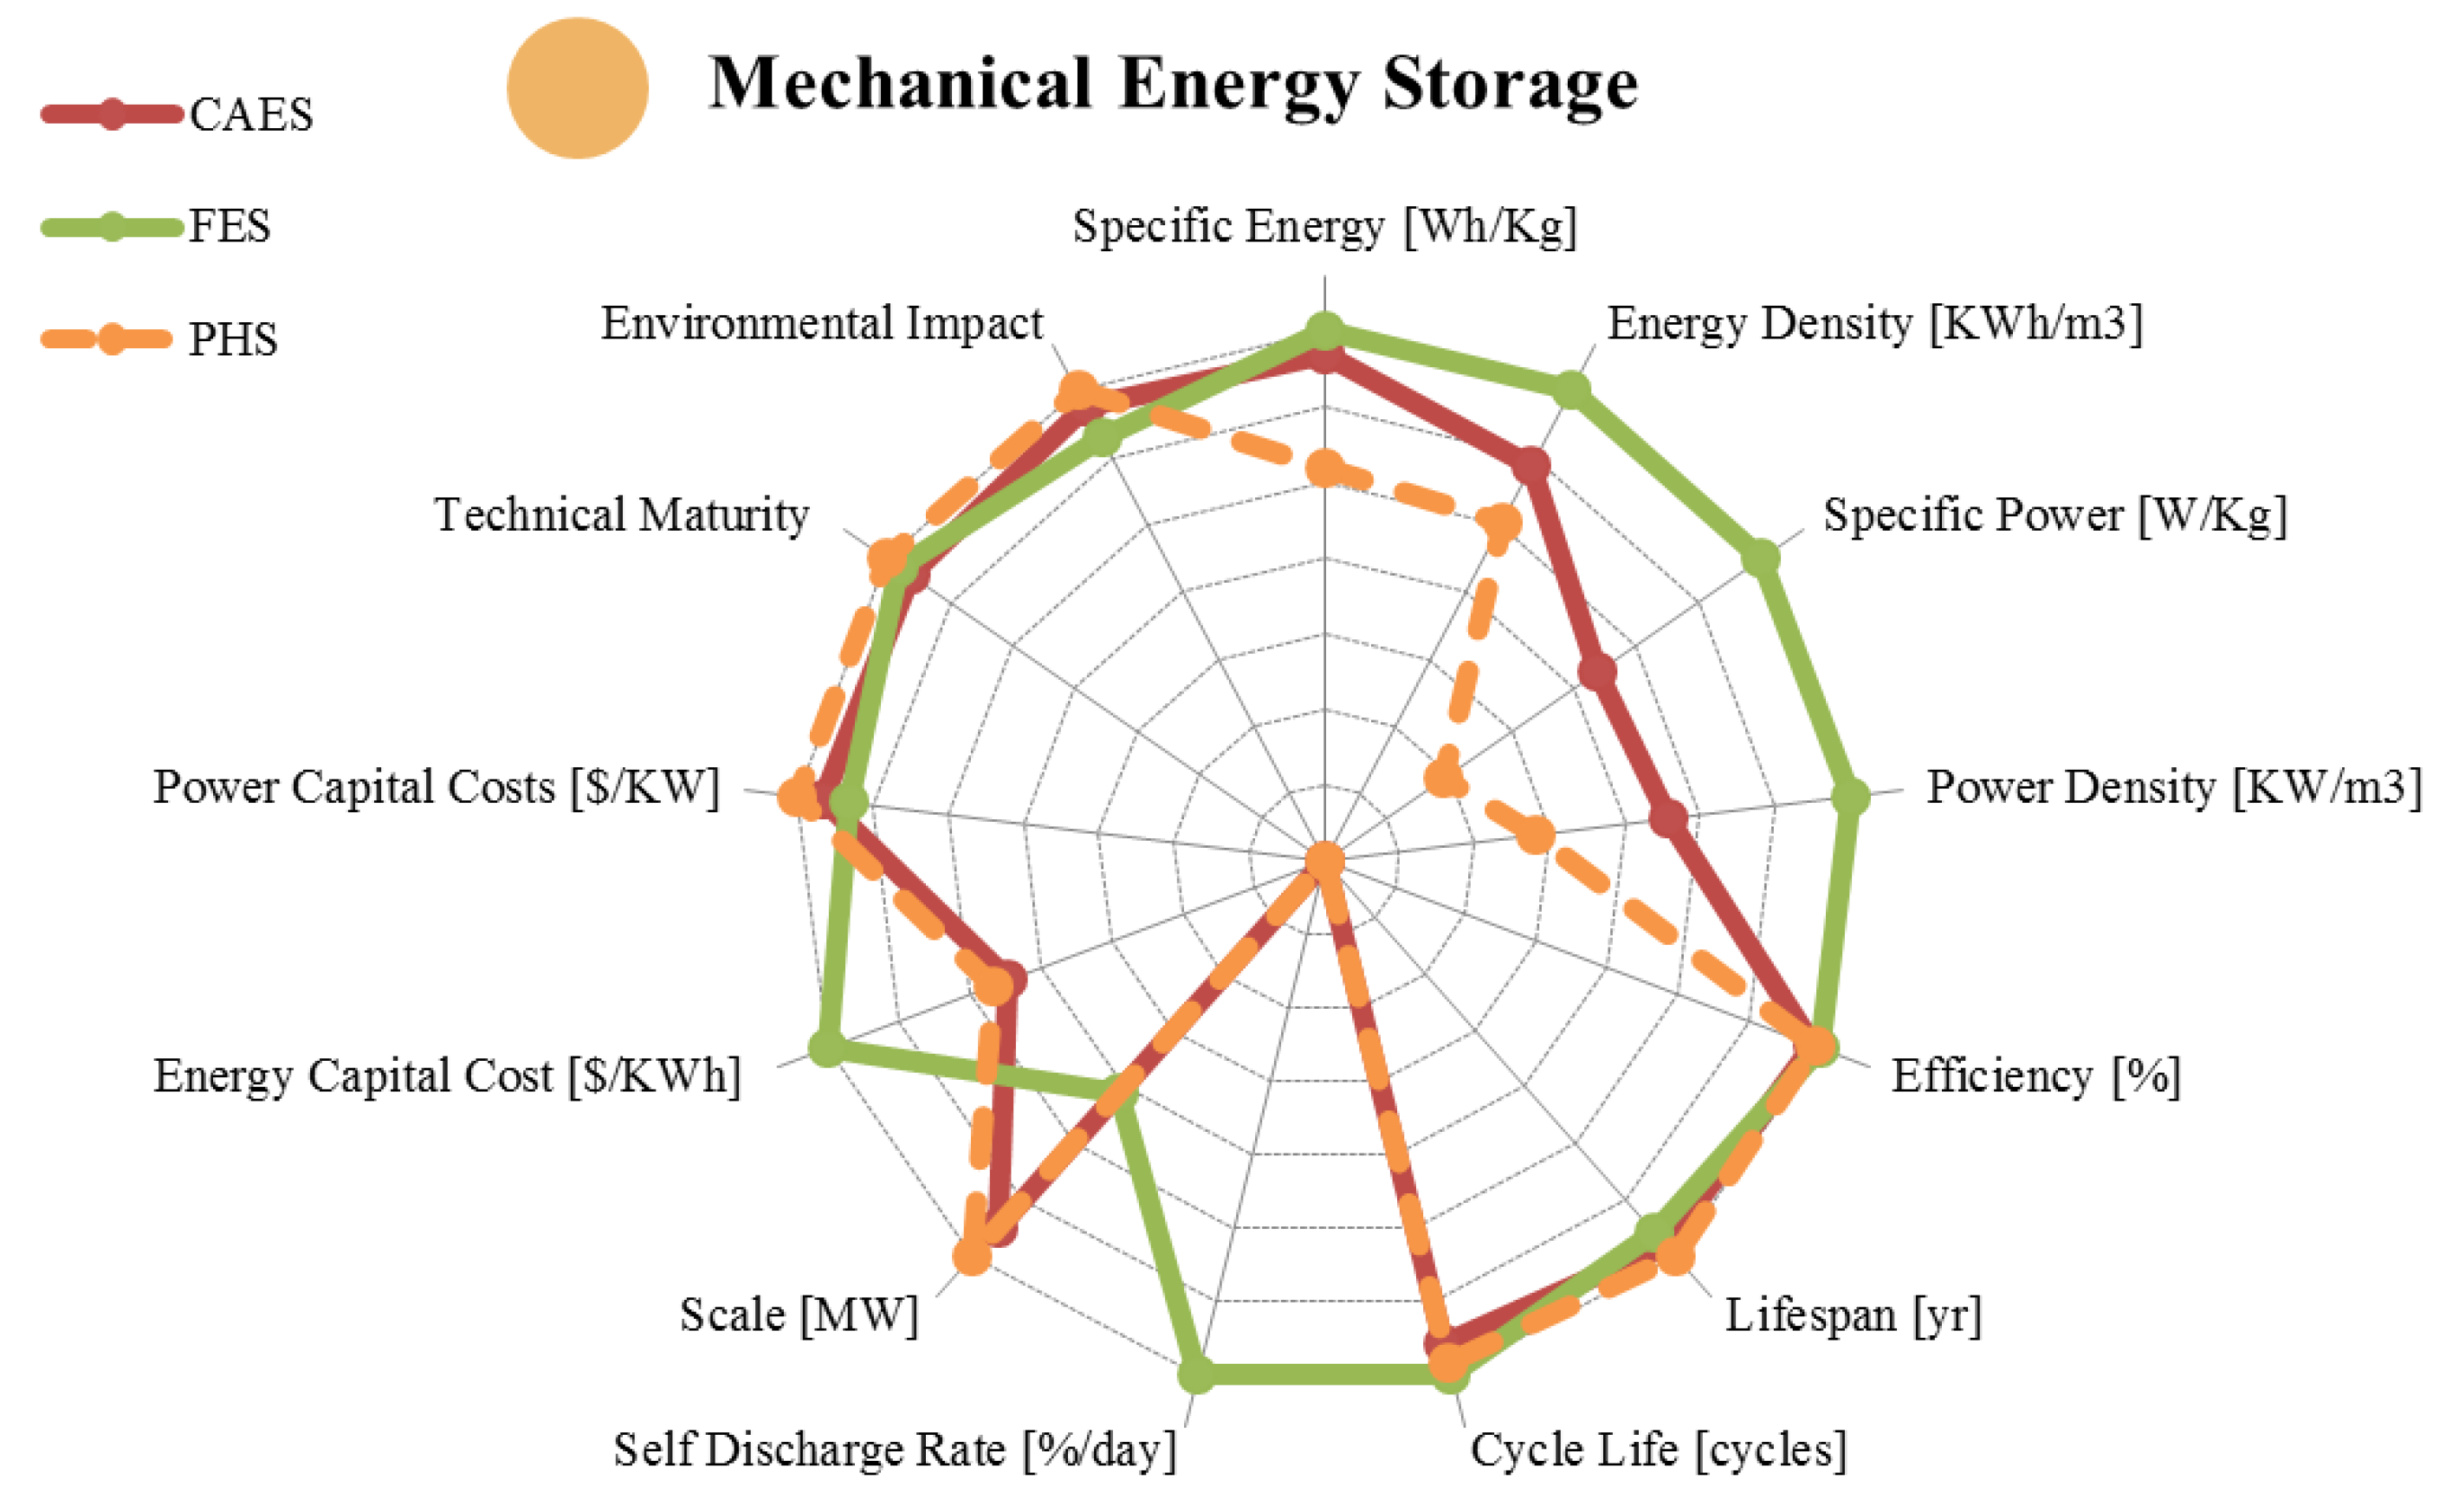
2. Mechanical Energy Storage
| Metric | Pumped Hydro. | Compressed Air | Flywheel | |
|---|---|---|---|---|
| range σ/μ//n | range σ/μ//n | range σ/μ//n | ||
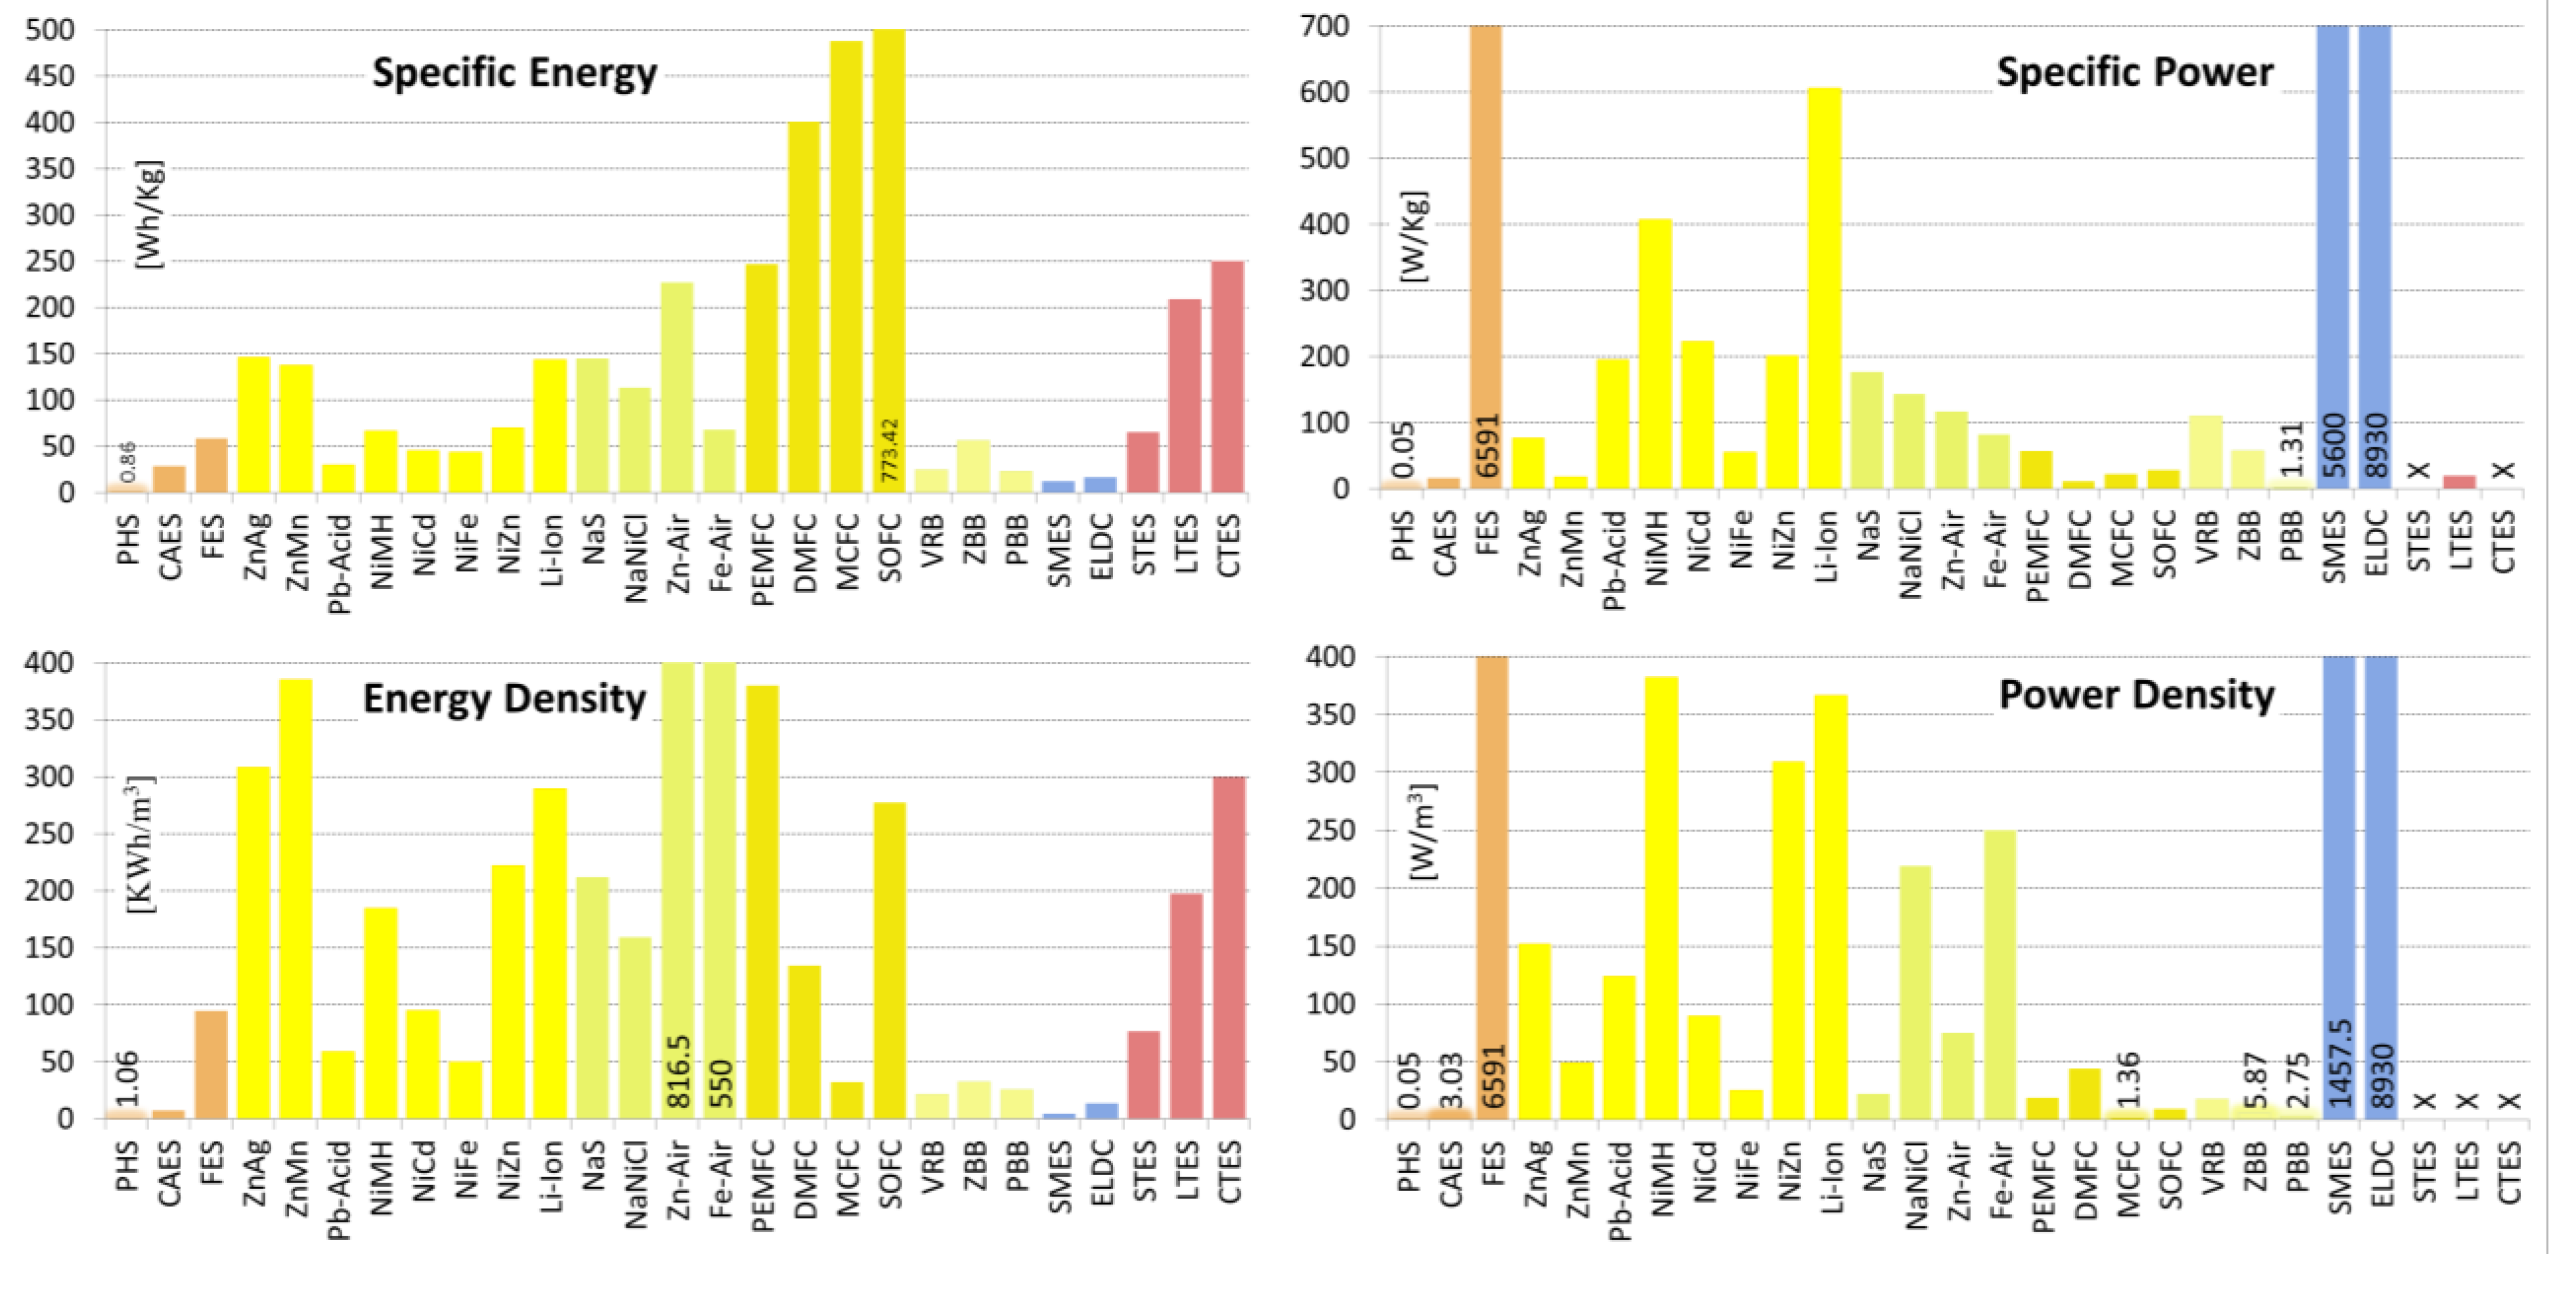
| Specific Energy | [Wh/Kg] | 0.30–1.33 0.48/0.87/0.78/6 | 3.20–60.00 19.89/28.50/30.00/11 | 5.00–200.00 56.94/58.16/30.00/19 |
| Energy Density | [KWh/m3] | 0.50–1.33 0.45/1.07/1.15/6 | 0.40–20.00 6.65/7.19/5.00/9 | 0.25–424.00 137.36/95.16/20.00/12 |
| Specific Power | [W/Kg] | 0.01–0.12 0.05/0.05/0.04/4 | 2.20–24.0 12.10/16.13/22.20/3 | 400.00–30,000.00 8,631/6,592/3,250/12 |
| Power Density | [KW/m3] | 0.01–0.12 0.05/0.05/0.04/4 | 0.04–10.00 3.81/3.03/1.90/7 | 40.00–2,000.00 814.40/816.29/707.00/7 |
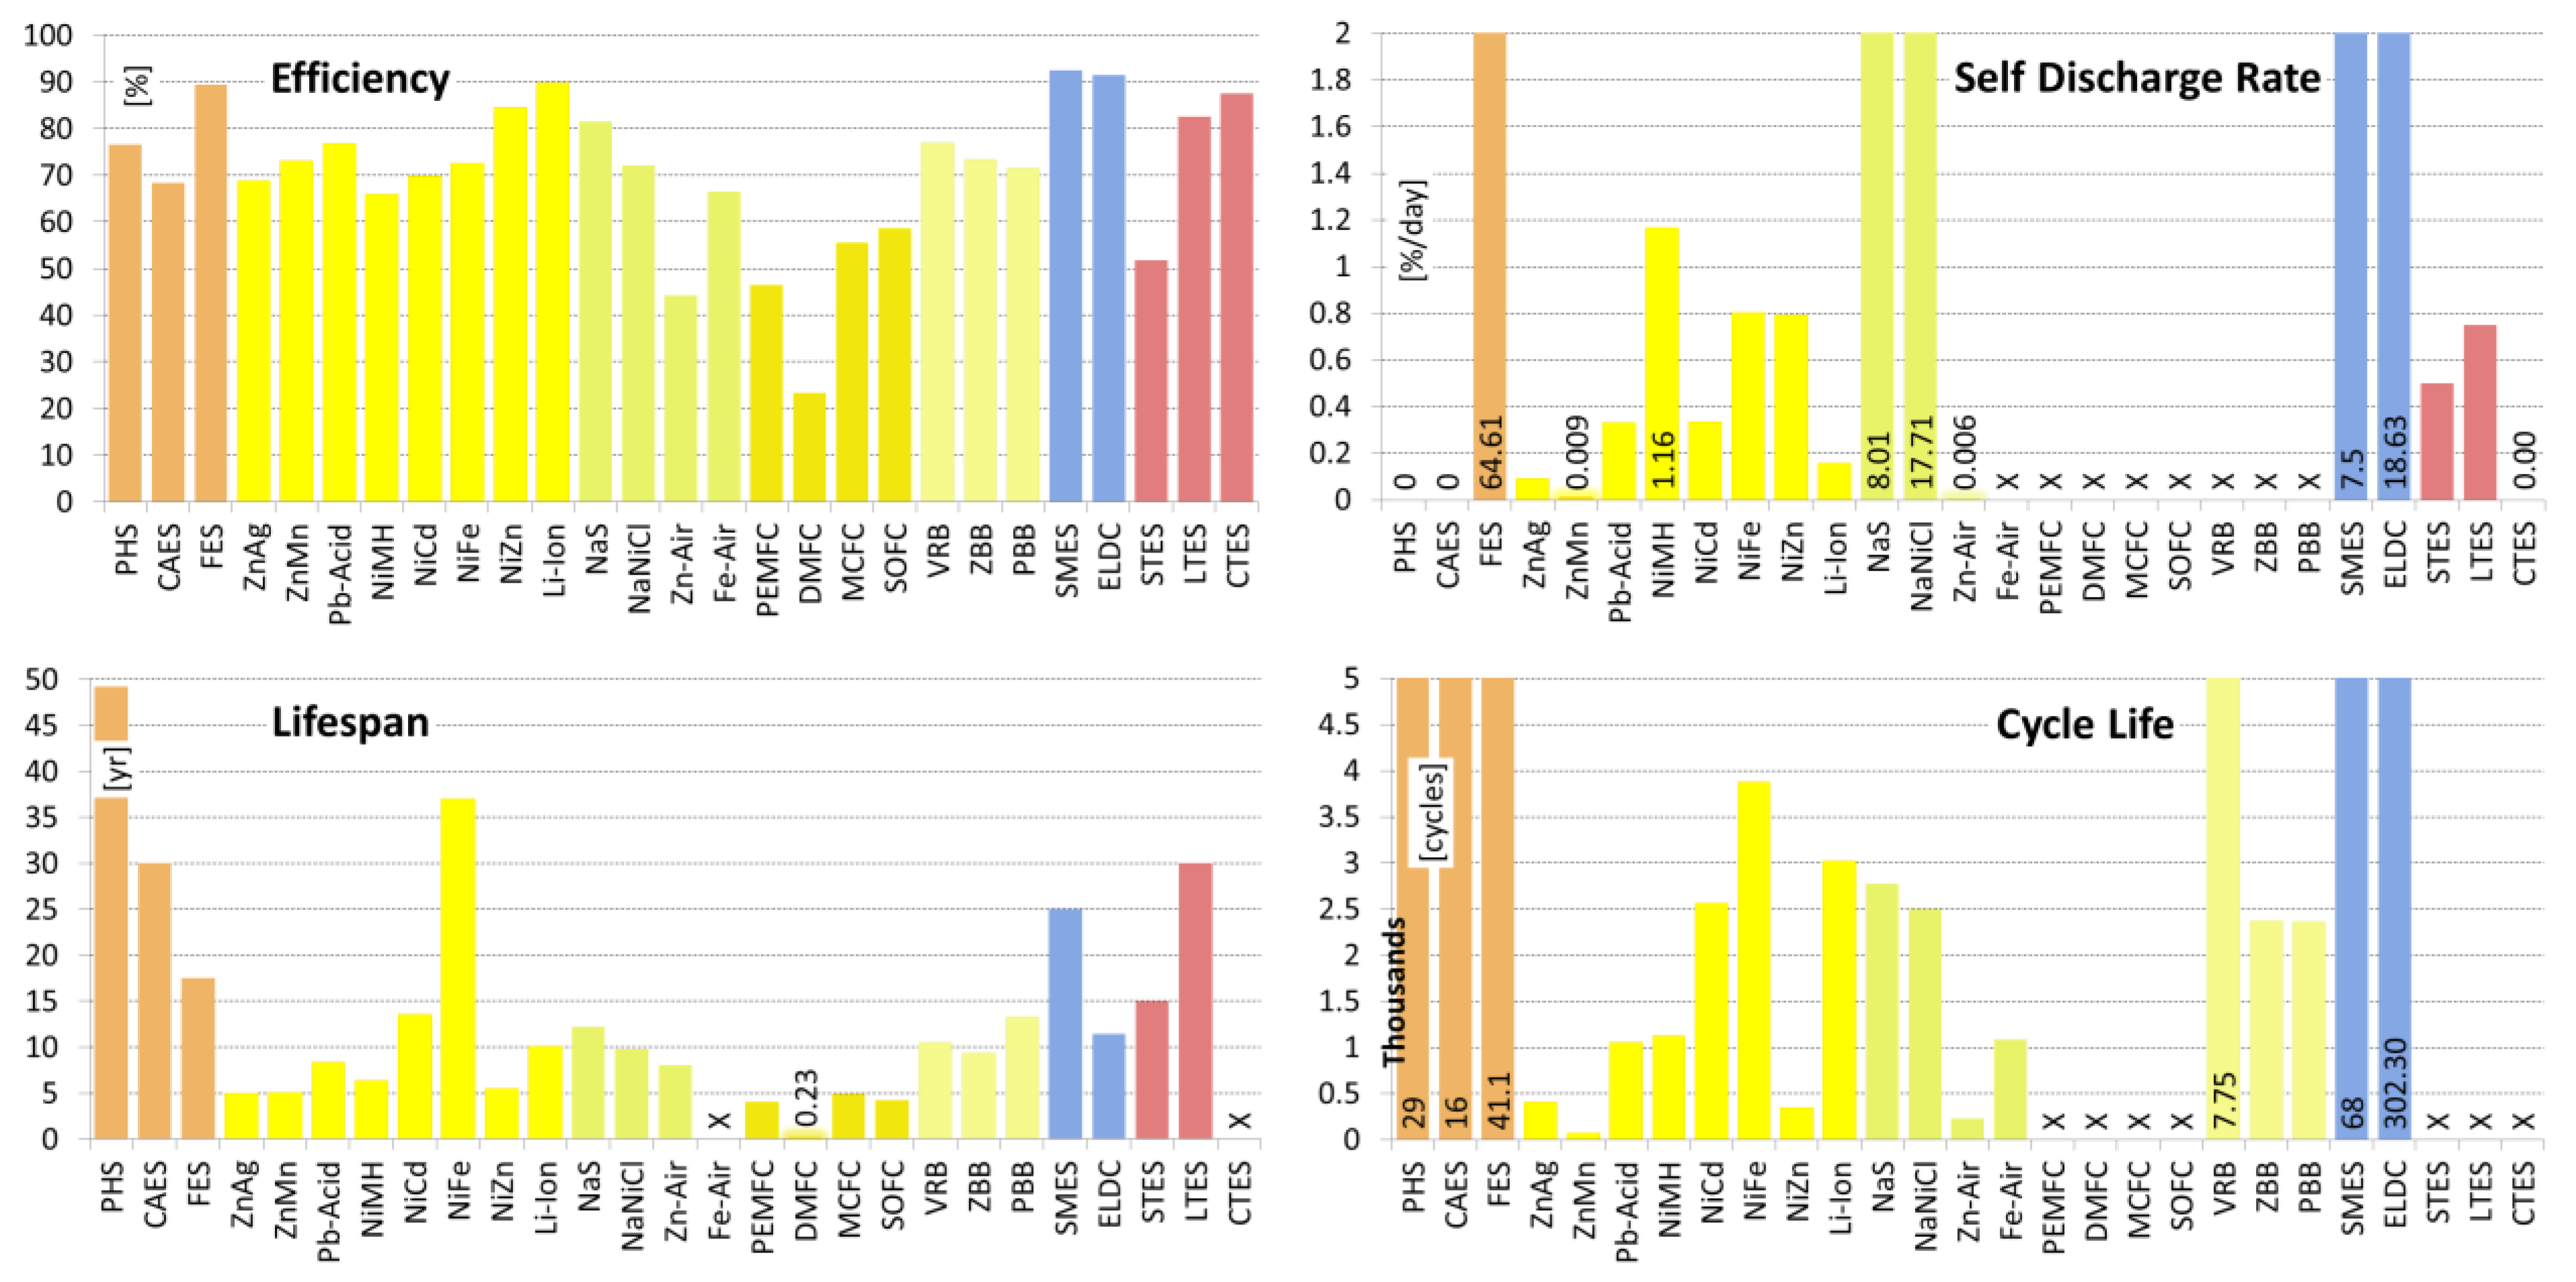
| Efficiency | [%] | 65.00–87.00 7.13/76.59/80.00/17 | 57.00–89.00 12.28/68.30/70.00/23 | 70.00–96.00 6.31/89.36/90.00/22 |
| Lifespan | [yr] | 20.00–80.00 23.14/49.20/45.00/12 | 20.00–40.00 8.66/30.00/30.00/9 | 15.00–20.00 2.89/17.50/17.50/4 |
| Cycle Life | [cycles] | 10,000–60,000 19,070/29,000/20,000/7 | 8,000–30,000 9,712/16,000/12,000/7 | 10,000–100,000 35,667/41,100/20,500/10 |
| Self-Discharge Rate | [%/day] | 0.00 0.00/0.00/0.00/5 | 0.00 0.00/0.00/0.00/4 | 24.00–100.00 39.92/64.61/72.00/7 |
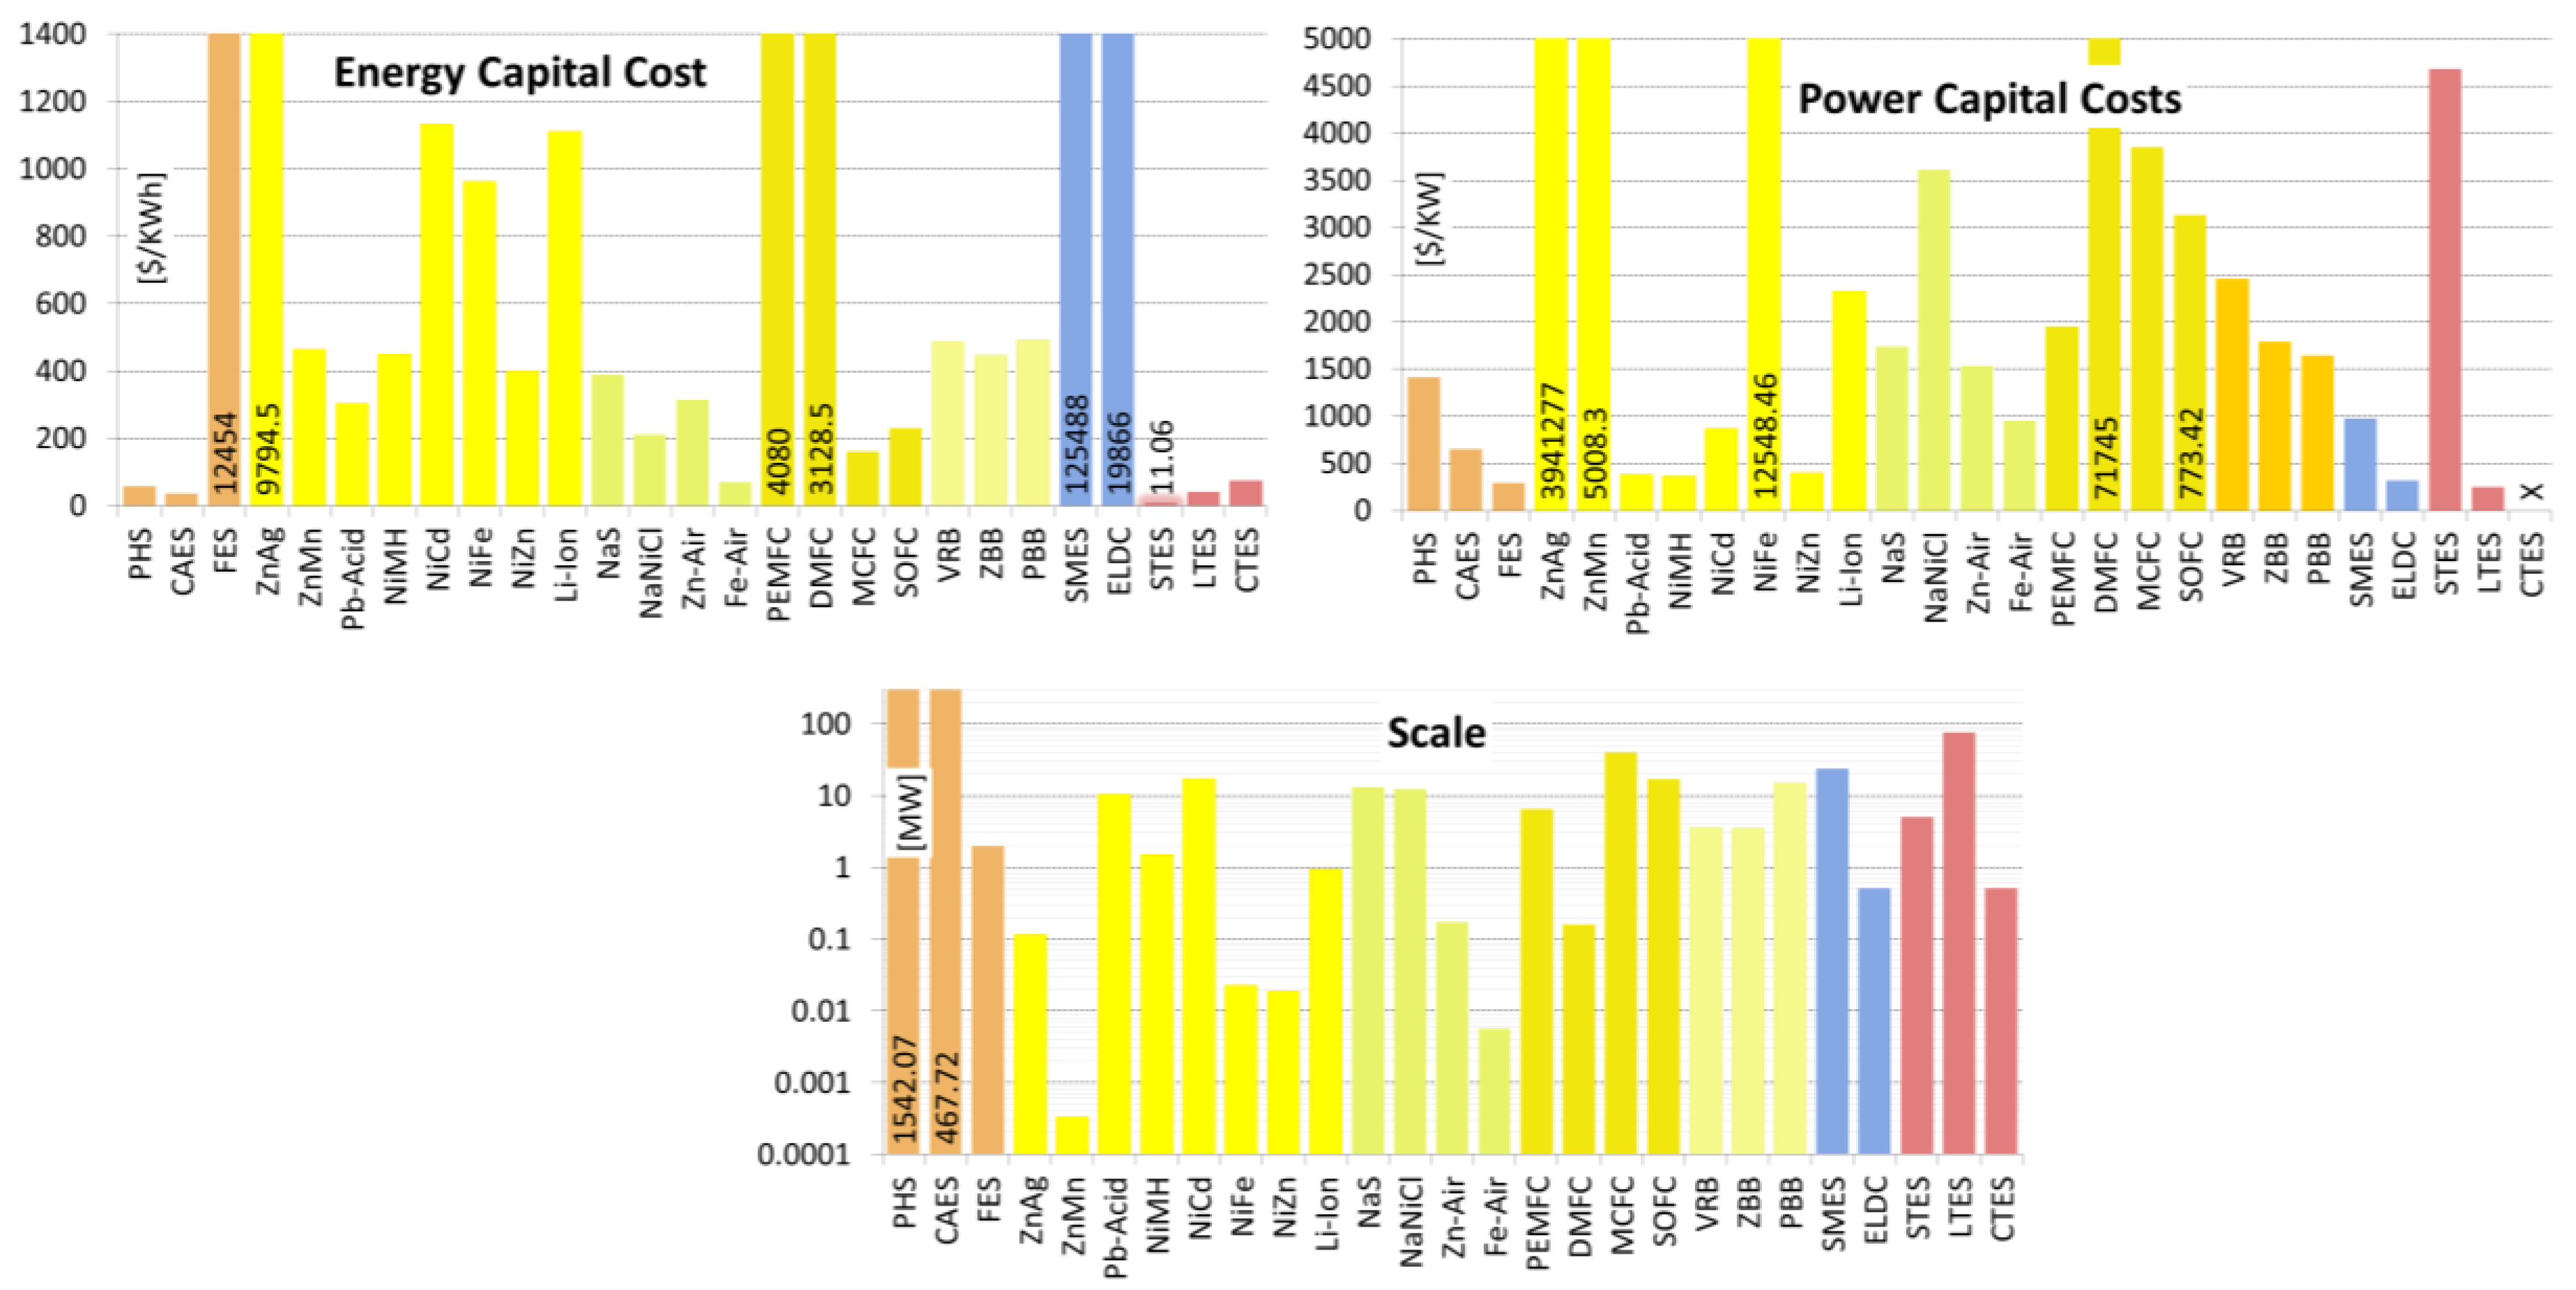
| Scale | [MW] | 10.00–8,000.00 1,998/1,542/800/28 | 0.01–3,000.00 792.14/467.72/150/33 | 0.001–10.00 4.62/1.96/0.20/25 |
| Energy Capital Cost | [US$/KWh] | 1.00–291.20 66.51/57.94/33.00/19 | 1.00–140.00 41.41/35.67/11.88/18 | 200.00–150,000.00 31,071/12,454/900/26 |
| Power Capital Cost | [US$/KW] | 300.00–5,288.00 1,133/1,414/1,000/25 | 400.00–2,250.00 412.19/649.55/500/21 | 30.28–700.00 149.29/296.14/290.0/16 |
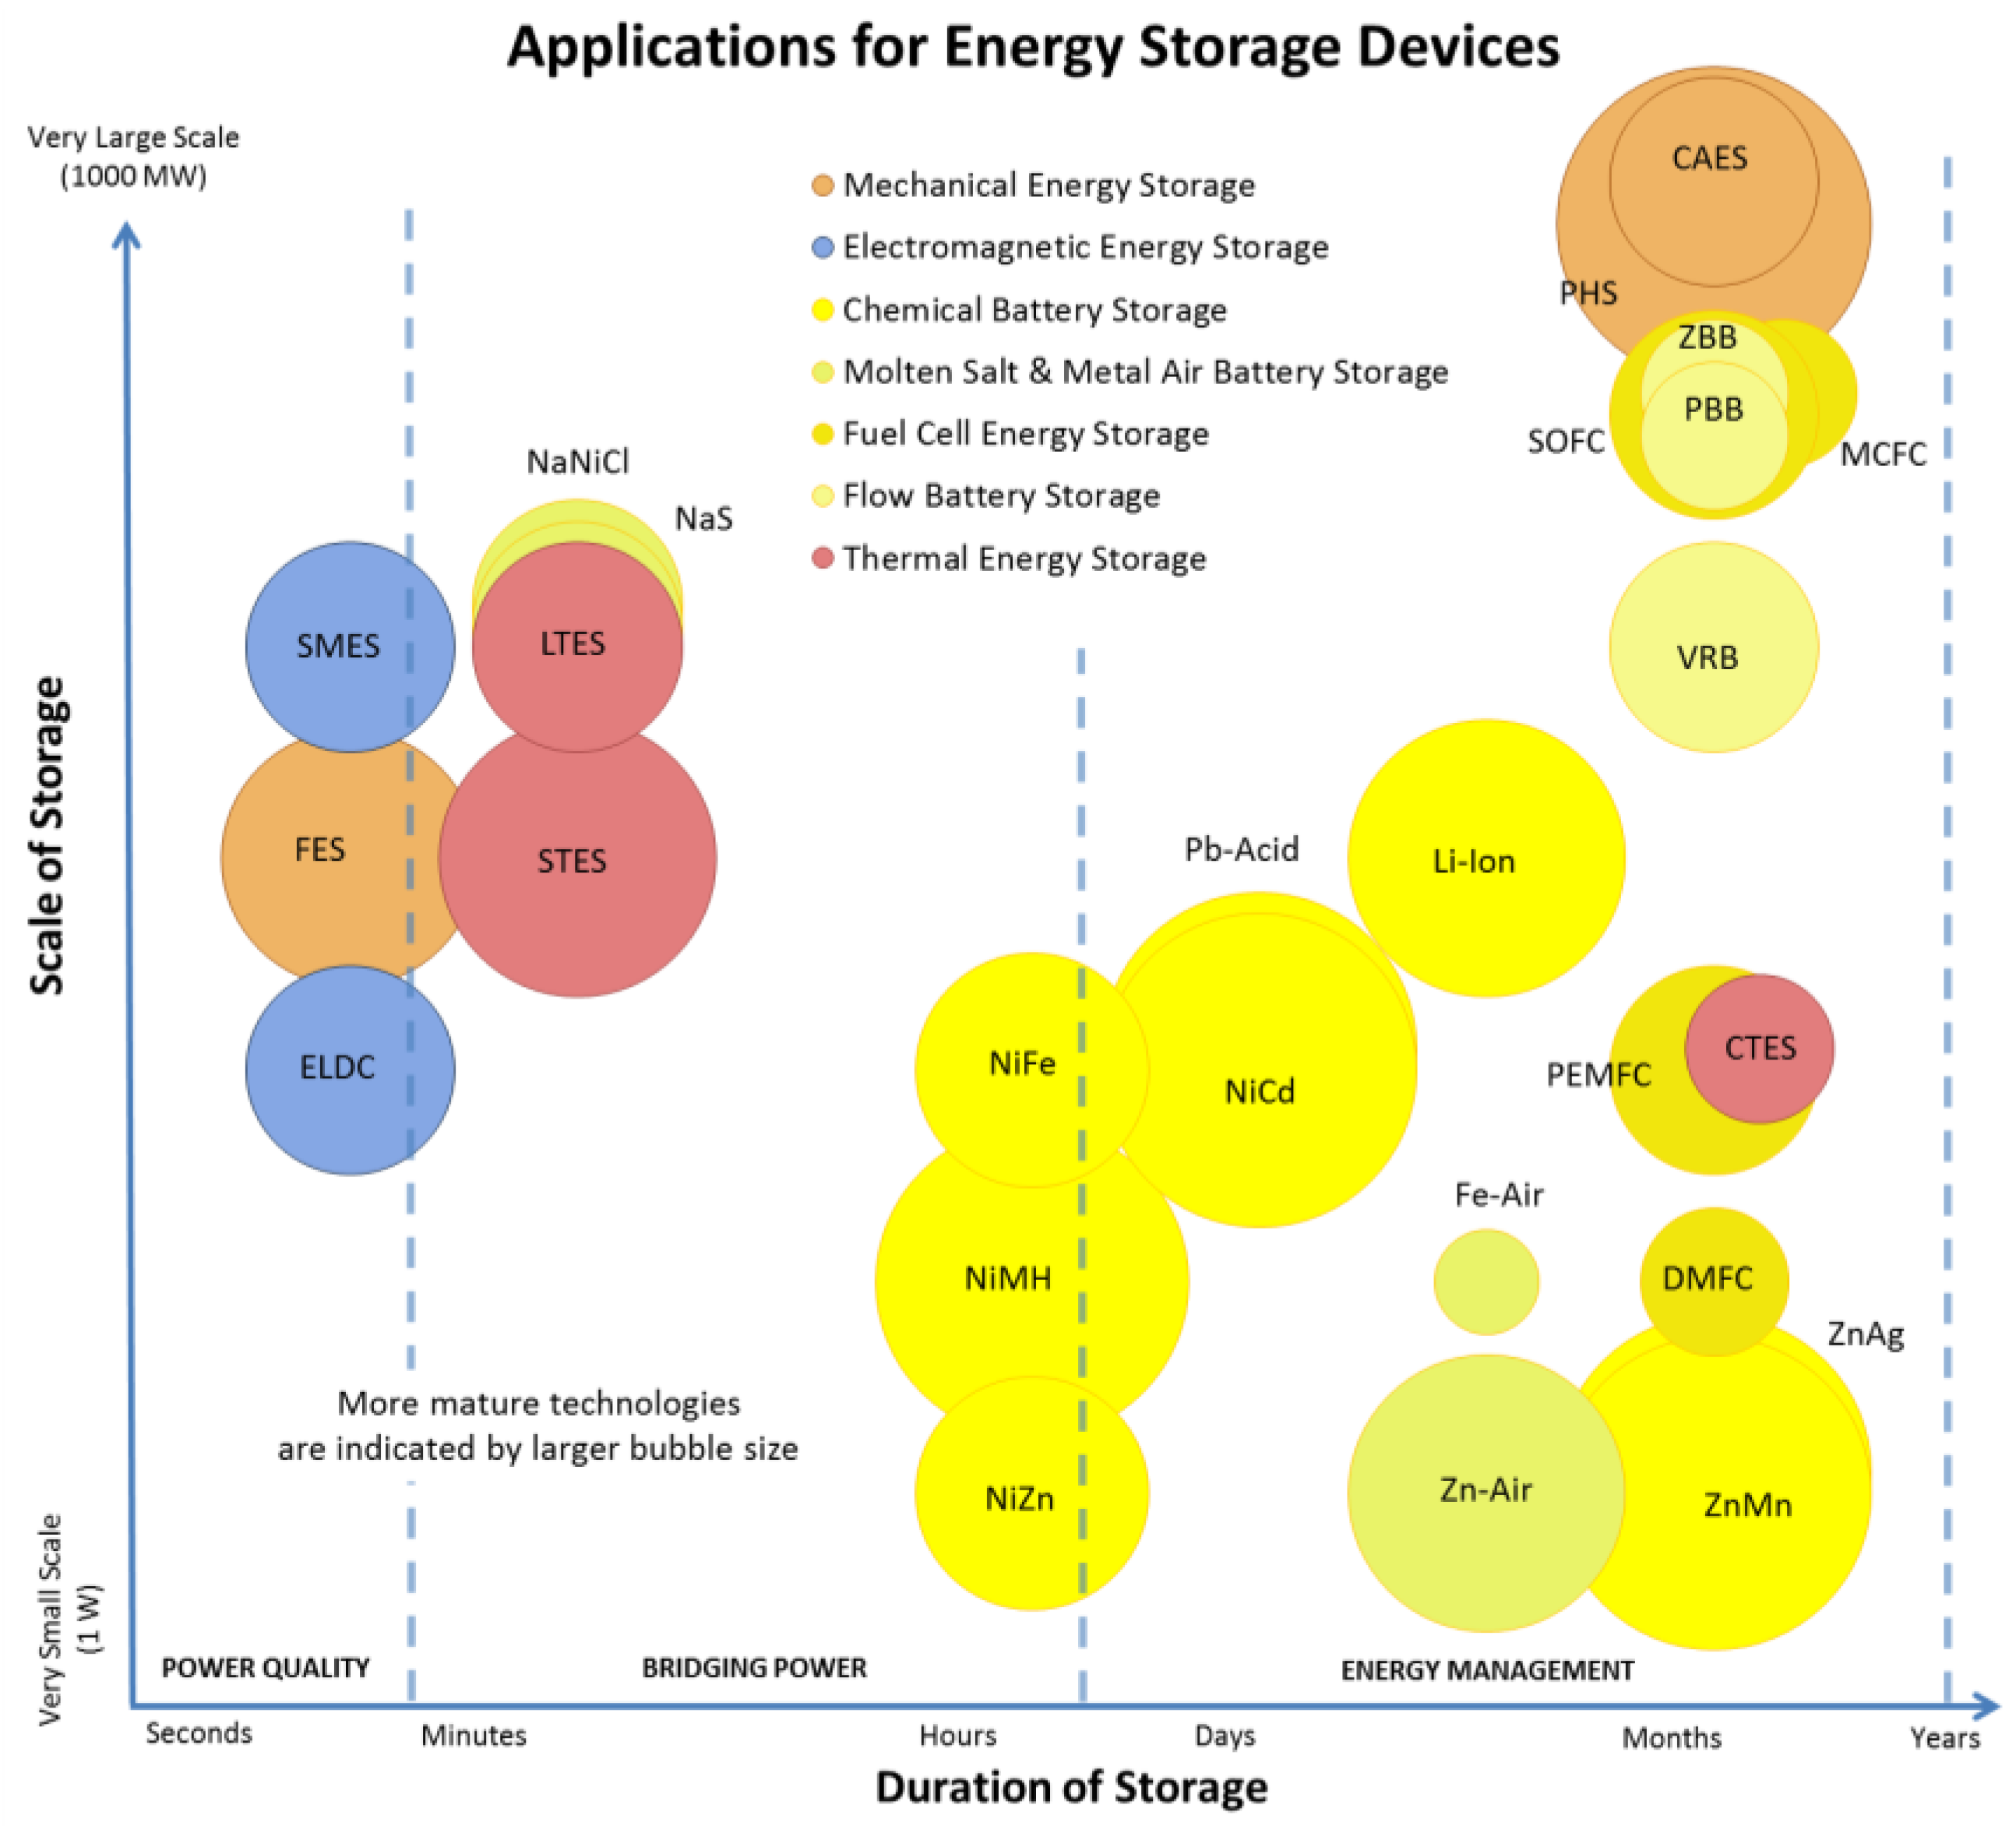
| Application | Very Large Scale Energy Management | Very Large Scale Energy Management | Medium Scale Power Quality | |
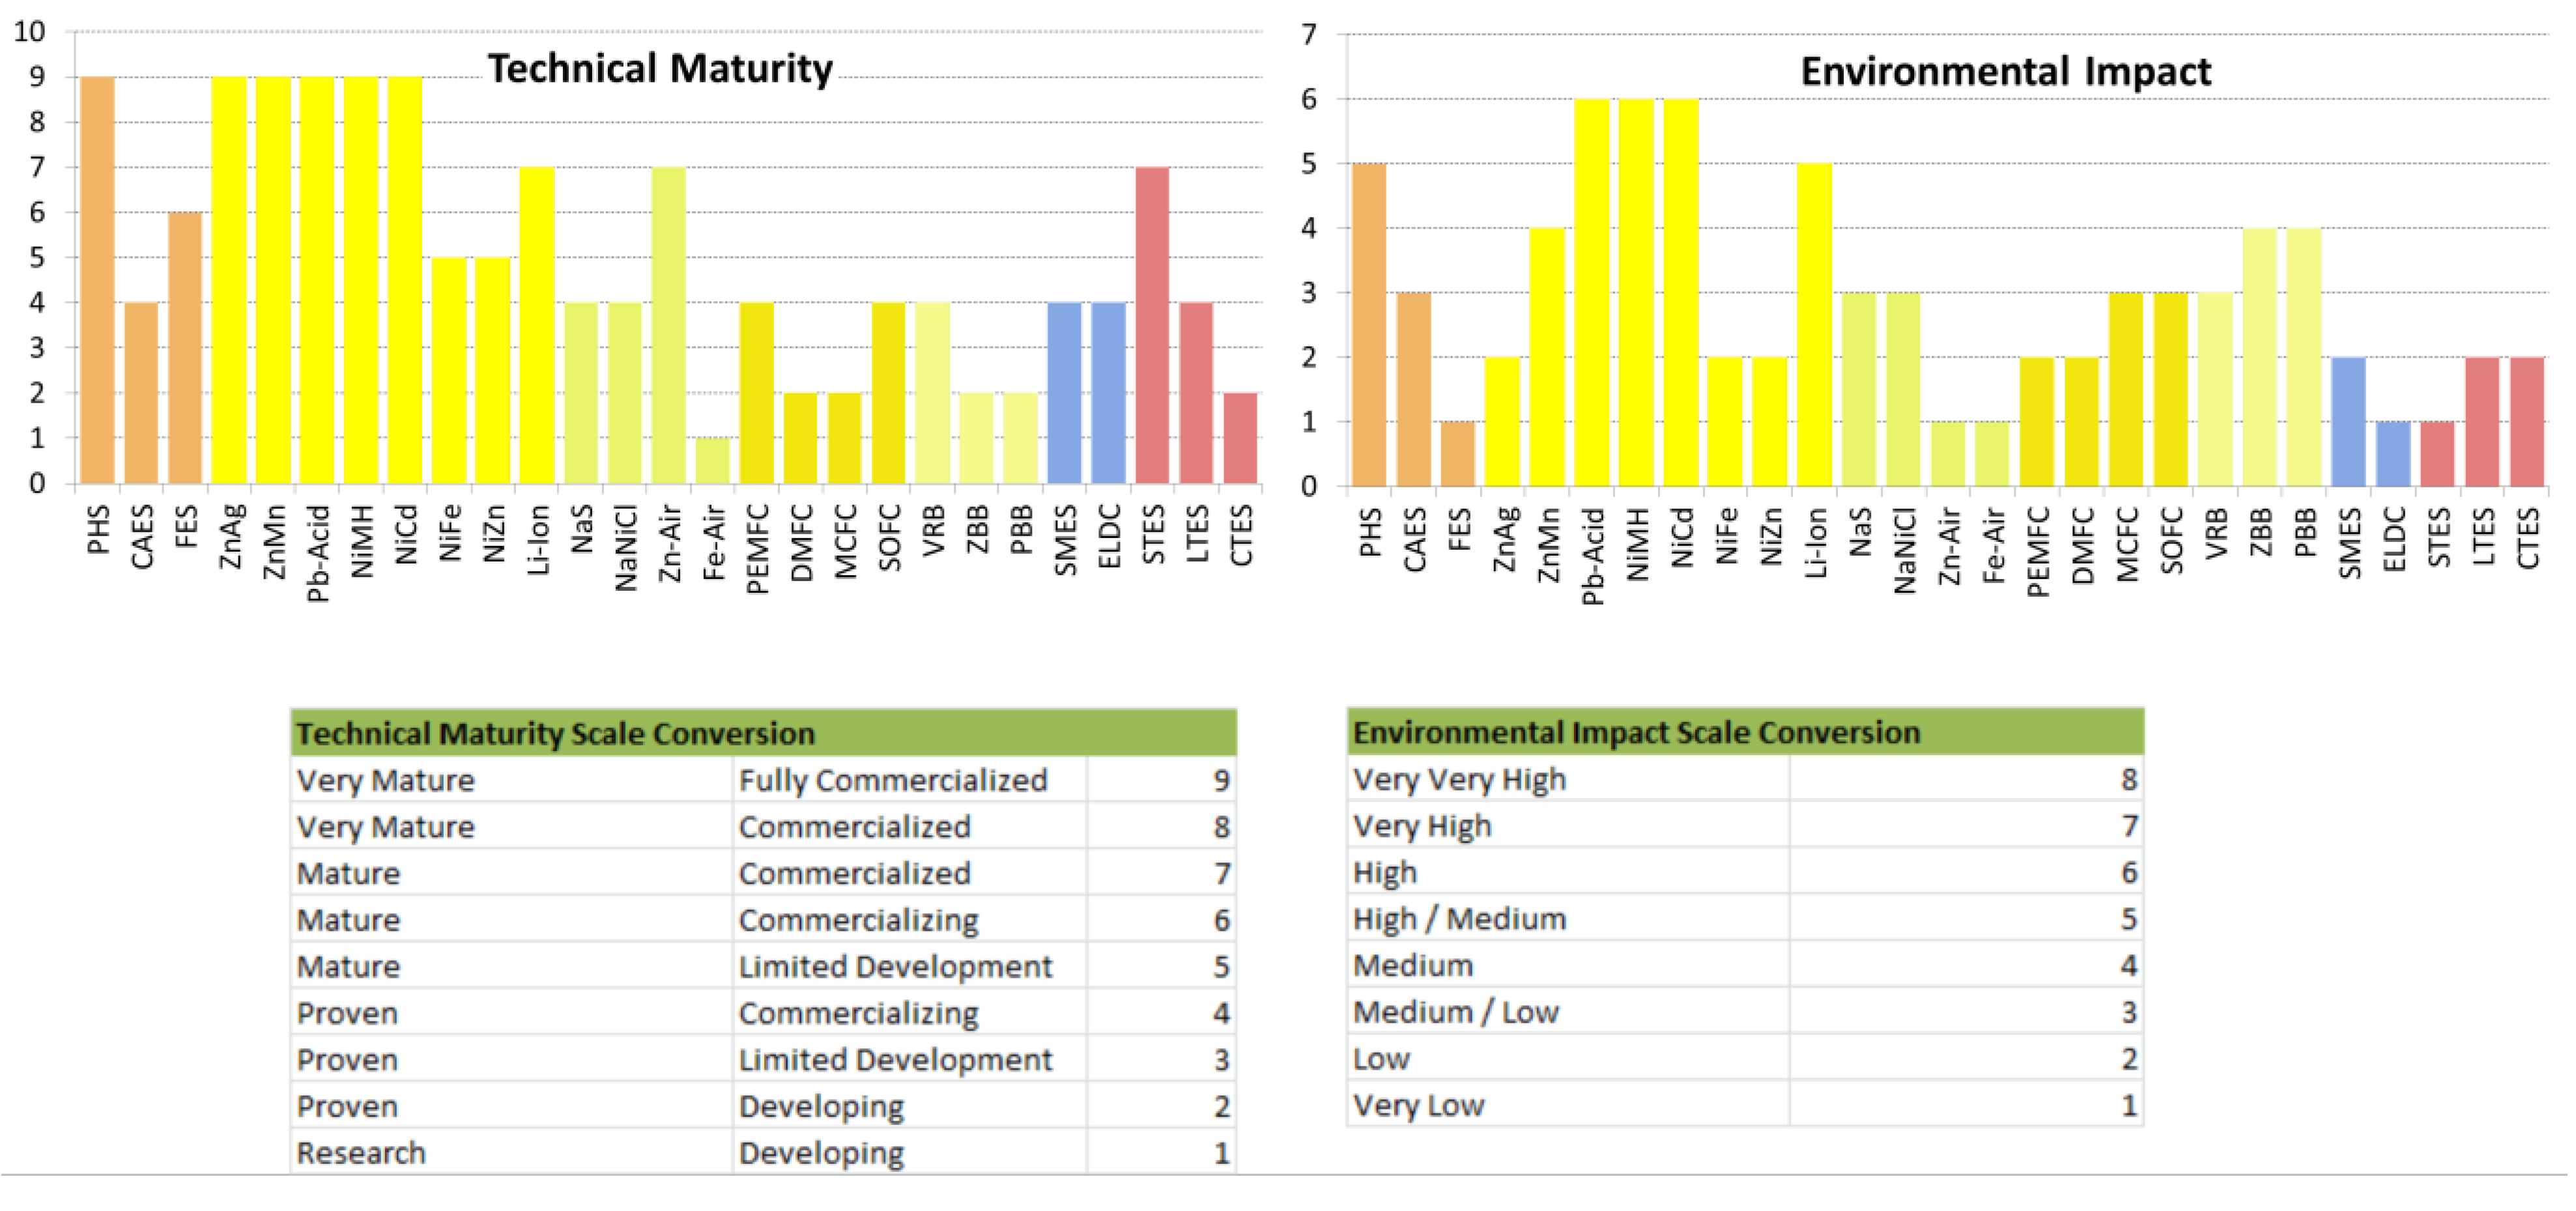
| Technical Maturity | Very Mature/ Fully Commercialized | Proven/Commercializing | Mature/Commercializing | |
| Environmental Impact | High/Medium | Medium/Low | Very Low | |

2.1. Pumped Hydroelectric Energy Storage (PHS)
2.2. Compressed Air Energy Storage (CAES)
2.3. Flywheel Energy Storage (FES)
2.4. Final Remarks
3. Chemical Energy Storage
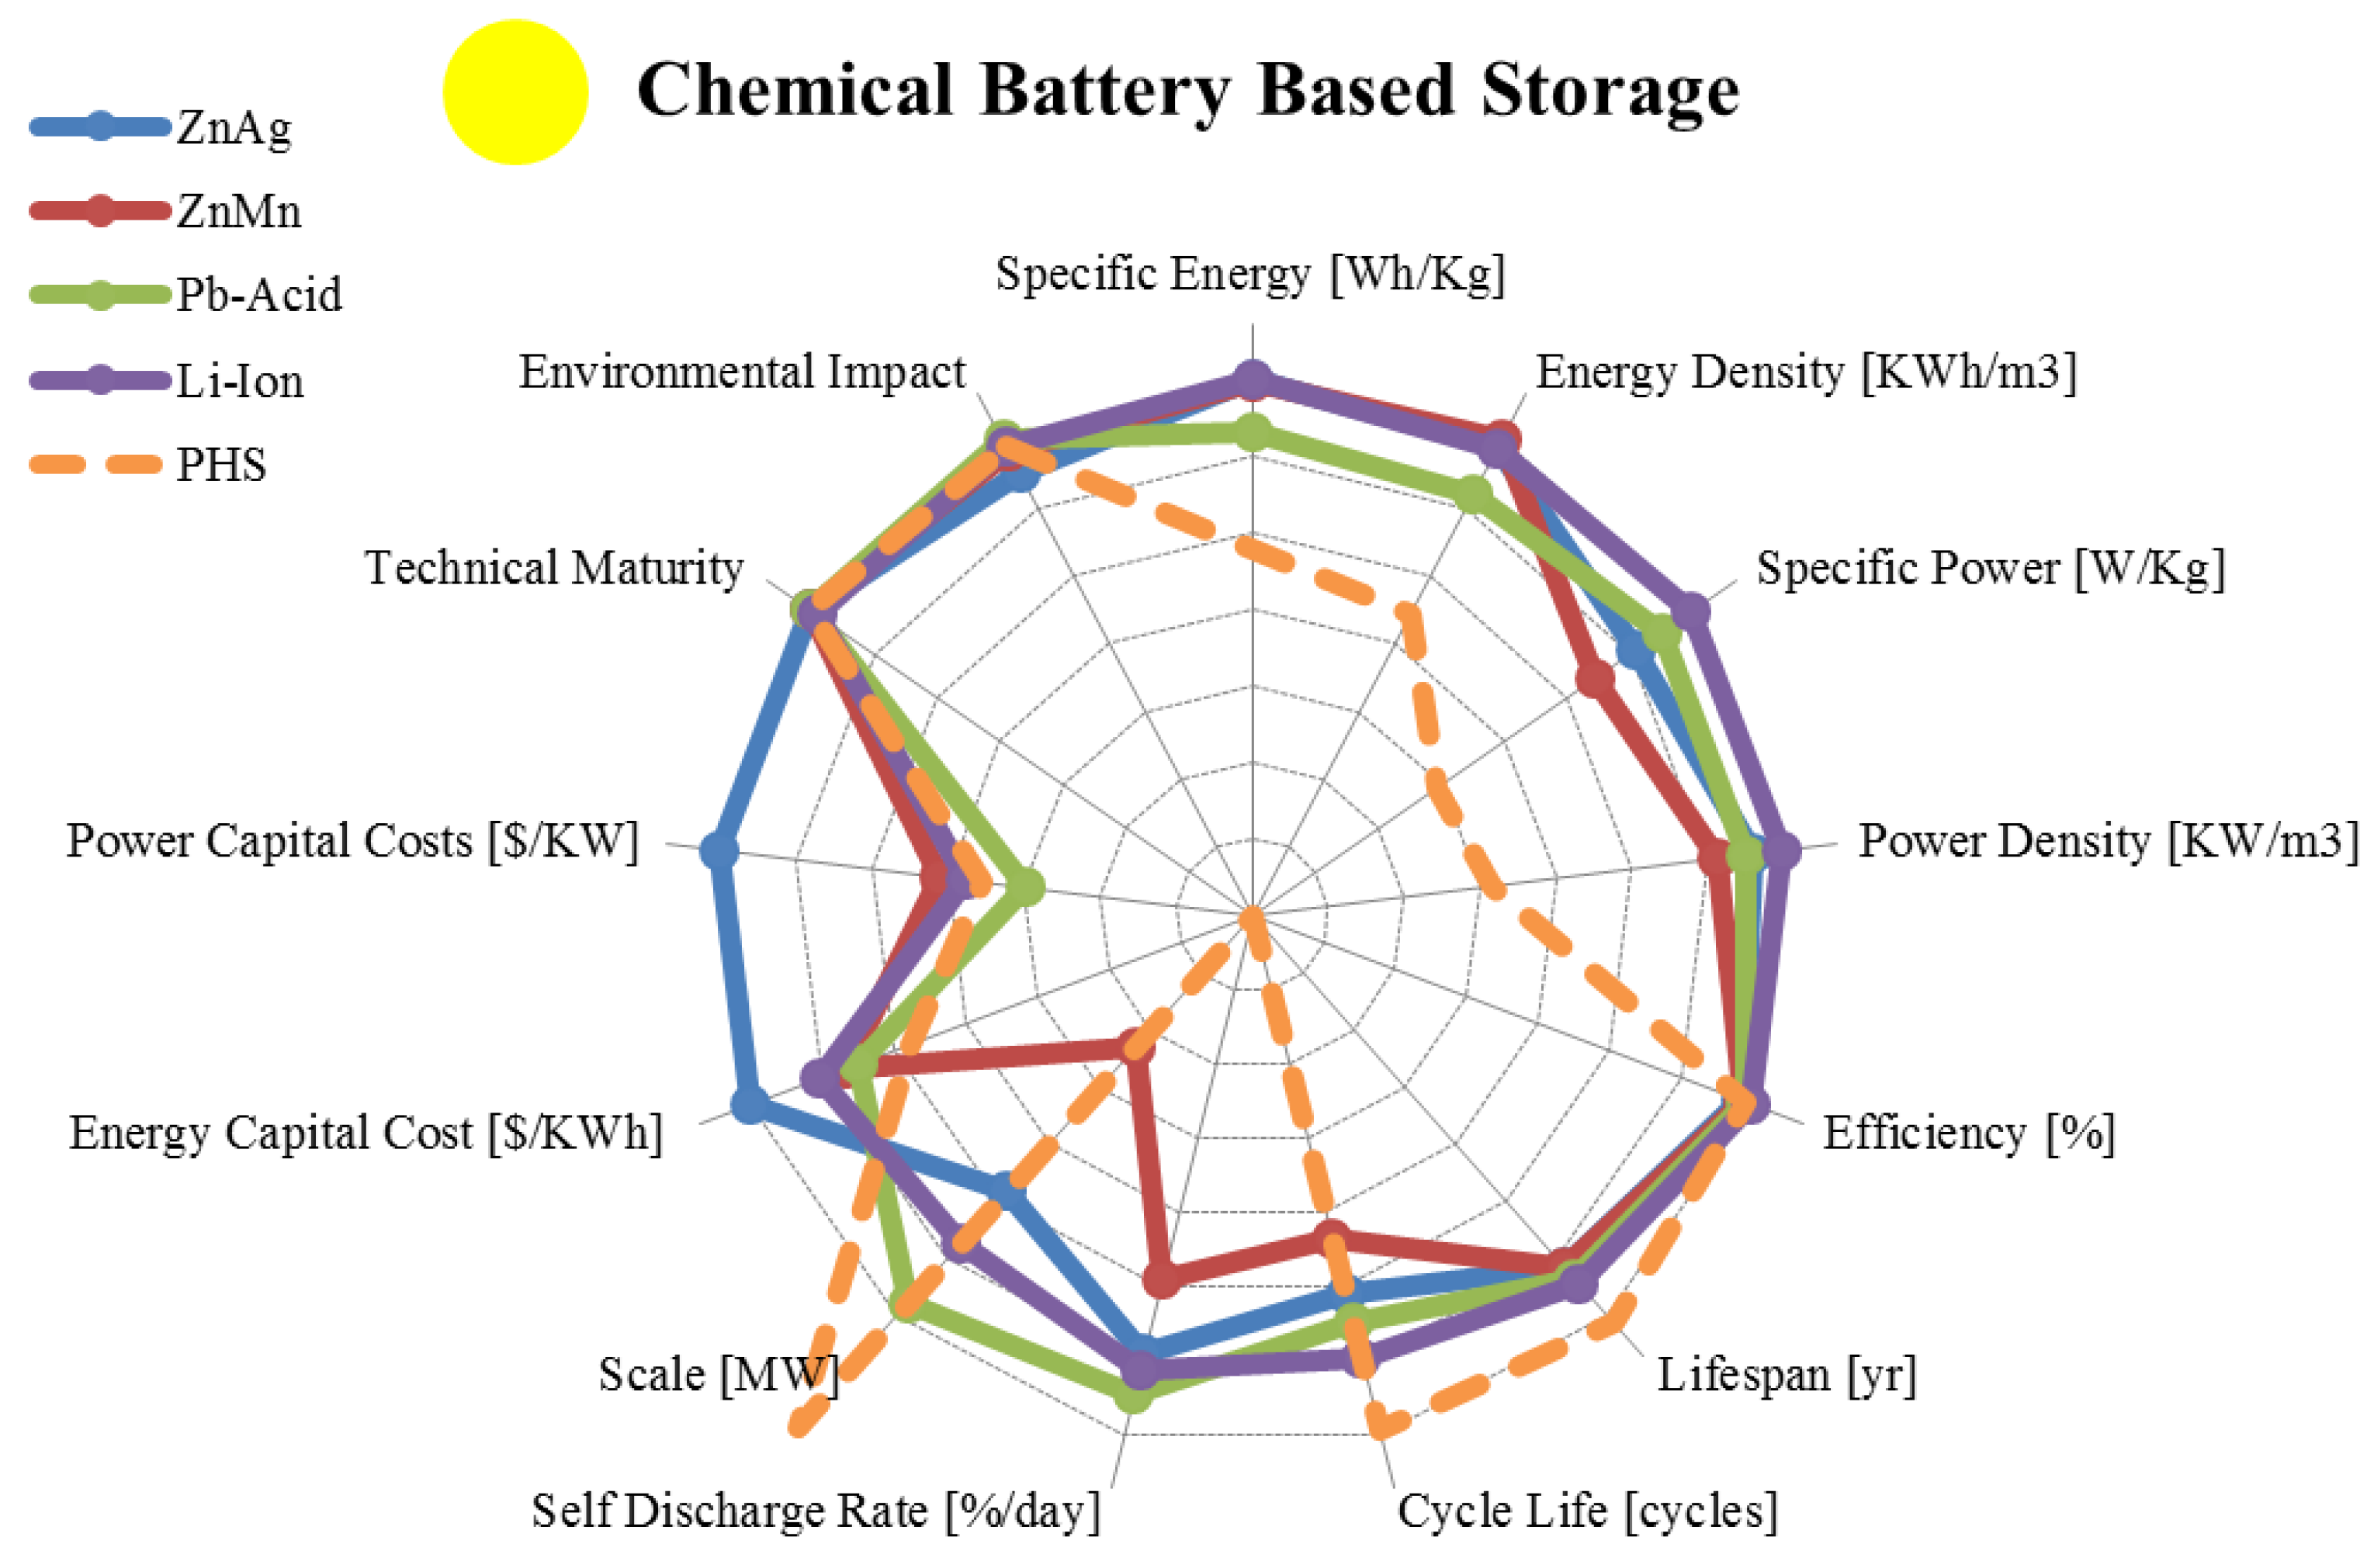
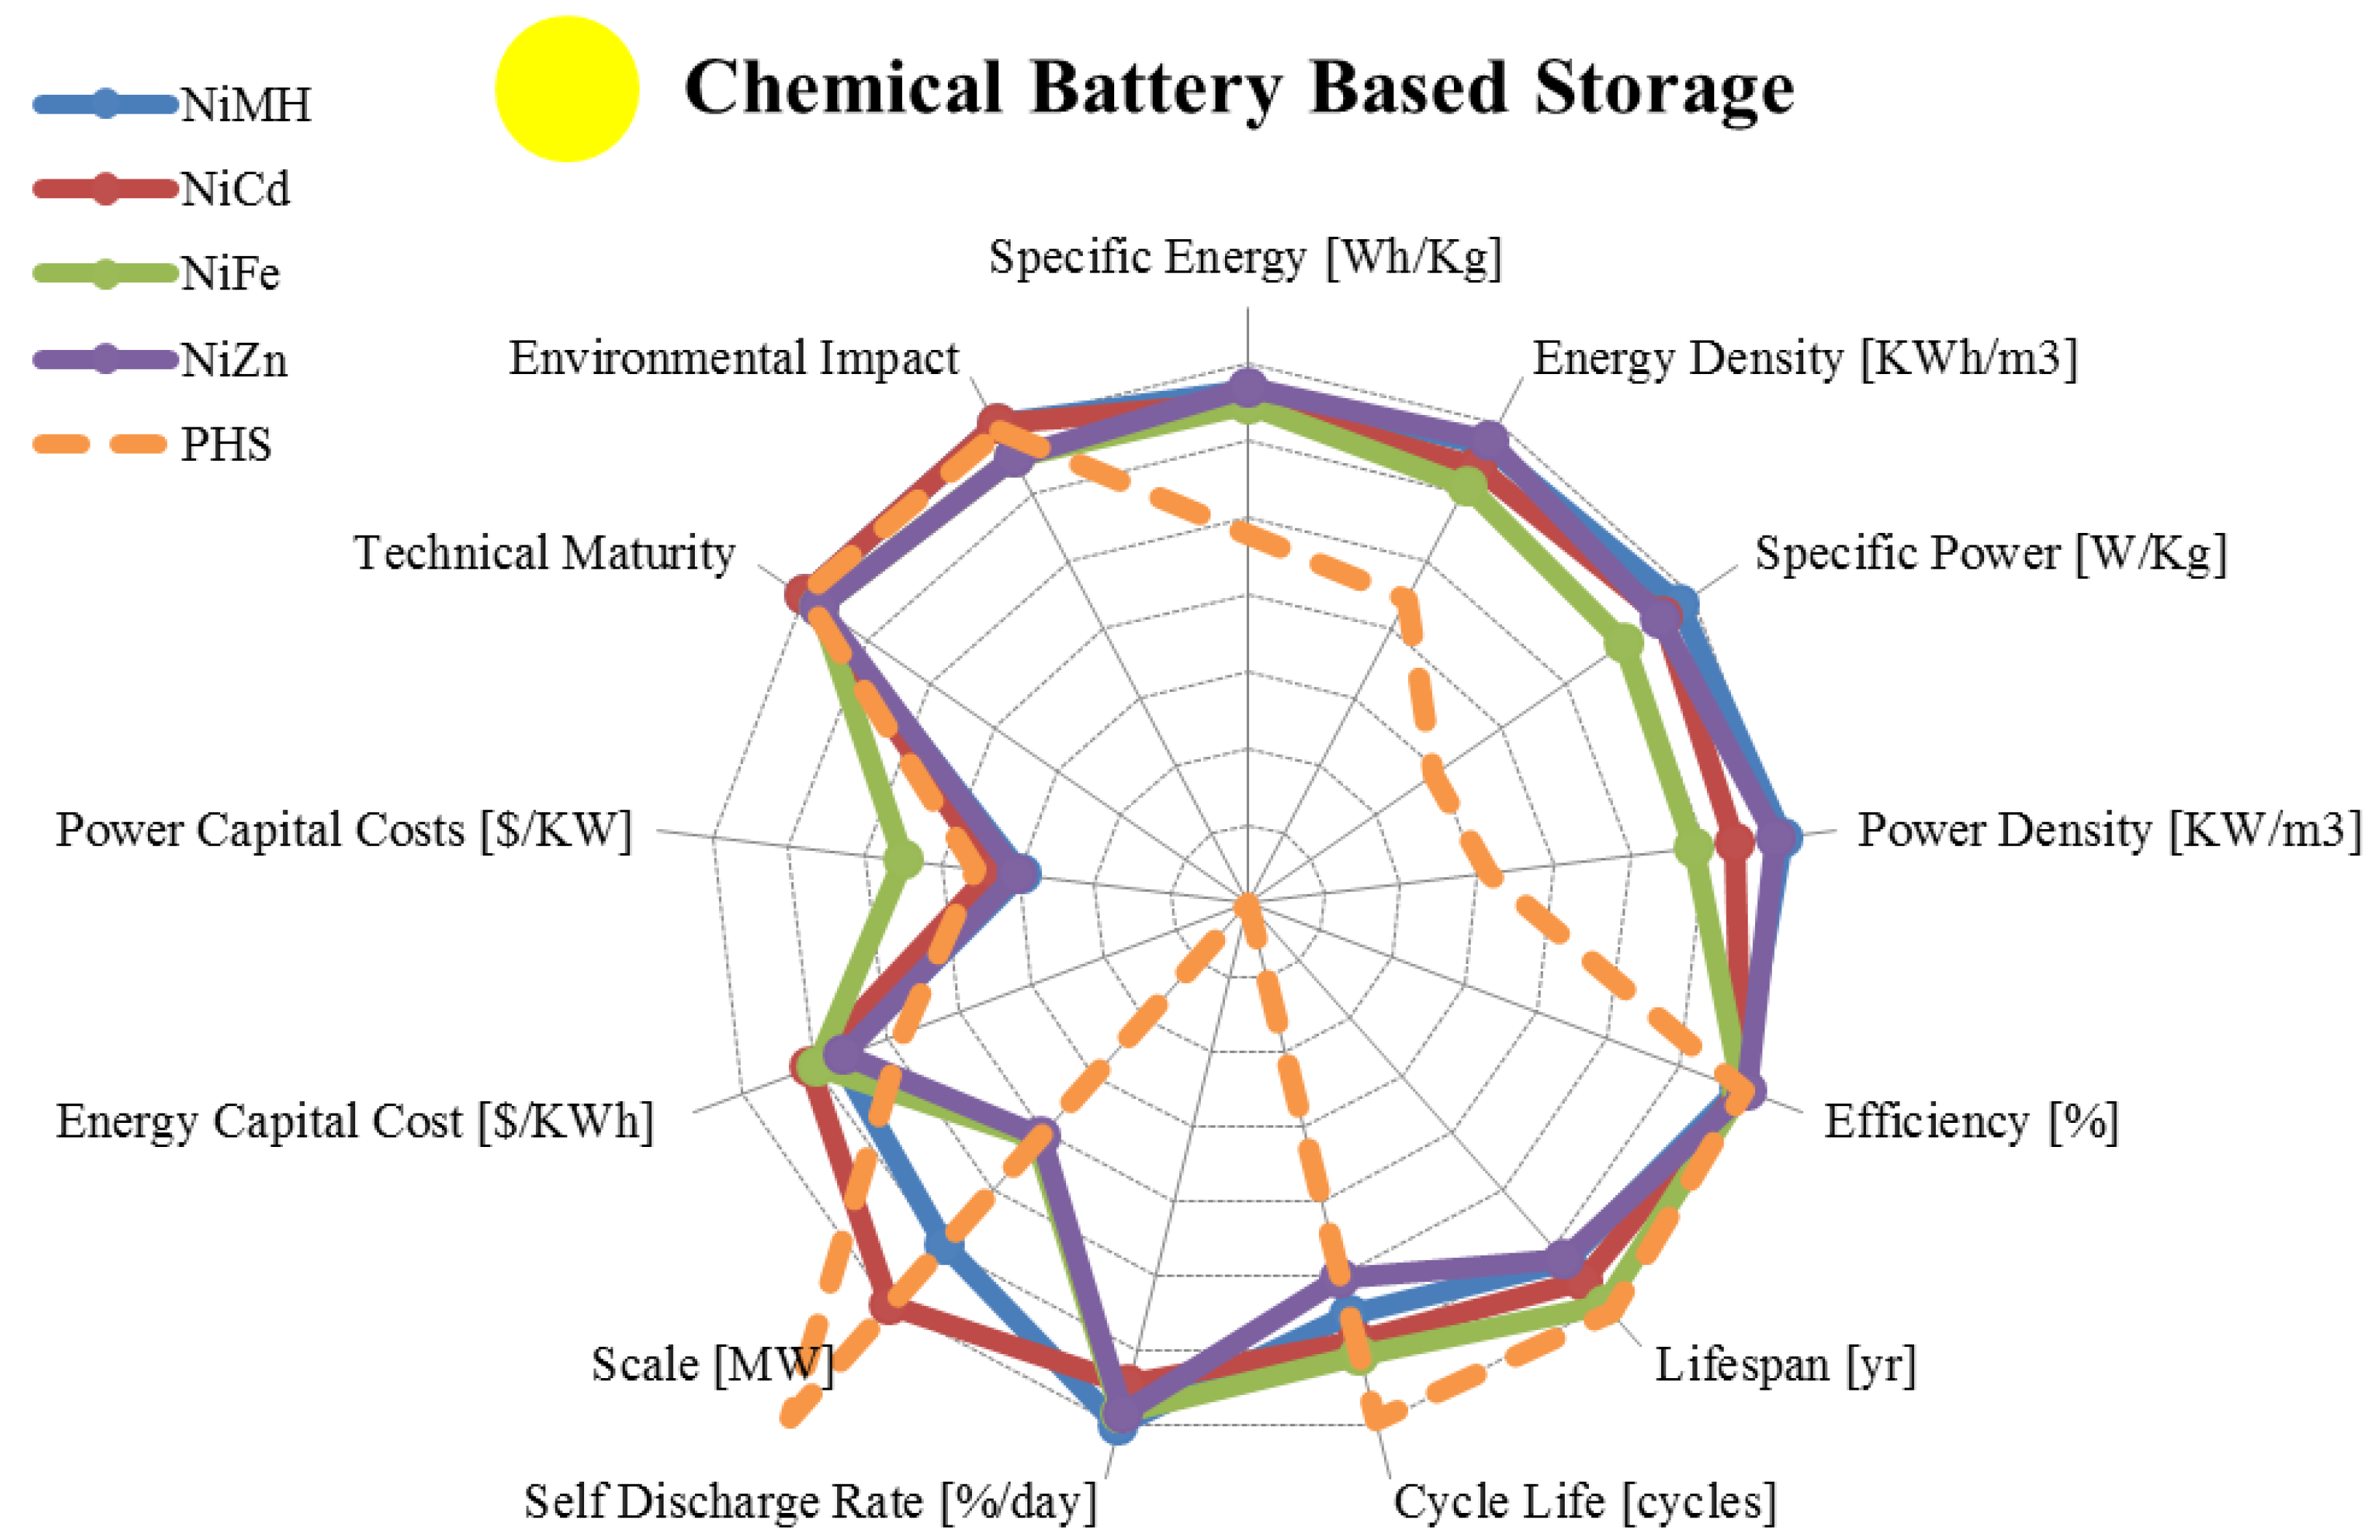
3.1. Typical Batteries
| Metric | Zinc Silver Oxide | Alkaline | Lead Acid | Lithium Ion | |
|---|---|---|---|---|---|
| range σ/μ//n | range σ/μ//n | range σ/μ//n | range σ/μ//n | ||
| Specific Energy | [Wh/Kg] | 81.00–276.00 73.45/146.13/115/8 | 80.0–175.00 37.33/137/145/5 | 10.00–50.00 11.7/29.8/30.0/13 | 30.00–300.00 65.2/143.9/150/29 |
| Energy Density | [KWh/m3] | 4.20–957.00 322.93/308.51/179/8 | 360.00–400.00 22.54/386/398/3 | 25.00–90.00 19.7/59.6/55.0/11 | 94.00–500.00 137/290/250/17 |
| Specific Power | [W/Kg] | 0.09–330.00 131.31/76.37/9.00/6 | 4.35–35.0 14.9/17.2/14.6/4 | 25.00–415.00 119.7/195/190/10 | 8.00–2,000.00 612.4/606/365/22 |
| Power Density | [KW/m3] | 0.36–610.00 243.14/151.88/28/6 | 12.35–101.70 43.7/49.3/41.6/4 | 10.00–400.00 185.8/123/41.9/4 | 56.80–800.00 321.4/366.4/304/4 |
| Efficiency | [%] | 20.00–100.00 34.25/68.75/77.50/4 | 36.00–94.00 25.5/73.0/81.0/4 | 63.00–90.00 8.56/76.9/76.0/15 | 70.00–100.00 8.5/89.8/90.0/17 |
| Lifespan | [yr] | 2.00–10.00 2.76/5.00/5.00/6 | 2.50–10.00 2.97/5.10/5.00/5 | 3.00–20.00 5.58/8.33/5.50/12 | 2.00–20.00 6.88/10.13/10.0/8 |
| Cycle Life | [cycles] | 1–1,500 593.51/408.50/100/6 | 1–200 109.82/73.7/20/3 | 100–2,000 736/1,053/1,100/18 | 250–10,000 3,036/1,018/1,500/19 |
| Self-Discharge Rate | [%/day] | 0.01–0.25 0.11/0.09/0.02/5 | 0.008–0.011 0.001/0.009/0.009/4 | 0.033–1.10 0.36/0.33/0.22/8 | 0.03–0.33 0.11/0.158/0.166/9 |
| Scale | [MW] | 0.00–0.25 0.13/0.12/0.10/3 | 0.00–0.001 0.0005/0.0003/0/3 | 0.00–50.00 14.18/10.34/8/12 | 0.00–3.00 1.20/0.93/0.15/8 |
| Energy Capital Cost | [US$/KWh] | 3,167.00–20,000.0 6,732/9,795/6,686/7 | 100.00–1,000.0 407.9/463/283/5 | 50.00–1,100.00 231.4/303/250/24 | 200.00–4,000.00 1,076/1,110/600/15 |
| Power Capital Cost | [US$/KW] | 7,140,620–741,935 4,524 K/3,941 K/ 3,941 K/2 | 1,000–11,900 5,994/5,008/2,125/3 | 175.00–900.00 209.1/383/300/15 | 175.00–4,000.00 1,446/2,325/1,950/9 |
| Application | Very Small Scale Energy Management | Very Small Scale Energy Management | Small/Medium Scale Energy Management | Small/Medium Scale Energy Management | |
| Technical Maturity | Very Mature/Fully Commercialized | Very Mature/Fully Commercialized | Very Mature/Fully Commercialized | Mature/ Commercialized | |
| Environmental Impact | Low | Medium | High | High/Medium | |
| Metric | Nickel Metal Hydride | Nickel Cadmium | Nickel Iron | Nickel Zinc | |
|---|---|---|---|---|---|
| range σ/μ//n | range σ/μ//n | range σ/μ//n | range σ/μ//n | ||
| Specific Energy | [Wh/Kg] | 30.00–90.00 20.2/66.5/73/14 | 10.00–80.00 20.5/45.3/45.0/16 | 27.00–60.00 14.3/43.1/45.0/7 | 15.00–110.00 29.7 /69.6/72.5/12 |
| Energy Density | [KWh/m3] | 38.90–300.00 96.8/185/180/10 | 15.00–150.00 53.7/95.5/100/10 | 25.00–80.00 22.6/50.0/55.0/5 | 80.00–400.00 109.3/236/245/8 |
| Specific Power | [W/Kg] | 6.02–1,100.00 378/408/235/12 | 50.00–1,000.00 244/222/150/13 | 20.57–110.00 45.8/54.9/25.0/5 | 50.00–900.00 287/201/95/8 |
| Power Density | [KW/m3] | 7.80–588.00 259.4/383/467/4 | 37.66–141.05 43.0/89.5/89.6/4 | 12.68–35.18 11.5/25.4/28.4/3 | 121.38–608.00 195.6/309/218/5 |
| Efficiency | [%] | 50.00–80.00 9.72/65.8/65.5/6 | 59.00–90.00 11.2/69.8/67.5/14 | 65.00–80.00 10.6/72.5/72.5/2 | 80.00–89.00 6.36/84.5/84.5/2 |
| Lifespan | [yr] | 2.00–15.00 4.72/6.33/5.00/6 | 2.00–20.0 6.6/13.6/14.0/12 | 8.00–100 26.4/37.0/30.0/9 | 1.00–10.00 6.36/5.50/5.50/2 |
| Cycle Life | [cycles] | 300–3,000 916/1,129/1,000/7 | 300–10,000 2,251/2,561/2,000/18 | 1,000–8,500 3,326/3,875 /3,000/ 4 | 100–500 191.5/350/400/4 |
| Self-Discharge Rate | [%/day] | 0.30–4.00 1.27/1.16/0.83/7 | 0.07–0.71 0.23/0.34/0.25/12 | 0.36–1.43 0.39/0.80/0.71/6 | 0.60–1.07 0.25/0.79/0.71/3 |
| Scale | [MW] | 0.01–3.00 2.11/1.51/1.51/2 | 0.00–50.00 20.2/17.1/5.0/14 | 0–0.05 0.02/0.02/ 0.019/6 | 0.001–0.05 0.026/0.02/0.006/2 |
| Energy Capital Cost | [US$/KWh] | 200.00–729.00 186.6/451/407/8 | 330.00–3,500.0 900/1,132/800/17 | 444.27–1,316 392/962 /1,044/4 | 250.00–660.00 153.3/398/340/6 |
| Power Capital Cost | [US$/KW] | 270.00–530.00 145.7/362/286/3 | 270.00–1,500.0 494/867/600/9 | 8,167–16,312 4,107/12.5K/13.1K/1 | 270.00–530.00 183.9/400/400/2 |
| Application | Small Scale Energy Management | Small/Medium Scale Energy Management | Small/Medium Scale Energy Management | Very Small Scale Energy Management | |
| Technical Maturity | Very Mature/Fully Commercialized | Very Mature/Fully Commercialized | Mature/Limited Development | Mature/Limited Development | |
| Environmental Impact | High | High | Low | Low | |
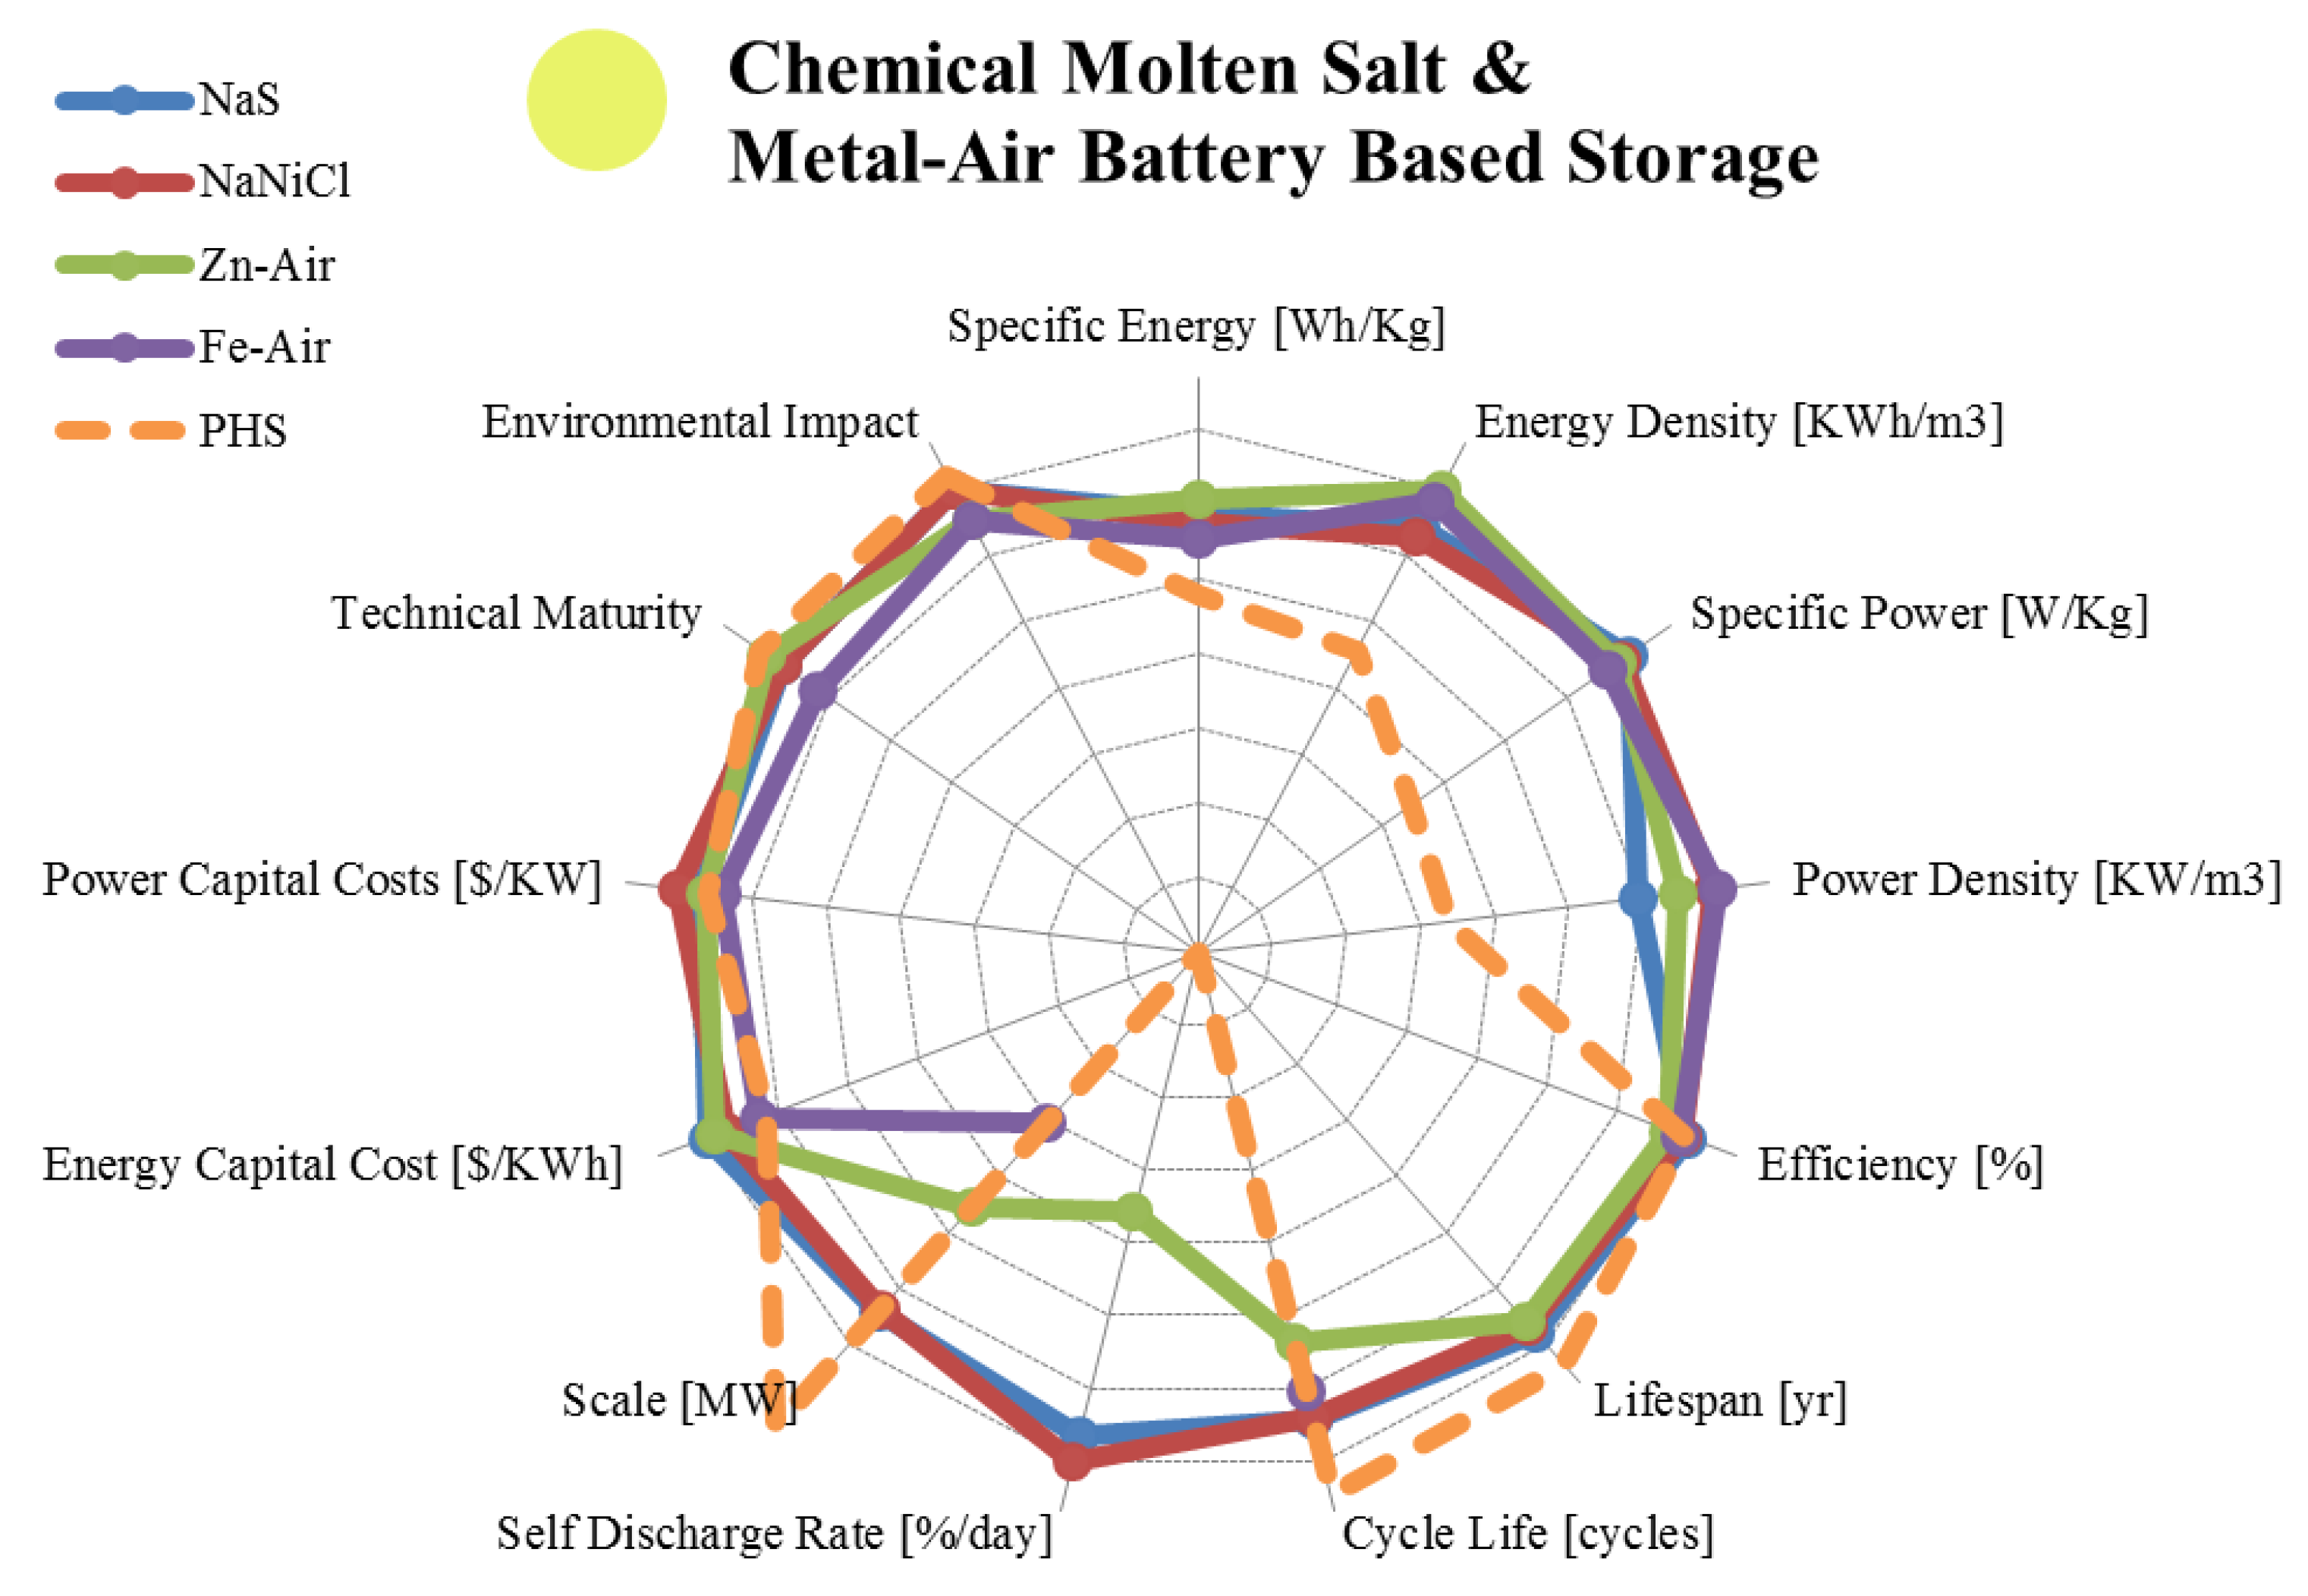
3.2. Liquid Metal, Molten Salt and Metal Air Batteries
| Metric | Sodium Sulphur | Sodium Nickel Chloride | Zinc Air | Iron Air | |
|---|---|---|---|---|---|
| range σ/μ//n | range σ/μ//n | range σ/μ//n | range σ/μ//n | ||
| Specific Energy | [Wh/Kg] | 100.00–240.00 44.72/145/135/10 | 85.00–140.00 16.7/112/117/10 | 10.00–470.00 165/227/150/15 | 8.00–109.00 28.9/68.1/70.0/9 |
| Energy Density | [KWh/m3] | 150.00–345.00 62.8/213/190/10 | 108.00–190.00 30.6/159.5/165/6 | 22.00–1,673.00 791/816.5/786/6 | 100.00–1,000.0 636.4/550/550/2 |
| Specific Power | [W/Kg] | 14.29–260.00 86.5/176.0/230/9 | 10.00–260.00 76.5/143/150/9 | 60.00–225.00 56.1/117/100/9 | 18.86–146.00 54.7/81.7/81.0/4 |
| Power Density | [KW/m3] | 1.33–50.00 17.6/21.8/20.0/5 | 54.20–300.00 96.5/219.2/257/5 | 10.00–208.00 91.5/74.9/40.9/4 | 250 x/250/250/1 |
| Efficiency | [%] | 65.00–92.00 8.1/81.5/85.0/21 | 21.00–92.50 34.2/72.1/87.5/4 | 30.00 - 50.00 9.60/44.25/48.5/ 4 | 42.00–96.00 20.2/66.5/62.5/8 |
| Lifespan | [yr] | 5.00–20.0 5.07/12.22/15.0/9 | 7.00–14.00 3.10/9.75/9.00/4 | 0.17–30.00 12.6/8.08/3.00/5 | Long |
| Cycle Life | [cycles] | 1,000–4,500 1,222/2,771/2,500/12 | 2,000–3,000 500/2,500/2,500/3 | 1.00–500.00 251.2/234/200/3 | 100–5,000 1,580/1,089/400/9 |
| Self-Discharge Rate | [%/day] | 0.00–20.0 10.95/8.01/0.05/5 | 11.89–26.25 7.56/17.7/15.0/3 | 0.005–0.01 0.003/0.007/0.005/3 | Small |
| Scale | [MW] | 0.01–80.00 22.6/13.1/4.5/16 | 0.00–53.00 21.5/12.3/0.30/7 | 0.00–1.00 0.41/0.17/0.008/6 | 0.00–0.01 0.005/0.006/0.006/5 |
| Energy Capital Cost | [US$/KWh] | 150.00–900.00 177.6/387/350/14 | 100.00–345.00 100.9/211/200/4 | 10.00–950.00 378/313/130/6 | 10.00–150.00 50.2/70.0/65.0/6 |
| Power Capital Cost | [US$/KW] | 150.00–3,300.0 1,121/1,736/1,850/13 | 150.00–10,000 4,615/3,613/2,150/4 | 100.00–4,000.0 1,567/1,533/975/6 | 950 x/950/950/1 |
| Application | Medium/Large Scale Energy Management | Medium/Large Scale Energy Management | Very Small Scale Energy Management | Small Scale Energy Management | |
| Technical Maturity | Proven/ Commercializing | Proven/ Commercializing | Mature/ Commercialized | Research/ Developing | |
| Environmental Impact | Medium/Low | Medium/Low | Very Low | Very Low | |
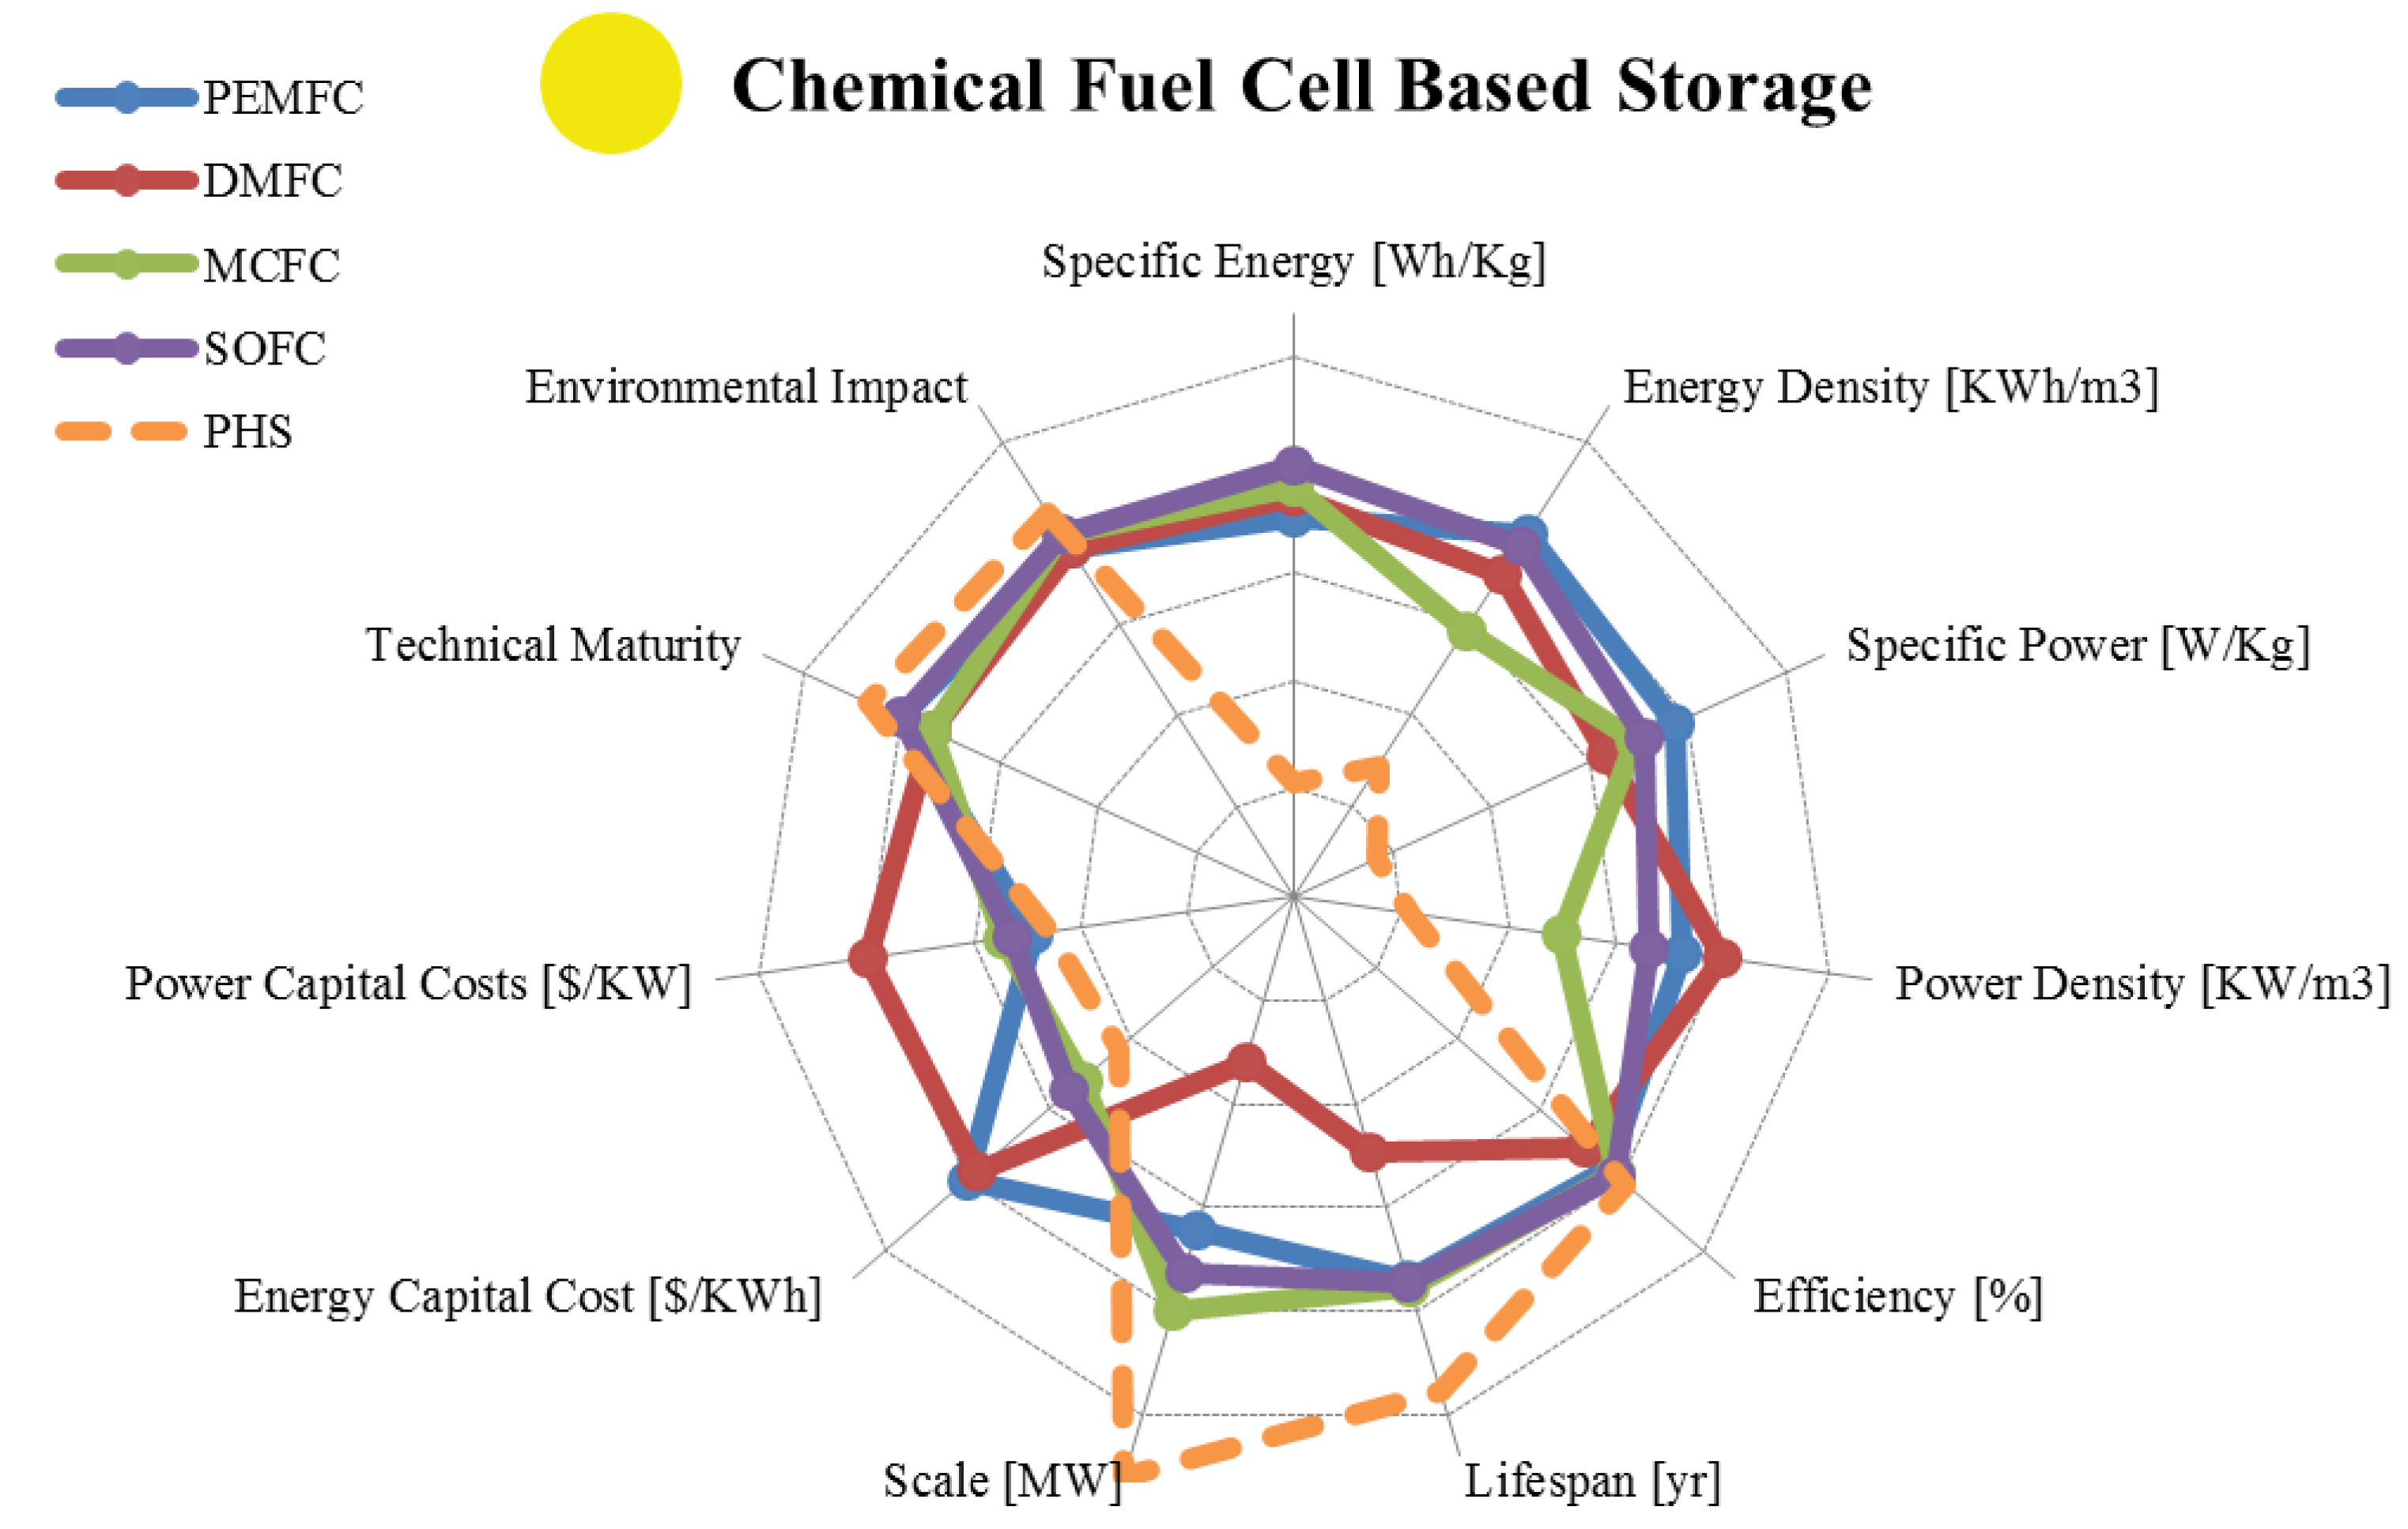
3.3. Fuel Cells
| Metric | Polymer Exchange Mem. | Direct Methanol | Molten Carbonate | Solid Oxide | |
|---|---|---|---|---|---|
| range σ/μ//n | range σ/μ//n | range σ/μ//n | range σ/μ//n | ||
| Specific Energy | [Wh/Kg] | 100.00–450.00 135/246.6/200/13 | 140.30–960.00 308.4/400/300/9 | 369.00–607.00 168.3/488/488/2 | 410.00–1,520.0 513/773/582/4 |
| Energy Density | [KWh/m3] | 112.20–770.00 211.7/380.2/360/8 | 29.90–274.00 90.08/135/118/6 | 25.00–40.00 10.6/32.5/32.5/2 | 172.00–462.09 160.5/277/198/3 |
| Specific Power | [W/Kg] | 4.00–150.00 63.7/56.1/18.2/5 | 2.10–20.00 5.53/11.1/10.0/9 | 12.00–36.70 11.1/22.4/20.4/4 | 10.00–63.34 24.9/27.3/12.8/6 |
| Power Density | [KW/m3] | 4.20–35.00 15.48/18.7/16.9/3 | 1.00–300.00 103.6/44.1/6.9/8 | 1.05–1.67 0.44/1.36/1.36/2 | 4.20–19.25 8.61/9.31/4.47/3 |
| Efficiency | [%] | 22.00–85.00 15.21/46.36/40/25 | 10.00–40.00 10.3/23.3/20.0/6 | 45.00–80.00 10.4/55.4/52.5/10 | 50.00–65.00 4.76/58.6/60.0/7 |
| Lifespan | [yr] | 0.22–10.00 4.04/4.07/2.79/10 | 0.01–0.56 0.22/0.24/0.22/5 | 1.40–10.00 3.14/4.90/4.50/5 | 0.28–10.00 5.09/4.26/2.50/3 |
| Scale | [MW] | 0.00–50.00 17.58/6.49/0.18/8 | 0.00–1.00 0.37/0.16/0.001/7 | 0.01–100.00 48.6/39.2/2.0/7 | 0.00–100.00 40.7/17.0/0.10/6 |
| Energy Capital Cost | [US$/KWh] | 70.00–13,000.00 6,096/4,080/1,625/4 | 3,067.0–3,190.0 3,190/3,129/3,129/2 | 146.00–175.00 20.5/160.5/160.5/2 | 180.00–333.00 88.1/231.3/181/3 |
| Power Capital Cost | [US$/KW] | 0.00–10,200.00 3,051/1,950/640/27 | 15,000–125,000 45K/71K/73K/4 | 3,500.0–4,200.0 495/3,850/3,850/2 | 481.00–8,000.0 3,263/3,130/1,170/5 |
| Application | Small/Medium Scale Energy Management | Very Small Scale Energy Management | Medium Scale Energy Management | Medium Scale Energy Management | |
| Technical Maturity | Proven/ Commercializing | Proven/ Developing | Proven/ Developing | Proven/ Commercializing | |
| Environmental Impact | Low | Low | Medium/Low | Medium/Low | |

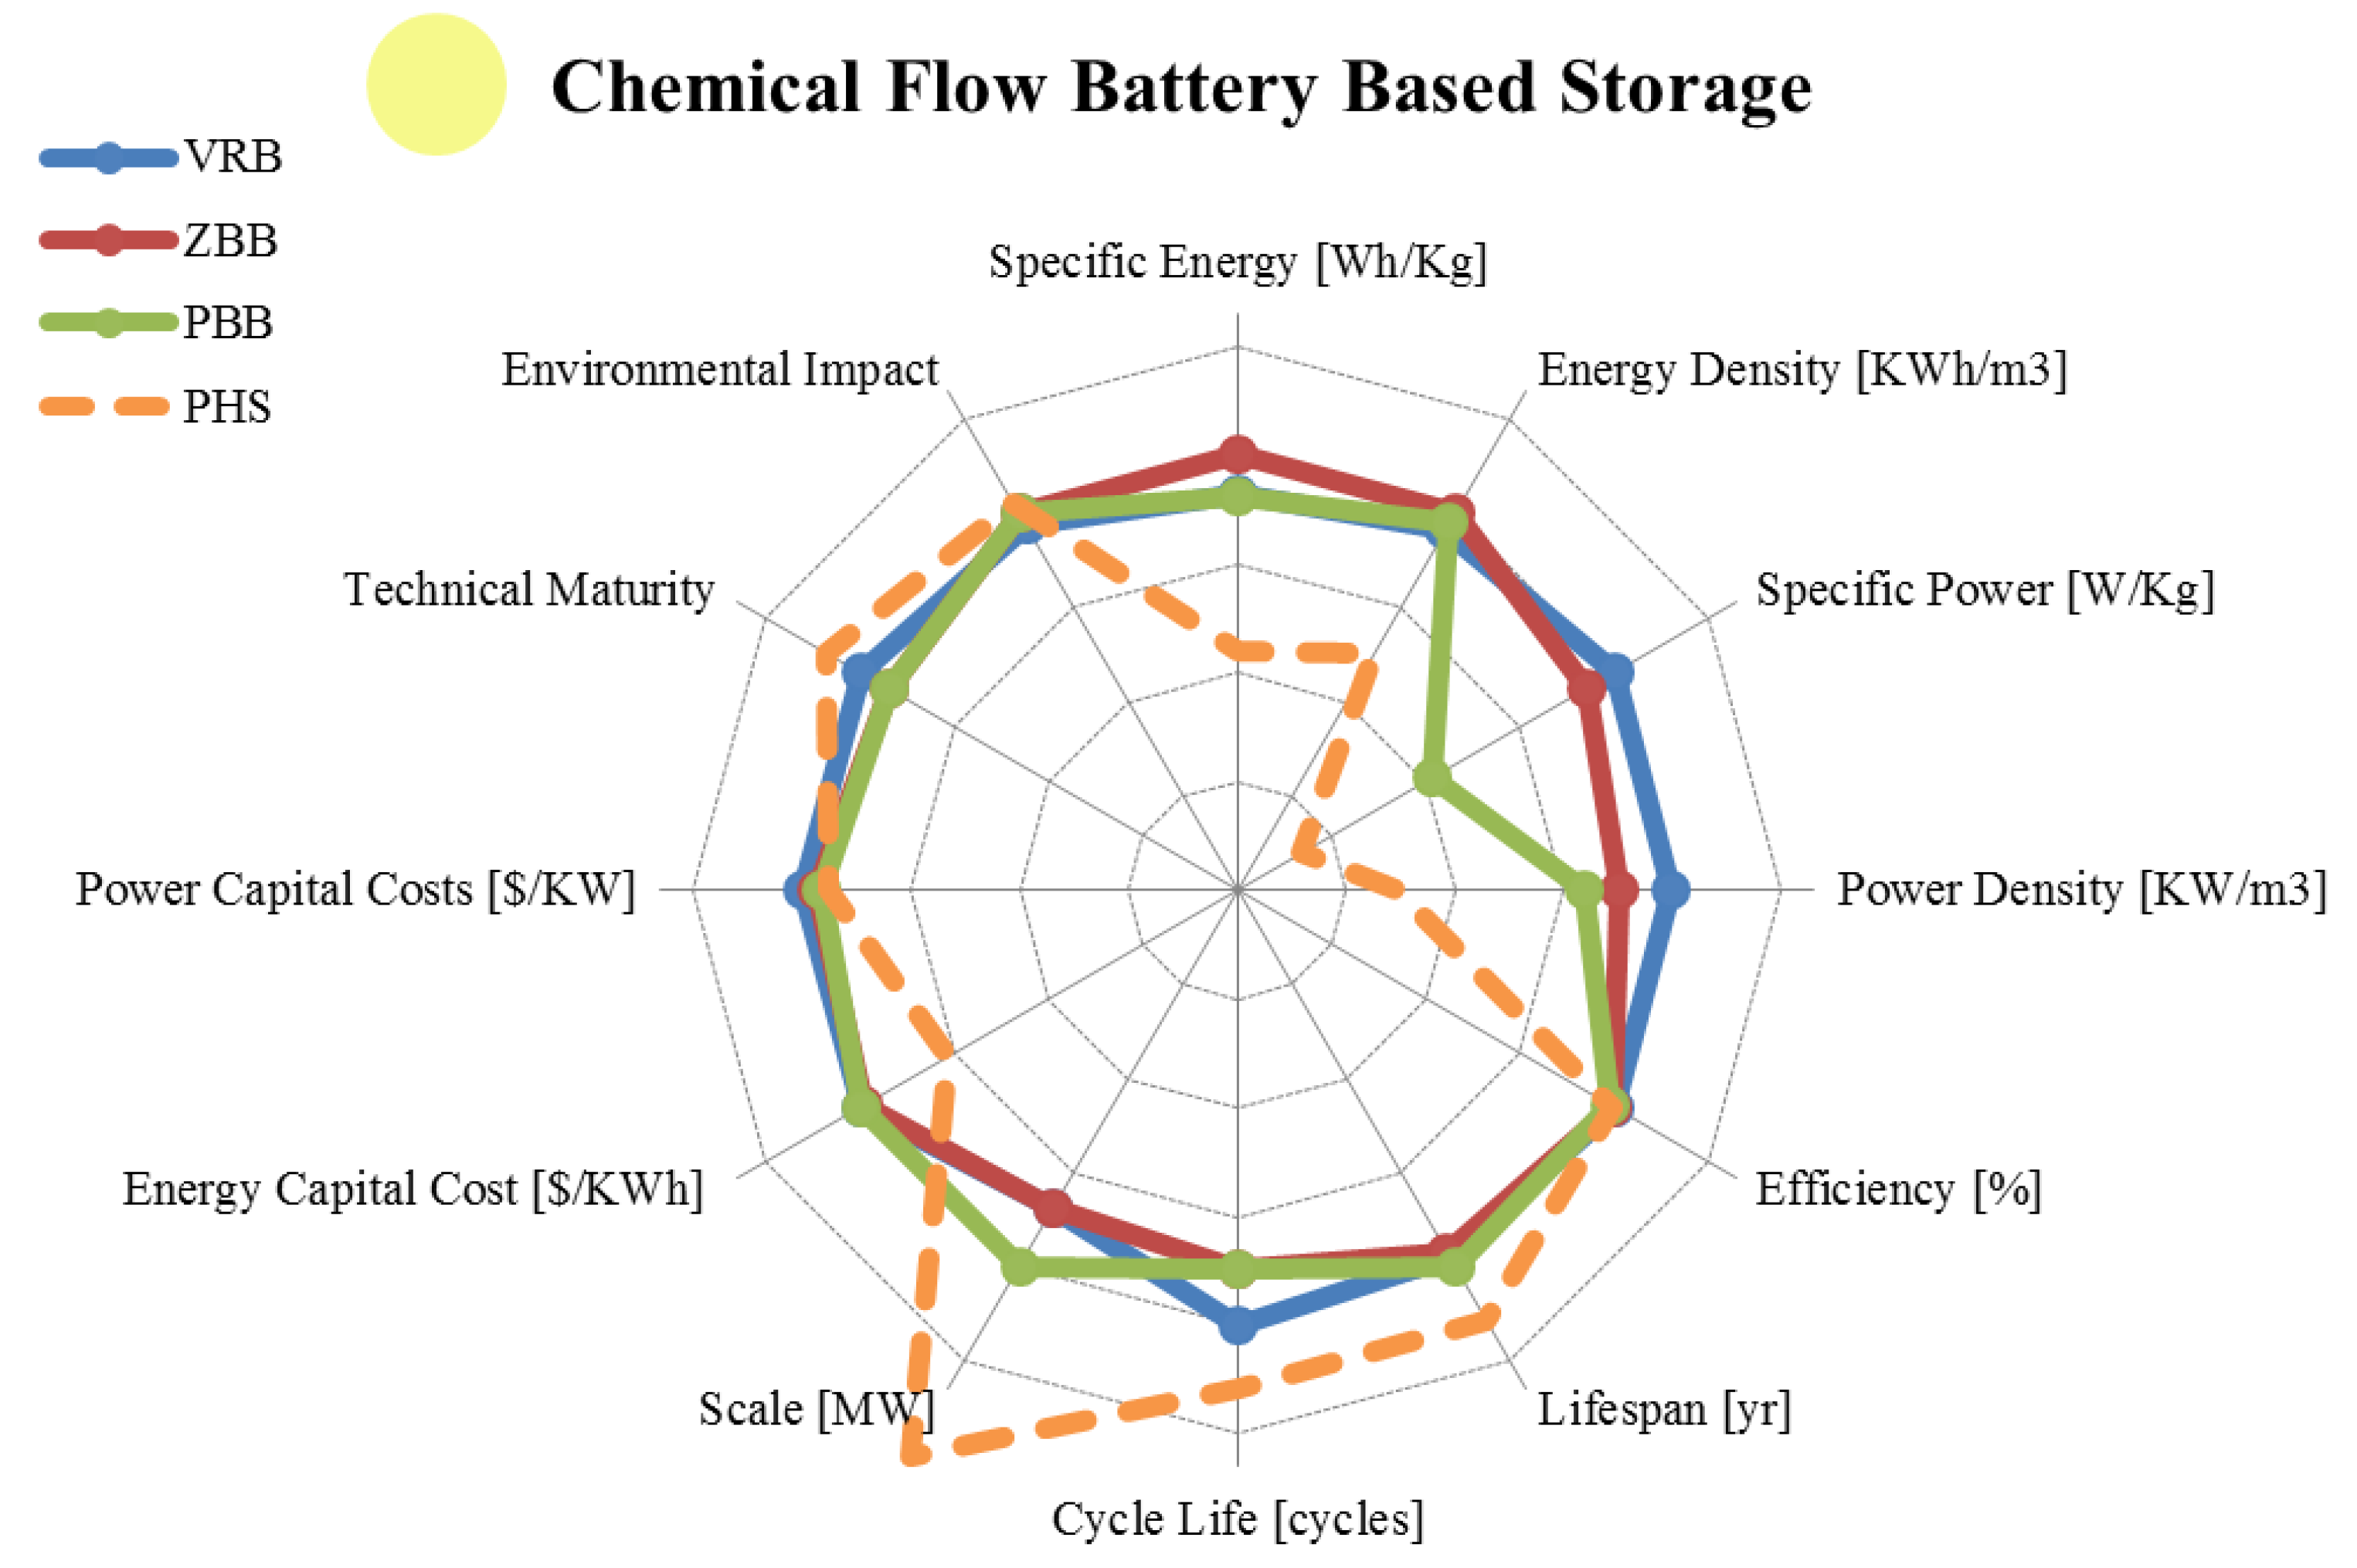
3.4. Flow Batteries
| Metric | Vanadium Redox | Zinc Bromine | Polysulphide Bromine | |
|---|---|---|---|---|
| range σ/μ//n | range σ/μ//n | range σ/μ//n | ||
| Specific Energy | [Wh/Kg] | 10.00–50.00 11.15/24.43/24.00/14 | 11.10–90.00 23.3/55.9/60.0/19 | 10.00–50.00 12.46/22.67/20.00/9 |
| Energy Density | [KWh/m3] | 10.00–33.00 8.17/21.70/20.00/10 | 5.17–70.00 19.9/32.6/30.0/16 | 10.80–60.00 15.78/25.60/20.00/8 |
| Specific Power | [W/Kg] | 31.30–166.00 54.89/110.46/125.00/5 | 5.50–110.00 37.2/56.9/60.0/9 | Unknown |
| Power Density | [KW/m3] | 2.50–33.42 21.86/17.96/17.96/2 | 2.58–8.50 2.60/5.87/6.00/5 | 1.35–4.16 1.99/2.76/2.76/2 |
| Efficiency | [%] | 60.00–88.00 7.28/76.96/78.30/19 | 60.00–85.00 7.21/73.3/73.0/17 | 57.00–83.00 8.65/71.45/75.00/11 |
| Lifespan | [yr] | 2.00–20.00 5.93/10.50/10.00/8 | 5.00–20.00 4.78/9.38/9.00/8 | 10.00–15.00 2.86/13.33/15.00/3 |
| Cycle Life | [cycles] | 800–16,000 5,250/7,759/7,500/16 | 800–5,000 1,225/2,368/2,000/11 | 800–4,000 1,203/2,360/2,000/5 |
| Scale | [MW] | 0.00–20.00 5.59/3.58/0.73/18 | 0.001–20.00 5.91/3.55/1.00/19 | 0.001–100.00 25.54/14.87/12.00/15 |
| Energy Capital Cost | [US$/KWh] | 100.00–2,000.00 542.4/488.1/200.0/15 | 110.00–2,000.0 525.6/447/225/13 | 110.00–2,000.00 559.05/494.08/187.50/16 |
| Power Capital Cost | [US$/KW] | 175.00–9,444.00 2,355/2,461/1,545/15 | 175.00–4,500.0 1,365/1,788/1,300/12 | 330.00–4,500.00 1,208/1,643/1,098/12 |
| Application | Medium/Large Scale Energy Management | Large Scale Energy Management | Large Scale Energy Management | |
| Technical Maturity | Proven/Commercializing | Proven/Developing | Proven/Developing | |
| Environmental Impact | Medium/Low | Medium | Medium | |

3.5. Final Remarks
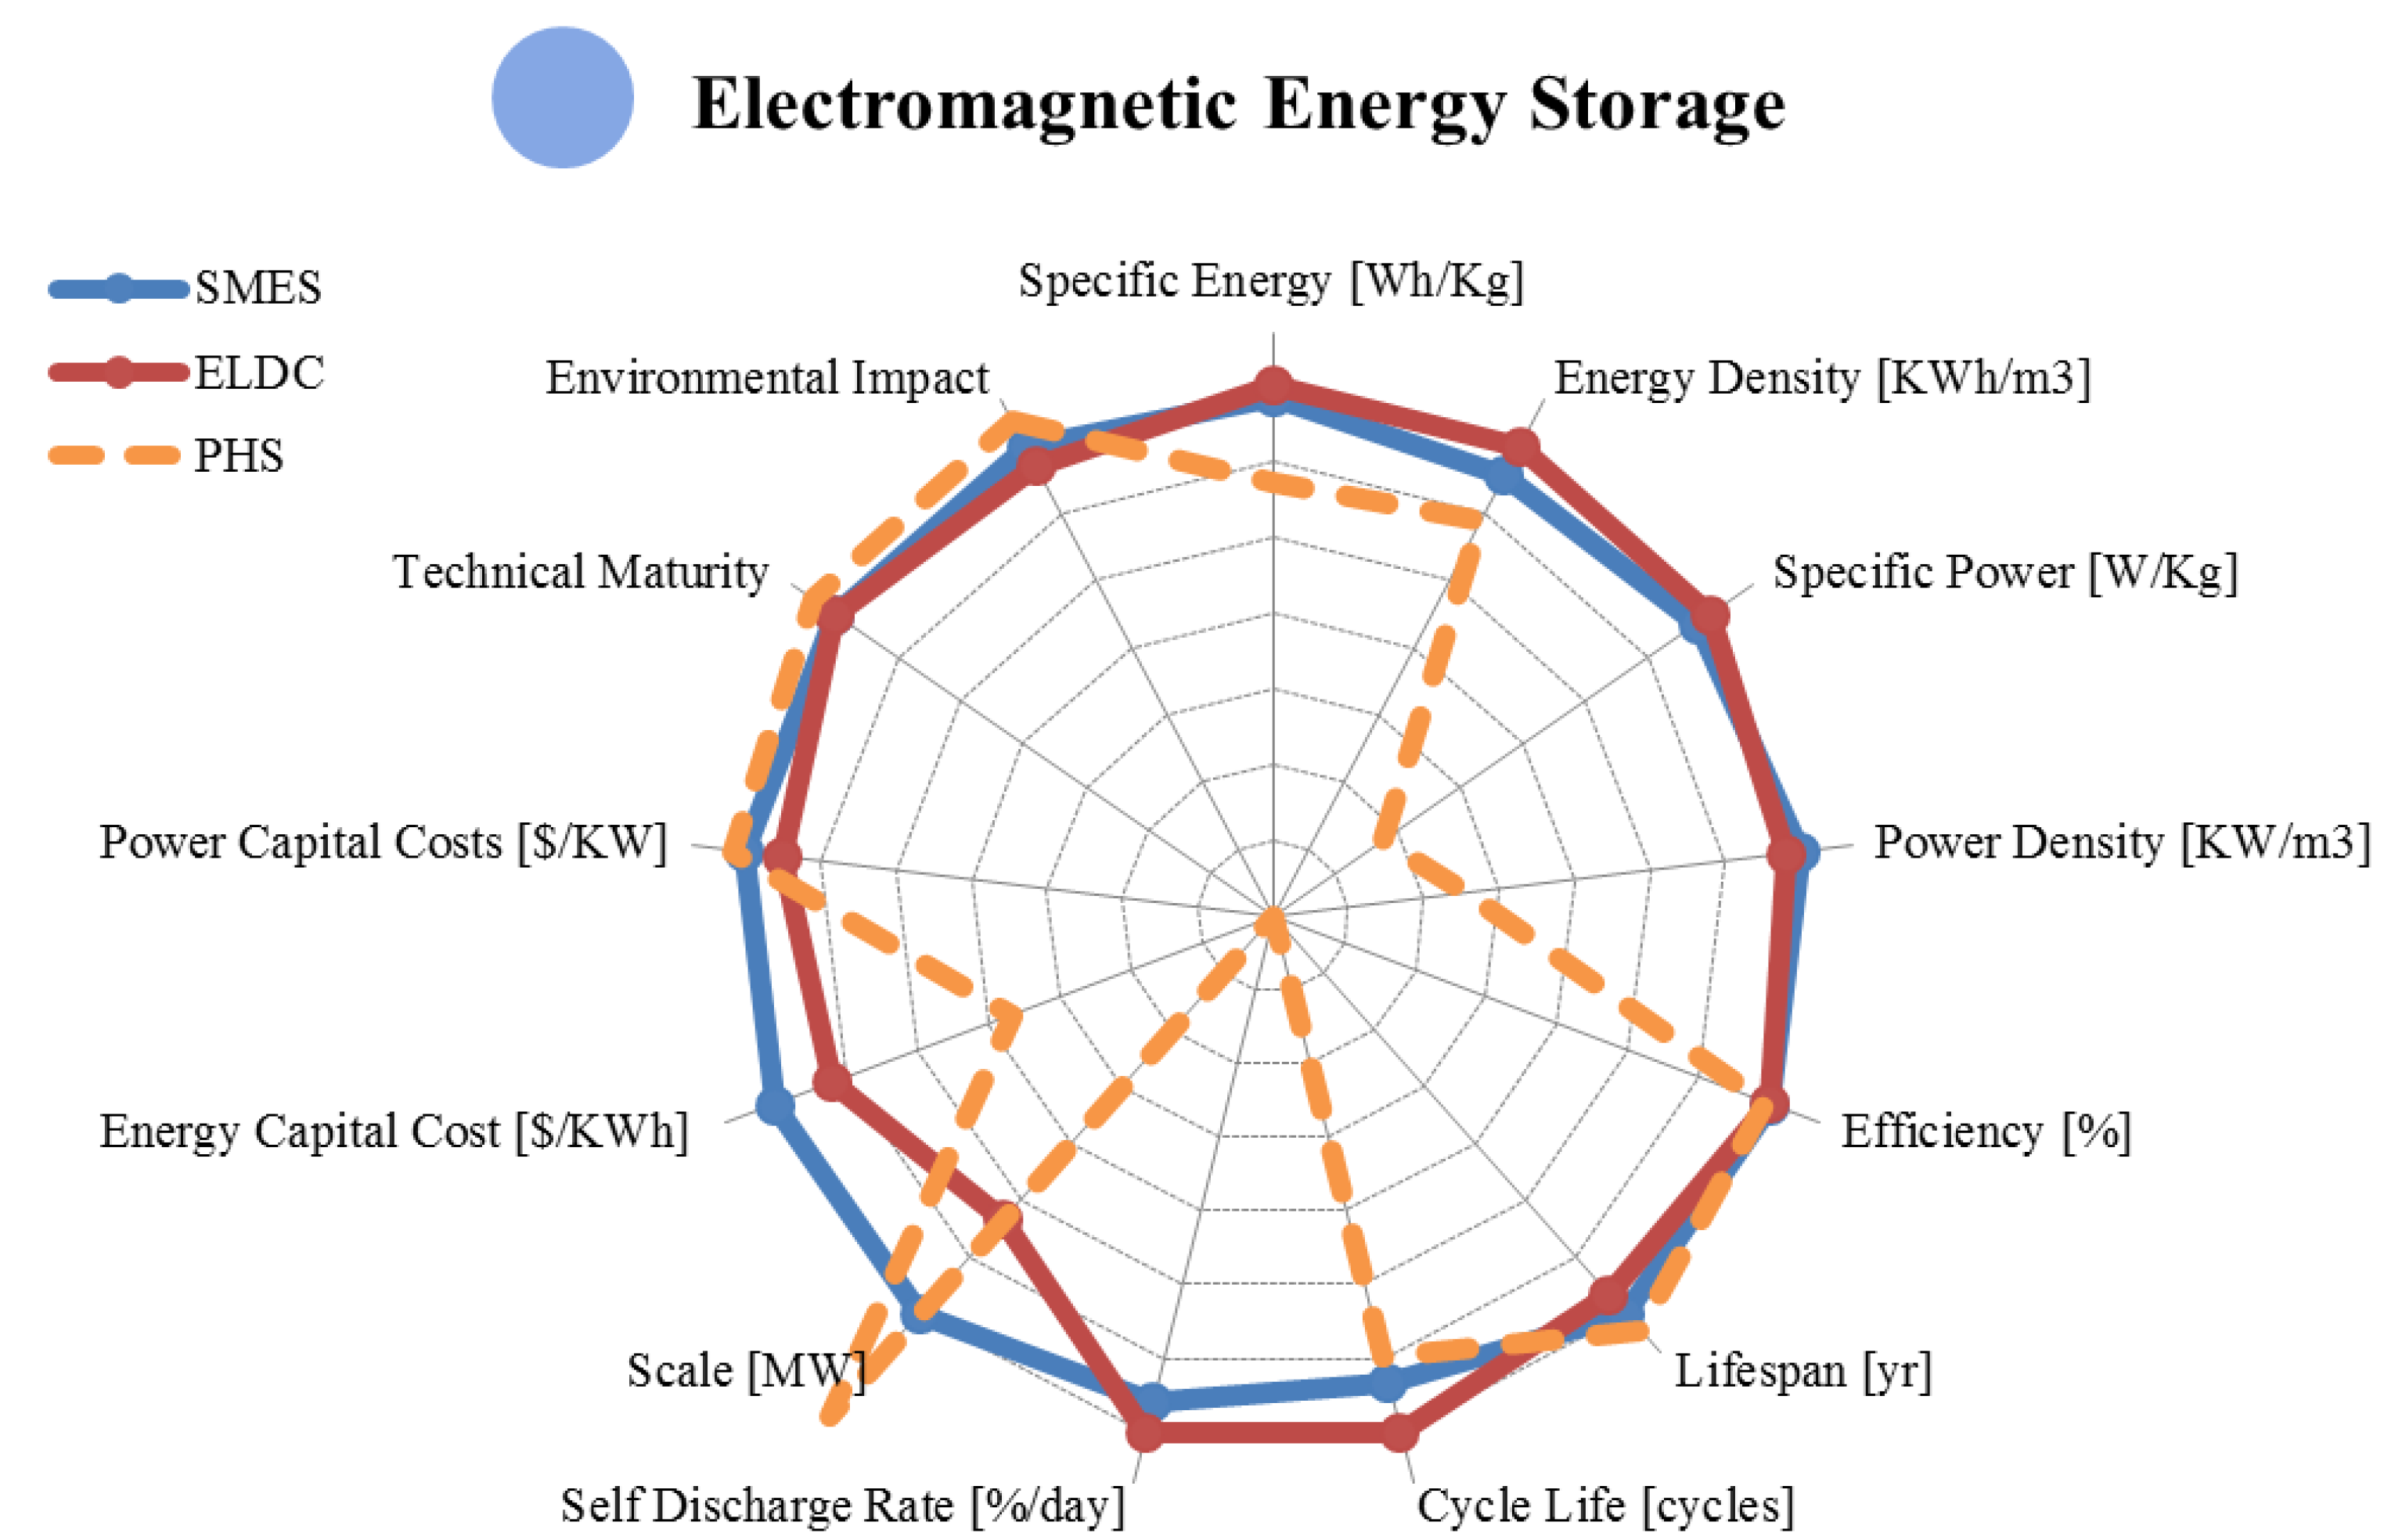
4. Electromagnetic Storage
| Metric | Superconducting | Supercapacitor | |
|---|---|---|---|
| range σ/μ//n | range σ/μ//n | ||
| Specific Energy | [Wh/Kg] | 0.27–75.00 21.43/11.79/5.00/11 | 0.07–85.60 20.62/16.36/10.00/25 |
| Energy Density | [KWh/m3] | 0.20–13.80 4.45/4.99/3.85/12 | 1.00–35.00 11.81/13.77/10.00/9 |
| Specific Power | [W/Kg] | 500.00–15,000.00 6,570.77/5,600.00/2,000.00/5 | 5.44–100,000.00 20,154.00/8,930.44/3,500.00/24 |
| Power Density | [KW/m3] | 300.00–4,000.00 1,719.85/1,457.50/765.00/4 | 15.00–4,500.00 2,000.74/921.00/30.00/5 |
| Efficiency | [%] | 80.00–99.00 5.72/92.45/95.00/11 | 65.00–99.00 9.63/91.33/95.00/12 |
| Lifespan | [yr] | 20.00–30.00 5.77/25.00/25.00/4 | 5.00–20.00 5.35/11.43/10.00/7 |
| Cycle Life | [cycles] | 10,000–100,000 40,865.63/68,000.00/90,000.00/5 | 10,000–1,000,000 364,649/302,308/100,000/13 |
| Self-Discharge Rate | [%/day] | 1.00–15.00 6.25/7.50/7.00/3 | 0.46–40.00 16.43/18.64/20.00/7 |
| Scale | [MW] | 0.01–200.00 48.55/23.56/8.00/22 | 0.00–5.00 1.29/0.52/0.02/23 |
| Energy Capital Cost | [US$/KWh] | 500.00–1,080,000.00 336,835/125,488/2,755/10 | 100.00–94,000.00 28,160/19,866/9,750/16 |
| Power Capital Cost | [US$/KW] | 196.00–10,000.00 2,412.70/981.56/325.00/16 | 100.00–800.00 226.46/321.00/300.00/10 |
| Application | Medium/Large Scale Power Quality | Small/Medium Scale Power Quality | |
| Technical Maturity | Proven/Commercializing | Proven/Commercializing | |
| Environmental Impact | Low | Very Low | |
4.1. Superconducting Magnetic Energy Storage
4.2. Supercapacitor Energy Storage
4.3. Final Remarks
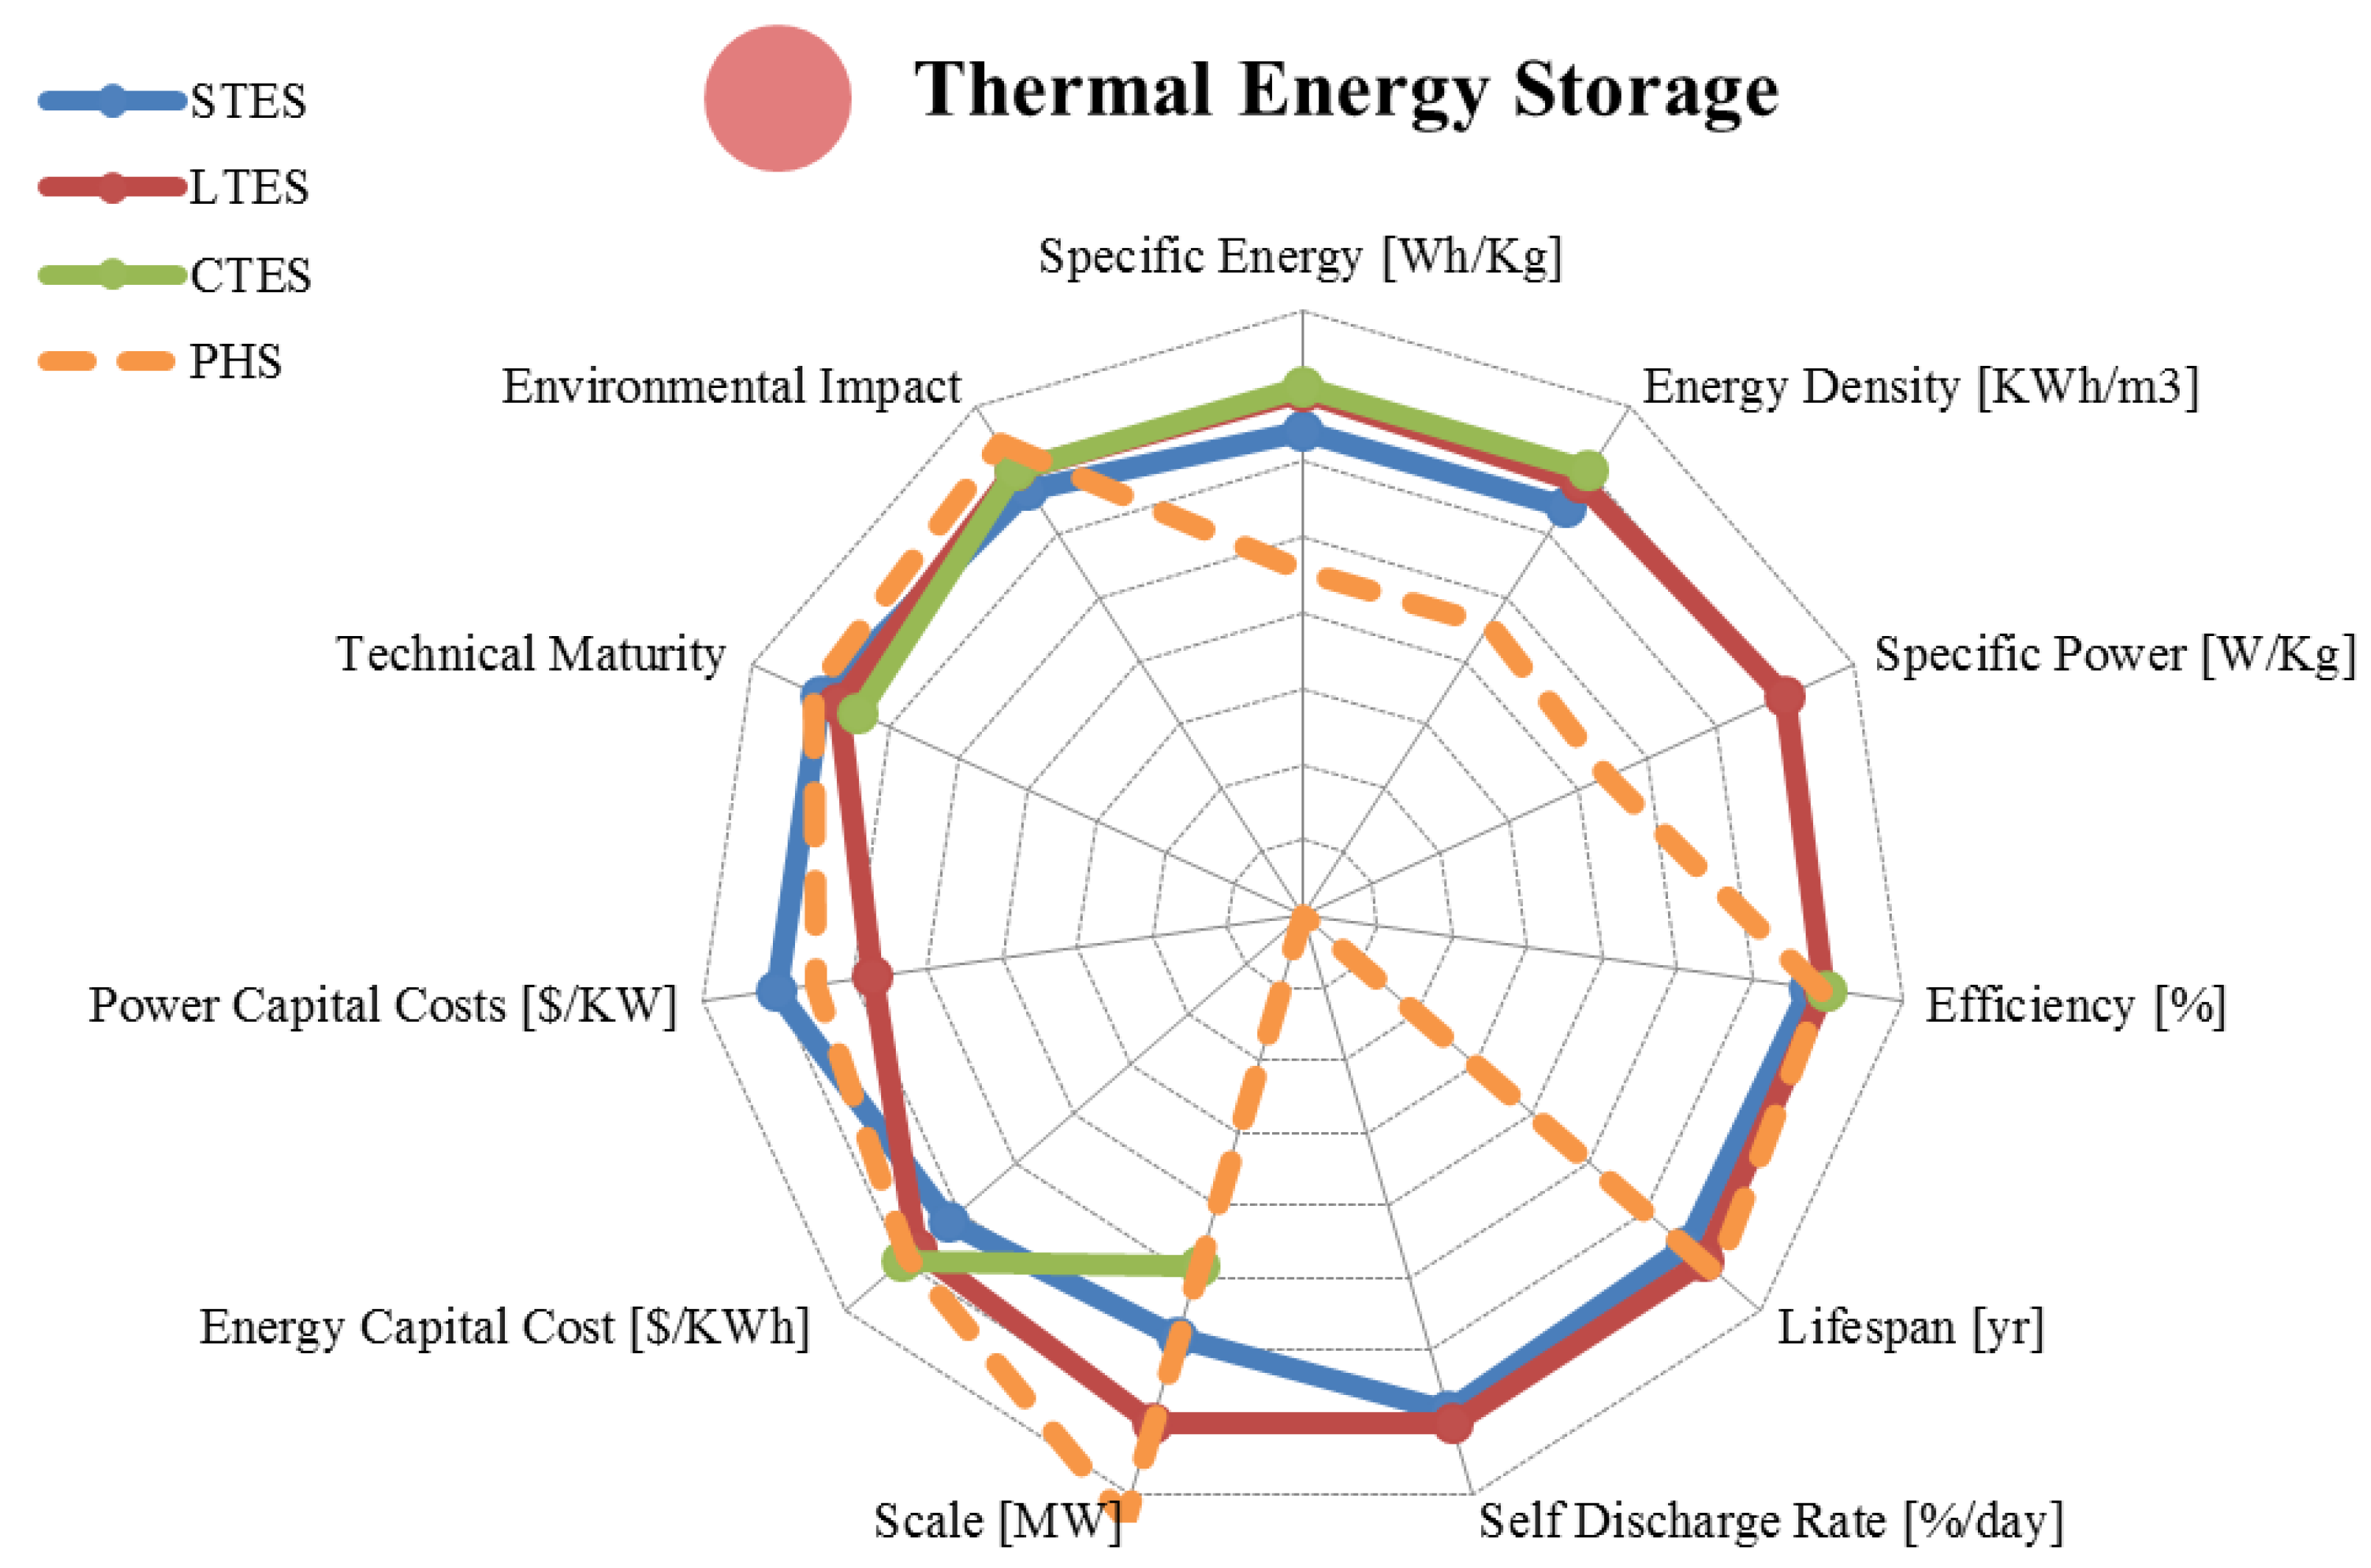
5. Thermal Storage
5.1. Sensible Heat Storage
| Metric | Sensible Heat | Latent Heat | Reaction Heat | |
|---|---|---|---|---|
| range σ/μ//n | range σ/μ//n | range σ/μ//n | ||
| Specific Energy | [Wh/Kg] | 10.00–120.00 46.55/65.00/65.00/4 | 150.00–250.00 52.5/209.3/227.8/3 | 250.00 x/250.00/250.00/1 |
| Energy Density | [KWh/m3] | 25.00–120.00 34.57/77.00/80.00/5 | 100.00–370.00 122.9/197.5/160.0/4 | 300.00 x/300.00/300.00/1 |
| Specific Power | [W/Kg] | Unknown | 10.00–30.00 14.14/20.00/20.00/2 | Unknown |
| Power Density | [KW/m3] | Unknown | Unknown | Unknown |
| Efficiency | [%] | 7.00–90.00 34.34/51.75/55.00/4 | 75.00–90.00 10.61/82.50/82.50/2 | 75.00–100.00 17.68/87.50/87.50/2 |
| Lifespan | [yr] | 10.00–20.00 7.07/15.00/15.00/2 | 20.00–40.00 14.14/30.00/30.00/2 | Unknown |
| Cycle Life | [cycles] | Unknown | Unknown | Unknown |
| Self-Discharge Rate | [%/day] | 0.50 x/0.50/0.50/1 | 0.50–1.00 0.35/0.75/0.75/2 | Unknown |
| Scale | [MW] | 0.001–10.00 7.07/5.00/5.00/2 | 0.001–300.00 149.82/75.28/0.55/4 | 0.01–1.00 0.70/0.51/0.51/2 |
| Energy Capital Cost | [US$/KWh] | 0.04–50.00 17.42/11.06/2.26/8 | 3.00–88.73 836.52/40.73/30.00/5 | 10.90–137.00 88.84/73.74/73.74/2 |
| Power Capital Cost | [US$/KW] | 2,500.00–7,900.00 2,844/4,683/3,650/3 | 200.00–300.00 70.7/250.0/250.0/2 | Unknown |
| Application | Medium Scale Bridging Power | Medium/Large Scale Energy Management | Small/Medium Scale Energy Management | |
| Technical Maturity | Mature/Commercialized | Proven/Commercializing | Proven/Developing | |
| Environmental Impact | Very Low | Low/Uncertain | Low/Uncertain | |

5.2. Latent Heat Storage
5.3. Reversible Chemical Reaction Heat Storage
5.4. Final Remarks
6. Conclusions
Acknowledgments
Author Contributions
Conflicts of Interest
References
- Shafiee, S.; Topal, E. When will fossil fuel reserves be diminished. Energy Policy 2009, 37, 181–189. [Google Scholar] [CrossRef]
- Worldwide Trends in Energy Use and Efficiency: Key Insights from Iea Indicator Analysis; International Energy Agency (IEA): Paris, France, 2008.
- International Energy Outlook 2013; U.S. Energy Information Administration: Washington, DC, USA, 2013.
- Chen, H.; Cong, T.N.; Yang, W.; Tan, C. Progress in electrical energy storage system: A critical review. Prog. Nat. Sci. 2009, 19, 291–312. [Google Scholar] [CrossRef]
- Key World Energy Statistics; International Energy Agency (IEA): Paris, France, 2013.
- Renewables 2013: Global Status Report; Renewable Energy Policy Network for the 21st Century: Paris, France, 2013.
- Sabihuddin, S. A numerical and graphical review of energy storage and energy production technologies (dataset). Available online: http://figshare.com/articles/A_Numerical_and_Graphical_Review_of_Energy_Storage_and_Energy_Production_Technologies/1096289 (accessed on 18 November 2014).
- Bueno, C.; Carta, J.A. Wind powered pumped hydro storage systems, a means of increasing the penetration of renewable energy in the canary islands. Renew. Sustain. Energy Rev. 2006, 10, 312–340. [Google Scholar] [CrossRef]
- Deane, J.P.; Gallacho, B.P.O.; McKeogh, E.J. Techno-economic review of existing and new pumped hydro energy storage plant. Renew. Sustain. Energy Rev. 2010, 14, 1293–1302. [Google Scholar] [CrossRef]
- Pickard, W.F. The history, present state, and future prospects of underground pumped hydro formassive energy storage. Proc. IEEE 2012, 100, 473–483. [Google Scholar] [CrossRef]
- Yang, C.-J.; Jackson, R.B. Opportunities and barriers to pumped-hydro energy storage in the united states. Renew. Sustain. Energy Rev. 2011, 15, 839–844. [Google Scholar] [CrossRef]
- Steffen, B. Prospects for pumped-hydro storage in germany. Energy Policy 2012, 45, 420–429. [Google Scholar] [CrossRef]
- Droste-Franke, B. Assessing environmetal impacts of storage technologies and competing options for balanacing demand and supply in 2050. In Proceedings of the International Renewable Energy Storage Conference (IRES), Berlin, Germany, 12 November 2012.
- Harano, M.; Tani, K.; Nomoto, S. Practical application of high-performance Francis-Turbine runner fitted with splitter blades at Ontake and Shinkurobegawa No. 3 power stations of the Kansai Electric Power Co., Inc. Hitachi Rev. 2006, 55, 109–113. [Google Scholar]
- Bierbower, W. Unconventional “hydraulic hydro storage” system offers energy storage for the grid on a grande scale. Available online: http://blogs.worldwatch.org/revolt/unconventional-“hydraulic-hydro-storage”-system-offers-energy-storage-for-the-grid-on-a-grand-scale/ (accessed on 18 November 2014).
- Study of Compressed Air Energy Storage with Grid and Photovoltaic Energy Generation; Arizona Research Institute for Solar Energy (AZRISE): Tucson, AZ, USA, 2010.
- Saadat, M.; Li, P.Y. Modeling and control of a novel compressed air energy storage system for offshore wind turbine. In Proceedings of the American Control Conference, Montreal, QC, Canada, 27–29 June 2012.
- Lund, H.; Salgi, G. The role of compressed air energy storage (caes) in future sustainable energy systems. Energy Convers. Manag. 2009, 50, 1172–1179. [Google Scholar] [CrossRef]
- Compressed Air Energy Storage Power Plants; Bine Informationsdienst: Bonn, Germany, 2007.
- Qin, C.; Loth, E. Liquid piston compression efficiency with droplet heat transfer. Appl. Energy 2014, 114, 539–550. [Google Scholar] [CrossRef]
- Ven, J.D.V.D.; Li, P.Y. Liquid piston gas compression. Appl. Energy 2009, 86, 2183–2191. [Google Scholar] [CrossRef]
- Advanced adiabatic compressed air energy storage (AA-CAES). Available online: http://energystorage.org/advanced-adiabatic-compressed-air-energy-storage-aa-caes (accessed on 18 November 2014).
- Pena-Alzola, R.; Sebastian, R.; Quesada, J.; Colmenar, A. Review of flywheel based energy storage systems. In Proceedings of the International Conference on Power ENgineering, Energy and Electrical Drives, Malaga, Spain, 11–13 May 2011.
- Bolund, B.; Bernhoff, H.; Leijon, M. Flywheel energy and power storage systems. Renew. Sustain. Energy Rev. 2007, 11, 235–258. [Google Scholar] [CrossRef]
- Hebner, R.; Pratap, S.; Lewis, M.; Hearn, C. Low-Cost Flywheel Energy Storage for Mitigating the Variability of Renewable Power Generation; The University of Texas at Austin: Austin, TX, USA, 2012. [Google Scholar]
- Liu, H.; Jiang, J. Flywheel energy storage—An upswing technology for energy sustainability. Energy Build. 2007, 39, 599–604. [Google Scholar] [CrossRef]
- Ragheb, M. Kinetic Energy Flywheel Energy Storage; University of Illinois at Urbana-Champaign: Champaign, IL, USA, 2013. [Google Scholar]
- Koyanagi, J. Durability of filament-wound composite flywheel rotors. Mech. Time-Depend. Mater. 2012, 16, 71–83. [Google Scholar] [CrossRef]
- Strasik, M.; Johnson, P.E.; Day, A.C.; Mittleider, J.; Higgins, M.D.; Edwards, J.; Schindler, J.R.; McCrary, K.E.; McIver, C.R.; Carlson, D.; et al. Design, fabrication, and test of a 5-kwh/100-kw flywheel energy storage utilizing a high-temperature superconducting bearing. IEEE Trans. Appl. Supercond. 2007, 12, 2133–2138. [Google Scholar] [CrossRef]
- Sabihuddin, S.; Aristides Kiprakis, M.M. A diamagnetically stabilized magnetically levitated flywheel battery. In Proceedings of the Ecologic Vehicles Renewable Energies (EVER), Monte Carlo, The Principality of Monaco, 27–30 March 2013.
- Siebert, M.; Ebihara, B.; Jansen, R.; Fusaro, R.L.; Morales, W.; Kascak, A.; Kenny, A. A Passive Magnetic Bearing Flywheel; NASA: Savannah, GA, USA, 2002. [Google Scholar]
- Praveen, R.P.; Ravichandran, M.H.; Achari, V.T.S.; Raj, V.P.J.; Madhu, G.; Bindu, G.R. Design and analysis of zero cogging brushless dc motor for spacecraft applications. In Proceedings of the International Conference on Electrical Engineering, Chaing Mai, Thailand, 19–21 May 2010.
- Lam, N.M.; Huyen, N.T.T.; Manh, D.H.; Ky, V.H.; Tung, D.K.; Dan, N.H. Fabrication of Nd-Fe-B exchange-spring magnets. J. Phys.: Conf. Ser. 2009, 187, 1–5. [Google Scholar]
- Rolim, L.G.B.; Ferreira, A.C.; Sotelo, G.G.; de Andrade, R., Jr. Flywheel generator with switched reluctance machine. In Proceedings of the International Conference on Electrical Machines (ICEM), Rio de Janeiro, Brazil, 6–9 October 2002.
- Suvorkova, E.; Vajda, I.; Dementiev, Y. Electromagnetic design of hybrid synchronous motor. In Proceedings of the International Symposium PARNU: Topical Problems in the Field of Electrical and Power Engineering, Seoul, Korea, 8–11 October 2013.
- Hansen, J.G.R.; O’Kain, D.U. An Assessment of Flywheel High Power Energy Storage Technology for Hybrid Vehicles; Oak Ridge National Laboratory: Oak Ridge, TN, USA, 2011. [Google Scholar]
- Tarascon, J.-M.; Armand, M. Issues and challenges facing rechargeable lithium batteries. Nature 2001, 414, 359–367. [Google Scholar] [CrossRef] [PubMed]
- Linden, D.; Reddy, T.B. Handbook of Batteries; McGraw-Hill: New York, NY, USA, 2002. [Google Scholar]
- Dueber, R. Strategic overview of silver-zinc rechargeaable batteries. Battery Power Prod. Technol. 2008, 12, 1–2. [Google Scholar]
- Olivetti, E.; Gregory, J.; Kirchain, R. Life Cycle Impacts of Alkaline Batteries with A Focus on End-of-Life; Massachusetts Institute of Technology: Cambridge, MA, USA, 2011. [Google Scholar]
- Huang, Y.-J.; Lin, Y.-L.; Li, W.-S. Manganese dioxide with high specific surface area for alkaline battery. Chem. Res. Chin. Univ. 2012, 28, 874–877. [Google Scholar]
- Ghaemi, M.; Amrollahi, R.; Ataherian, F.; Kassaee, M.Z. New advances on bipolar rechargeable alkaline manganese dioxide–zinc batteries. J. Power Sources 2003, 117, 233–241. [Google Scholar] [CrossRef]
- Zhu, Z.; Tam, T.K.; Sun, F.; You, C.; Zhang, Y.-H.P. A high-energy-density sugar biobattery based on a synthetic enzymatic pathway. Nat. Commun. 2014, 4. [Google Scholar] [CrossRef]
- Kincaid, B.; Poynter, B.; Braam, K.; Taniguchi, H. Printable Zinc-Manganese Dioxide Batteries; University of California Berkeley: Berkeley, CA, USA, 2010. [Google Scholar]
- Evans, J.W.; Keist, J.; Ho, C.; Quan, B.; Wright, P.K. Printed Energy Storage; University of California Berkeley: Berkeley, CA, USA, 2014. [Google Scholar]
- Banerjee, S. Low-Cost Grid-Scale Electrical Storage Using a Flow-Assisted Rechargeable Zinc-Manganese Dioxide Battery; The City University of New York: New York, NY, USA, 2012. [Google Scholar]
- Buchmann, I. Battery University. Available online: http://batteryuniversity.com/ (accessed on 18 November 2014).
- Xu, J.; Thomas, H.R.; Francis, R.W.; Lum, K.R.; Wang, J.; Liang, B. A review of the processes and technologies for the recycling of lithium-ion secondary batteries. J. Power Sources 2008, 177, 512–527. [Google Scholar] [CrossRef]
- Cyrus Wadia, P.A. Venkat Srinivasan. Resource constraints onthe battery energy storage potential for grid and transporation applications. J. Power Sources 2011, 196, 1593–1598. [Google Scholar] [CrossRef]
- Ritchie, A.; Howard, W. Recent developments and likely advances in lithium-ion batteries. J. Power Sources 2006, 162, 809–812. [Google Scholar] [CrossRef]
- Fetcenko, M.A.; Ovshinsky, S.R.; Reichman, B.; Young, K.; Fierro, C.; Koch, J.; Zallen, A.; Mays, W.; Ouchi, T. Recent advances in nimh battery technology. J. Power Sources 2007, 165, 544–551. [Google Scholar] [CrossRef]
- Bauerlein, P.; Antonius, C.; Loffler, J.; Kumpers, J. Progress in high-power nickel–metal hydride batteries. J. Power Sources 2008, 176, 547–554. [Google Scholar] [CrossRef]
- Tsai, P.-J.; Chan, S.L.I. Nickel-based batteries: Materials and chemistry. In Electricity Transmission, Distribution and Storage Systems; Woodhead Publishing Limited: New Delhi, India, 2013. [Google Scholar]
- Bradwell, D.J. Liquid Metal Batteries: Ambipolar Electrolysis and Alkaline Earth Electroalloying Cells; Massachusetts Institute of Technology (MIT): Cambridge, MA, USA, 2011. [Google Scholar]
- Hatta, T. Recent Applications of nas Battery System in the United States and in Japan; Sandia National Laboratories: Albuquerque, NM, USA, 2011. [Google Scholar]
- Tanaka, K.; Kurashima, Y.; Tamakoshi, T. Recent Sodium Sulfur Battery Applications in Japan. In Proceedings of the IEEE/PES Transmission and Distribution Conference and Exposition, Atlanta, GA, USA, 28 October–2 November 2001; pp. 1169–1173.
- Min, J.K.; Lee, C.-H. Numerical study on the thermal management system of a molten sodium-sulfur battery module. J. Power Sources 2012, 210, 101–109. [Google Scholar] [CrossRef]
- Benson, D.K.; Potter, T.F.; Tracy, C.E. Design of a Variable-Conductance Vacuum Insulation; National Renewable Energy Laboratory (NREL): Detroit, MI, USA, 1994. [Google Scholar]
- Burch, S.D.; Parish, R.C.; Keyser, M.A. Thermal Management of Batteries Using a Variable-Conductance Insulation Enclosure; National Renewable Energy Laboratory (NREL): Orlando, FL, USA, 1995. [Google Scholar]
- Ellis, B.L.; Nazar, L.F. Sodium and sodium-ion energy storage batteries. Curr. Opin. Solid State Mater. Sci. 2012, 16, 168–177. [Google Scholar] [CrossRef]
- Wen, Z.; Cao, J.; Gu, Z.; Xu, X.; Zhang, F.; Lin, Z. Research on sodium sulfur battery for energy storage. Solid State Ionics 2008, 179, 1697–1701. [Google Scholar] [CrossRef]
- Zyl, A.V. Review of the zebra battery system development. Solid State Ionics 1996, 86–88, 883–889. [Google Scholar]
- Lee, J.-S.; Kim, S.T.; Cao, R.; Choi, N.-S.; Liu, M.; Lee, K.T.; Cho, J. Metal–air batteries with high energy density: Li–air versus zn-air. Adv. Energy Mater. 2011, 1, 34–50. [Google Scholar] [CrossRef]
- Koretz, B.; Harats, Y.; Goldstein, J. Operational aspects of the electric fuel zinc-air battery system for evs. In Proceedings of the 12th International Seminar on Primary and Secondary Battery Technology and Application, Deerfield Beach, FL, USA, 6–9 March 1995.
- Cooper, J. Powering future vehicles with the refuelable zinc/air battery. Sci. Technol. Rev. 1995, October, 6–13. [Google Scholar]
- Manohar, A.K.; Malkhandi, S.; Yang, B.; Yang, C.; Prakash, G.K.S.; Narayanan, S.R. A high-performance rechargeable iron electrode for large-scale battery-based energy storage. J. Electrochem. Soc. 2012, 159, A1209–A1214. [Google Scholar] [CrossRef]
- Cheng, X.; Shi, Z.; Glass, N.; Zhang, L.; Zhang, J.; Song, D.; Liu, Z.-S.; Wang, H.; Shen, J. A review of pem hydrogen fuel cell contamination: Impacts, mechanisms, and mitigation. J. Power Sources 2007, 165, 739–756. [Google Scholar] [CrossRef]
- Aricò, A.S.; Baglio, V.; Antonucci, V. Direct methanol fuel cells: History, status and perspectives. In Electrocatalysis of Direct Methanol Fuel Cells; Wiley-VCH Verlag: Darmstadt, Germany, 2009. [Google Scholar]
- Basri, S.; Kamarudin, S.K.; Daud, W.R.W.; Yaakub, Z. Nanocatalyst for direct methanol fuel cell (dmfc). Int. J. Hydrog. Energy 2010, 35, 7957–7970. [Google Scholar] [CrossRef]
- Ren, X.; Zelenay, P.; Thomas, S.; Davey, J.; Gottesfeld, S. Recent advances in direct methanol fuel cells at los alamos national laboratory. J. Power Sources 2000, 86, 111–116. [Google Scholar] [CrossRef]
- Cassir, M.; Ringuede, A.; Lair, V. Molten carbonates from fuel cells to new energy devices. In Molten Salt Chemistry; Elsevier: Burlington, MA, USA, 2013. [Google Scholar]
- Zhao, Y.; Xia, C.; Jia, L.; Wang, Z.; Li, H.; Yu, J.; Li, Y. Recent progress on solid oxide fuel cell: Lowering temperature and utilizing non-hydrogen fuels. Int. J. Hydrog. Energy 2013, 38, 16498–16517. [Google Scholar] [CrossRef]
- Blanc, C.; Rufer, A. Understanding the vanadium redox flow batteries. In Paths to Sustainable Energy; InTech: Glasgow, UK, 2010. [Google Scholar]
- Skyllas-Kazacos, M.; Menictas, C. Redox flow batteries for medium- to large-scale energy storage. In Electricity Transmission, Distribution and Storage Systems; Woodhead Publishing Limited: Cambridge, MA, USA, 2013. [Google Scholar]
- Parasuramana, A.; Lima, T.M.; Menictasc, C.; Skyllas-Kazacos, M. Review of material research and development for vanadium redox flow battery applications. Electrochim. Acta 2013, 101, 27–40. [Google Scholar] [CrossRef]
- Superconductivity: Present and Future Applications. Available online: http://www.ccas-web.org/pdf/ccas_brochure_web.pdf (accessed on 25 December 2014).
- Ali, M.H.; Wu, B.; Dougal, R.A. An overview of smes applications in power and enegy systems. IEEE Trans. Sustain. Energy 2010, 1, 38–47. [Google Scholar] [CrossRef]
- Buckles, W.; Hassenzahl, W.V. Superconducting magnetic energy storage. Power Eng. Rev. 2000, May, 16–20. [Google Scholar] [CrossRef]
- Dai, T.; Tang, Y.; Shi, J.; Jiao, F.; Wang, L. Design of a 10 mj hts superconducting magnetic energy storage magnet. IEEE Trans. Appl. Supercond. 2010, 20, 1356–1359. [Google Scholar] [CrossRef]
- Sharma, P.; Bhatti, T.S. A review on electrochemical double-layer capacitors. Energy Convers. Manag. 2010, 51, 2901–2912. [Google Scholar] [CrossRef]
- Muthukumar, P. Thermal energy storage: Methods and materials. Indian Institute of Technology Guwahati: Sevilla, Spain, 2011. [Google Scholar]
- Kerskes, H.; Mette, B.; Bertsch, F.; Asenbeck, S.; Drück, H. Chemical energy storage using reversible solid/gas-reactions (cws)—results of the research project. Energy Procedia 2012, 30, 294–304. [Google Scholar] [CrossRef]
- Sharma, A.; Tyagi, V.V.; Chen, C.R.; Buddhi, D. Review on thermal energy storage with phase change materials and applications. Renew. Sustain. Energy Rev. 2009, 13, 318–345. [Google Scholar] [CrossRef]
- Farid, M.M.; Khudhair, A.M.; Razack, S.A.K.; Al-Hallaj, S. A review on phase change energy storage: Materials and applications. Energy Convers. Manag. 2004, 45, 1597–1615. [Google Scholar] [CrossRef]
- Thermal Energy Satorage: Technology Brief; International Renewable Energy Agency (IRENA): Abu Dhabi, UAE, 2013.
- Fischer, M.; Bruzzano, S.; Egenolf-Jonkmanns, B.; Zeidler-Fandrich, B.; Wack, H.; Deerberg, G. Thermal storage by thermoreversible chemical reaction systems. Energy Procedia 2014, 48, 327–336. [Google Scholar] [CrossRef]
© 2014 by the authors; licensee MDPI, Basel, Switzerland. This article is an open access article distributed under the terms and conditions of the Creative Commons Attribution license (http://creativecommons.org/licenses/by/4.0/).
Share and Cite
Sabihuddin, S.; Kiprakis, A.E.; Mueller, M. A Numerical and Graphical Review of Energy Storage Technologies. Energies 2015, 8, 172-216. https://doi.org/10.3390/en8010172
Sabihuddin S, Kiprakis AE, Mueller M. A Numerical and Graphical Review of Energy Storage Technologies. Energies. 2015; 8(1):172-216. https://doi.org/10.3390/en8010172
Chicago/Turabian StyleSabihuddin, Siraj, Aristides E. Kiprakis, and Markus Mueller. 2015. "A Numerical and Graphical Review of Energy Storage Technologies" Energies 8, no. 1: 172-216. https://doi.org/10.3390/en8010172