Article

Comparative Study of Two Daylighting Analysis Methods with Regard to Window Orientation and Interior Wall Reflectance

Department of Architectural Engineering, Hanbat National University, San 16-1, Dukmyeong-Dong, Yuseong-Gu, Daejeon 305-320, Korea
*
Author to whom correspondence should be addressed.
Energies 2014, 7(9), 5825-5846; https://doi.org/10.3390/en7095825
Submission received: 8 May 2014 / Revised: 8 August 2014 / Accepted: 2 September 2014 / Published: 5 September 2014
(This article belongs to the Special Issue Energy Efficient Building Design and Operation 2014)

Abstract

:
The accuracy and speed of the daylighting analysis developed for use in EnergyPlus is better than its predecessors. In EnergyPlus, the detailed method uses the Split-flux algorithm whereas the DElight method uses the Radiosity algorithm. Many existing studies have addressed the two methods, either individually or compared with other daylight analysis methods like Ray tracing but still there is lack of detailed comparative study of these two methods. Our previous studies show that the Split-flux method overestimates the illuminance, especially for the areas away from the window. The Radiosity method has the advantage of accurately predicting this illuminance because of how it deals with the diffuse light. For this study, the EnergyPlus model, which has been calibrated using data measured in a real building in previous studies, has also been used. The calibrated model has a south oriented window only. This model is then used to analyze the interior illuminance inside the room for north, west and east orientation of the window by rotating the model and by changing the wall reflectance of the model with south oriented window. Direct and diffuse component of the illuminance as well as the algorithms have been compared for a detailed analysis.

1. Introduction

1.1. Background and Purpose

Recently, the window area ratio in buildings is increasing. In fact, glass curtain walls are becoming more and more commonplace. Taking advantage of daylight to provide a more visual comfortable environment inside the building is being explored more actively nowadays. For this, accurate calculation of contribution of daylight for interior illuminance is very important. Many studies have been done regarding illuminance in interior space and decrease in energy consumption. Koshel [1] emphasized the significance of the illumination evaluating technology in the visual comfort of occupants and lighting energy in buildings. Nakamura [2] examined the estimation method for assessment of discomfort due to glare from window over a wide range of various source sizes.
Currently, many interior illuminance analysis software programs employing different algorithms are available for analysis of solar radiation through windows [3]. The solar radiation analysis algorithm methods that are most frequently used are the Radiosity method, Split-flux method and Ray-tracing method. Quite a few detailed and comparative studies have been carried out of these methods. Dong et al. [4] applied the simulation technique to design the LED lighting with the uniform irradiance for the proper optical design. Audenaert et al. [5] performed the parametric study to assess the impact of important input parameters on the accuracy of the ray tracing simulation results such as the bidirectional reflectance distribution function (BRDF). Luminous intensity distribution (LID) was simulated, which was validated against the measured data with a near-field goniophotometer. Although a good agreement between the measured and simulated LID was found, the luminance distributions only corresponded when the most accurate BRDF model was applied, indicating that more complex models are needed for evaluation of luminance distributions [5]. Tsangrassoulis et al. [6] performed the comparative study between Radiosity and Ray-tracing methods to analyse the daylight levels in atria under a variety of conditions. Hviid [7] suggested the combined approach between Radiosity and Ray-tracing techniques to develop a simple but accurate tool for the proper prediction of indoor daylight level. The coupled approach was compared against the Ray-tracing program and showed that the accuracy of the approach was adequate for predicting the energy implications of photo-responsive lighting control. Versage et al. [8] also compared the Split-flux and Ray-tracing algorithms and found that Split-flux method provided illuminance higher than actual as the distance from windows was increased. Robinson et al. [9,10] developed a simplified Radiosity algorithm to predict internal illumination in an urban context and compared with the ray-tracing method, which is very close to the ray-tracing method but the computation is drastically decreased. Tsangrassoulis et al. [11] developed the stand-alone model to predict the daylight performance and validated the model against the experimental data and the simulation results obtained from radiosity and ray-tracing methods. Yoon et al. [12] compared the illuminance results for a south facing window from Radiosity and Split-flux method and found that for summer solstice day, the difference in the data from two methods was greater far from the window whereas in winter solstice day, the difference was more near the window.
In EnergyPlus, either the Split-flux or Radiosity method can be used for calculation of interior illuminance. The Split-flux method in EnergyPlus is based on the daylighting calculation in DOE-2.1E [13,14]. A daylighting calculation is performed at each heat-balance time-step by interpolating the stored daylight factors using current sun position and sky condition and multiplying by the external horizontal illuminance. When the daylighting calculation was brought over from DOE-2.1E to EnergyPlus, sky type was increased from two to four and calculation of daylight factors was increased from twenty to hourly sun-path sun positions several times a year. This increased the accuracy of the program but, as Versage et al. found, this method provided higher illuminance values than actual [8]. This accuracy can be increased by replacing the Split-flux method with Radiosity method which was developed by Modest [14,15]. The Radiosity method developed by Modest was a general and relatively simple yet accurate and efficient model specifically for the prediction of daylight illumination [16,17]. The literature review shows how few comparative studies between Split-flux and Radiosity methods have been done. Moreover, it was observed that most of the studies done are for south-oriented windows. Modest clearly shows the position of windows being south oriented in his paper while developing the Radiosity algorithm which has been incorporated into the EnergyPlus.
Yoon et al. [12] performed an analytical study of Split-flux and Radiosity method and compared with real time data for comparative study of the two algorithms. It was found that the illuminance resulted from Radiosity method is closer to real time data than Split-flux method. This study was done for the south oriented window only. To have a better understanding of how these two daylighting analysis methods give results for windows oriented other than south, this study has been done. Thus, the objective of this study is to investigate the consistency of the two daylight analysis methods in EnergyPlus for windows that are oriented north, east and west. The interior illuminance is calculated at 42 reference points inside a room for four different window locations—south, north, east and west. In each condition there is only one window in the investigated orientation. Also, the wall reflectance is changed, to check how the resultant values change at the furthest reference points in the two methods. The interior illuminance is compared in total and also as the direct and diffuse component. The algorithms are also compared to understand the final result from the two methods.

1.2. Research Scope

In this paper, the previously calibrated EnergyPlus model carried out in previous studies has been used. The room where the testing was carried out for calibration is the “J” building in South Korea. EnergyPlus v6.0 was used for energy modeling and calibration. The calibrated model was rotated to analyze the interior illuminance level from the windows oriented south, north, east and west, to see whether the results are consistent, i.e., whether the results for north, east and west are similar to the ones for south orientation. Then the wall reflectance was changed for the South oriented room from 0.1–0.9. Both Radiosity and Split-flux methods were used for the simulation and for detailed study, the algorithms of both methods were studied.

2. Simulation Overview and Theoretical Background

2.1. Simulation Software

The simulation software used is EnergyPlus v6.0. It is a dynamic building simulation software developed by Department of Energy U.S.A. It comprises the best features of DOE-2 and BLAST [13,14]. The Split-flux method was brought over from DOE-2.1E and more features were added and is known as EnergyPlus Detailed methods [13,14,18,19]. The Radiosity method was integrated from the DElight program [14,16,18,19] and is known as DElight Daylighting calculations [14].

2.2. Simulation Modelling

The building model used in EnergyPlus is the same size as the testing room used for the experimental study with wall reflectance of 0.3. The specifications of the window used are given in Table 1 and there is no mechanical heating or cooling provided in the room. The weather data used for simulation is derived from Meteonorm. DOE recommends that if weather station data is not available then it is recommended to use data generated from Meteonorm program [20]. As this testing building is located near Seoul, weather data for Seoul is used. The energy model used in this study is the same one as for the study done by Yoon et al. [12], where the model is calibrated using mean air temperature and illuminance values recorded in experimental data. For more information about validation and calibration of the simulated model, see [12].
Table 1. Specifications of simulated Window.
Input data6 mm Clear
Solar transmittance0.765
Front side solar reflectance0.073
Back side solar reflectance0.073
Visible transmittance0.878
Front side visible reflectance0.083
Back side visible reflectance0.083
Front side infrared hemispherical emissivity0.42
Back side infrared hemispherical emissivity0.42
Conductivity (W/mK)0.9
Dirt correction factor for solar and visible transmittance1
Solar diffusionNo

2.3. Analysis of Algorithm

In EnergyPlus, there are two methods for daylight analysis, namely, Detailed and DElight. The analysis in both methods is done in three steps. First the interior illuminance is calculated using either Split-flux or Radiosity algorithm for different sky types at each reference point. Then, six Daylight Factors are calculated and stored. Daylight factor is calculated by dividing the interior illuminance by exterior horizontal illuminance. Finally, the time-step illuminance at reference point is calculated by interpolating the stored Daylight factors and multiplied by the exterior horizontal illuminance for every hour the sun is up [14].
In the Split flux method, the interior illuminance is given by the following equation [14,21]:
Energies 07 05825 i001
where,
  • Lw = Luminance for window;
  • dΩ = subtended solid angle from window on reference point;
  • γ = angle between the line joining reference point and center of (x, y) patch on window and vertical line.
For the Radiosity method, the interior illuminance is given by the following equation [22,23]:
Energies 07 05825 i002
where,
  • Ljl = Luminance of internal surface patch “jl”;
  • Fik→jl = Form factor or light-weight factor;
  • Lcik = directly transmitted luminance from window;
  • Nj and N = Number of inside wall surface patch.
Window luminance is present in equations of each method, Lw and Lcik. The calculation of the two methods is given by following equations:
The Split-flux equation for window transmitted solar is [12,14,19]:
Lw = LτVIS(cos B)
where,
  • Lw = Luminance for window;
  • L = Luminance of sky or obstruction;
  • τVIS = visible transmittance of glass at angle B;
  • B = angle between line joining reference point and center of (x, y) patch on window and window normal.
The Radiosity equation for window transmitted solar is [14,16,19,24]:
Energies 07 05825 i003
where,
  • Lcik = directly transmitted luminance from window;
  • Fik→jl = purely geometric coefficients called form factor;
  • τik−jl = Transmissivity of window between ik patch under consideration and jl patch on window;
  • Lp = Luminance of outside surface or sky from which light beam can travel;
  • δc = denotes if direct sunshine falls on inside node (δc = 1) or not (δc = 0);
  • τik−s = Transmissivity of window between patch ik and patch on sky dome as seen from window;
  • Es = direct solar illumination perpendicular to rays;
  • βsik = angle between window surface (ik patch) normal and the unit vector pointing towards the sun;
  • Nj = Number of outside surface patch;
  • Nc + Nsw = Number of clear window and opaque walls on model surface.
The time-step interior illuminance is the product of interpolated DF and the time-step exterior horizontal illuminance. Although EnergyPlus provides extensive equations for Split-flux method, even including the time-step equations, for Radiosity method, no equations are given in the EnergyPlus reference manual, only references are provided. A comprehensive set of equations, that is available only for Split-flux method, is given below. The time-step interior calculation is done using following algorithm [14,19,22,24,25,26]:
Energies 07 05825 i004
where,
  • Itot(iL) = Net illuminance at reference point iL;
  • is = window shade index (unshaded = 1, shaded = 2);
  • Iwin(is, iL) = Interior illuminance at point iL.
where,
Iwin(is, iL) = đsunEh,sun + [đsky,k(is, iL)fk + đsky,k′(is, iL)fk′]Eh,sky
where,
  • đsunsky,ksky,k′ = interpolated daylight factors for sun and skies k and k′;
  • Eh,sun/Eh,sky = exterior horizontal illuminance from sun and sky;
  • fk/fk′ = fraction of horizontal illuminance from sky due to sky type k and k′;
and,
Eh,sun = ηdir Snorm,dir cos Z
Eh,sky = ηdif Sh,dir
where,
  • Snorm,dir = Direct normal solar irradiance;
  • Sh,dir = Exterior direct horizontal solar irradiance;
  • Z = solar zenith angle;
  • ηdir = luminous efficacy of direct radiation from sun;
  • ηdif = luminous efficacy of diffuse solar radiation from sky.

3. Analysis

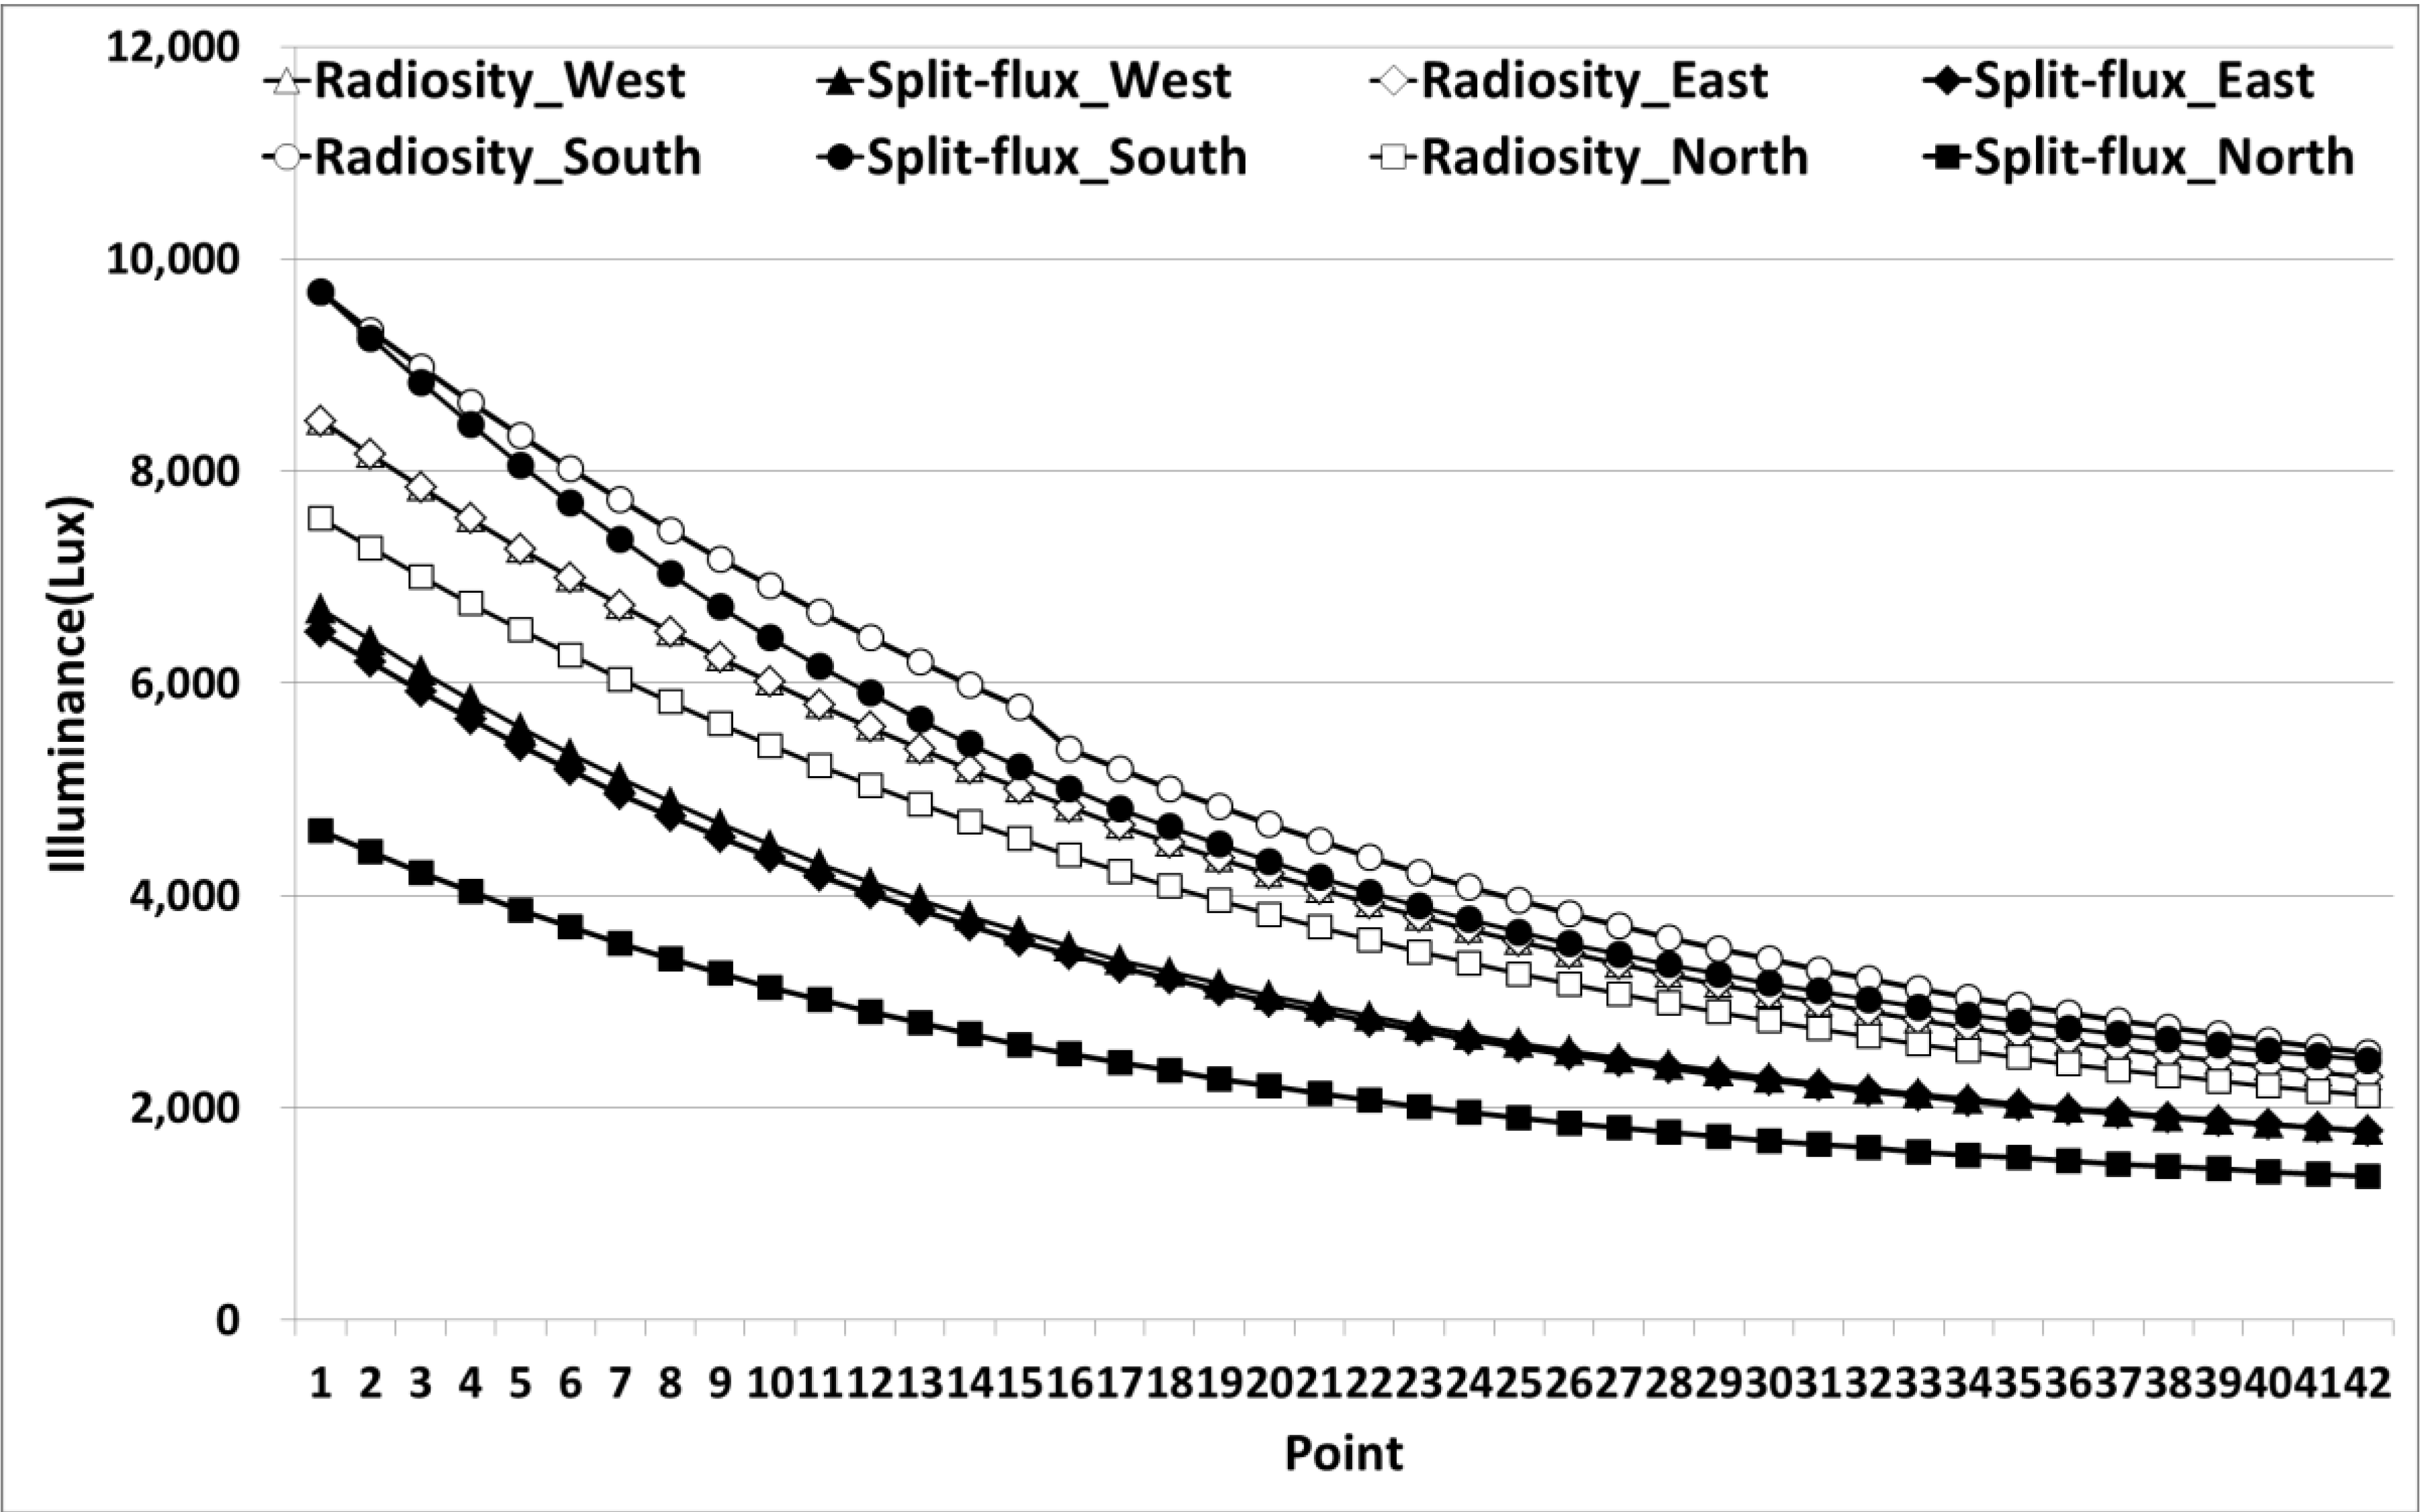
3.1. Analysis of Interior Illuminance for Various Orientation of Window

For the analysis, 42 reference points are used for simulation, so that gradual changes can be observed. Figure 1 shows the interior illuminance at 42 reference points at 13:00 inside the daylit zone with window oriented to East, West, South and North from two daylight analysis methods in EnergyPlus—Split-flux (Equations (5) and (6)) and Radiosity. On the chosen day, 27 June, there was a clear sky. In the case of the south oriented window, the Radiosity and Split-flux illuminance values are almost the same for the first point, which is closest to the window and is very similar at the last point as well but in the middle, Radiosity value is more than the Split-flux value. For other three orientations, the Radiosity value is much more than the Split-flux value. This difference is reduced for the points further away from the window. At 13:00, the sun is almost overhead, so the light coming from east and west will be almost the same, which can be seen from the graph where illuminance value for East and West in both methods is almost the same. Consequently, the illuminance value for south oriented sun is the highest than other orientations. For the south orientation, the difference between the illuminance values from the two methods is very small, but for other orientations this difference is very significant, as can be seen from the graph. To understand more about this phenomenon, illuminance at different times in the day for south, north and west orientations is analyzed.
Figure 1. Interior illuminance at 42 reference points for four orientations of window.
Energies 07 05825 g001

3.2. Analysis of Interior Illuminance at Different Time

3.2.1. Analysis for West Orientation

Figure 2 shows interior illuminance at three different times of the day with west oriented window. The “_9, _13 and _18” denotes the time at 09:00, 13:00 and 18:00 in Figure 2 and the graphs following (Figure 3, Figure 4, Figure 5 and Figure 6), unless otherwise specified. At all times and in both methods, the illuminance values decrease as the distance from the window increases, similar to Figure 1. More importantly, in the case of Split-flux method as calculated by Equations (5) and (6), the illuminance value at 18:00 is higher than for 13:00, and the lowest value is at 09:00. The illuminance level at 18:00 is almost five times higher than illuminance at 09:00. However, in the case of the Radiosity method, the value at 13:00 is higher than 18:00 and 09:00, where the value for 18:00 and 09:00. is almost same. Near the window the difference between illuminance values at 13:00 and 09:00/18:00 is much larger than at the furthest point. In fact, the difference gradually decreases as the distance increases. This is due to the time-step algorithm developed in the Split-flux method and is illustrated in more detail in Section 3.3 and Section 3.4; and described in more detail in Section 3.5.
Figure 2. Interior illuminance at 42 reference points at 09:00, 13:00 and 18:00 for West orientation of window.
Energies 07 05825 g002

3.2.2. Analysis for South Orientation

For a south oriented window, the illuminance values given by both methods show that the 13:00 illuminance is higher than at 09:00 and the lowest is at 18:00, as shown in Figure 3. The illuminance values given by Radiosity method is slightly higher than those given by Split-flux method, which is significantly more in case of 09:00, more so at the points near to the window than those which are further away. The illuminance level decreases as the distance from the window increases. In case of 09:00 near the window, the Radiosity value is more than the Split-flux value but at almost the mid-point of the reference points the values switch over. In split flux, the diffuse illuminance is averaged to give the final illuminance at reference point, but for Radiosity, the diffuse illuminance is related to the light form factors to give a more realistic result as is demonstrated by Equations (1) and (2).

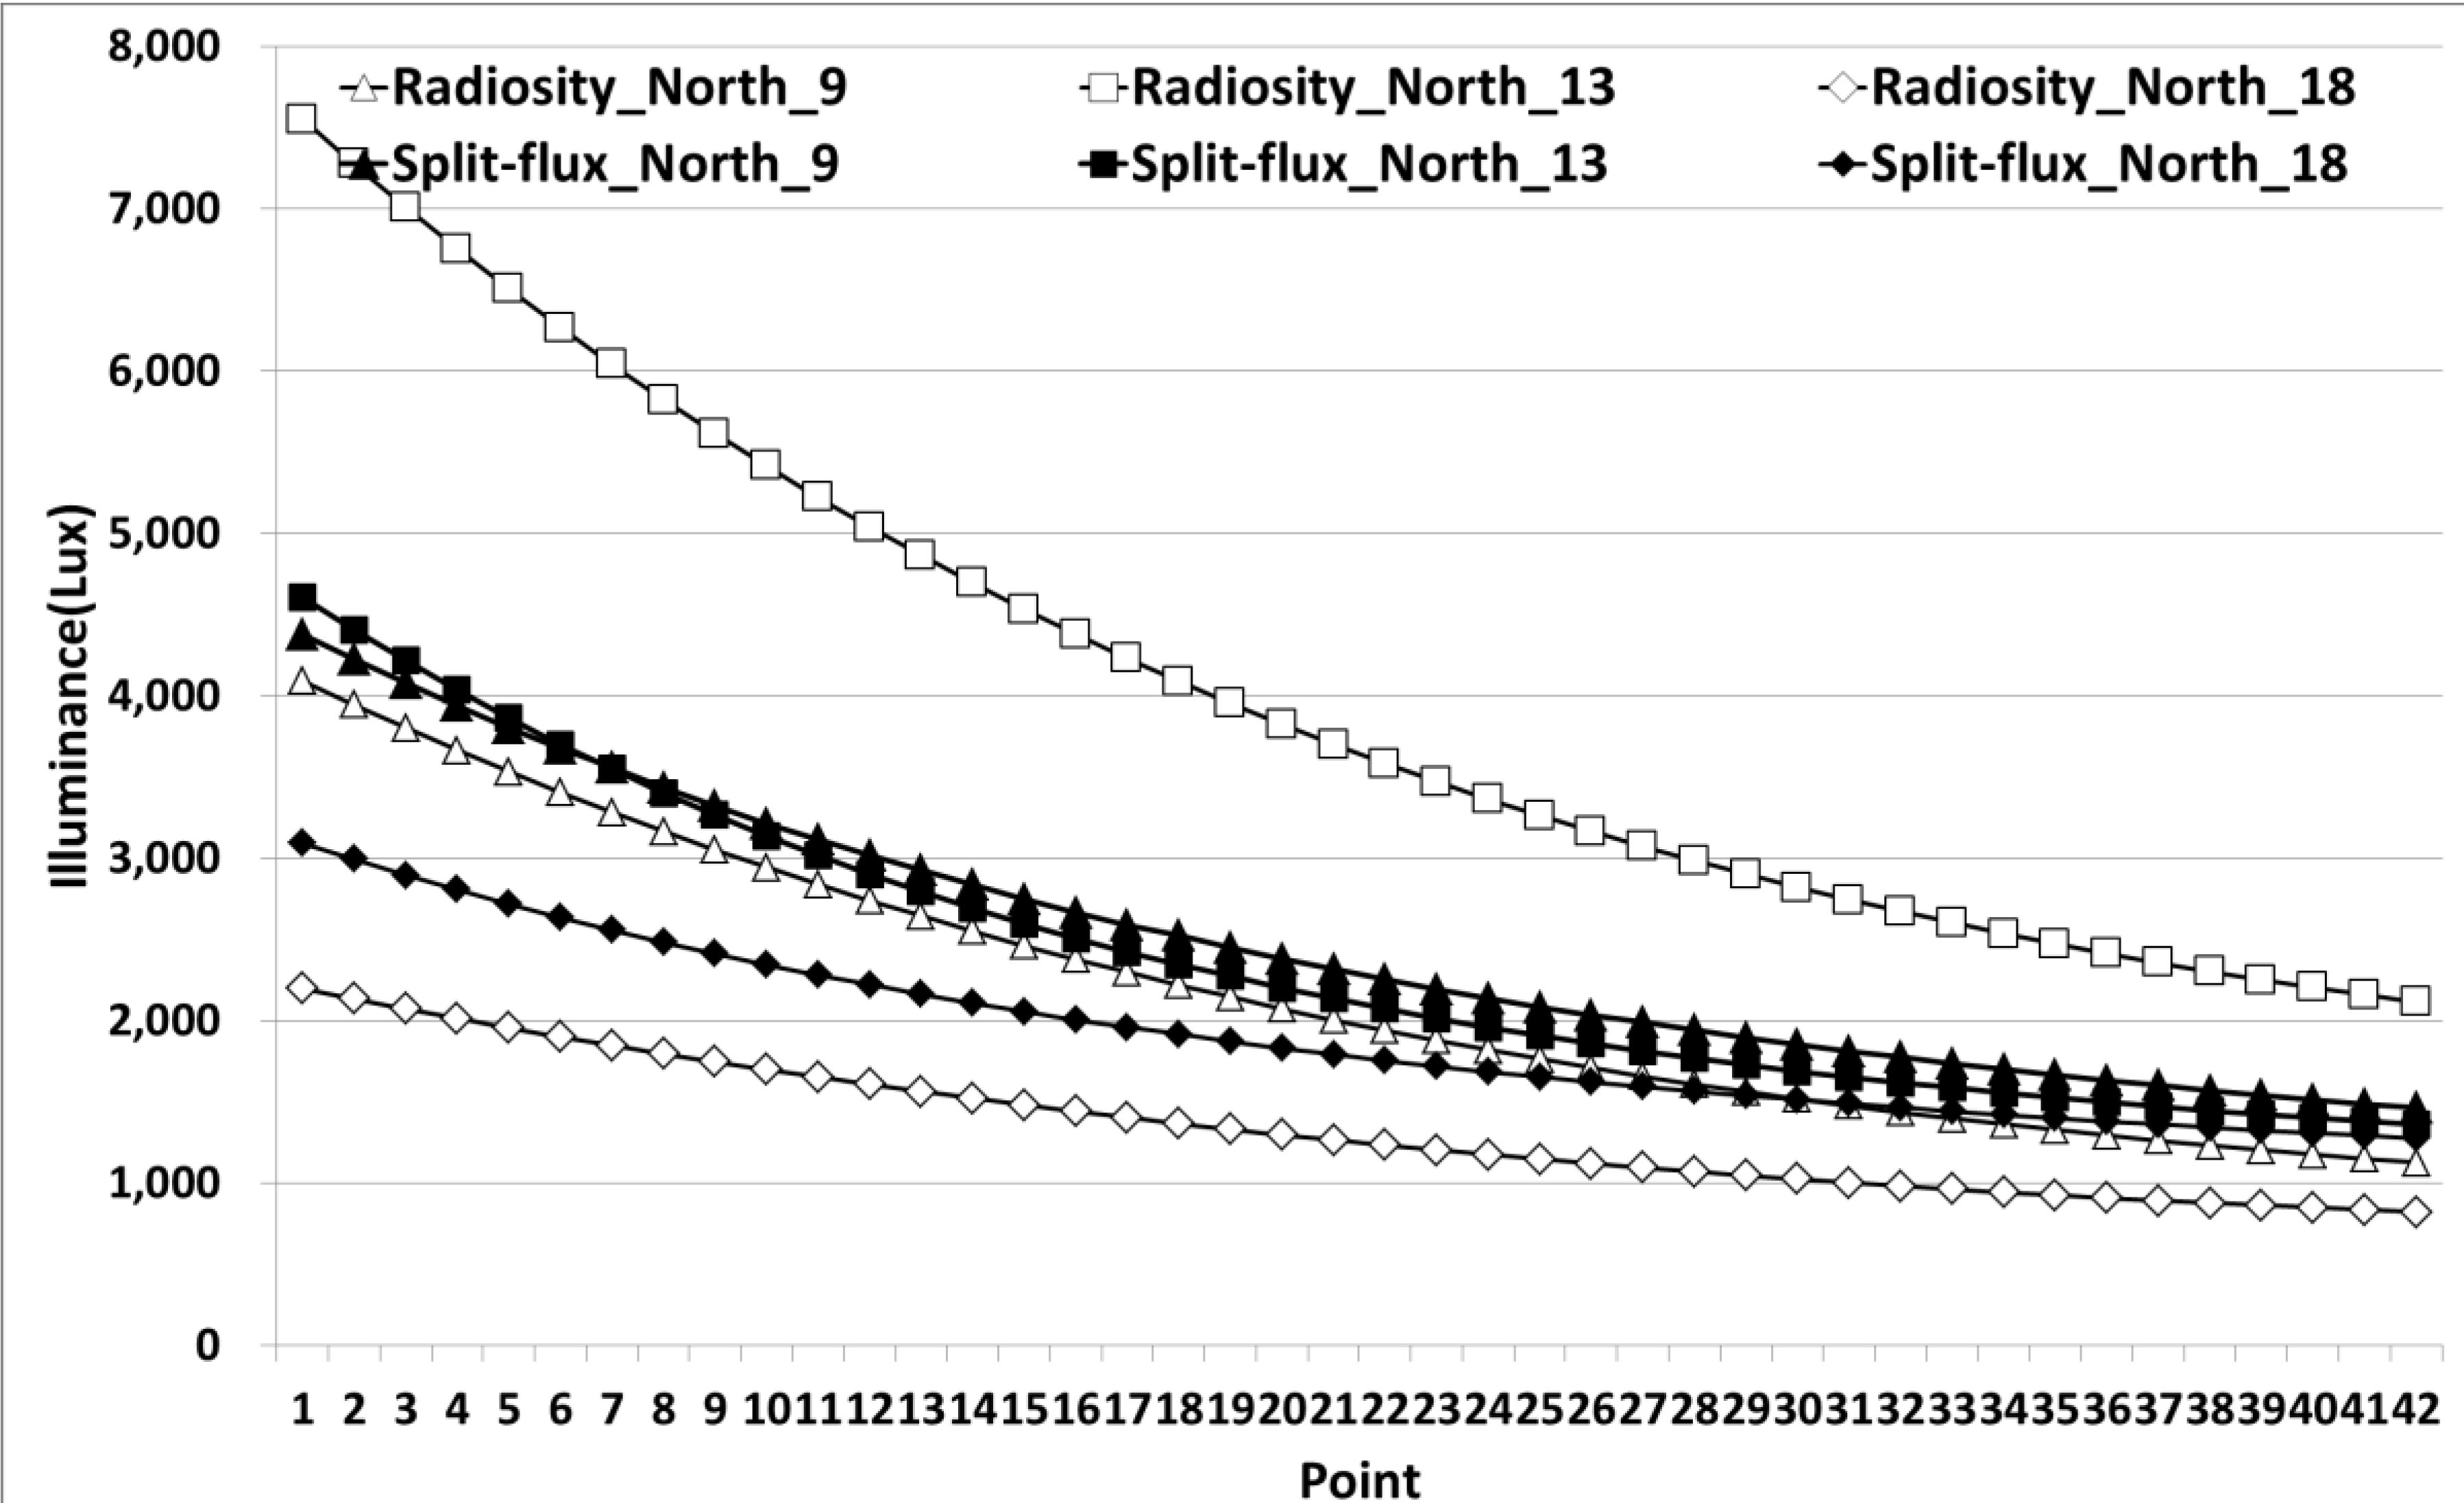
3.2.3. Analysis for North Orientation

In Figure 4, also in the case of north orientation, the illuminance values given by Radiosity method are much higher than the values given by Split-flux method. The illuminance levels decrease as the distance from the window increases. In the case of Radiosity method, the illuminance value at 13:00 is highest, then at 09:00 and the lowest is at 18:00. This is similar to south orientation where the illuminance at 13:00 is highest. This is because at 13:00 the exterior illuminance is at its highest point. This is described in further detail in Section 3.5. In case of Split-flux method, the pattern starts out the same near the window but after the eighth point, the illuminance level at 09:00 becomes higher than that at 13:00. Although the Radiosity illuminance value at 13:00 is higher than that of the Split-flux method, for 09:00 and 18:00, the Split-flux method is higher than that of Radiosity method. This can be attributed to how the Split-flux algorithm treats diffuse illuminance and sometimes even over predicts the diffuse illuminance inside the room, which can be clearly seen from the diffuse illuminance graph shown below.
Figure 3. Interior illuminance at 42 reference points at 09:00, 13:00 and 18:00 for South orientation of window.
Energies 07 05825 g003
Figure 4. Interior illuminance at 42 reference points at 09:00, 13:00 and 18:00 for North orientation of window.
Energies 07 05825 g004

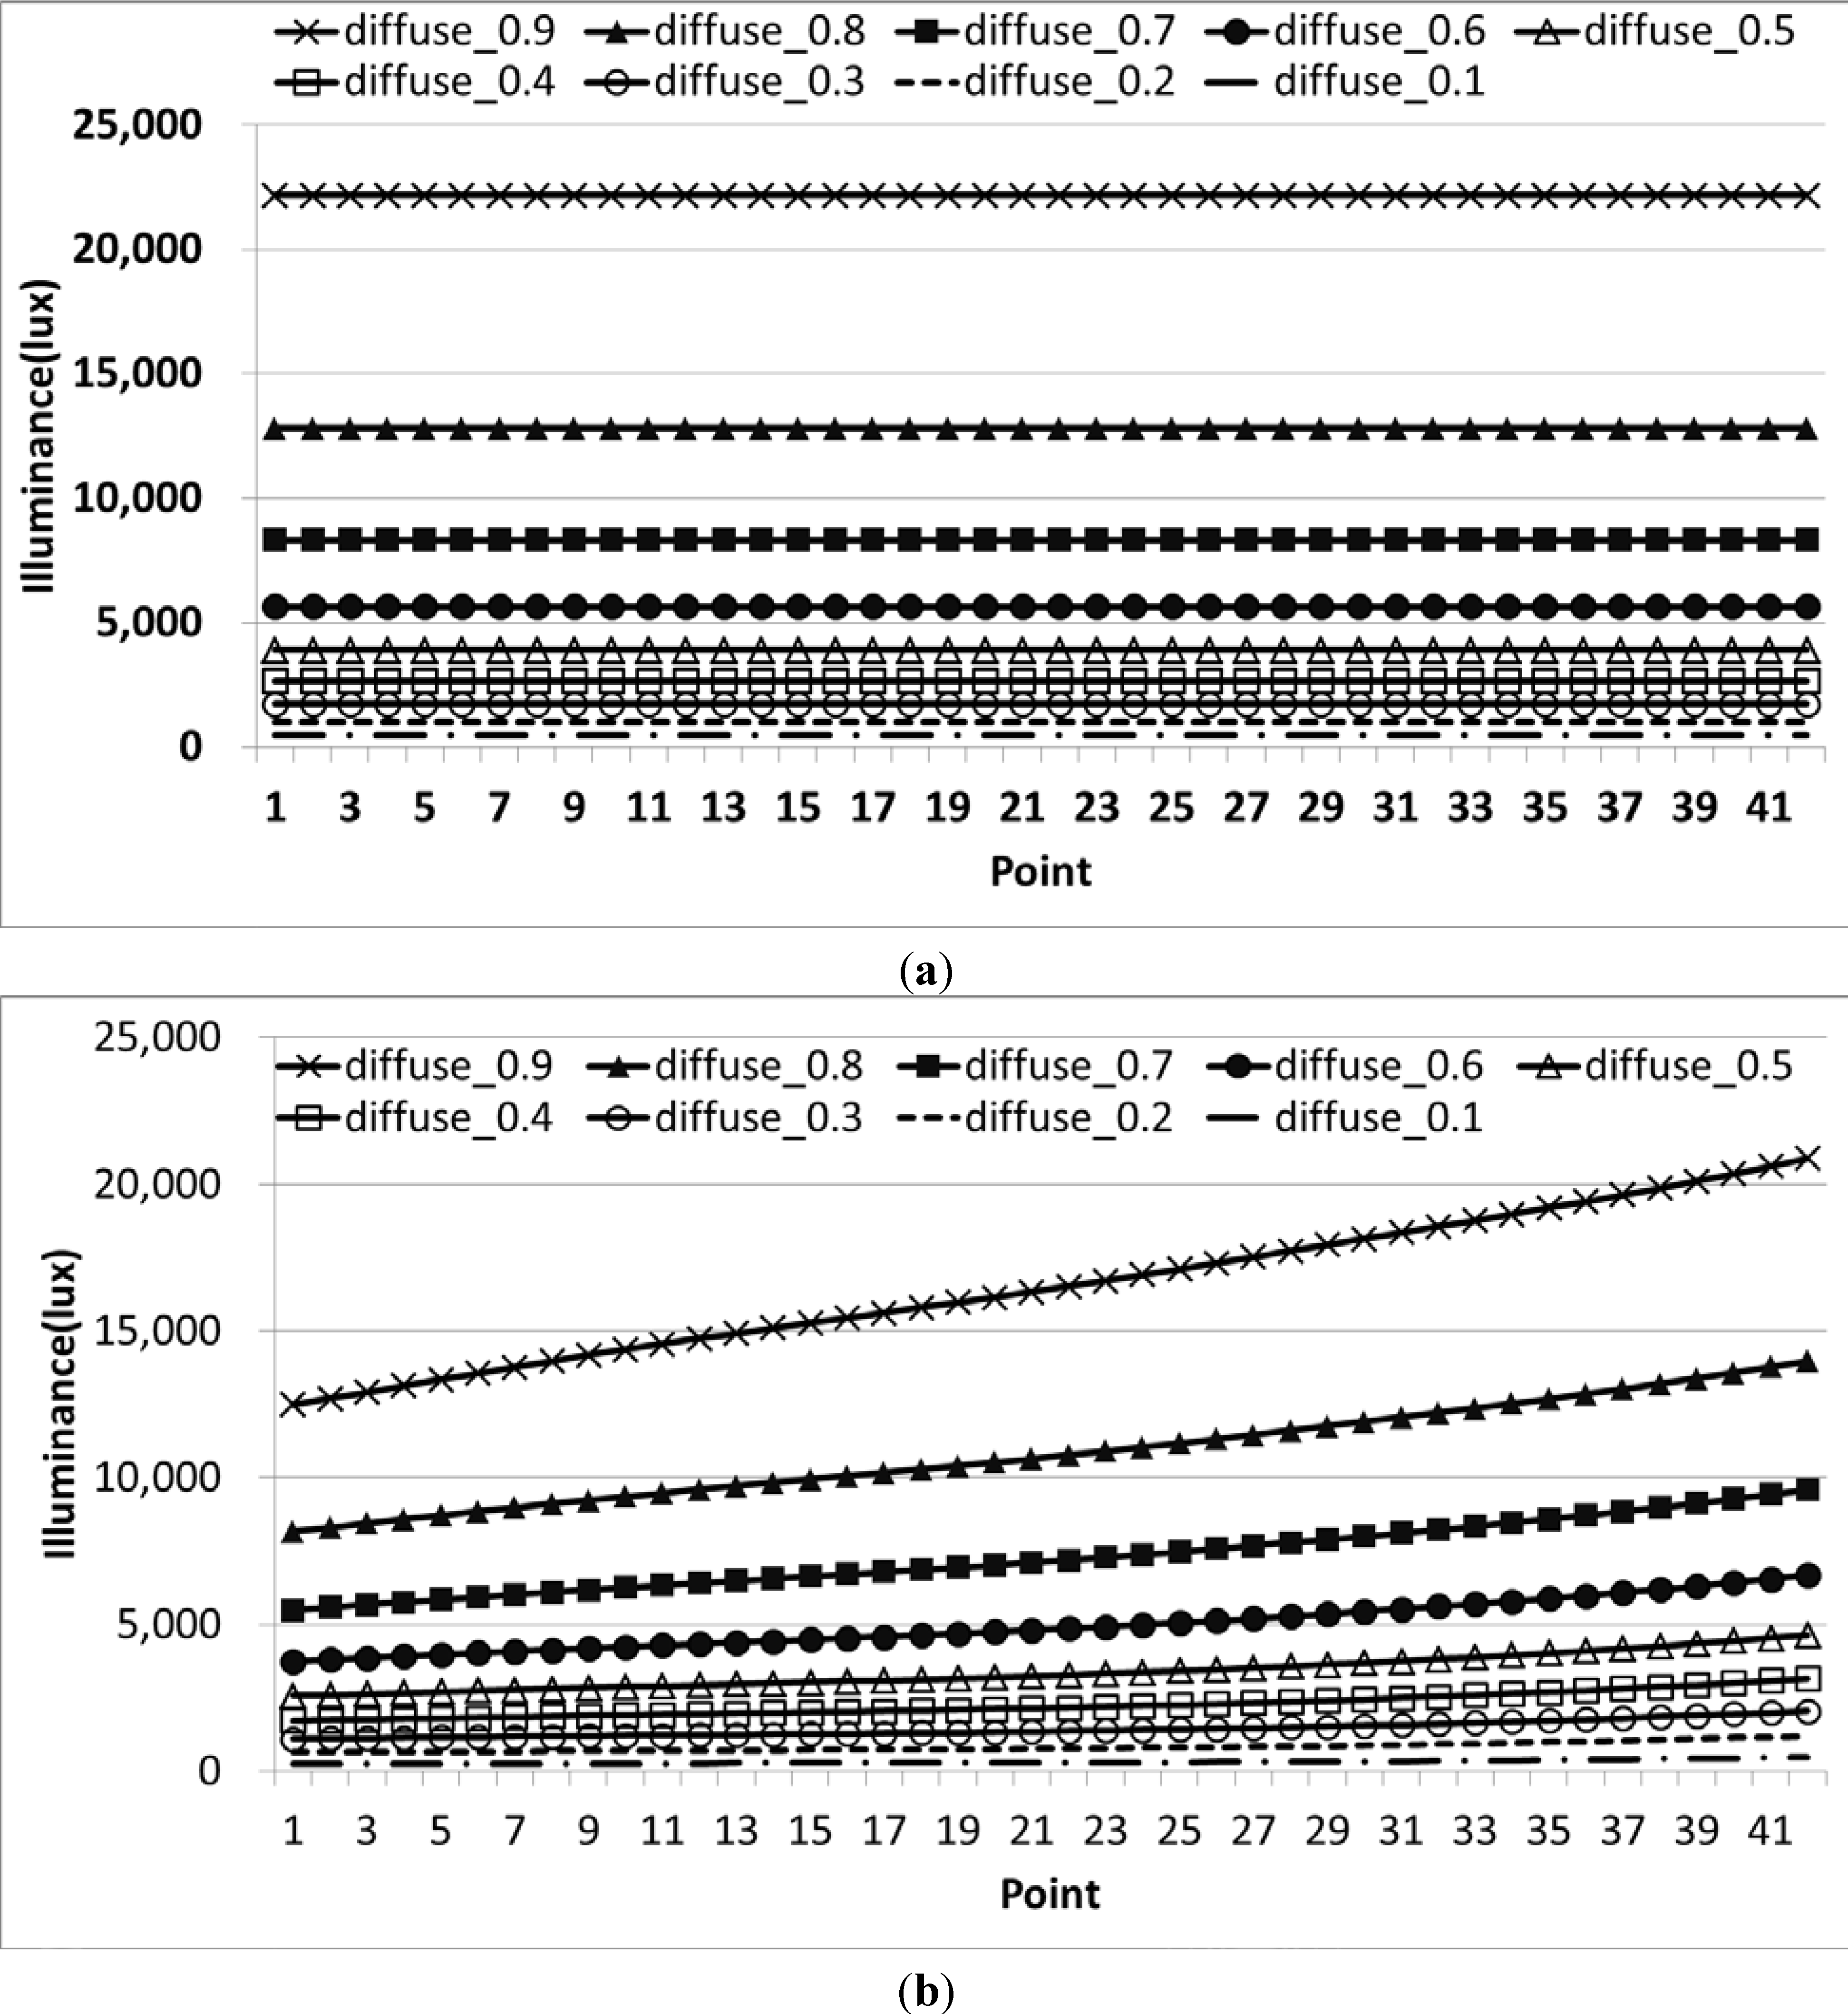
3.3. Analysis of Direct and Diffuse Illumianance

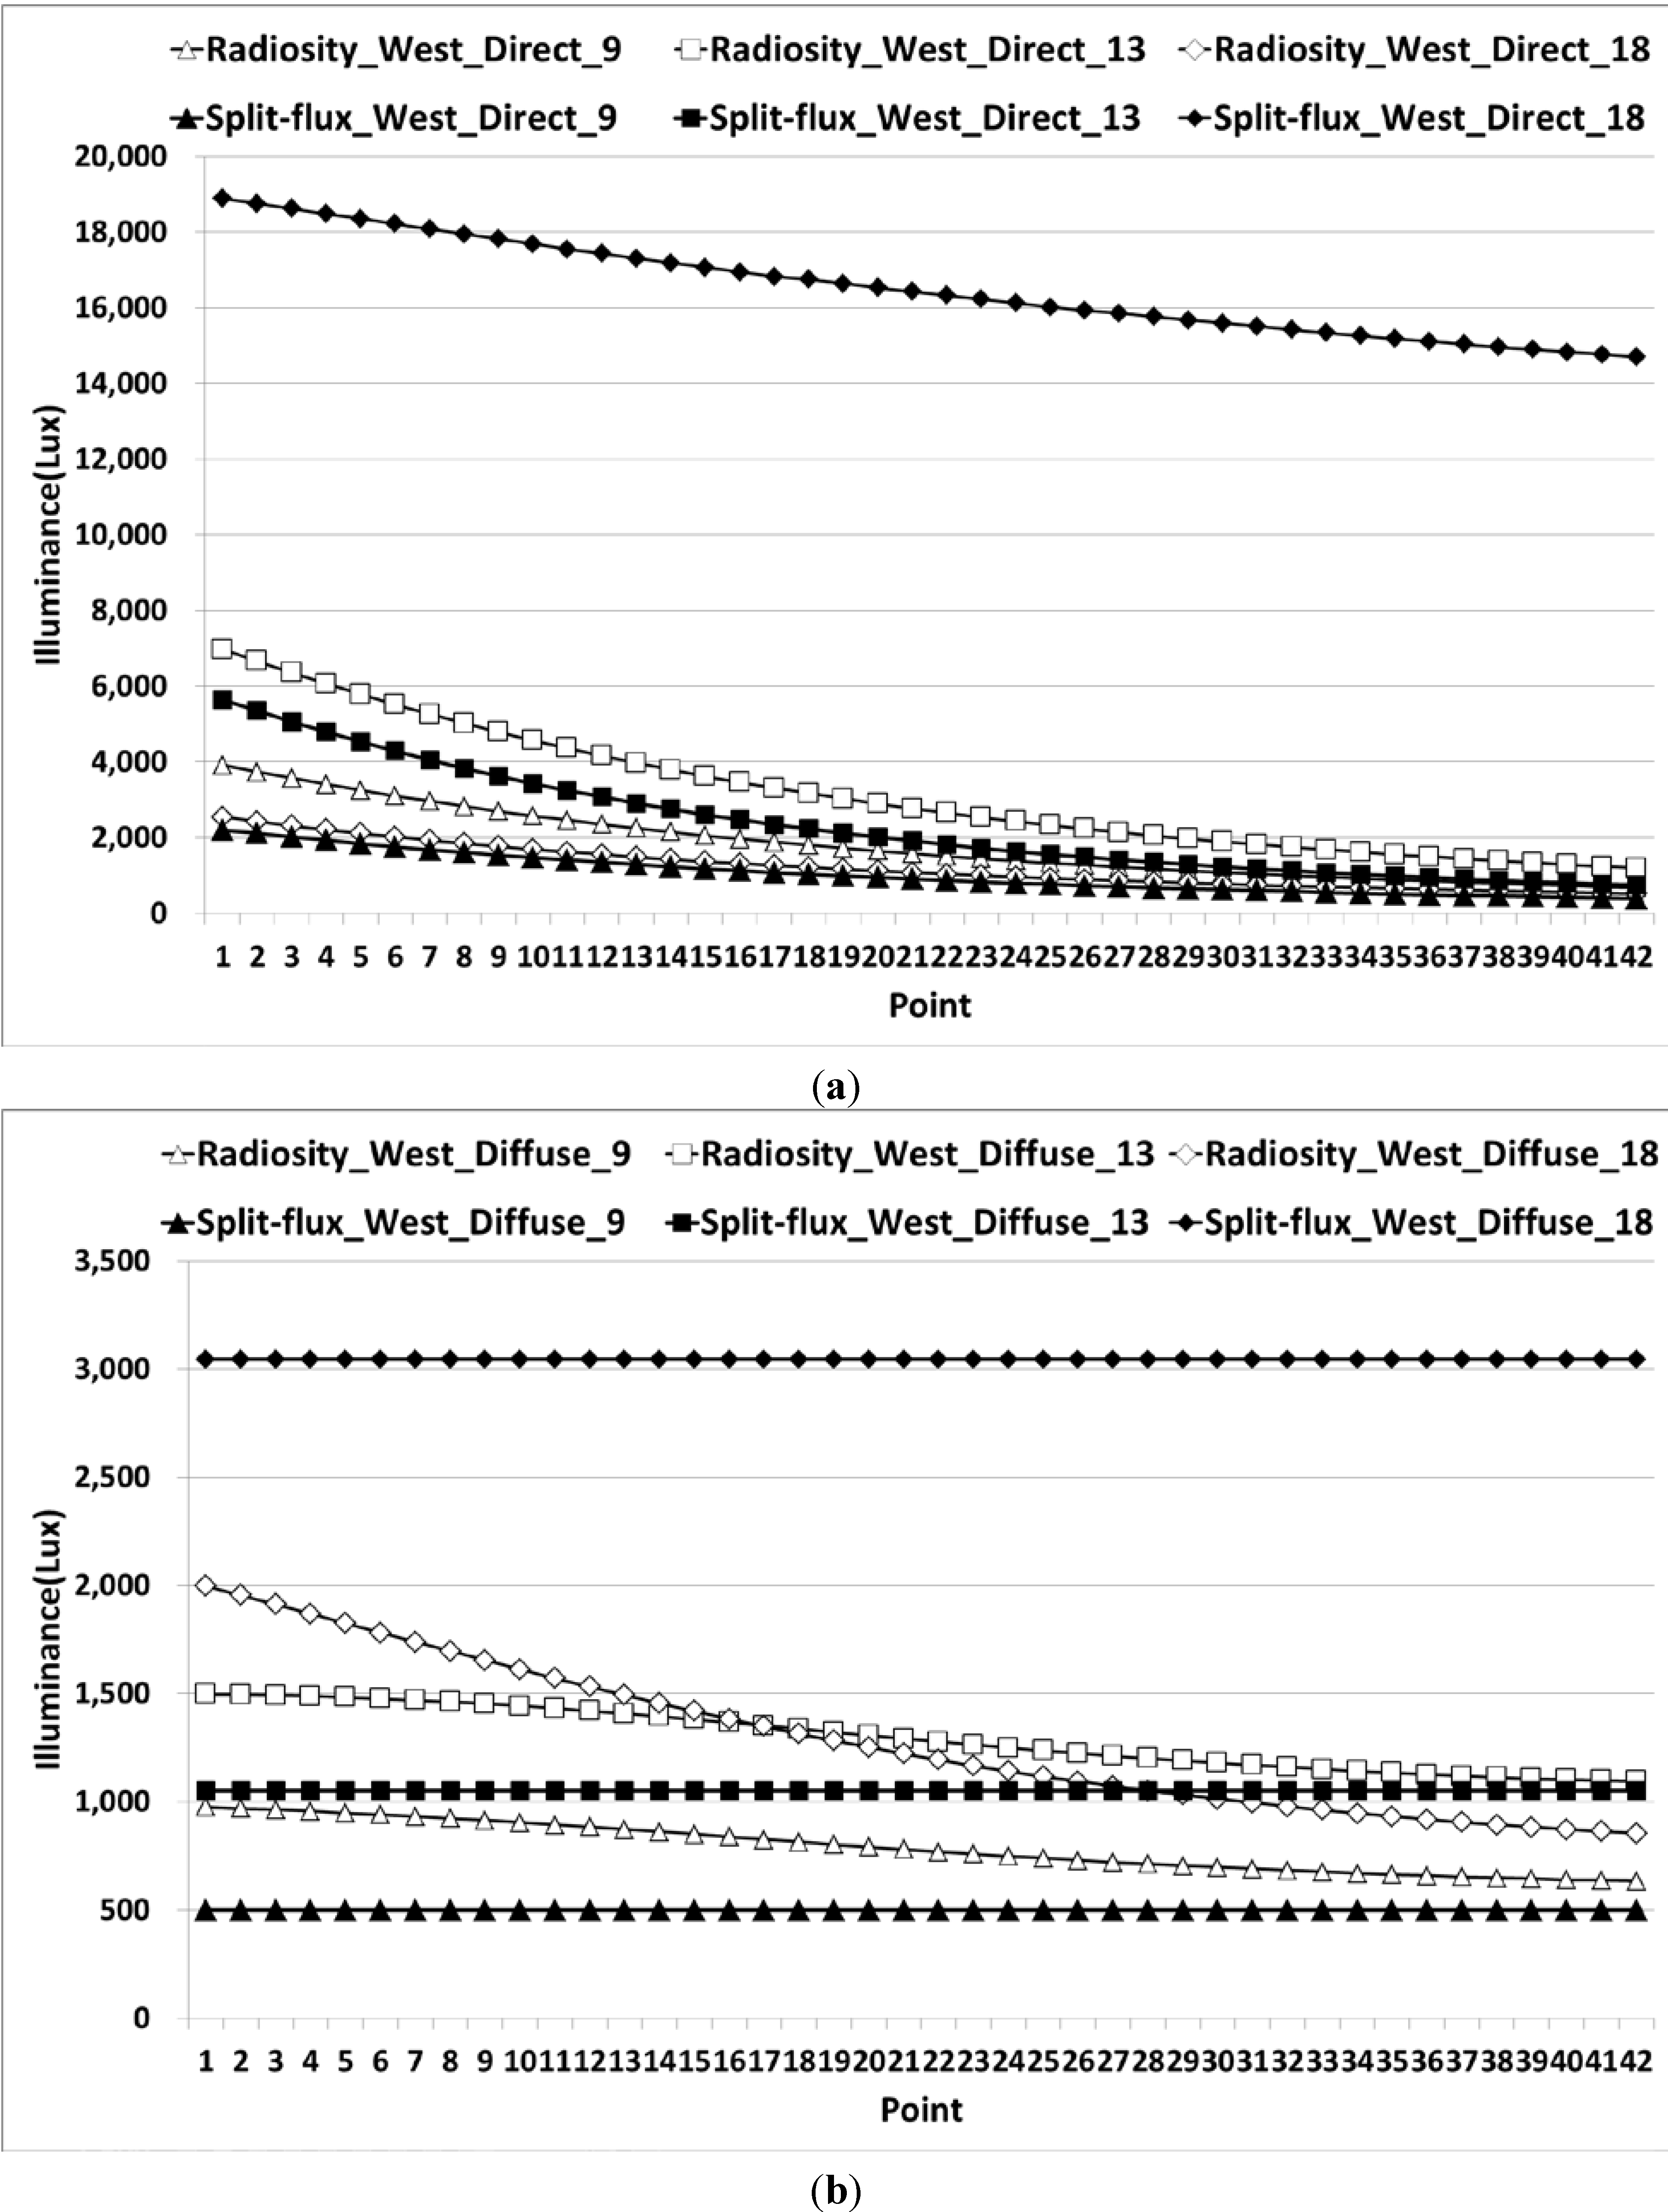
3.3.1. Analysis of Direct and Diffuse Illumianance for West Orientation of Window

To calculate the interior illuminance at reference point, EnergyPlus daylight analysis methods analyze both the direct and diffuse components. The following graphs, Figure 5a,b and Figure 6a,b illustrate how Radiosity and Split-flux methods calculate the direct and diffuse illuminance. The equations related to Section 3.3.1, Section 3.3.2 and Section 3.4 for direct and diffuse components have been given in previous studies, so in this study these sections only illustrate the illuminance patterns [21]. Figure 5a,b show the direct and diffuse illuminance values at the 42 reference points respectively for West orientation and Figure 6a,b show illuminance values for South orientation. Figure 5a shows that the direct illuminance is very high compared to diffuse illuminance as shown in Figure 5b. At 18:00, direct illuminance from Split-flux method at first point is almost 17,000 lux but from the Radiosity method it is barely more than 2000 lux. In Figure 5a, the direct illuminance graphs follow the same pattern as Figure 2. In this case, the illuminance level decreases as the distance from the window increases, but for the Split-flux method, it remains constant. At 18:00 the illuminance is about 3045 lux, at 13:00 it is 1051 lux and at 09:00, it is only 501 lux. In the case of Radiosity, at the first point, difference between illuminance values at 13:00 and 18:00 is almost 500 lux, but after the 17th point, illuminance at 18:00 becomes higher than at 13:00.
Figure 5. Direct and Diffuse interior illuminance from Split-flux and Radiosity at 09:00, 13:00 and 18:00 for West orientation of window: (a) interior direct illuminance at 09:00, 13:00 and 18:00 for West orientation of window; (b). interior diffuse illuminance at 09:00, 13:00 and 18:00 for West orientation of window.
Energies 07 05825 g005

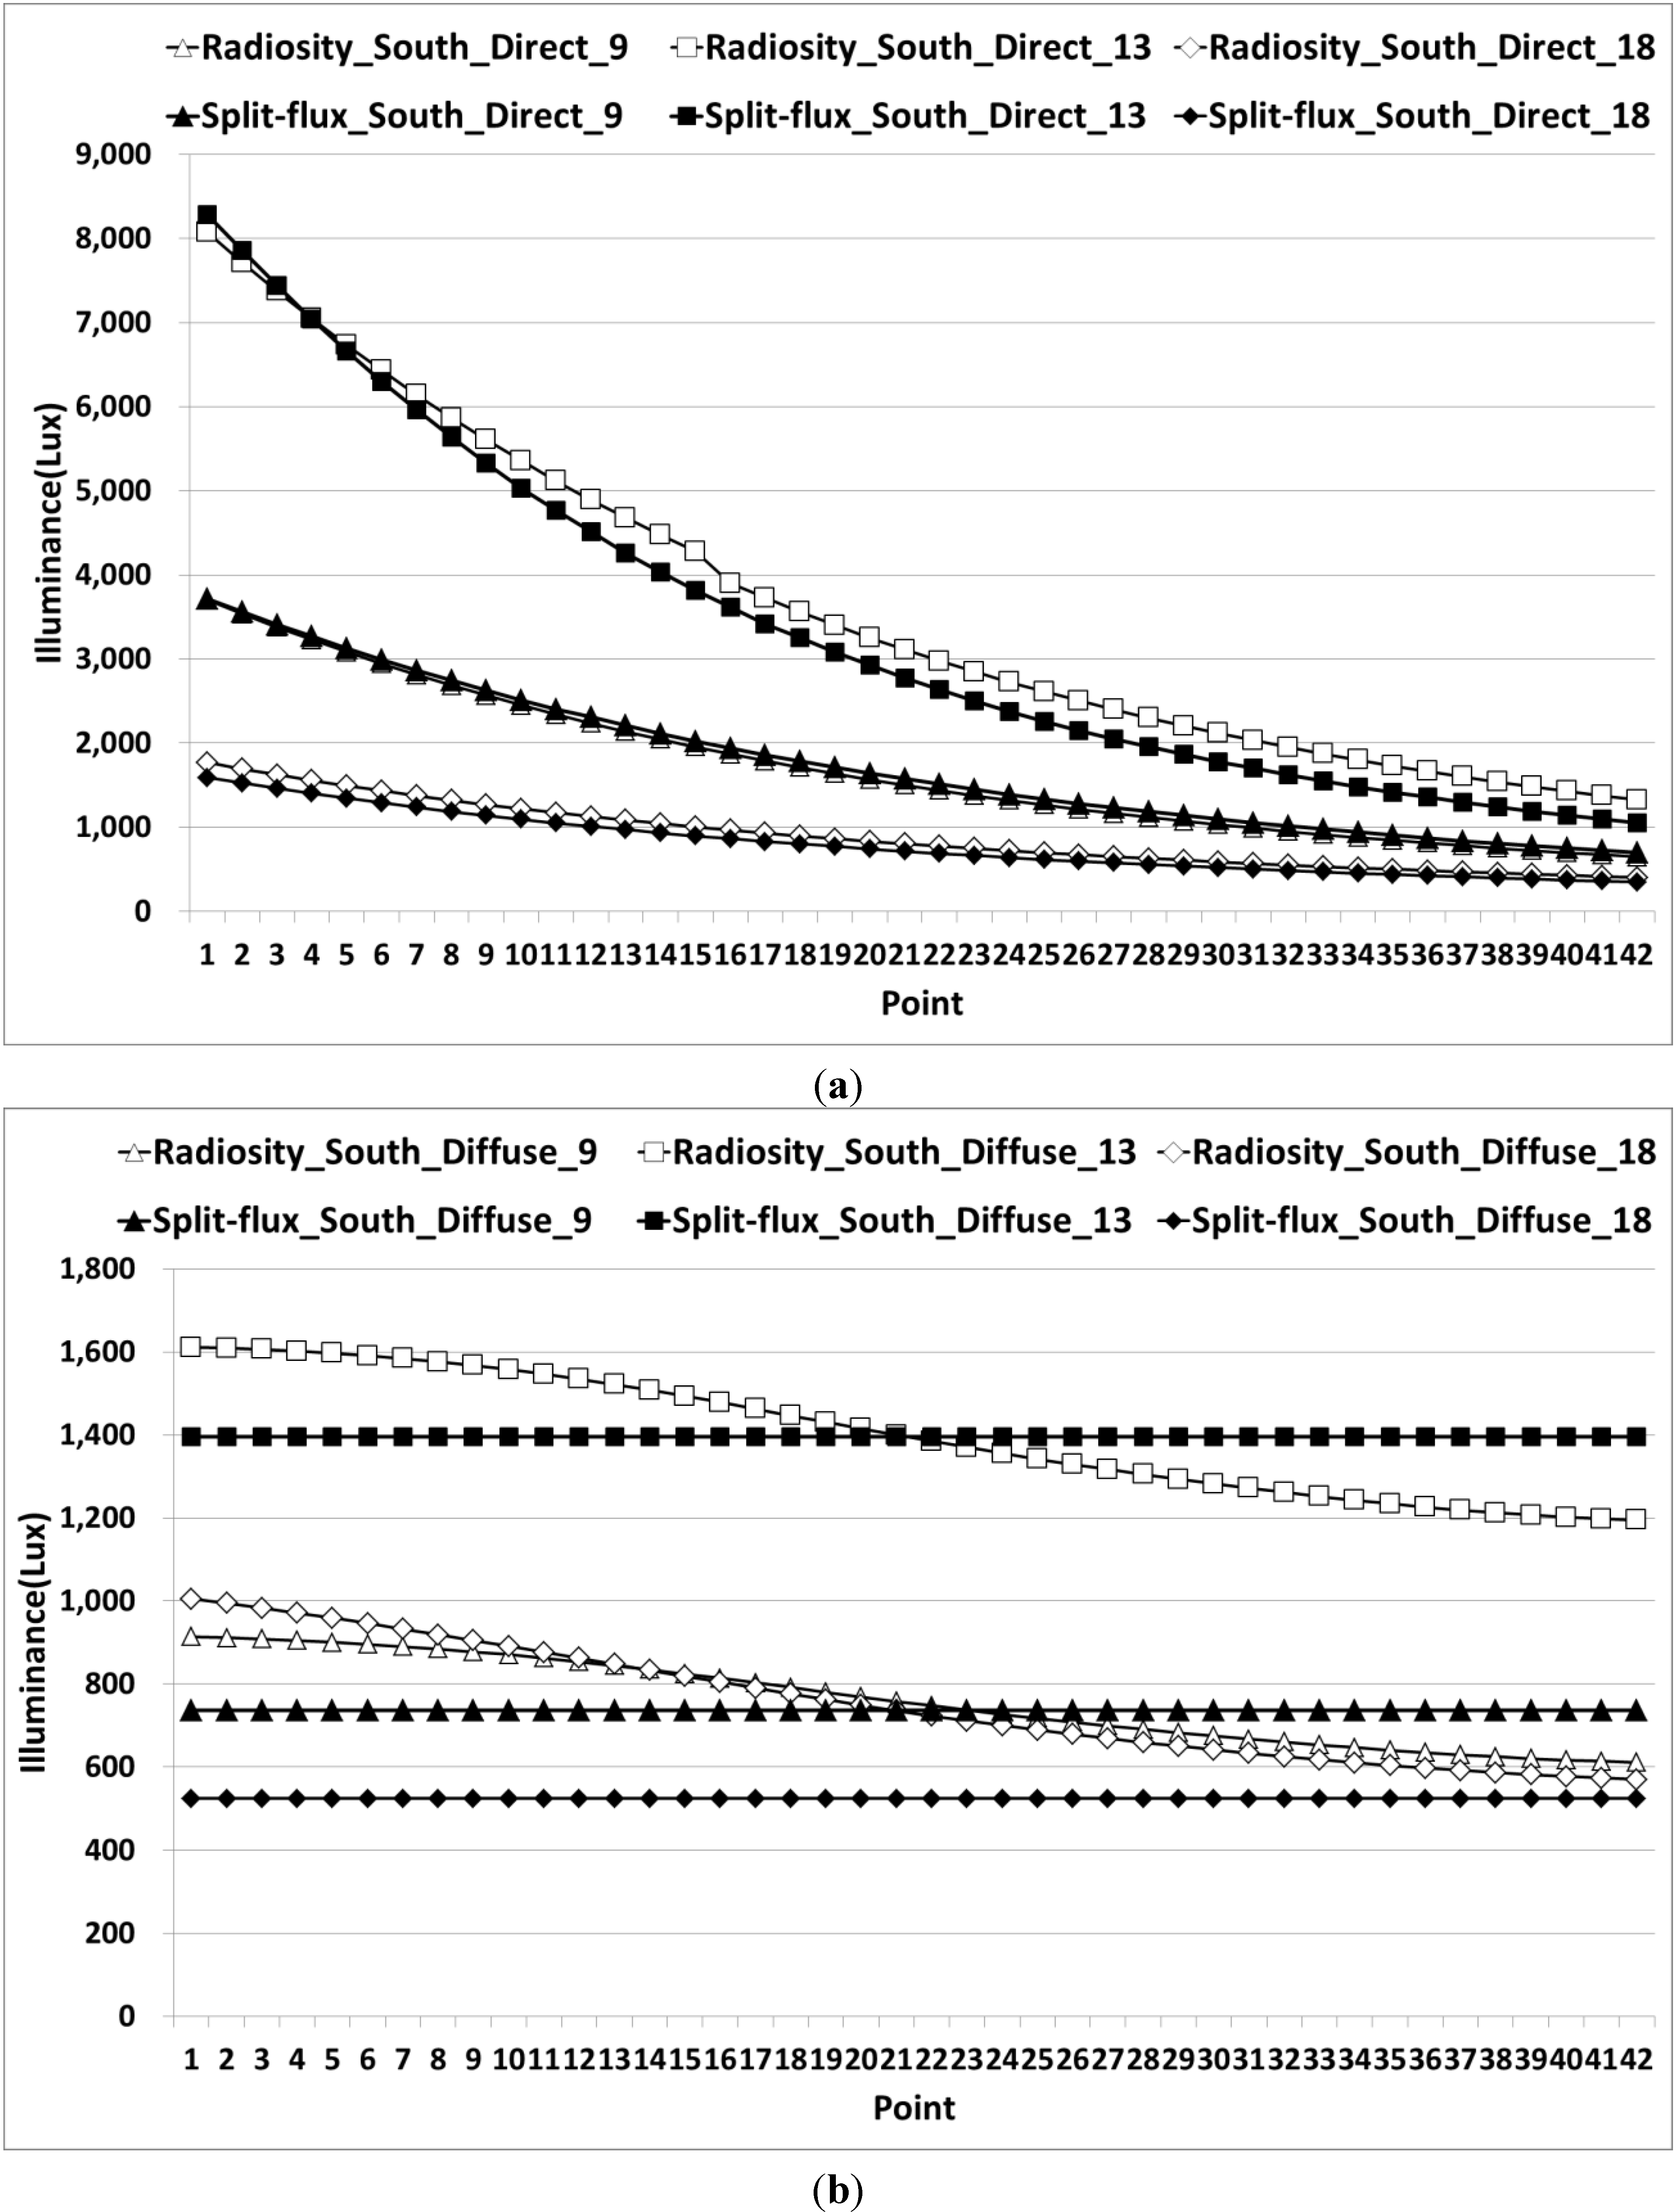
3.3.2. Analysis of Direct and Diffuse Illumianance for South Orientation of Window

Figure 6a shows the direct illuminance at the reference points. The illuminance level near the window is higher than at the points further away from the window and the illuminance values given by Radiosity and Split-flux method is similar. In the case of 13:00, the illuminance value from Split-flux method is higher near the window but after point four, the Radiosity value increases. At 09:00, near the window both values are same but as the distance from window increases, Split-flux values are more than Radiosity values. For 18:00, the Radiosity values are more than the Split-flux method and the difference between the values decreases as distance from the window increases. Figure 6b shows the diffuse illuminance at the reference points. In case of split-flux method, the illuminance is constant for all points irrespective of the distance from the window. However, for the Radiosity method, like the direct illuminance, the values decrease as distance from the window increases. For the Split-flux method, at 13:00 the illuminance value is maximum at 1395 lux, after that, at 09:00, it is at about 737 lux and the lowest value is at 18:00 at 523 lux. In case of Radiosity method, at 13:00 the illuminance value is maximum. Near the window, the value for 18:00 is more than for 09:00, but after the 15th point, the value for 09:00 is more than 18:00.
However, the diffuse illuminance value is almost four to five times less than direct illuminance. Therefore, the total illuminance graph follows the same pattern as the direct illuminance. In case of the Split-flux method, since the diffuse illuminance is constant, there is a linear increase but for the Radiosity method, the diffuse illuminance causes the total illuminance pattern to be a little different than that of the direct illuminance.
Figure 6. Direct and Diffuse interior illuminance from Split-flux and Radiosity at 09:00, 13:00 and 18:00 for South orientation of window: (a) Interior direct illuminance at 09:00, 13:00 and 18:00 for South orientation of window; (b) Interior diffuse illuminance at 09:00, 13:00 and 18:00 for South orientation of window.
Energies 07 05825 g006

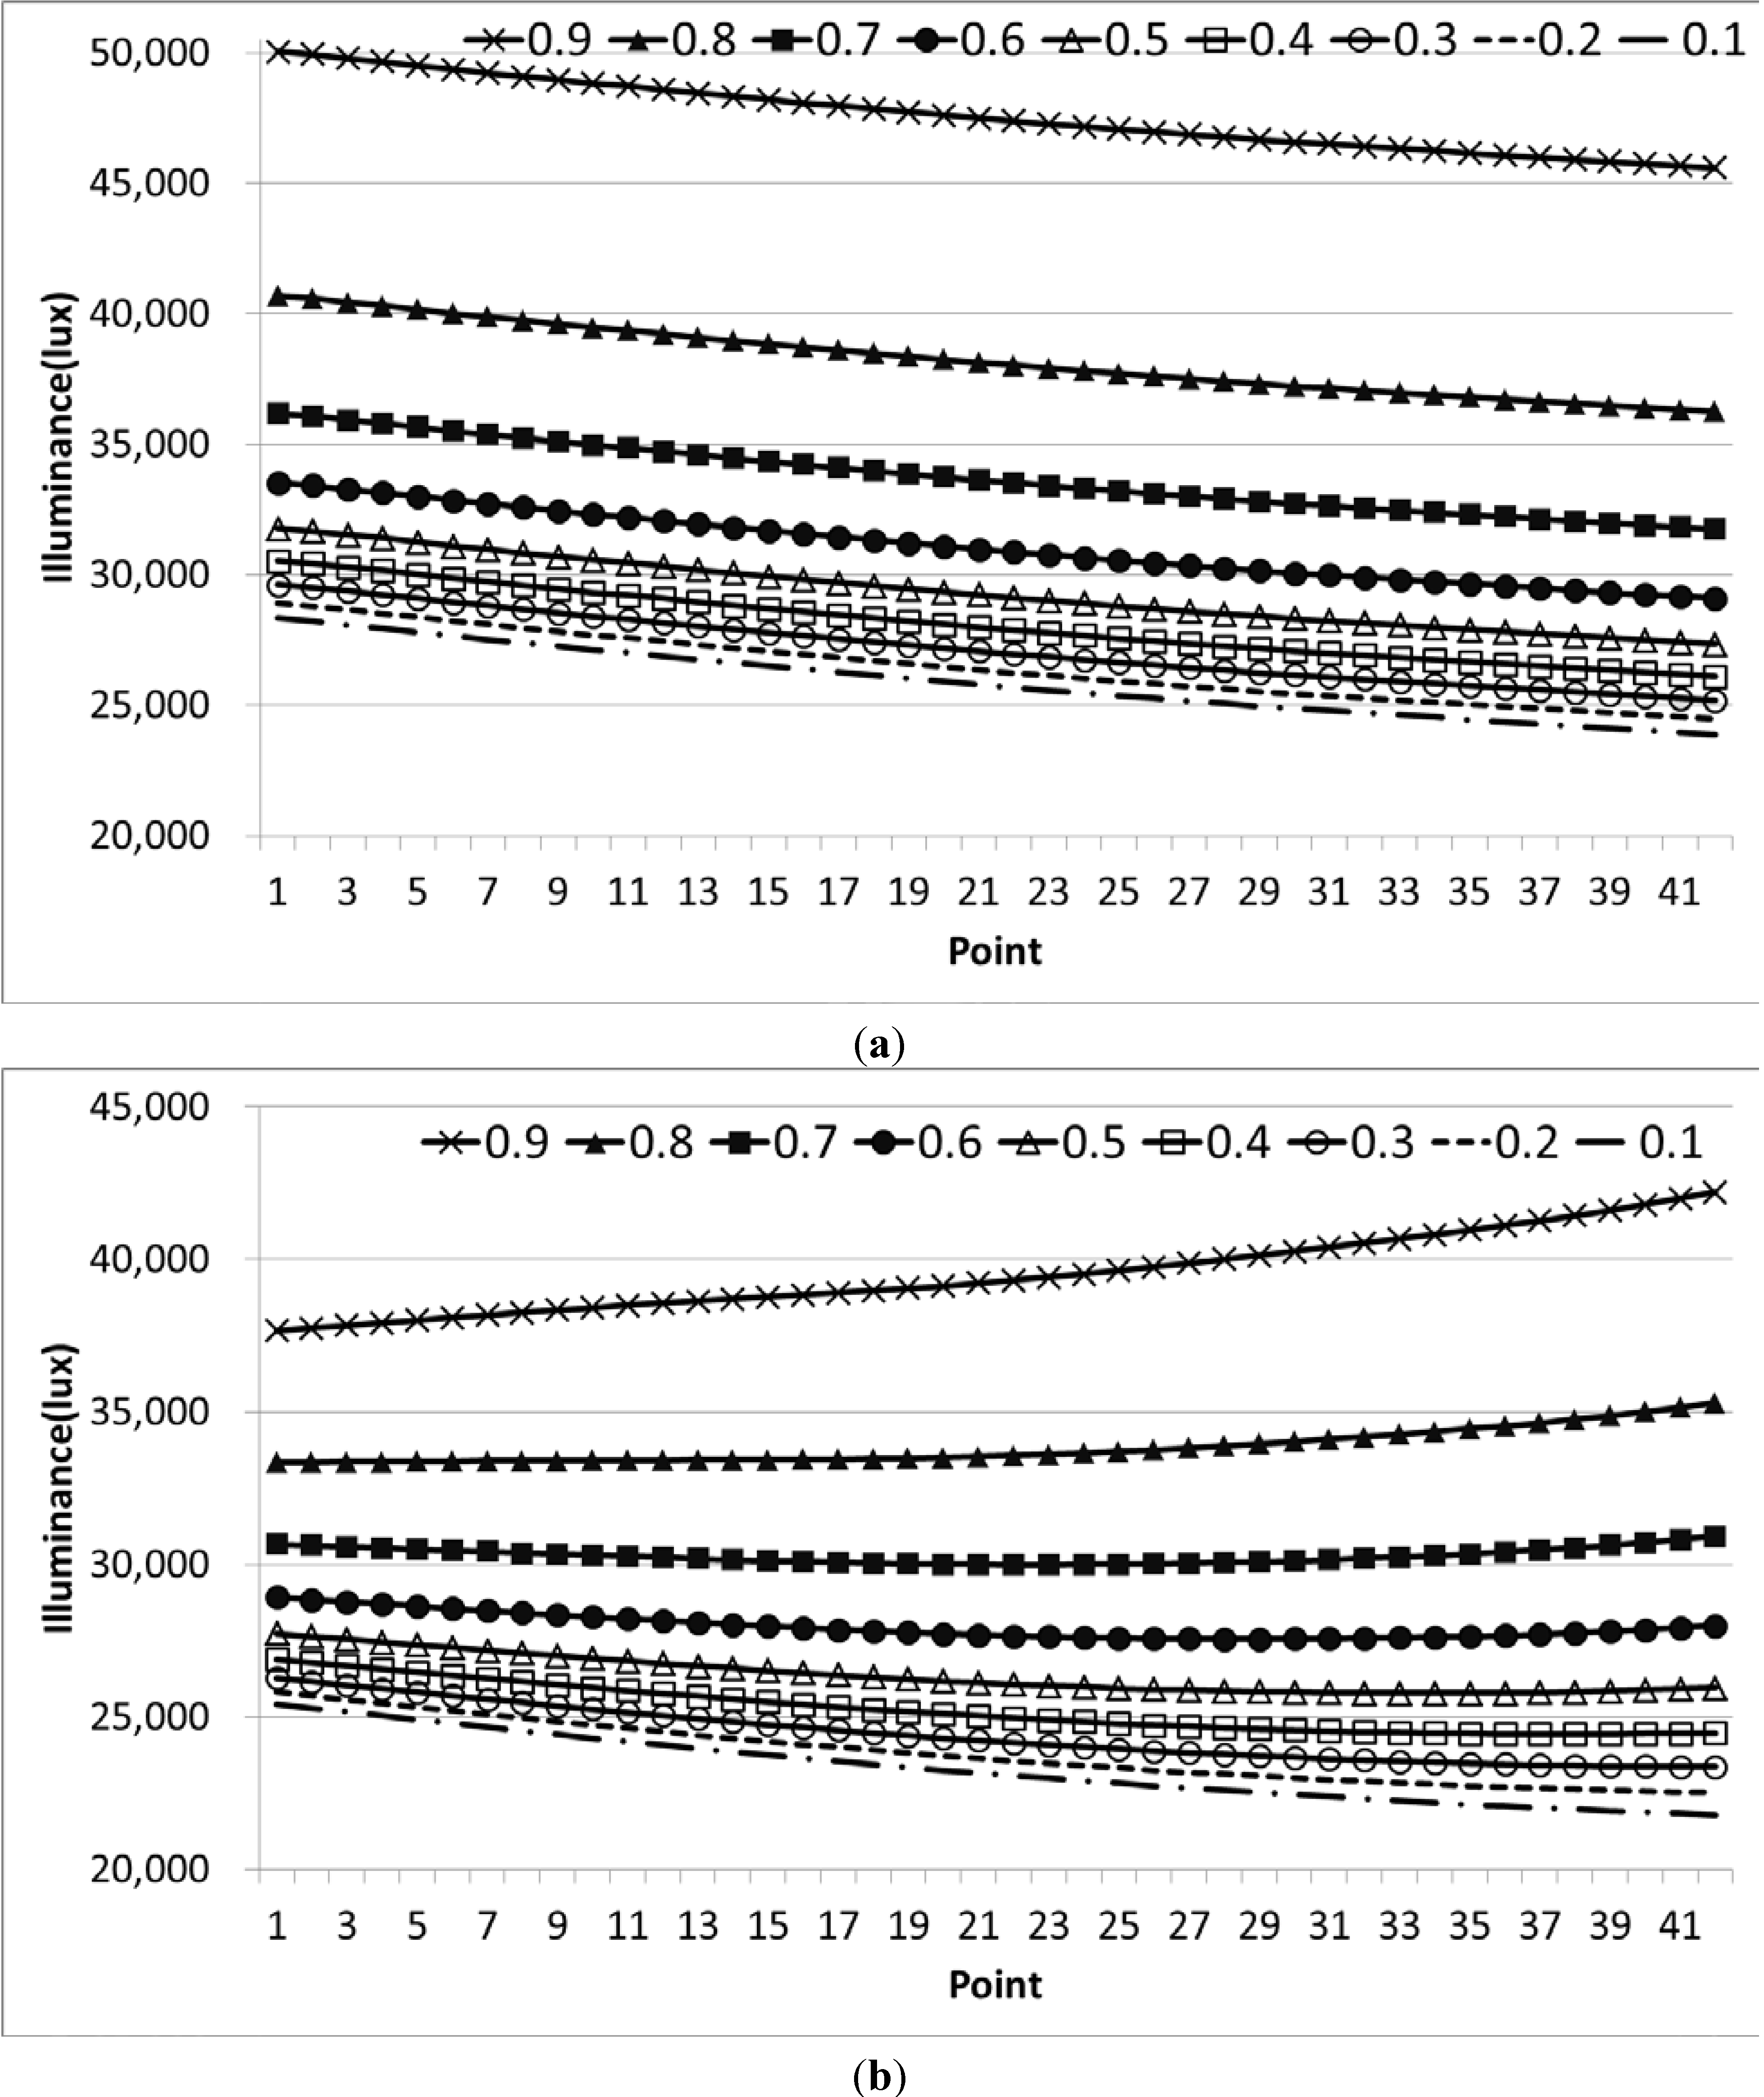
3.4. Analysis of Direct and Diffuse Illuminance Due to Change in Wall Reflectance with South Oriented Window

The simulation study below is done using the same window details as Section 4.4.2. Figure 7a,b, show the illuminance levels at 42 points inside the room using Split-flux and Radiosity methods for summer (27 June) and winter (22 December) conditions, when the wall reflectance changes from 0.1 to 0.9. In both the Split-flux and Radiosity methods, the internally reflected light is taken as diffuse illumination. So, when wall reflectance changes, the internally reflected illumination also changes, i.e., the higher the wall reflectance, the higher the diffuse illuminance. The individual curves denote the interior illuminance at that particular wall reflectance. Although the illuminance level is different for summer conditions, both methods show a similar pattern. The illuminance level decreases as the distance from the window increases but the level of illuminance for each point increases when wall reflectance increases. If 0.5 wall reflectance is taken as a standard case, in this instance, it is observed that illuminance level difference between the two methods is 272.5 lux averaged. The difference in illuminance level results between the two methods increases as the distance from the window increases.
Figure 8a,b, show the illuminance levels for winter conditions. The individual curves denote the interior illuminance at that particular wall reflectance. In the Split-flux method, the illuminance level for each point increases as wall reflectance increases and it decreases with the distance from the window. This is very similar to the summer case even though the graph is more like a straight line. However, for the Radiosity method, the result is different. For wall reflectance 0.1–0.4, the illuminance level decreases as the distance from the window increases just like in the Split-flux method, but when wall reflectance increases from 0.5–0.9, the trend is upward.
Figure 7. Summer condition shows a similar trend of illuminance level results: (a) illuminance level using the Split-flux method; (b) illuminance level using the Radiosity method.
Energies 07 05825 g007
Figure 8. Winter solstice condition shows different trends in illuminance results [21]: (a) illuminance level using the Split-flux method [21]; (b) illuminance level using the Radiosity method [21].
Energies 07 05825 g008
To understand this phenomenon better, analysis of illuminance level due to individual direct and diffuse component was done. The illuminance level inside the room is due to direct and diffused light. When there is no diffuse light, illuminance level will be due to direct light only. In EnergyPlus, the minimum input wall reflectance value is 0.00001 and maximum is 0.99999. We assume that at 0.00001 there is 100% absorption of sunlight by wall, so there is no diffusion of light by reflection.
Figure 9 shows the illuminance levels for summer and winter condition for Split-flux and Radiosity methods for wall reflectance of 0.00001, i.e., direct sunlight only. In summer conditions, the illumination level difference between Split-flux and Radiosity method is 88 lux at point nearest to the window and 9.47 lux when farthest from the window. For winter conditions, the difference is 2700 lux and 2113 lux respectively. So, the difference decreases as distance increases. In winter conditions, for both methods the illuminance decrease level is very gradual as the distance from window increases but for summer conditions, the decrease gradient is very sharp. So we can see that illuminance due to direct component gives a similar graph to that of the summer condition simulation.
Figure 10a,b show the illuminance levels for diffuse sunlight. Here “_number” denotes the wall reflectance value. In the Split-flux method, Figure 11a, there is no change in illuminance level as the distance from window increases, only amount of illuminance increases as reflectivity of wall increases.
In the Radiosity method, Figure 10b, there is an increase in illuminance level as the distance increases. For wall reflectance 0.1–0.4, the increase level is very small and from 0.5–0.9, the increase is very high as the distance from the window increases.
Figure 9. Analysis of illuminance level for direct sunlight conditions.
Energies 07 05825 g009
Figure 10. Winter solstice condition shows Illuminance level due to diffuse light [21]: (a) illuminance level due to diffuse light in the Split-flux method [21]; (b) illuminance level due to diffuse light in the Radiosity method [21].
Energies 07 05825 g010
The results of graphs from Figure 9 and Figure 10a justify Figure 8a. Similarly, graphs from Figure 9 and Figure 10b justify Figure 9b. For Split-flux method winter conditions, illuminance due to direct light (Figure 9) had a gradual downward slope and illuminance due to diffuse light (Figure 10a) is constant, and thus the resultant illuminance level has a gradual slope (Figure 8a), like Figure 9 (Split-flux_winter) where the total illuminance amount is increased. For Radiosity method winter condition, illuminance due to direct light (Figure 9) has a very sharp downward illuminance, when combined with illuminance (Figure 10b) for wall reflectance 0.1–0.4, the resultant illuminance has downward slope and for wall reflectance 0.5–0.9 (Figure 10b), the resultant illuminance has an upward slope.
Thus, this simulation study reinforces our belief that the difference is caused by how the two algorithms treat diffuse illuminance inside the room. As shown in previous studies [12,21], in the Split-flux method, the diffuse illuminance is averaged where as in the Radiosity method, the diffuse illuminance is governed by the form factor between the wall patch from where light is being reflected and reference point surfaces. However, in winter conditions, when sunlight penetrates deeper into the room, the illuminance level increases when wall reflectance increases. As we go further into the room, there is more reflected light and more point to point pairs for the algorithm to work. This results in Radiosity algorithm showing an increased illuminance level further away from window at high wall reflectance values. As the two algorithms give very different results, the time-step algorithm for Radiosity needs to be developed, especially where high reflectance surfaces are used, so that better study results can be generated, which would be closer to real time data.
Figure 11. Hourly Window Transmitted Solar for south, north, east and west orientation.
Energies 07 05825 g011

3.5. Result Conclusion from above Simulation Results

Both for Split-flux and Radiosity methods, the window luminance is part of the interior daylight illuminance calculation Equations (1) and (2). In the case of the Split-flux method, Equation (3), window luminance is the product of outside (sky) luminance, window transmittance and cosine of incidence angle; whereas in Radiosity, Equation (4), angle of incidence is replaced by the light exchange factor and the direct solar portion is added depending on whether the direct sunlight falls on the window or not. From Figure 11 we can see that the window transmitted solar from the window is higher in the case of the Radiosity method than in the Split-flux method. This can be attributed to the fact that in the Radiosity method, it is dependent on the light exchange factors between the surfaces as well, Equation (4), instead of being an independent quantity like for the Split-flux method. As the interior illuminance is directly proportional to window transmitted solar, the Radiosity illuminance values are higher than the Split-flux illuminance values.
However, this does not directly explain why in the Radiosity method, the illuminance at 13:00 is the highest irrespective of the window orientation. This is explained by how the time-step interior illuminance calculation is done. In simple terms, time-step interior illuminance is calculated by interpolating the Daylight Factors (DF) for each time-step when the sun is up and multiplying with the exterior horizontal illuminance [14]. According to EnergyPlus reference, six daylight factors are precalculated to find the interior illuminance for each time-step. In the Split-flux method, it is not as straight forward due to the time-step algorithms given, which clearly show that they are affected by the sun position and orientation of the window, Equations (6)–(8). In the case of the Radiosity method, in the absence of any algorithms for time-step illuminance calculation, it can be deduced that a straightforward approach is taken. This scenario makes more sense based on the above illuminance graphs. As shown by Figure 11, the transmitted solar values are different for different orientations of the window. Therefore, the DFs calculated for different window orientations will be different. However, because the window luminance value is so small, DF is also very small. If we look at the hourly horizontal illuminance for 27 June, Figure 12, we can see that it is very high and the highest value is at 13:00. So, in the Radiosity method, interior illuminance is very high and the 13:00 illuminance value is highest irrespective of the window orientations.
Figure 12. Hourly external horizontal illuminance.
Energies 07 05825 g012

4. Conclusions

In this study, a full scale building has been used for calibration of the simulation model [12,21]. The room used for actual data gathering is used to make the EnergyPlus model. The inside illuminance pattern derived from Radiosity and Split-flux method has been studied as a whole and their direct and diffuse components. The following results have been concluded:
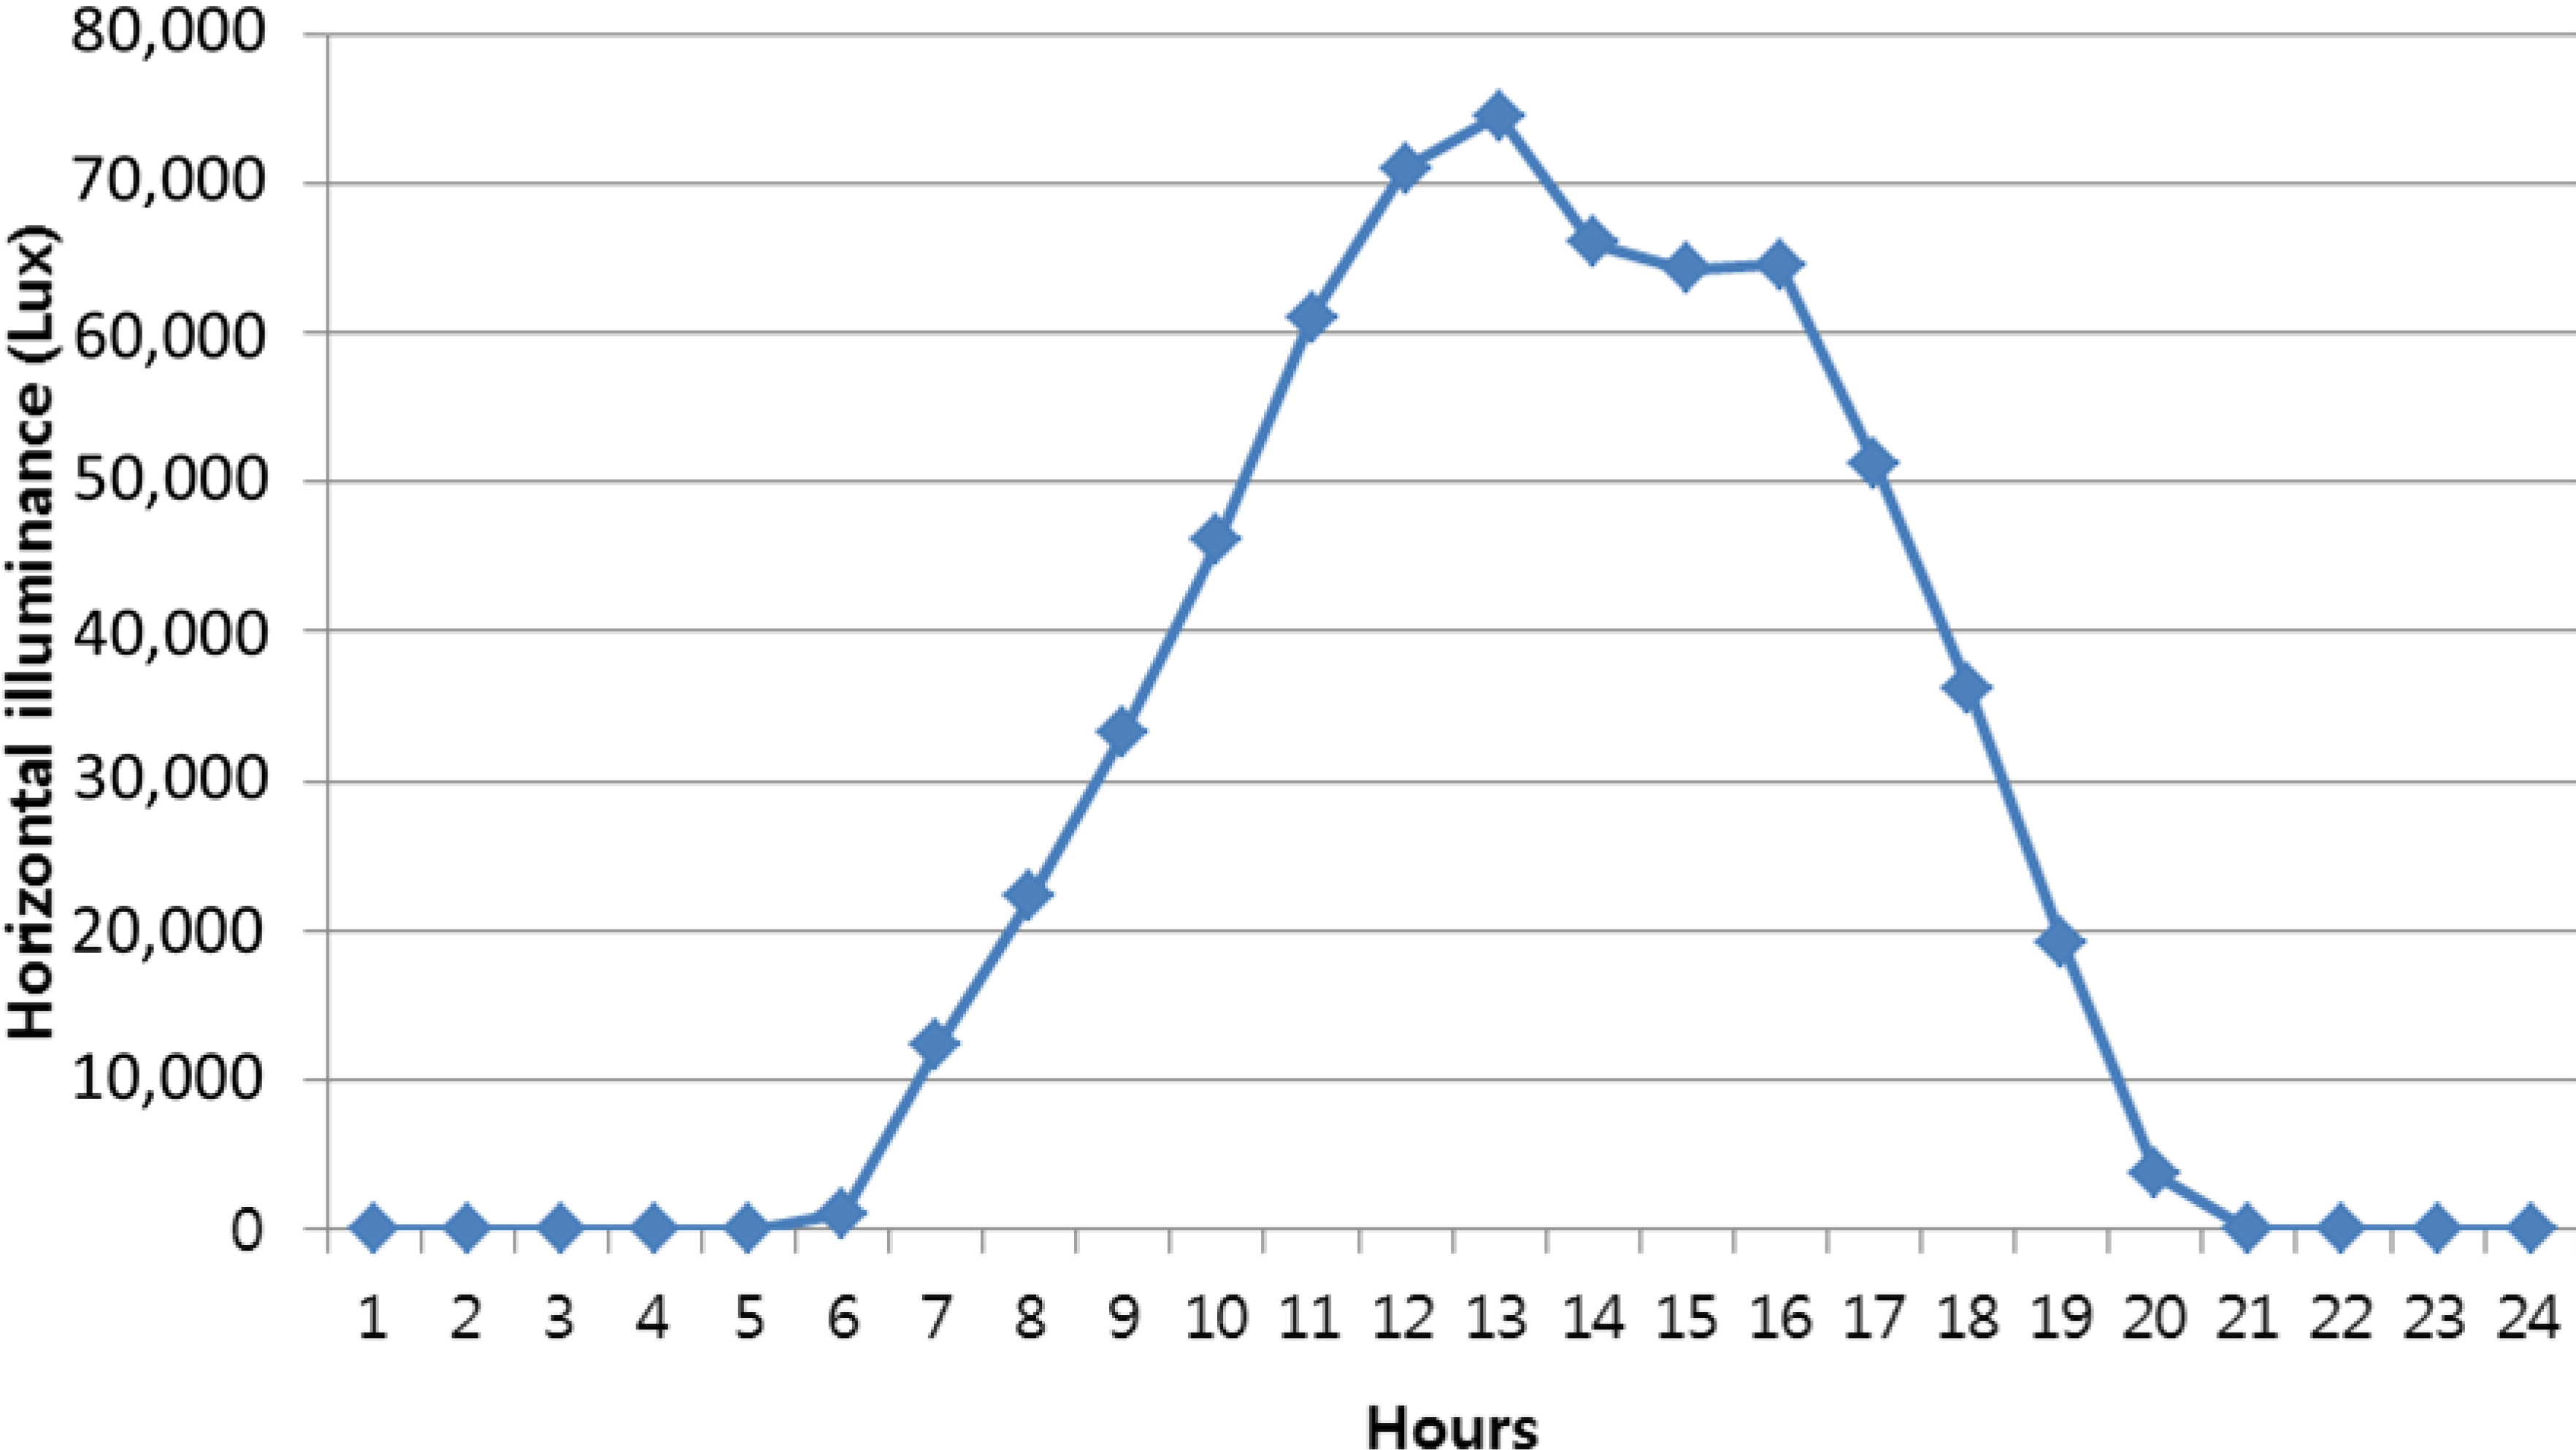
  • The day chosen for simulation is a clear day with high illuminance. For both the Radiosity and Split-flux methods, in case of south orientation, the interior illuminance value is very high and the difference in the data from two methods is not very high. However, in other orientations, the Radiosity value is higher than the Split-flux method. Thus, detailed study was carried out.
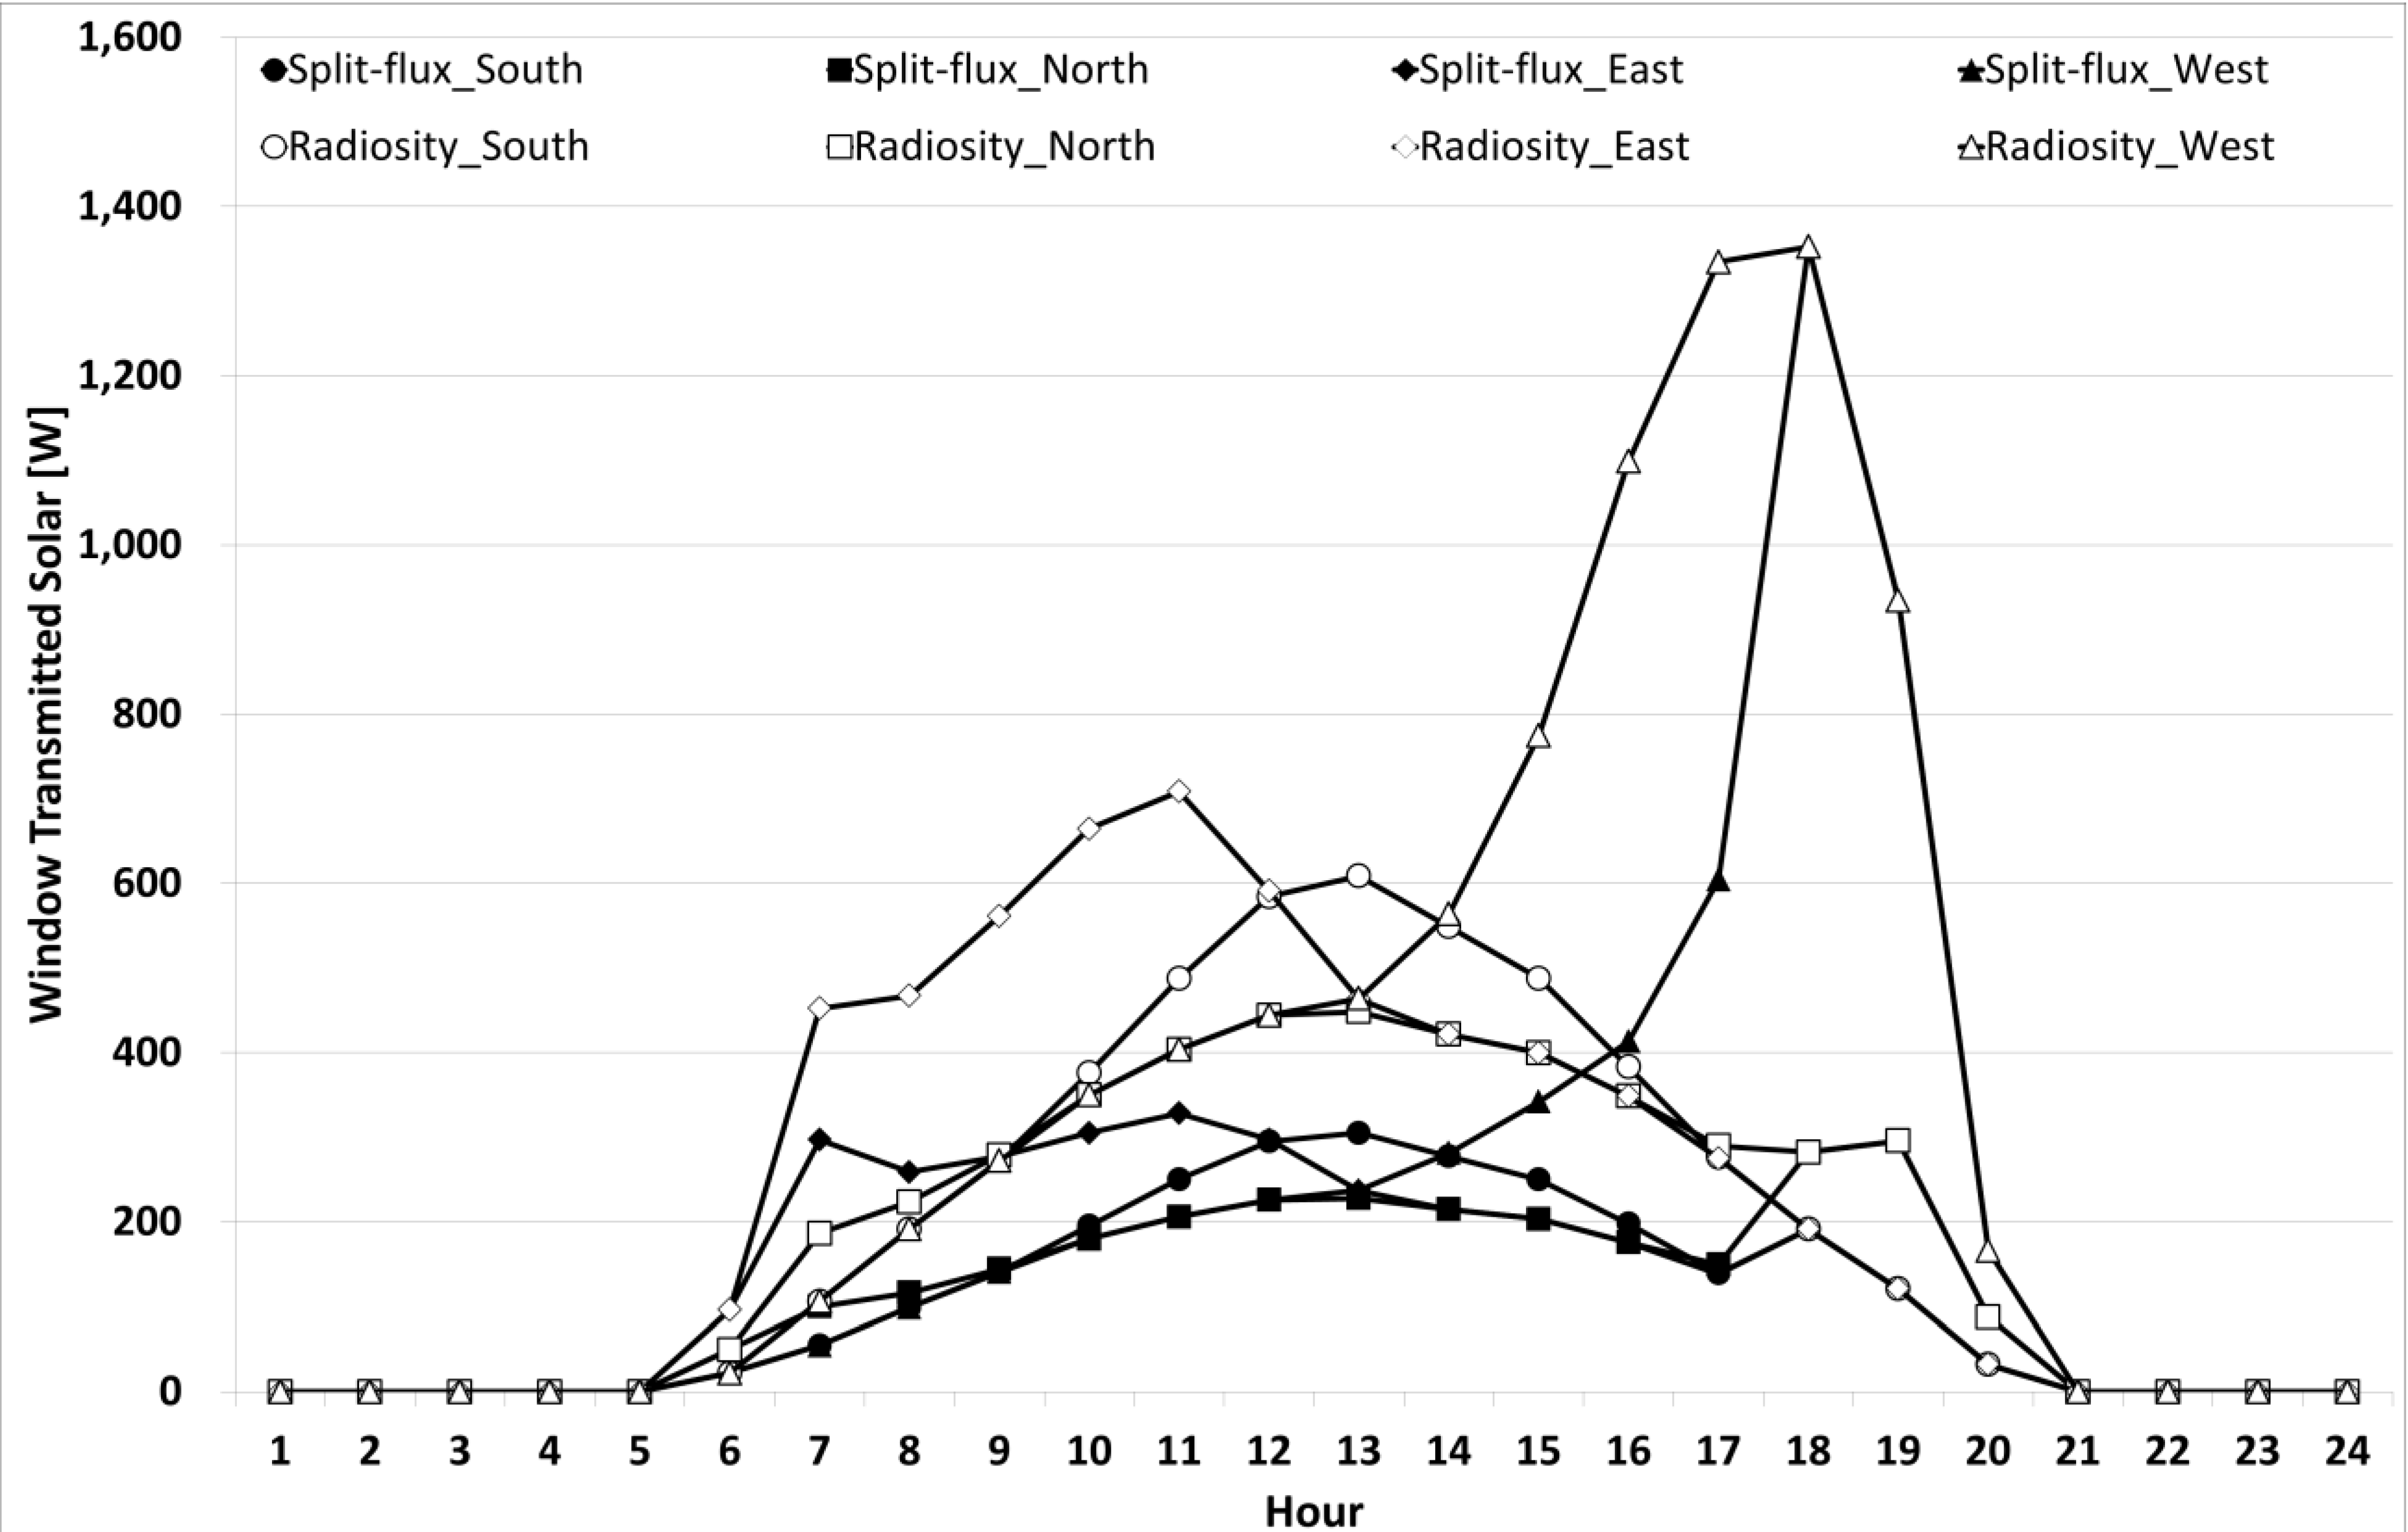
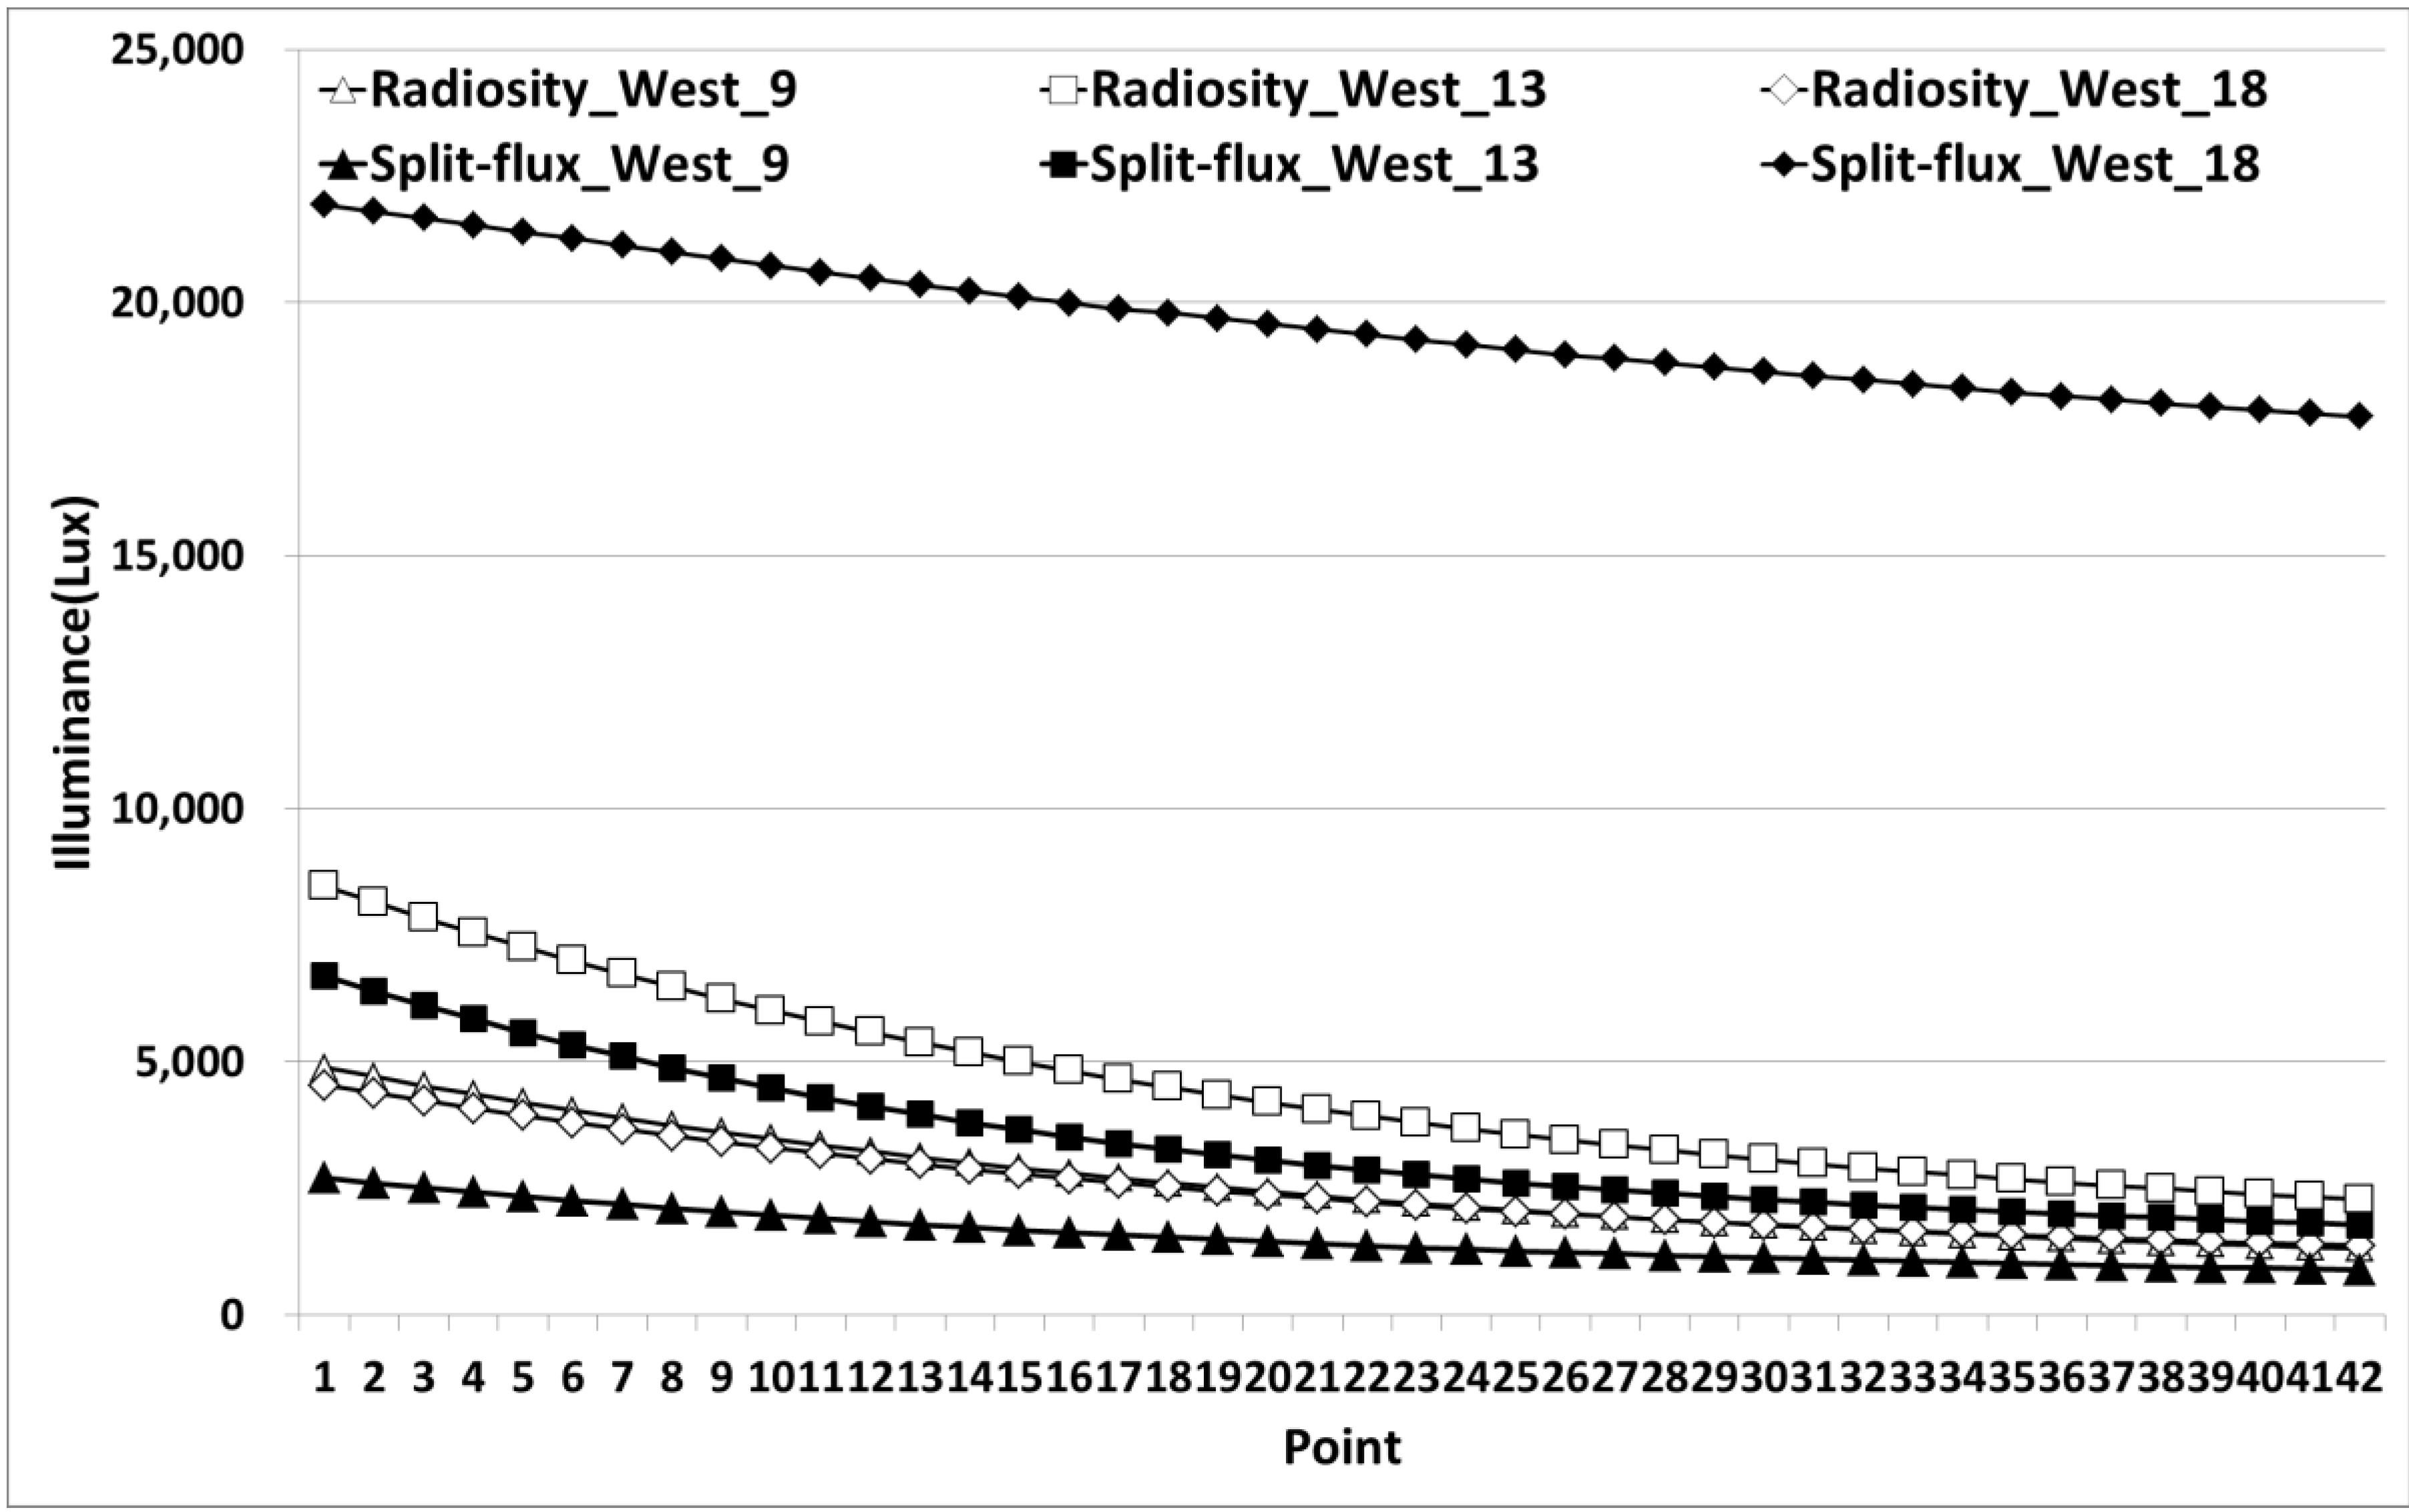
  • For West orientation, interior illuminance from the Radiosity and Split-flux methods were compared at 09:00, 13:00 and 18:00. In the Split-flux method, the illuminance was highest at 18:00. At 18:00, the solar incidence angle is very low and the window transmitted solar is very high, which is clearly reflected in the Split-flux method. However, in the Radiosity method, this is not the case. This is attributed to the time-step interior illuminance which is dependent only on the interpolated Daylight Factor and the time-step external horizontal illuminance. At 09:00 and 18:00, the pattern is same as for the other data.
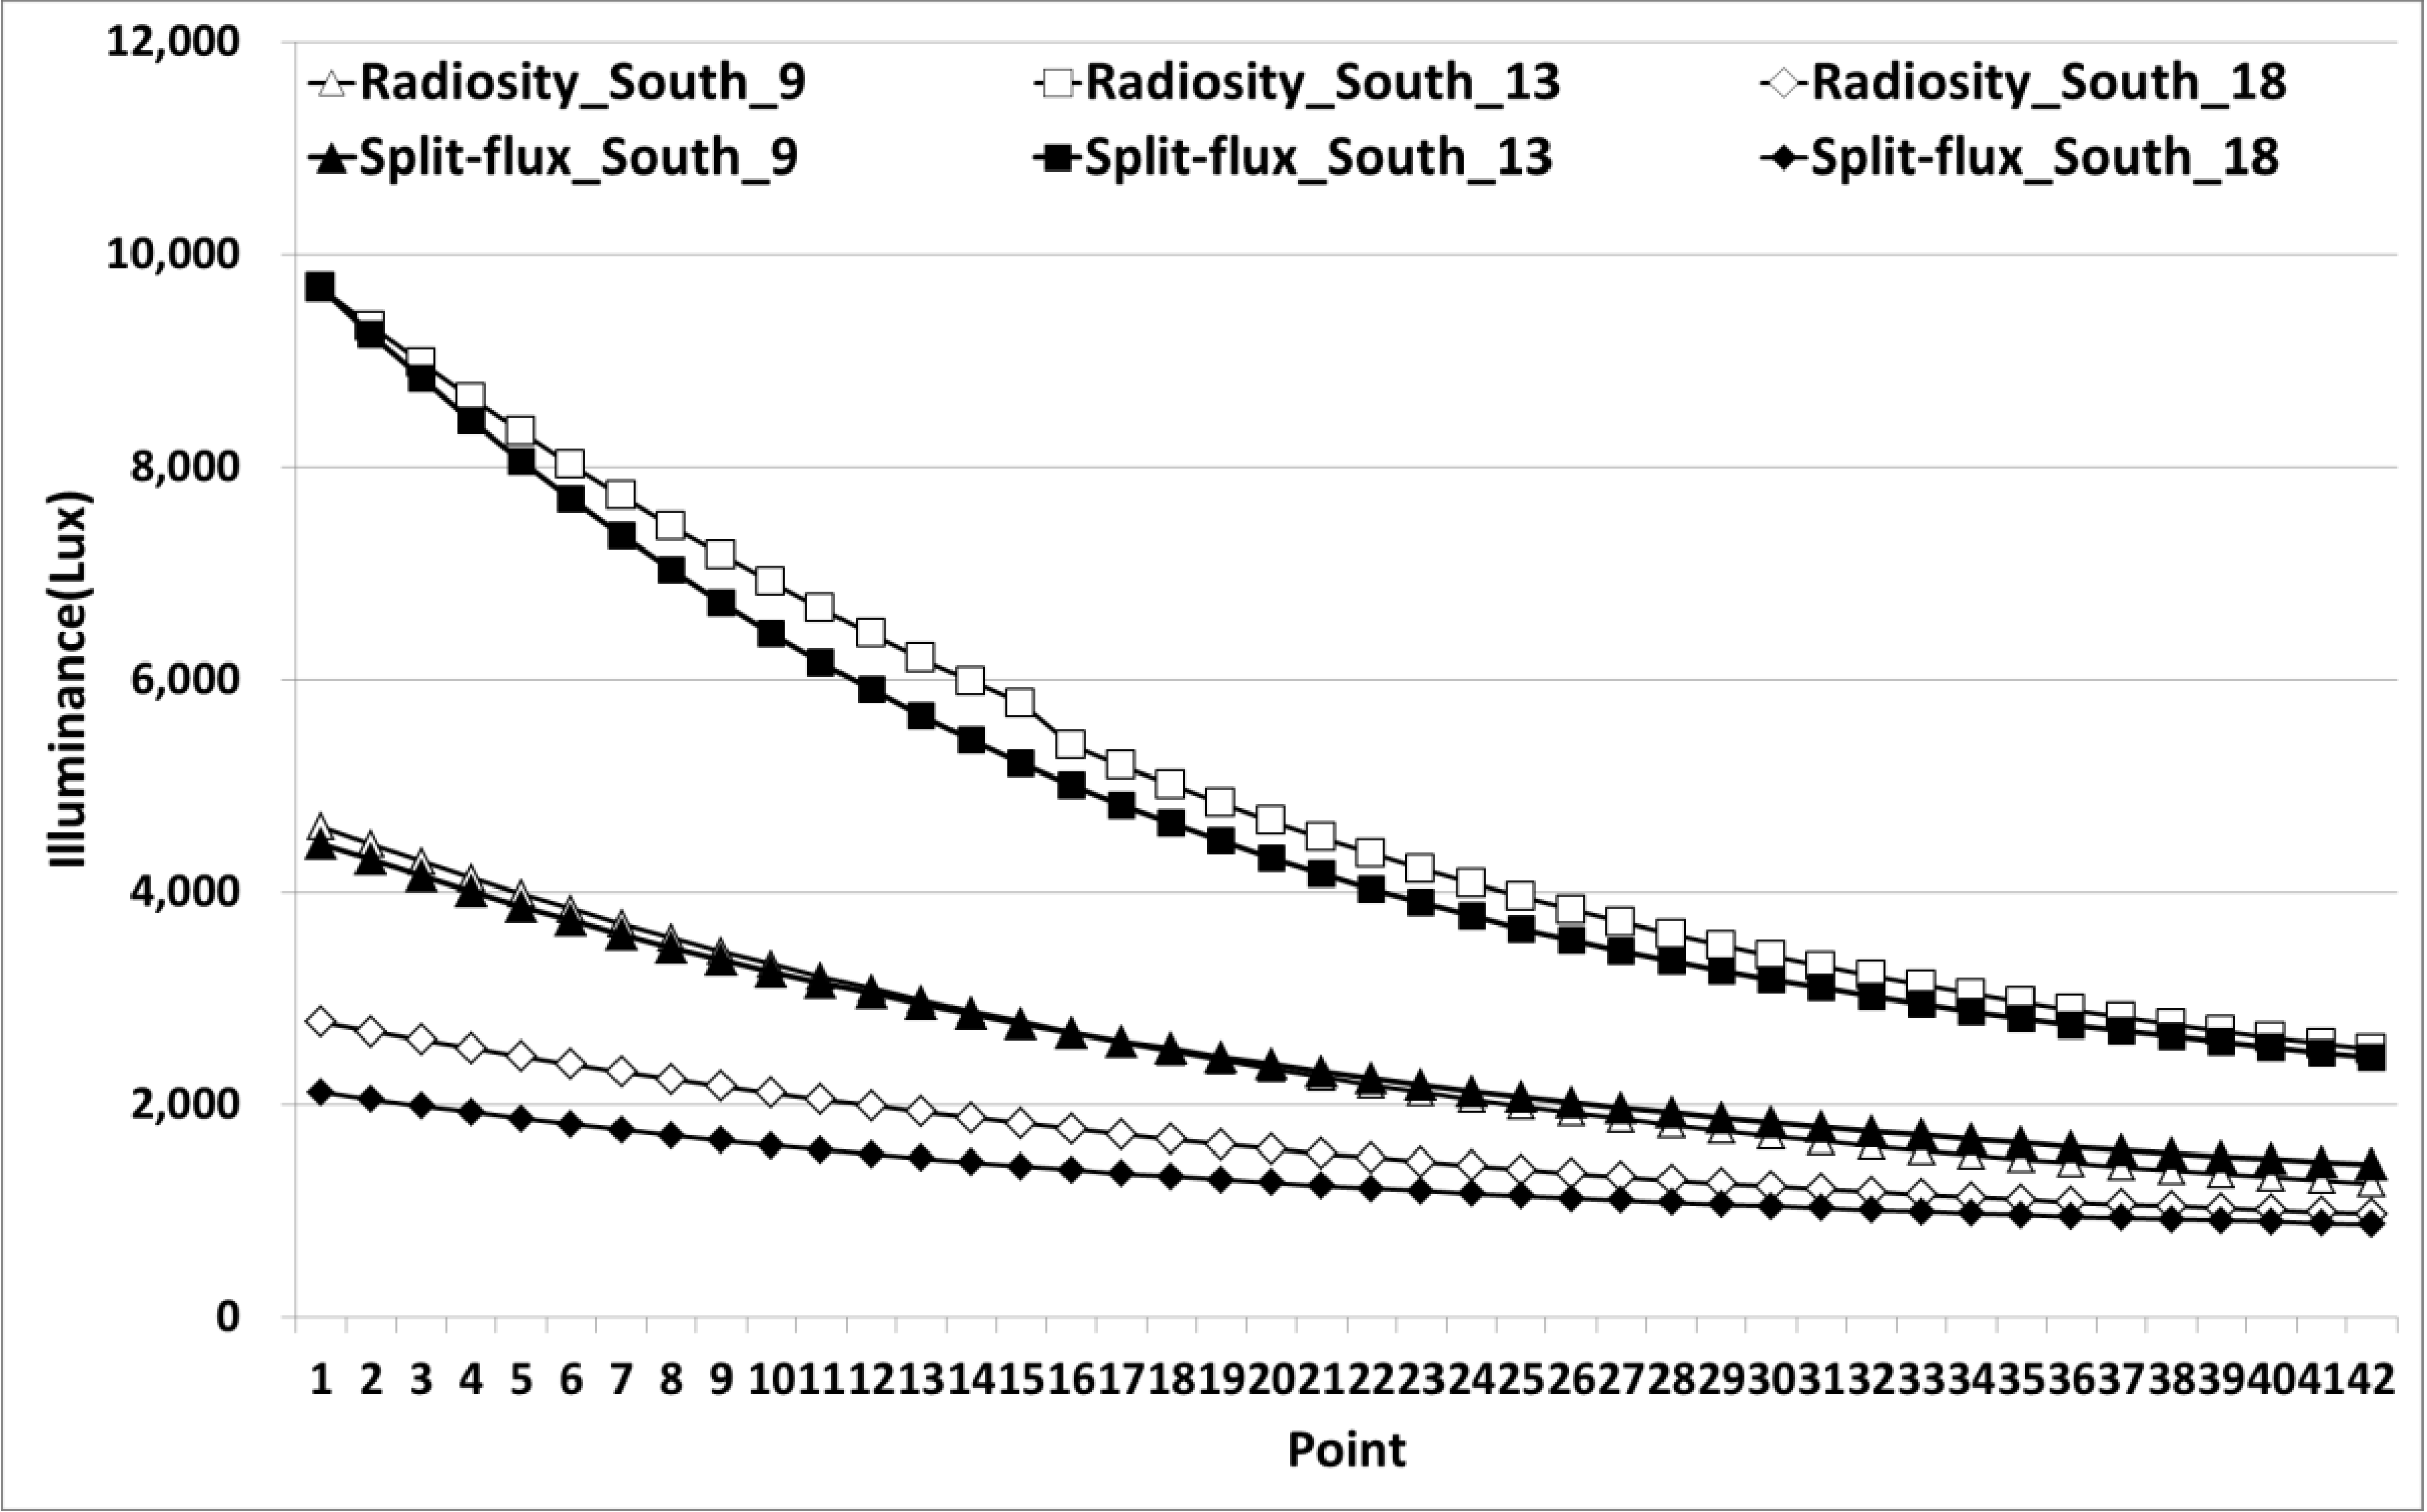
  • In North and South orientation, the pattern is very similar to the above analysis. At 13:00, the interior illuminance is higher. However, for north orientation, at 09:00 and 18:00, the Split-flux data is more than the Radiosity illuminance data. This is because of how Split-flux and Radiosity algorithm treats diffuse illuminance. For Split-flux, the illuminance value is high and is constant irrespective of the distance from window.
  • In the Split-flux method, in every step of the equation, solar angle and the incident angle is incorporated, either directly or indirectly. However, in Radiosity, only the incidence angle is taken in account. By the time the interior illuminance is calculated, the incidence angle is between the interior reflecting surface and reference point. Ultimately, during time-step interior illuminance, it does not make any appearance at all.
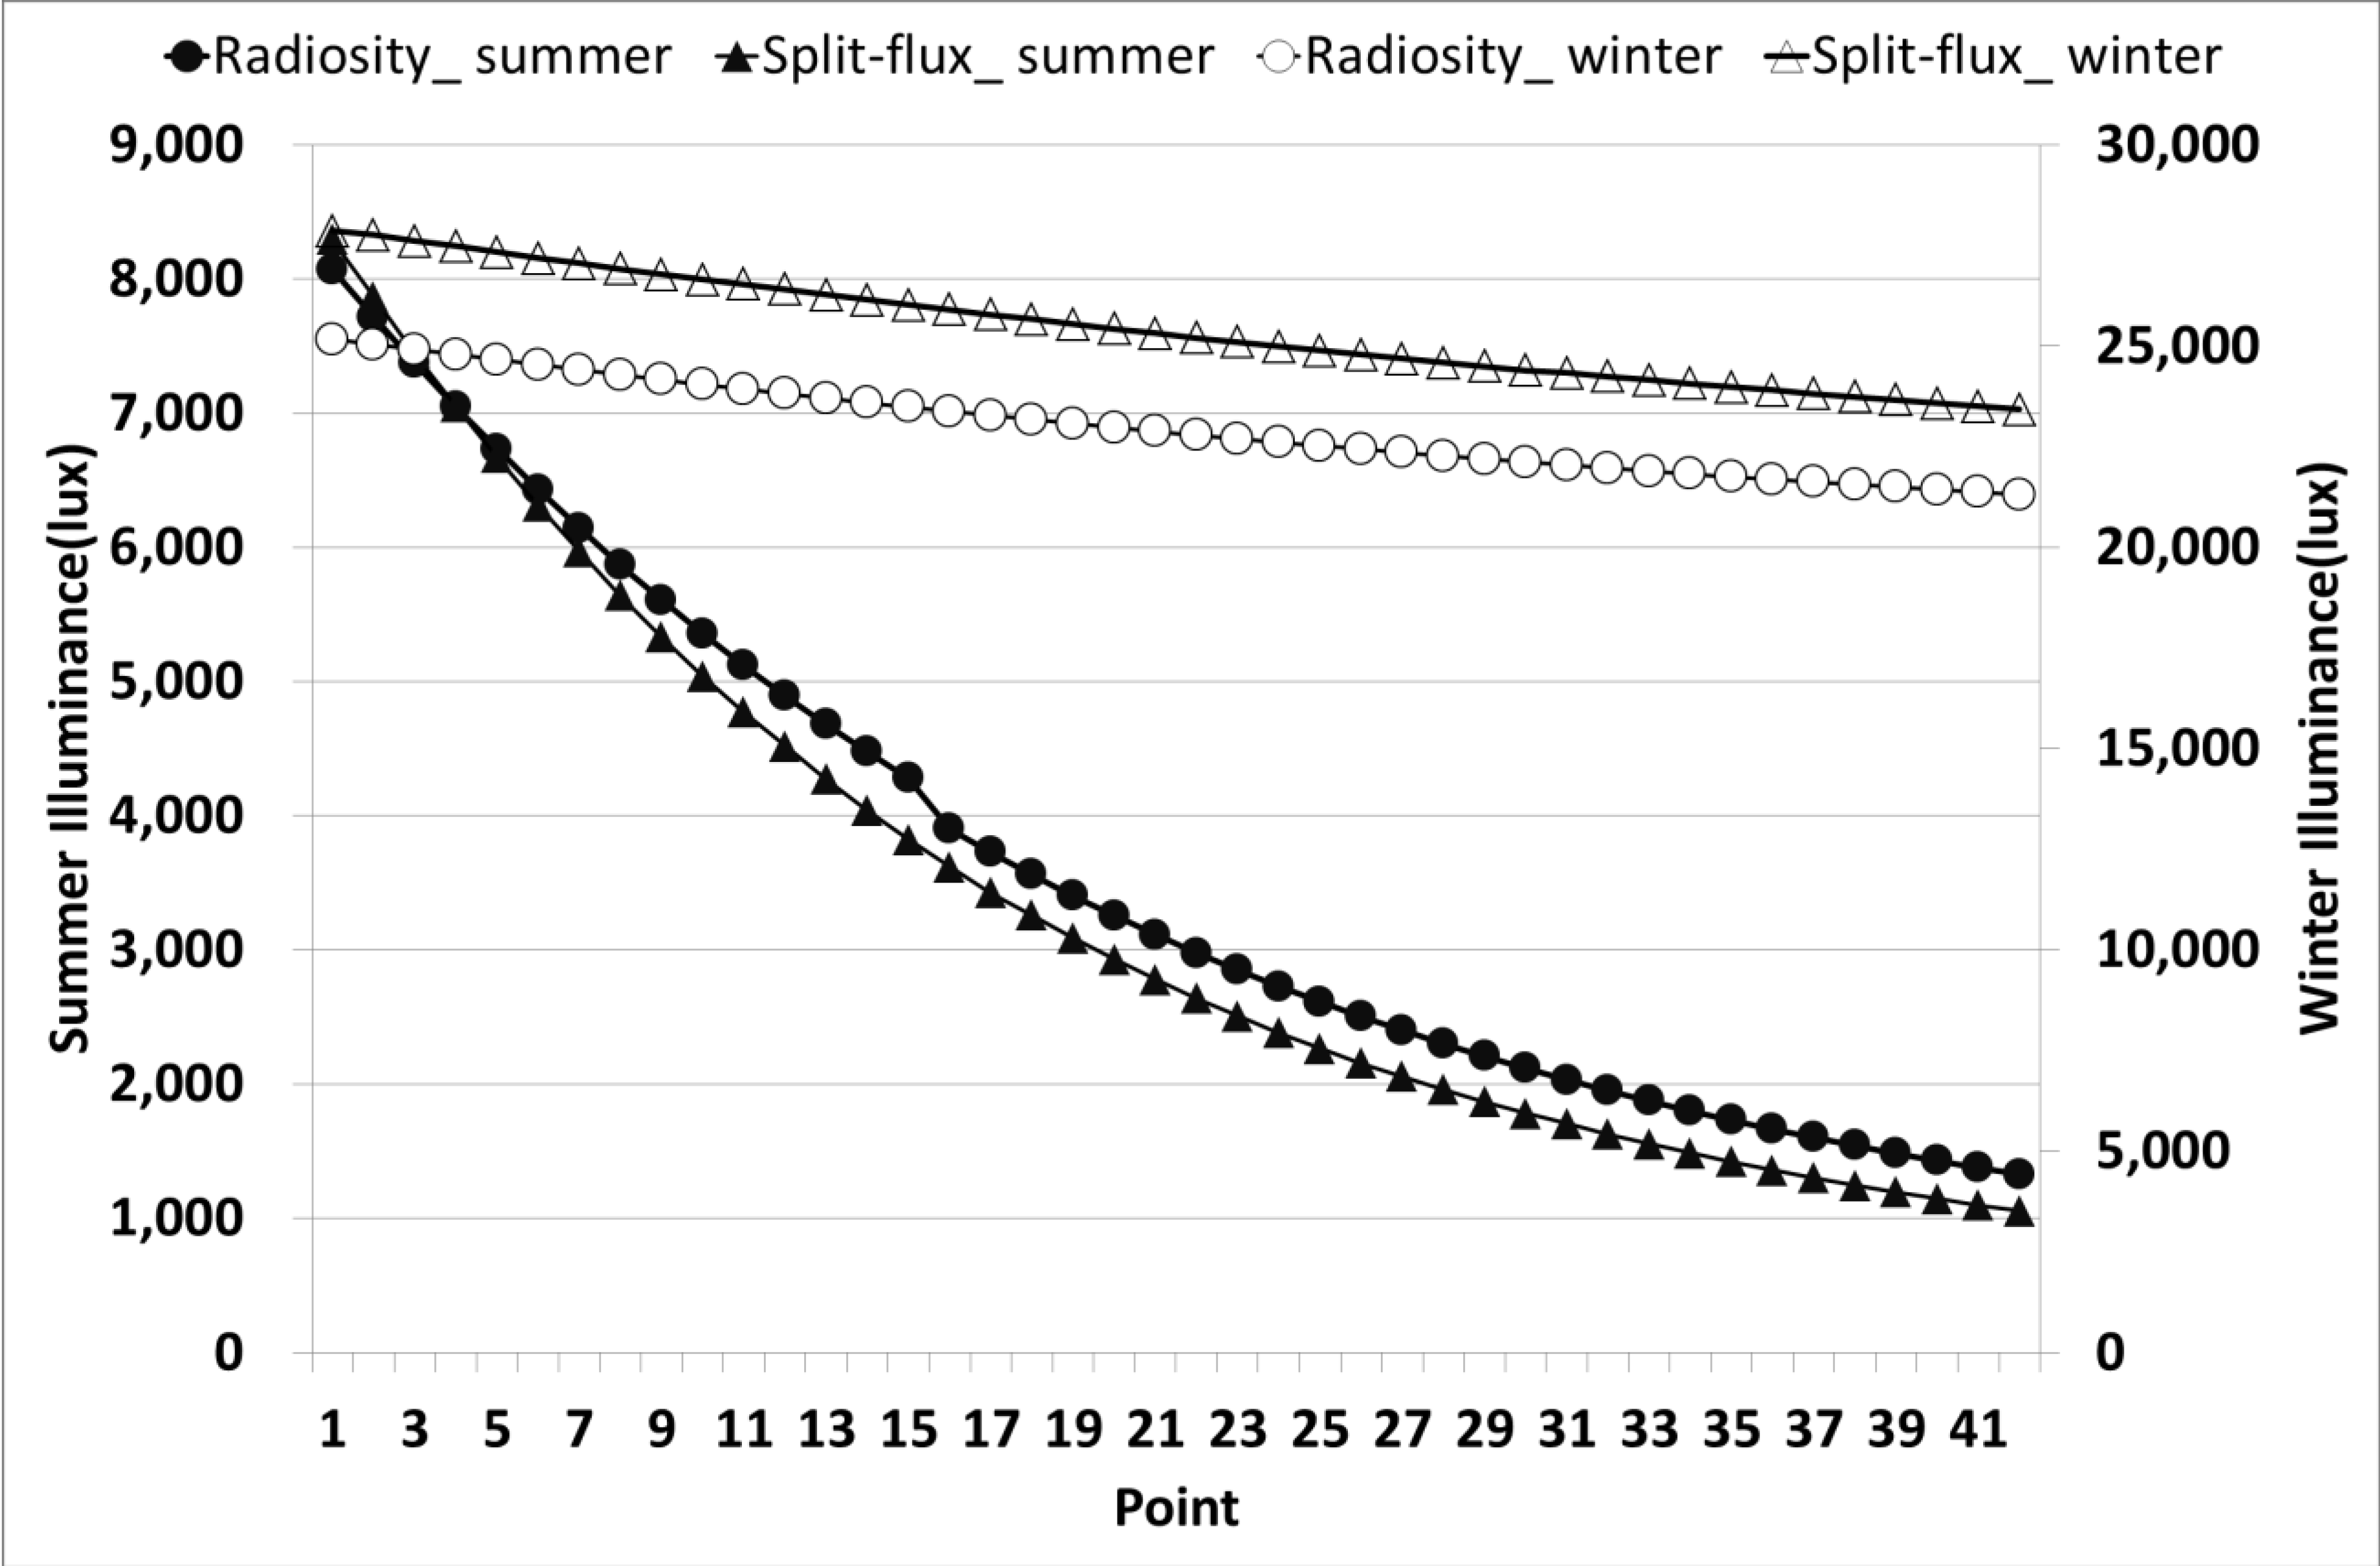
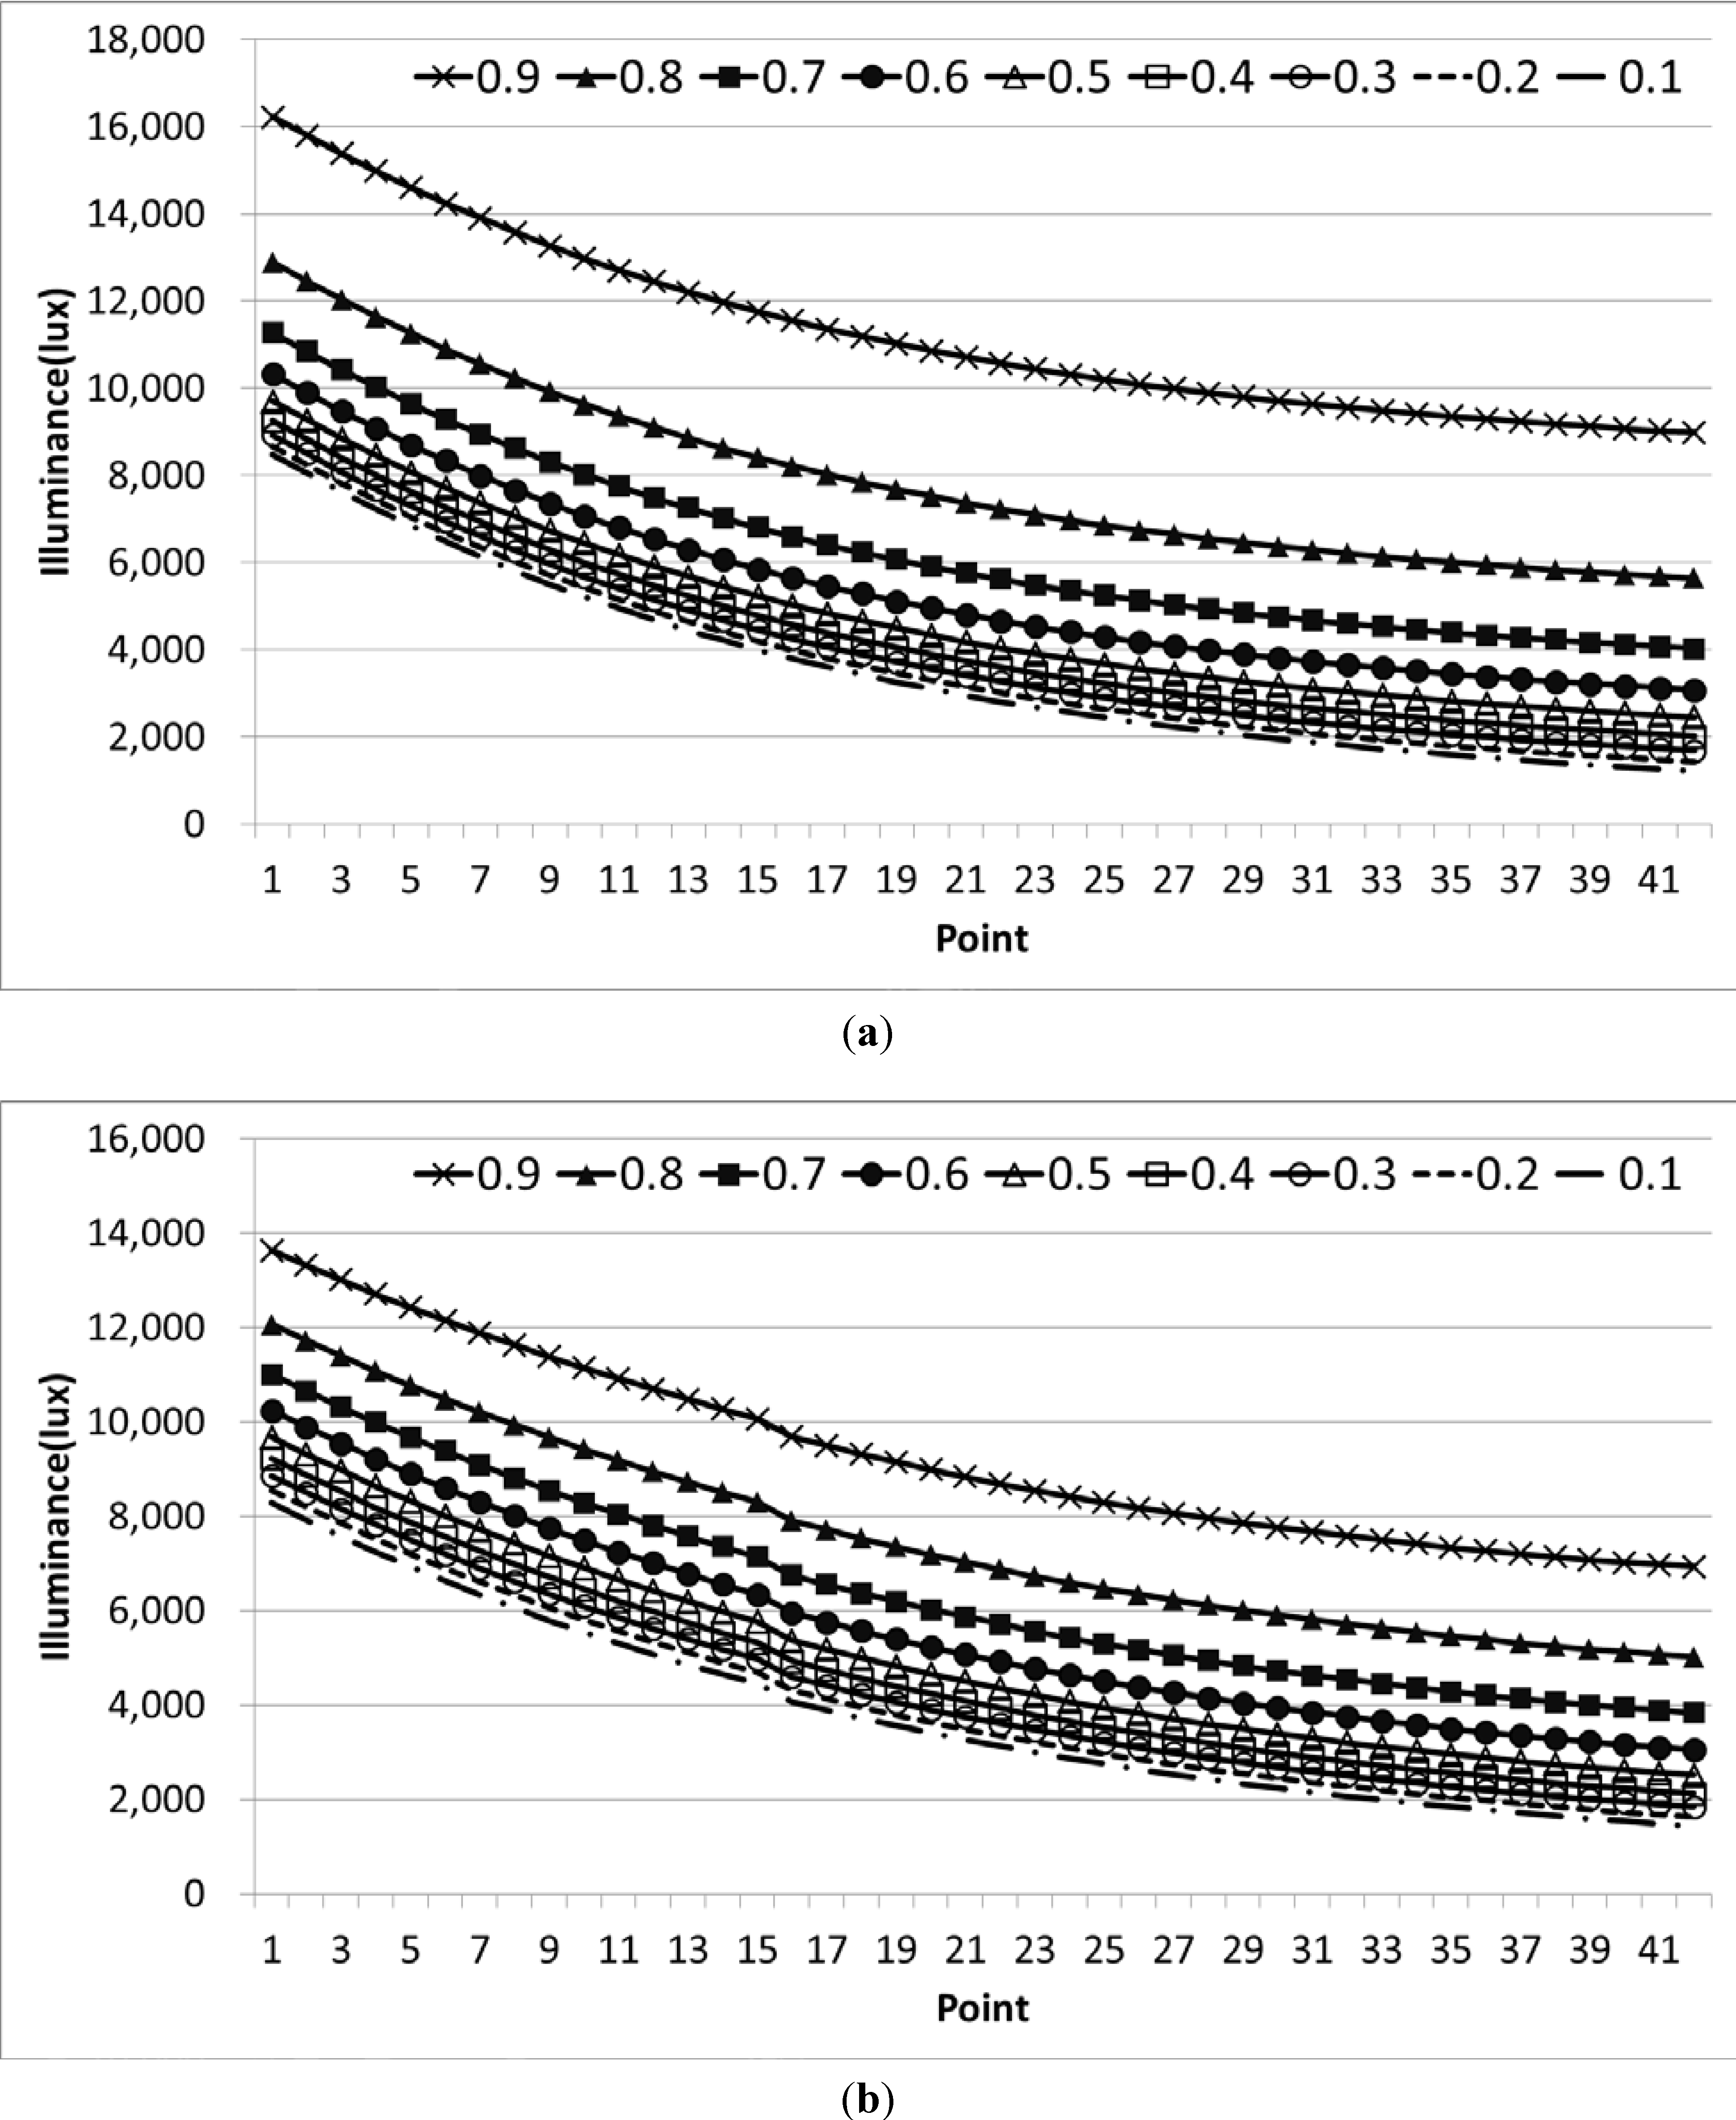
  • As we move further away from the window, the illuminance level decreases, except for in winter solstice conditions, when sunlight penetrates deeper into the room, and this phenomenon is reversed. Moreover, the illuminance level increases with the increase in wall reflectance. This is because of how the Radiosity algorithm works. As we go further into the room, there is more reflected light and more point to point pairs for the algorithm to work. We also believe that due to the presence of window, the light instead of being re-reflected into the room, bounces out of the window, making the illuminance level lower near window than further inside the room. This becomes more pronounced as the wall reflectance increases. Therefore, the illuminance level increases when wall reflectance and distance from the window increases.
Much has been discussed regarding the Radiosity and Split-flux method, but these discussions almost always takes place for south orientation. The initial study in this experiment verified that the Radiosity method provided results are more realistic than the Split-flux method. However, when the windows were turned to face different orientation, this theory definitely needed to be revised. Although it can be deduced from the literature review and from our own study that the Radiosity method definitely has an edge over the Split-flux method when it comes to accuracy, it still lacks the flexibility for dynamic control of individual openings and calculation of glare [14]. Moreover, we can see from our study that it is not ready to deal with orientation change as well. This can be easily fixed if the time-step algorithm is developed for the Radiosity method in the same way that it has been developed for the Split-flux method.

Acknowledgments

This research was supported by Basic Science Research Program through the National Research Foundation of Korea (NRF) funded by the Ministry of Science, ICT & Future Planning (2012R1A1A1003730).

Author Contributions

All authors contributed equally to this work. All authors designed the simulations, discussed the results and implications and commented on the manuscript at all stages. Yeo Beom Yoon performed the energy simulations. Rashmi Manandhar led the development of the paper and Kwang Ho Lee performed the result analysis and discussion.

Conflicts of Interest

The authors declare no conflict of interest.

References

  1. Koshel, R.J. Illumination engineering. Opt. Eng. 2004, 43, 1478–1479. [Google Scholar] [CrossRef]
  2. Nakamura, Y. Method of discomfort glare estimation applicable to a wide range of source sizes-glare estimation system based on luminance image. Light Eng. 2008, 16, 84–88. [Google Scholar]
  3. Carroll, W.L. Daylighting Simulation: Methods, Algorithms, and Resources; Report of IEA SHC Task 21/ECBCS ANNEX 29. No. LBNL-44296; Lawrence Berkeley National Laboratory: Berkeley, CA, USA, 1999. [Google Scholar]
  4. Dong, J.T.; Lu, R.S.; Shi, Y.Q.; Xia, R.X.; Li, Q.; Xu, Y. Optical design of color light-emitting diode ring light for machine vision inspection. Opt. Eng. 2011, 50, 043001:1–043001:11. [Google Scholar]
  5. Audenaert, J.; Leloup, F.B.; van Giel, B.; Durinck, G.; Deconinck, G.; Hanselaer, P. Impact of the accurateness of bidirectional reflectance distribution function data on the intensity and luminance distributions of a light-emitting diode mixing chamber as obtained by simulations. Opt. Eng. 2013, 52. [Google Scholar] [CrossRef]
  6. Tsangrassoulis, A.; Bourdakis, V. Comparison of radiosity and ray-tracing techniques with a practical design procedure for the prediction of daylight levels in atria. Renew. Energy 2003, 28, 2157–2162. [Google Scholar] [CrossRef]
  7. Hviid, C.A.; Nielsen, T.R.; Svendsen, S. Simple tool to evaluate the impact of daylight on building energy consumption. Sol. Energy 2008, 82, 787–798. [Google Scholar] [CrossRef]
  8. Versage, R.; Melo, A.P.; Lamberts, R. Impact of different daylighting simulation results on the prediction of total energy consumption. In Proceedings of the SimBuild 2010 Conference, New York, NY, USA, 11–13 August 2010; pp. 1–7.
  9. Robinson, D.; Stone, A. Internal illumination prediction based on a simplified radiosity algorithm. Sol. Energy 2006, 80, 260–267. [Google Scholar] [CrossRef]
  10. Robinson, D.; Stone, A. A simplified radiosity algorithm for general urban radiation exchange. Build. Serv. Eng. Res. Technol. 2005, 26, 271–284. [Google Scholar] [CrossRef]
  11. Tsangrassoulis, A.; Santamouris, M.; Asimakopoulos, D. Theoretical and experimental analysis of daylight performance for various shading systems. Energy Build. 1996, 24, 223–230. [Google Scholar] [CrossRef]
  12. Yoon, Y.B.; Jeong, W.R.; Lee, K.H. Window material daylighting performance assessment algorithm: Comparing radiosity and split-flux methods. Energies 2014, 7, 2362–2376. [Google Scholar] [CrossRef]
  13. Winkelmann, F. Modeling windows in EnergyPlus, building simulation 2011. In Proceedings of the 7th International IBPSA Conference, Rio de Janeiro, Brazil, 13–15 August 2001.
  14. The U.S. DOE. EnergyPlus Engineering Reference. The Reference to EnergyPlus Calculations. Available online: http://apps1.eere.energy.gov/buildings/energyplus/pdfs/engineeringreference.pdf (accessed on 29 October 2012).
  15. Hitchcock, R.J.; Carroll, W.L. DElight: A Daylighting and Electric Lighting Simulation Engine. In Proceedings of the 8th International IBPSA Conference, Eindhoven, the Netherlands, 11–14 August 2003; pp. 483–489.
  16. Modest, M.F. A general model for the calculation of daylighting in interior spaces. Energy Build. 1982, 5, 69–79. [Google Scholar] [CrossRef]
  17. Crawley, D.B.; Lawrie, L.K.; Winkelmann, F.C.; Buhl, W.F.; Pedersen, C.O.; Strand, R.K.; Liesen, R.J.; Fisher, D.E.; Witte, M.J.; Henninger, R.H.; et al. EnergyPlus: New, capable, and linked. In Proceedings of the Performance of Exterior Envelopes of Whole Buildings VIII, ASHRAE 2001, Clearwater Beach, FL, USA, 1–5 December 2001.
  18. Jeong, W.R. Visual Environment Assessment of Office Space Daylighted by Transparent BIPV Window System. Master’s Thesis, Hanbat National University, Daejeon, Korea, 2013. [Google Scholar]
  19. The U.S. DOE. EnergyPlus Input Output Reference: The Encyclopedic Reference to EnergyPlus Input and Output. Available online: http://apps1.eere.energy.gov/buildings/energyplus/pdfs/inputoutputreference.pdf (accessed on 29 October 2013).
  20. The U.S. DOE. Tips & Tricks for Using EnergyPlus; Insider Secrets to Using EnergyPlus. Available online: http://apps1.eere.energy.gov/buildings/energyplus/pdfs/tips_and_tricks_using_energyplus.pdf (accessed on 28 February 2014).
  21. Yoon, Y.B.; Lee, K.H. Comparing Radiosity and Split-flux illuminance algorithm in Energyplus. In Proceedings of the Biannual Autumn Conference of Korean Institute of Architectural Sustainable Environment and Building System (KIAEBS), Seoul, Korea, 2 November 2013.
  22. Modest, M.F. Daylighting Calculations for Non-Rectangular Interior Spaces with Shading Devices. Report No. LBL-12599; Lawrence Berkeley Laboratory: Berkeley, CA, USA, 1981. [Google Scholar]
  23. Müller, S.; Kresse, W.; Gatenby, N.; Schöffel, F. A radiosity approach for the simulation of daylight. In Rendering Techniques ’95 Eurographics. Proceedings of the Eurographics Workshop, Dublin, Ireland, 12–14 June 1995.
  24. Willmott, A.J.; Heckbert, P.S. An Empirical Comparison of Radiosity Algorithms; Technical Report CMU-CS-97-115; School of Computer Science, Carnegie Mellon University: Pittsburgh, PA, USA, 1997; pp. 7–10. [Google Scholar]
  25. Winkelmann, F.C. Daylighting Calculation in DOE-2; Report No. LBL-11353; Lawrence Berkeley Laboratory: Berkeley, CA, USA, 1983. [Google Scholar]
  26. Winkelmann, F.C. Daylighting Simulation in the DOE-2 Building Energy Analysis Program; Report No. LBL-18508; Lawrence Berkeley Laboratory: Berkeley, CA, USA, 1985. [Google Scholar]

