Modeling of Clostridium tyrobutyricum for Butyric Acid Selectivity in Continuous Fermentation

Abstract
: A mathematical model was developed to describe batch and continuous fermentation of glucose to organic acids with Clostridium tyrobutyricum. A modified Monod equation was used to describe cell growth, and a Luedeking-Piret equation was used to describe the production of butyric and acetic acids. Using the batch fermentation equations, models predicting butyric acid selectivity for continuous fermentation were also developed. The model showed that butyric acid production was a strong function of cell mass, while acetic acid production was a function of cell growth rate. Further, it was found that at high acetic acid concentrations, acetic acid was metabolized to butyric acid and that this conversion could be modeled. In batch fermentation, high butyric acid selectivity occurred at high initial cell or glucose concentrations. In continuous fermentation, decreased dilution rate improved selectivity; at a dilution rate of 0.028 h−1, the selectivity reached 95.8%. The model and experimental data showed that at total cell recycle, the butyric acid selectivity could reach 97.3%. This model could be used to optimize butyric acid production using C. tyrobutyricum in a continuous fermentation scheme. This is the first study that mathematically describes batch, steady state, and dynamic behavior of C. tyrobutyricum for butyric acid production.1. Introduction
Organic acids can be produced from biomass-derived sugars through fermentation. One of these products, butyric acid, has many applications in the food and perfume industries. Pure butyric acid is used in food flavors, and esters of butyric acid are widely used as additives in the perfume industry [1,2]. Butyric acid is also used to produce the biodegradable polymer β-hydroxybutyrate and in the production of several drugs [3]. Butyric acid might also find application as an intermediate in the production of one of the next generation of biofuels, biobutanol, through two-step fermentation as described by Ramey [4]. Butyric acid is currently produced chemically, which starts from the oxosynthesis of propylene [5]. The fermentation process to produce butyric acid is difficult because it forms multiple products at low concentrations, which greatly increases downstream separation costs.
There are several Clostridial strains which can convert sugars to butyric acid [6–14]. Of these strains, Clostridium tyrobutyricum is attractive because it only requires a simple medium (yeast extract) for growth, and can produce butyric acid in high yield, selectivity and concentration [15]. C. tyrobutyricum is a rod-shaped, Gram-positive bacterium which grows under anaerobic conditions. It produces butyric acid and acetic acid as its main fermentation products from sugars, and also produces hydrogen and carbon dioxide as gaseous by-products. The production of acetic acid diminishes the feasibility of the fermentation process with C. tyrobutyricum by decreasing the selectivity and yield for butyric acid. Some research has been done to improve this fermentation by trying to inhibit or eliminate the production of acetic acid. Several fermentation modes and operation parameters were investigated [10–12,16]. During these studies, the selectivity varied from 71% to 89% in batch fermentation, depending on the glucose concentration. For continuous fermentation, the selectivity varied from 60% to 96%, depending on the dilution rate. It was also found that continuous fermentation with partial cell recycle gave high selectivity at low dilution rate and high cell recycle ratio [17]. A novel extractive fermentation, with 10% alamine 336 in oleyl alcohol as a solvent, selectively extracted butyric acid from the fermentation with a butyric acid selectivity of 91% [15]. Further, selective separation using electrodeionization has given high selectivity at relatively high productivities [18]. Gene manipulation methods have also been used to disrupt the gene associated with the acetic acid formation pathway. In this way, more butyric acid was produced, although acetic acid production was not eliminated [3,19,20].
The cell growth rate of C. tyrobutyricum, glucose concentration within the system and nutrient supply have significant influences on selectivity. A possible explanation for the influence of cell growth rate on selectivity is that the production of acetic acid produces more ATP, which is needed for rapid cell growth [3,10,13]. Additionally, the influence of glucose concentration and supply modes are dependent upon the cell growth rate. For example, in a continuous fermentation of C. tyrobutyricum, the selectivity for butyric acid decreases with increased dilution rate [11]; the relationship between dilution rate and cell growth rate exists because the dilution rate equals the specific cell growth rate for continuous fermentation [21]. The selectivity for butyric acid increases with increasing glucose concentration. This could be explained by product inhibition of cell growth at higher product concentrations, which then prefers the production of butyric acid. A continuous fermentation with total cell recycle showed a selectivity for butyric acid of 96.8%, which was much higher than batch fermentation results, because cell recycle inhibited cell growth [12]. Although experiments have shown the impact of cell growth rate, a comprehensive simulation explaining batch and continuous behavior has not been published for this fermentation.
1.1. Theory
The objective of this paper was to develop a mathematical model to describe cell growth rate, product formation, and substrate consumption for the fermentation of glucose to butyric acid with C. tyrobutyricum. By solving these coupled differential equations with initial cell, glucose and products concentrations, a time course for the batch fermentation could be simulated. By introducing the mass balance for continuous fermentation, a steady state simulation for continuous fermentation could also be obtained.
The classical Luedeking-Piret equation shows how the rate of product formation changes with cell mass and cell growth rate [22,23], which illustrates that cell growth rate is important to describe most fermentation processes. The Monod equation expresses the change in cell growth rate [24]. These two equations, combined with an equation describing substrate consumption, are often used for fermentation simulation, mainly for the production of lactic acid, glutamic acid, and ethanol [22,23,25–28]. Although these fermentations produce a single product, the Luedeking-Piret equation is also applicable to multiple-product fermentations [23]. Therefore, it is possible to develop a mathematical model to predict the production of butyric acid and acetic acid, and then the selectivity for butyric acid in batch and continuous fermentations, by combining the Luedeking-Piret equation, the Monod equation, and an equation describing substrate consumption.
Cell growth over time during fermentation can be divided into the lag phase, the exponential growth phase, the stationary phase, and the death phase. The rate of cell growth in the exponential phase can be written as:
A simplified equation to describe the specific cell growth rate is the Monod equation, assuming glucose is the limiting growth component of the fermentation [23]:
The Monod equation allows for good prediction in a low inhibition environment. If there is a strong inhibition with a maximum cell concentration, it is necessary to introduce a cell inhibition term. Xm is the maximum cell concentration that can be reached and the constant m represents how strongly the inhibition affects the growth rate equation [21], shown as:
After describing the cell growth rate with a modified Monod equation, the production formations of butyric acid and acetic acid must be described. The Luedeking-Piret equation with empirical constants αi and βi correlates product formation, dPi/dt with cell growth rate, dX/dt and cell concentration, X, respectively:
In cultivation with a composite medium (a medium specially designed for this organism), a 95%–100% carbon source is used for product formation, meaning that almost all the carbon is going to products and little is going to cell maintenance [8]. Thus, the rate of substrate utilization, dS/dt, may be shown as:
In batch culture the cell growth, product formation and substrate consumption change with time and then terminate after a period of time. In continuous culture, steady state is reached, and cell growth rate can be obtained from the mass balance [23]:
1.2. Definitions
Selectivity was defined as the ratio of the weight of butyric acid to the weight of all acids produced. YP/S was used to define how much glucose is converted to products, both desirable (organic acids) and undesirable (carbon dioxide). It should be noted that the stoichiometry of producing butyric acid dictates that 1 mole of carbon dioxide is made for every mole of butanol. A YP/S of 1 meant all of the glucose was converted to products. The yield of butyric acid was defined as the ratio of the weight of butyric acid produced to the weight of glucose consumed. The conversion of glucose was defined as the ratio of the consumed glucose to the initial glucose.
2. Results and Discussion
2.1. Batch Fermentation Performance with C. tyrobutyricum
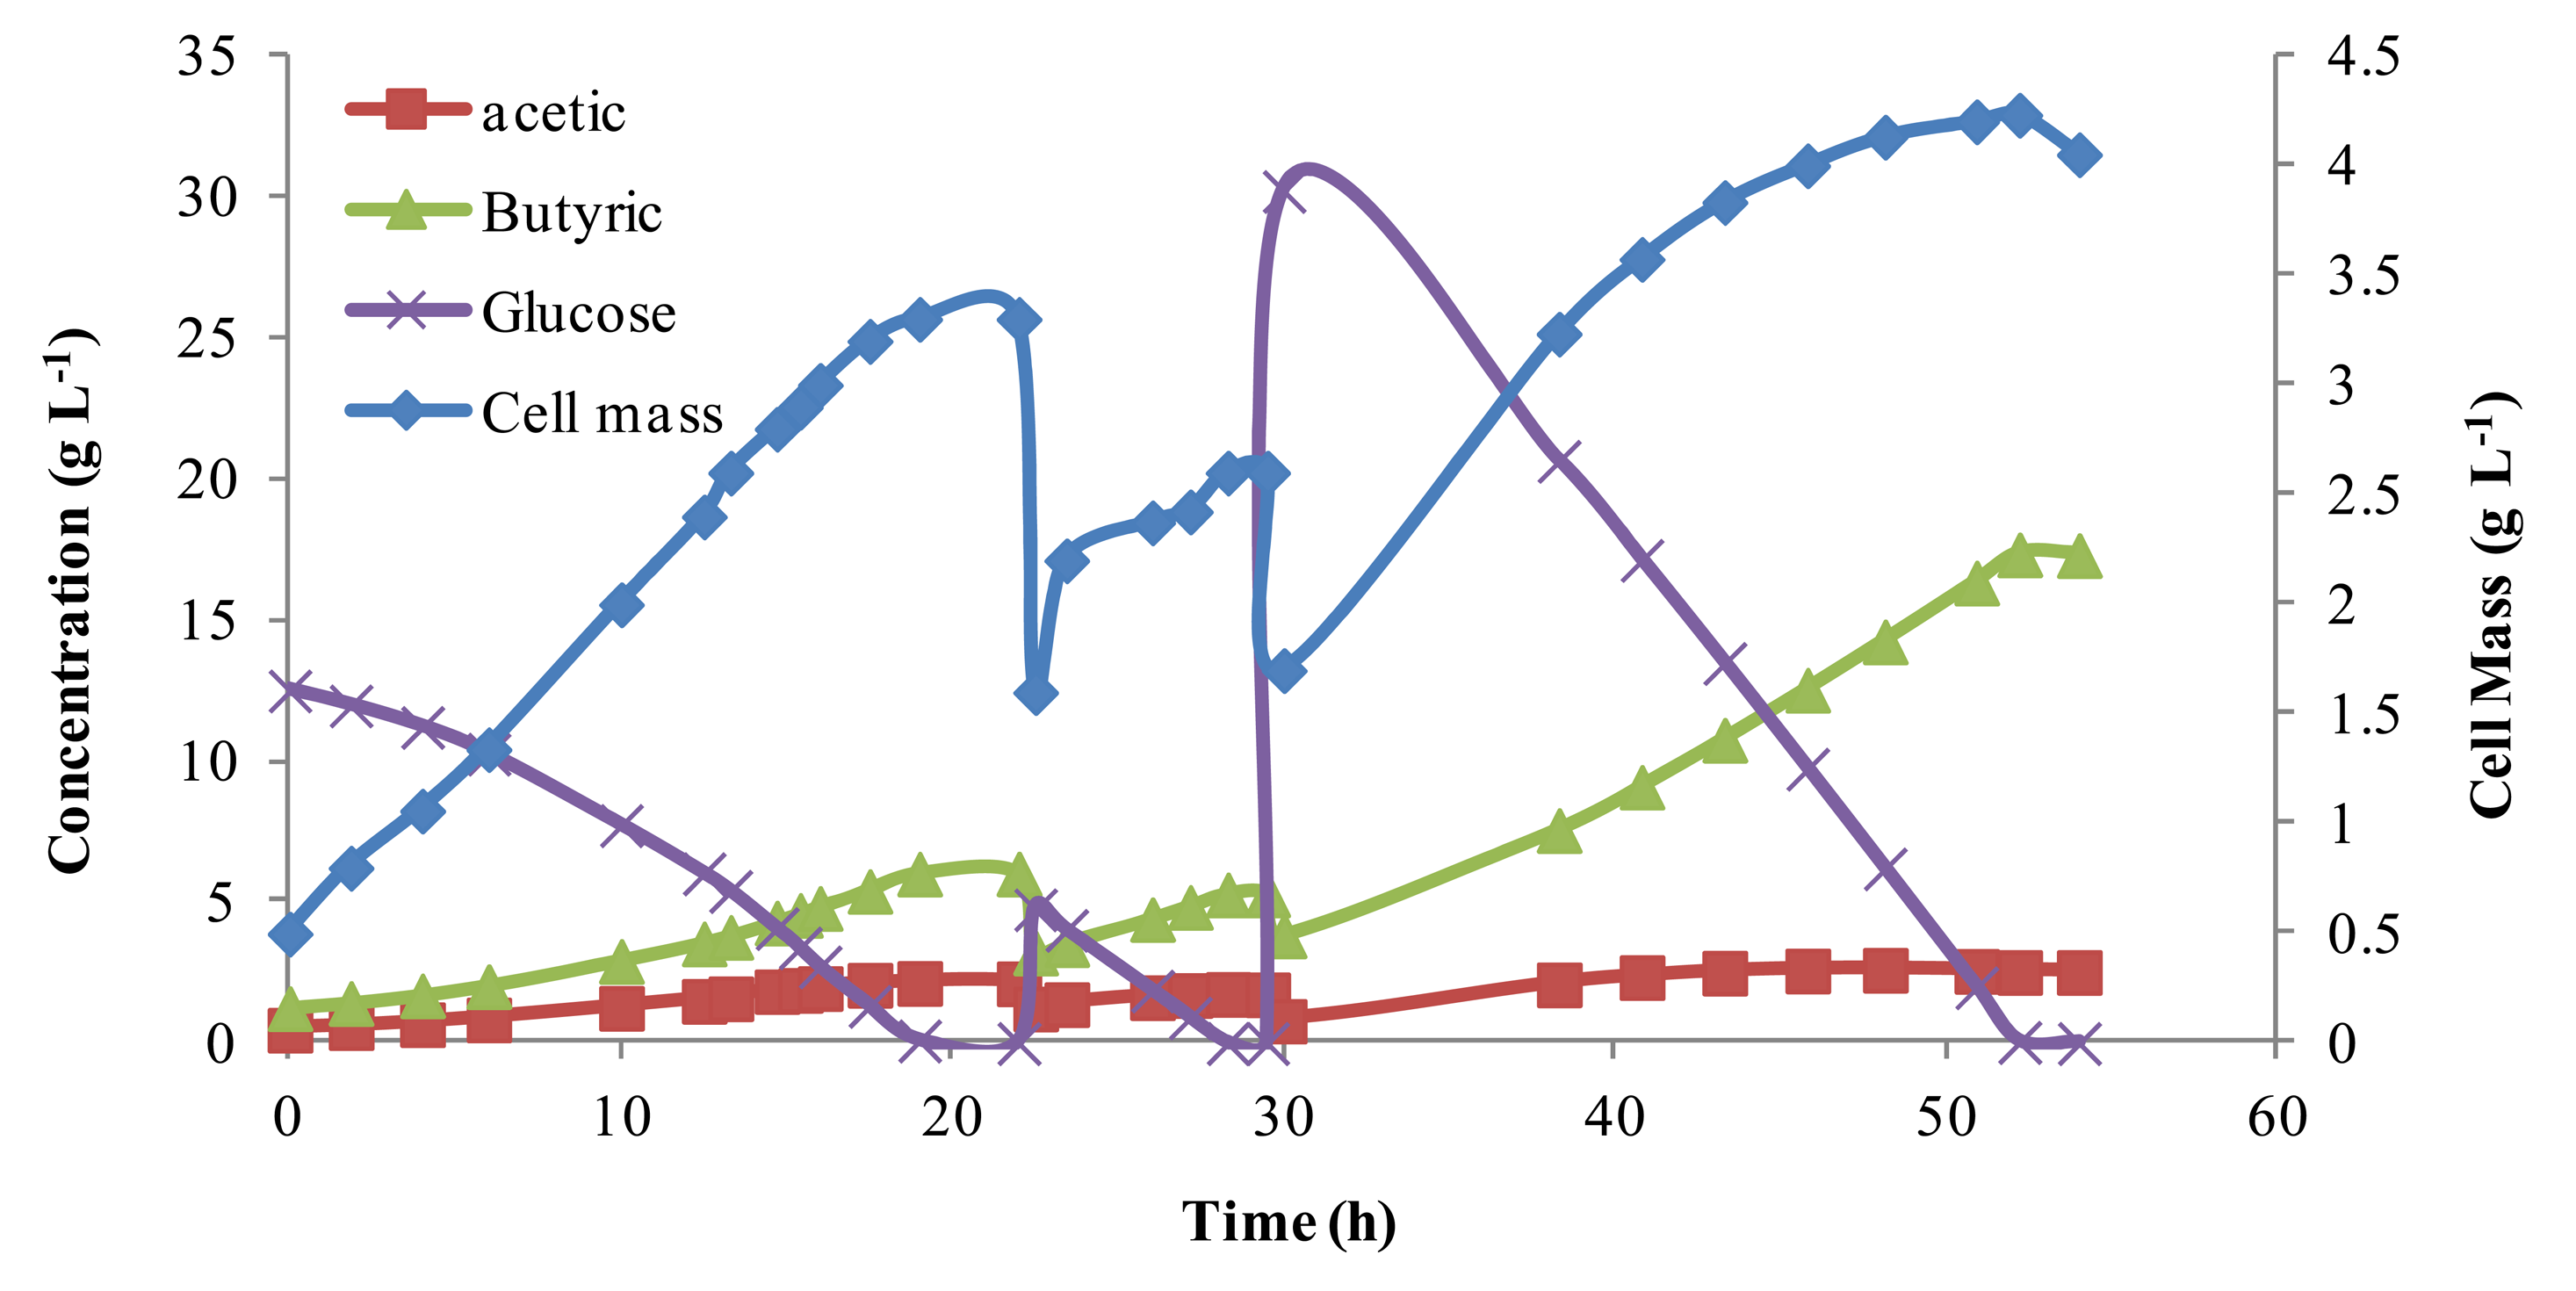
To evaluate the parameters in the mathematic models describing the batch fermentation, repeated batch fermentations were conducted. The time course of the batch fermentations was recorded and compared to other published data. Results from batch experiments are shown in Figure 1. The initial glucose concentration was varied by feeding medium with different glucose concentrations, and the initial cell mass was varied by purging different volumes of fermentation broth. Note, the non-linear jump in the cell mass with addition of more glucose is expected as the reactor returns to equilibrium. The total reaction volume was kept constant at 700 mL, although several times reactor volume was removed and new media was added (indicated by a drop in cell mass). Butyric acid concentrations, as shown in Figure 1, increase and decrease in proportion to cell mass, reaching a high of above 15 g L−1. Acetic acid byproduct was relatively steady under 5 g L−1. The selectivity of butyric acid varied from 76% to 90%, which was consistent with the work of Michel-Savin et al. [10] and Fayolle et al. [16], indicating that the media used was suitable for butyric acid production.
These results showed that cell mass grew almost linearly when the glucose concentration was high, but with the consumption of glucose, cell growth rate slowed. In comparing different fermentation batches, independent of the initial glucose concentrations, the cell concentration approached, but never surpassed 5.0 g L−1. This was probably because the chief product, butyric acid, strongly inhibits cell growth [3,10–12,15]. Work by Du et al. [18] showed this cell mass could be increased dramatically with continuous product removal. These batch results were later used for model parameter estimation.
2.2. Continuous Fermentation Performance with C. tyrobutyricum
Continuous fermentation experiments were carried out at different dilution rates (0.02 to 0.14 h−1) and different glucose concentrations (17 g L−1, 25 g L−1 and 50 g L−1). As shown in Table 1, cell washout occurred when the dilution rate was between 0.107 and 0.14 h−1, independent of the glucose concentration indicating a limit on the maximum specific cell growth rate. The cell concentration remained below 5.0 g L−1, which was consistent with the cell concentrations in the batch fermentations. When the glucose concentration was 50 g L−1, not all of the glucose was consumed, thus requiring a lower dilution rate. Dilution rate also had an influence on butyric acid selectivity. Independent of glucose concentration, the butyric acid selectivity increased with decreasing dilution rate, most likely as a result of low specific cell growth rate at low dilution rate.
2.3. Continuous Fermentation of C. tyrobutyricum with Total Cell Recycle
An extreme condition available for use to evaluate the influence of cell growth rate on continuous fermentation was total cell recycle by ultrafiltration or microfiltration. Total cell recycle greatly inhibited cell growth, and kept the cell growth rate close to zero. However, it could never be truly continuous as the fermentation vessel would eventually fill with dead cell mass. Theoretically, the cell growth rate for total cell recycle equals the cell death rate [21]. Continuous fermentation experimentation with cell recycle was conducted at a glucose concentration of 17 g L−1 and a dilution rate of 0.078 h−1, yielding a butyric acid selectivity of 97.3%, as shown in Table 1. Normally, the cell concentration in a fermenter with cell recycle would be much higher than without cell recycle [12]. For this particular fermentation, however, the cell concentration was only slightly higher, which again showed that product concentration increased cell growth inhibition.
2.4. Batch Fermentation Modeling
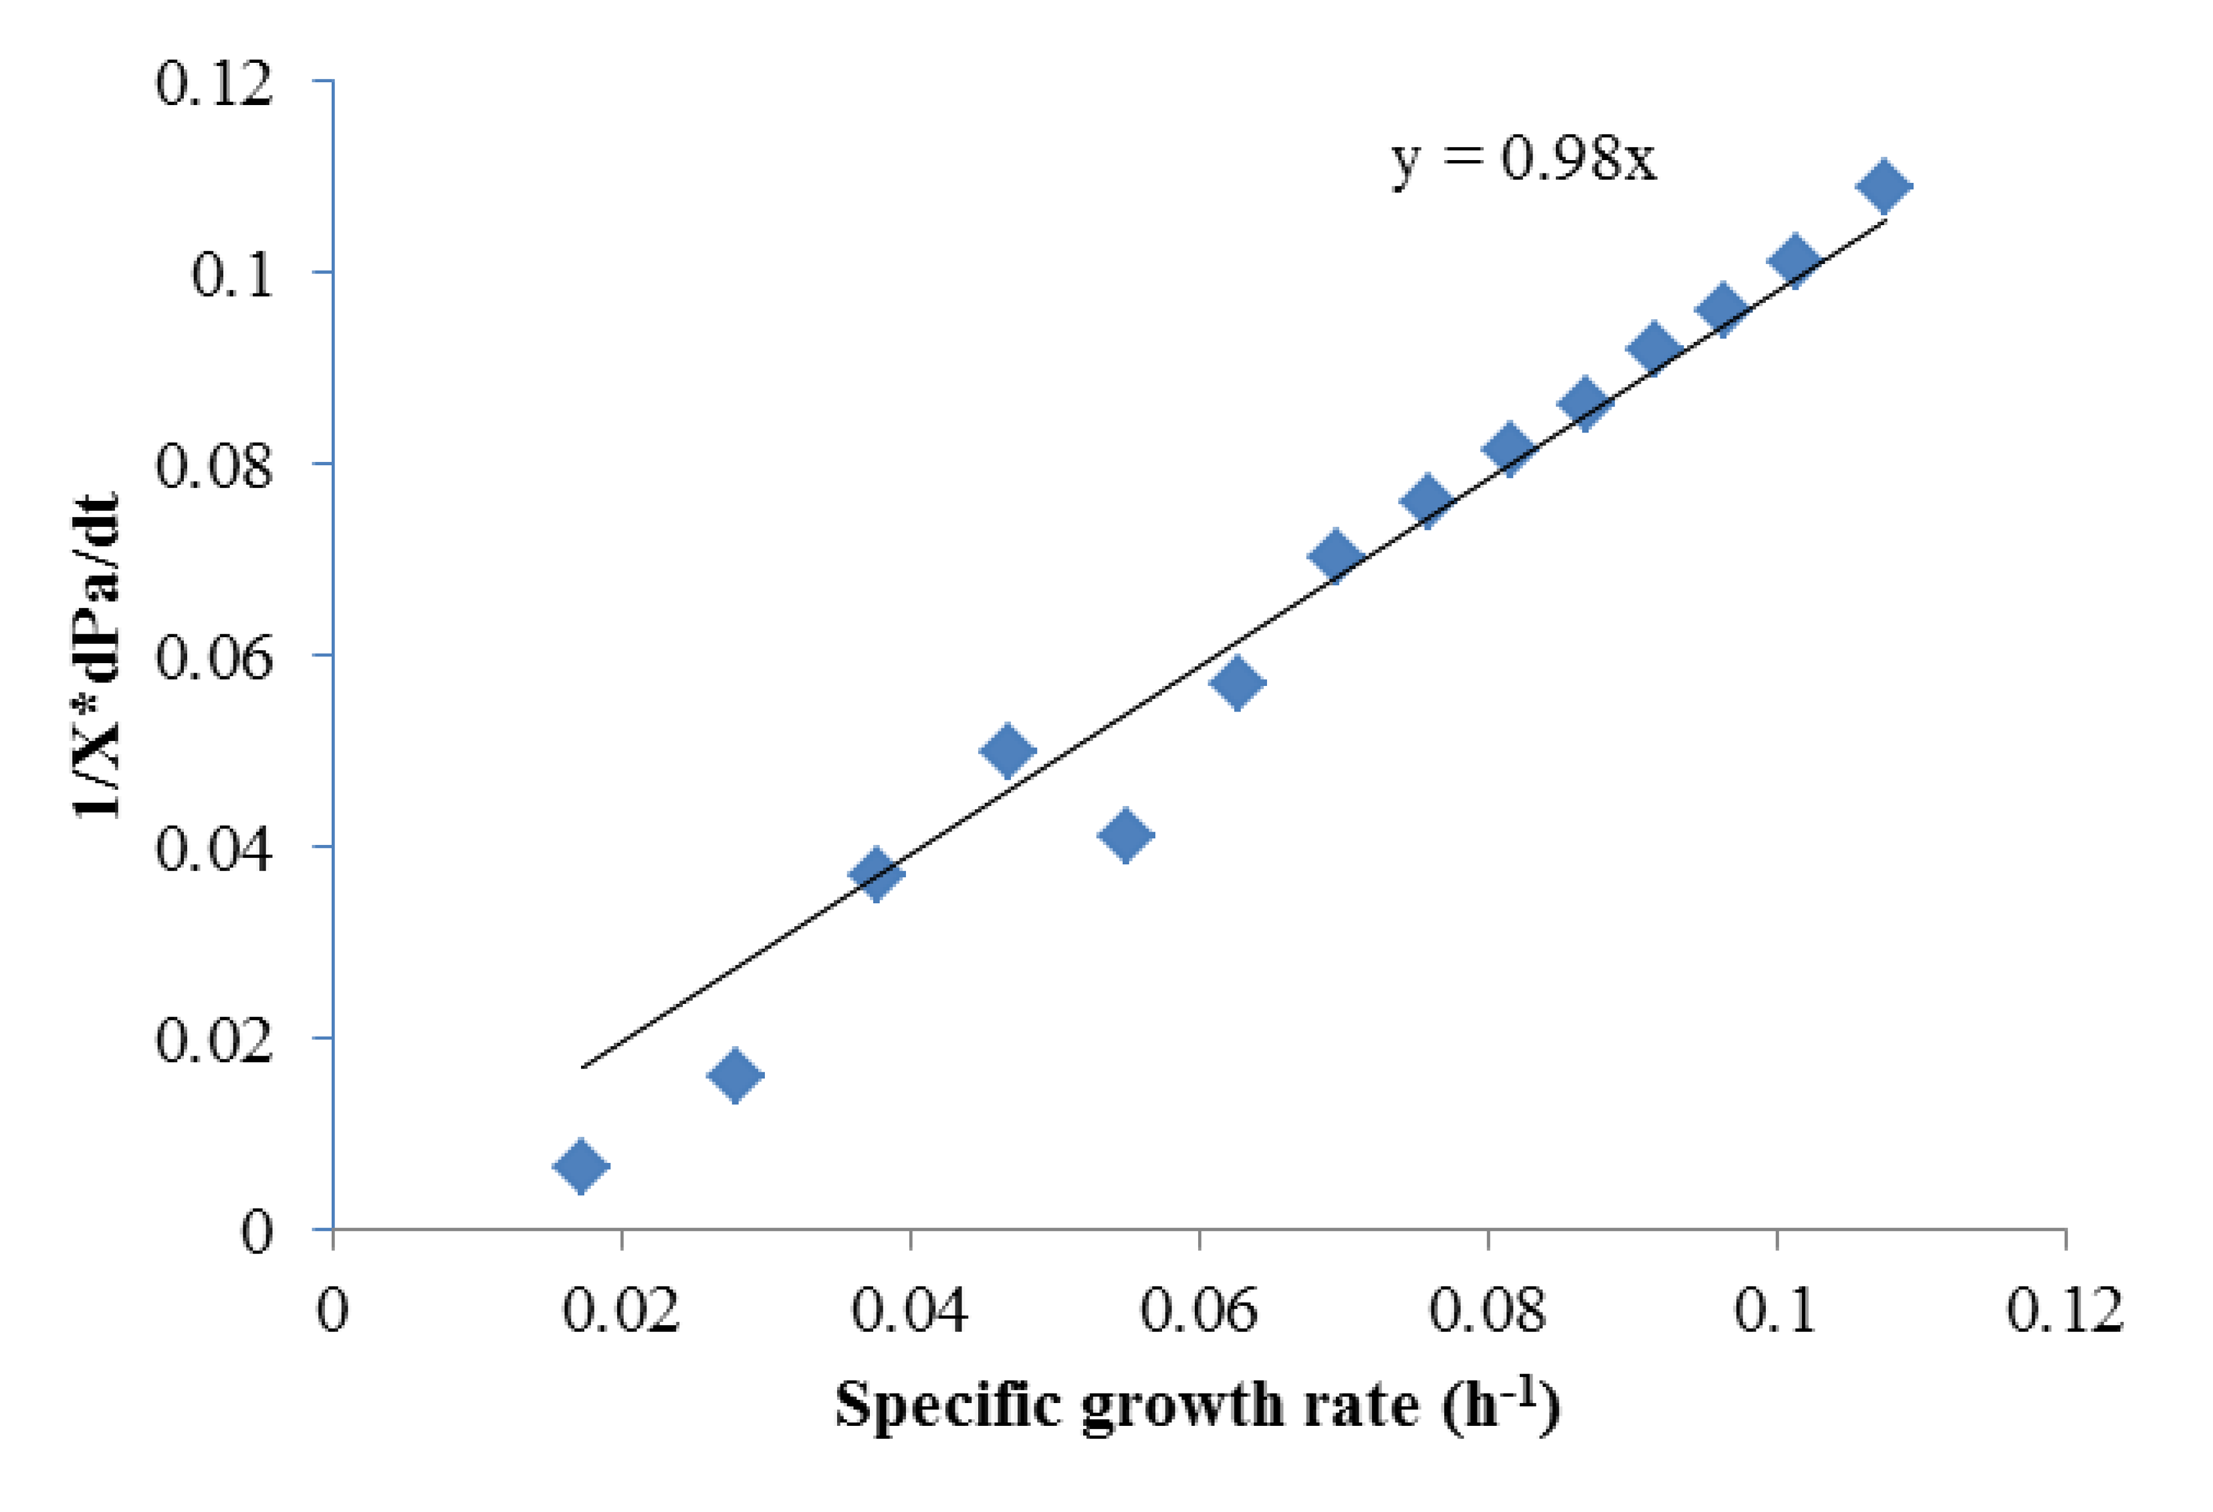
In order to accurately model the fermentation characteristics, the adjustable parameters from Equations (3)–(5) were determined. Thus, Equation (4) was rearranged to yield:
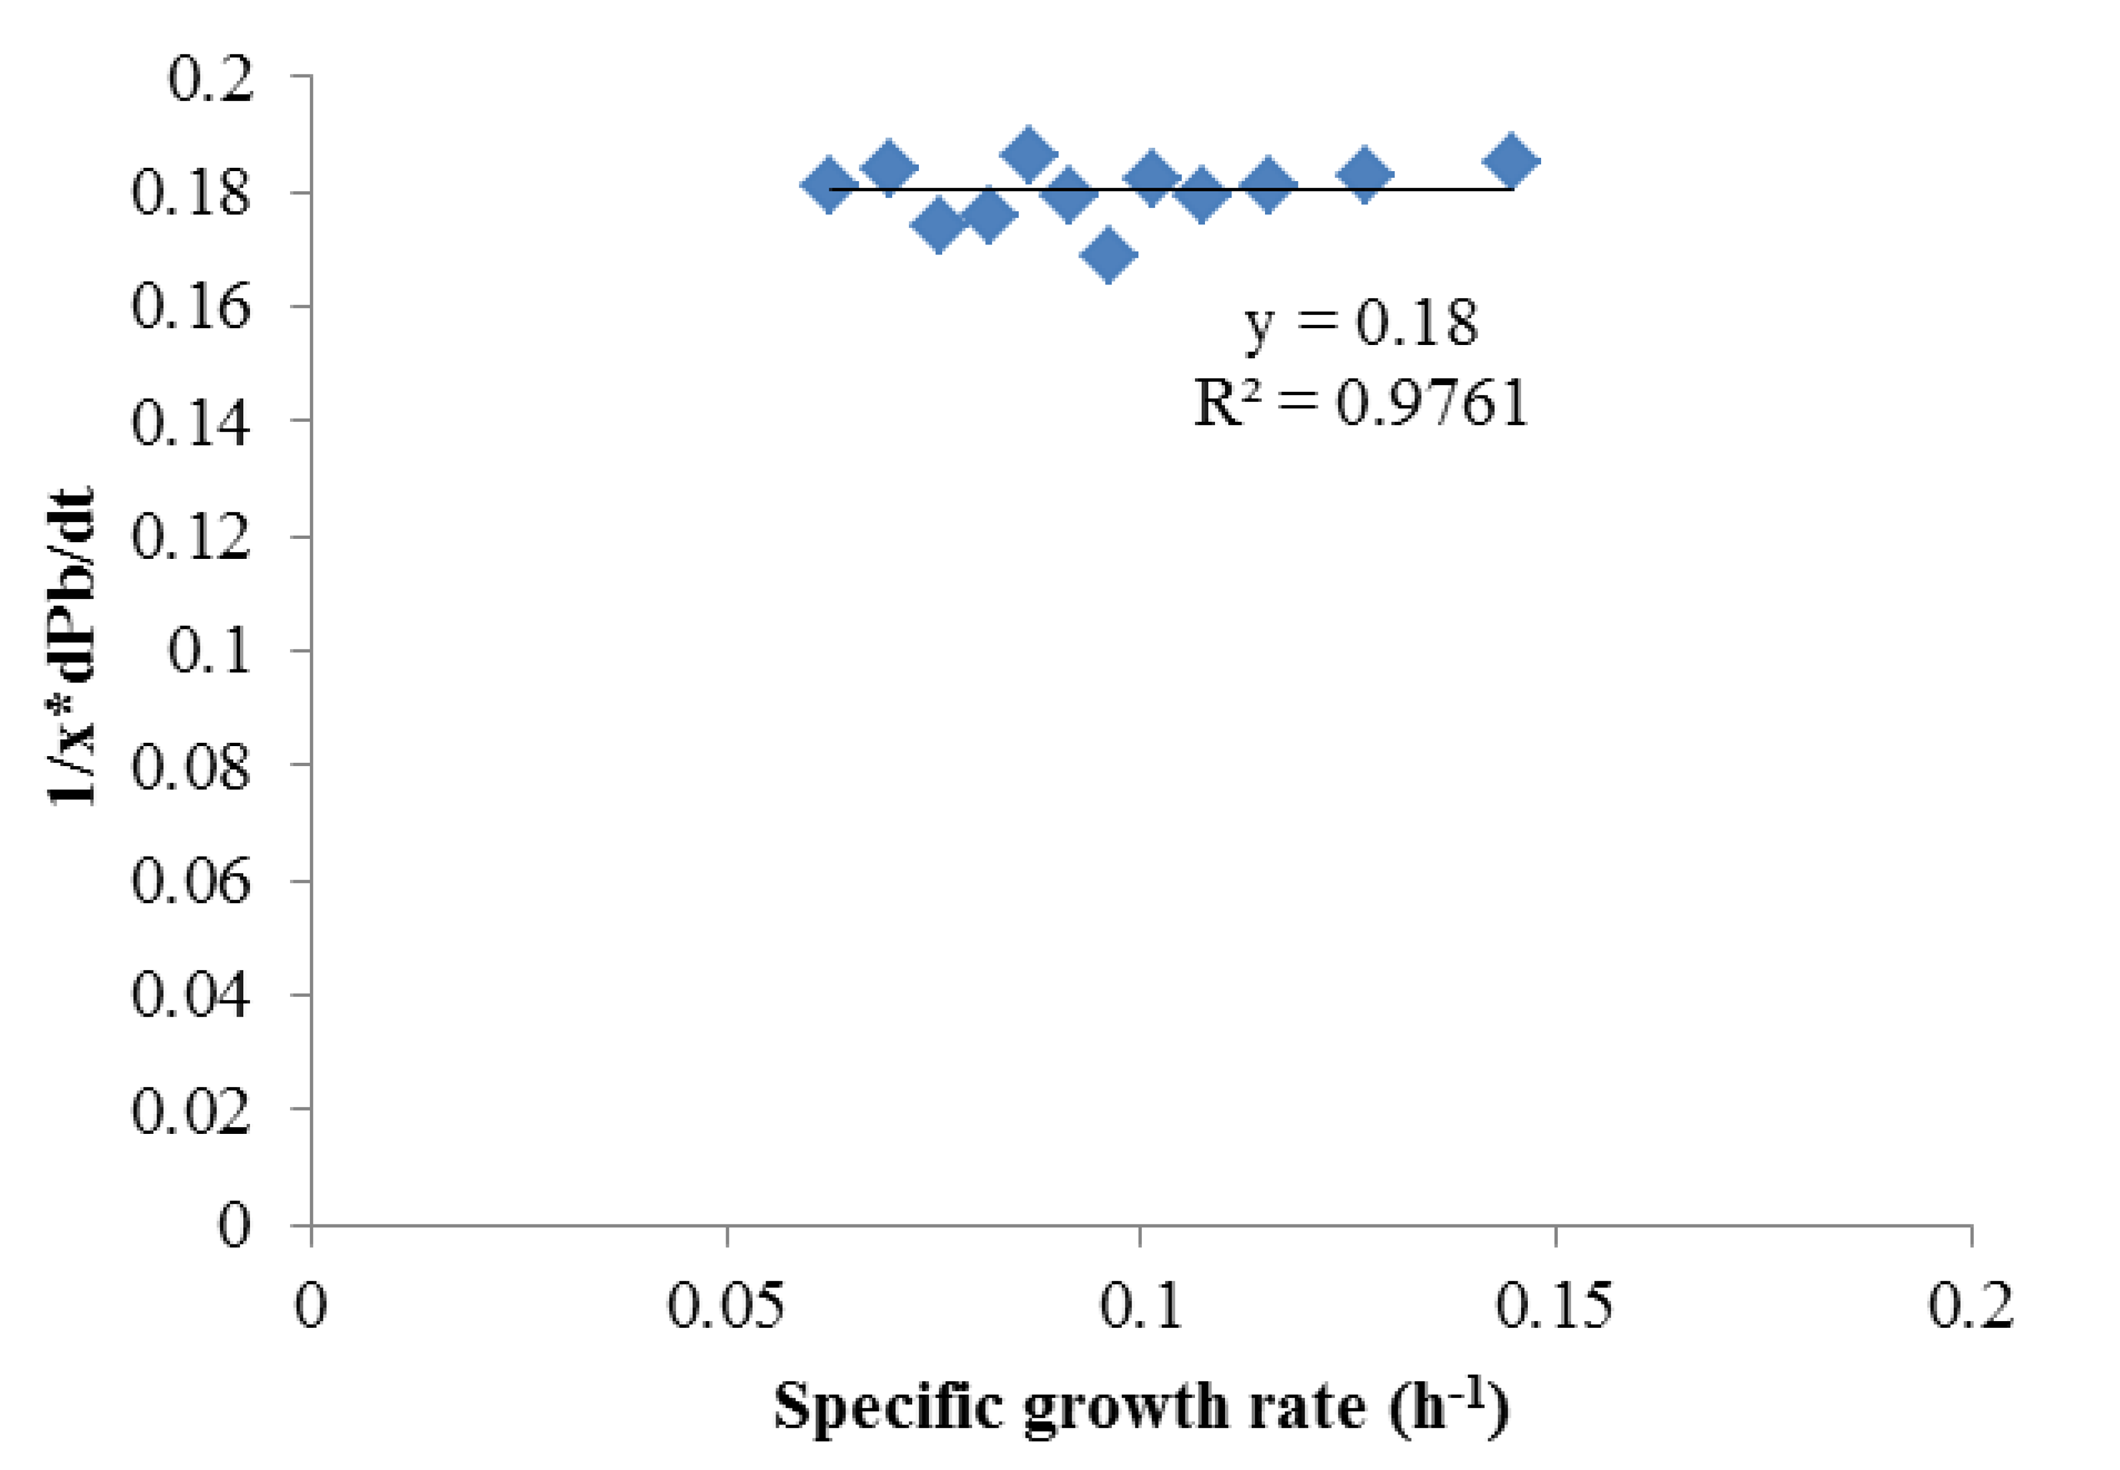
To obtain αi and βi, (1/X) × (dPi)/dt and (1/X) × dX/dt were obtained using the Matlab curve fit toolbox. As shown in Figures 2 and 3 which contains all the data in Figure 1, Luedeking-Piret equations for butyric acid and acetic acid formation were generated:
Both of these equations showed very good fits (R2 > 0.975), strongly indicating butyric acid was non-growth rate-related and the production of acetic acid was growth-rate-related. The strength of these correlations indicated that low growth conditions (such as late in batch fermentation or in high rates of cell recycling) were best for high selectivities of butyric acid.
To simplify the Monod equation, an assumption was made that cell inhibition was low. The following equation represented cell growth when initial glucose concentration was low:
Equation (5), describing substrate consumption, includes the parameters YB/S and YA/S. These parameters could be obtained from reaction stoichiometry, showing that one mole of butyric acid was produced from one mole of glucose and two moles of acetic acid were produced from one mole of glucose [8]. Thus:
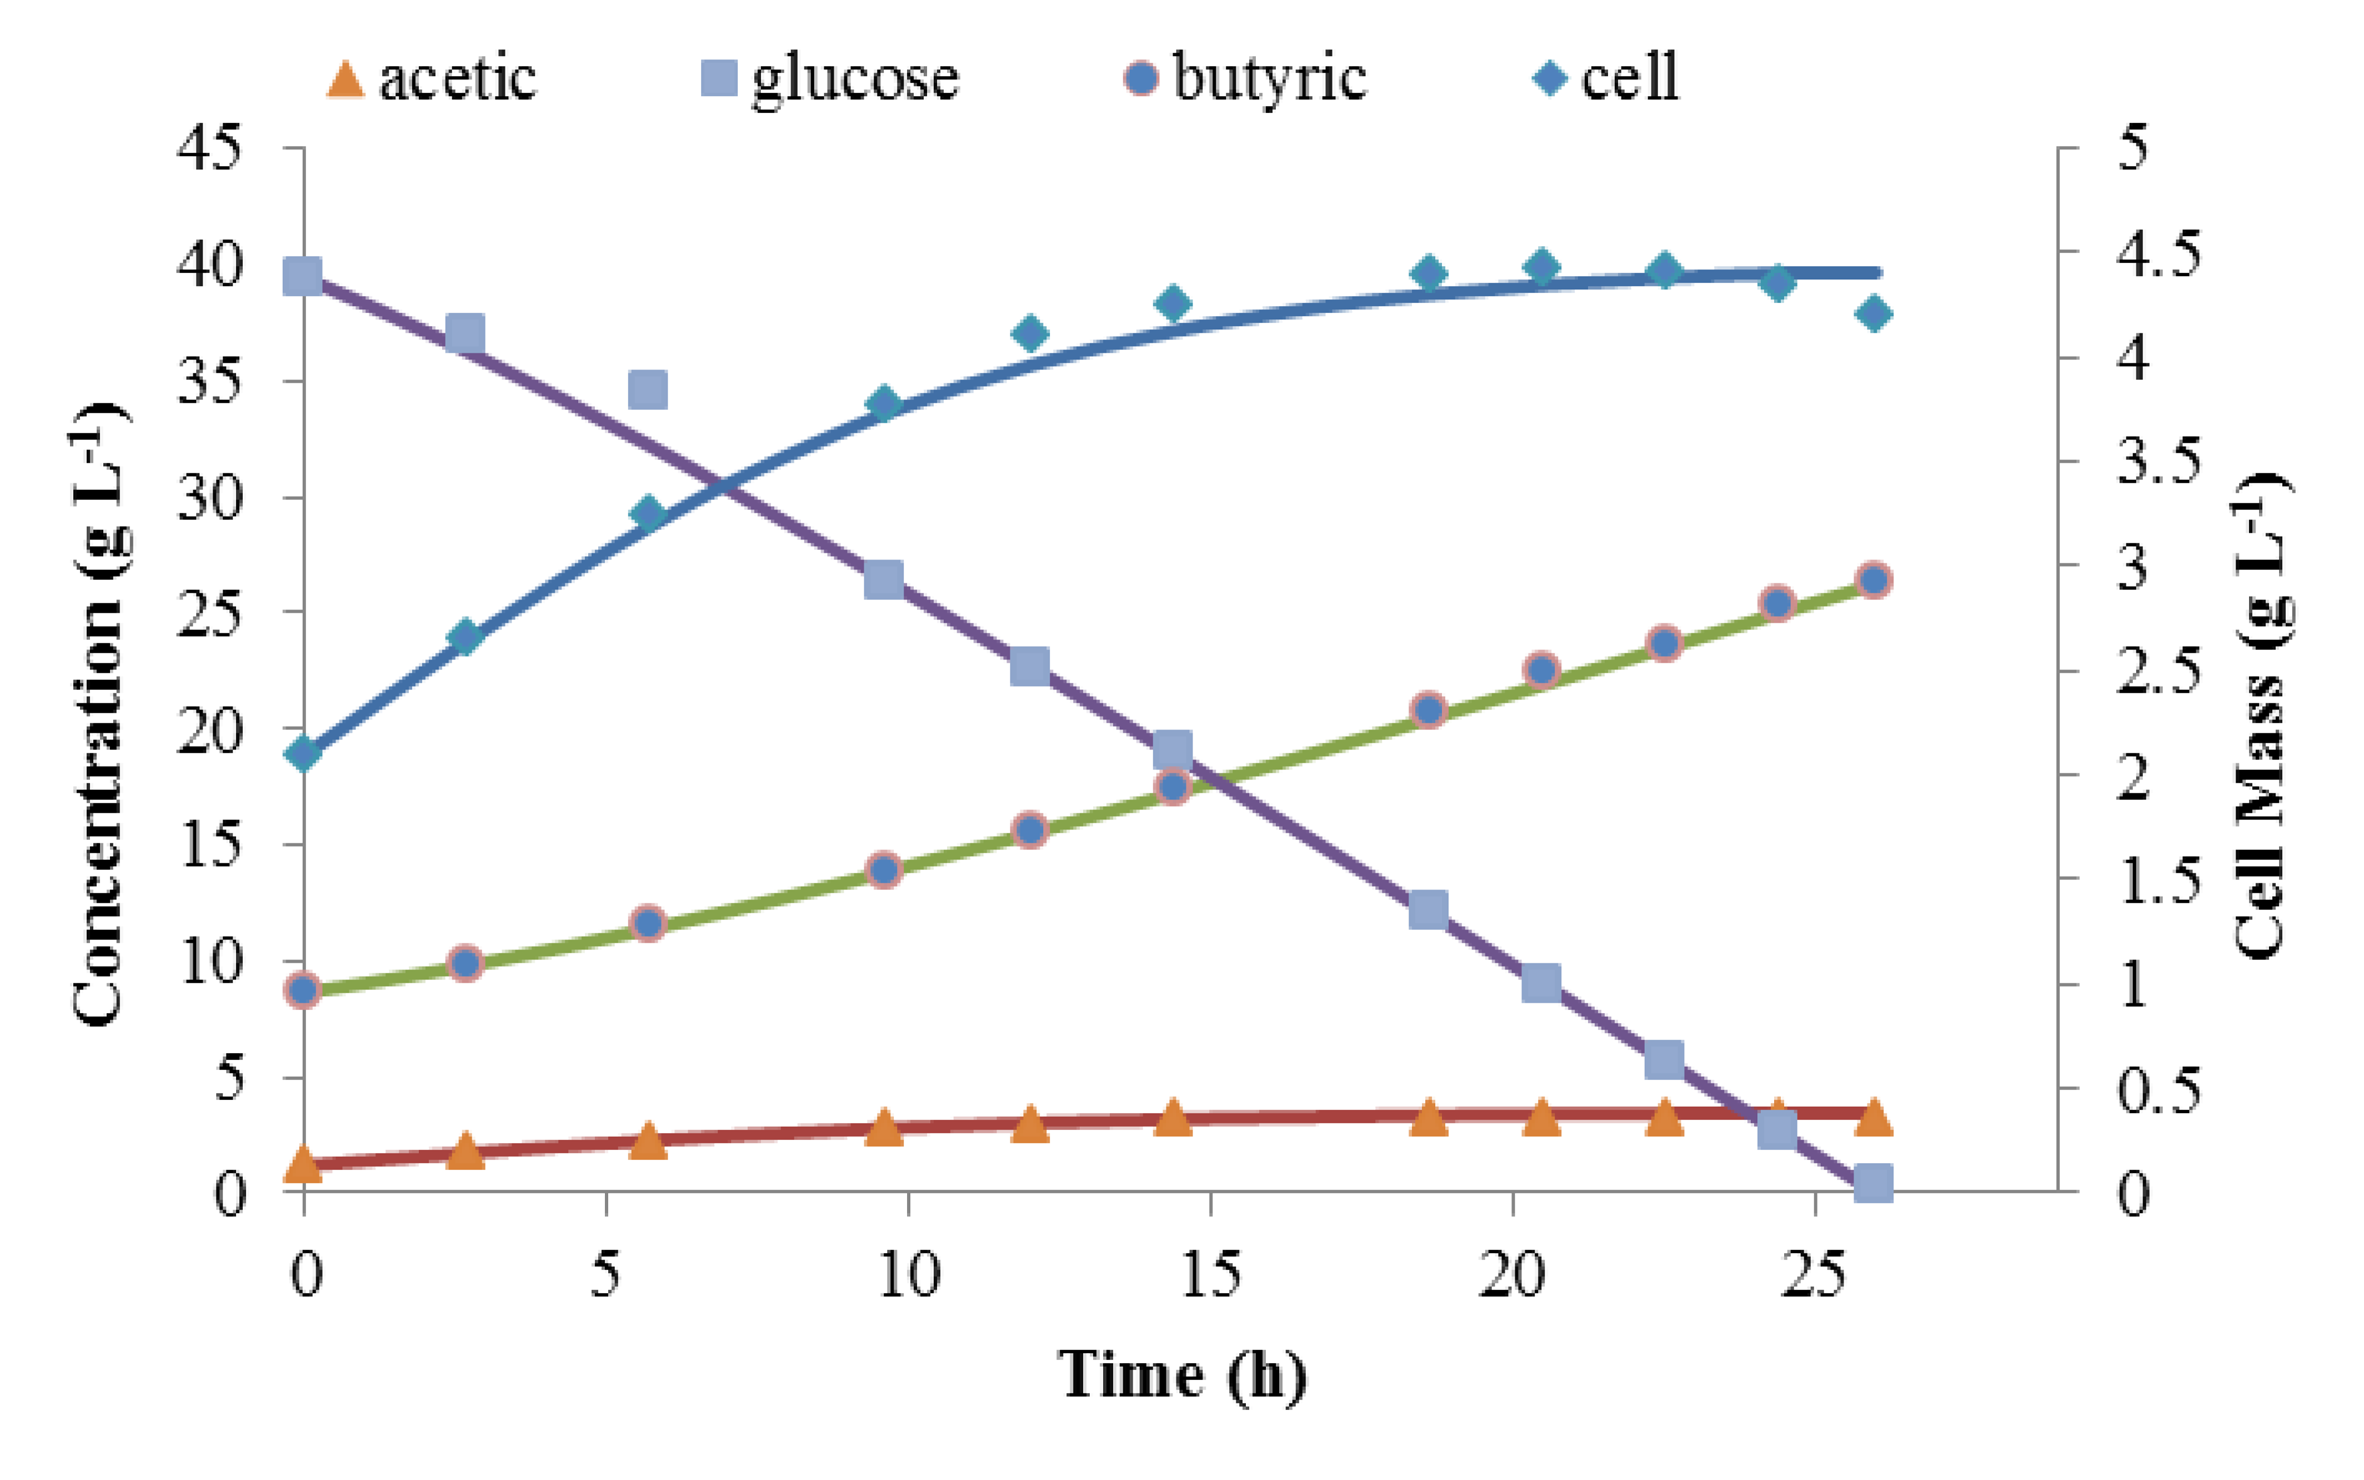
Matlab was used to solve these three coupled differential equations. These were solved simultaneously with the mass balance in order to assure carbon balance. Figure 4 shows the simulated time courses of batch fermentation against experimental data for the last batch fermentation, which was initiated with 39.6 g L−1 of glucose. The simulation predicted the kinetics of this batch fermentation very well. YP/S was calculated from experimental results to be close to 1. This proved the assumption that for this composite medium, 95%–100% of the glucose was converted to products instead of cell mass. It also shows that this model can be used as the basis for continuous fermentation modeling.
2.5. Steady State Continuous Fermentation Modeling
The equation describing product formation during the batch fermentation was used to find the steady-state mass balance for the continuous culture to obtain predicted output concentrations of products and selectivity for butyric acid. A mass balance on acetic acid is shown below, in Equation (13). From batch fermentation kinetics:
This equation is empirically derived from data obtained by Figure 3. A transient simulation of the mass balance on acetic acid applied to the fermenter is:
A similar equation was derived for butyrate production:
Finally, the selectivity was defined as the amount of butyric acid produced over the total amount of acids produced. If acetic acid was not metabolized to butyric acid this selectivity was given as:
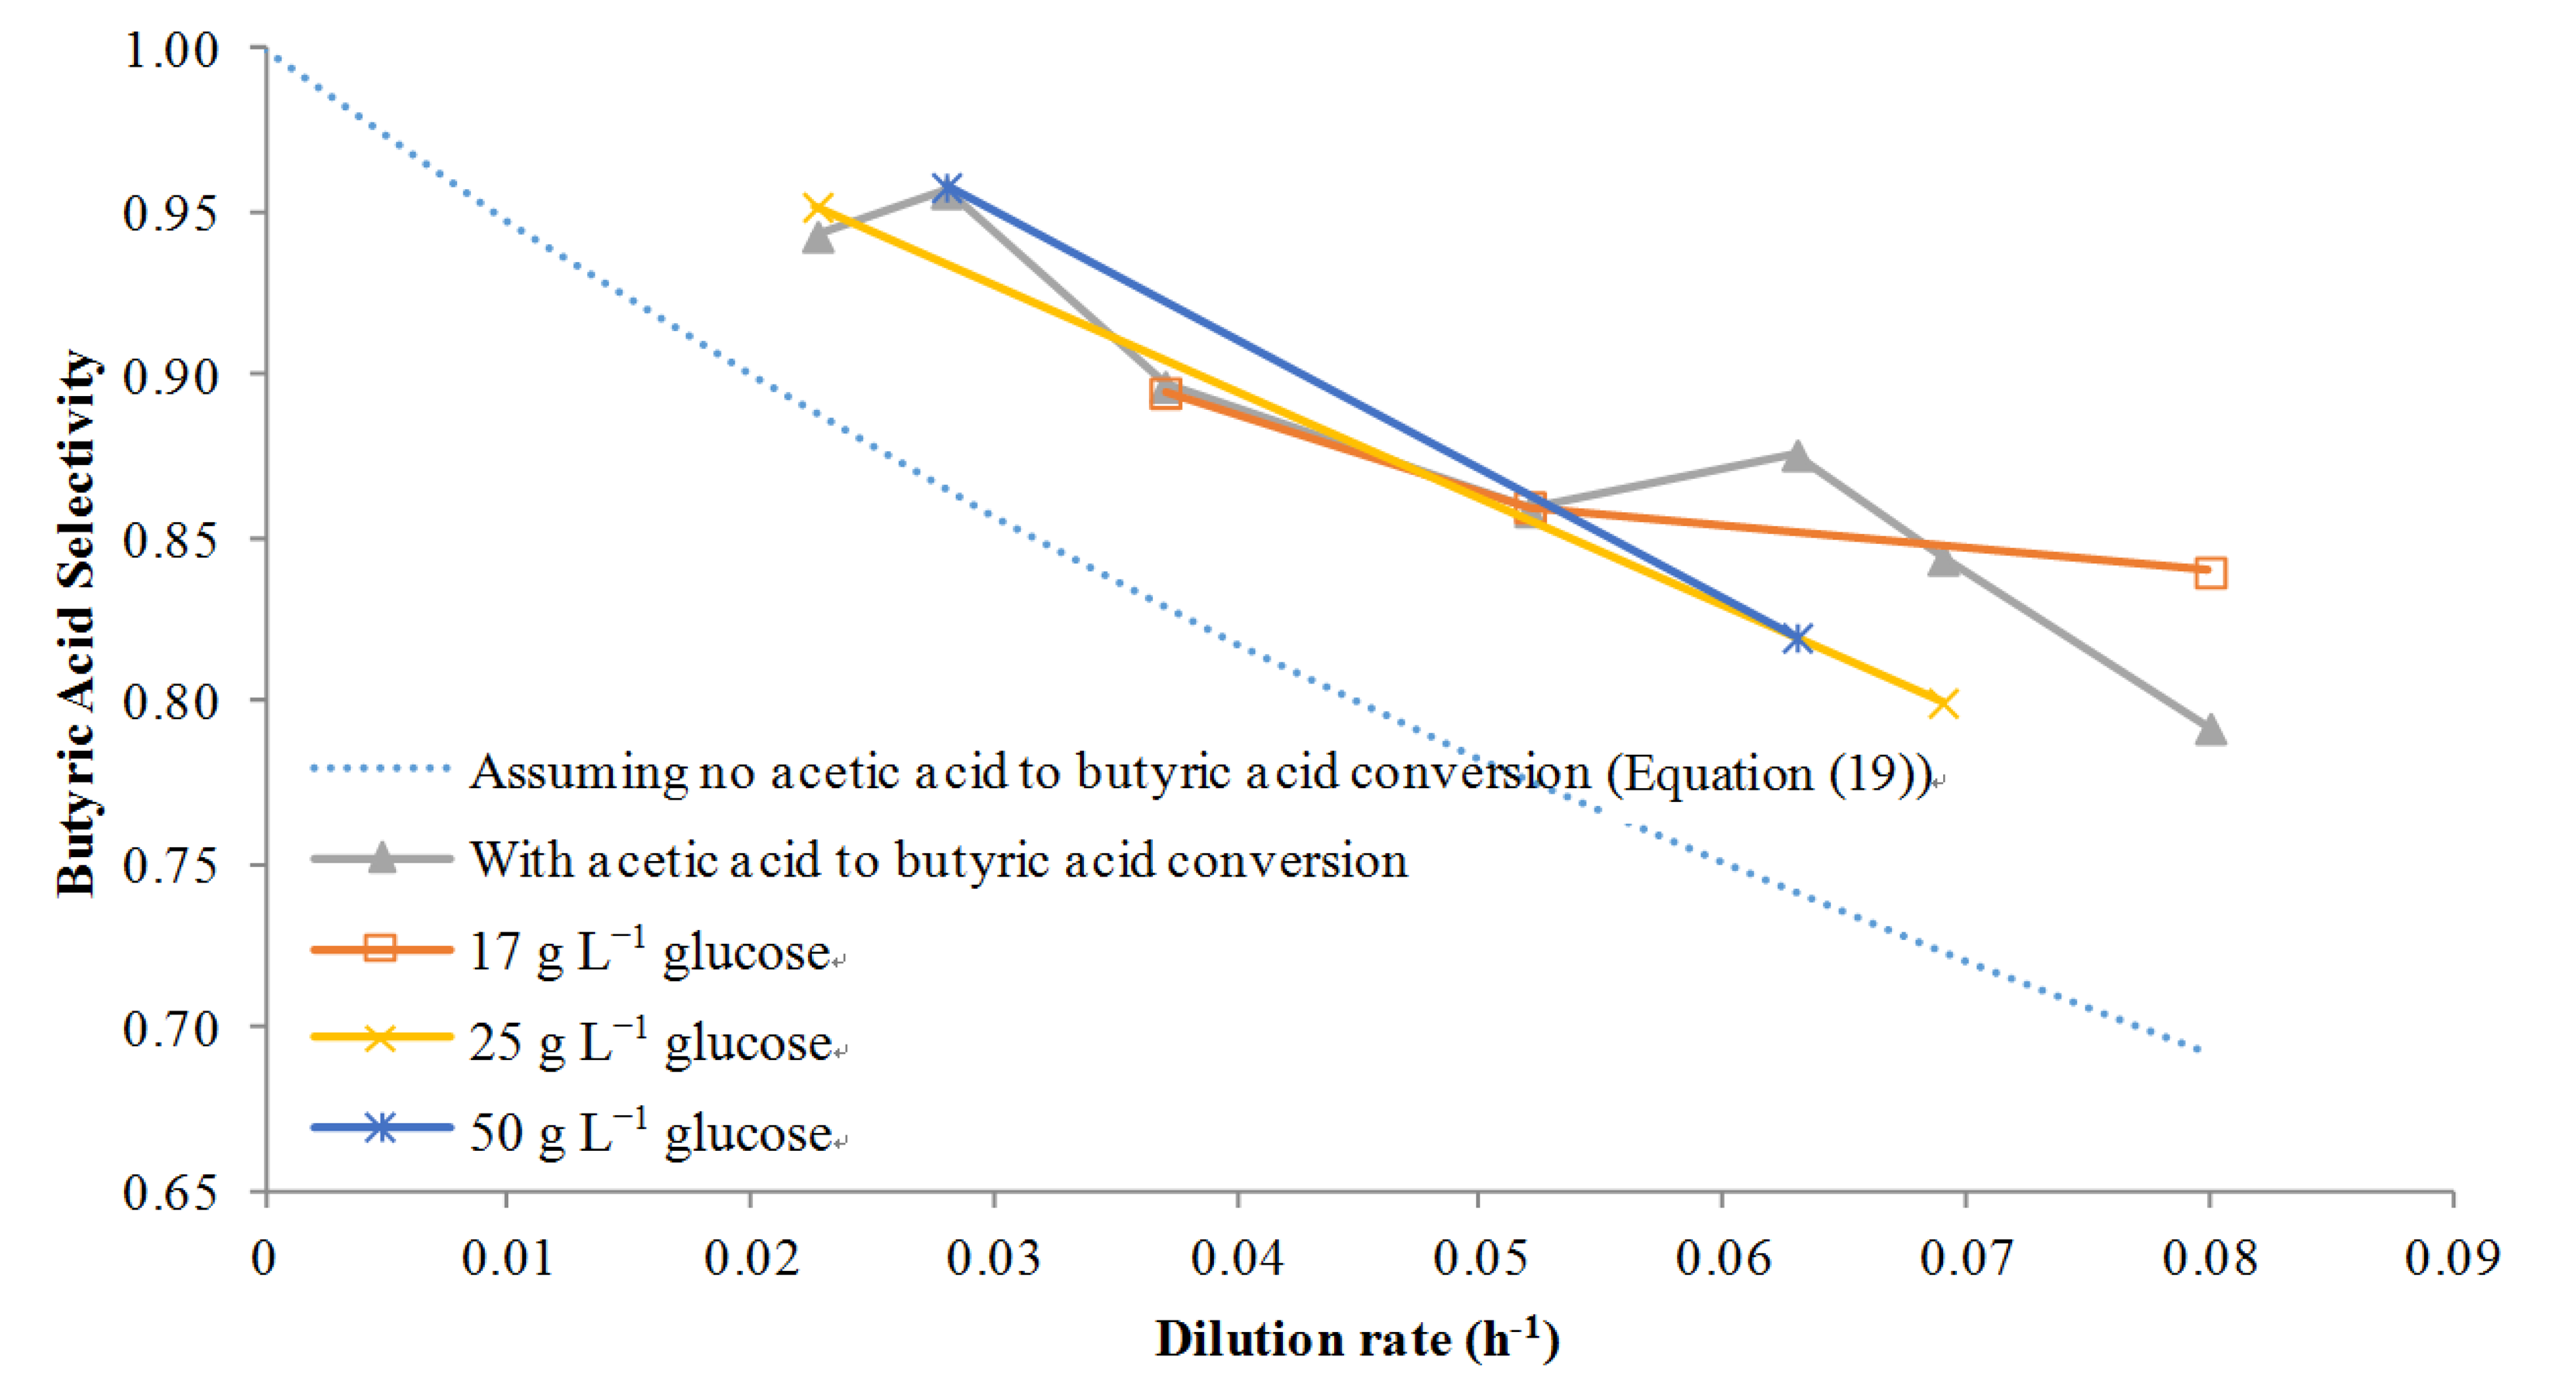
However, if acetic acid was metabolized to butyric acid then Equations (14), (16)–(18) were solved simultaneously using Matlab and the selectivity was calculated on a point by point basis where the term βa is concentration dependent with a big effect occurring at high concentrations. The results of using this model with several dilution rates at several different glucose concentrations are given in Figure 5. First, if no acetic to butyric acid conversion was assumed, the model clearly under-predicts the selectivity: butyric acid selectivity was predicted to be about 0.90 at a low dilution rate of 0.02 h−1, for example, while the actual values at various concentrations of glucose are closer to 0.95. However, using the adjusted model it was found that the selectivity prediction was closer to the actual values at several different glucose feed concentrations. This provided proof that not only was acetic acid to butyric acid conversion taking place, but also that it was possible to model the conversion accurately with few data points. Although Michel-Savin et al. [11] showed conversion of acetic acid to butyric acid, this phenomenon had not been accurately modeled until this work.
2.6. Predicting Optimum Operating Conditions
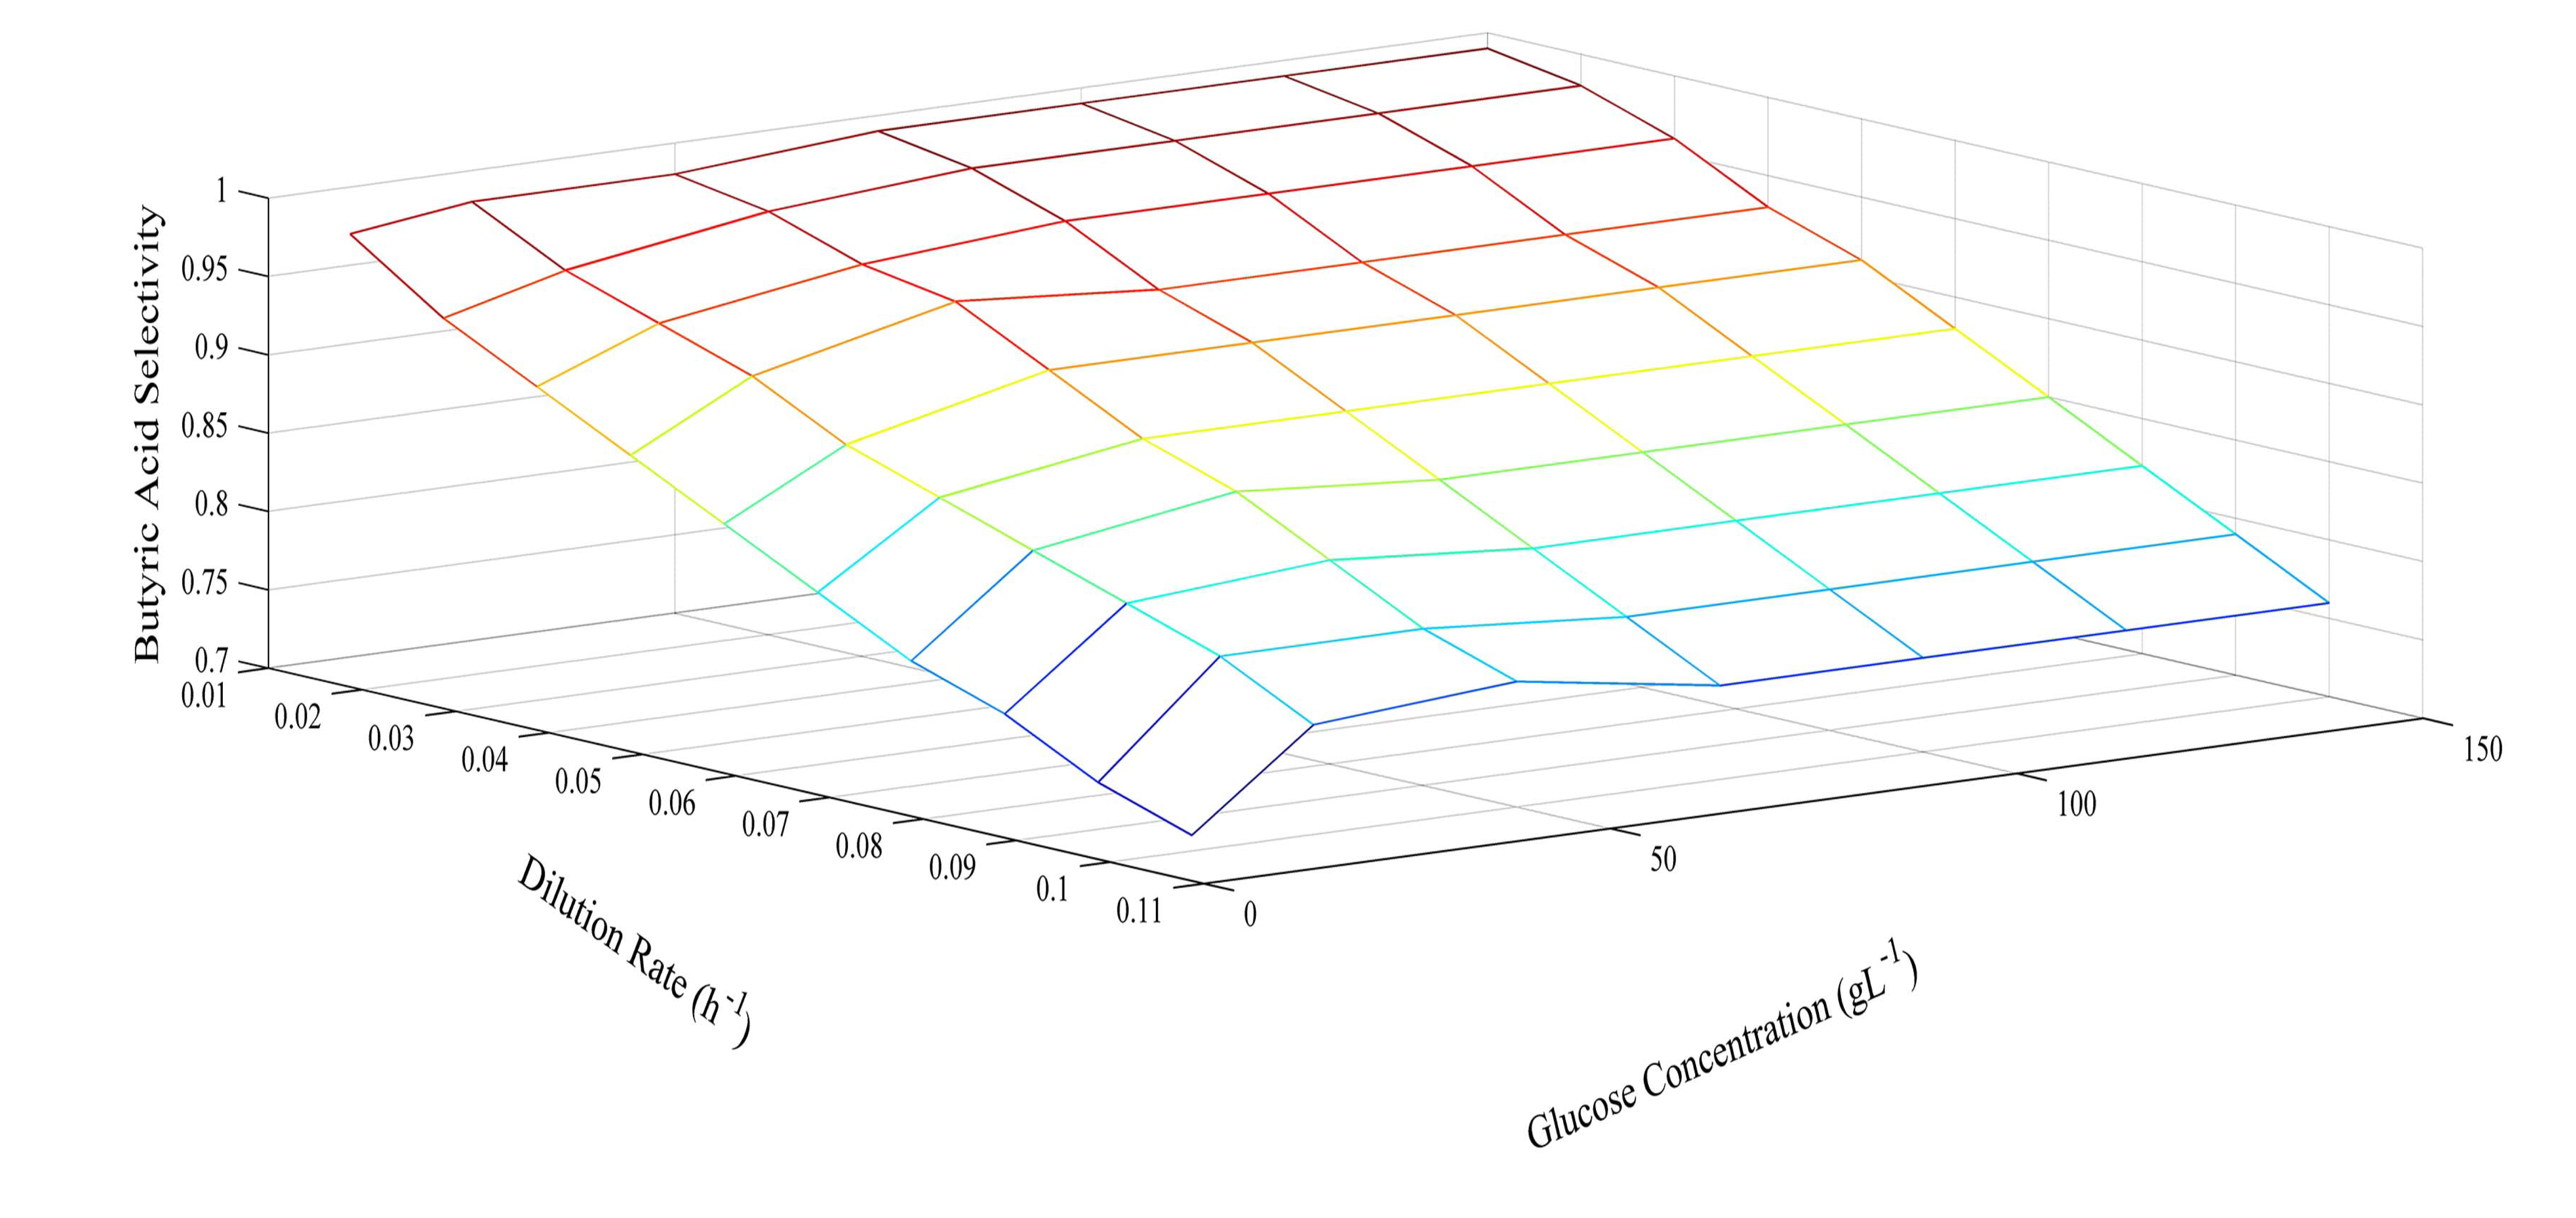
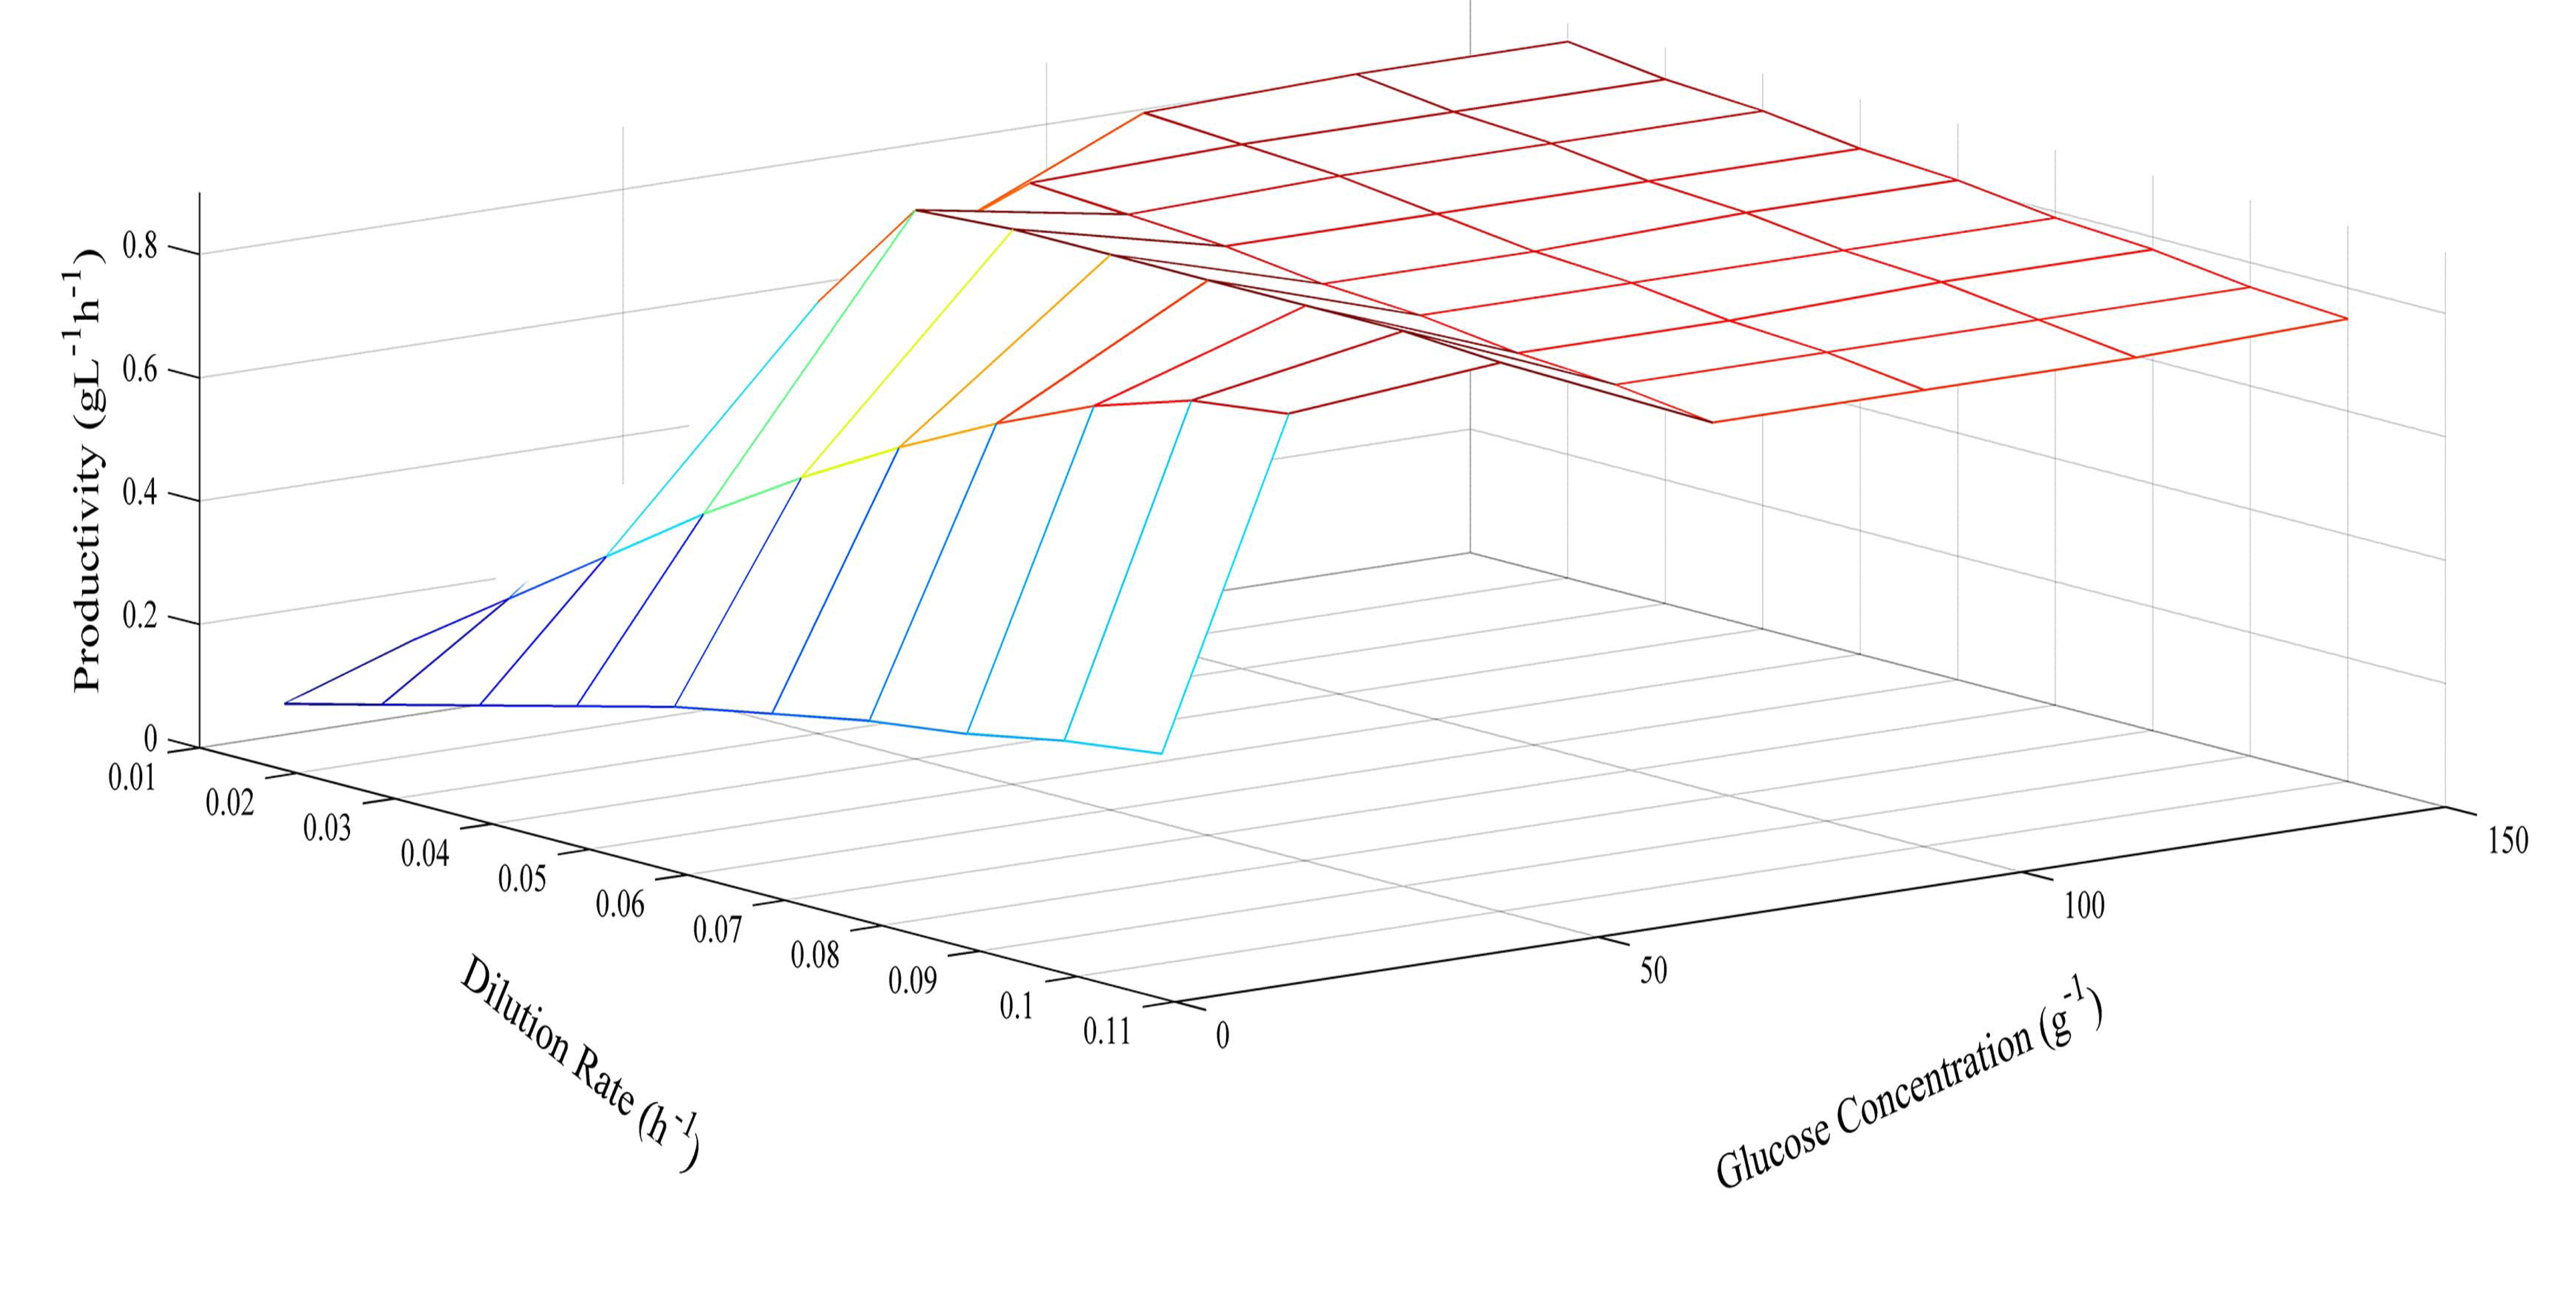
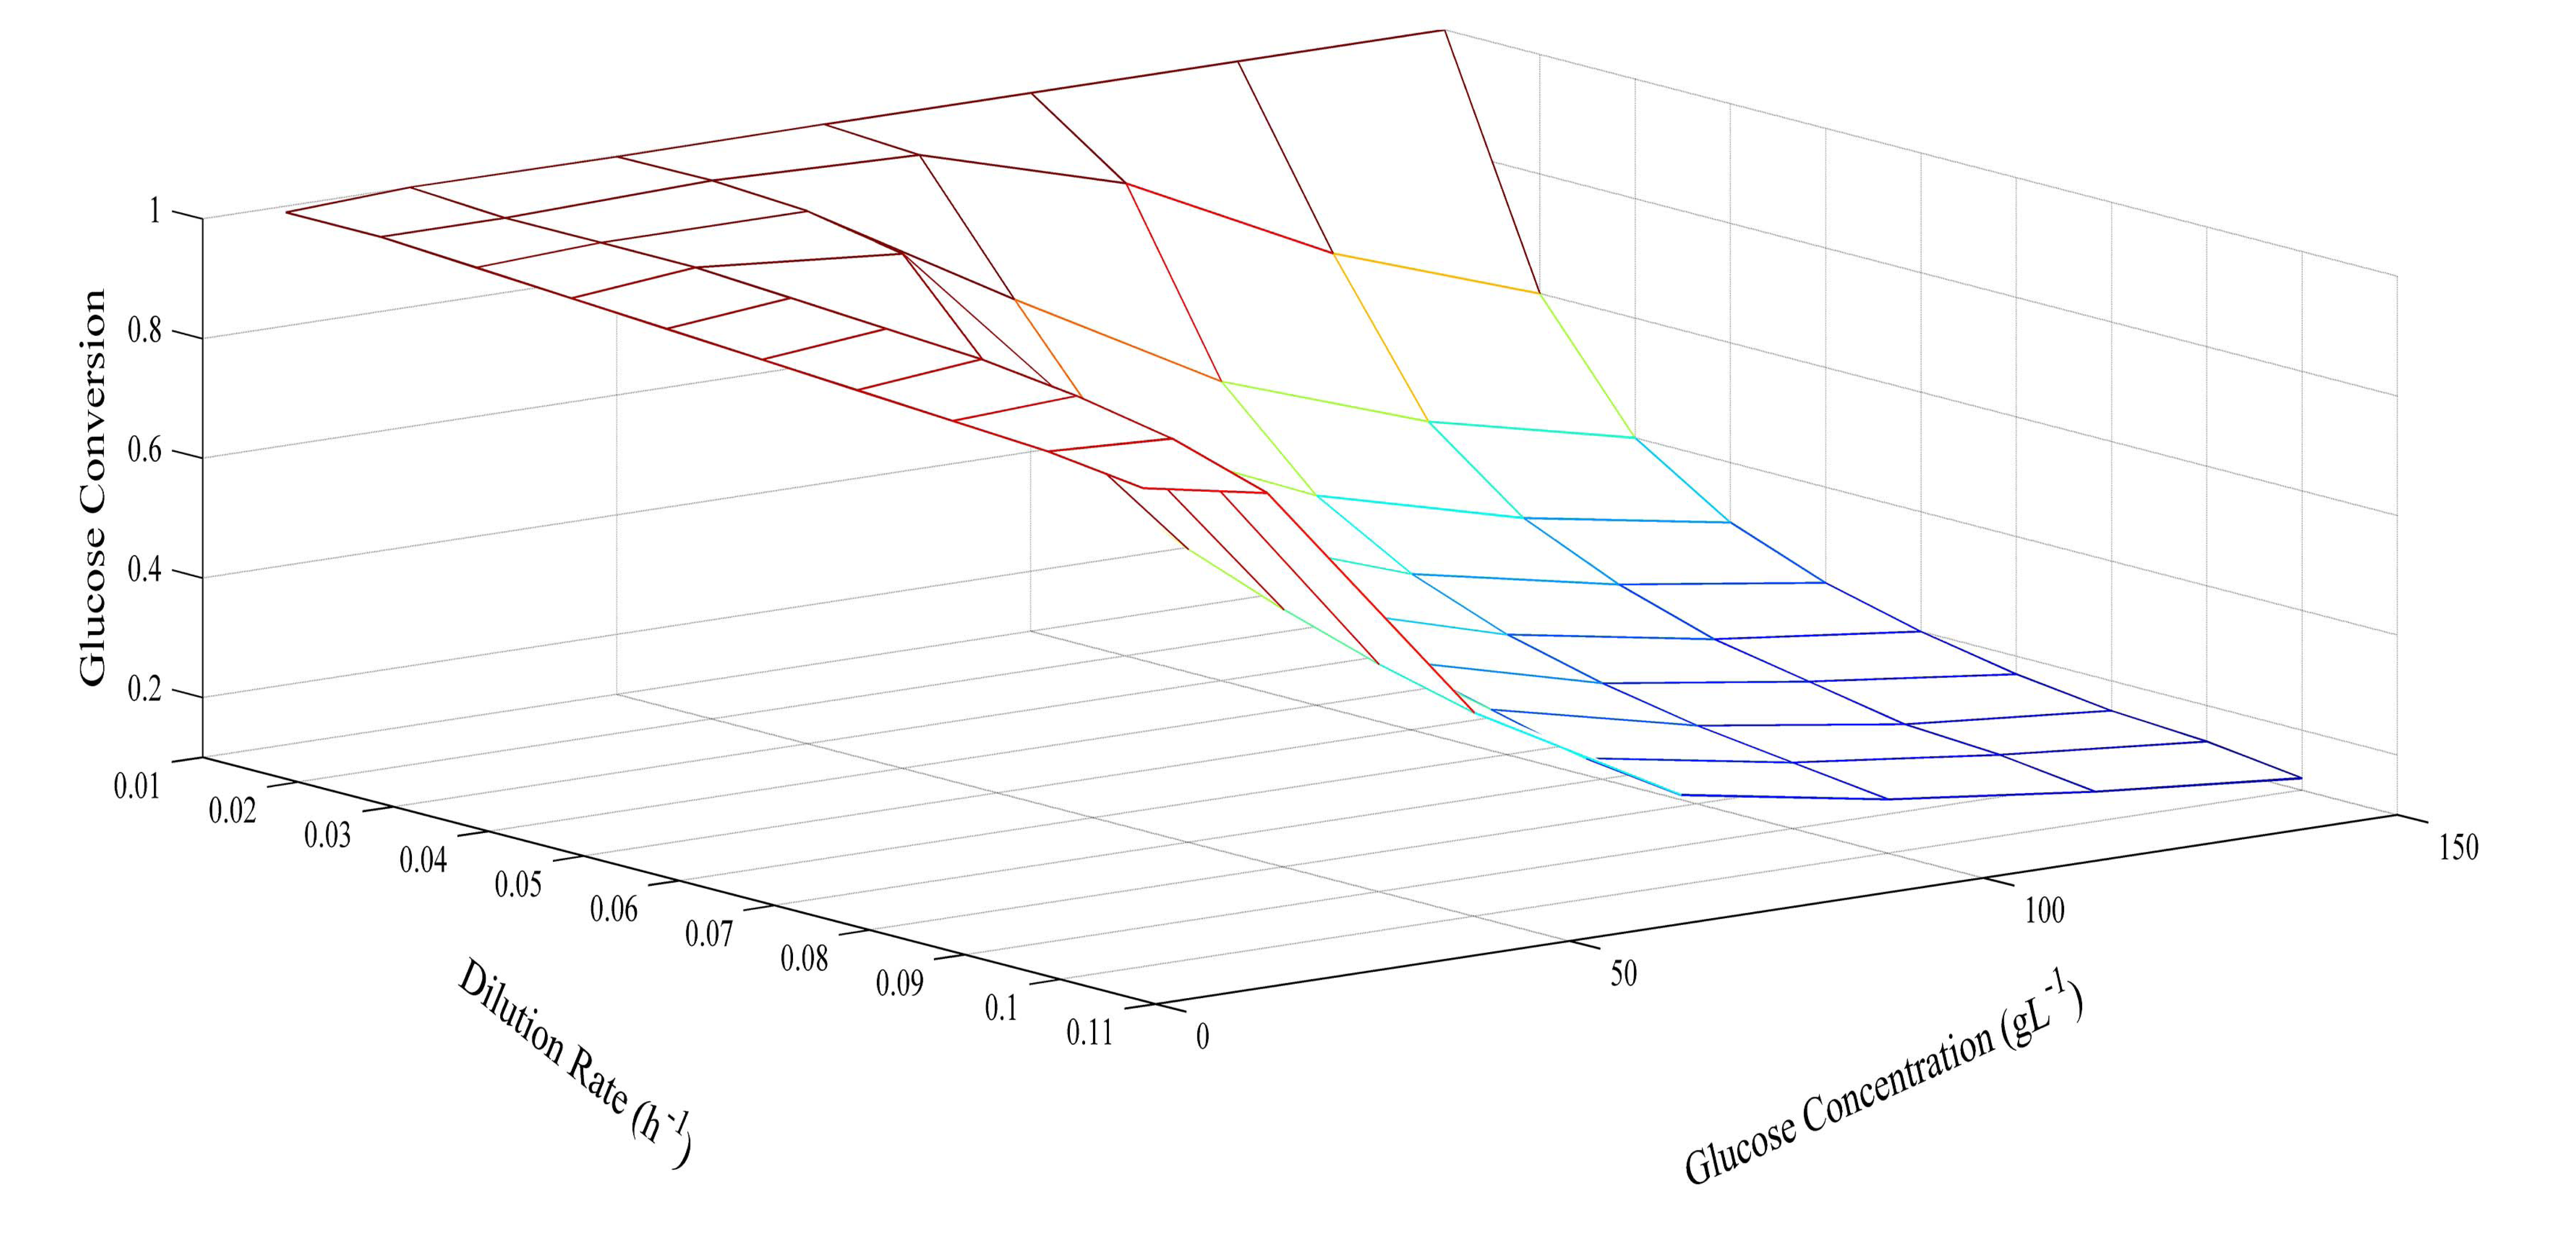
Since the model was proven at several different glucose concentrations, it was then used to predict optimum conditions for glucose concentration and dilution rate. The prediction of butyric acid selectivity, productivity, and glucose conversion are given in Figures 6, 7 and 8, respectively. With all glucose concentrations, it was predicted that butyric acid selectivity was maximized at low dilution rates. This was because butyric acid was produced when cell growth rates were low. The best conditions to achieve these maxima are either a fed batch fermentation system, when cell density can remain high when feed conditions are low, or in a high cell recycle environment in a continuous system with cell recycling. To maximize productivity, glucose concentration must be kept high (>75 g L−1) at all cell growth rates. However, a look at overall glucose conversion shows the opposite effect; that is, that glucose conversion is higher when glucose concentration is low. This opposite effect shows that with this fermentation, one always fights the battle of high selectivity and high conversion in optimizing these conditions. Thus, as has been proposed earlier, cell recycling [17] and product separation [18] can make it possible to get high selectivities, conversions, and productivities. These levels are >95% selectivity is certain cases.
3. Experimental Section
3.1. Materials and Methods
3.1.1. Cultures and Medium
Stock culture of C. tyrobutyricum (ATCC 25755) was kept in bottles under anaerobic conditions at 4 °C. For the pre-culture, 10 mL stock cultures were used to inoculate 100 mL of PYG (Peptone, Yeast extract, Glucose) medium in an incubator at 37 °C for about 48 h. The medium used in the fermentation contained 5 g yeast extract, 1.5 g KH2PO4, 0.6 g MgSO4·7H2O, 30 mg FeSO4·7H2O, 3 g (NH4)2SO4 and varying glucose concentrations per liter of deionized water (all from Aldrich-Sigma, St. Louis, MO, USA). The medium was autoclaved at 121 °C for 30 min before use.
3.1.2. Fermentation Modes
Batch and continuous fermentations were carried out in a 1 L stirred tank reactor (Applikon, Schiedem, The Netherlands). A schematic of the entire system is given and described in a previous paper [17]. The fermentation was controlled at a temperature of 37 °C and a pH of 6.2. The stirring rate was controlled at 200 rpm. The batch fermentation started with 700 mL of medium inoculated with 100 mL of pre-culture. Nitrogen was sparged into the culture at a flowrate of 20 mL min−1 to keep the fermenter anaerobic. Batch fermentations were continued by removing the fermentation broth and feeding new media with varying glucose concentrations. Fermentation was switched from batch to continuous mode by starting the feed pump and withdrawing culture. For continuous fermentation, the flowrate of the feed medium was controlled by a Masterflex peristaltic pump (Cole-Parmer, Vernon Hills, IL, USA). A reaction volume of 700 mL was maintained by a liquid level control, which was part of the fermentation system. Two 4 L bottles were used as the feed bottles, with all medium and connecting tubing sterilized in an autoclave for 30 min at 121 °C.
To investigate cell mass inhibition, a Koch Membrane ultrafiltration membrane cartridge (Wilmington, MA, USA) was used for cell recycle. This cartridge was made of polysulfone, under the brand of Romicon, with a 100,000 molecular weight cut-off (MWCO). The membrane cleaning and replacement procedure was described in a previous paper [17]. The permeate flowrate was controlled by a Masterflex peristaltic pump.
3.1.3. Analysis
High-performance liquid chromatography (HPLC) was used to analyze all the fermentation compounds, including glucose, acetic acid and butyric acid. The HPLC system consisted of a Waters Corporation 717 autosample injector, a Waters Corporation 1525 binary HPLC pump, an IC-PakTM ion-exclude column and a Waters Corporation 2414 refractive index detector (Milford, MA, USA). The solvent was 0.0005 mol L−1 sulfuric acid in water at a flowrate of 1.0 mL min−1 as described [29]. Cell concentration was measured by optical density at 600 nm with a DU 800 spectrophotometer (Beckman Coulter Inc., Brea, CA, USA). The dry cell mass was measured by employing an MB45 moisture analyzer (Ohaus, Parsippany, NJ, USA) at a temperature of 150 °C for 25 min. Before measuring the dry cell mass, the sample was centrifuged and rinsed with deionized water so that the sample was devoid of medium and products.
3.1.4. Kinetic Parameter Estimation
Matlab was used in the evaluation of kinetic parameters to solve the modeling equations. Kinetic parameter estimation utilized the curve fit toolbox to fit the batch fermentation results. This was done by solving Equations (14)–(18) simultaneously. A fourth-order Runge-Kutta solver was used to solve the coupled differential equations.
4. Conclusions
The developed model for continuous fermentation with C. tyrobutyricum accurately predicted fermentation kinetics, which includes cell growth, product formation, and substrate consumption. This model provides a specific understanding of the various factors that influence butyrate selectivity, productivity, and glucose conversion rate for the continuous fermentation with C. tyrobutyricum. The model also provides an understanding of the rate of conversion of acetate to butyrate, and how it influences butyrate selectivity. This model would be a useful tool to design a continuous fermentation process to produce butyrate at optimized conditions. Future work on this model should include adjustments for the effects of the separation technique used. The maximum selectivity of this organism, as shown in Table 1, is 97.3%.
Acknowledgments
The authors would like to thank the Ralph E. Martin Department of Chemical Engineering, the Mack Blackwell Rural Transportation Center, and the Walton Foundation for financial support of this project.
Conflicts of Interest
The authors declare no conflict of interest.
References
- Zigová, J.; Sturdik, E.; Vandak, D.; Schlosser, S. Butyric acid production by clostridium butyricum with integrated extraction and pertraction. Process Biochem. 1999, 34, 835–843. [Google Scholar]
- Vandak, D.; Zigová, J.; Sturdik, E.; Schlosser, S. Evaluation of solvent and pH for extractive fermentation of butyric acid. Process Biochem. 1997, 32, 245–251. [Google Scholar]
- Zhu, Y.; Yang, S.T. Adaptation of Clostridium tyrobutyricum for enhanced tolerance to butyric acid in a fibrous-bed bioreactor. Biotechnol. Prog. 2003, 19, 365–372. [Google Scholar]
- Ramey, D.E.; Yang, S.T. Production of Butyric Acid and Butanol from Biomass; Final Report to the US Department of Energy; Washington DC, USA, 2004. [Google Scholar]
- Playne, M.J. Propionic and Butyric Acids. In Comprehensive Biotechnology: The Principles, Applications and Regulations of Biotechnology in Industry, Agriculture and Medicine; Moo-Young, M., Bull, A.T., Dalton, H., Cooney, C. L., Humphrey, A. E., Blanch, H. W., Drew, S., Wang, D. I.C., Robinson, C. W., Howell, J. A., Eds.; Pergamon Press: Oxford, England, UK, 1985; pp. 731–759. [Google Scholar]
- Alam, S.; Stevens, D.; Bajpai, R. Production of butyric acid by batch fermentation of cheese whey with Clostridium beijerinckii. J. Ind. Microbiol. Biotechnol. 1988, 2, 359–364. [Google Scholar]
- Crabbendam, P.M.; Neijssel, O.M.; Tempest, D.W. Metabolic and energetic aspects of the growth of Clostridium butyricum on glucose in chemostat culture. Arch. Microbiol. 1985, 142, 375–382. [Google Scholar]
- Papoutsakis, E.T. Equations and calculations for fermentations of butyric acid bacteria. Biotechnol. Bioeng. 1984, 26, 174–187. [Google Scholar]
- Heyndrickx, M.; de Vos, P.; de Ley, J. Fermentation of D-xylose by Clostridium butyricum LMG 1213t1 in chemostats. Enzyme Microb. Technol. 1991, 13, 893–897. [Google Scholar]
- Michel-Savin, D.; Marchal, R.; Vandecasteele, J.P. Butyrate production in continuous culture of Clostridium tyrobutyricum: Effect of end-product inhibition. Appl. Microbiol. Biotechnol. 1990, 33, 127–131. [Google Scholar]
- Michel-Savin, D.; Marchal, R.; Vandecasteele, J.P. Butyric fermentation: Metabolic behaviour and production performance of Clostridium tyrobutyricum in a continuous culture with cell recycle. Appl. Microbiol. Biotechnol. 1990, 34, 172–177. [Google Scholar]
- Michel-Savin, D.; Marchal, R.; Vandecasteele, J.P. Control of the selectivity of butyric acid production and improvement of fermentation performance with Clostridium tyrobutyricum. Appl. Microbiol. Biotechnol. 1990, 32, 387–392. [Google Scholar]
- Van Andel, J.G.; Zoutberg, G.R.; Crabbendam, P.M.; Breure, A.M. Glucose fermentation by Clostridium butyricum grown under a self generated gas atmosphere in chemostat culture. Appl. Microbiol. Biotechnol. 1985, 23, 21–26. [Google Scholar]
- Zigová, J.; Šturdik, E. Advances in biotechnological production of butyric acid. J. Ind. Microbiol. Biotechnol. 2000, 24, 153–160. [Google Scholar]
- Wu, Z.; Yang, S.T. Extractive fermentation for butyric acid production from glucose by Clostridium tyrobutyricum. Biotechnol. Bioeng. 2003, 82, 93–102. [Google Scholar]
- Fayolle, F.; Marchal, R.; Ballerini, D. Effect of controlled substrate feeding on butyric acid production by Clostridium tyrobutyricum. J. Ind. Microbiol. Biotechnol. 1990, 6, 179–183. [Google Scholar]
- Du, J.; McGraw, A.; Lorenz, N.; Beitle, R.R.; Clausen, E.C.; Hestekin, J. Continuous fermentation of Clostridium tyrobutyricum with partial cell recycle as a long-term strategy for butyric acid production. Energies 2012, 5, 2835–2848. [Google Scholar]
- Du, J.; Lorenz, N.; Beitle, R.R.; Hestekin, J.A. Application of wafer-enhanced electrodeionization in a continuous fermentation process to produce butryic acid with Clostridium tyrobutricum. Sep. Sci. Technol. 2012, 47, 43–51. [Google Scholar]
- Zhu, Y.; Wu, Z.; Yang, S.T. Effect of pH on metabolic pathway shift in fermentation of xylose by Clostridium tyrobutyricum. J. Biotechnol 2004, 110, 143–147. [Google Scholar]
- Liu, X.; Zhu, Y.; Yang, S.T. Butyric acid and hydrogen production by Clostridium tyrobutyricum ATCC 25755 and mutants. Enzyme Microb. Technol 2006, 38, 521–528. [Google Scholar]
- Shuler, M.L.; Kargi, F. Bioprocess Engineering; Prentice Hall: Upper Saddle River, NJ, USA, 2002. [Google Scholar]
- Luedeking, R.; Piret, E.L. A kinetic study of the lactic acid fermentation batch process at controlled pH. J. Biochem. Microbiol. Technol. Eng. 1959, 1, 393–412. [Google Scholar]
- Luedeking, R.; Piret, E.L. Transient and steady states in continuous fermentation: Theory and experiment. J. Biochem. Microbiol. Technol. Eng. 1959, 1, 431–459. [Google Scholar]
- Monod, J. The growth of bacterial cultures. Ann. Rev. Microbiol. 1949, 3, 371–394. [Google Scholar]
- Bovee, J.P.; Strehaiano, P.; Goma, G.; Sevely, Y. Alcoholic fermentation: Modeling based on sole substrate and product measurement. Biotechnol. Bioeng. 1984, 26, 328–334. [Google Scholar]
- Lee, J.M.; Pollard, J.F.; Coulman, G.A. Ethanol fermentation with cell recycling: Computer simulation. Biotechnol. Bioeng. 1983, 25, 497–511. [Google Scholar]
- Richard, A.; Margaritis, A. Empirical modeling of batch fermentation kinetics for poly (glutamic acid) production and other microbial biopolymers. Biotechnol. Bioeng. 2004, 87, 501–515. [Google Scholar]
- Yamané, T.; Shiotani, T. Interrelationship among specific rates of cell growth, substrate consumption, and metabolite formation in some simple microbial reactions producing primary metabolites. Biotechnol. Bioeng. 1981, 23, 1373–1387. [Google Scholar]
- Young, J.; Lee, P.J.; di Gioia, A.D. Fast HPLC Analysis for Fermentation Ethanol Process. Available online http://www.waters.com/waters/library.htm?cid=511436&lid=1512671 (accessed on 13 January 2014).


| Feed Conc. (g L−1) | Dilution Rate (h−1) | Glucose (g L−1) | Selectivity | Butyric Acid Yield | Cell Mass (g L−1) | Glucose Conversion |
|---|---|---|---|---|---|---|
| 17.0 | 0.037 | 0.040 | 0.895 | 0.436 | 4.50 | 0.998 |
| 17.0 | 0.052 | 0.040 | 0.860 | 0.416 | 4.60 | 0.998 |
| 17.0 | 0.080 | 0.030 | 0.840 | 0.407 | 4.80 | 0.998 |
| 17.0 | 0.140 | Washout | ||||
| 25.0 | 0.023 | 0.030 | 0.952 | 0.420 | 4.80 | 0.998 |
| 25.0 | 0.069 | 2.00 | 0.800 | 0.350 | 4.80 | 0.92 |
| 25.0 | 0.107 | Washout | ||||
| 50.0 | 0.028 | 19.2 | 0.958 | 0.393 | 4.70 | 0.616 |
| 50.0 | 0.063 | 16.8 | 0.820 | 0.297 | 4.90 | 0.664 |
| 50.0 | 0.120 | Washout | ||||
| 17.0 | 0.078 | 0.040 | 0.973 | 0.460 | 5.10 | 0.998 |
© 2014 by the authors; licensee MDPI, Basel, Switzerland. This article is an open access article distributed under the terms and conditions of the Creative Commons Attribution license ( http://creativecommons.org/licenses/by/3.0/).
Share and Cite
Du, J.; McGraw, A.; Hestekin, J.A. Modeling of Clostridium tyrobutyricum for Butyric Acid Selectivity in Continuous Fermentation. Energies 2014, 7, 2421-2435. https://doi.org/10.3390/en7042421
Du J, McGraw A, Hestekin JA. Modeling of Clostridium tyrobutyricum for Butyric Acid Selectivity in Continuous Fermentation. Energies. 2014; 7(4):2421-2435. https://doi.org/10.3390/en7042421
Chicago/Turabian StyleDu, Jianjun, Amy McGraw, and Jamie A. Hestekin. 2014. "Modeling of Clostridium tyrobutyricum for Butyric Acid Selectivity in Continuous Fermentation" Energies 7, no. 4: 2421-2435. https://doi.org/10.3390/en7042421