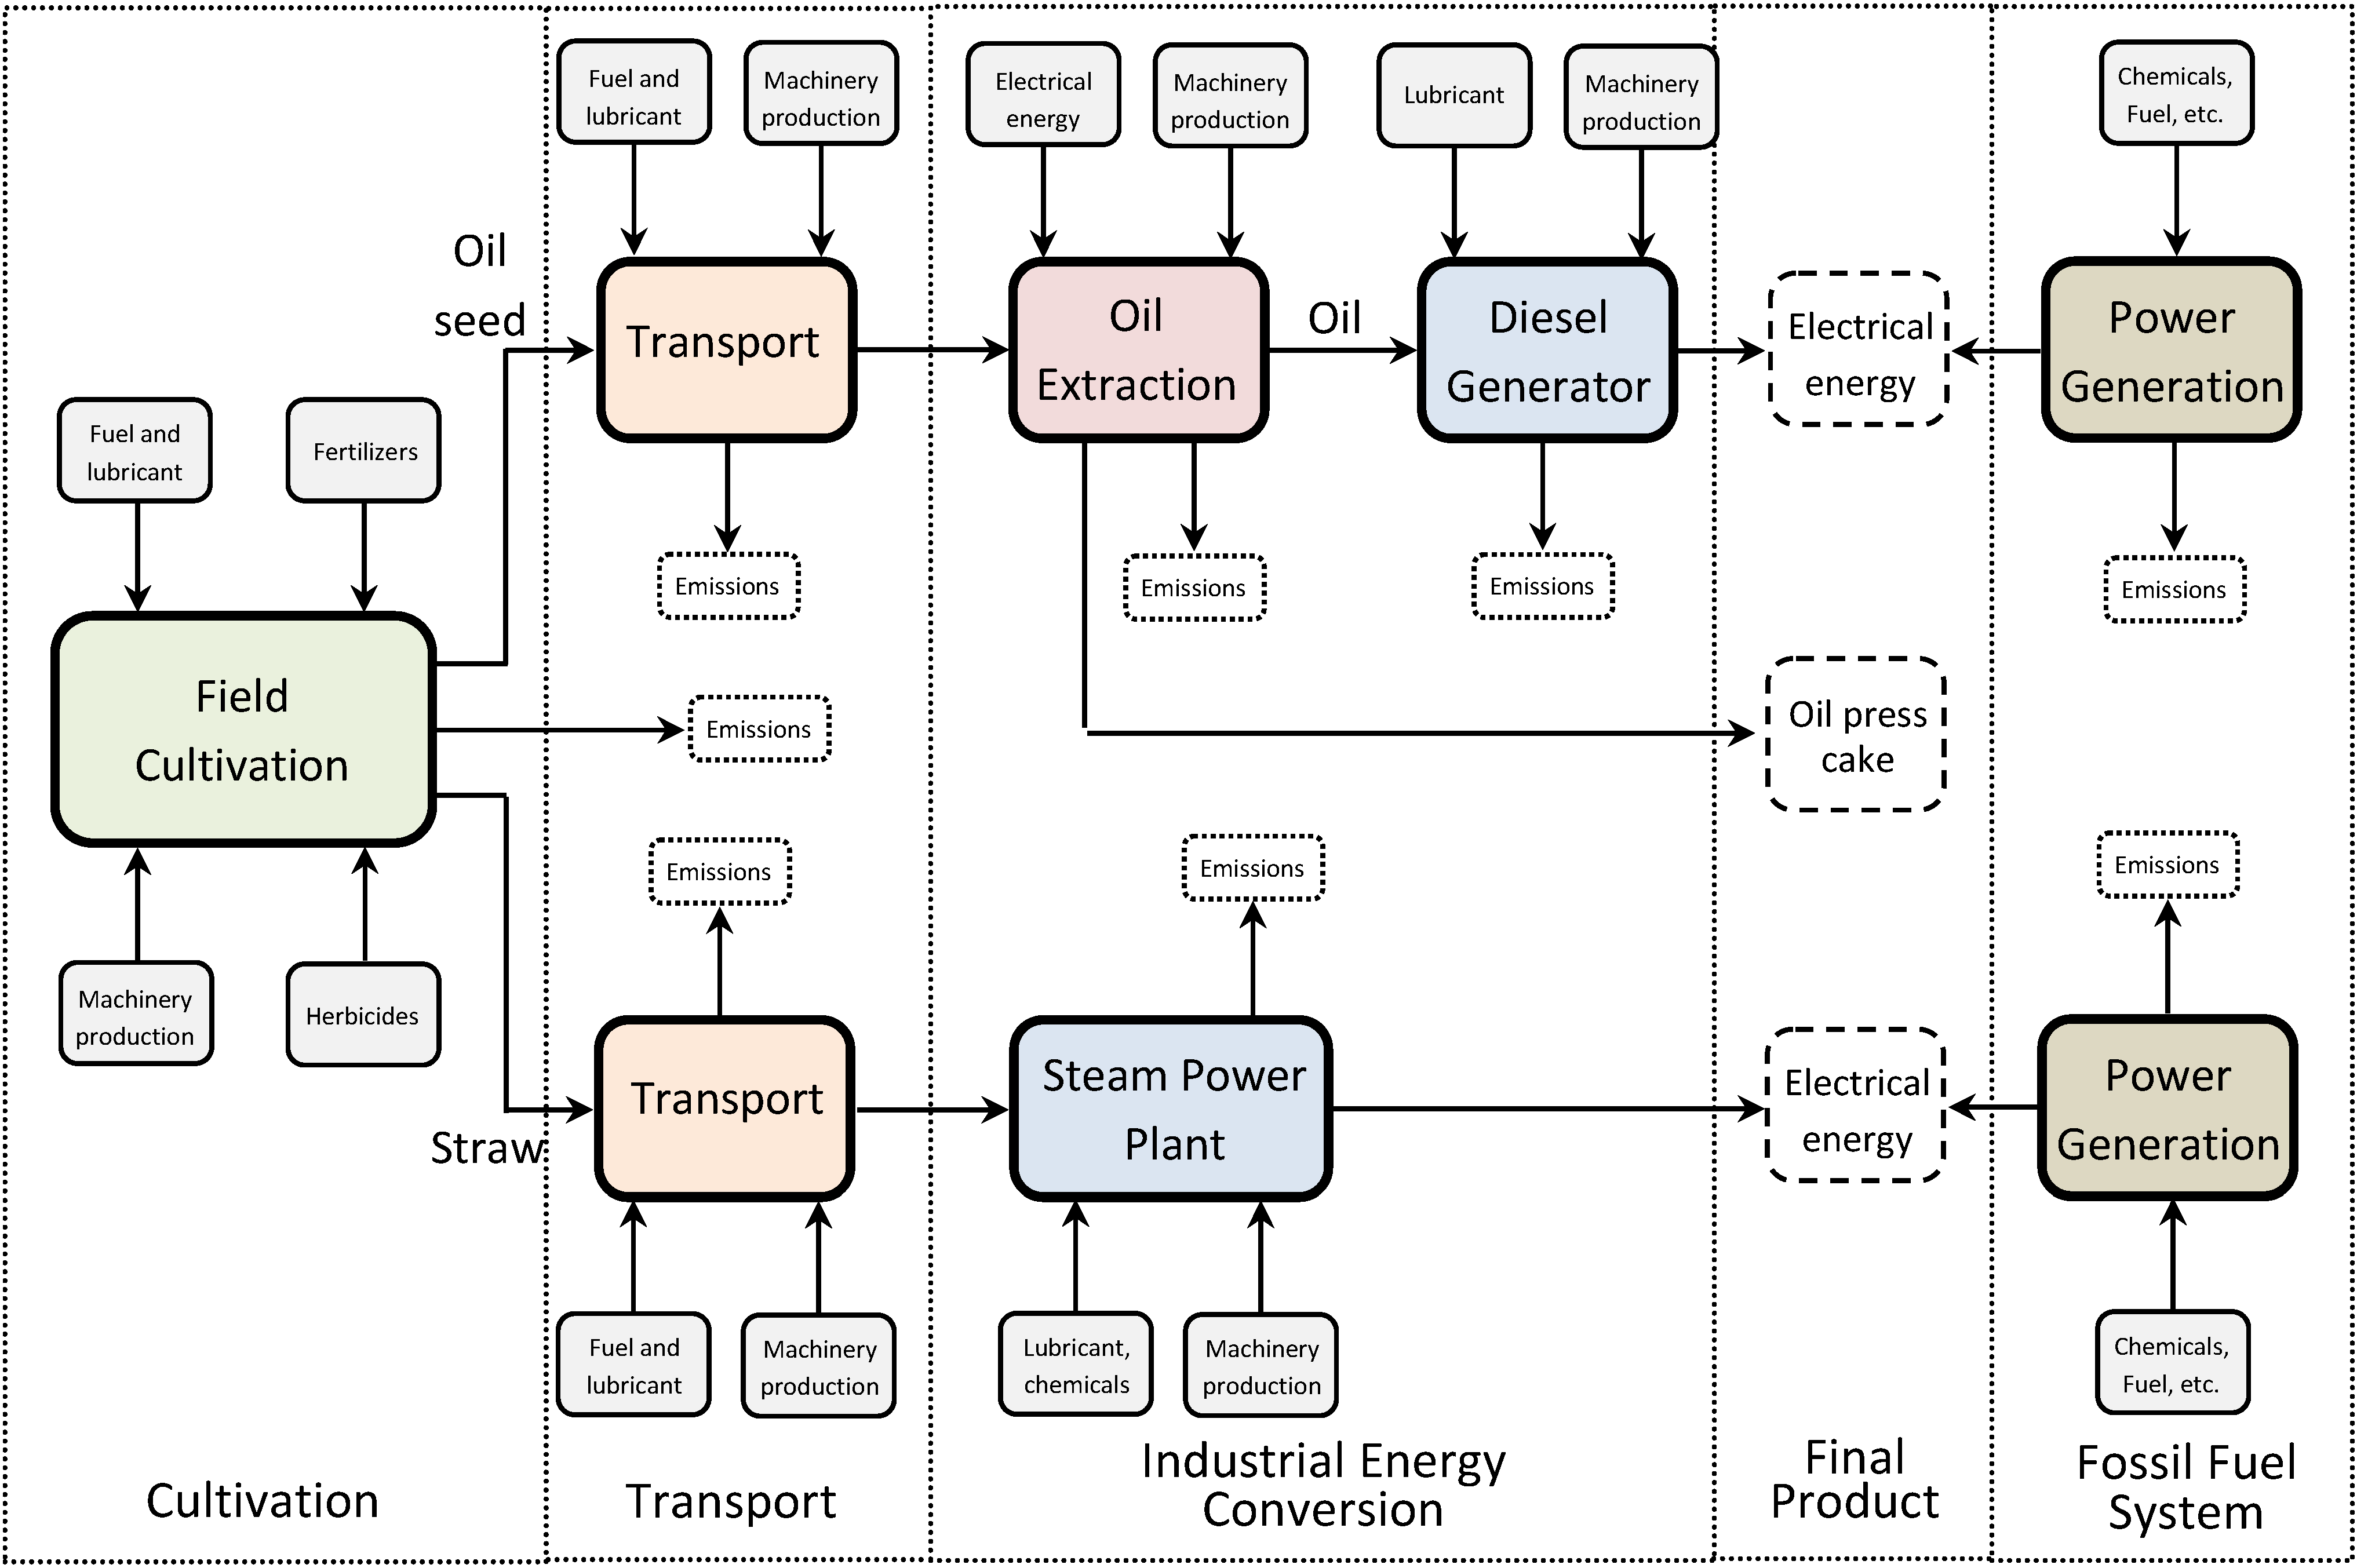
The main results of the LCA study of the three oleaginous bioenergy chains are presented and discussed with reference to the main unit processes.
4.1. Oleaginous Crop Cultivation
Table 4 gives the results of the LCA study for the cultivation phase of the three oleaginous crops, with reference to 1 ha of cultivated land. In
Table 4, the LCA impact (fuel, lubricating and machinery construction) of ploughing, harrowing and rolling operations was grouped into the tillage operation. Other than LCA impact due to fuel, lubricant and machinery construction, the sowing, fertilization and weeding control operations also include those related to seed, fertilizers and herbicides, respectively.
As shown in
Table 4, the LCA impact of the cultivation phase is very similar for the three oleaginous crops because the field operations are almost the same for all three. Moreover, the LCA impact of the cultivation phase is mainly affected by fertilization and in particular by fertilizer production. Oilseed rape and Ethiopian mustard fertilization accounts for around 53%–54% of CED, 75%–76% of GWP and around 89% of AP. This large impact of fertilization on oilseed rape and Ethiopian mustard cultivation is similar to other studies [
23,
51]. For cardoon, fertilization accounts for about 66% (CED), 83% (GWP) and 93% (AP), respectively.
Table 4.
Main LCA results for the cultivation phase (for 1 ha of cultivated land).
Table 4.
Main LCA results for the cultivation phase (for 1 ha of cultivated land).
| Cumulative Energy Demand (MJ·ha−1) |
| Bioenergy chains | Tillage | Sowing | Fertilization | Weeding | Harvesting | Total |
| Oilseed rape | 3,717.2 | 1,005.8 | 9,347.3 | 396.2 | 2,799.4 | 17,266.0 |
| Ethiopian mustard | 3,717.2 | 1,083.8 | 10,010.1 | 396.2 | 3,629.6 | 18,837.9 |
| Cardoon | 744.5 | 316.3 | 11,372.1 | 189.9 | 4,702.7 | 17,325.6 |
| Global Warming Potential 100y (kg CO2eq·ha−1) |
| Bioenergy chains | Tillage | Sowing | Fertilization | Weeding | Harvesting | Total |
| Oilseed rape | 238.8 | 57.9 | 1508.7 | 22.4 | 163.8 | 1,991.6 |
| Ethiopian mustard | 238.8 | 61.4 | 1626.3 | 22.4 | 214.0 | 2,162.9 |
| Cardoon | 47.8 | 17.2 | 1725.7 | 9.9 | 289.0 | 2,089.7 |
| Acidification Potential (kg SO2eq·ha−1) |
| Bioenergy chains | Tillage | Sowing | Fertilization | Weeding | Harvesting | Total |
| Oilseed rape | 1.54 | 0.45 | 26.77 | 0.34 | 1.01 | 30.12 |
| Ethiopian mustard | 1.54 | 0.49 | 29.63 | 0.34 | 1.34 | 33.34 |
| Cardoon | 0.31 | 0.15 | 35.34 | 0.08 | 1.98 | 37.85 |
However, as previously mentioned, the three oleaginous crops compared here show different seed yield and straw production. Although an overall range of 80–250 g·m
−2 potential of seed yield is reported for cardoon [
64], the average grain yield of 0.75 t·ha
−1 and 10 t·ha
−1 for straw considered in this paper is in accordance with the recent findings of [
65]. In fact, those authors reported a mean seed yield of 603 kg·ha
−1 in a large scale cultivation (77 ha) of the cardoon in southern Portugal and confirmed that this species is suitable for biomass production in Mediterranean regions. Average grain yields of 1.8 t·ha
−1 and 1.9 t·ha
−1 were considered in for oilseed rape and Ethiopian mustard, respectively, although both species show a high seed yield variability within years and among cultivation sites [
20]. CED values in MJ·ha
−1 for Ethiopian mustard and oilseed rape were relatively low due to the low fertilization ratios applied on the basis of the expected yields. Similar CED values were reported for the latter crop in Romania, where its seed yields were about twice than in Sardinia [
66].
As stated before, the LCA results of
Table 4 refer to a case study where the vegetable oil was used in a diesel generator while the cultivation residues were collected and used in a steam power plant. Therefore, for the oleaginous bioenergy crops studied here, all the aboveground biomass (seeds and straw) was used for energy production. For this reason,
Table 5 summarizes the results of the LCA study of the cultivation phase and the LCA impact indicators are reported with reference to 1 ha of cultivated land, 1 t of seeds and 1 GJ of collected biomass energy (seeds and straw). The energy content of oleaginous seeds and residual straw was evaluated here on the basis of their LHV. In particular, the LHV of seeds and straw was assumed to be 25.0 and 15.0 MJ·kg
−1 respectively, for oilseed rape and Ethiopian mustard [
58] and 22.5 and 13.0 MJ·kg
−1 for cardoon [
67].
Table 5.
LCA impact for the cultivation phase with reference to 1 ha of cultivated land, 1 t of seeds and 1 GJ of collected biomass energy (seeds and straw).
Table 5.
LCA impact for the cultivation phase with reference to 1 ha of cultivated land, 1 t of seeds and 1 GJ of collected biomass energy (seeds and straw).
| Cultivation Phases | Oilseed rape | Ethiopian mustard | Cardoon |
|---|
| Seed production (t·ha−1) | 1.80 | 1.90 | 0.75 |
| Straw production (t·ha−1) | 6.15 | 8.10 | 10.00 |
| Seed energy (GJ·ha−1) | 45.00 | 47.50 | 16.88 |
| Straw energy (GJ·ha−1) | 92.25 | 121.50 | 130.00 |
| LCA Impacts | Oilseed rape | Ethiopian mustard | Cardoon |
| CED | MJ·ha−1 | 17,266.0 | 18,836.8 | 17,325.6 |
| MJ·tSEED−1 | 9,592.2 | 9,914.1 | 23,100.8 |
| MJ·GJPROD−1 | 125.80 | 111.46 | 117.96 |
| GWP-100y | kg·CO2·ha−1 | 1,991.6 | 2,162.9 | 2,089.7 |
| kg·CO2·tSEED−1 | 1,106.4 | 1,138.3 | 2,786.2 |
| kg·CO2·GJPROD−1 | 14.51 | 12.80 | 14.23 |
| AP | kg·SO2·ha−1 | 30.1 | 33.3 | 37.9 |
| kg·SO2·tSEED−1 | 16.7 | 17.5 | 50.5 |
| kg·SO2·GJPROD−1 | 0.22 | 0.20 | 0.26 |
If the LCA impact indicators are calculated with reference to the mass of oilseed,
Table 5 demonstrates that cardoon gives the worst environmental performance owing to its low seed yield. In particular, the corresponding CED, GWP and AP impact indicators for cardoon are 2.3–3 times those for oilseed rape and Ethiopian mustard. However, as shown in
Table 5, the energy content of the residual straw is very high for all three oleaginous crops and in particular for cardoon. Therefore,
Table 5 shows that if the LCA impact indicators refer to the overall energy content of the collected biomass, the LCA impact of the cultivation phase for the three oleaginous crops shows smaller differences (by about 12%–13% for CED and GWP and by about 30% for AP). Overall, the cultivation phase of Ethiopian mustard produces the lowest LCA impact. These results highlight that cardoon cannot be considered an actual oleaginous crop but its seed production is only a secondary product compared to its potential biomass production. In addition, the exploitation of straw plays such an important role in determining the oilseed chain that it makes Ethiopian mustard more effective. The latter is a relatively “new” oilseed crop and has the lowest LCA impact owing to its higher production in straw. In this case, indeed, the oilseed rape, which is the most widespread crop among the three considered and the most promising species for oilseed production thanks to breeding activities in recent decades, is the most efficient (in terms of CED) crop for oilseed production but its lower biomass production compared to Ethiopian mustard penalizes its performance in terms of CED and GWP with respect to the energy content of the collected products.
4.4. PVO Diesel Generator
As mentioned, in this study the vegetable oil was directly used in a medium-speed diesel engine for power generation with a net conversion efficiency of 44% (that is, a specific fuel consumption of about 0.218 kg·kWh
−1). As shown in
Table 8, on the basis of the PVO yield, the electricity production is about 2812 kWh·ha
−1 for the oilseeds’ rape chain, 2794 kWh·ha
−1 for Ethiopian mustard and 827 kWh·ha
−1 for cardoon. As mentioned, the boundaries of the system were extended because the latter energy production replaces an equal amount of electrical energy produced by the Italian power generation mix and therefore avoids the corresponding environmental impact and fossil fuel energy consumption (hereinafter called avoided impact). The overall LCA impact of the power generation process from PVO for the three oleaginous crops is summarized in
Table 8. Specific fuel consumption and environmental emission factors of the diesel engine (
Table 3) are the same for the three vegetable oils and therefore the LCA impact is the same for the three oleaginous crops. However, because of the different oil production, the direct and avoided LCA impact indicators are reported with reference to 1 ha of cultivated land. As reported in
Table 8, the direct CED of power generation by PVO is about 8% of the CED required by the Italian power generation mix; GWP is about 9% and AP about 20%.
Table 8.
Energy and environmental impact for the diesel generator with reference to 1 ha of cultivated land.
Table 8.
Energy and environmental impact for the diesel generator with reference to 1 ha of cultivated land.
| Energy Production | Oilseed rape | Ethiopian mustard | Cardoon |
|---|
| Vegetable oil (kg·ha−1) | 612 | 608 | 180 |
| Electrical energy (kWh·ha−1) | 2,812.48 | 2,794.10 | 827.20 |
| LCA Impacts | Oilseed rape | Ethiopian mustard | Cardoon |
| CED (MJ·ha−1) | Direct | 2,150.35 | 2,136.30 | 632.46 |
| Avoided | −26,765.30 | −26,590.39 | −7,872.15 |
| GWP (kg CO2·ha−1) | Direct | 163.48 | 162.41 | 48.08 |
| Avoided | −1,778.55 | −1,766.93 | −523.10 |
| AP (kg SO2·ha−1) | Direct | 1.70 | 1.69 | 0.50 |
| Avoided | −8.33 | −8.28 | −2.45 |
4.5. Steam Power Plant
The straw is used for power generation in a small size (10–15 MW) steam power plant with an electrical efficiency of 25% (that is, a specific fuel consumption of about 1.11 kg·kWh
−1 for the cardoon straw and about 0.96 kg·kWh
−1 for oilseed rape and Ethiopian mustard straw). In
Table 9, the direct and avoided LCA impact indicators of the steam power plant are calculated with reference to 1 ha of cultivated land.
Table 9 also reports the avoided environmental impact related to the electricity produced from straw. On the basis of the assumptions of this study, electrical energy production from cultivation residues varies from 6406 kWh·ha
−1 (oilseed rape) to 9028 kWh·ha
−1 (cardoon) and substitutes an equal amount of electrical energy produced by the Italian power generation mix. For all three oleaginous crops, the CED of power generation by residual straw is about 9%–10% with respect to power generation by using the Italian power generation mix, while GWP is about 11%–12%. However,
Table 9 also shows that the acidification potential related to straw combustion is almost twice that of Italian power generation mix owing to its higher SO
X and NO
X emissions.
Table 9.
Energy and environmental impact for the steam power plant with reference to 1 ha of cultivated land.
Table 9.
Energy and environmental impact for the steam power plant with reference to 1 ha of cultivated land.
| Energy Production | Oilseed rape | Ethiopian mustard | Cardoon |
|---|
| Straw (kg·ha−1) | 6,150 | 8,100 | 10,000 |
| Electrical energy (kWh·ha−1) | 6,406.25 | 8,437.50 | 9,027.78 |
| LCA Impacts | Oilseed rape | Ethiopian mustard | Cardoon |
| CED (MJ·ha−1) | Direct | 5,683.75 | 7,485.92 | 9,140.72 |
| Avoided | −60,965.85 | −80,296.48 | −85,913.95 |
| GWP (kg CO2·ha−1) | Direct | 425.81 | 560.82 | 685.40 |
| Avoided | −4,051.18 | −5,335.70 | −5,708.98 |
| AP (kg SO2·ha−1) | Direct | 34.95 | 46.03 | 56.80 |
| Avoided | −18.97 | −24.99 | −26.74 |
4.6. Comparison of the Three Bioenergy Systems
Table 10 summarizes the direct LCA impact of the entire bioenergy chains, as well as the avoided impact with the substitution of power generation when compared to the Italian power mix.
As shown in
Table 10, the cultivation phase greatly affects the performance of the bioenergy chains. In particular, the cumulative energy demand of the cultivation phase is about 49% for the oilseed rape, 45% for Ethiopian mustard and 38% for cardoon. Power generation with the diesel engine and the steam power plant accounts for about 43% (oilseed rape), 46.5% (Ethiopian mustard) and 52.5% (cardoon) of CED. The transportation phase of straw accounts for about 5.5%–8.8% of the overall CED, while only marginal amounts of primary energy are required by the oil extraction process and the seed transportation phase. Similarly, the cultivation phase contributes greatly to the GWP (by about 50%–60%) of the overall bioenergy chain, while straw combustion in the steam power plant is the main factor responsible (by about 66%–72%) for the acidification potential.
As demonstrated in
Table 10, power generation from vegetable oil and cultivation residue allows avoiding a noteworthy amount of primary energy (88–107 GJ·ha
−1), greenhouse (5830–7100 kg·CO
2·ha
−1) and acid gas emissions (27–33 kg·SO
2·ha
−1). The use of residual straw for power generation contributes greatly to the avoided environmental impact of the three bioenergy chains (about 70% of the overall energy saving for oilseed rape, 75% for Ethiopian mustard and about 92% for cardoon, for example). However, the agronomic sustainability of power generation from residual straw should be studied in depth because crop residue removal may reduce nutrient pools and alter soil chemical properties [
51]. Obviously, the actual energy and environmental saving of the bioenergy chain can be calculated by subtracting the direct impact from the avoided one. Overall, the oleaginous bioenergy chains allow a saving of about 70–86 GJ·ha
−1 (that is about 79%–80% with respect to conventional power generation) and a reduction of the GWP impact by about 71%–73% (about 4138 kg·CO
2eq·ha
−1 for oilseed rape, 5219 kg·CO
2eq·ha
−1 for Ethiopian mustard and 4545 kg·CO
2eq·ha
−1 for cardoon). However, for all three oleaginous crops, power generation from PVO and residual straw increases the acidification potential mainly due to the higher SO
X and NO
X emissions related to straw combustion. In particular, AP impact produced by the oilseed rape and Ethiopian mustard chains is about 1.9 times that produced by conventional power generation and about 2.7 times for the cardoon bioenergy chain.
Table 10.
LCA impact for the entire bioenergy chains with reference to 1 ha of cultivated land.
Table 10.
LCA impact for the entire bioenergy chains with reference to 1 ha of cultivated land.
| Phases | CED (MJ·ha−1) | GWP (kg CO2·ha−1) | AP (kg SO2·ha−1) |
|---|
| Oilseed rape | Ethiopian mustard | Cardoon | Oilseed rape | Ethiopian mustard | Cardoon | Oilseed rape | Ethiopian mustard | Cardoon |
|---|
| Cultivation | 8,943.8 | 9,324.2 | 7,068.8 | 1,031.6 | 1,070.6 | 852.6 | 15.60 | 16.51 | 20.59 |
| Seed transportation | 105.4 | 106.3 | 34.6 | 6.2 | 6.3 | 2.0 | 0.03 | 0.03 | 0.01 |
| Straw transportation | 1,004.5 | 1,323.1 | 1,633.4 | 59.7 | 78.6 | 97.0 | 0.33 | 0.43 | 0.53 |
| Oil extraction | 313.1 | 314.8 | 101.0 | 5.0 | 5.0 | 1.5 | 0.03 | 0.03 | 0.01 |
| Diesel generator | 2,150.4 | 2,136.3 | 632.5 | 163.5 | 162.4 | 48.1 | 1.70 | 1.69 | 0.50 |
| Steam power plant | 5,683.8 | 7,485.9 | 9,140.7 | 425.8 | 560.8 | 685.4 | 34.95 | 46.03 | 56.80 |
| LCA Impacts | Oilseed rape | Ethiopian mustard | Cardoon | Oilseed rape | Ethiopian mustard | Cardoon | Oilseed rape | Ethiopian mustard | Cardoon |
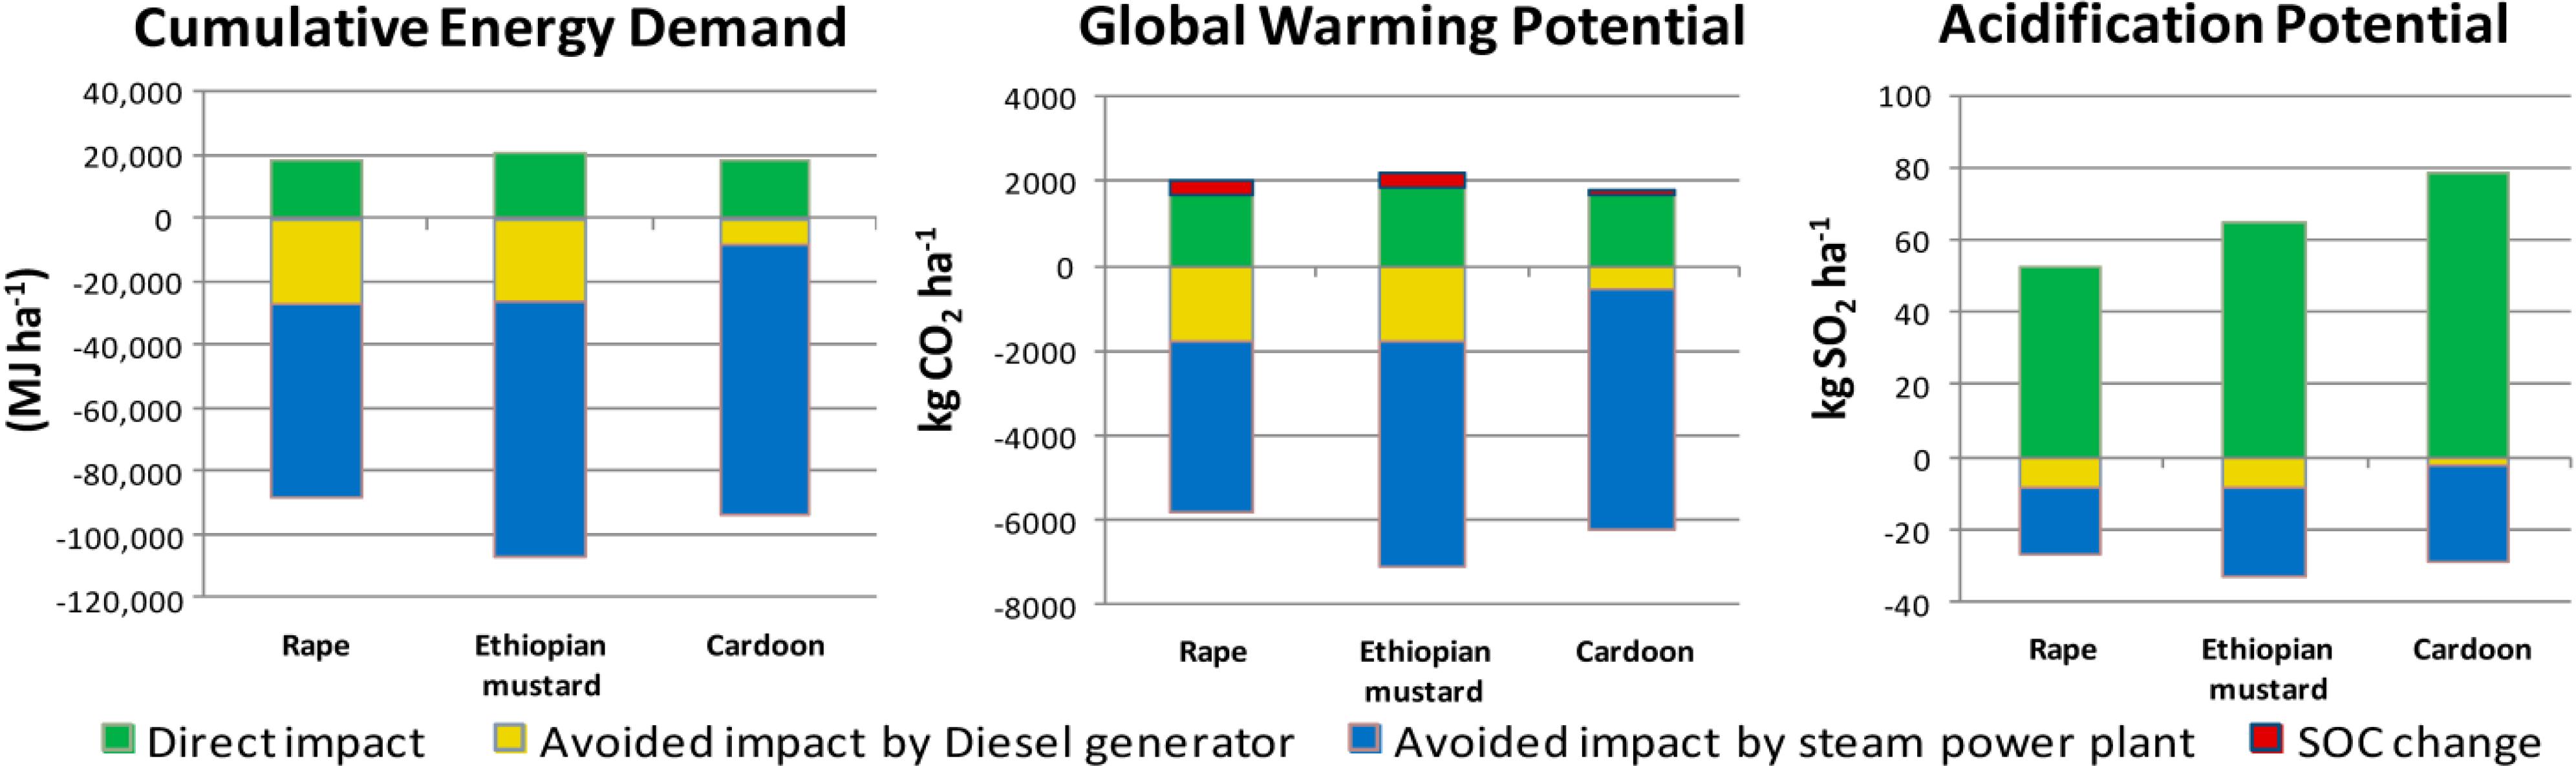
| Direct impact (a) | 18,201.0 | 20,690.6 | 18,611.0 | 1,691.9 | 1,883.7 | 1,686.7 | 52.64 | 64.71 | 78.44 |
| Avoided impact by Diesel generator | 26,765.3 | 26,590.4 | 7,872.1 | 1,778.6 | 1,766.9 | 523.1 | 8.33 | 8.28 | 2.45 |
| Avoided impact by steam power plant | 60,965.8 | 80,296.5 | 85,914.0 | 4,051.2 | 5,335.7 | 5,709.0 | 18.97 | 24.99 | 26.74 |
| Avoided impact (b) | 87,731.2 | 106,886.9 | 93,786.1 | 5,829.7 | 7,102.6 | 6,232.1 | 27.31 | 33.27 | 29.19 |
| Saved impact (b − a) | 69,530.2 | 86,196.2 | 75,175.1 | 4,137.9 | 5,218.9 | 4,545.4 | −25.33 | −31.45 | −49.25 |
As mentioned, GWP impact of bioenergy chains may be significantly affected by SOC variation caused by land use changes. As reported in
Section 3.5, the highest SOC changes obtained for annual crops (oilseed rape and Ethiopian mustard) showed a reduction of 20%–21% with respect to the baseline values, whereas SOC changes were about half (10%) for cardoon.
Although the lack of certain data related to soil carbon storage has been claimed [
32], the estimated SOC changes have confirmed previous results [
51], thus suggesting that oilseed rape has a higher detrimental impact because of the differences between initial and final SOC [
51]. This is in agreement with other researchers [
62,
69,
70,
71], who stated that annual cropping systems are the most damaging in terms of SOC contents and structure due to higher soil revolving, short permanence and litter removal. Consequently, impacts in terms of SOC in a bioenergy chain are slightly different depending on whether the chain is based on annual or perennial crops and the latter results in higher environmental benefits than the former [
32].
The values of carbon stock used in this work are considered for soil conditions after 20 years of continuous cultivation. As already stated by [
72], for oilseed rape and winter wheat in the UK, it should also be noted that from an agronomic point of view it is unlikely that oilseed rape, Ethiopian mustard or cardoon would be grown exclusively for so long a time. As the predicted SOC contents in oilseed rape, Ethiopian mustard and other extensive crops usually in rotation with them (e.g., durum wheat) are very close, we can consider the carbon stock of our arable land quite representative of a standard rotation for a Mediterranean area. On the other hand, the agronomically expected interruption of cardoon crops (after 5 years of cultivation) with other extensive annual crops (e.g., durum wheat) following in the rotation, could determine a partial and temporary increase in CO
2 emission due to SOC oxidation. Consequently, the actual GWP related to d-LUC of cardoon may be slightly larger than the value estimated for this bioenergy chain.
SOC reduction leads to CO
2 emissions during the first years of cultivation. In this study, CO
2 emissions from SOC are about 33.0 t CO
2·ha
−1 for oilseed rape, 35.2 t CO
2·ha
−1 for Ethiopian mustard and 12.5 t CO
2·ha
−1 for cardoon. According to [
73], the latter CO
2 emissions represent a “Biofuel Carbon Debt” that is repaid over time by the CO
2 savings of the bioenergy chain. Starting from the CO
2 savings in
Table 10, the carbon debt would take about 8 years to repay for oilseed rape, 6.7 years for Ethiopian mustard and less than 3 years for cardoon.
Table 11 summarizes the GWP impact of the three bioenergy chains by including the CO
2 emissions related to SOC changes and also considering the environmental impact due to d-LUC. For all three bioenergy chains, the SOC changes reduce the greenhouse gas emission saving in comparison to the data in
Table 10. The GWP impact due to SOC changes accounts for about 16% of the overall GWP impact for oilseed rape and Ethiopian mustard and only 7% for cardoon. Overall, the GWP saving of Ethiopian mustard is about 9% higher than that of cardoon and 22% higher than that of oilseed rape.
Finally,
Figure 3 summarizes the overall environmental impact of the three bioenergy chains compared here.
Table 11.
Overall GWP impact for the three bioenergy chains with reference to 1 ha of cultivated land.
Table 11.
Overall GWP impact for the three bioenergy chains with reference to 1 ha of cultivated land.
| GWP-100y (kg CO2·ha−1) | Bioenergy Chains |
|---|
| Oilseed rape | Ethiopian mustard | Cardoon |
|---|
| Direct impact (a) | 1692 | 1884 | 1687 |
| SOC change (b) | 330 | 352 | 125 |
| Overall impact (c = a + b) | 2022 | 2236 | 1811 |
| Avoided impact (d) | 5830 | 7103 | 6232 |
| Saved impact (d − c) | 3808 | 4867 | 4421 |
Figure 3.
Comparison of the environmental impact of the three bioenergy chains.
Figure 3.
Comparison of the environmental impact of the three bioenergy chains.


 ,
, 

