3.1. Proximate Chemical Composition of Yeast Extract and DSY
The compositions of yeast extract and DSY are shown in
Table 2. Total carbohydrate in DSY was about four fold that in yeast extract, while the protein content in the DSY was only 67% of that in yeast extract. Total fat and crude fiber contents in yeast extract were lower than those in DSY. The ash content in yeast extract was approximately two fold that in DSY. Mineral and trace elements required for yeast growth and/or ethanol production [
33] were also detected in yeast extract and DSY as shown in
Table 2.
The protein content of DSY in this study was about 8% higher than that (41.75%) reported by Suwanapong
et al. [
19] indicating that the composition of the company-supplied DSY varied slightly from lot to lot. According to the protein content of yeast extract and DSY and data from many literature reports [
5,
6,
13,
19,
25], the concentrations of yeast extract, DSY and glycine in the L
9 (3
4) orthogonal experiments for the ethanol fermentation were selected as previously mentioned.
3.2. The Orthogonal Experiment Results of Ethanol Fermentation
Batch ethanol fermentation of the experimental runs 1 to 9 (
Table 1) was carried out. The results of the fermentation of Run 1 (yeast extract, 1; DSY, 4 and glycine 1 g·L
−1) are shown in
Figure 1.
Table 2.
The compositions of yeast extract (Himedia, India) and DSY (Beerthip Brewery (1991) Co., Ltd., Thailand).
Table 2.
The compositions of yeast extract (Himedia, India) and DSY (Beerthip Brewery (1991) Co., Ltd., Thailand).
| Constituents | Yeast extract | DSY a |
|---|
| Total carbohydrate (%) | 8.98 | 35.88 |
| Protein (%) | 74.50 | 50.12 |
| Total fat (%) | 0.07 | 2.53 |
| Crude fiber (%) | ND b | 0.13 |
| Moisture (%) | 5.19 | 5.29 |
| Ash (%) | 11.26 | 6.18 |
| Mineral and trace elements |
| P (g kg−1) | 10.96 | 13.13 |
| K (g kg−1) | 60.67 | 18.28 |
| Na (g kg−1) | 8.20 | 3.40 |
| S (g kg−1) | 3.50 | 3.50 |
| Ca (g kg−1) | 0.25 | 1.58 |
| Mg (mg kg−1) | 247.00 | 4.17 |
| Fe (mg kg−1) | 59.39 | 65.11 |
| Mn (mg kg−1) | 1.35 | 2.02 |
| Cu (mg kg−1) | 1.47 | 3.58 |
| Zn (mg kg−1) | 68.26 | 48.90 |
| Ni (mg kg−1) | 0.52 | 0.54 |
| Mo (mg kg−1) | 0.06 | 4.78 |
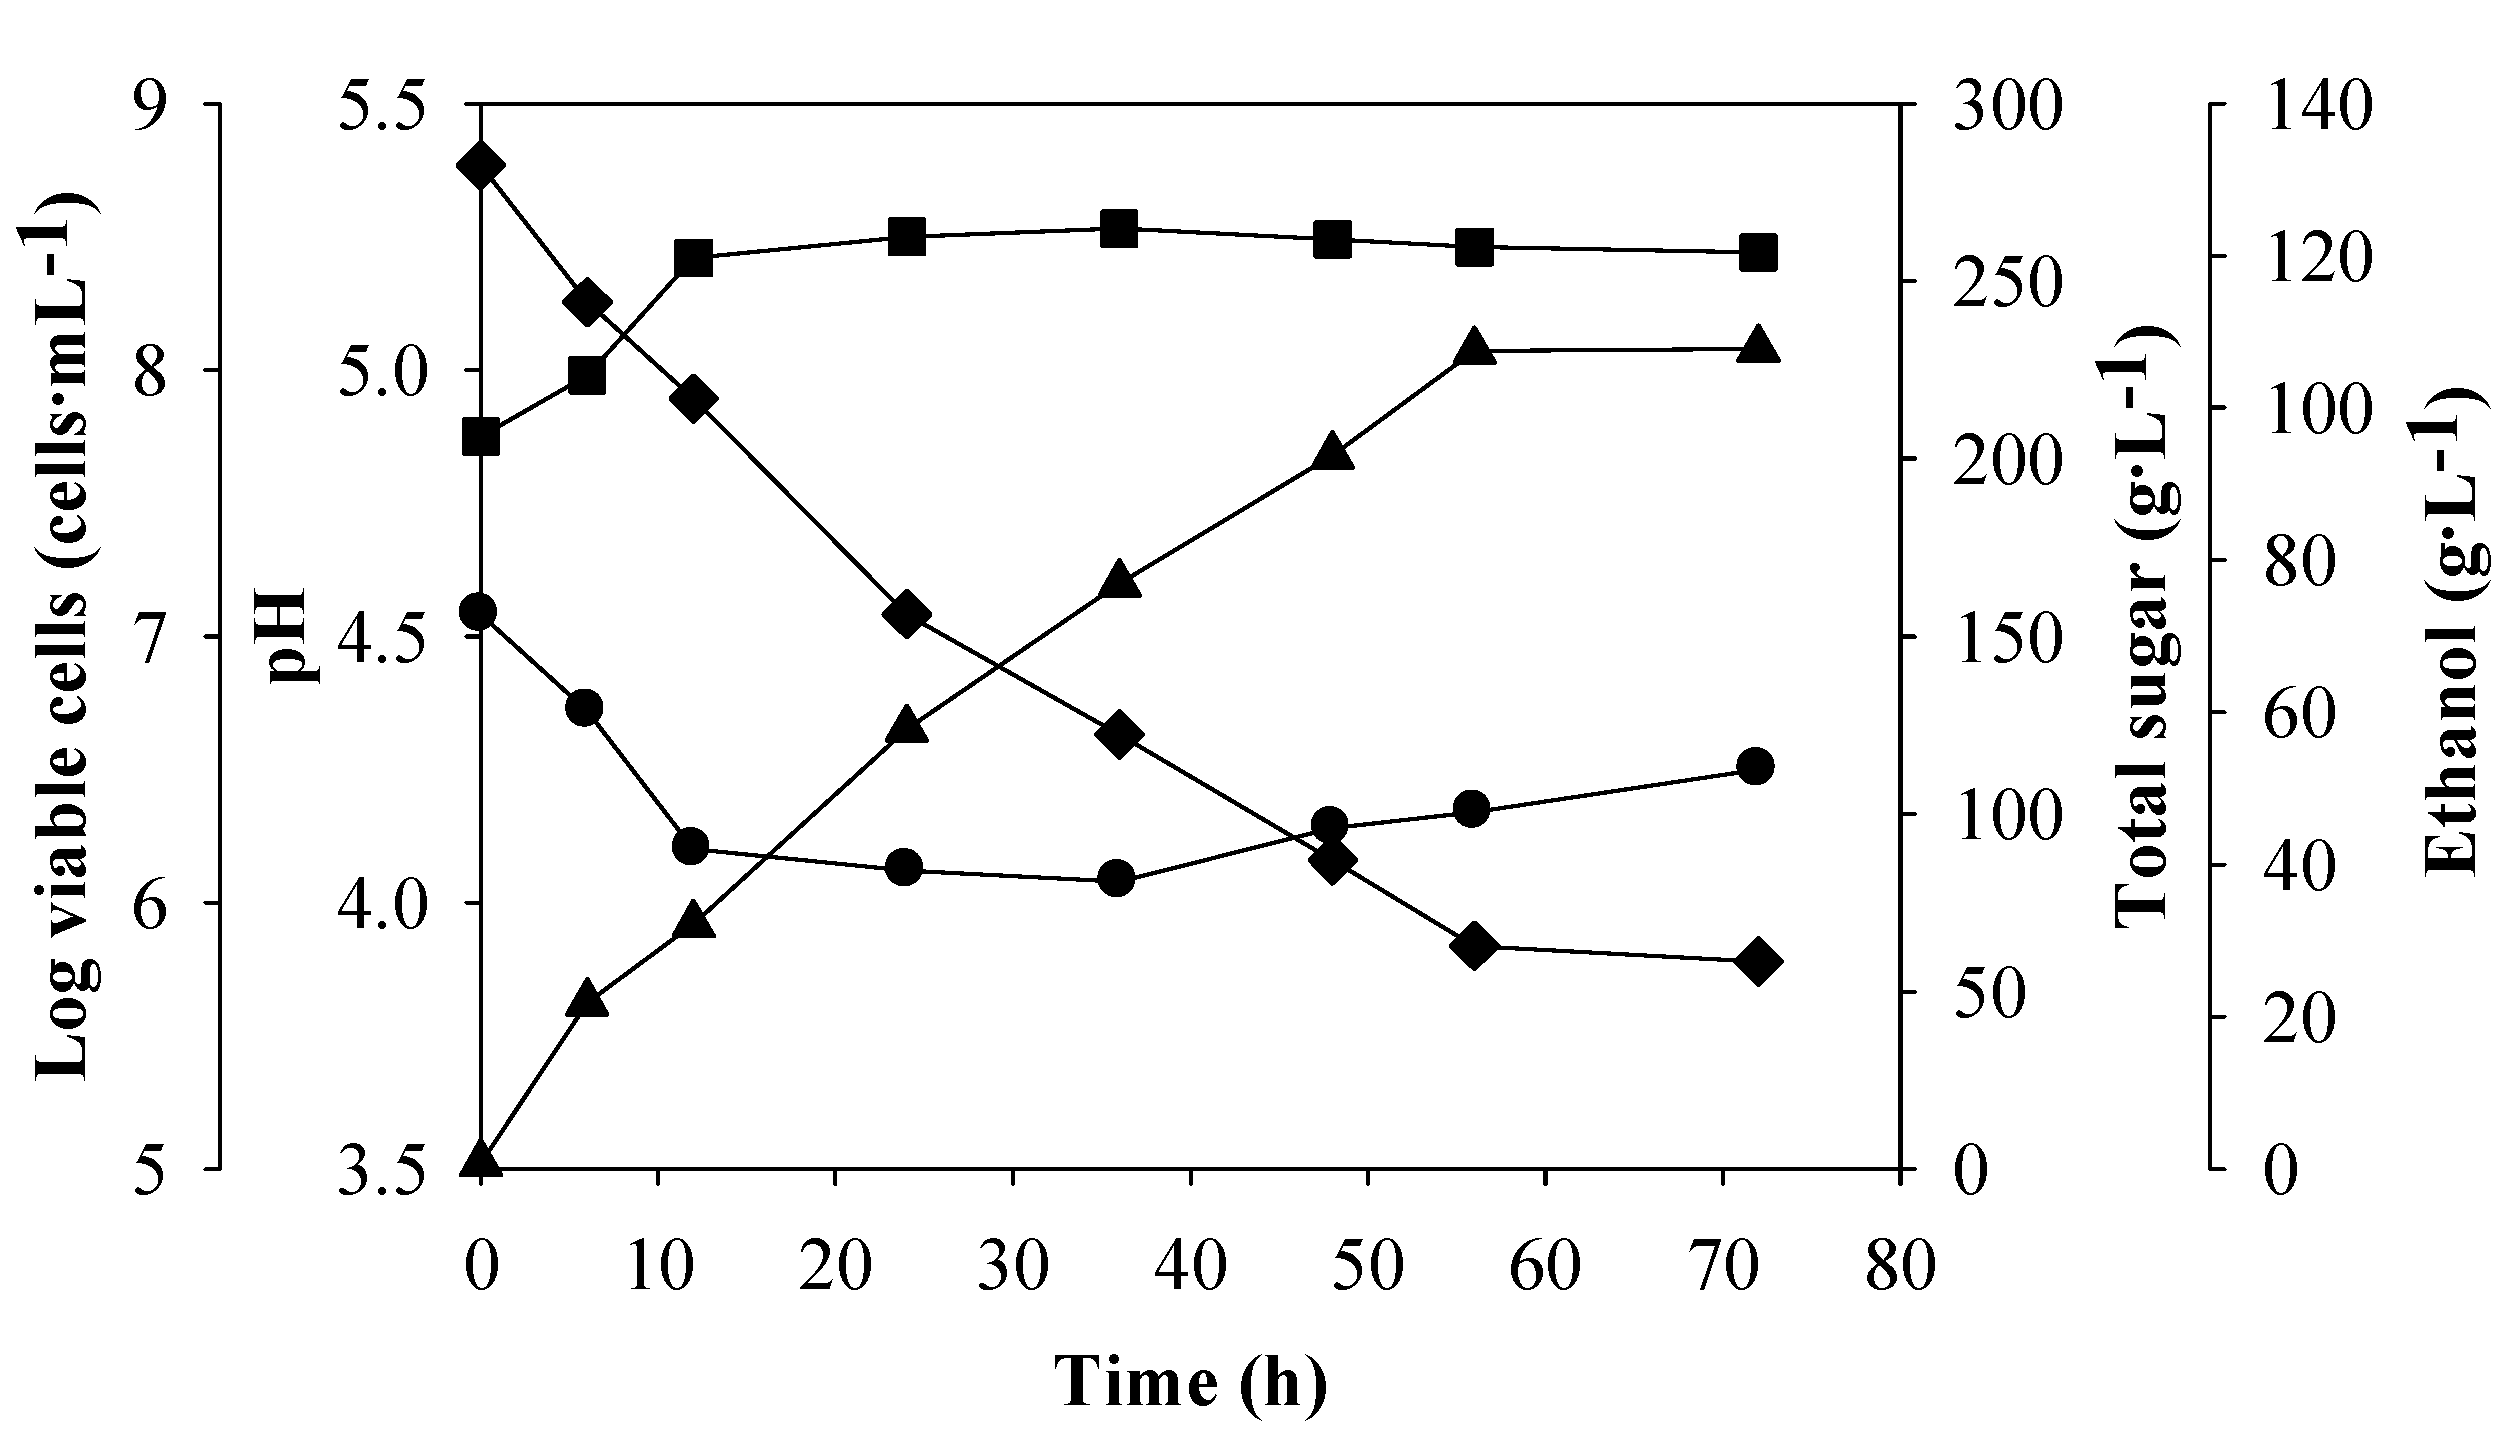
Figure 1.
Batch ethanol fermentation of Run 1 from the synthetic medium containing 280 g·L−1 of total sugar supplemented with yeast extract, 1; DSY, 4 and glycine, 1 g·L−1: log viable cells (■), pH (●), total sugar (♦) and ethanol (▲).
Figure 1.
Batch ethanol fermentation of Run 1 from the synthetic medium containing 280 g·L−1 of total sugar supplemented with yeast extract, 1; DSY, 4 and glycine, 1 g·L−1: log viable cells (■), pH (●), total sugar (♦) and ethanol (▲).
At the beginning of the fermentation, the initial cell and total sugar concentrations were 5.7 × 10⁷ cells·mL−1 and 282.5 g·L−1, respectively. No lag phase was observed after inoculation. The yeast cell numbers increased significantly in the first 12 h, to a value of 2.6 × 10⁸ cells·mL−1 and rarely changed afterwards. The pH of the fermentation broth decreased from 4.5 to 4.1 at 12 h, and increased slightly to 4.3 at the end of the fermentation.
The sugar was not completely consumed under this condition, with 62.8 g·L
−1 of total sugar remaining in the broth. The
P value increased with increasing fermentation time, and the highest value was 107.5 g·L
−1 at 56 h, corresponding to
Qp,
Yp/s and sugar consumption of 1.92 g·L
−1·h
−1, 0.47 g·g
−1 and 79.2 %, respectively. The profiles of the parameters measured during the batch ethanol fermentation of the eight remaining experimental runs were similar to those of Run 1 (data not shown).
Table 3 shows the orthogonal experiment results of the viable yeast cell concentration,
P,
Qp,
Yp/s and sugar consumption at the fermentation time of 56 h. The initial cell concentration under all conditions ranged from 5.6 to 5.7 × 10
7 cells·mL
−1. At 56 h fermentation time, the viable yeast cell concentrations were similar, with a range of 2.5 to 2.8 × 10
8 cells·mL
−1, indicating that the nutrients in the synthetic medium (
Section 2.3) were sufficient for yeast growth. However, the different amounts of nutrient supplements affected the ethanol fermentation efficiencies and sugar consumption. The highest
P,
Qp,
Yp/s and sugar consumption were obtained from Run 4. In contrast, the lowest
P and sugar consumption were obtained from Run 9, which contained the highest concentrations of yeast extract (5 g·L
−1) and DSY (20 g·L
−1) with low glycine (1 g·L
−1). Similar results were reported by Nofemele
et al. [
34] who found that although the growth of
S. cerevisiae in sugarcane molasses medium containing 0.5 to 4.0 g·L
−1 of urea at 35 °C were not different, the supplementation with urea at 2.0 g·L
−1 gave the maximum ethanol concentration and fermentation efficiency. Decreased ethanol fermentation efficiency was observed at higher urea concentrations (3.0 and 4.0 g·L
−1).
Table 3.
Orthogonal experiment results of ethanol fermentation from the synthetic medium containing 280 g·L−1 of total sugar at the fermentation time of 56 h.
Table 3.
Orthogonal experiment results of ethanol fermentation from the synthetic medium containing 280 g·L−1 of total sugar at the fermentation time of 56 h.
| Experimental run a | Mean (range) |
|---|
| Viable yeast cells (cells·mL−1) | P (g·L−1) | Qp (g·L−1·h−1) | Yp/s (g·g−1) | Sugar consumption (%) |
|---|
| R1 | 2.8 × 10⁸ (1.5 × 10⁶ ) e | 107.5 (1.4) b,c | 1.92 (0.02) b,c | 0.47 (0.02) b,c | 79.2 (1.2) b,c |
| R2 | 2.8 × 10⁸ (2.0 × 10⁶ ) e | 106.0 (2.3) b | 1.89 (0.04) b | 0.47 (0.00) b,c | 77.9 (1.1) b |
| R3 | 2.6 × 10⁸ (1.2 × 10⁶ ) c | 108.7 (1.8) b,c | 1.94 (0.04) c | 0.46 (0.02) b,c | 80.1 (1.1) b,c,d |
| R4 | 2.8 × 10⁸ (1.1 × 10⁶ ) e | 119.3 (1.5) f | 2.13 (0.02) f | 0.49 (0.02) c | 85.2 (1.2) e |
| R5 | 2.5 × 10⁸ (1.3 × 10⁶ ) b | 113.8 (2.4) e | 2.03 (0.02) e | 0.45 (0.02) b | 83.4 (1.2) d,e |
| R6 | 2.6 × 10⁸ (2.0 × 10⁶ ) c | 112.1 (0.3) d,e | 2.00 (0.02) d,e | 0.46 (0.00) b,c | 83.1 (1.0) d,e |
| R7 | 2.8 × 10⁸ (1.5 × 10⁶ ) e | 110.0 (0.2) c,d | 1.96 (0.00) c,d | 0.47 (0.02) b,c | 82.2 (1.1) c,d,e |
| R8 | 2.7 × 10⁸ (1.4 × 10⁶ ) d | 112.0 (1.9) d,e | 2.00 (0.04) d,e | 0.45 (0.04) b | 83.4 (1.1) d,e |
| R9 | 2.6 × 10⁸ (1.9 × 10⁶ ) c | 105.9 (0.8) b | 1.89 (0.02) b | 0.45 (0.00) b | 77.5 (1.1) b |
In the industry, high P and Qp values have been continuously pursued because of the energy savings in the downstream distillation and waste distillate treatment. Thus, the P and Qp values are considered in this study to judge the ethanol production.
3.3. Impact of Factors on Ethanol Concentration and Volumetric Ethanol Productivity
The
P values of the orthogonal experiments (
Table 3) ranged from 105.9 to 119.3 g·L
−1. Range analysis was applied to clarify the important sequence of yeast extract (factor
A), DSY (factor
B) and glycine (factor
C) concentrations in the orthogonal experiments (
Table 4). The highest range value (
R) of 7.68 was found for factor
A, while the lowest range value of 3.38 was found for factor
B. The bigger
R value of a factor represents a greater effect on the final
P value. According to the range, the order of influence on the
P value was yeast extract > glycine > DSY. Thus, the optimum condition for improving
P value was determined as
A2B1C3 corresponding to yeast extract, 3; DSY, 4 and glycine, 5 g·L
−1. The analysis of variance (ANOVA) method was used to confirm the order of the effects of these three parameters on the final
P value. The model
F-value of 184.14 implied that the model was significant. There was only a 5.00% chance that “a model
F-value” this large could occur due to noise. Values of probe
F < 0.05 indicated that the model terms were significant. According to the
F value, the order of influence (
Fyeast extract = 360.68,
Fglycine = 127.19 and
FDSY = 64.55) was similar to that of the
R value. The effect of the dummy variable was calculated in the same manner as the effects of the experimental variables. If the effect shown by a dummy variable is 0, there is no interaction and no error in measuring the response. If not, it is assumed to be a measure of the lack of experimental precision plus any analytical error in measuring the response [
35]. The correlation between predicted and actual results of the
P values had
R2 of 99.8%. These results confirmed an acceptable fit of the model to the data [
36].
Table 4.
The range analysis of L9 (34) orthogonal experiment for ethanol concentration (P) and productivity (Qp).
Table 4.
The range analysis of L9 (34) orthogonal experiment for ethanol concentration (P) and productivity (Qp).
| A: Yeast extract | B: DSY a | blank | C: Glycine |
| P | QP | P | QP | P | QP | P | QP |
| K1 | 644.3 | 11.50 | 673.6 | 12.02 | 663.1 | 13.81 | 654.4 | 11.68 |
| K2 | 690.3 | 12.32 | 663.6 | 11.84 | 662.4 | 13.84 | 656.1 | 11.70 |
| K3 | 655.8 | 11.70 | 653.3 | 11.66 | 664.9 | 13.79 | 679.9 | 12.14 |
| k1 | 107.4 | 1.92 | 112.3 | 2.00 | 110.5 | 2.30 | 109.1 | 1.94 |
| k2 | 115.1 | 2.05 | 110.6 | 1.97 | 110.4 | 2.31 | 109.4 | 1.95 |
| k3 | 109.3 | 1.95 | 108.9 | 1.94 | 110.8 | 2.30 | 113.3 | 2.02 |
| R | 7.68 | 0.13 | 3.38 | 0.06 | 0.30 | 0.01 | 4.24 | 0.08 |
| Q | A2 | A2 | B1 | B1 | | | C3 | C3 |
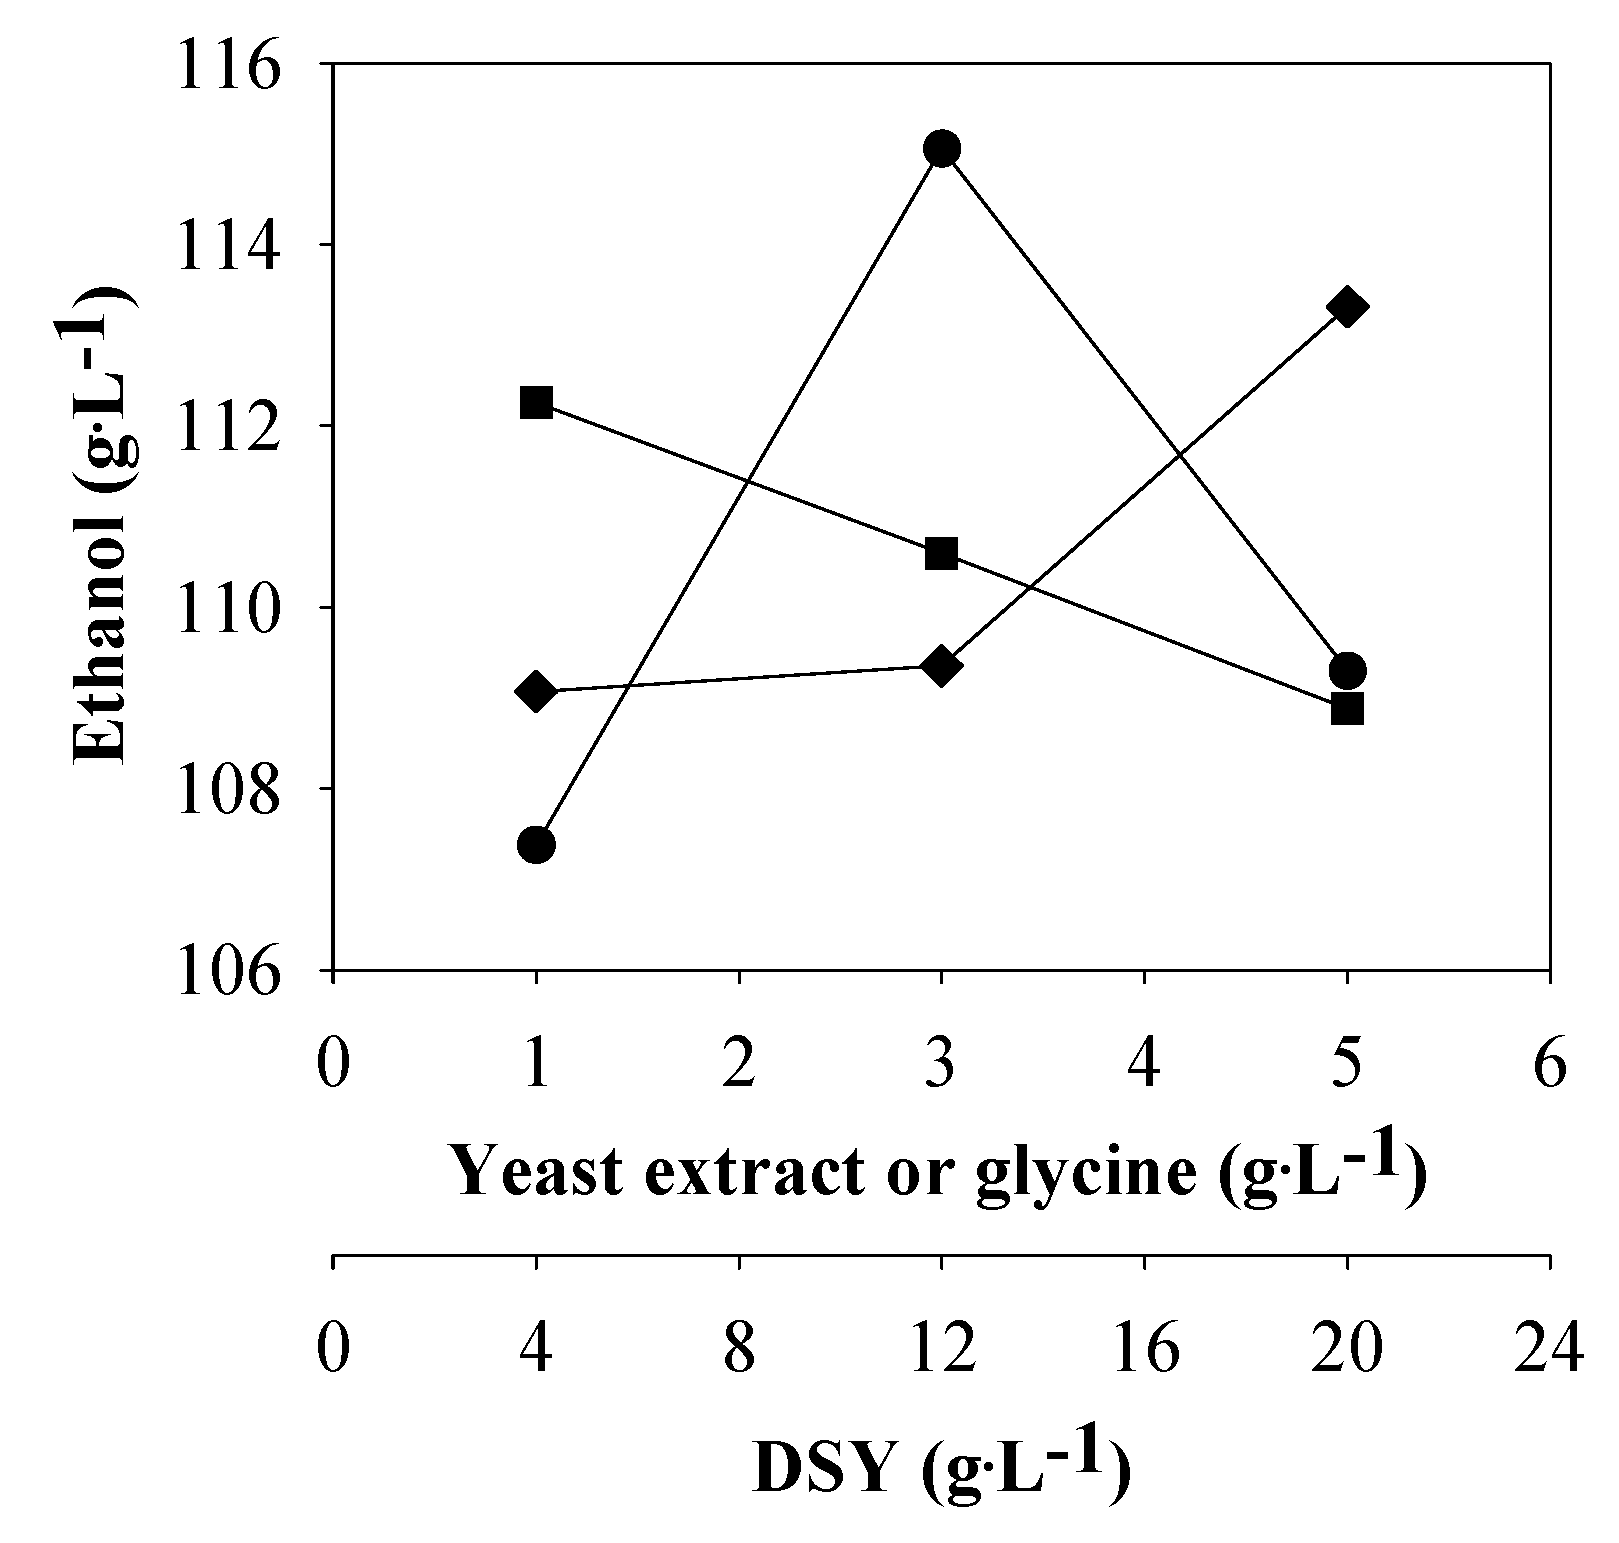
Figure 2 shows the
P values at different levels and factors. The
P values ranged from 107.4 (
k1) to 115.1 (
k2) g·L
−1; when the yeast extract concentration was increased from 1 to 3 g·L
−1 (
Table 4). The highest
P value (115.1 g·L
−1,
k2) was achieved at 3 g·L
−1 of yeast extract. This implied that both permeation intensity of nutrients from the fermentation broth to the inside of yeast cells and the ethanol from the inside of yeast cells to the broth could be improved [
13,
20], in other words, the sugar uptake and ethanol production were enhanced by increasing the yeast extract concentration from 1 to 3 g·L
−1. However, higher yeast extract concentrations (>3 g·L
−1) did not increase the
P value. For the DSY concentrations,
S. cerevisiae NP 01 showed the highest
P value of 112.3 g·L
−1 (
k1) at the DSY concentration of 4 g·L
−1. Increasing in the DSY concentration in the medium did not promote ethanol production. Bafrncová
et al. [
13] reported that excess assimilable nitrogen did not lead to an increase in the ethanol production rate and a reduction of the fermentation time. The higher the glycine concentration was, the more ethanol production was obtained. The maximum
P value of 113.3 g·L
−1 (
k3) was obtained at the glycine concentration of 5 g·L
−1. The value was higher than that reported by Thomas
et al. [
20], who found that the addition of 3 g·L
−1 of glycine into VHG ethanolic fermentation medium containing 350 g·L
−1 of sugar improved sugar consumption of
S. cerevisiae NCYC 1324 from 173 g·L
−1 (no addition) to 324 g·L
−1, and the cell viability increased from 13% to 78%.
Figure 2.
The ethanol concentrations at different levels and factors: yeast extract (●), dried spent yeast (DSY, ■) and glycine (♦).
Figure 2.
The ethanol concentrations at different levels and factors: yeast extract (●), dried spent yeast (DSY, ■) and glycine (♦).
Regarding the ethanol productivity or
Qp, the values varied among the combined factor treatments of the orthogonal experiments in the range of 1.89 to 2.13 g·L
−1·h
−1 (
Table 3).
Table 4 shows the range analysis of L
9 (3
4) orthogonal experiments of the
Qp values. The range (
R) of factors
A,
C and
B was 0.13, 0.08 and 0.06, respectively. The bigger
R value of a factor represents the greater effect on the final
Qp. Thus, the order of influence on the
Qp value was yeast extract > glycine > DSY, which was the same as that for the
P value. The optimum condition for improving
Qp value (
A2B1C3) was also not different from that for the
P value. Thus, the optimum fermentation condition was determined as follows: yeast extract, 3; DSY, 4 and glycine, 5 g·L
−1. The order of influence on
P and
Qp values was not always consistent as reported by Liu and Shen [
37]. According to the
F value in our study, the order of influence for
Qp value (
Fyeast extract = 457.00,
Fglycine = 169.00 and
FDSY = 81.00) was similar to that of the
R value. The correlation between the predicted and actual results of the
Qp values having
R2 of 99.9%, which was higher than 75%, confirming that the fitted model to the results was acceptable [
36]. The profiles of the
Qp values under different conditions were similar to those of the
P values shown in
Figure 2. The highest
Qp of 2.05 g·L
−1·h
−1 (
k2) was found at 3 g·L
−1 of yeast extract. This implied that the fermentation rate would be enhanced with the increased yeast extract concentration from 1 to 3 g·L
−1 and decreased with the increased yeast extract concentration from 3 to 5 g·L
−1. The highest
Qp value of 2.00 g·L
−1·h
−1 (
k1) was obtained at 4 g·L
−1 of DSY. A trend of lower
Qp value with an increase in the DSY concentration was observed. The maximum
Qp value was 2.02 g·L
−1·h
−1 (
k3) at 5 g·L
−1 of glycine. This might be explained by the fact that the
Qp value would be boosted with the increased glycine concentration.
3.4. The Verification Experiments
In order to verify the reliability of the results in flasks, an additional experiment with the corresponding parameters under the optimum nutrient condition
A2B1C3 (yeast extract, 3; DSY, 4 and glycine, 5 g·L
−1) was carried out in the 2-L fermenter (
Figure 3).
Figure 3.
Batch ethanol fermentation in the 2-L fermenter from the synthetic medium containing 280 g·L−1 of total sugar and nutrient supplements at the optimum nutrient concentrations (yeast extract, 3; DSY, 4 and glycine, 5 g·L−1) (closed symbols, solid lines), without nutrients supplement (open symbols, solid lines), with 9 g·L−1 of yeast extract (open symbols, dashed lines) and with 13.4 g·L−1 of DSY (closed symbols, dashed lines). (a) pH (●○) and log viable cells (■□) and (b) total sugar (♦◊) and ethanol (▲△).
The viable yeast cells increased from 5.7 × 10
7 to 3.5 × 10
8 cells·mL
−1 before a slight decrease after 36 h, while pH fell from approximately 4.5 to 4.1 in the first 12 h of the fermentation after which time an increase to approximately 4.3 was observed. The viable cell numbers and total sugar remaining in the broth were 2.7 × 10
8 cells·mL
−1 and 41.1 g·L
−1, respectively; corresponding to a sugar consumption of 85.2%. The sugar and ethanol concentrations were almost constant at 56 h with the
P,
Qp and
Yp/s values of 119.9 g·L
−1, 2.14 g·L
−1·h
−1 and 0.49, respectively (
Table 5). The control experiment operating under the same condition without nutrient supplement was also performed (
Figure 3). The
P,
Qp and
Yp/s values of the control treatment were 95.3 g·L
−1, 1.70 g·L
−1·h
−1 and 0.49 g·g
−1, respectively at the fermentation time of 56 h (
Table 5). The viable yeast cells and ethanol concentration under the optimum condition were approximately 28 and 26% higher than those of the control treatment, respectively. This clearly indicated that the use of both nitrogen supplements coupled with the osmoprotectant significantly promoted ethanol production from the synthetic medium under the VHG conditions. When the synthetic medium was supplemented with 9 g·L
−1 of yeast extract and used as the EP medium, the changes of pH in the broth were comparable with those under the optimum nutrient condition (
Figure 3), but the viable cell concentrations under the optimum nutrient supplementation were slightly higher. This might be due to the positive effect of the osmoprotectant addition on cell growth as reported by Thomas
et al. [
20]. The sugar consumption and the ethanol production rates in the first 48 h under the yeast extract addition were higher, implying that some essential trace elements in yeast extract (
Table 2) promoted those rates. When the synthetic medium was supplemented with 13.4 g·L
−1 of DSY (total nitrogen content was equal to that of 9 g·L
−1 of yeast extract), the changes of pH and viable yeast cells in the broth and glycerol production were similar to those under the yeast extract supplementation (
Figure 3 and
Table 5). However, the ethanol production efficiencies were lower. This implied that the fermentation activities of the yeast were different under both conditions. The
P,
Qp,
Yp/s values and glycerol production at 56 h under the yeast extract addition and optimum nutrient conditions were similar (
Table 5). These indicated that DSY and glycine could be used to replace some amount of yeast extract for high level ethanol production under VHG fermentation.
Our results demonstrated that the optimum condition
A2B1C3 was suitable and reliable for VHG ethanol fermentation by
S. cerevisiae NP 01. Similar results were observed by Bafrncová
et al. [
13] who reported that the supplementation with yeast extract, 12; cell walls, 3; glycine, 3 and soya flour, 20 g·L
−1 into synthetic medium containing 300 g·L
−1 of glucose led to an increase in ethanol production efficiency with the
P and
Qp values of 91 g·L
−1 and 3.30 g·L
−1·h
−1, respectively.
Table 5.
Fermentation parameters of batch ethanol production under VHG fermentation at 280 g·L−1 of total sugar.
Table 5.
Fermentation parameters of batch ethanol production under VHG fermentation at 280 g·L−1 of total sugar.
| Supplement | Mean (range) | t (h) |
|---|
| Medium | P (g·L−1) | Qp (g·L−1·h−1) | Yp/s (g·g−1) | Glycerol (g·L−1) | SC (%) |
|---|
| None | Synthetic | 95.3 (0.4) d | 1.70 (0.00) d | 0.49 (0.00) c | 12.47 (0.4) c | 67.0(3.5) c | 56 |
| Yeast extract (9 g·L−1) | Synthetic | 121.1 (0.5) e | 2.16 (0.00) e | 0.49 (0.00) c | 12.36 (0.2) c | 88.2 (2.1) f | 56 |
| DSY a (13.4 g·L−1) | Synthetic | 110.5 (0.2) f | 1.97 (0.01) d | 0.48 (0.01) d | 12.55 (0.3) c | 82.2 (1.0) d | 56 |
| Optimum (A2B1C3) | Synthetic | 119.9 (0.3) e | 2.14 (0.02) f | 0.49 (0.00)c | 11.34(0.7) d | 85.2(2.3) e | 56 |
| None | SSJ b | 90.7 (0.2) c | 1.62 (0.01) c | 0.49 (0.01) c | 11.77(0.2) d | 65.8 (1.1) c | 56 |
| Optimum (A2B1C3) | SSJ | 120.1 (0.3) e | 2.50 (0.00) g | 0.48 (0.00) d | 10.75 (0.4) e | 93.1 (3.9) g | 48 |
Since the amount of assimilable nitrogen affected the ethanol production efficiency, especially under the VHG ethanol fermentation conditions [
12,
13,
38], the fermentable nitrogen concentrations in the fermented broth were determined.
Table 6 shows the fermentable nitrogen utilized by
S. cerevisiae NP 01 during the ethanol fermentation from the synthetic medium in the orthogonal experiments compared to those of the medium with and without 9 g·L
−1 of yeast extract. In the orthogonal experiments, it seemed that the utilization of fermentable nitrogen in the medium increased when the
P values increased. According to
Table 2, the initial total nitrogen in the broth of Run 2 was equal to that in the broth containing 9 g·L
−1 of yeast extract, but the fermentable nitrogen in the former was only 56% of that in the latter. Therefore, the initial fermentable nitrogen concentrations of the nine experimental runs were much lower than that of the yeast extract supplementation. However, it seemed that the amount of nitrogen consumption did not always relate to ethanol production performance of the yeast as reported by many groups [
13,
31,
38,
39,
40]. The
P values of the medium containing 9 g·L
−1 of yeast extract (121.1 g·L
−1) and R4 (119.3 g·L
−1) were similar, but the utilized fermentable nitrogen of the former (317.5 mg·L
−1) was much higher than that of the latter (250.3 mg·L
−1). The results also showed that the fermentable nitrogen was not limited, even in the medium without nutrient supplementation, because the fermentable nitrogen still remained at approximately 110 mg·L
−1. This suggested that the mineral and trace elements in yeast extract and DSY (
Table 2) might affect the capability of nitrogen utilization by the yeast under VHG conditions.
Table 6.
Fermentable nitrogen during ethanol production from the synthetic medium under various nutrient supplements by S. cerevisiae NP 01.
Table 6.
Fermentable nitrogen during ethanol production from the synthetic medium under various nutrient supplements by S. cerevisiae NP 01.
| Condition | Mean (range) |
|---|
| Fermentable nitrogen a (mg·L−1) | Ethanol concentration b (g·L−1) |
|---|
| Initial | Utilized |
|---|
| No supplement | 291.3 (1.5) c | 182.0 (4.0) c | 95.3 (0.4) c |
| Yeast extract (9 g·L−1) | 628.8 (2.3) l | 317.5 (3.8) j | 121.1 (0.5) j |
| R1 | 330.3 (4.8) d | 209.1 (5.7) e | 107.5 (1.4) b,c |
| R2 | 349.2 (3.2) e | 205.9 (2.3) e | 106.0 (2.3) b |
| R3 | 465.3 (2.0) k | 216.9 (3.7) f | 108.7 (1.8) b,c |
| R4 | 351.4 (1.0) e | 250.3 (2.6) i | 119.3 (1.5) f |
| R5 | 372.2 (4.0) f | 239.7 (4.7) h | 113.8 (2.4) e |
| R6 | 482.4 (1.8) j | 235.0 (3.0) g | 112.1 (0.3) d,e |
| R7 | 382.8 (2.1) g | 219.7 (4.1) f | 110.0 (0.2) c,d |
| R8 | 390.3 (2.5) h | 241.2 (4.4) h | 112.0 (1.9) d,e |
| R9 | 489.2 (2.1) i | 200.0 (3.0) d | 105.9 (0.8) b |
3.5. VHG Ethanol Fermentation from Sweet Sorghum Juice
Sweet sorghum [
Sorghum bicolor (L.) Moench] is an attractive alternative feedstock for the future supplies of bioethanol because its stalks contain high concentrations of fermentable sugar, and it can be cultivated in nearly all temperatures and tropical climate areas [
41,
42,
43]. In this study, the ethanol production from the sweet sorghum juice (280 g·L
−1 of total sugar) supplemented with yeast extract, 3; DSY, 4; and glycine, 5 g·L
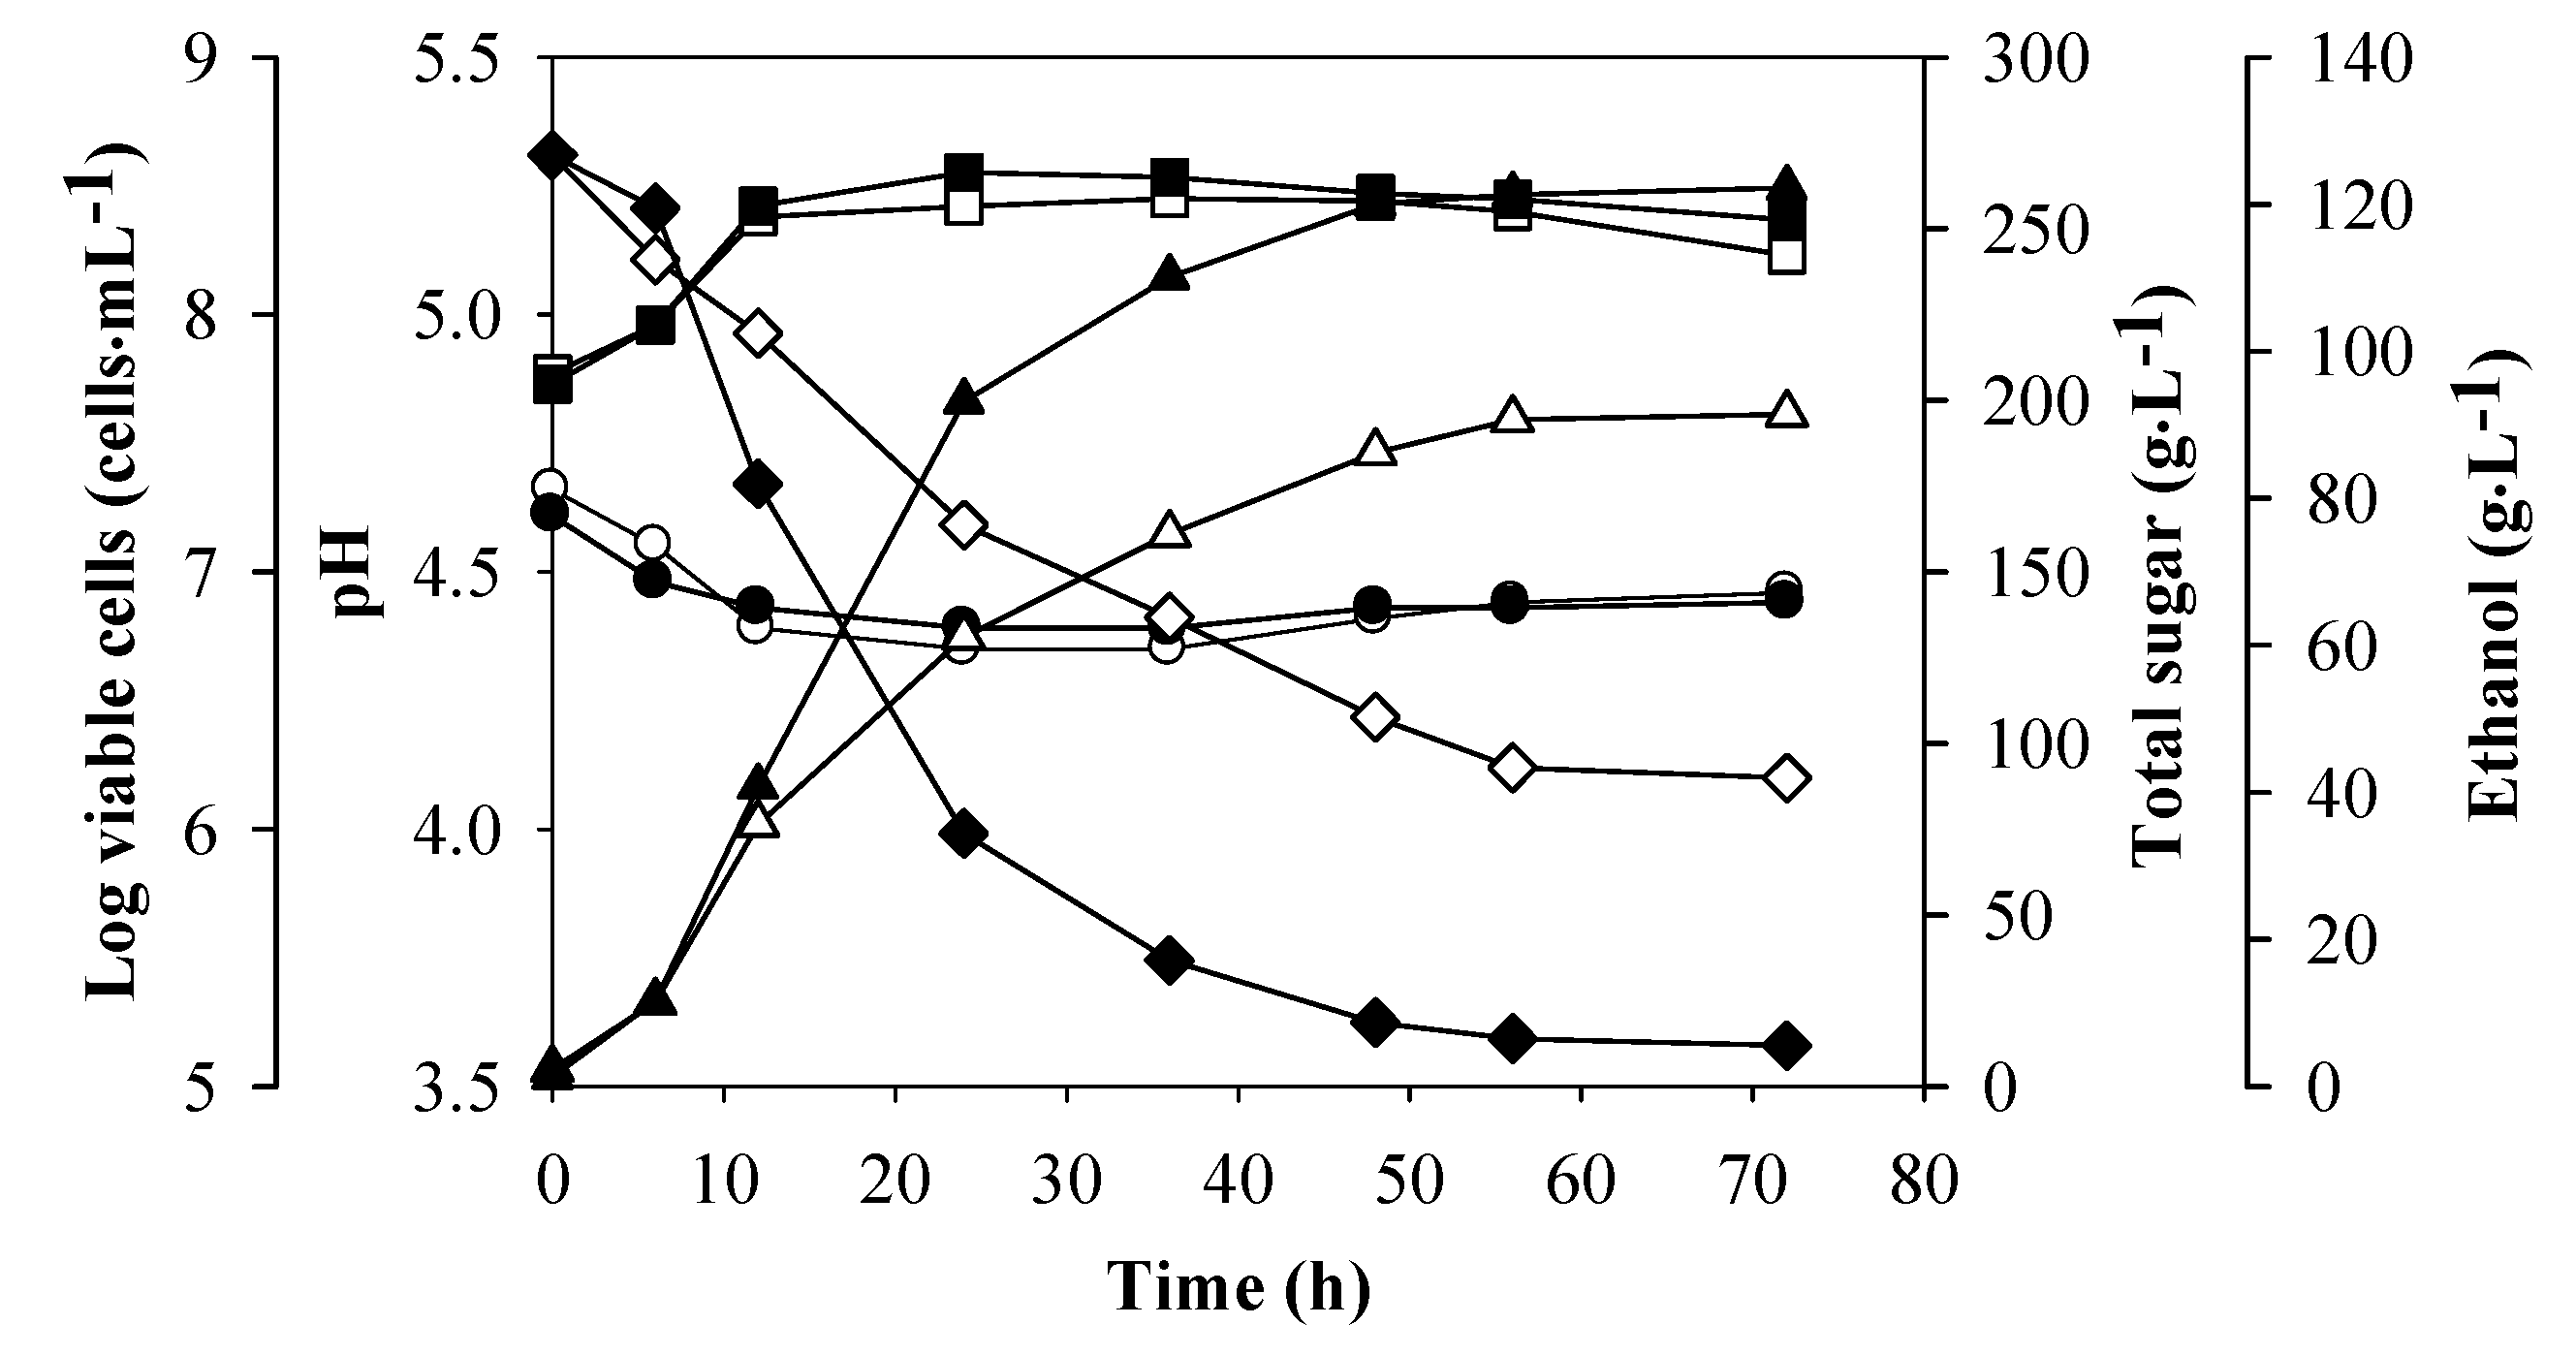
−1 was carried out in the 2-L fermenter to compare the ethanol fermentation efficiencies with those from the synthetic medium. The viable cell numbers and total sugar remaining in the broth were 2.3×10
8 cells·mL
−1 and 18.6 g·L
−1, respectively (
Figure 4). All parameters measured were almost constant at 48 h with the
P, 120.1 g·L
−1;
Qp, 2.50 g·L
−1·h
−1;
Yp/s, 0.48 and sugar consumption, 93.1% (
Table 5). Under the optimum supplementation, the changes of viable cell concentration during fermentation in the juice and the synthetic medium were similar. However, the
Qp value of the sweet sorghum juice was higher than that of the synthetic medium, implying that some elements, e.g., metal ions and vitamins in the juice [
18,
33], might play an important role in stimulating the fermentation rate in terms of sugar consumption and ethanol production under VHG conditions. The
P values from the sweet sorghum juice containing 9 g·L
−1 of yeast extract reported by Nuanpeng
et al. [
5] and Khongsay
et al. [
6] were 120.2 and 119.4 g·L
−1, respectively. These values were not different from the
P value (120.1 g·L
−1) obtained in this study under the optimum nutrient supplementation (
A2B1C3), but the amount of yeast extract added in this study was reduced three fold. This also indicated that DSY, a low-cost nitrogen source, could be used to replace some amount of yeast extract and the addition of nitrogen supplement (yeast extract and DSY) coupled with the osmoprotectant (glycine) significantly promoted ethanol production from the sweet sorghum juice under the VHG conditions.
It was reported that large amounts of by-products were produced under osmotic stress or VHG conditions, and glycerol was the main by-product of ethanol fermentation [
44,
45,
46]. In our study, the glycerol concentration produced during the fermentation from the juice was also slightly lower than that produced from the synthetic medium (
Table 5). The lack of a marked difference in the glycerol production might be due to the fact that all conditions were carried out under the VHG fermentation at the same sugar concentration.
Figure 4.
Batch ethanol fermentation in 2-L fermenter from sweet sorghum juice containing 280 g·L−1 of total sugar and nutrient supplements at the optimum concentrations (closed symbols) and without nutrient supplement (open symbols): pH (●○), log viable cells (■□), total sugar (■□) and ethanol (▲△).

