Article

Application Model for a Stirling Engine Micro-Generation System in Caravans in Different European Locations

1
Defense University Center, The Naval Academy, Plaza de España 2, Marín 36920, Spain
2
Industrial Engineering School, University of Vigo, Lagoas Marcosende s/n, Vigo 36310, Spain
*
Author to whom correspondence should be addressed.
Energies 2013, 6(2), 717-732; https://doi.org/10.3390/en6020717
Submission received: 27 November 2012 / Revised: 25 January 2013 / Accepted: 29 January 2013 / Published: 6 February 2013
(This article belongs to the Special Issue Combined Heat and Power – Strategy and Practice)

Abstract

:
This article describes a simple model obtained from a commercial Stirling engine and used for heating a caravan. The Stirling engine has been tested in the lab under different electrical load conditions, and the operating points obtained are presented. As an application of the model, a series of transient simulations was performed using TRNSYS. During these simulations, the caravan is traveling throughout the day and is stationary at night. Therefore, during the night-time hours, the heating system is turned on by means of the Stirling engine. The study was performed for each month of the year in different European cities. The different heating demand profiles for different cities induce variation in the electricity production, as it has been assumed that electricity is only generated when the thermal demand requires the operation of the Stirling system. As a result, a comparison of the expected power generation in different European cities is presented.

1. Introduction

A system is called a small-scale micro-cogeneration system when it generates electricity and usable heat, but the electric power produced remains below 5 kW [1]. Currently, there are four different families of micro-cogeneration technologies, each with distinct features depending on their conversion method. Fuel cells (FC), Stirling engines (SE), steam engines (mainly using the Rankine cycle) and internal combustion engines (ICE) are the most useful technologies for micro-cogeneration applications within residential dwellings [2]. Thermodynamic optimization of some of these systems is performed intending to maximize the exergy in Feidt et al. [3]
ICE is the most mature technology, having trigeneration applications, as described in Míguez et al. [4,5], in addition to cogeneration applications. In this work, the different advantages and possibilities of an SE cogeneration system were analyzed. The external combustion used in this method allows fuel flexibility [6]. As a result, the engine can be easily adapted to run on diesel, natural gas or renewable fuels such as wood, biogas or pellets [1,2]. When low grade fuels are burnt in the combustion chamber, fouling problems can appear from deposits on the heat exchanger surfaces [7]. This fouling should be removed following an optimal maintenance routine [8].
Furthermore, the rotating elements produce low noise and vibrations [9], essential features for use in a recreational vehicle. Additionally, SE devices allow longer working intervals and higher maintenance-free periods than are possible with ICE devices [10]. In general, an SE can be considered to be a reciprocating external combustion engine [11,12] with high overall thermal efficiency that also provides electricity [13] with good performance at partial loads [12]. These characteristics make SEs particularly interesting for applications where an electrical connection does not exist.
The caravan and the motorhome are widespread forms of tourism that allow mobility with very favorable economics. There is a lack of studies about motorhomes and caravans, despite the fact that many people use such vehicles for temporary, and sometimes permanent, accommodation. The European Caravan Federation (ECF) [14] estimates that approximately 1.4 million motorhomes and 4 million caravans are in use in Europe [15].
This article addresses the development of a simple model for estimating the annual performance of a Stirling-based CHP unit [16] inside a commercial caravan. Prior to modeling the whole system, a study of the thermal demands of the caravan in different cities in Europe is made using the TRaNsient SYstem Simulation (TRNSYS) [17] program.
TRNSYS is a software program with a modular structure, developed to analyze transient problems in complex energy systems. This software allows users to build bespoke components, called “Types”, which allow the definition of the performance of electrical producers and consumers, including systems and equipment not available in the standard software. Thanks to this versatility, from its very first version, TRNSYS has been widely and successfully used over the last 35 years [18,19,20].
After modeling the thermal behavior of the caravan, the modeling of the Stirling-based CHP requires its experimental characterization, presented in Section 2. Section 3 presents the caravan used in the application of this micro-CHP system and its basic modeling parameters. Section 4 shows the simulations performed in TRNSYS. Finally, the overall results of the caravan and the Stirling-based CHP system evaluated in different locations throughout Europe will be compared and discussed.

2. Materials and Methods

2.1. The Stirling Engine

2.1.1. Main Characteristics

A four-cylinder Stirling-cycle engine was selected to supply heat and electricity to the caravan. This SE is classified as a kinematic engine where the four cylinders are interconnected so that the expansion space of one cylinder is connected to the compression space of the adjacent cylinder. These pistons are driven by a wobble-yoke mechanism.
The cylinders are pressurized up to 28 bar with nitrogen, which works in a closed thermodynamic cycle [9]. In this cycle, the nitrogen is continuously heated and cooled and the resulting changes in gas volume cause the pistons to move up and down [6]. This linear motion is converted by a transmission system to a rotational movement driving a generator with permanent magnets. This generator unit produces DC electricity, which can be directly consumed or transformed into AC electricity.
The selected micro-cogeneration machine is one of the smallest Stirling engines on the market. It has reduced dimensions (450 × 500 × 650 mm3) and light weight (90 kg), useful characteristics for its application in smaller vehicles. The heat produced by the SE is used for space heating, and the power is used to meet the electrical needs of the caravan. The peak electrical power of the engine reaches 1 kW, and the maximum thermal energy is established at approximately 6.5 kW. As a basis for comparison, the conventional solution for the needs of a caravan are an ICE and a boiler to provide electricity and heat, respectively.

2.1.2. Operating Principle

SE accomplishes external combustion within a fuel combustion chamber. This method is used for heating the heat source and the working fluid. The selected fuel type was diesel with an LHV of 11.89 kWh·kg−1 because of its high availability at gas stations and higher energetic density. The low fuel consumption of the Stirling (roughly 0.7 L per hour of continuous run) guarantees long working periods between refills. The fuel combustion chamber heats the upper part of the cylinders. The lower portion of the cylinders is refrigerated by the circulating water, and this difference of temperature provokes a gradient of pressure that makes the pistons move. This linear displacement is converted to a rotational movement that moves the generator unit by means of a transmission system.
A water circuit collects the heat from the cylinders and from the exhaust gas through a condensing heat exchanger, and this recovered heat is used to supply space heating. This heat is carried out through fan coils or radiators distributed throughout the caravan.
Thus, the generator unit produces electricity only while the Stirling engine is running. This electricity can be used directly or it can be stored in batteries. Additionally, the production of electricity is linked to the production of heat. Although the production of heat is not linked to the generation of electricity, in this work, it will be assumed that the accumulation of electricity in the batteries will avoid the production of heat alone.
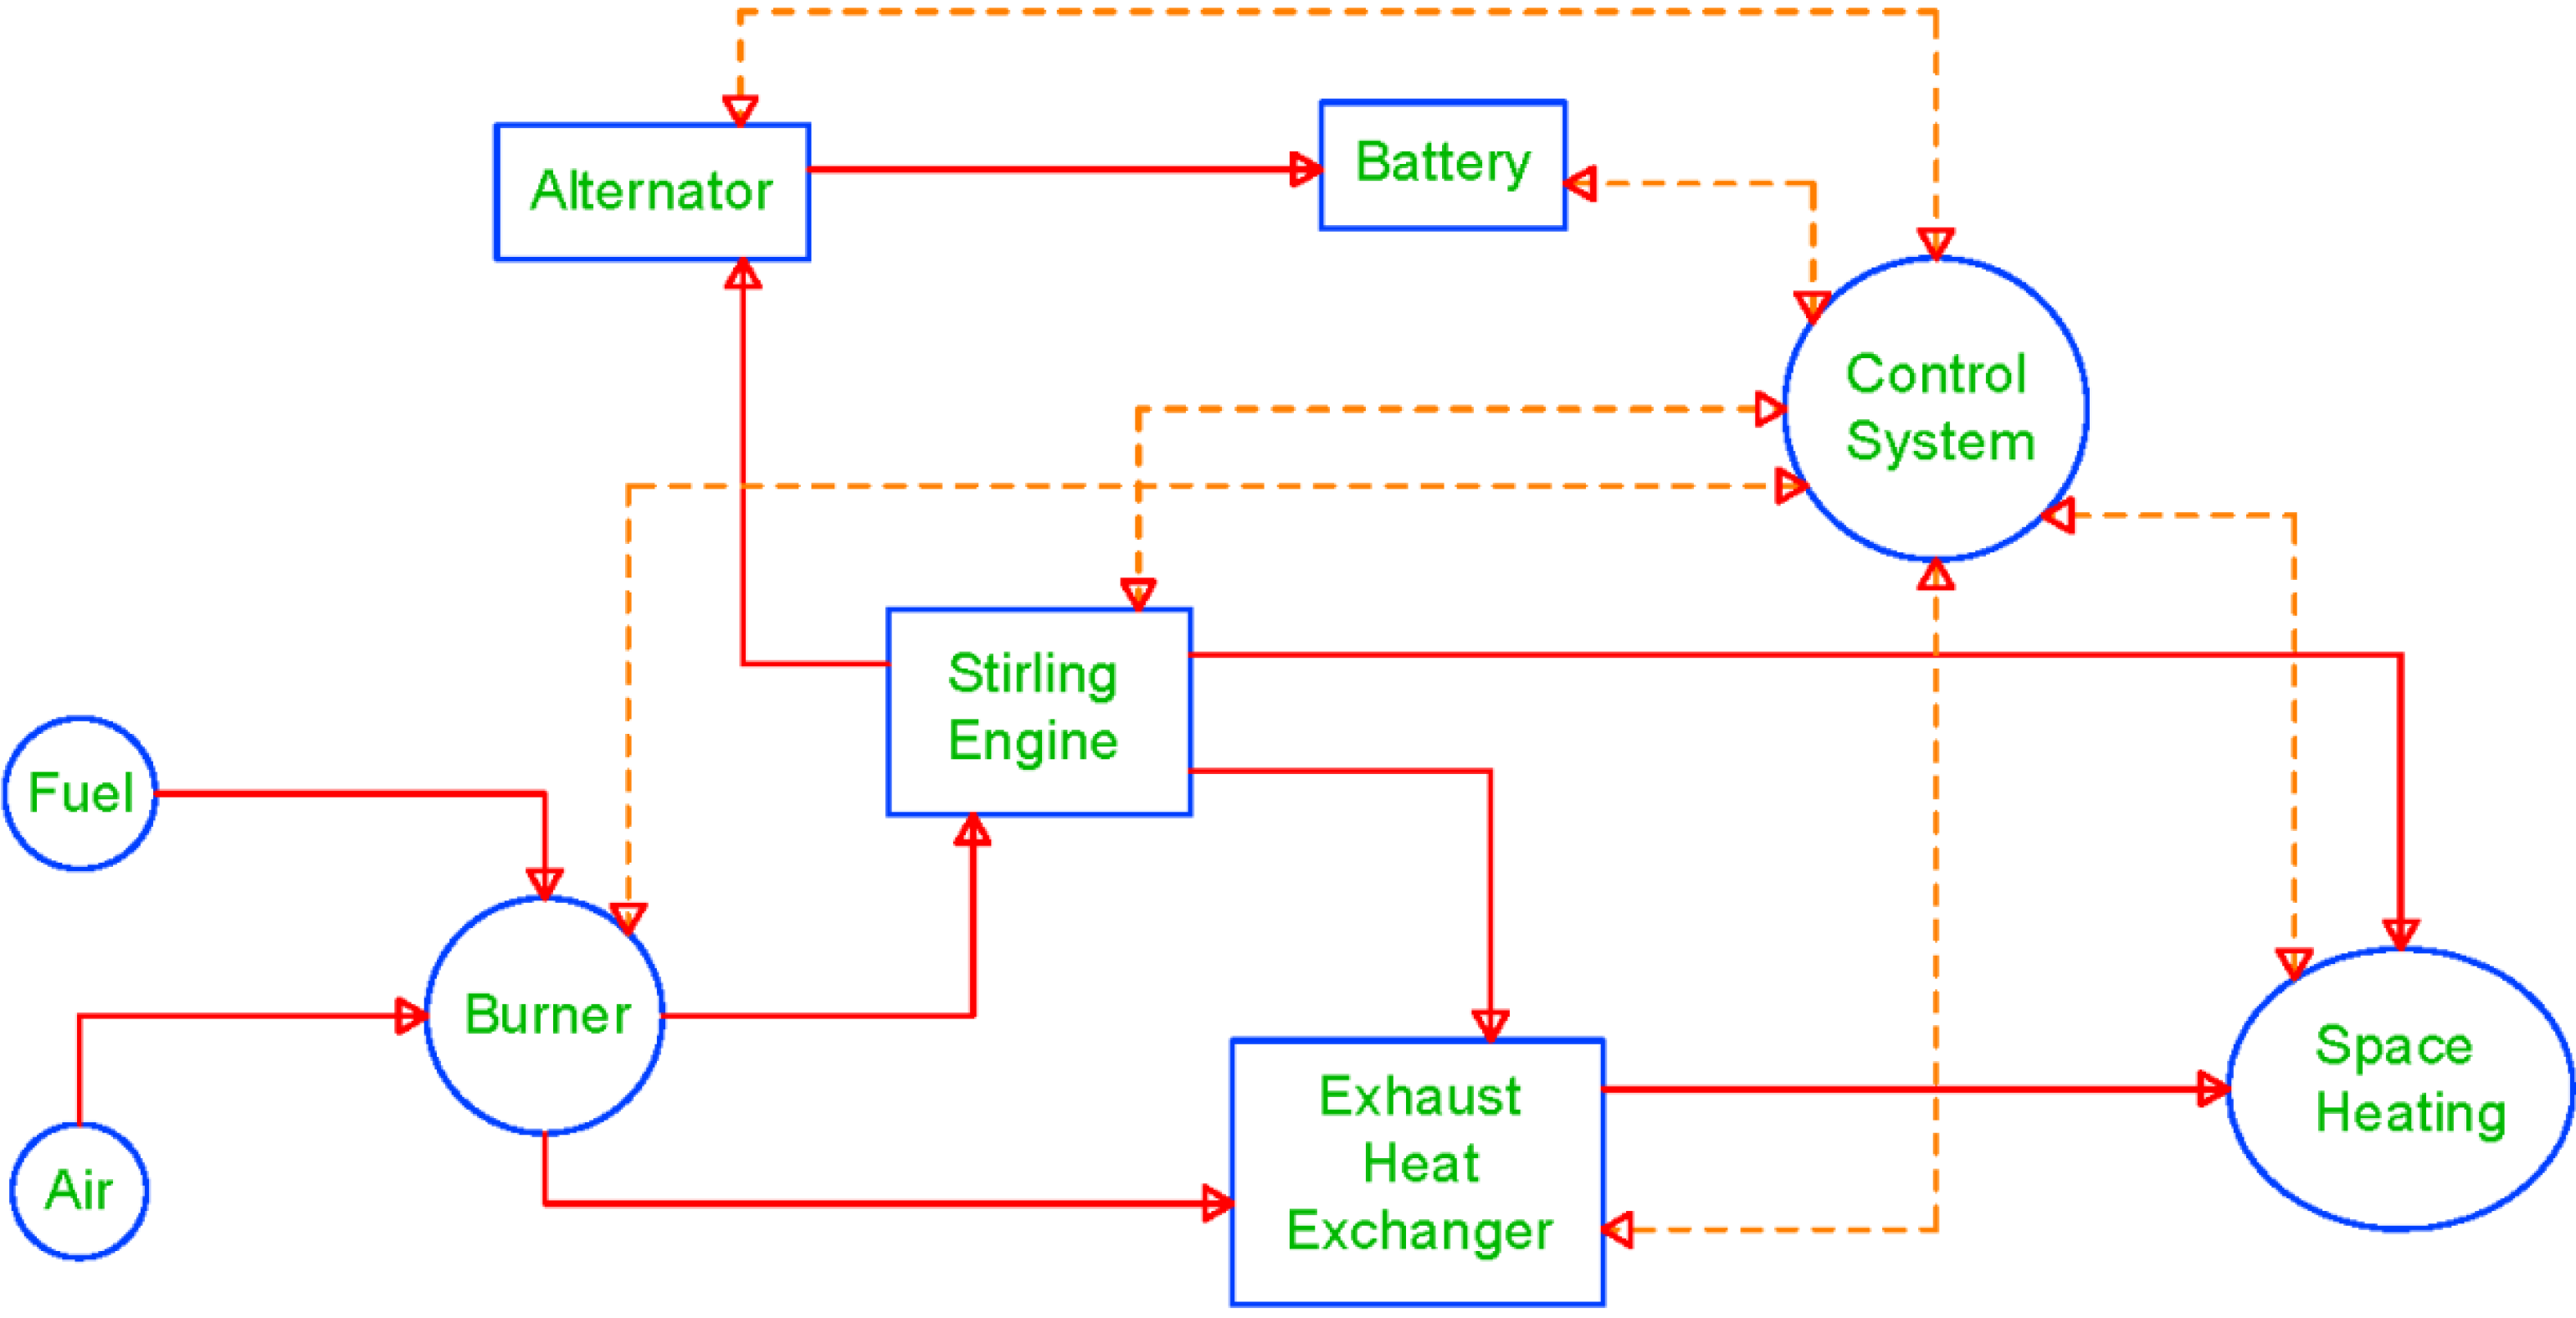
The working parameters are controlled by a microprocessor to maintain the engine in the optimal running condition and to maximize the obtained efficiencies as shown in Figure 1.
An inverter is used to convert DC into AC depending on the current electrical needs. For optimal functioning of the SE, the cold source should be kept as cold as possible. Some SEs use a secondary refrigeration circuit to maintain the cold source temperature below a fixed value in the event that the cold source temperature is not low enough. In such systems, the use of such a secondary refrigeration circuit has to be considered a heat rejection.
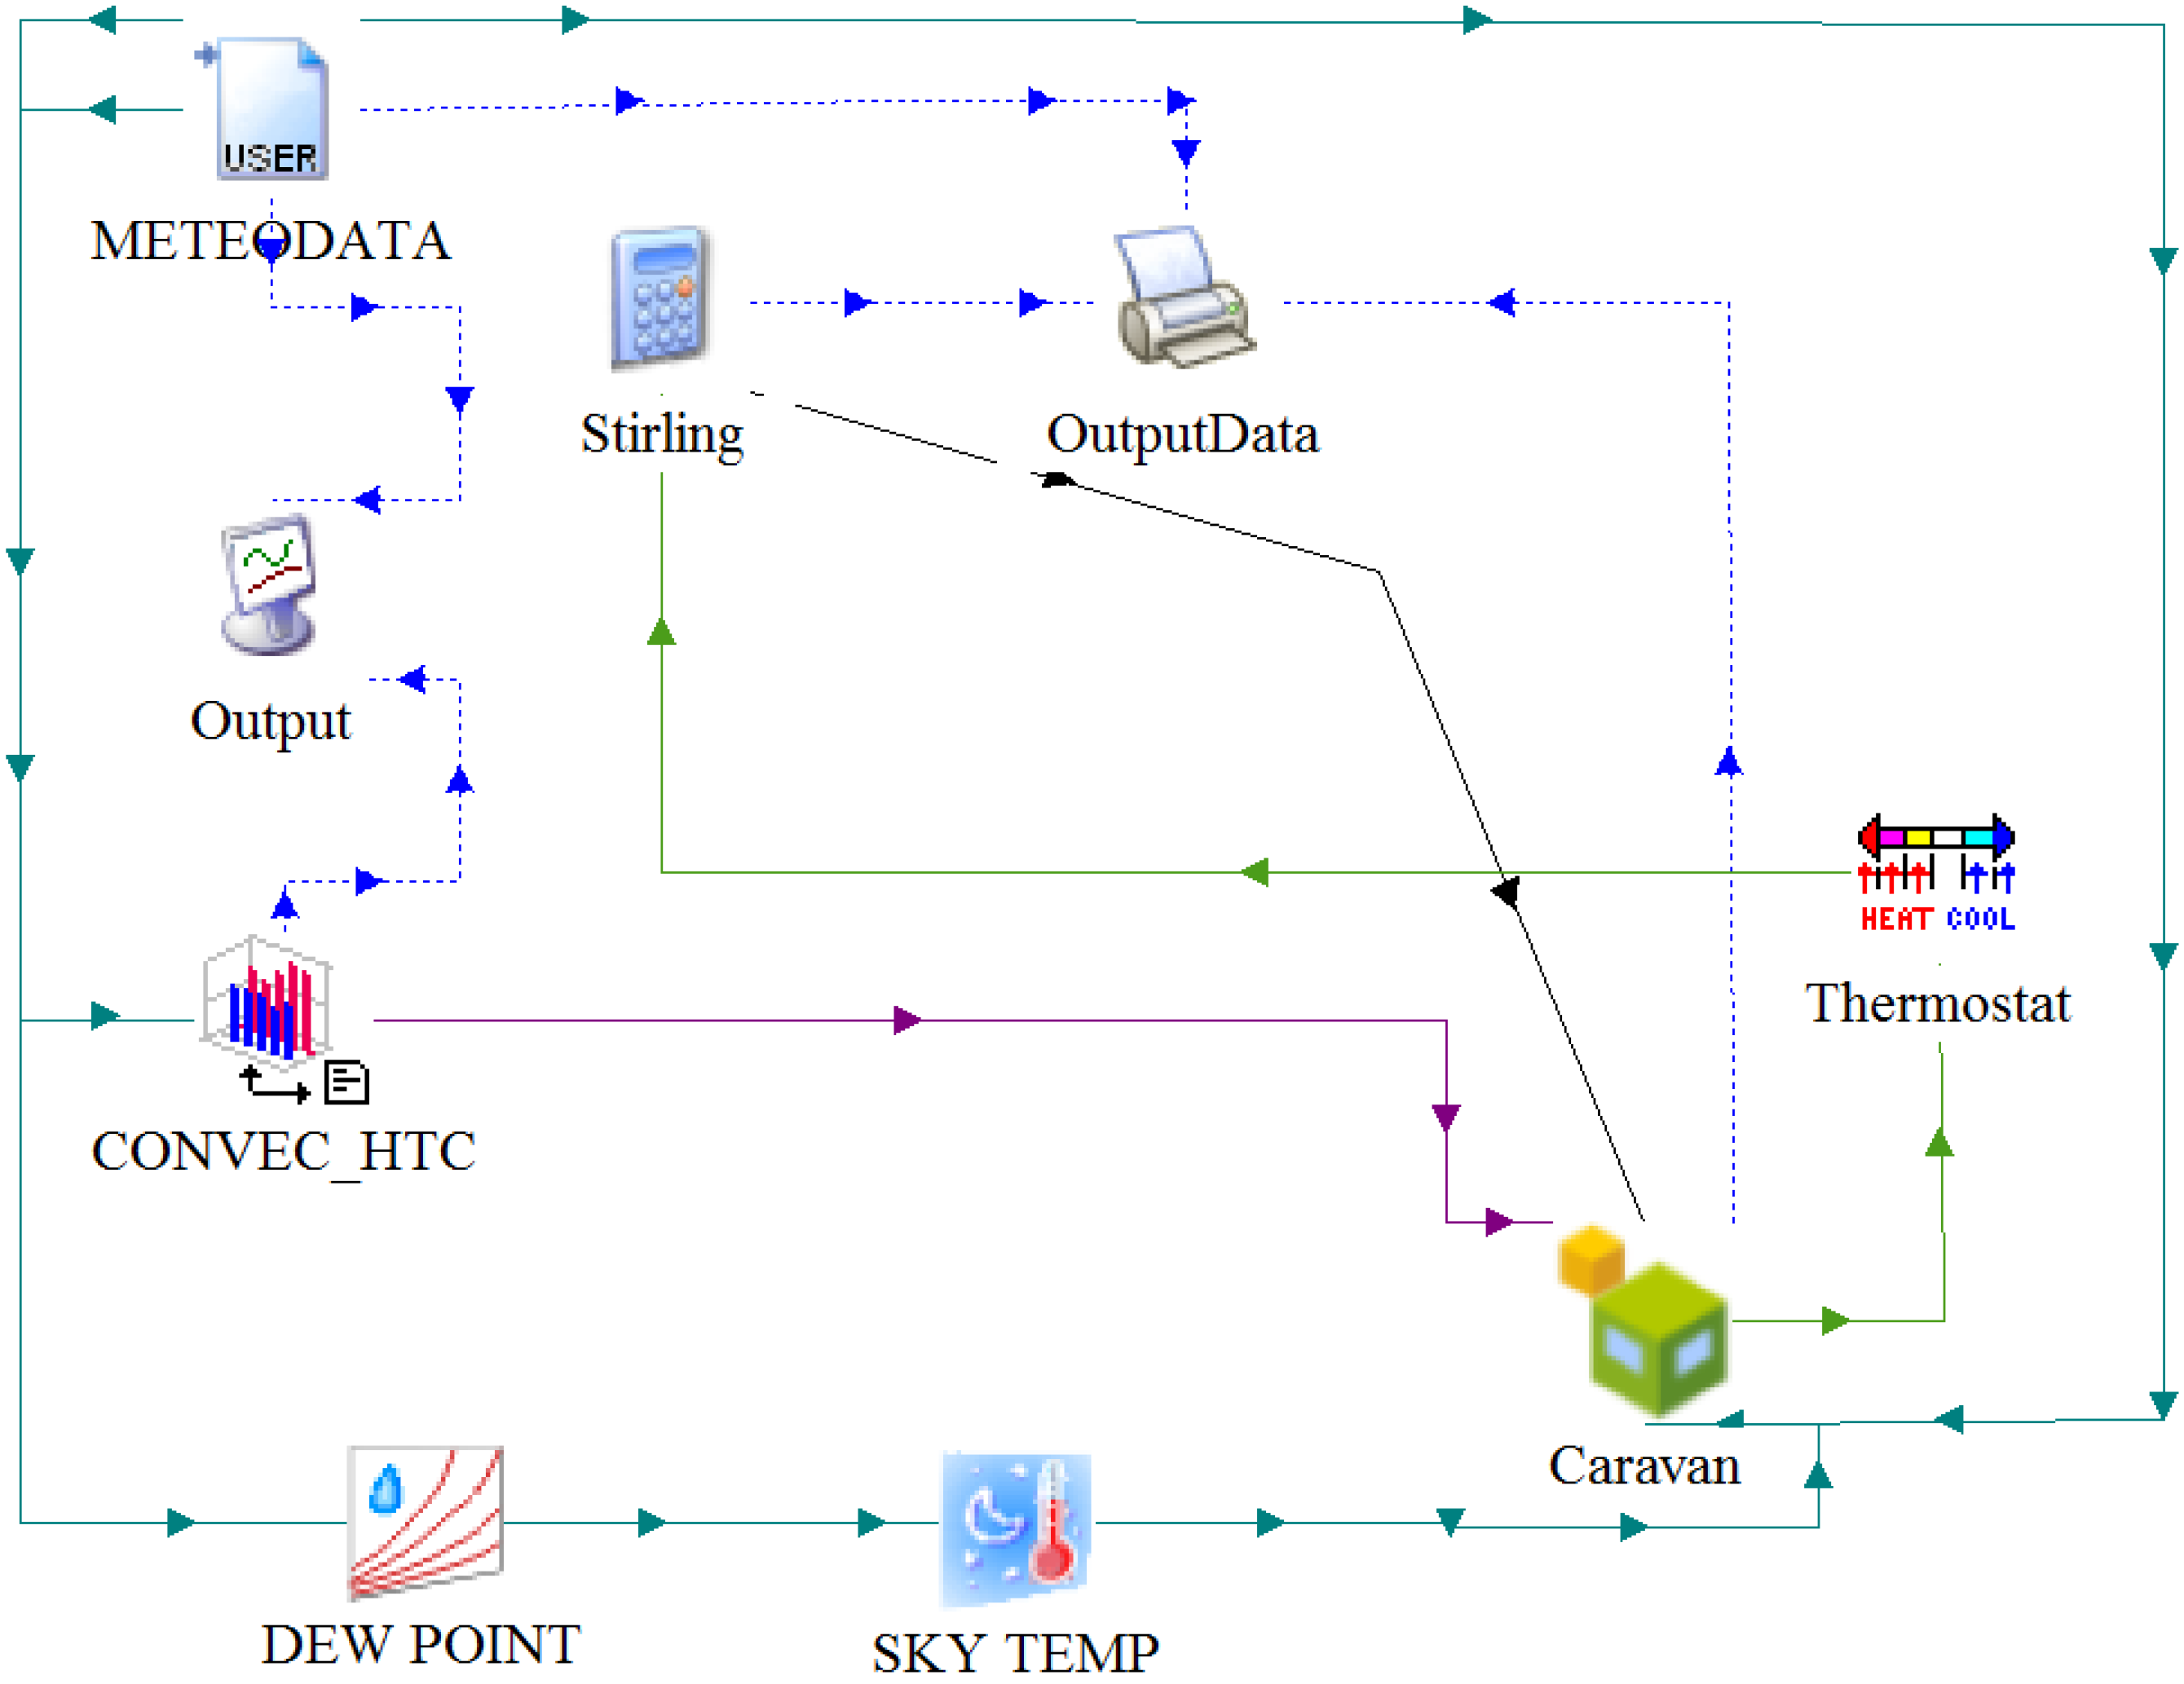
Figure 1. Operational scheme of the Stirling CHP system.
Energies 06 00717 g001

2.1.3. Running Modes

The SE employed can operate in two Heat Management Modes (HMM). If the HMM is on, the SE is commanded by a temperature set point. Otherwise, if the HMM is off, the system will run for a user-defined number of hours, or at least as long as the batteries are capable of absorbing the electricity produced (this mode is also called Autocharging). This Autocharging mode turns on the SE when the batteries’ charge level reaches a pre-set minimum value and stops when the batteries are completely charged or when a pre-set maximum number of running hours has been reached. As long as the HMM is off, the production of heat is considered a side-effect and the excess heat may therefore be rejected if necessary.
During the tests, the selected HMM was off in order to carry out the experiments with different electrical loads for studying the SE behavior. During this working mode, the heat produced by the SE was collected by the coolant and delivered into the space heating mechanism. To avoid the loss of heat rejected by the secondary circuit, both cooling circuits were connected to the same heat-sink.
Additionally, the SE allows the control of the coolant temperature flowing out of the system to be between 45 and 70 °C. The selected set-point temperature during the experiments was 60 °C, as this was considered a standard value for the radiators or fan coils of caravans and recreational vehicles.

2.1.4. Experimental Procedure

A test bench was built for testing the SE. This test bench contains four principal circuits: cogeneration system SE, hydraulic circuit, electrical circuit, and data acquisition system.
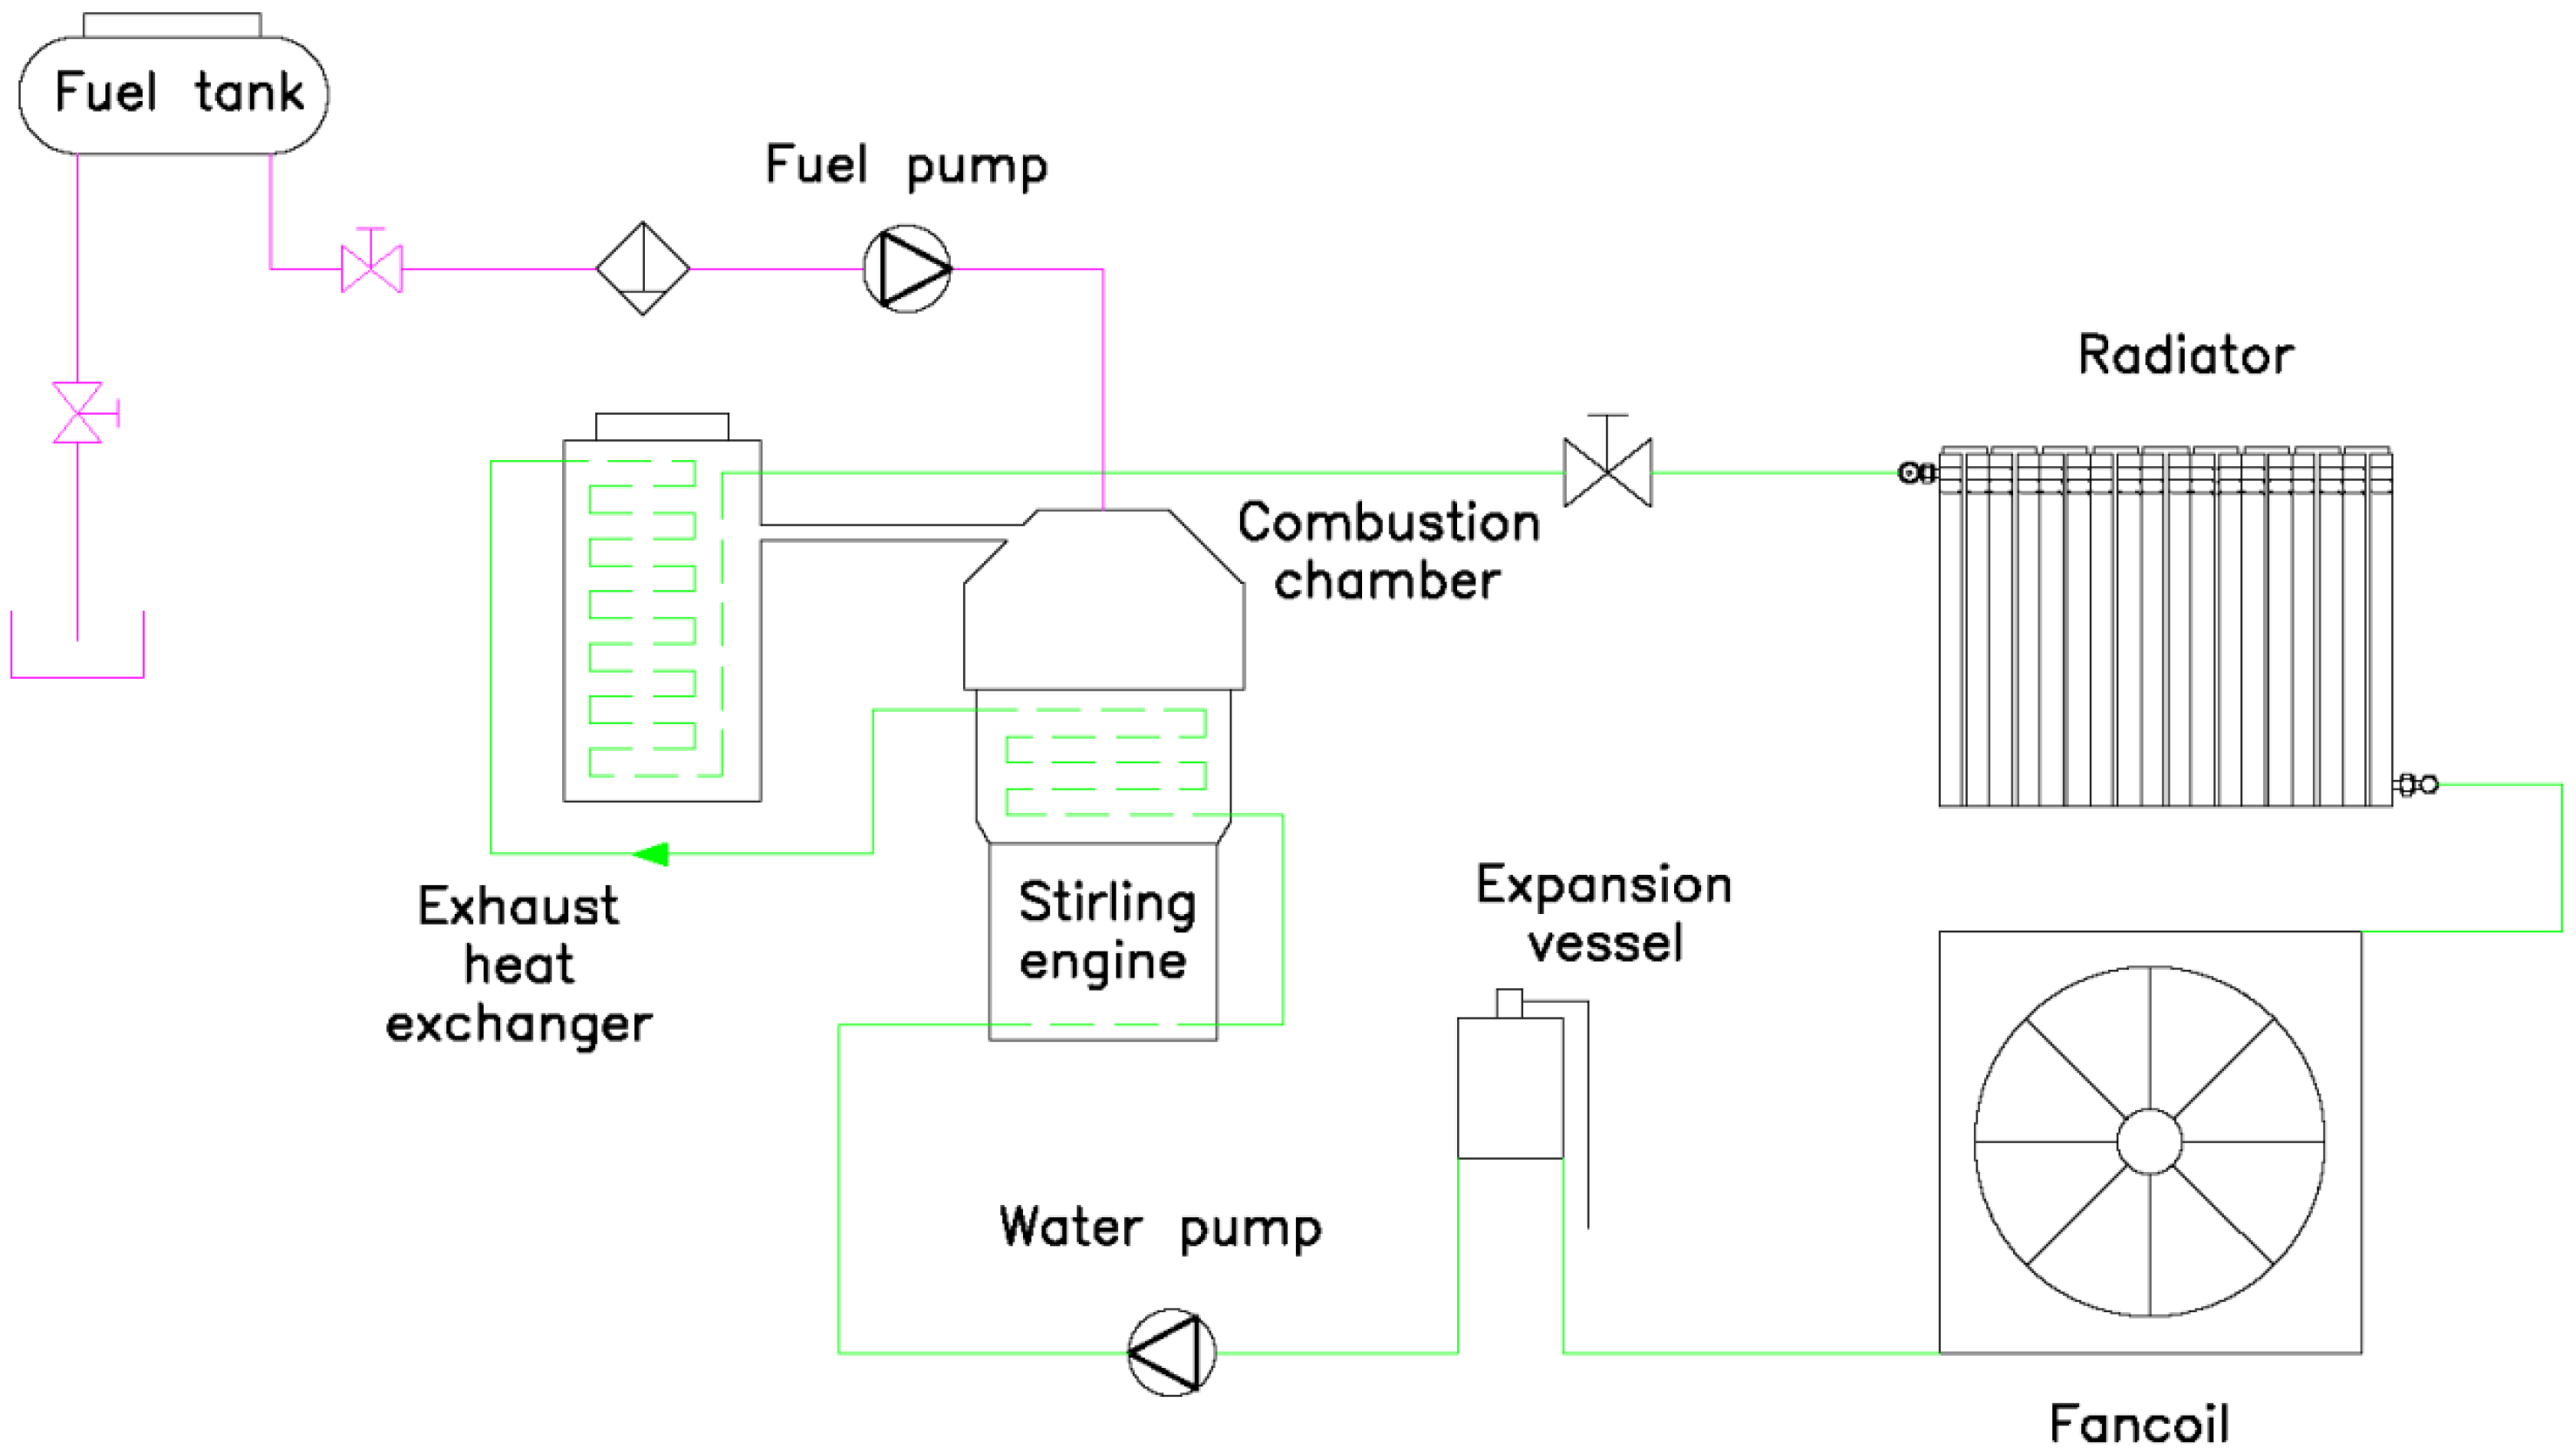
Essentially, the SE produces electricity and heat. Afterwards, the electric and the hydraulic circuits utilize these products to meet the needs of the caravan. The most important components are represented in Figure 2.
Figure 2. Schematic of the SE experimental setup.
Energies 06 00717 g002
The SE has been tested in the laboratory to obtain the nominal working parameters. For this purpose, the cogeneration system was subjected to different electrical loads. When the cogeneration system is turned on, the diesel is first burnt in the combustion chamber. This fuel supplies the necessary energy for expanding the nitrogen from the SE. The coolant inside the engine block provokes cooling of the nitrogen, and when the temperature difference between the hot and cold source is enough to expand and condense the nitrogen, the Stirling machine starts to turn. It has been observed that thanks to the reduced dimensions of this engine and the minimal thermal inertia, the heat source quickly reaches the nominal temperature; therefore, the system tends to predominately operate in a steady state. The electricity coming from the generator is stored in two 12 V DC and 100 Ah batteries connected in series. This electrical energy can be directly used in 24 V DC applications.
The coolant captures the heat from the engine block. Next, the coolant is carried through the exhaust gas by means of a condensing heat exchanger, and any extra energy is obtained. The exhaust gas temperature is maintained at approximately 90 °C. Directly afterwards, the coolant passes through a radiator and through a fan coil and additional thermal energy is taken from the coolant. This thermal power is calculated by measuring both the flow rate via a flowmeter and the temperature difference between the SE input and the output via temperature sensors.
The batteries are connected to a variable electrical load, which, in this case, is composed of diverse 24 V halogen lamps. The combination of these lamps allows the modulation of the electrical load in fixed steps between 350 and 950 W, which will simulate different caravan electrical loads. The performance of the system was studied within the eight electrical loads presented in the next section. Additionally, the battery current (input and output) is continuously measured by means of a Hall Effect ammeter. Other parameters, such as coolant temperature, battery voltage, exhaust gases temperature, exhaust gas composition, fuel injection frequency, etc. are also measured. In addition, fuel consumption is obtained by continuously weighing the fuel reservoir.

2.1.5. Experimental Results

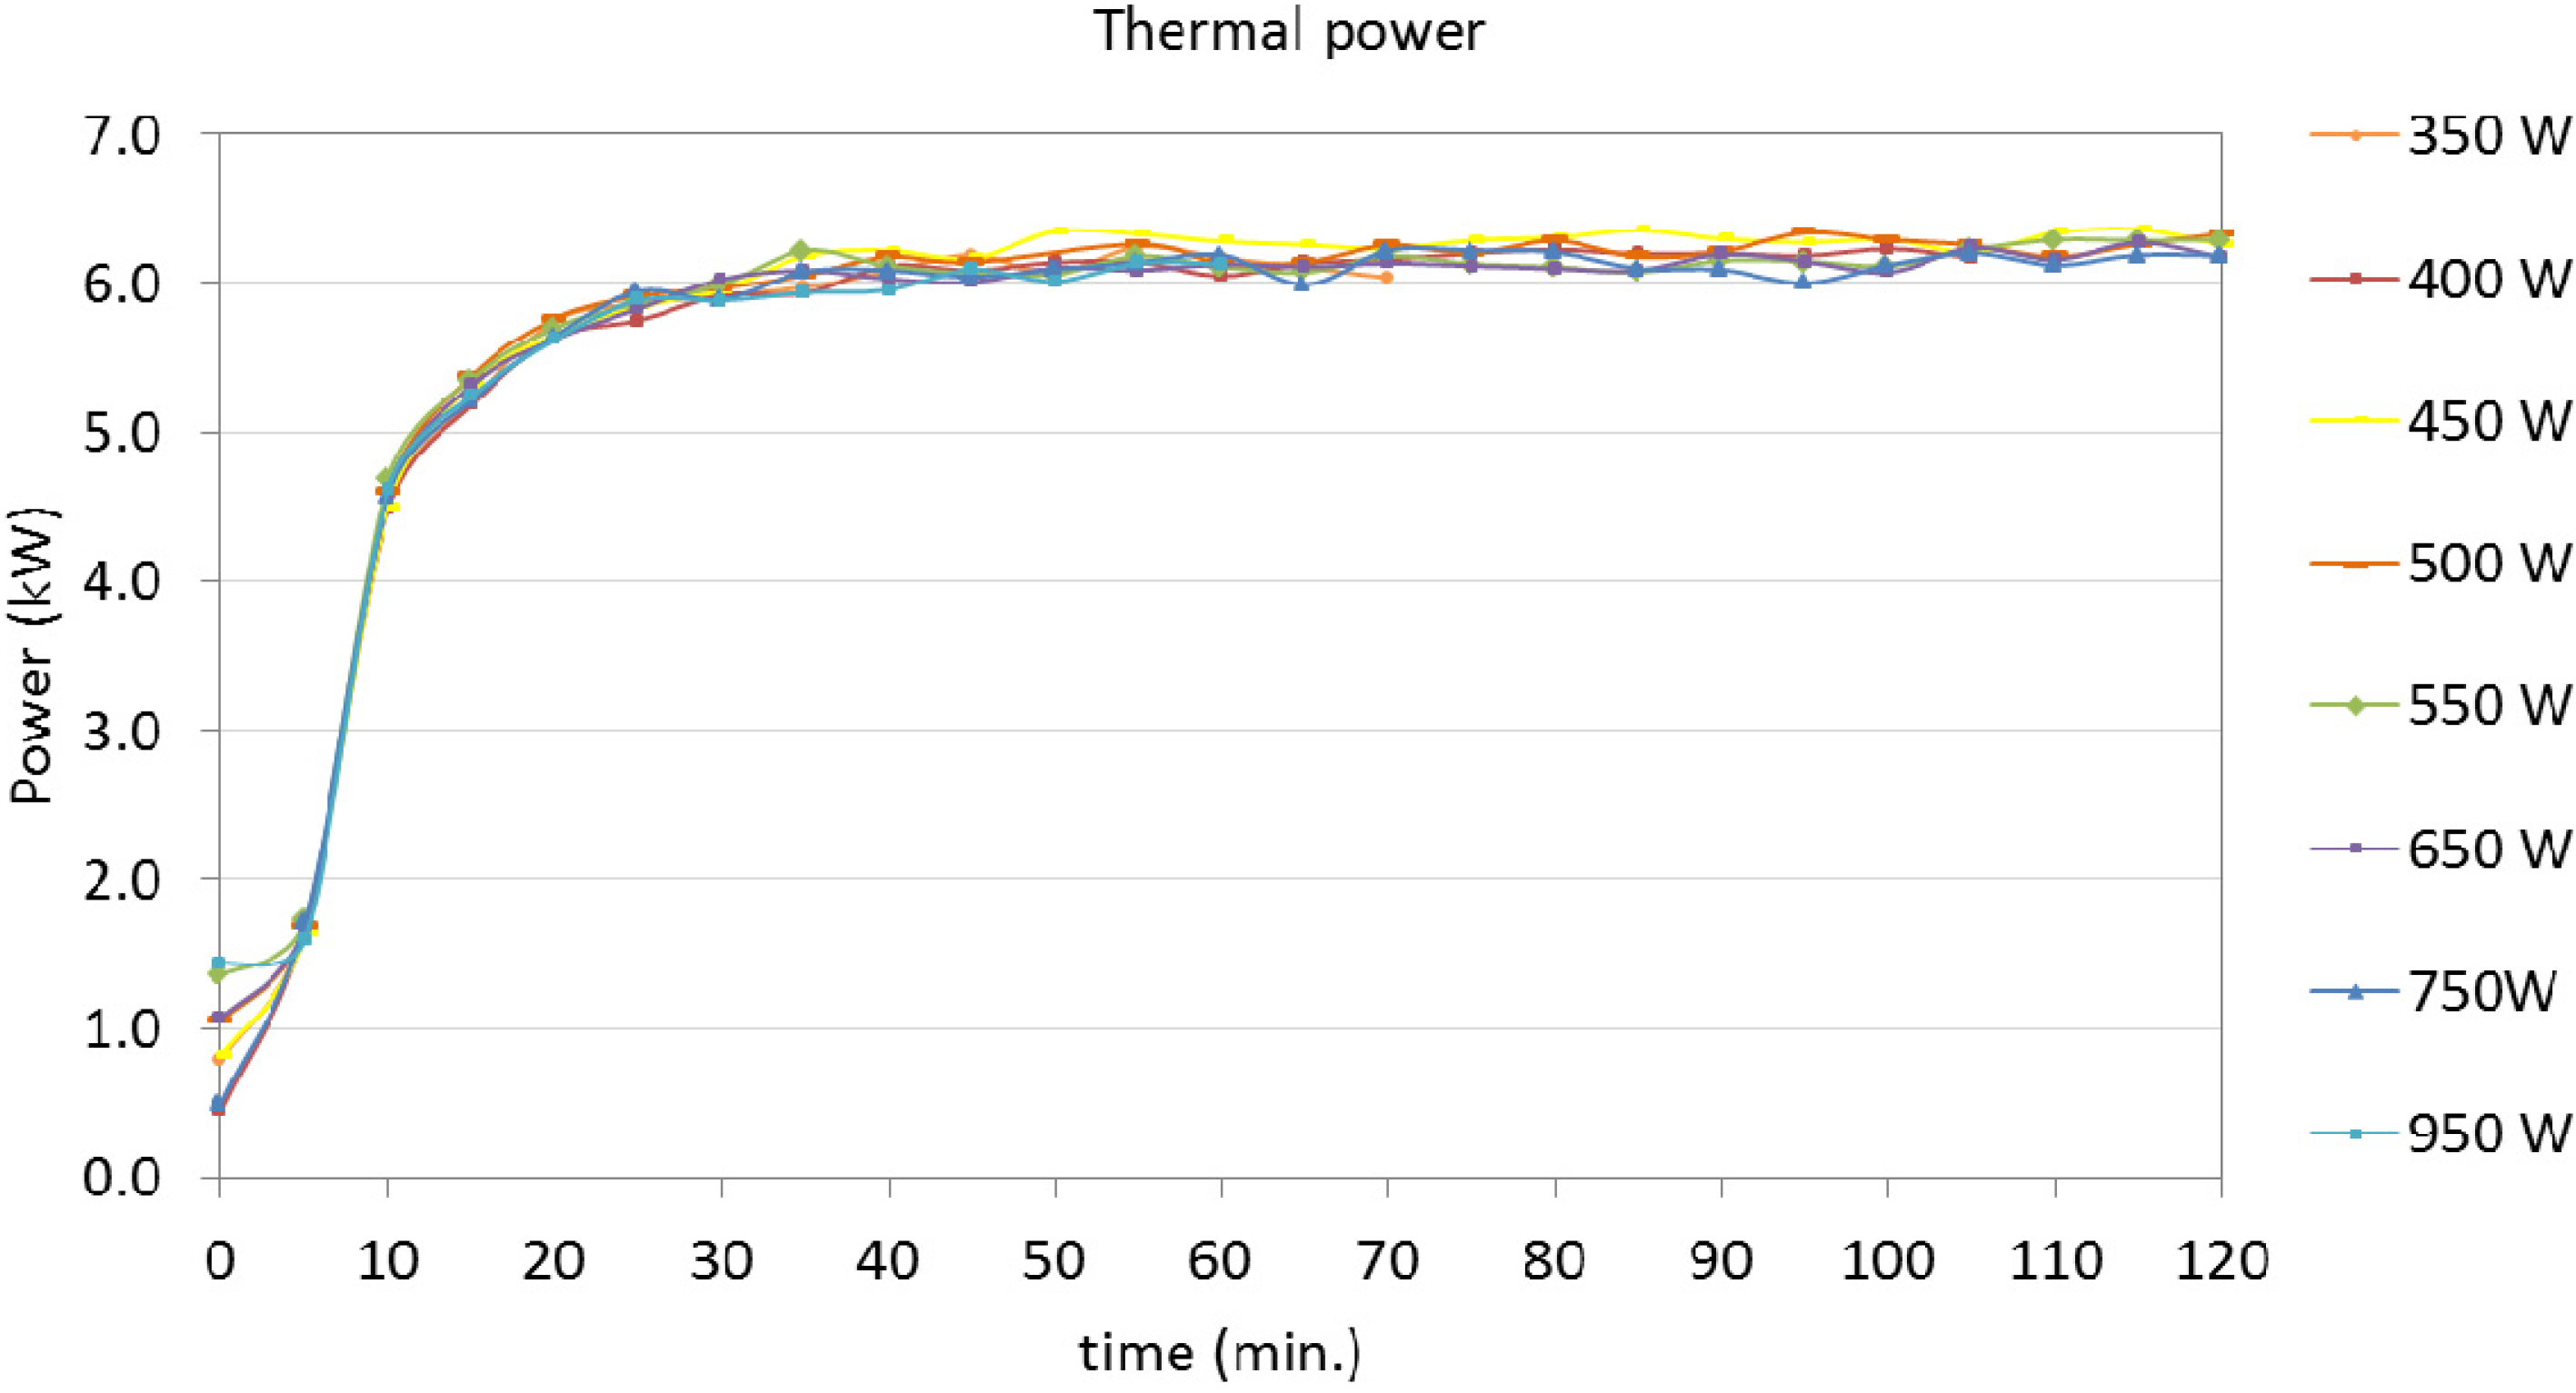
Table 1 presents the thermal and electrical power in steady state conditions for different electrical loads as well as the measured fuel consumption.
Table 1. Steady state results for different electric loads.
Test numberElectrical load (kW)Electrical power (kW)Thermal power (kW)Consumption (kg/h)
10.3500.9185.8510.647
20.4000.9195.9540.633
30.4500.9326.0950.637
40.5000.9336.0570.645
50.5500.9316.0160.643
60.6500.9295.9800.641
70.7500.9325.9780.642
80.9500.9045.7700.641
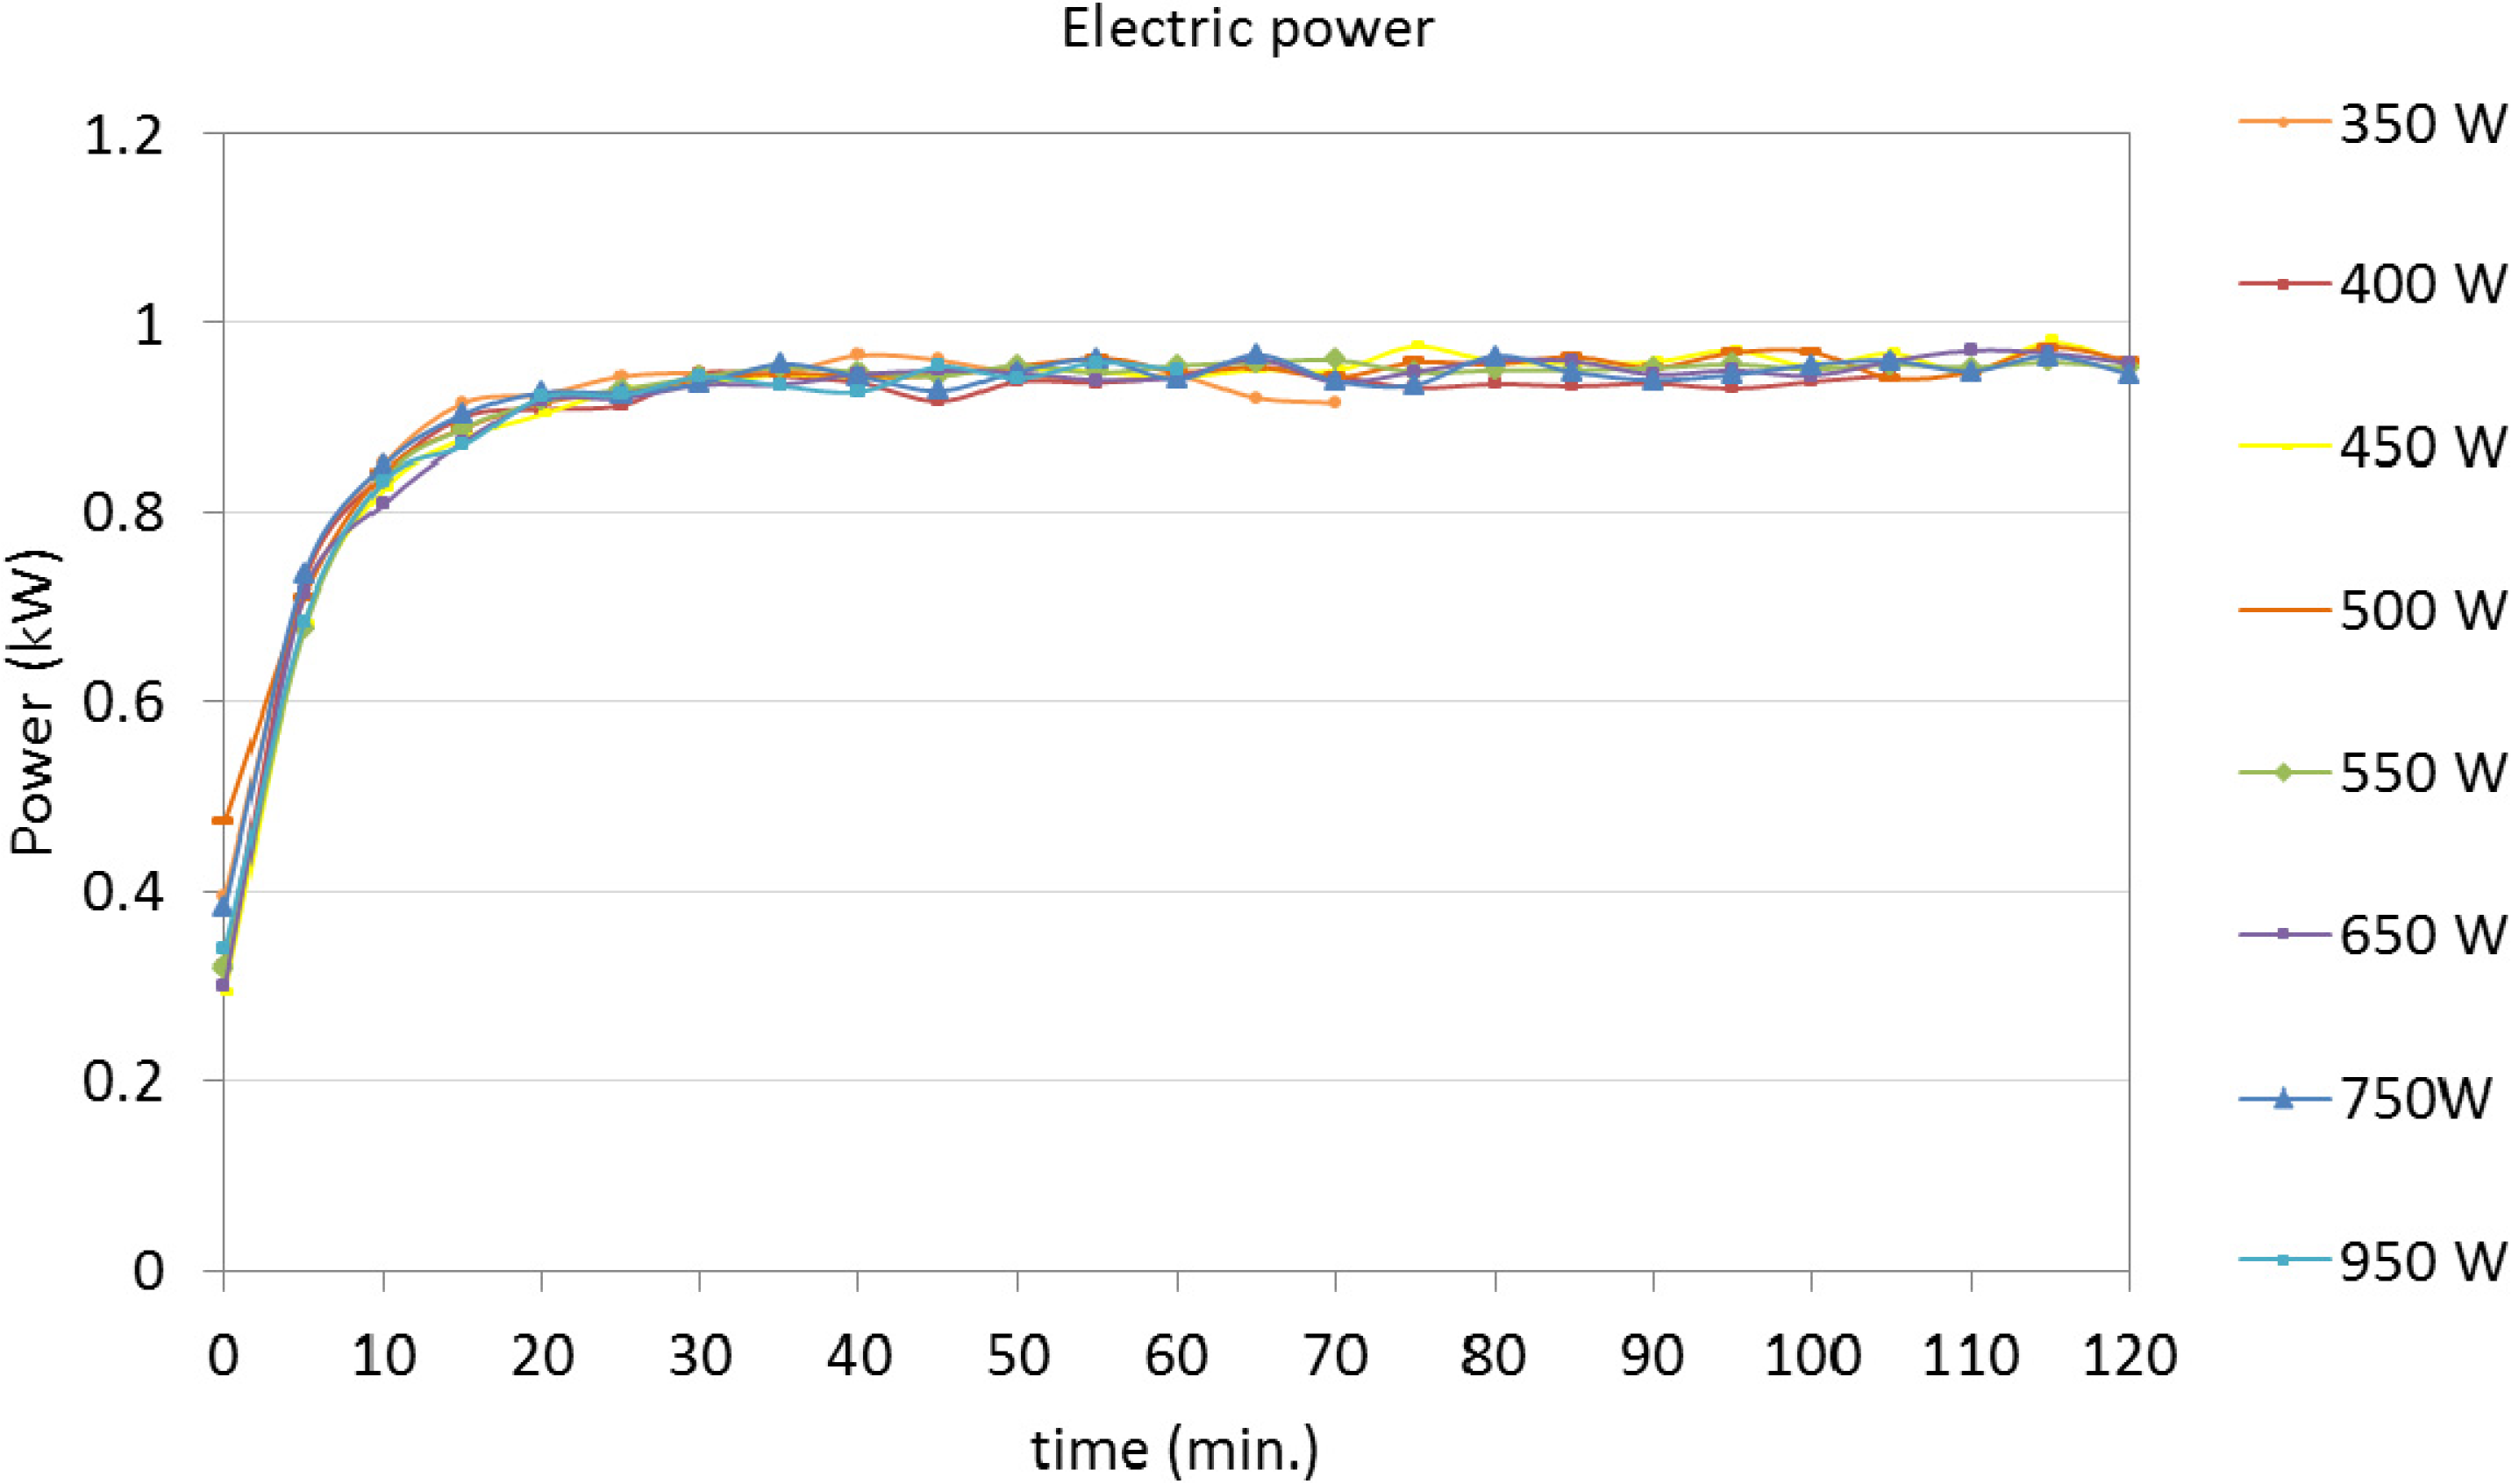
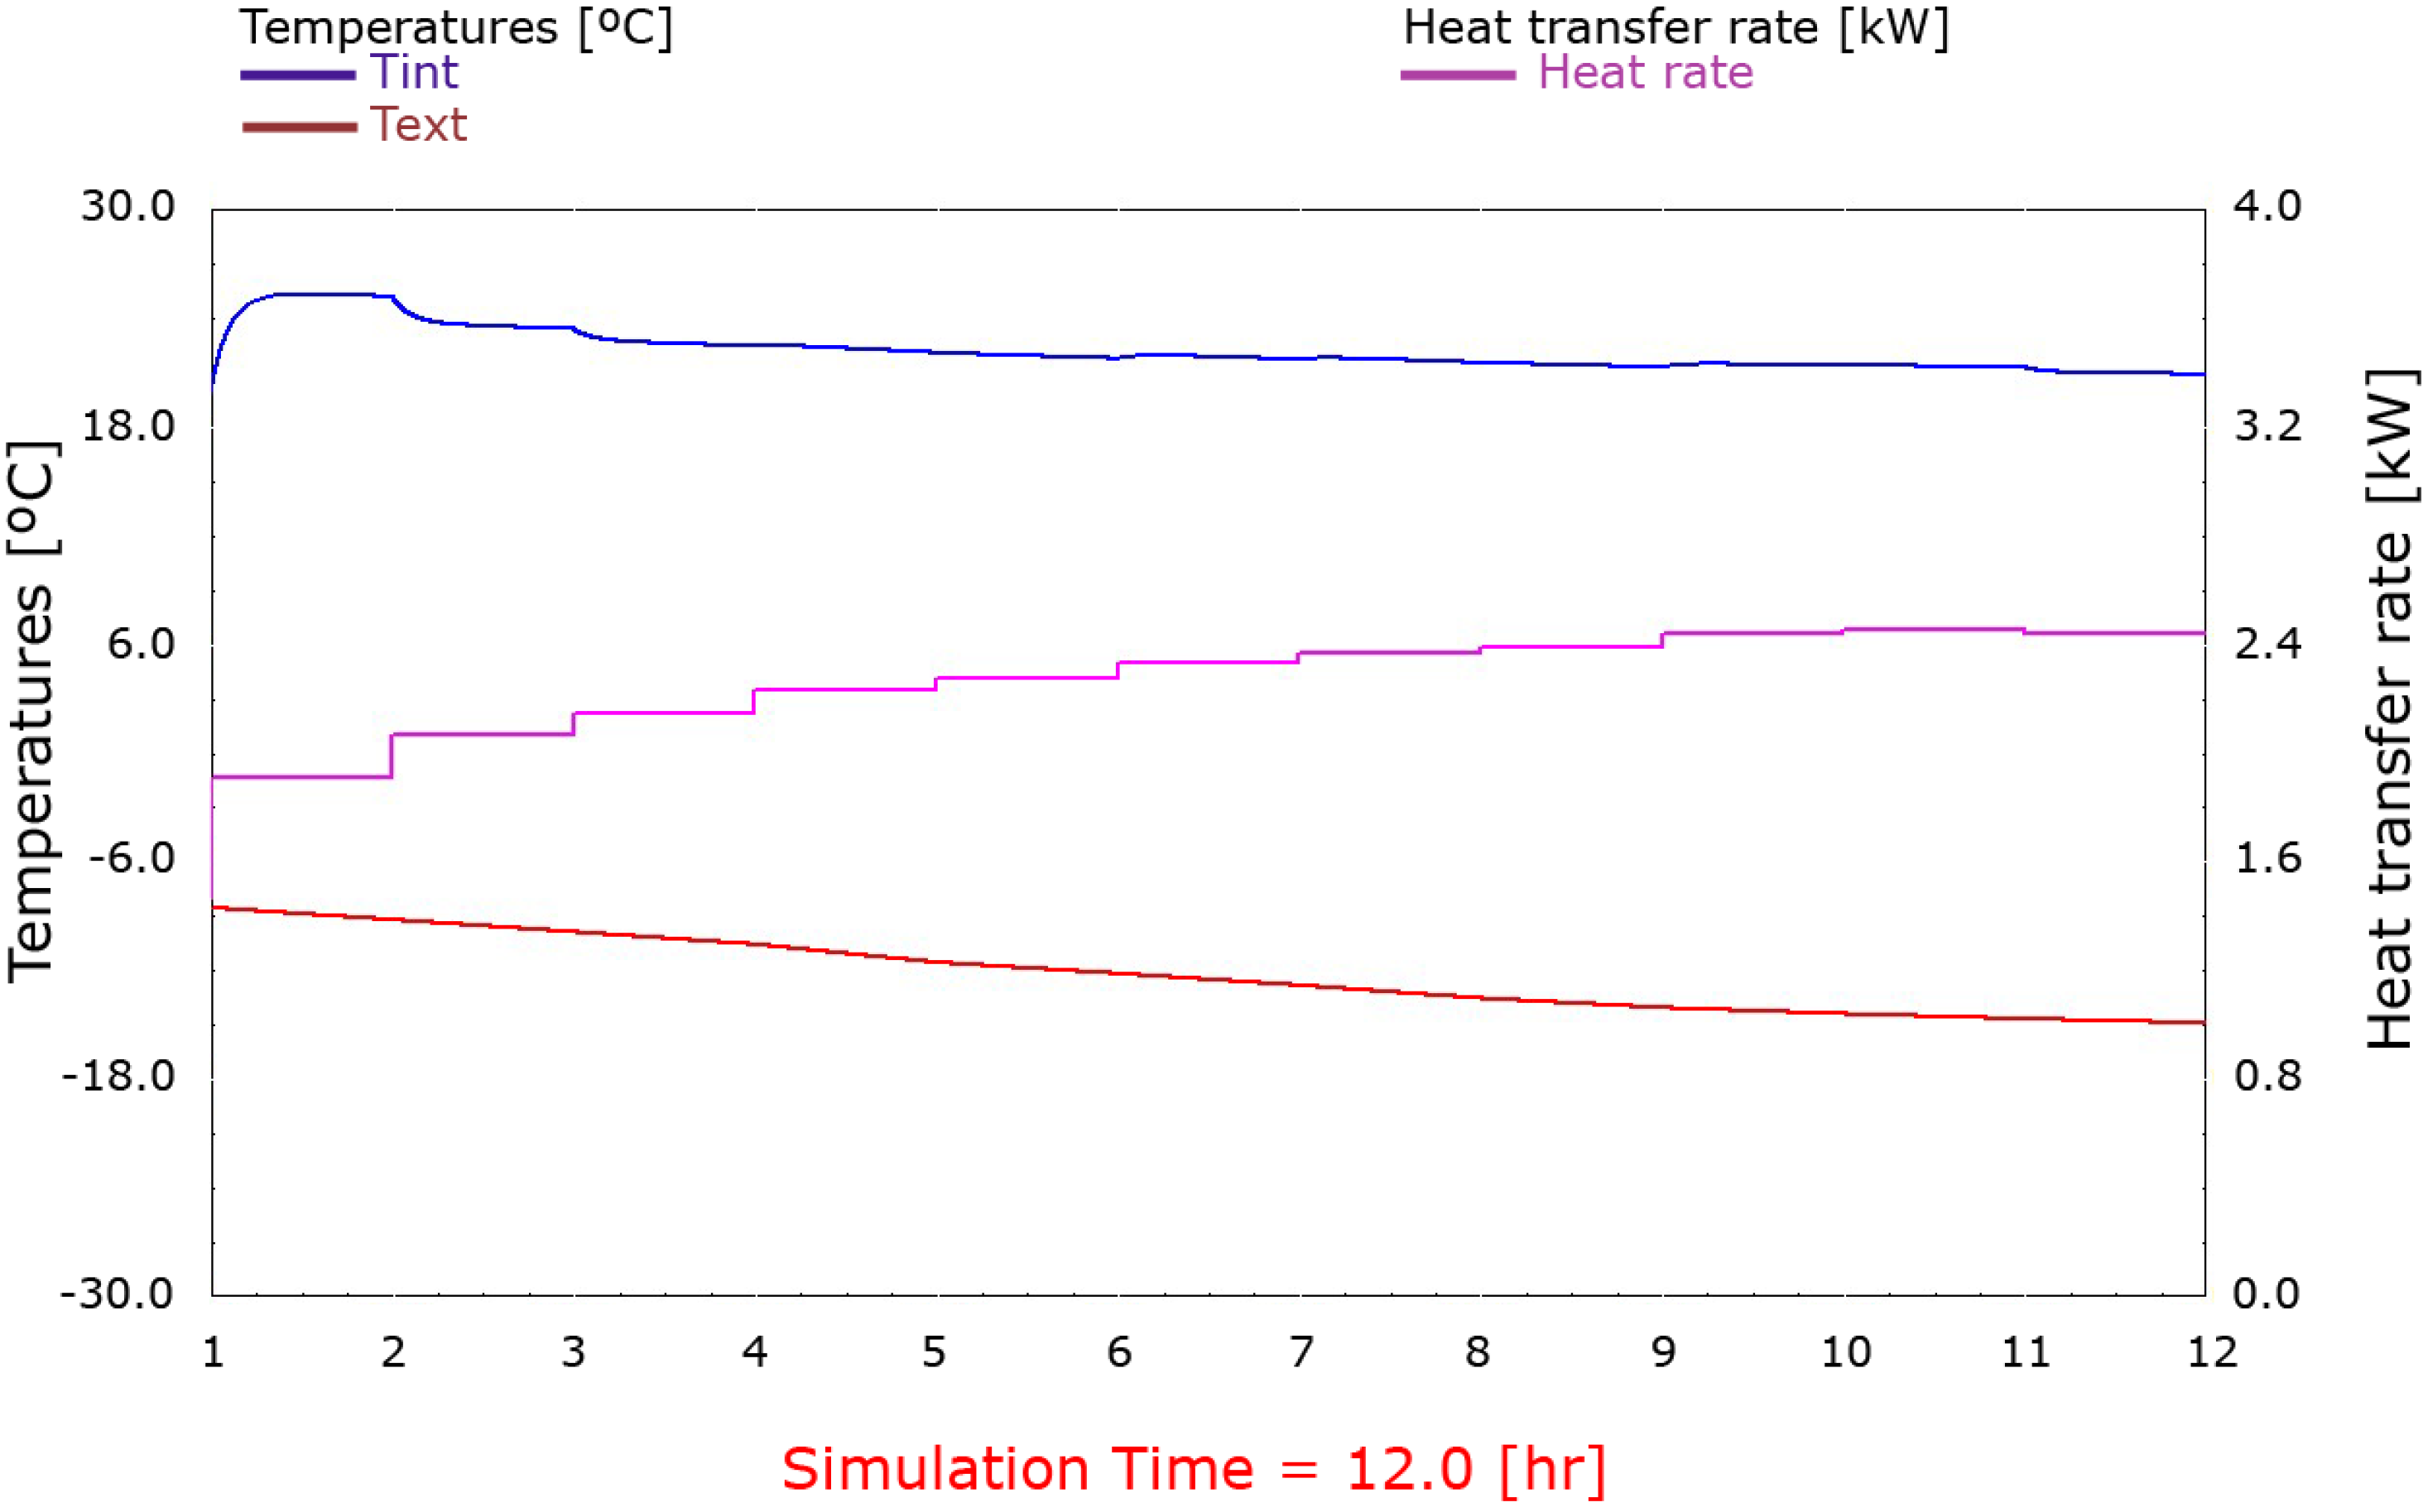
The electrical and thermal power results are presented in Figure 3 and Figure 4, respectively. As shown, the SE reaches a single operation mode independent of the electrical load, which means that these components tend to operate at their nominal power to produce the maximum amount of electricity possible. The possibility of accumulating any excess electricity in the batteries allows for this type of regulation.
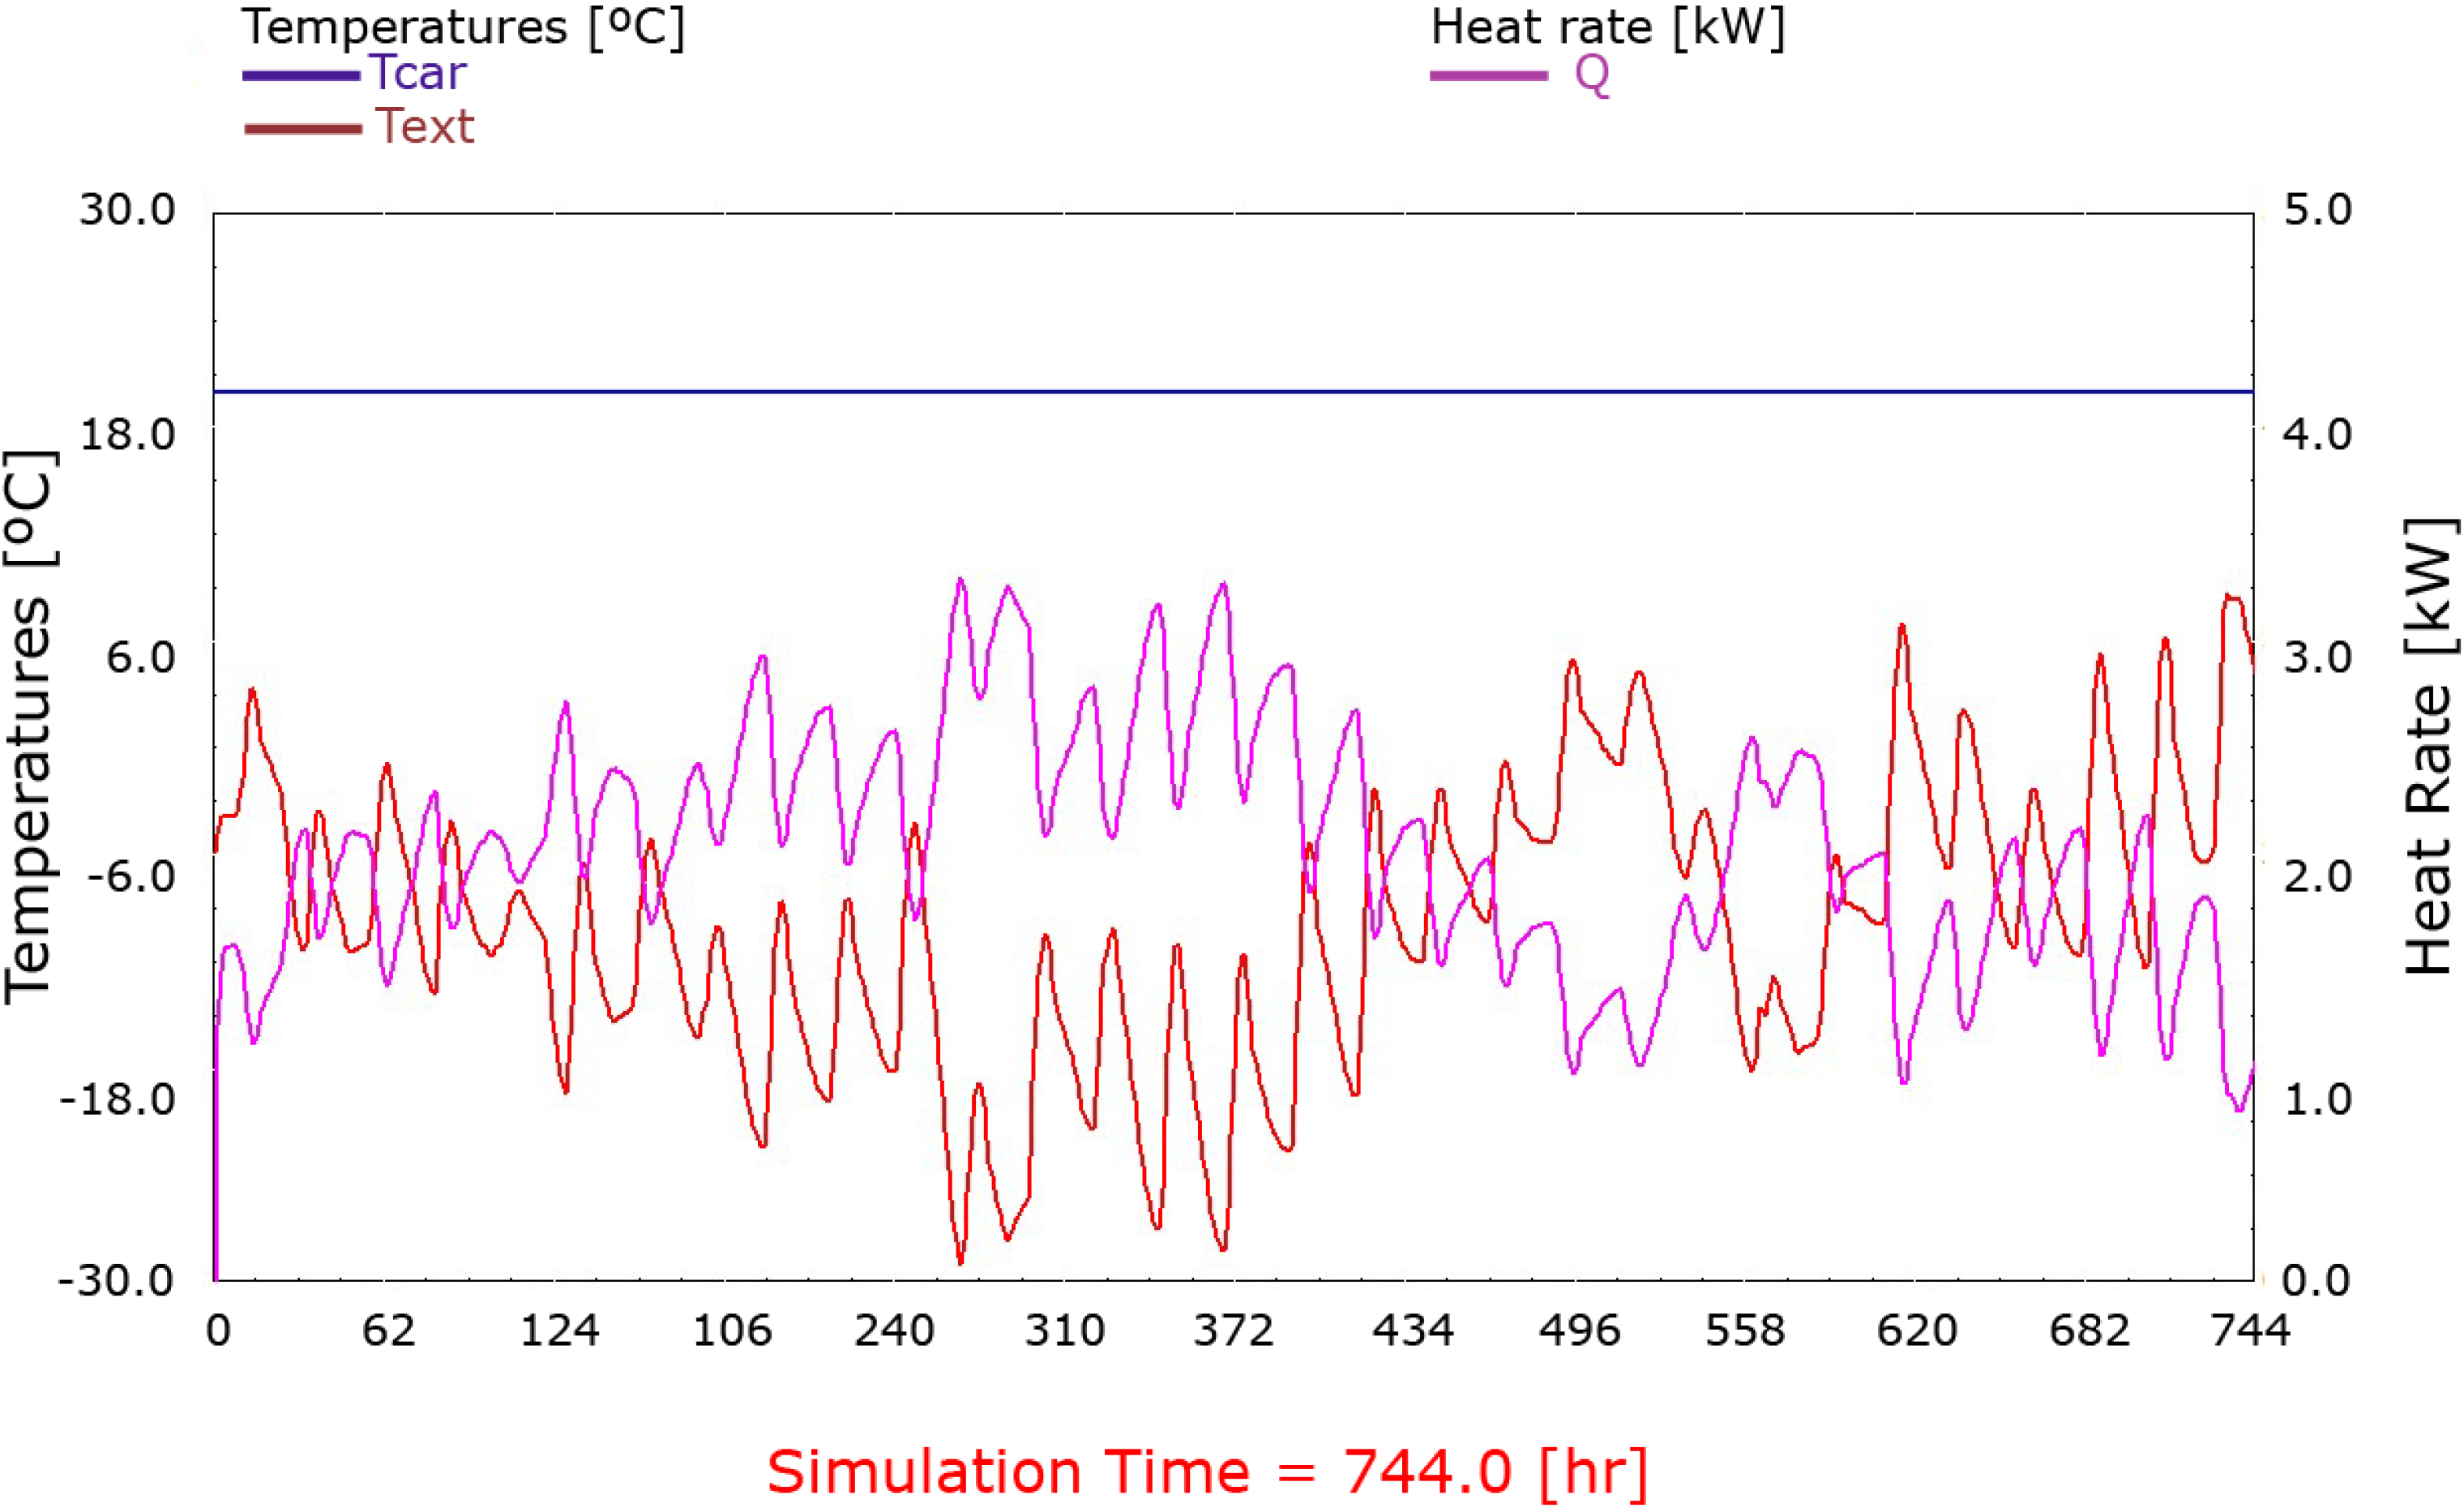
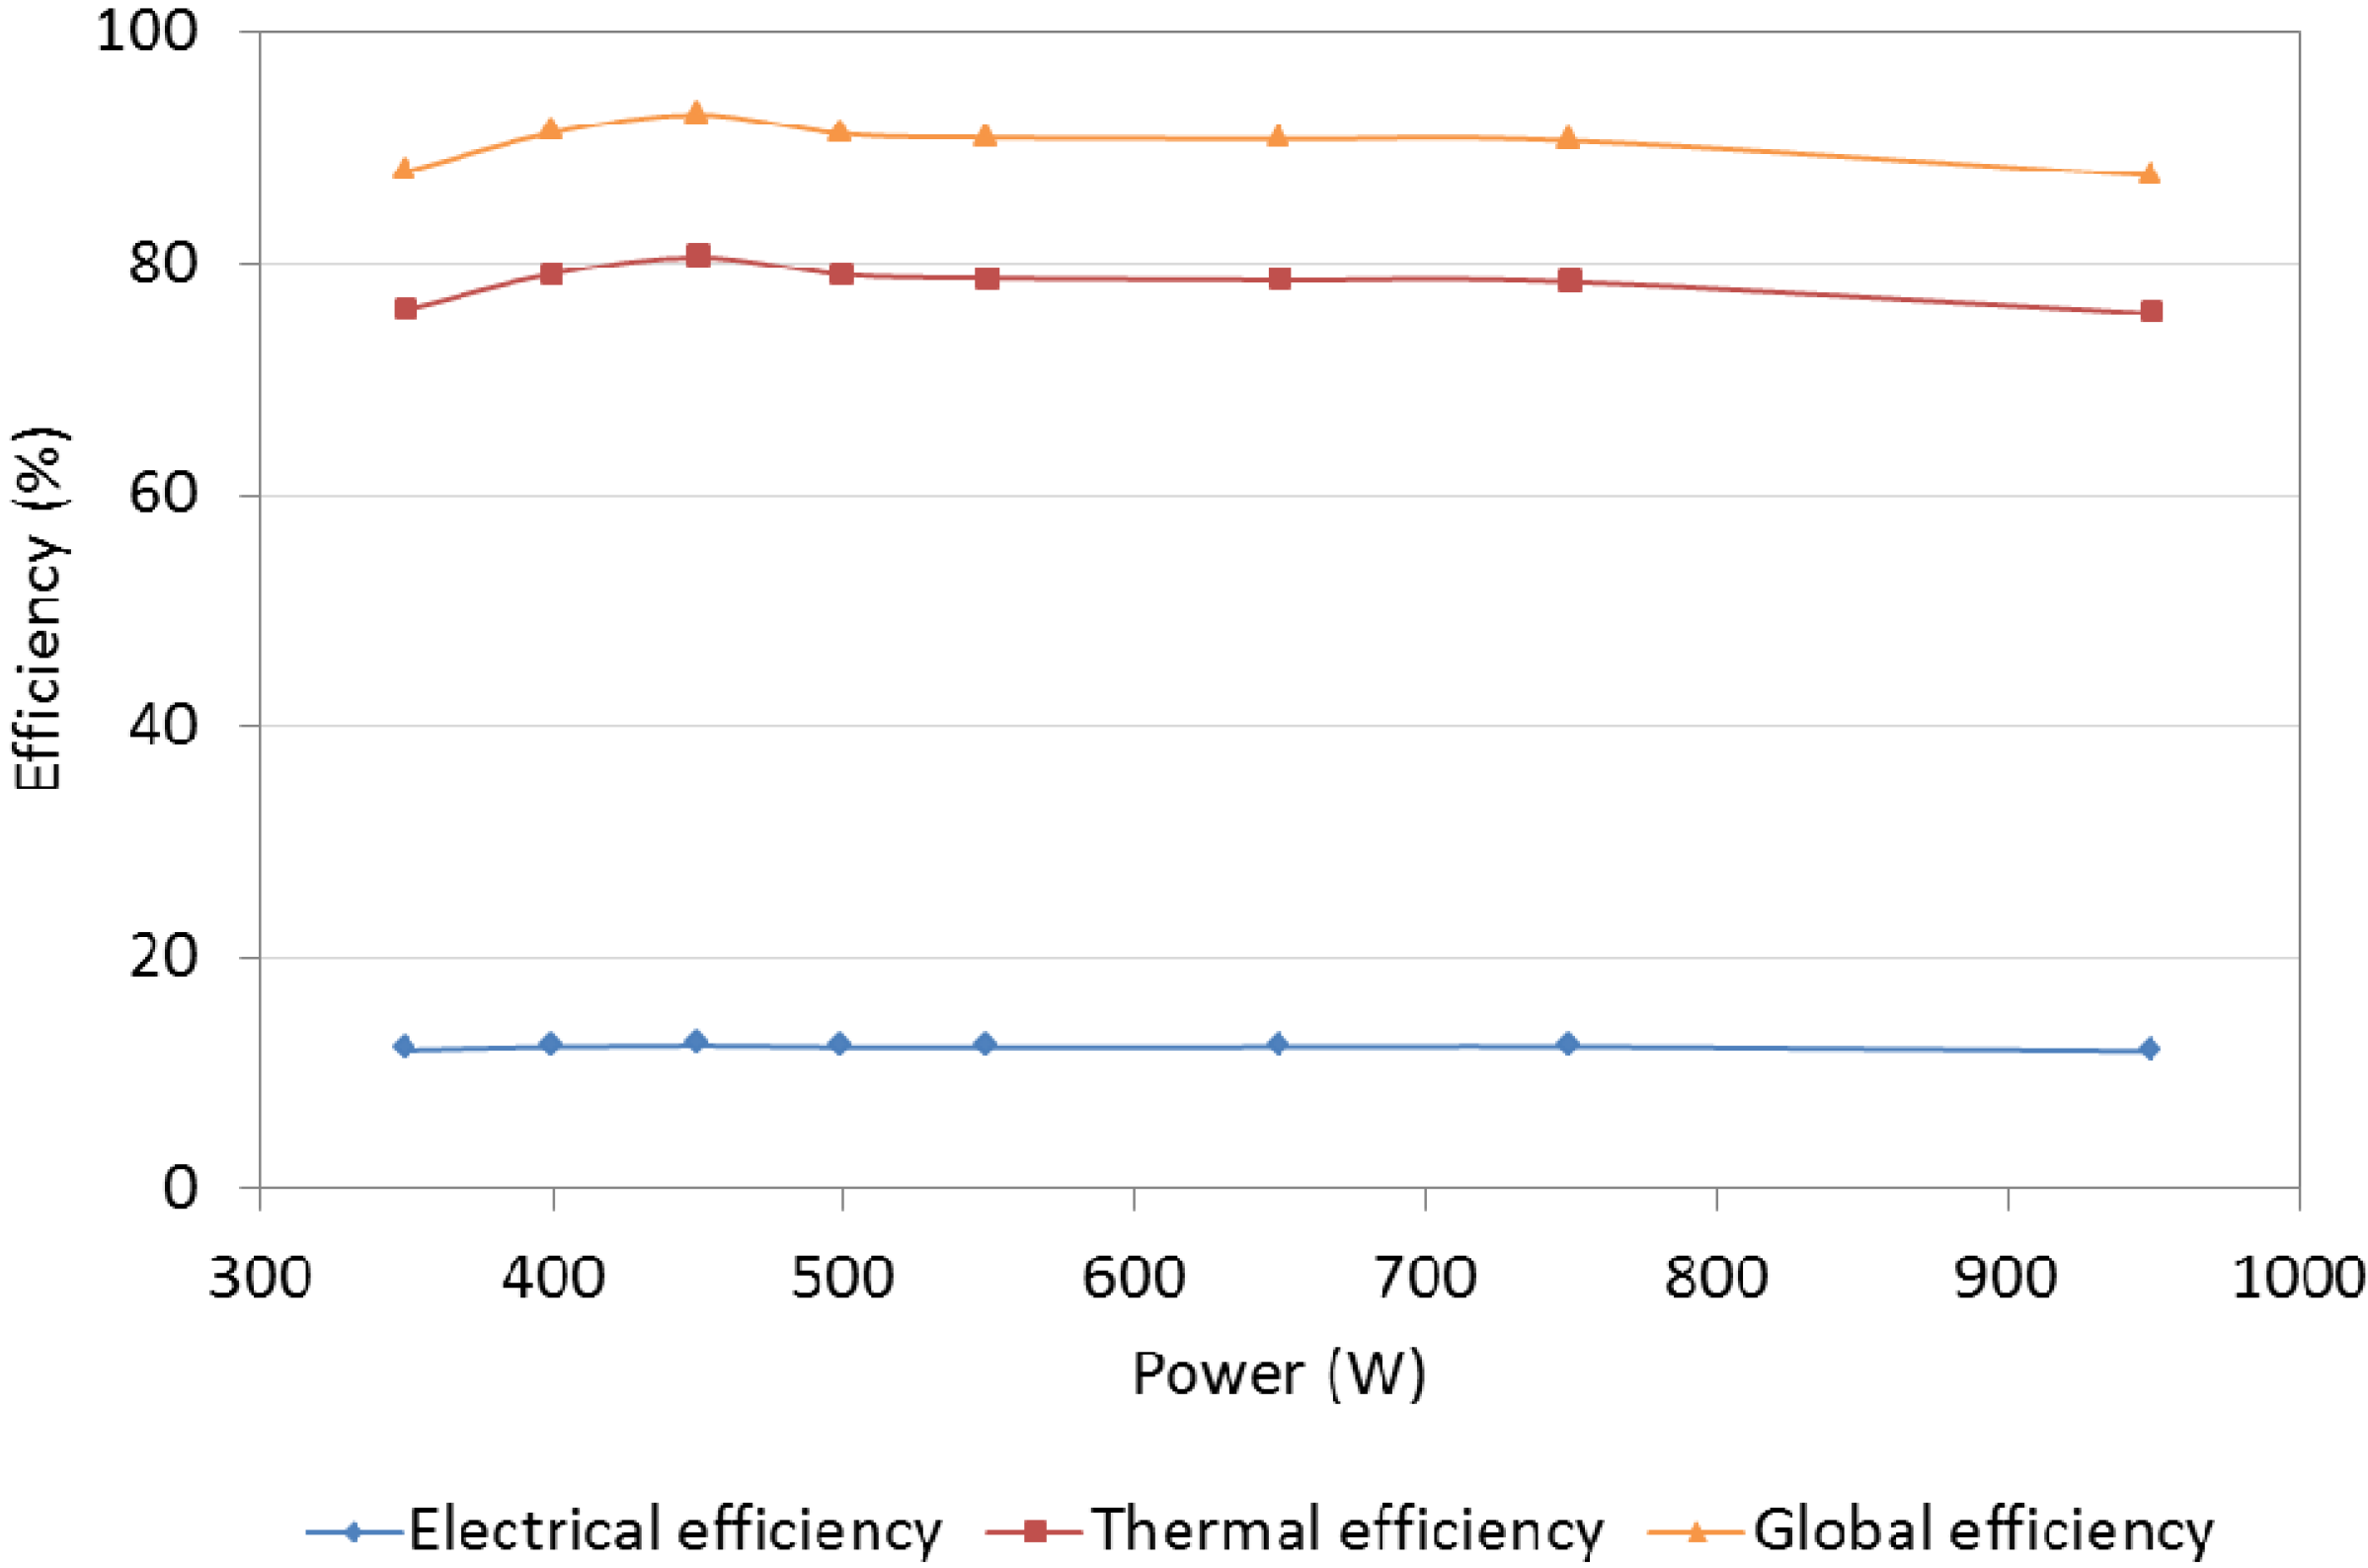
Because the simulation of the SE and the caravan was carried out during the night-time, the SE will work almost continuously, preventing machine cool down and avoiding any effect from periods of warm-up. The working point is clearly defined with a thermal power of 5.93 kW and an electrical power of 0.92 kW. The fuel consumption is also stabilized at 0.64 kg/h. These were the values introduced in the TRNSYS simulation tool. The mean value of the ratio between the generated heat and the generated electricity is 6:1, obtained at a high efficiency (91%), as shown in Figure 5.
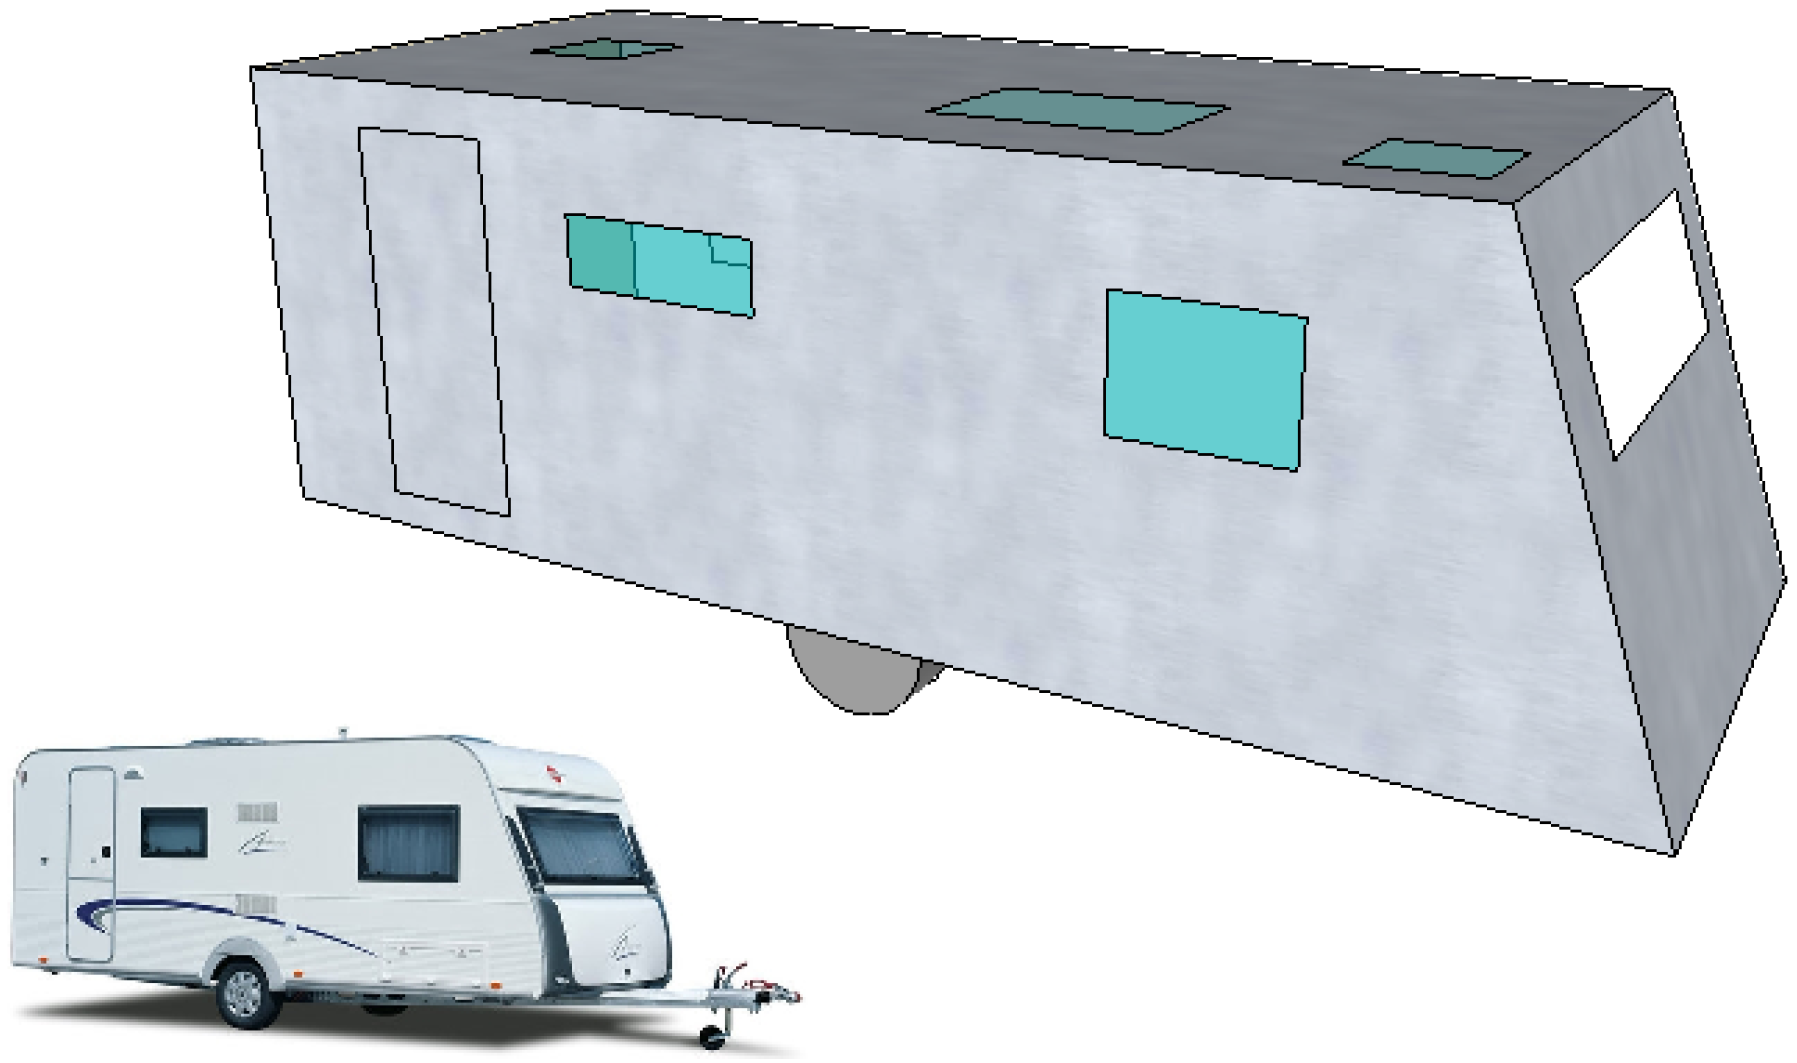
The composition and thicknesses of the walls, ceiling, and floor of the caravan are presented in Table 2 and Table 3.
Figure 3. Power generated as a function of time for the different tests in kW.
Energies 06 00717 g003
Figure 4. Heat rate as a function of time for the different tests in kW.
Energies 06 00717 g004
Figure 5. Efficiencies with different loads.
Energies 06 00717 g005
Table 2. Thermal properties of the layers of the walls and roof.
Dimension/PropertiesOuter aluminum layerInsulation polyurethaneInner Plywood layer
Thickness (mm)1263
Thermal Conductivity (W/m·K)1600.0340.17
Table 3. Thermal properties of the layers of the floor.
Dimension/PropertiesOuter aluminum layerInsulation polyurethaneInner Plywood layer
Thickness (mm)4306
Thermal Conductivity (W/m·K)1600.0340.17

2.2. The Vehicle

2.2.1. Selected Vehicle and Main Characteristics

For the present study, a Camper model caravan, used as a car trailer, has been selected. This caravan is a Burstner brand, model Trecento 560K (Figure 6). This model is a high-end large size caravan. The outer dimensions of the caravan are 6.2 m long, 2.5 m wide and 2.5 m height. The simulation is carried out using different software tools. For the development of the simulation, the caravan is modeled using the Google SketchUp TRNSYS3D tool that converts the geometric model to a thermal model that can be used with TRNBUILD. This model is drawn with windows and skylights in the roof, as shown in Figure 6. The 3D Google SketchUp model is imported into the simulation software TRNSYS. The enclosures are defined in TRNSYS by means of their thickness and composition.
Figure 6. Bürstner TRECENTO 560K and virtual model employed for the simulation.
Energies 06 00717 g006

2.2.2. Structural Characteristics

The caravan is composed of a chassis from the manufacturer AL-KO onto which the exterior enclosure is mounted. This enclosure is composed of a polyurethane layer sandwiched between a thin outer layer made of aluminum and a thin inner layer of plywood.
The enclosure from the walls and roof has a transfer coefficient of U = 1.047 W/m2·K with a total surface of 44.1 m2. The floor presents a transfer coefficient of U = 0.917 W/m2·K with a surface of 14.9 m2. The windows transmittance is U = 3.25 W/m2·K, and finally, the total surface is 4.9 m2. The total volume of the caravan is 29.7 m3.

2.2.3. Electrical Power Consumption

The caravan includes a series of devices that require electricity. The interior lighting, a fridge, an oven and other entertainment equipment require electricity to operate. The monthly electricity consumption and utilization rate are tabulated in Table 4 for the equipment incorporated in a mid-range caravan. With these data provided by caravan manufacturers, the expected daily electricity demand can be estimated.
Table 4. Expected electricity consumption during the simulation process.
EquipmentConsumption (kWh/month)Utilization rateExpected consumption (kWh/month)Expected consumption (kWh/year)
Fridge THETFORD N14512025%30360
Lights (4 × 25 W)320%0.67.2
Oven THETFORD DUPLEX452%0.910.8
TV 20’’ + DVD34%0.121.44
Total 31.62379.44

3. Simulation Process

As previously mentioned, this work requires the development of three individual models: a model of the caravan, a model of the heating system and a model of the weather conditions based on TRNSYS components (TRNSYS 17th version). The simulation has mainly considered the following aspects:
  • Weather Data: data obtained from Meteonorm [21] in TMY2 format were used to obtain the monthly mean data for all locations. Ebrahimpour et al. [22] show that a typical meteorological year generated by Meteonorm software is in good agreement with the long-term average measured data.
  • Infiltrations: one air change per hour with ambient conditions.
  • Long-wave radiation exchange to the atmosphere: Assuming that the sky is an ideal black surface and taking into account the cloudiness factor of the sky, an effective sky temperature is determined as in [23].
  • Convective Heat Transfer Coefficient of Walls: calculated as a function of air velocity, air temperature (Reynolds and Prandtl numbers) and the external temperatures of the walls (see Incropera and DeWitt [24]).
  • The heat consumption associated with the generation of domestic hot water was not taken into account. This heat may increase the engine operation.
  • The heat generation produced by two resting people has been taken into account as internal heat gains according to ISO 7730.
  • The thermal behavior of the caravan walls has been modeled by transfer functions calculated by the TRNBUILD module.
  • The simulation time step has been decreased to 1 minute for more accurate results.
  • The SE was set to work with HMM on. In this mode, the SE attends to the thermal requirements of the caravan, and the cogeneration system will follow the heating demand.
Only the overnight data were used, from 8:00 p.m. to 8:00 a.m., avoiding radiation effects and looking for low exterior temperatures, assuring that the Stirling engine attends to the heating demands of the caravan. Figure 7 shows layout of the TRNSYS simulation.

4. Results and Discussion

4.1. Maximum Heat Load Analysis in Different European Locations

First, the caravan was simulated in different European cities, and the maximum heating load was calculated with the average meteorological file (TMY2) provided by Meteonorm. An ideal system that maintains the caravan at 20 °C was employed, and the necessary thermal power at all times was computed. Figure 8 shows the result of the simulation during the month of January in Berlin. The simulation process was performed for each month of the year in different locations, and the results are summarized in Table 5. As shown, the Stirling-based CHP system with a nominal thermal power of 6 kW exceeds the higher maximum load expected, corresponding to Berlin on the 12th of January with a peak demand of 3.29 kW with an exterior temperature of −28.9 °C.
Figure 7. Layout of the TRNSYS simulation combining the three submodels.
Energies 06 00717 g007
The TMY file provides expected average data, which do not reflect the more extreme data that can realistically occur. This result justifies that the Stirling engine has greater power than the maximum required. This value can also be compared to the specifications of different boiler manufacturers for caravans and motorhomes. As an example boilers from 3 to 6 kW are incorporated as standard equipment of the caravan object of this study.
Figure 8. Simulation results for Berlin in January. Room temperature of the caravan (blue line) was fixed to 20 °C, and the ambient temperature (red line) reached −28.9 °C on the 12th day. The heating rate in the right axis reached 3.29 kW (pink line).
Energies 06 00717 g008
Table 5. Maximum heating rate, ambient temperature and date at the moment of maximum heating rate.
CityMax. heating rate (kW)Min. temperature (°C)Day of max heating rateHour of max. heating rate
Seville1.222.812 January9
Madrid1.70−4.925 December9
Vigo1.320.125 January1
Marseille1.56−2.313 January2
Vienna1.99−9.815 January8
Paris1.70−5.115 January9
Brussels1.82−7.213 January0
Berlin3.29−28.912 January8
Copenhagen1.96−7.915 February1
Helsinki2.81−21.915 February8
Oslo2.30−13.914 February19
Vilnius2.73−20.812 January19
Athens1.42−0.315 February4
Roma1.51−1.813 January7
Dubrovnik1.360.215 February2
London1.73−5.513 January1
The engine model was used in a series of simulations for each month of the year. It was assumed that the caravan was parked during the 12 h ranging from 20:00 to 8:00 the next day. The mean values of the meteorological data were used for each month. The thermal and the electrical output of the SE were calculated. Figure 9 shows the simulation results in Berlin for the average night in January.
Figure 9. Simulation of the caravan in Berlin during the average night in January. The blue line represents the interior temperature in °C, and the red line represents the ambient temperature. The mean hourly heating rate of the SE is shown in the right axis in kW (pink line).
Energies 06 00717 g009

4.2. Discussion

Figure 10 compares the monthly electricity in four cities (Seville, Paris, Helsinki and Berlin). Although heating is not required during the summer, the simulation program computes a low specific demand during the mid-year months. It can also be seen that in Seville, during the summer months, there is no heating production and hence no electricity generated (as electricity is only produced as a byproduct of heat). On the contrary, the production in Helsinki and Berlin are positive throughout the year and closer during the mildest months of the year. Figure 11 compares the accumulated annual production of electricity from the SE for all of the studied locations. Figure 12 shows simulated annual electrical energy in kWh for all of the cities in the study.
Figure 10. Comparison of monthly generated power (in kWh) in Seville, Paris, Helsinki and Berlin.
Energies 06 00717 g010
Figure 11. Comparison of annual generated power in kWh for all of the cities studied.
Energies 06 00717 g011
The warmer weather cities do not reach 200 kWh per year, while the coldest cities exceed 600 kWh. The more temperate cities are all above 400 kWh. Table 6 summarizes the numerical data obtained for the 11 cities. At first glance, it can be noted that in the colder locations, the SE generates up to four times more electricity than is generated in the warmer locations. The production of electricity in Seville is approximately 147.68 kWh, which is less than half of the energy required under the assumptions of Section 2.2.3. In contrast, in Berlin, the production of electricity is 774.23 kWh, which is enough for living inside the caravan. Despite these annual readings, during the summer months, when production is much lower, the amount of electricity generated is not sufficient. For this reason, monthly readings in the coldest city, Berlin, demonstrate that electricity production would be insufficient during the months of June, July and August. It should be recalled that this electrical production can be increased or decreased according to certain parameters that cannot be predicted in advance, including the following:
  • The heat flux through the envelope can differ depending on where the caravan parks. The results would be different if the location is sheltered or in an open landscape.
  • Some of commercial caravans use isolation materials inferior to the selected ones.
  • The infiltrations are difficult to measure, and the assumed rate of one per hour may be well below reality, especially if the doors are repeatedly opened.
  • A heat exchanger could be used to recover heat in vent conductions.
  • Any electrical consumption results in a decrease of the thermal demand.
Figure 12. Simulated annual electrical energy in kWh for all of the cities in the study.
Energies 06 00717 g012
Although electricity has been considered only to be a byproduct of heat in this work, the system studied has the possibility of rejecting the heat produced, which will lead to an efficiency of 12% (electric power vs. fuel consumption). This figure could be compared with the efficiencies of the conventional low power generation sets (closer to 20%) normally used in caravans, but this possibility was not explored as it was not the aim of the present work.
Table 6. Heat and electricity production and fuel consumption for all of the study locations.
CityHeating Energy (kWh)Power Energy (kWh)Fuel Consumption (kg)
Seville950.26147.68102.73
Madrid2178.07338.48235.47
Vigo2102.49326.74227.30
Marseille1706.14265.14184.45
Vienna2712.64421.56293.26
Paris2495.38387.80269.77
Brussels2693.50418.58291.19
Berlin4981.98774.23538.59
Copenhagen3223.34500.92348.47
Helsinki4237.24658.49458.08
Oslo3986.63619.54430.99
Vilnius3996.39621.06432.04
Athens1243.20193.20134.40
Rome1765.44274.36190.86
Dubrovnik1311.38203.80141.77
London2885.70448.45311.97

5. Conclusions

In this article, a study of SE operation was performed to obtain basic function parameters at steady state at different levels of electrical consumption. The ratio obtained between the generated heat and the generated electricity is 6:1, and a high efficiency value of 91% was obtained.
Furthermore, a commercial caravan utilizing this system was simulated through the software tool TRNSYS and its TRNBUILD module in order to obtain thermal demands associated with different European cities. The maximum loads ranged from 1.22 kW in a southern European city such as Seville to 3.29 kW in a cold city such as Berlin. Thus, it was found that the SE is appropriate for providing heating for a commercial caravan.
With weather patterns provided by Meteonorm and with the models introduced in TRNSYS, it was found that the electrical production system provides an amount of energy ranging from 147.7 kWh per year in Seville to 774.2 kWh per year in the city of Berlin. Therefore, the electrical production system generates approximately five times more power in a very cold city than in a temperate city over the course of a year. The caravan used for this study has a planned annual electricity consumption of 379.4 kWh. This amount of energy can be totally generated in colder cities, while approximately 50% of this energy can be generated in the warmer Mediterranean cities. It should also be noted that the electrical battery should provide sufficient storage capacity, as heating loads occur in times where there is not always electricity demand.
Electrical energy generated is not enough in summer time. Depending on the region a lower thermal-electrical energy conversion ratio would be desirable in SE. Future research will incorporate the different electrical needs of one or two people, as well as considering the storage capabilities of batteries and domestic hot water tanks. This study will also provide more details about system feasibility according to the needs of each person.

References

  1. Alanne, K.; Söderholm, N.; Sirén, K.; Beausoleil-Morrison, I. Techno-economic assessment and optimization of Stirling engine micro-cogeneration systems in residential buildings. Energy Convers. Manag. 2010, 51, 2635–2646. [Google Scholar] [CrossRef]
  2. Thiers, S.; Aoun, B.; Peuportier, B. Experimental characterization, modeling and simulation of a wood pellet micro-combined heat and power unit used as a heat source for a residential building. Energy Build. 2010, 42, 896–903. [Google Scholar] [CrossRef]
  3. Feidt, M.; Costea, M. Energy and exergy analysis and optimization of combined heat and power systems. Comparison of various systems. Energies 2012, 5, 3701–3722. [Google Scholar] [CrossRef]
  4. Míguez, J.L.; Murillo, S.; Porteiro, J.; López, L.M. Feasebility of a new domestic CHP trigeneration with heat pump: I. Design and development. Appl. Therm. Eng. 2004, 24, 1409–1419. [Google Scholar] [CrossRef]
  5. Porteiro, J.; Míguez, J.L.; Murillo, S.; López, L.M. Feasebility of a new domestic CHP trigeneration with heat pump: II. Availability analysis. Appl. Therm. Eng. 2004, 24, 1421–1429. [Google Scholar] [CrossRef]
  6. De Paepe, M.; D’Herdt, P.; Mertens, D. Micro-CHP systems for residential applications. Energy Convers. Manag. 2006, 47, 3435–3446. [Google Scholar]
  7. Miccio, F. On the integration between fluidized bed and Stirling engine for micro-generation. Appl. Therm. Eng. 2013, 52, 46–53. [Google Scholar] [CrossRef]
  8. Kuosa, M.; Kaikko, J.; Koskelainen, L. The impact of heat exchanger fouling on the optimum operation and maintenance of the Stirling engine. Appl. Therm. Eng. 2007, 27, 1671–1676. [Google Scholar] [CrossRef]
  9. Lombardi, K.; Ugursal, V.I.; Beausoleil-Morrison, I. Proposed improvements to a model for characterizing the electrical and thermal energy performance of Stirling engine micro-cogeneration devices based upon experimental observations. Appl. Energy 2010, 87, 3271–3282. [Google Scholar] [CrossRef]
  10. Aliabadi, A.A.; Thomson, M.J.; Wallace, J.S.; Tzanetakis, T.; Lamont, W.; di Carlo, J. Efficiency and emissions measurement of a Stirling-engine-based residential microcogeneration system run on diesel and biodiesel. Energy Fuels 2009, 23, 1032–1039. [Google Scholar] [CrossRef]
  11. Thombare, D.G.; Verma, S.K. Technological development in the Stirling cycle engines. Renew. Sustain. Energy Rev. 2008, 12, 1–38. [Google Scholar] [CrossRef]
  12. Farra, N.; Tzanetakis, T.; Thomson, M.J. Experimental determination of the efficiency and emissions of a residential microcogeneration system based on a Stirling engine and fueled by diesel and ethanol. Energy Fuels 2012, 26, 889–900. [Google Scholar] [CrossRef]
  13. Magri, G.; di Perna, C.; Serenelli, G. Analysis of electric and thermal seasonal performances of a residential microchip unit. Appl. Therm. Eng. 2012, 36, 193–201. [Google Scholar] [CrossRef]
  14. European Caravan Federation Homepage. Available online: http://www.e-c-f.com/ (accessed on 15 August 2012).
  15. Cardinale, N.; Stefanizzi, P.; Rospi, G.; Augenti, V. Thermal performance of a mobile home with light envelope. Build. Simul. 2010, 3, 331–338. [Google Scholar] [CrossRef]
  16. Ferguson, A.; Kellyb, N.; Weberc, A.; Griffith, B. Modelling residential-scale combustion-based cogeneration in building simulation. J. Build. Perform. Simul. 2009, 2, 1–14. [Google Scholar] [CrossRef]
  17. TRNSYS. Transient Systems Simulation Homepage. Available online: http://www.trnsys.com (accessed on 1 September 2012).
  18. Kwiatkowski, J.; Woloszyn, M.; Roux, J.J. Influence of sorption isotherm hysteresis effect on indoor climate and energy demand for heating. Appl. Therm. Eng. 2011, 31, 1050–1057. [Google Scholar] [CrossRef]
  19. Ayompe, L.M.; Duffy, A.; McCormack, S.J.; Conlon, M. Validated TRNSYS model for forced circulation solar water heating systems with flat plate and heat pipe evacuated tube collectors. Appl. Therm. Eng. 2011, 31, 1536–1542. [Google Scholar] [CrossRef]
  20. Campos-Celador, A.; Pérez-Iribarren, E.; Sala, J.M.; Portillo-Valdés, L.A. Thermoeconomic analysis of a micro-CHP installation in a tertiary sector building through dynamic simulation. Energy 2012, 45, 228–236. [Google Scholar] [CrossRef]
  21. Meteonorm Homepage. Available online: http://meteonorm.com/ (accessed on 1 September 2012).
  22. Ebrahimpour, A.; Maerefat, M. A method for generation of typical meteorological year. Energy Convers. Manag. 2010, 51, 410–417. [Google Scholar] [CrossRef]
  23. Martin, M.; Berdahl, P. Characteristics of infrared sky radiation in the United States. Sol. Energy 1984, 33, 321–336. [Google Scholar] [CrossRef]
  24. Incropera, F.P.; DeWitt, D.P.; Bergman, T.L.; Lavine, A.S. Fundamentals of Heat and Mass Transfer, 6th ed.; Prentice Hall: Mexico DF, Mexico, 2002. [Google Scholar]

