Article

A Materials Life Cycle Assessment of a Net-Zero Energy Building

1
Department of Civil and Environmental Engineering, University of Pittsburgh, 949 Benedum Hall, Pittsburgh, PA 15261,USA
2
School of Sustainability and the Built Environment, Arizona State University, P.O. Box 875306, Tempe, AZ 85287, USA
3
Department of Electrical and Computer Engineering, University of Pittsburgh, 205 Benedum Hall, Pittsburgh, PA 15261,USA
4
Department of Mechanical Engineering, University of Pittsburgh, 153 Benedum Hall, Pittsburgh, PA 15261, USA
5
Mascaro Center for Sustainable Innovation, University of Pittsburgh, 153 Benedum Hall, Pittsburgh, PA 15261, USA
*
Author to whom correspondence should be addressed.
Energies 2013, 6(2), 1125-1141; https://doi.org/10.3390/en6021125
Submission received: 15 October 2012 / Revised: 15 January 2013 / Accepted: 6 February 2013 / Published: 21 February 2013

Abstract

:
This study analyzed the environmental impacts of the materials phase of a net-zero energy building. The Center for Sustainable Landscapes (CSL) is a three-story, 24,350 square foot educational, research, and administrative office in Pittsburgh, PA, USA. This net-zero energy building is designed to meet Living Building Challenge criteria. The largest environmental impacts from the production of building materials is from concrete, structural steel, photovoltaic (PV) panels, inverters, and gravel. Comparing the LCA results of the CSL to standard commercial structures reveals a 10% larger global warming potential and a nearly equal embodied energy per square feet, largely due to the CSL’s PV system. As a net-zero energy building, the environmental impacts associated with the use phase are expected to be very low relative to standard structures. Future studies will incorporate the construction and use phases of the CSL for a more comprehensive life cycle perspective.

1. Introduction and Background

As the number of low-energy buildings increases, the need to consider embodied energy from building materials increases, especially if an overall goal is to reduce the building’s life cycle energy use. The life cycle assessment of advanced building materials and systems is paramount to significantly improving overall environmental building performance. This paper focuses on an illustrative case study, a net-zero energy/water building, which aims to achieve significant benchmarks in the United States—the Living Building Challenge and Leadership in Energy and Environmental Design platinum. A materials phase life cycle assessment was completed on the Center for Sustainable Landscapes (CSL). We focused on materials not only due to current construction and operation schedules, but also because previous studies have suggested that the materials used to construct green buildings have higher environmental impacts than those of traditional buildings [1,2,3].
The following definitions are posed to ensure understanding of the concepts presented: Embodied Energy: the energy required to extract, process, manufacture and transport building materials (within the manufacturing stage), associated with the building [3]; Cumulative Energy Demand: the impact assessment method used to calculate embodied energy and primary energy, developed by ecoinvent and expanded by SimaPro developers to include other databases [4,5]; Carbon Footprint: a measure of the total amount of equivalent carbon dioxide emissions directly and indirectly caused by an activity or is accumulated over the life stages of a product [6]; Embodied Carbon Footprint: a term used by the International Living Future Institute to describe the carbon footprint associated with the structural materials of a building and used to measure the quantity of carbon offsets needed to be purchased for Living Building Challenge certification [7,8]. Net-Zero Energy: often defined as the balance between the energy consumed by the use of the building and the energy produced by the building’s renewable systems on an annual basis [9]. Material Phase: the phase related to material extraction and product processing and manufacturing. Use Phase: the phase related to a building’s operational lifetime, including energy consumption, maintenance, and replacement materials.
Life Cycle Assessment and Building Energy Use. One method to assess the overall environmental impacts is with Life Cycle Assessment; LCA is a tool used to quantify the environmental inputs and outputs from the raw materials extraction and manufacturing of the product (i.e., cradle) through the product’s use phase and ultimately, disposal (i.e., grave) [10,11]. In a whole-building LCA, environmental impacts can be calculated at all phases: raw materials extraction and processing, product shipment to site, construction, use/maintenance, and demolition/disposal. LCA provides a standardized method for comparing the relative sustainability of similar products or processes. LCA can also identify points in a product or process cycle where environmental impacts are relatively high and changes could be made to improve the sustainability of the overall system.
According to ISO 14040 standards, an LCA is conducted in four phases [12]. The first phase, goal and scope definition, establishes the boundary conditions of the system, defines a functional unit for the system, and enables equivalent comparisons with other products or processes. During the second phase, Life Cycle Inventory (LCI), data is aggregated to determine the aggregate inputs and outputs. In the case of a building materials study, this is often the quantity of materials used as well as the emissions associated with the production of those materials. In phase three, Life Cycle Impact Assessment (LCIA), the LCI is translated using characterization factors, into impact categories, such as global warming potential and ecotoxicity. The fourth and final phase is interpretation, where data and results are analyzed to determine areas of relatively high environmental impacts and recommendations are made for improvements to the system. The four phases often occur in an iterative nature. Some LCA tools and software exist that can be used to assess buildings, for example, BEES, ATHENA, GaBi Build-it, and SimaPro [13,14,15,16]. The USGBC has also started to incorporate LCA into their newest version of LEED through pilot credits, including Pilot Credit 1: Life Cycle Assessment of Building Assemblies and Materials and Pilot Credit 63: Materials and Resources—Whole Building Life Cycle Assessment [17].
Although a range of findings are prevalent in the LCA and energy building literature, general consensus maintains that the use phase of a standard building represents the largest phase in terms of energy consumption. Studies assuming a 40 to 50 year life span found that the use phase, or operational energy, contributes anywhere from 52% to 82% of the total life cycle energy consumption of a building [18,19,20,21,22]. One study used a 75-year lifetime and another analyzed 73 case studies ranging from 40 to 100 years, resulting in total operational life cycle energy of 94% and 80%–90% respectively, highlighting the influence of a building’s life span [23,24]. The construction and material phases of traditional buildings account for 2% to 15% of a building’s total life cycle energy, from embodied energy to operational energy to demolition energy [22,23,24]. However, as the impacts associated with the use phase of buildings starts to decrease with more efficient technologies, it is becoming more important to look at the embodied energy [3].
Recent research has found that lower energy houses typically have proportionally higher embodied energy compared to traditional houses, and that while environmental sustainability was improved through reduction in energy use, the embodied energy of the materials, particularly those materials comprising the shell of the structure, actually increases slightly in low-energy buildings [1,19,20,21,22,25]. Some studies have concluded that embodied energy for conventional buildings accounts for 10%–38% of the total energy in a building’s life cycle [2,18,23,26]. Embodied energy has a higher relative percentage in low-energy buildings, one study finding 9%–46% of a buildings total life cycle energy, than in conventional buildings, an important realization for moving forward with green building analyses [2,18].
Living Building Challenge. Cascadia Green Building Council launched the Living Building Challenge (LBC) in 2006 [27]. In 2009, Cascadia formed the International Living Building Institute to oversee LBC and in 2011 the Institute was renamed the International Living Future Institute. Version 1.3 of the LBC standards was released in August 2009; Phipps Conservatory and Botanical Gardens, the case study, evaluated herein, is designed to meet LBC v1.3.
LBC Version 1.3 is divided into six prerequisites or “petals”, all must be met to achieve certification. The petals are: beauty and inspiration, site, materials, energy, indoor quality, and water. The materials petal contains five of the 16 prerequisites for Living Building certification and includes restrictions in the types of materials that can be used, distance radius from manufacturer to building site for materials and services, carbon footprinting, and construction wastes [27]. In order to achieve LBC certification, the building must be in full operation for one year and monitored during this time to ensure it meets operational criteria, including net-zero energy and water consumption.
As of August 2012, the International Living Future Institute has six buildings with certification: three educational buildings have achieved full Living certification, two mixed office spaces that have achieved Net-Zero Energy certification, and one residential building that has achieved Petal Recognition. Roughly 12 projects are reaching the end of their one-year operational phase and will be submitting for certification in the next 6 months [28]. Net-Zero Energy certification is a partial certification program that focuses on the buildings ability to fulfill net-zero requirements, likewise, petal recognition is a partial certification program that is awarded to projects that satisfy three out of the six petal categories for the LBC [7]. There are very few life cycle based studies on the environmental effects of net-zero energy buildings or Living Buildings [9,18,25,29].

2. Approach and Methods

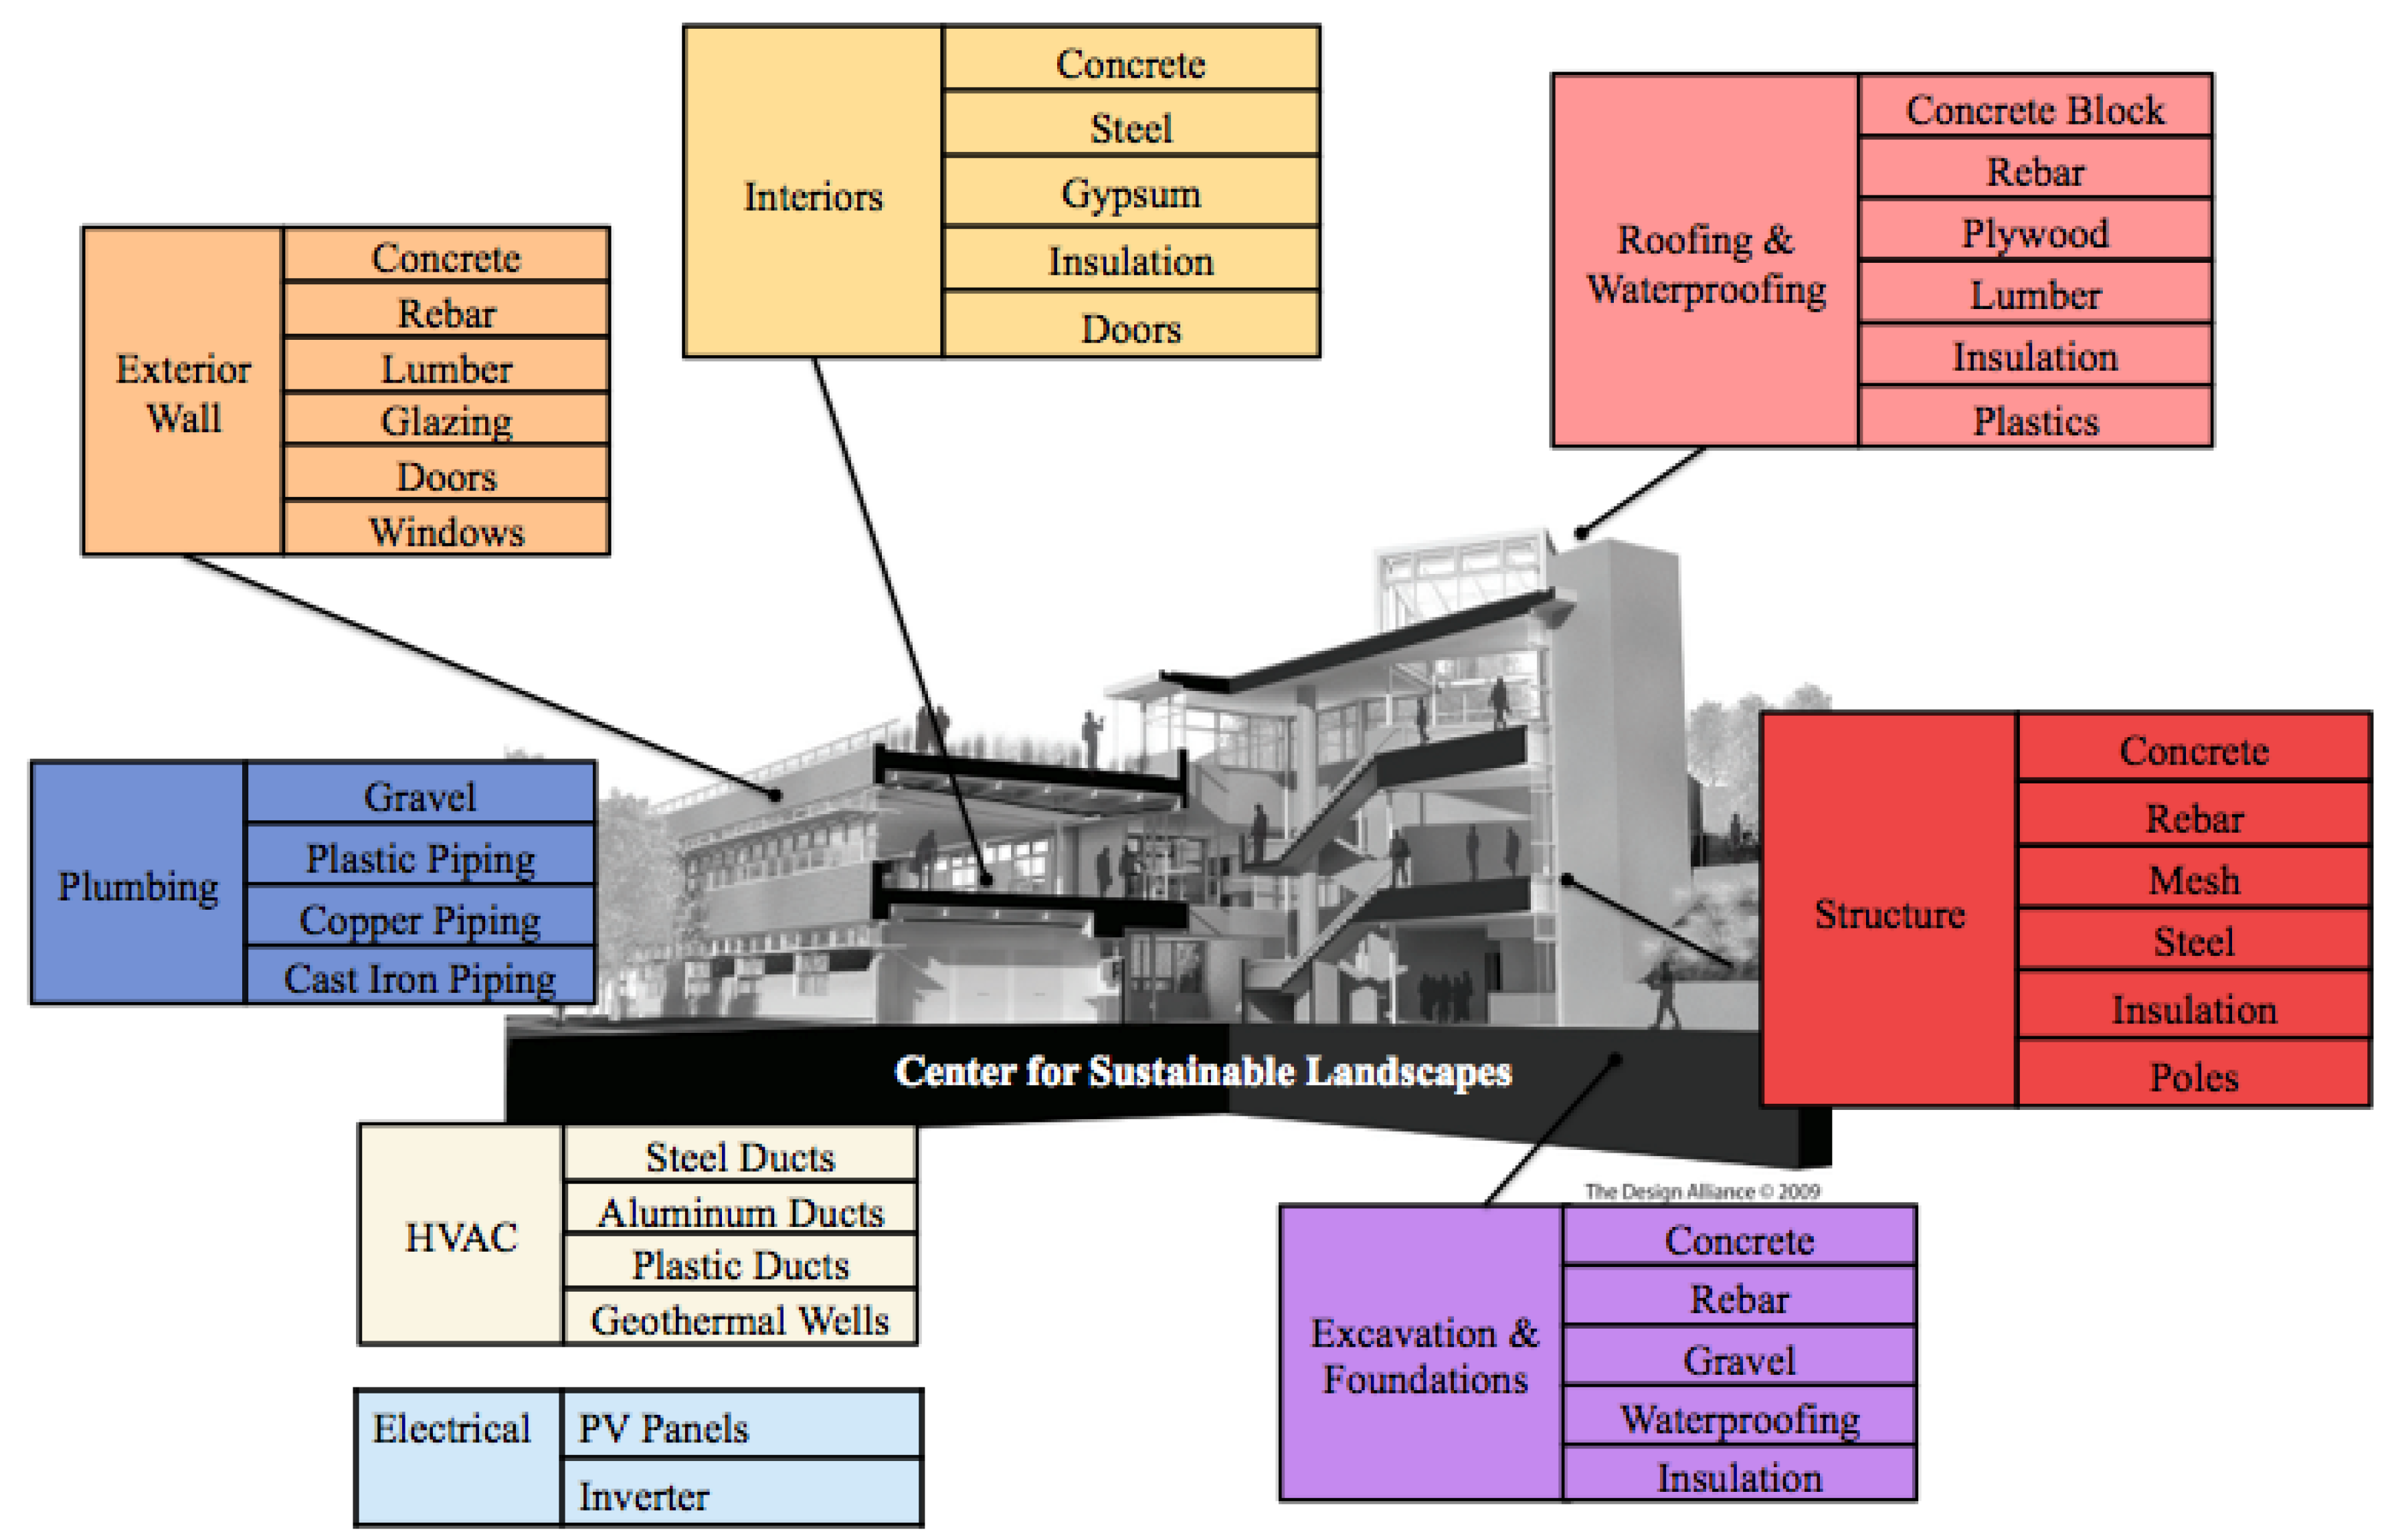
2.1. Case Study Description: Phipps Center for Sustainable Landscapes

Phipps Conservatory and Botanical Gardens was built in 1893 as a gift to the city of Pittsburgh, Pennsylvania [30]. The mission of Phipps, “to inspire and educate visitors with the beauty and importance of plants; to advance sustainability and worldwide biodiversity through action and research; and to celebrate its historic glass house” is complemented by a three-part green capital plan [30]. The green capital plan, which started at the beginning of the new millennium, includes a LEED Silver Welcome Center integrated into a historical landmark, production greenhouses with state-of-the-art energy and water efficiency, and lastly, the new Center for Sustainable Landscapes (CSL) building. The CSL is a 24,350 square foot educational, research, and administrative office attempting to meet the high green standards of the Living Building Challenge v1.3, LEED Platinum, and SITES certification for landscapes [31]. The CSL will be an integral part of the existing Phipps Conservatory and Botanical overall plan.
Using an integrated project delivery system, the project owner, architects, engineers, and contractors designed the CSL to be a facility that combines passive solar design, geothermal wells, photovoltaics, solar hot water collectors, a constructed lagoon and wetland system, permeable paving, and a green roof. The CSL is 3 stories with cast-in-place concrete and steel framing for the structure and aluminum/glass curtain wall and wood cladding for the envelope while the roof is a combination of a green roof, paver patio, and thermoplastic polyolefin white roof. Construction on the facility began in winter 2010 with completion expected in 2012.

2.2. LCA Boundary Definitions and LCI Data Sources

This LCA focuses on the environmental impacts of CSL’s building materials. The boundaries for this study include material extraction and product processing and manufacturing (defined herein as “materials phase”) of the CSL. Transportation of the building materials to the construction site, construction waste, and materials used for construction itself (e.g., temporary materials) are not included. The building material phase is becoming increasingly important as the impacts associated with the use phase of low-energy buildings decreases. The functional unit of this study is defined as the entire CSL building.
Figure 1 details the major components of the analysis, ranging from structural elements to interior flooring as well as ductwork for the Heating, Ventilation and Air Conditioning (HVAC) system and piping for plumbing. This LCA also includes the production phase of the photovoltaic (PV) panels as well as the geothermal heat wells. It is important to note that the PV panels do not include the mounting system or the monitoring system and the associated materials with those PV system parts The mounting system, monitoring system, and associated PV system parts account for approximately 18% of the total primary energy for the PV system [32]. Not included in the study were landscaping elements; interior finishes such as carpet tiling and paints were also not included in this study as they represent a small quantity of the building’s total mass. Paint and interior finished represented only 2%–4% of energy and global warming impacts in previous building LCA studies [20]. The analysis takes a closer look at the initial materials involved with the CSL and does not account for replacement materials, which would be deemed in the “use phase” and therefore, out of the boundary definition.
Figure 1. System boundary: material phase for illustrative case study [33].
Energies 06 01125 g001
Material inventory data was obtained through CSL’s project documents, including estimates, plans, and specifications provided by the architects and the pre-construction management company. Materials were allocated to a representative LCI unit process within an environmental impacts database, with preference first given to the US based material process database Franklin USA 98 [34]. When Franklin USA 98 was insufficient to represent the material, ecoinvent was used [35]. If a unit process was not available in either Franklin USA 98 or ecoinvent, another database was selected based on the best possible information of the unit process description, boundary considerations, and installed product use. Table 1 provides a description of building material and associated LCA unit process.
Table 1. LCI Databases for Building Materials. CH = Switzerland geographical code; RER = Europe geographical code; U = unit process; FAL = Franklin Associates code; ecoinvent Unit Process [5]; ETH-ESU 96 U [4]; Franklin USA 98 [34]; Industry Data 2.0 [36]; IDEMAT 2001 [37]; * Concrete and concrete block unit processes were modified to adjust for flyash incorporation based on published results [38].
Building CategoryBuilding MaterialDatabaseUnit Process Name
Exterior WallsGlazingecoinvent Unit Process Glazing/ecoinvent Unit Process
Concrete*ETH-ESU 96 U Concrete not reinforced ETH U
RebarFranklin USA 98 Steel cold rolled, EAF FAL/Franklin USA 98
Lumberecoinvent Unit Process Reclaimed lumber/ecoinvent UP used
Doorecoinvent Unit ProcessDoor, outer, wood-aluminum, at plant/RER U/ecoinvent Unit Process
Windowsecoinvent Unit ProcessWindow frame, aluminum, U = 1.6 W/m2K, at plant/RER U/ecoinvent Unit Process
Interior PartitionsConcrete*ETH-ESU 96 UConcrete not reinforced ETH U
SteelFranklin USA 98Steel cold rolled, EAF FAL/Franklin USA 98
Insulationecoinvent Unit ProcessRock wool, at plant/CH U
Doorsecoinvent Unit ProcessDoor, inner, wood, at plant/RER U/ecoinvent Unit Process
Gypsumecoinvent Unit ProcessGypsum plaster board, at plant/CH U/ecoinvent Unit Process
Roofing and Water-proofingConcrete Block*ecoinvent Unit Process Concrete block, at plant/DE U/ecoinvent Unit Process
RebarFranklin USA 98Steel cold rolled, EAF FAL/Franklin USA 98
Plywoodecoinvent Unit ProcessPlywood, outdoor use, at plant/RER U/ecoinvent Unit Process
Lumberecoinvent Unit ProcessReclaimed lumber/ecoinvent UP used
Insulationecoinvent Unit ProcessPolystyrene, extruded (XPS), at plant/RER U/ecoinvent Unit Process
HDPEFranklin USA 98HDPE bottles FAL/Franklin USA 98
Recycled PolymerIDEMAT 2001Recycling mixed polymer I’/IDEMAT 2001
LDPEFranklin USA 98LDPE film FAL/Franklin USA 98
Recycled LDPEFranklin USA 98LDPE film recycled FAL/Franklin USA 98
StructureConcrete*ETH-ESU 96 UConcrete not reinforced ETH U
Rebar/Steel/MeshFranklin USA 98Steel cold rolled, EAF FAL/Franklin USA 98
Insulationecoinvent Unit ProcessRock wool, at plant/CH U
Polesecoinvent Unit ProcessCladding, crossbar-pole, aluminum, at plant/RER U/ecoinvent Unit P
Excavation and FoundationsConcrete*ETH-ESU 96 UConcrete not reinforced ETH U
RebarFranklin USA 98Steel cold rolled, EAF FAL/Franklin USA 98
Gravelecoinvent Unit ProcessGravel, crushed, at mine/CH U/ecoinvent Unit Process
Waterproofingecoinvent Unit ProcessBitumen sealing Alu80, at plant/RER U/ecoinvent Unit Process
Insulationecoinvent Unit ProcessPolystyrene, extruded (XPS), at plant/RER U/ecoinvent Unit Process
ElectricalPV Panelsecoinvent Unit ProcessPhotovoltaic panel, single-Si, at plant/RER/I U
Inverter ecoinvent Unit ProcessInverter, 2500 W, at plant/RER/I U
HVACSteel Ductsecoinvent Unit Process Ventilation duct, steel, 100 × 50 mm, at plant/RER U/ecoinvent Unit Process
Aluminum Ductsecoinvent Unit Process Flexible duct, aluminum/PET, DN of 125, at plant/RER U/ecoinvent Unit Process
Plastic Ductsecoinvent Unit ProcessVentilation duct, PE corrugated tube, DN 75, at plant/RER U/ecoinvent Unit Process
Geothermal Wellsecoinvent Unit ProcessHeat geothermal probe 10 kW U—edited (no HCFC-22)
PlumbingGravelecoinvent Unit ProcessGravel, crushed, at mine/CH U/ecoinvent Unit Process
Plastic PipingIndustry Data HDPE pipes E/industry data 2.0
Copper Pipingecoinvent Unit Process Copper, primary, at refinery/RER U/ecoinvent Unit Process
Cast Iron Pipingecoinvent Unit Process Cast iron, at plant/RER U/ecoinvent Unit Process

2.3. Impact Assessment Methods

The LCIA phase was conducted using two impact assessment methods. First, embodied energy of the materials was calculated using a Cumulative Energy Demand (CED) method developed by ecoinvent [39,40]. The remaining environmental impacts were calculated using TRACI 2 v3.01. TRACI, or Tool for the Reduction and Assessment of Chemical and Other Environmental Impacts, was developed by the Environmental Protection Agency (EPA) as a US-based impact assessment method [41]. The impact assessment categories reported from TRACI include global warming, acidification, human health cancer, human health noncancer, human health criteria air pollutants, eutrophication, ecotoxicity, smog, natural resource depletion, water intake, and ozone depletion.

3. Results, Discussion, and Interpretation

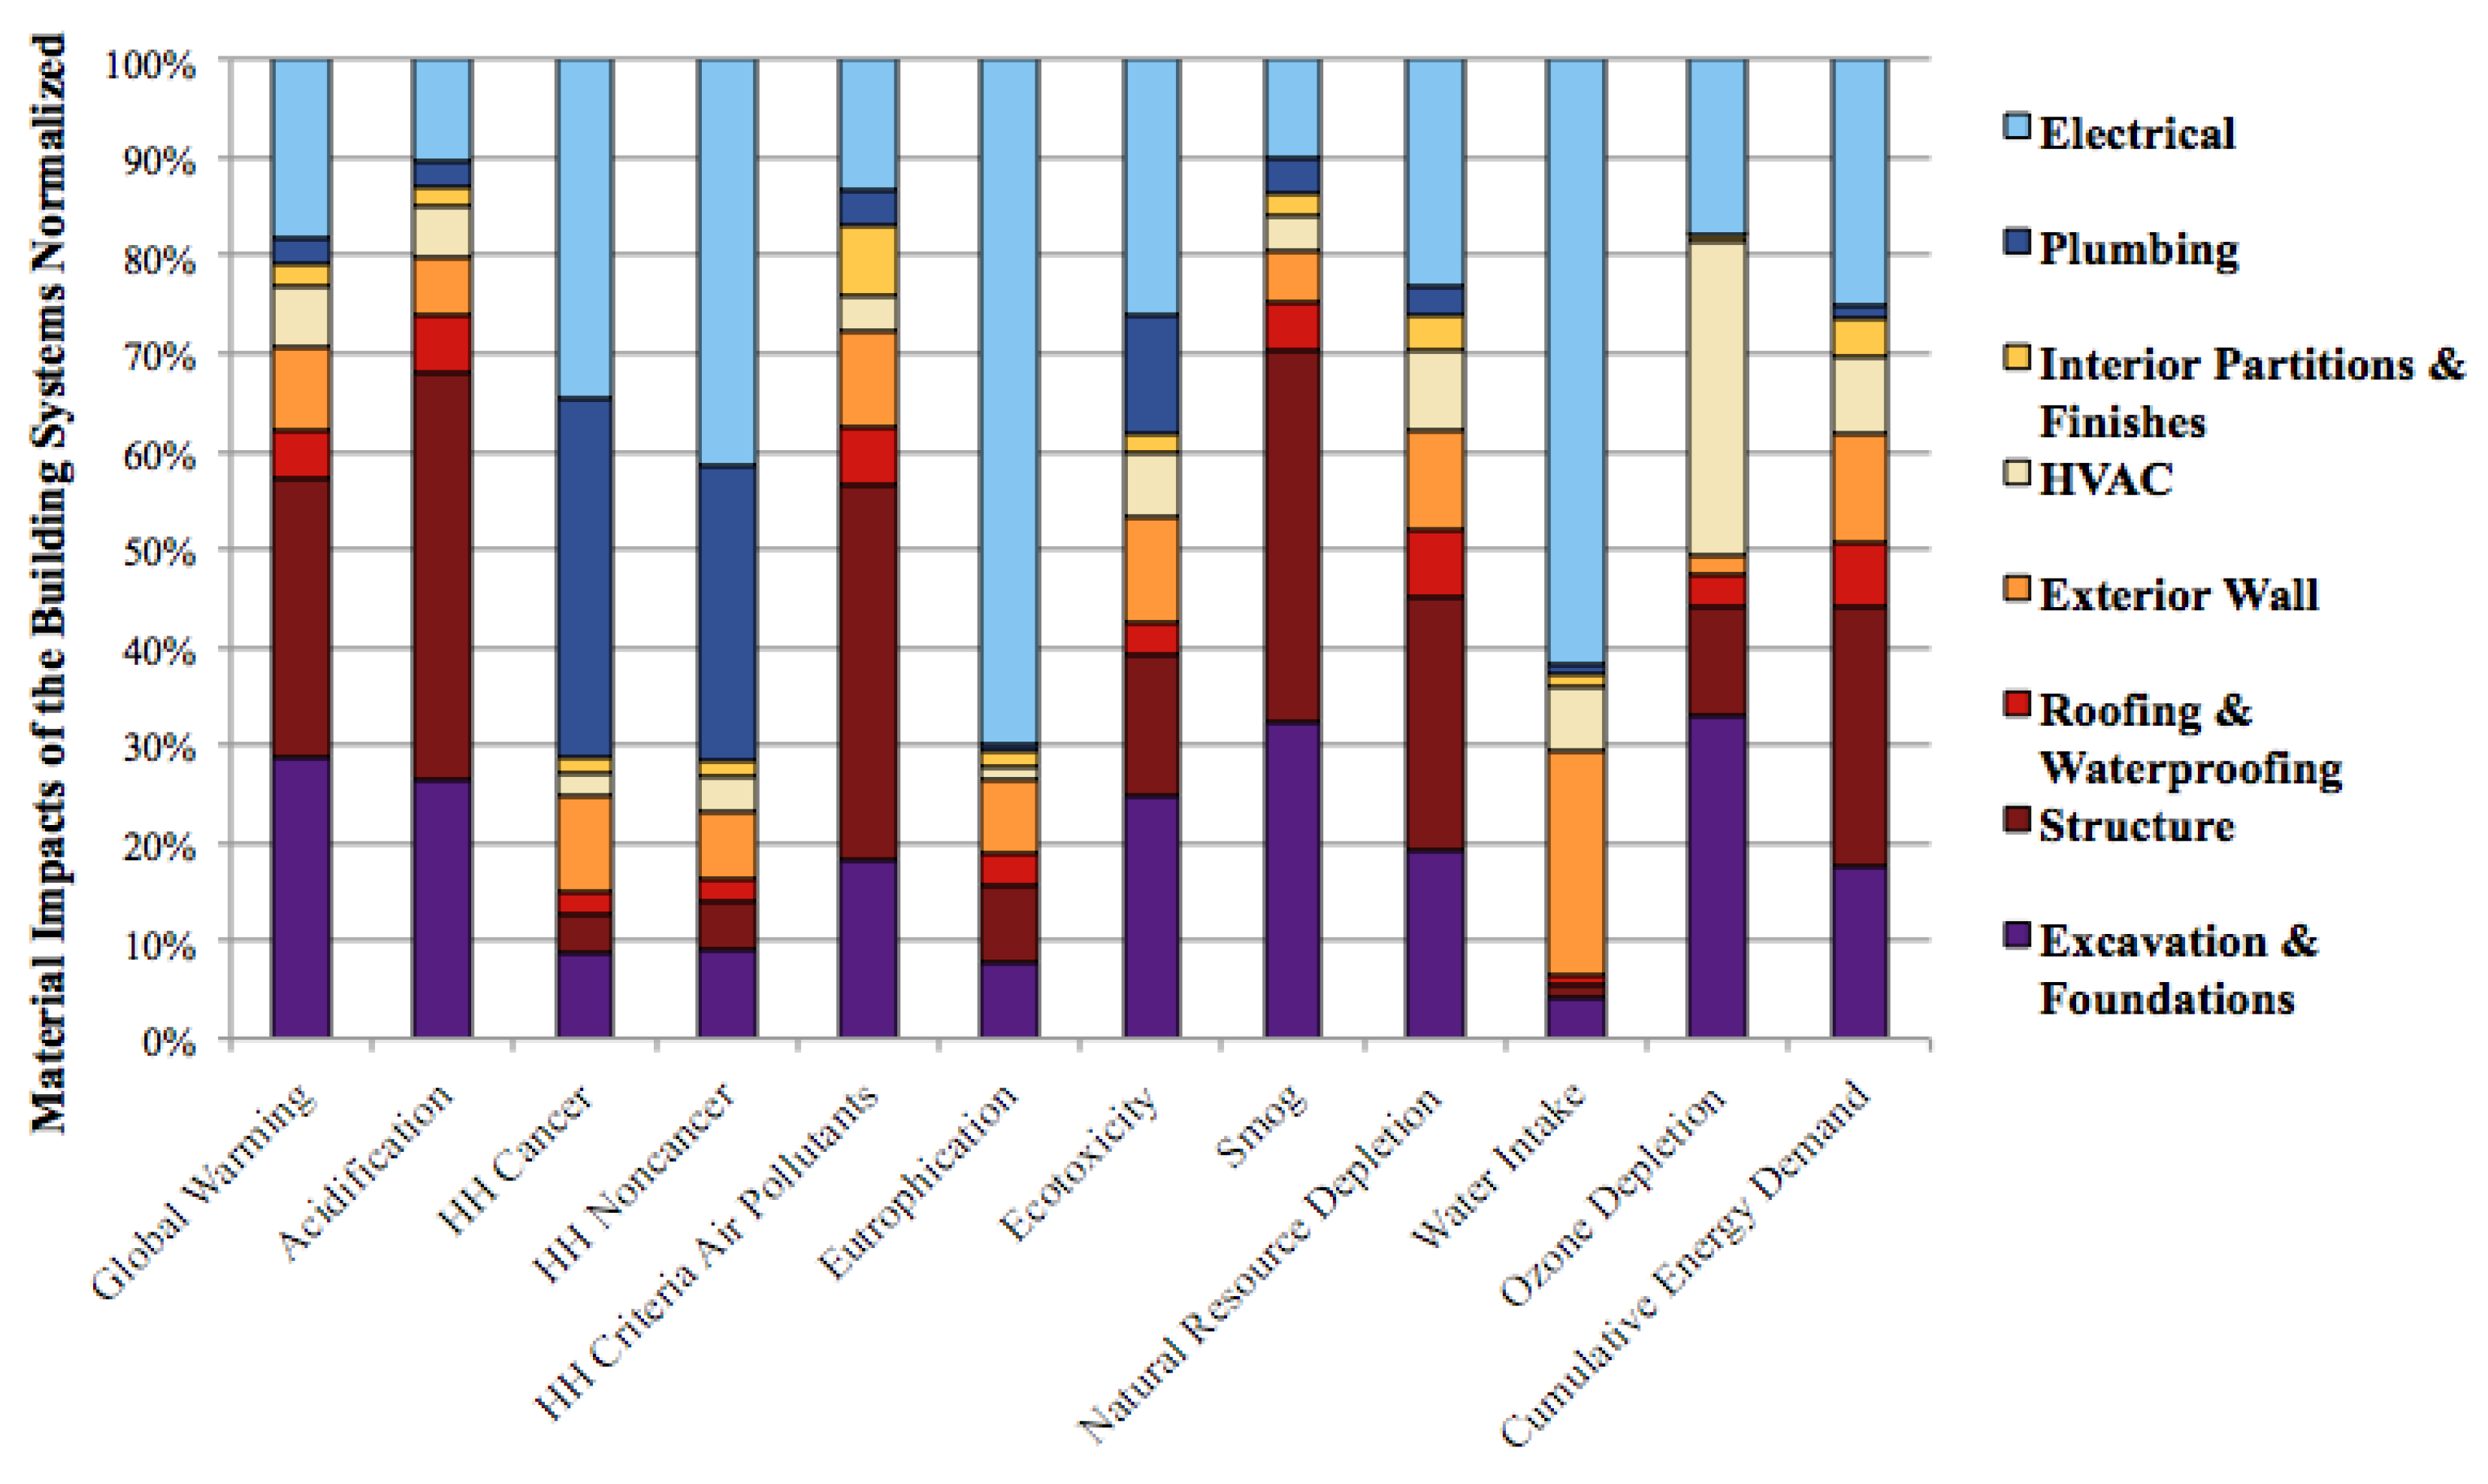
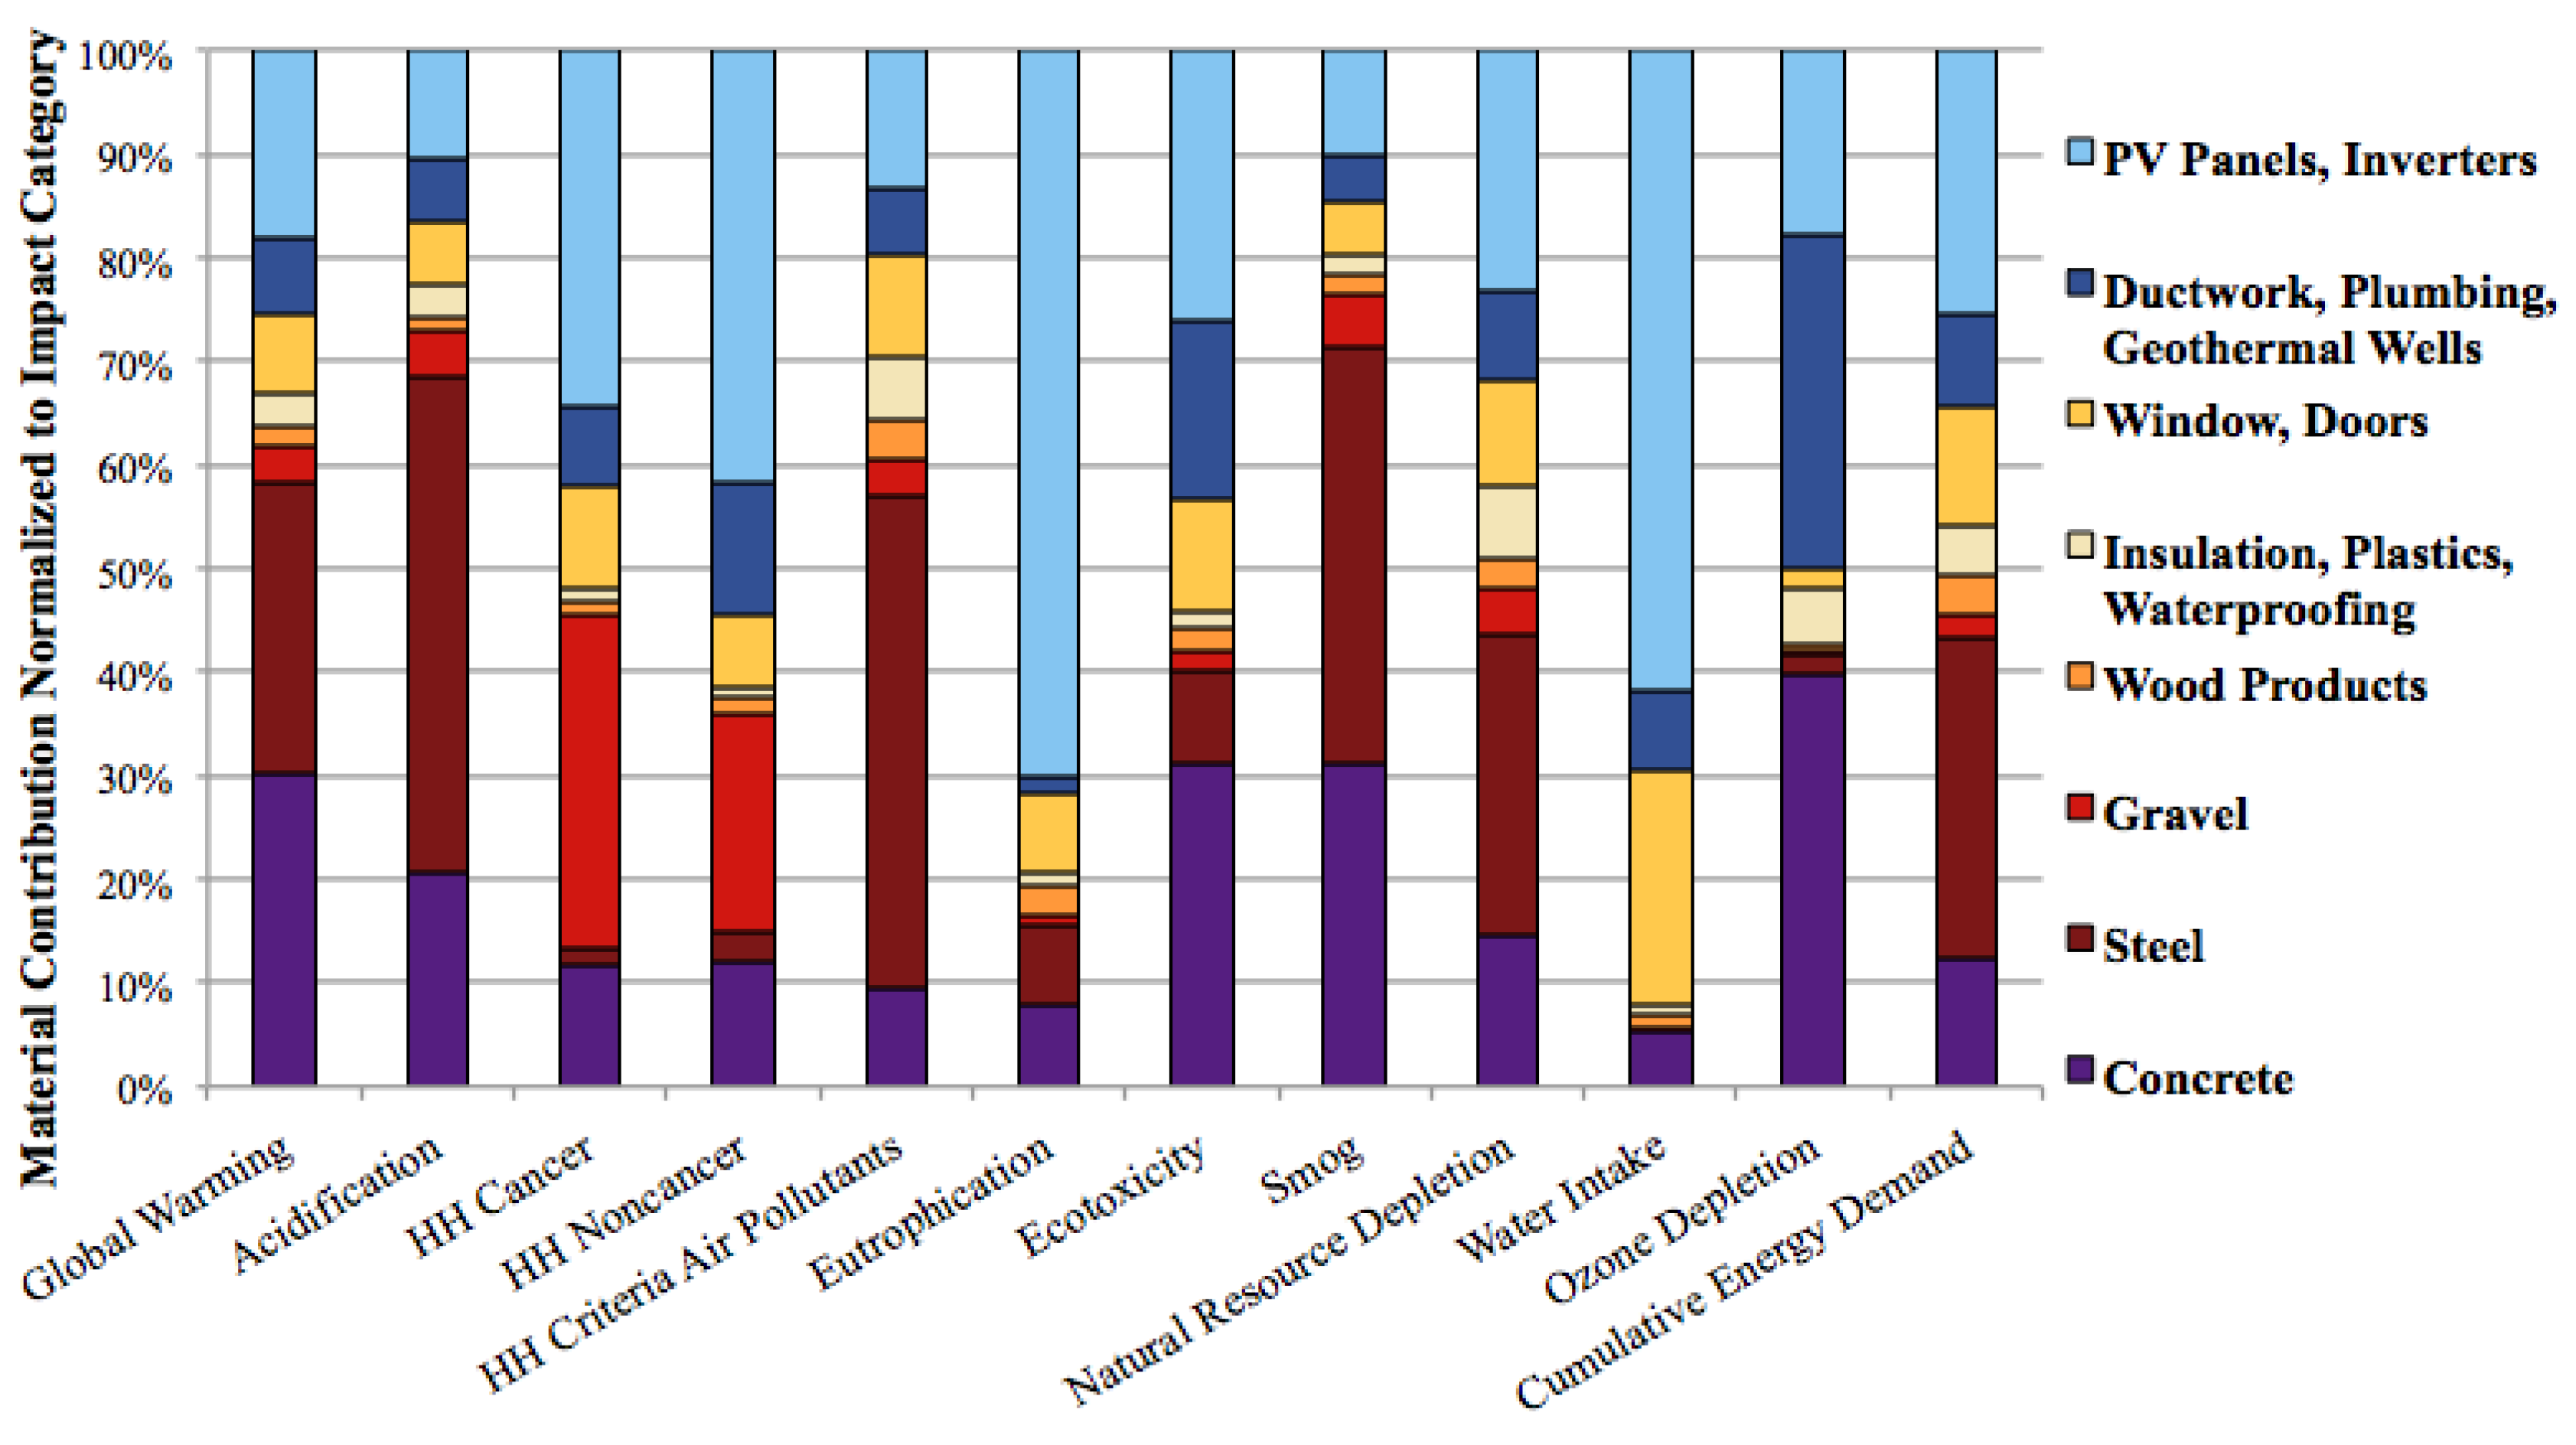
3.1. Life Cycle Environmental Impacts of LBC CSL Building Materials

We considered two sets of results with the goal of providing information related to building systems/components (e.g., electrical, plumbing, etc., in Figure 2) and materials (e.g., gravel, steel, etc., in Figure 3). In general, either the foundations and excavation or structure categories of the CSL represented the highest environmental impact in nearly every impact category analyzed shown in Figure 2. Concrete contributes an average of 73% of the environmental impacts for the excavation and foundations of the building, and steel contributes an average of 59% of the environmental impacts for the structural system of the CSL. The electrical system (PV panels and inverters), along with the plumbing system, also represents high environmental impacts, specifically in the human health cancer, human health non-cancer, eutrophication, and water intake categories. To further understand the source of the environmental impacts, the building materials were analyzed separate from their building system, shown in Figure 3. As concrete and steel represent a large portion of the CSL materials by weight, reducing the impacts associated with concrete and steel would have high-yield results for the building’s overall LCA.
Figure 2. Life cycle impact of building materials by building system for net-zero energy building (HH = human health).
Energies 06 01125 g002
Figure 3. Life cycle environmental impacts of building materials by material type for net-zero energy building (PV = photovoltaic).
Energies 06 01125 g003
Although researchers have identified concrete and steel as significant sources of global warming potential and embodied energy, alternative materials are often not used. Long-term solutions and material replacements may need to be considered [38,42,43]. Short-term solutions include continued improvements to the manufacturing process of steel or continued research on additives to concrete to reduce the environmental impacts [3]. Instead of using 100% Portland cement for concrete, incorporating 25% flyash or 40% ground granulated blast furnace slag into the concrete mixture has the potential to reduce greenhouse gas emissions up to 14% and 22% respectively [38].
To meet the standards set forth by the LBC, the CSL and our analysis used a minimum of 40% flyash for cement replacement. For this calculation, we utilized the results of a report that found that 12% of cement replacement by mass, attributed to 92% of the embodied energy of the concrete [44]. Extrapolating this data in relation to the 40% flyash reduction assumed for the CSL results in an overall 25% reduction in energy consumption for the production of the concrete. According to published reports and assumed in this study, production energy associated with the increase of flyash percentage in cement does not account for the production of flyash because it is considered a waste by-product [44,45,46,47]. With respect to GWP of flyash replacement in cement, we assumed an emission factors for cement to be 0.82 ton CO2/ton of cement and for flyash to be 0.027 ton CO2/ton [38]. We applied these emission factors and found that compared to using 100% Portland cement, the use of 40% flyash for cement replacement reduced concrete’s overall GWP contribution by 39%.
In terms of other alternatives for future building options, another study concludes that the incorporation of engineered cementitious composites instead of conventional steel expansion joints can reduce life cycle energy consumption by 40%, waste generation by 50%, and raw material consumption by 38% [48]. Although the engineered cementitious composites can extend the life span of the structure and may require less maintenance than conventional infrastructure, the cost is approximately two to three times higher per unit volume [48]. Externalities such as cost and resource availability are important in terms of the future of sustainable design.
For steel, stainless steel production incorporates the use of 33% of recycled steel, which accounts for 3.6 kg of carbon dioxide emissions per 1 kg of stainless steel produced [49]. Theoretically, the use of 100% recycled content in the production of stainless steel would result in 1.6 kg of carbon dioxide released for every 1 kg produced, or a 44% overall carbon dioxide reduction [49]. Applied to the CSL, the 100% recycling process would reduce carbon dioxide by 85,000 kg and the total global warming potential for the CSL building by 8%.
Other significant materials include gravel, crystalline silicone associated with the PV panels, and electronic components associated with the inverters. Due to the intense process of mining gravel, including machinery, electricity, and hazardous waste disposal, in conjunction with the release of particulate matter, gravel has high human health impacts in both cancer and non-cancer categories [50,51,52]. For PV panels, the high water intake category is a result of heat recovery units within the PV system and prevention of dust accumulation, which inhibits solar efficiency [53,54]. Inverters required to utilize the PV panels contain many electronic components, which are associated with a high level of toxicity risk [55]. Components such as the integrated circuit, wiring board, and inductor contribute to global warming potential, while the copper wiring contributes to categories such as acidification, eutrophication, and human health impacts. Standard structures do not generally include PV panels in the material phase as they utilize the grid or natural gas as primary energy sources for the use phase. However, PV panels as a renewable, non-fossil based fuel source reduce the impacts during the use phase of the building’s life cycle and reduce the total environmental impacts of the CSL when allocated over the building’s lifespan. In other words, PV panels have high impacts in the material phase, but low in the use phase, while traditional non-renewable sources commonly have low impacts in the material phase and high impacts in the use phase.

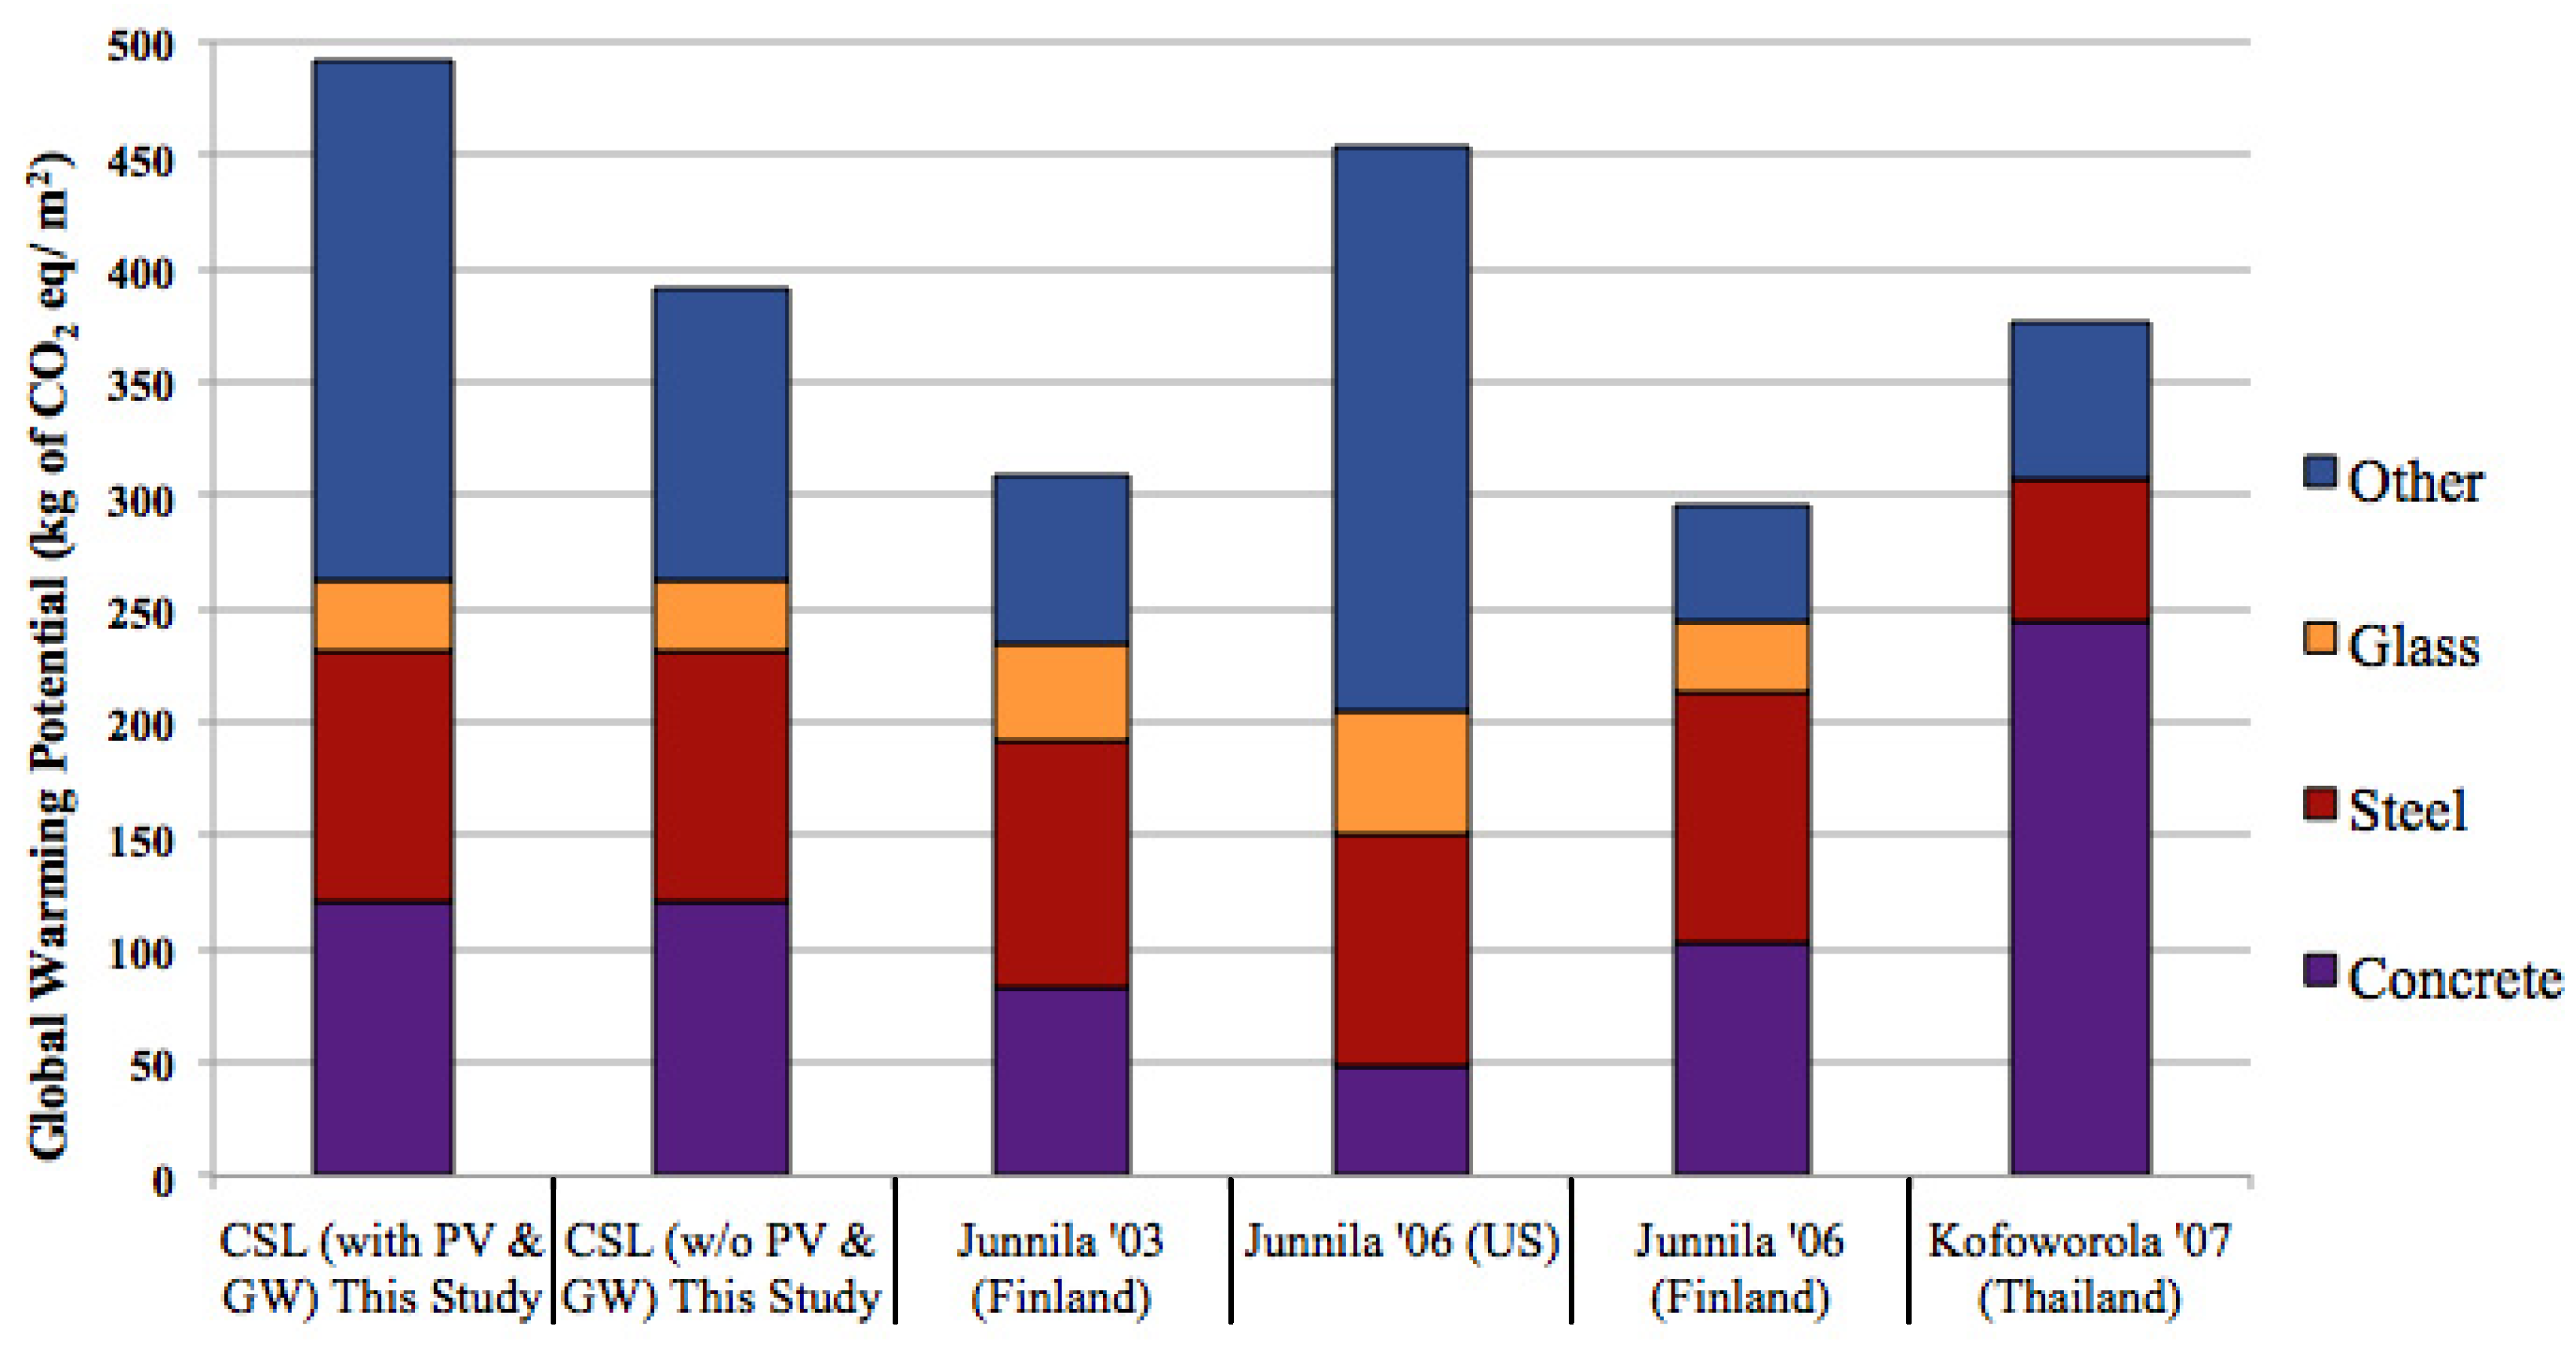
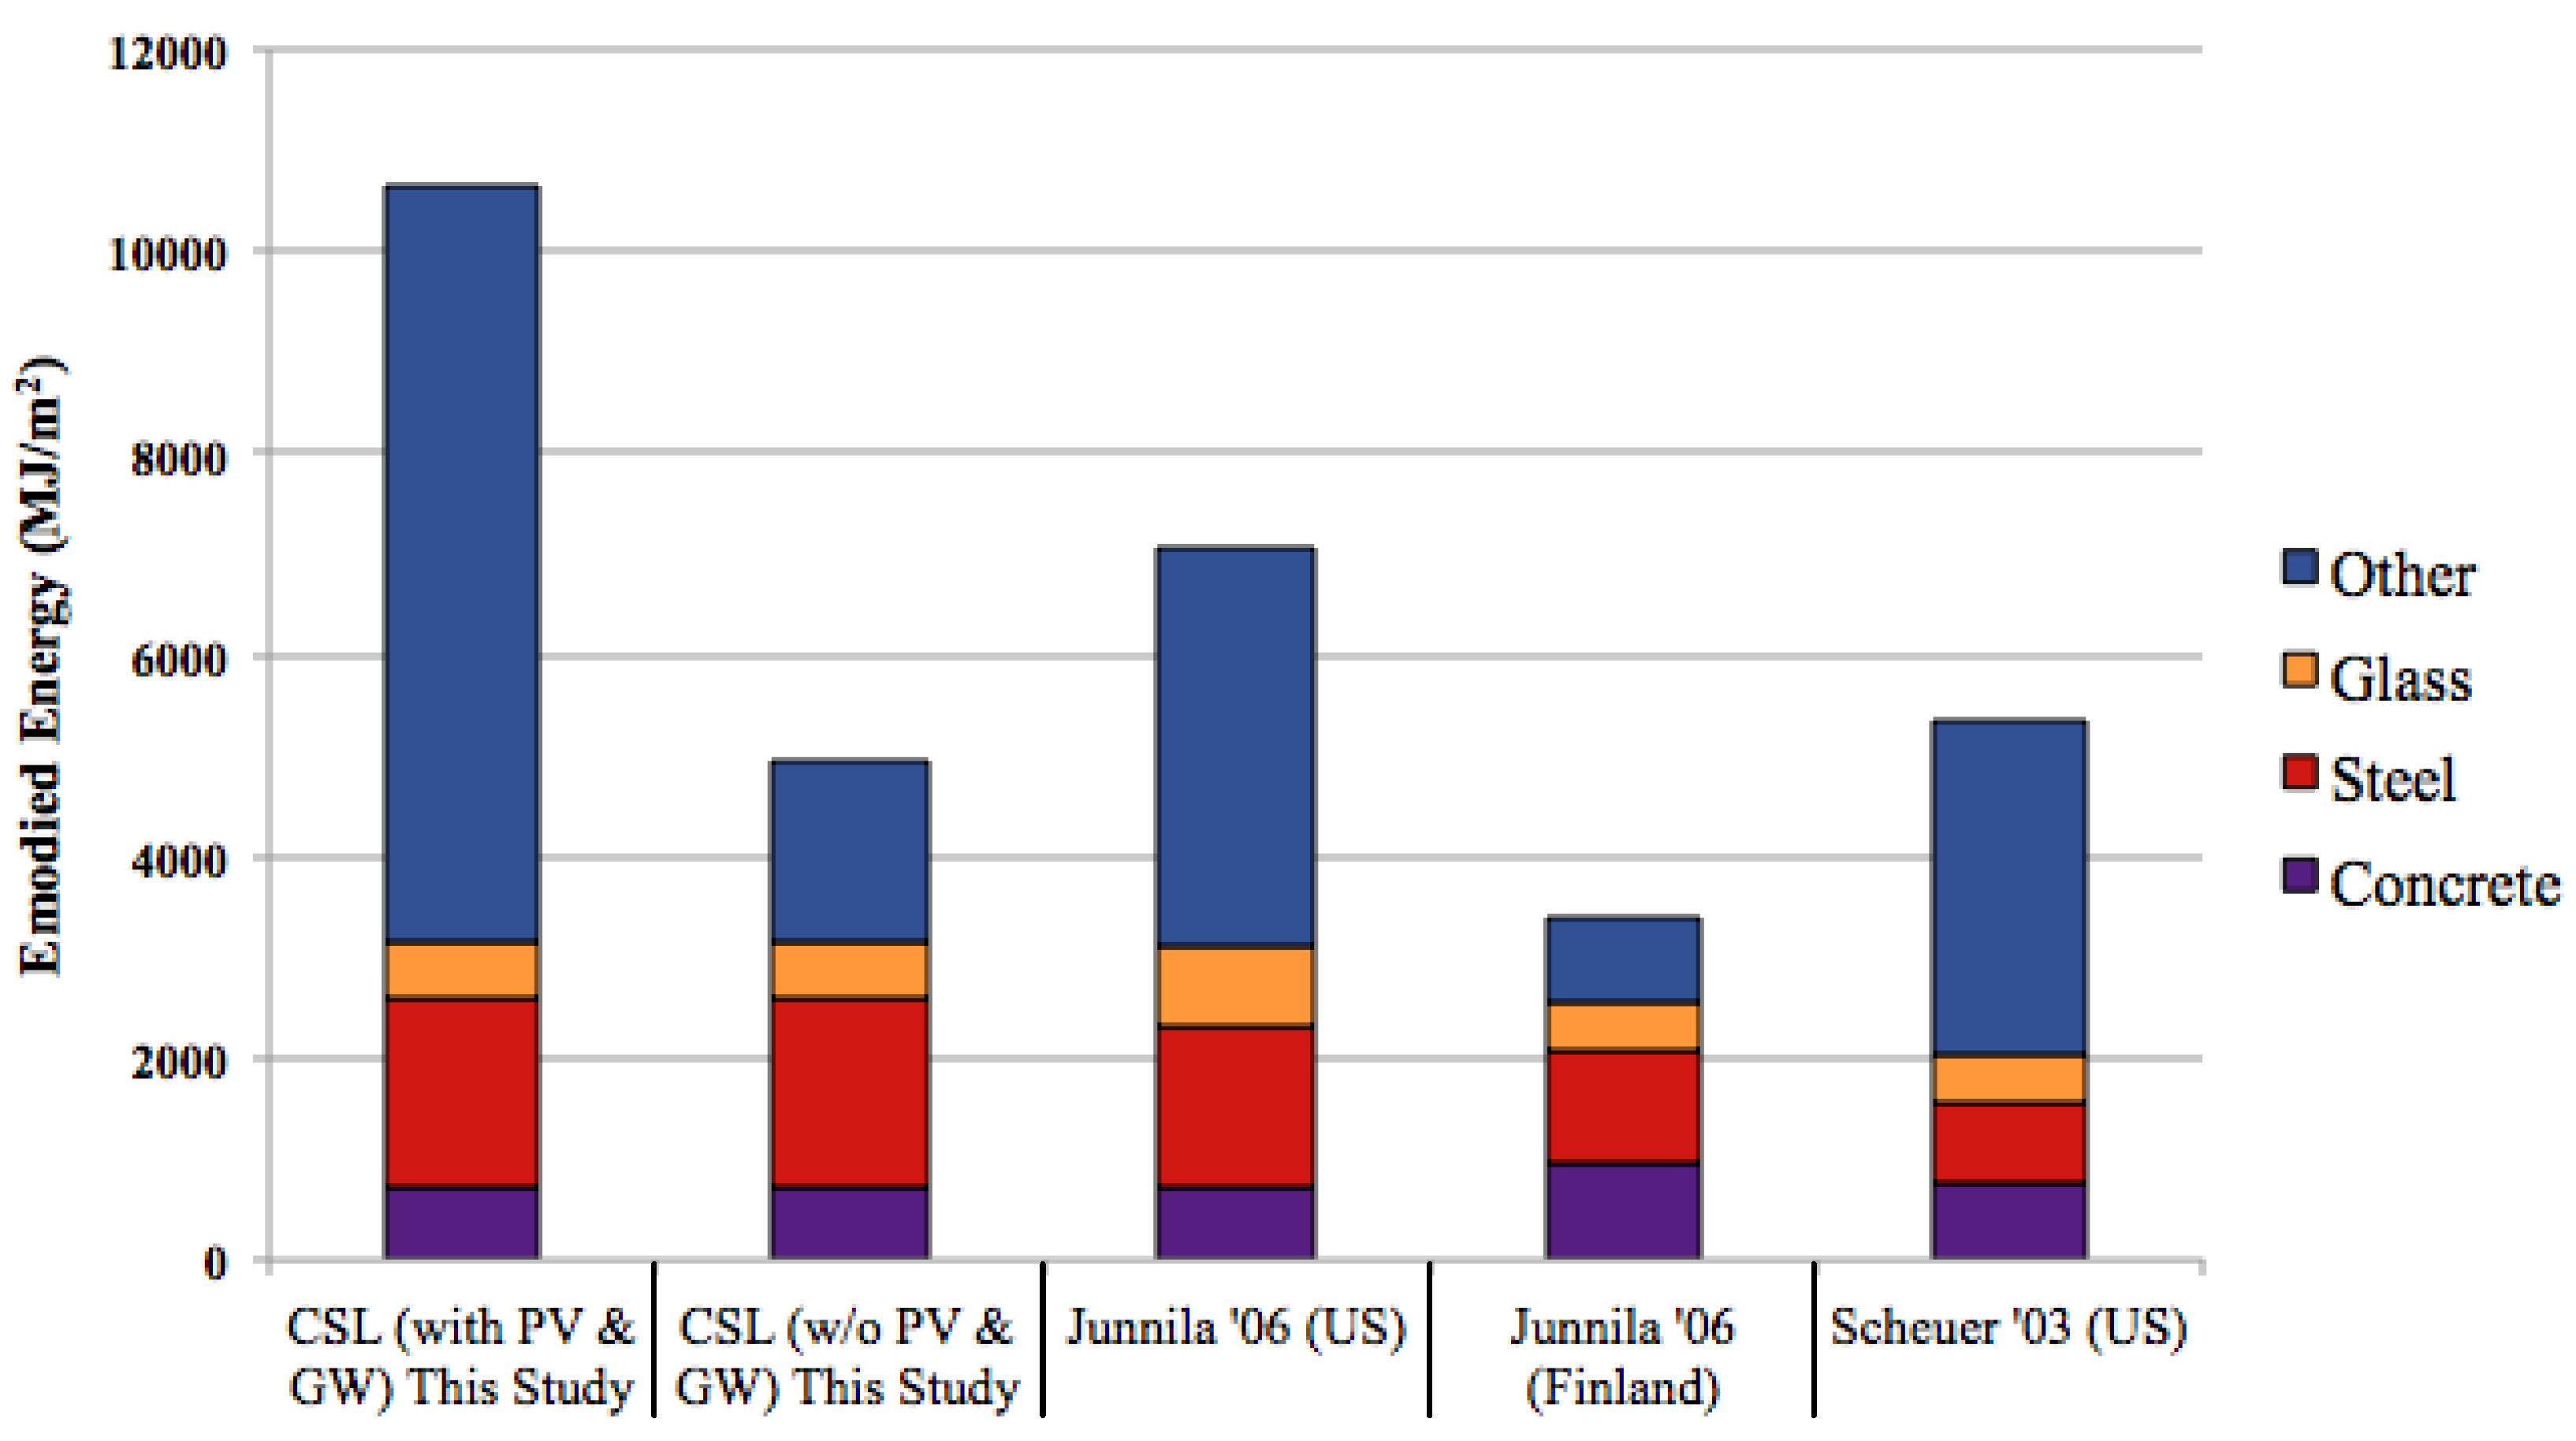
3.2. Comparison of Net-Zero Building to Standard Buildings

The differences between environmental impacts of this net-zero energy building and a standard structure largely result from unique design components such as passive solar, natural ventilation, and a green roof. Previous LCA studies of five buildings show that steel, concrete, and glass have significant environmental impacts relative to other building materials. Similarly, the LCA of the CSL identified concrete and steel as materials with the largest relative impacts. An overview of the traditional structures compared to the CSL is summarized in Table 2.
Table 2. Building and material properties for case study comparison study; NR = Not Reported.
CSLJunnila ’03 [19]Junnila ’06 [20]Junilla ’06 [20]Scheuer ’03 [24]Kowoforola ’08 [21]
Building PurposeMulti-use Education/OfficeHigh-tech organizationsTypical Office SpaceOffice/Laboratory SpaceEducational and Residential SpaceTypical Office Space
Building Certification /EfficiencyLiving Building Challenge37% reduced heating energy from baselineNR6% higher heating energy from baselineNRNR
LocationPennsylvania, USAFinlandMidwest, USAFinlandMichigan, USAThailand
Life Expectancy50 Years50 Years50 Years50 Years75 Years50 Years
Total Area2262 m215,600 m24400 m24400 m27300 m260,000 m2
Total Volume18,800 m361,700 m316,400 m317,300 m3NR9,120,000 m3
Floors3554638
StructureCast-in-place concrete and steel frameCast-in-place concreteSteel-reinforces concrete beam-column system with shear wallsSteel-reinforced concrete mean-column systemCase-in-place concrete on corrugated, galvanized steel sheets and precast concrete with hollow core elementsCase-in-place concrete
EnvelopeAluminum/glass curtain wall and wood claddingBrick/curtain wall combinationAluminum curtain wallsNRAluminum/glass curtain wall and concrete masonry with brick and precast concrete planksBrick/curtain wall combination
Though the assumed lifespan of each building is listed in Table 2, this study compares the CSL to other building LCAs based only on the initial building materials and not materials required for temporary construction, maintenance, or energy required during the use phase. Because of inherent boundary issues with LCA and building, material quantity and associated impact data from these previous studies were extrapolated to include the initial building materials only. The analyses of replacement materials in the compared reports were removed to have equivalent comparisons with the CSL study. The results shown are categorized by the initial material total to the m2 area of each building, not by the lifespan of the materials.
Global warming potential (GWP) was compared between the CSL and the published results (Figure 4). The CSL was compared with and without the inclusion of the PV panels, inverters, and the geothermal wells, due to the fact that they are not a common material across all the published studies examined. The results show that PV panels and inverters account for approximately 16% of the total GWP, while the geothermal wells account for 5% of the total GWP for the CSL. For all structures, concrete and steel accounted for a large range of results, 11% to 65% and 17% to 38% of the buildings’ total GWP.
Figure 4. Global warming potential of the CSL compared to the published results. PV = Photovoltaic & Inverters; GW = Geothermal Wells; Note: The Kofoworola ’07 study did not report glass separately from other materials; it is therefore represented in the “other” category.
Energies 06 01125 g004
The second parameter compared between the CSL and the published reports was embodied energy (Figure 5). Embodied energy is the energy required to extract, process, manufacture and transport building materials, associated with the building [3]. The PV panels and inverters represent 49% of the total embodied energy and the geothermal wells account for approximately 4% of the total embodied energy of the CSL. High levels of energy are required for the production of the PV panels and inverters, contributing to the high levels of embodied energy [56]. For all structures, concrete and steel contributed 7% to 28% and 12% to 42% of the total embodied energy, respectively.
Figure 5. Embodied energy comparison between the Net-Zero Energy CSL building and published LCA building studies; PV = Photovoltaic & Inverters; GW = Geothermal Wells; Note: Junnila ’03 and Kofoworola ’07 did not report on embodied energy.
Energies 06 01125 g005
The contributions of concrete, steel, and glass to GWP and embodied energy are comparable between the CSL and standard commercial structures, as seen in Figure 4 and Figure 5. The addition of green energy features such as the PV system and geothermal wells increases the CSL’s global warming potential and embodied energy by nearly 30% and 50% respectively. Yet despite this increase, the GWP for all of the CSL’s materials is only 10% higher than Junnila’s US-based commercial structure, and the embodied energy remains slightly less than Junnila’s US structure. Due to previous literature, it was assumed the CSL’s materials would have a higher embodied energy when compared to standard buildings [2,3,25].
The next step in this research is to conduct a full LCA of the CSL, which will include the construction, use, and end-of-life phases. For net-zero energy buildings, the materials chosen and the design of those materials contribute to the amount of energy and resources consumed by the building during its lifespan, and should also be considered in the net-zero energy designation. Because buildings are generally assumed to be in use for 50 to 75 years, design changes that improve performance can make a large difference in the total effects of our building stock. Net-zero energy and high performance buildings should not, however, neglect the impacts associated with construction materials, as the impacts from these design decisions become more significant in the total life cycle of these structures.

4. Conclusions

This study analyzed the life cycle environmental impacts of the materials phase of a net-zero energy building. Concrete and steel, the majority represented by the excavation and foundations and structural building systems, represent the highest environmental impacts in most categories. Gravel makes up a noticeable impact in the human health cancerous and non-cancerous categories of the CSL, while the production of PV panels and inverters makes up over 50% of water intake and eutrophication impacts. It is important to identify those materials within the building system that have the greatest effect on a building’s environmental impacts in order to target specific areas for minimizing environmental impacts in future construction. Comparing LCA results of the CSL to standard commercial structures reveals that the addition of the CSL’s energy reduction systems, such as PV and geothermal wells, results in a 10% higher global warming potential and nearly equal embodied energy per square foot relative to standard commercial buildings.
This study looked at the both the GWP and the embodied energy for the CSL building materials and it is important to note that for LBC certification, only the Embodied Carbon Footprint (ECF) is needed. As mentioned in the Introduction, the International Living Future Institute defines the ECF as the carbon footprint associated with the materials of a building’s structure [7,8]. However, this prerequisite is still a work in progress in terms of accuracy, process, and performance [57]. The LBC certification is unique as a green building rating system due to its requirement to be net-zero energy and water during the use phase. To accommodate for the fact that energy is used during the manufacturing of the building structure materials, the ECF prerequisite uses a carbon footprint calculator to determine how many carbon-offsets need to be purchased to fulfill the prerequisite. The carbon-offsets are justification for the carbon emissions in the manufacturing process. For future versions of the LBC, more robust embodied energy calculators may provide a more accurate understanding the life cycle energy of a building and truly bringing it closer to net-zero.
As more building are designed to meet net-zero energy goals, the embodied energy of the materials plays an increasingly important role. Many studies in the past have largely focused on use phase energy, as that building life cycle phase typically dominated analyses. We now need to reconsider the important interplay between building materials and use phase performance to truly design and operate net-zero energy buildings [18,58]. An important and necessary aspect of “net-zero energy” designation is the quantification of embodied energy, illustrated via this case study and using life cycle assessment. Life cycle assessment is a necessary aspect to net-zero energy buildings to understand how the embodied energy of materials is allocated during a building’s use phase. With more quantitative data that accurately depict more sustainable processes, such as the incorporation of flyash into the concrete production, the connection between materials, embodied energy, operational energy, and total life cycle energy will become clearer. Specifically, the incorporation of flyash is an example of how by-product allocation is still a topic for contention within LCA and may effect how this sustainable process is modeled and understood. Since the impacts of CSL’s materials were comparable to standard buildings, future criteria specifically aim to reduce the material impacts below that of a standard building should be further considered.

Acknowledgements

We would like to acknowledge the University of Pittsburgh’s Mascaro Center for Sustainable Innovation for their funding and support. We would also like to thank Phipps Conservatory and Botanical Gardens and their project team, the Design Alliance Architects, and Mascaro Construction Management Services for the data they provided as well as their continued efforts for environmental improvement. This material is based upon work supported by the National Science Foundation under IGERT (0504345) and EFRI-SEED (1038139). Any opinions, findings, and conclusions or recommendations expressed in this material are those of the author(s) and do not necessarily reflect the views of the National Science Foundation.

References

  1. Blengini, G.A.; Di Carlo, T. The changing role of life cycle phases, subsystems and materials in the LCA of low energy buildings. Energy Build. 2010, 42, 869–880. [Google Scholar] [CrossRef]
  2. Sartori, I.; Hestnes, A.G. Energy use in the life cycle of conventional and low-energy buildings: A review article. Energy Build. 2007, 39, 249–257. [Google Scholar] [CrossRef]
  3. Venkatarama Reddy, B.V.; Jagadish, K.S. Embodied energy of common and alternative building materials and technologies. Energy Build. 2003, 35, 129–137. [Google Scholar] [CrossRef]
  4. Frischknecht, R. Öko-Inventare von Energiesystemen[in German], 3rd ed.; ETH-ESU (Eidgenössische Technische Hochschule Zürich): Zurich, Switzerland, 1996. [Google Scholar]
  5. Frischknecht, R.; Rebitzer, G. The ecoinvent database system: A comprehensive web-based LCA database. J. Clean Prod. 2005, 13, 1337–1343. [Google Scholar] [CrossRef]
  6. Wiedmann, T.; Minx, J. A definition of “Carbon Footprint”. In Ecological Economics Research Trends; Pertsova, C.C., Ed.; Nova Science Publishers: New York, NY, USA, 2008; pp. 1–11. [Google Scholar]
  7. ILBI (International Living Building Institute). Living Building Challenge 2.1; International Living Building Institute and Cascadia Green Building Council: Seattle, WA, USA, 2012. [Google Scholar]
  8. Davies, D. Climate-conscious building design: New approaches to embodied-carbon optimization. In Trim Tab 2010; Cascadia Green Building Council: Portland, OR, USA, 2010; pp. 46–51. [Google Scholar]
  9. Hernandez, P.; Kenny, P. From net energy to zero energy buildings: Defining life cycle zero energy buildings (LC-ZEB). Energy Build. 2010, 42, 815–821. [Google Scholar] [CrossRef]
  10. Citherlet, S.; Di Guglielmo, F.; Gay, J.B. Window and advanced glazing systems life cycle assessment. Energy Build. 2000, 32, 225–234. [Google Scholar] [CrossRef]
  11. Prek, M. Environmental impact and life cycle assessment of heating and air conditioning systems, a simplified case study. Energy Build. 2004, 36, 1021–1027. [Google Scholar] [CrossRef]
  12. ISO (International Organization for Standardization). Environmental Management—Life Cycle Assessment—Principles and Framwork; ISO 14040; ISO: Geneva, Switzerland, 1997. [Google Scholar]
  13. Goedkoop, M.; Oele, M. SimaPro 6—Introduction to LCA with SimaPro; PRe Consultants: Amersfoort, The Netherlands, 2004. [Google Scholar]
  14. Kaufmann, P. GaBi Build-It; PE International: Leinfelden-Echterdingen, Germany, 2010. [Google Scholar]
  15. NIST (National Institute of Standards and Technology). Building for Enviornmental and Economic Sustainability (BEES) 4.0; Building and Fire Research Laboratory, NIST: Boulder, CO, USA, 2007. [Google Scholar]
  16. Athena EcoCalcuator; ASMI (Athena Sustainable Materials Institute): Ottawa, Canada, 2012. Available online: http://www.athenasmi.org/our-software-data/ecocalculator/ (accessed on 6 February 2013).
  17. USGBC (United States Green Building Council). Pilot Credit 63: MR-While Building Life Cycle Assessment; USGBC: Washington, DC, USA, 2012. [Google Scholar]
  18. Aktas, C.; Bilec, M. Impact of lifetime on US residential building LCA results. Int. J. Life Cycle Assess. 2012, 17, 337–349. [Google Scholar] [CrossRef]
  19. Junnila, S.; Horvath, A. Life-Cycle Environmental Effects of an Office Building. J. Infrastruct. Syst. 2003, 9, 157–166. [Google Scholar] [CrossRef]
  20. Junnila, S.; Horvath, A.; Guggemos, A.A. Life-Cycle assessment of office buildings in Europe and the United States. J. Infrastruct. Syst. 2006, 12, 10–17. [Google Scholar] [CrossRef]
  21. Kofoworola, O.; Gheewala, S. Environmental life cycle assessment of a commercial office building in Thailand. Int. J. Life Cycle Assess. 2008, 13, 498–511. [Google Scholar] [CrossRef]
  22. Suzuki, M.; Oka, T. Estimation of life cycle energy consumption and CO2 emission of office buildings in Japan. Energy Build. 1998, 28, 33–41. [Google Scholar] [CrossRef]
  23. Ramesh, T.; Prakash, R.; Shukla, K.K. Life cycle energy analysis of buildings: An overview. Energy Build. 2010, 42, 1592–1600. [Google Scholar] [CrossRef]
  24. Scheuer, C.; Keoleian, G.A.; Reppe, P. Life cycle energy and environmental performance of a new university building: Modeling challenges and design implications. Energy Build. 2003, 35, 1049–1064. [Google Scholar] [CrossRef]
  25. Blengini, G.A.; Di Carlo, T. Energy-saving policies and low-energy residential buildings: An LCA case study to support decision makers in Piedmont (Italy). Int. J. Life Cycle Assess. 2010, 15, 652–665. [Google Scholar] [CrossRef]
  26. Yohanis, Y.G.; Norton, B. Life-cycle operational and embodied energy for a generic single-storey office building in the UK. Energy 2002, 27, 77–92. [Google Scholar] [CrossRef]
  27. Cascadia Region Green Building Council. Living Building Challenge; Cascadia Region Green Building Council: Seattle, WA, USA, 2007. [Google Scholar]
  28. ILBI. Case Studies. Available online: https://ilbi.org/lbc/casestudies (accessed on 6 February 2013).
  29. Fay, R.; Treloar, G.; Iyer-Raniga, U. Life-cycle energy analysis of buildings: A case study. Build. Res. Inf. 2000, 28, 31–41. [Google Scholar] [CrossRef]
  30. Phipps. About Phipps Conservatory. Available online: http://phipps.conservatory.org/about-phipps/index.aspx (accessed on 6 February 2013).
  31. Phipps. Phipps and Sustianability. Available online: http://phipps.conservatory.org/project-green-heart/green-heart-at-phipps/center-for-sustainable-landscapes.aspx (accessed on 6 February 2013).
  32. Kannan, R.; Leong, K.C.; Osman, R.; Ho, H.K.; Tso, C.P. Life cycle assessment study of solar PV systems: An example of a 2.7 kWp distributed solar PV system in Singapore. Sol. Energy 2006, 80, 555–563. [Google Scholar] [CrossRef]
  33. The Design Alliance Architects. Center for Systainable Landscapes: Overview of Images; The Design Alliance Architects: Pittsburgh, PA, USA, 2009. [Google Scholar]
  34. USA LCI Database Documentation; FranklinAssociates: Prairie Village, KS, USA, 1998.
  35. Frischknecht, R.; Jungbluth, N.; Hans-Jörg Althaus, H.J.; Doka, G.; Dones, R.; Heck, T.; Hellweg, S.; Hischier, R.; Nemecek, T.; Rebitzer, G.; Spielmann, M. The ecoinvent Database: Overview and Methodological Framework (7 pp). Int. J. Life Cycle Assess. 2005, 10, 3–9. [Google Scholar] [CrossRef]
  36. PlasticsEurope. Industry Data v2.0. Available online: http://www.pre-sustainability.com/content/databases#SimaPro%20databases (accessed on 6 February 2013).
  37. IDEMAT. Available online: http://www.idemat.nl/index.htm (accessed on 6 February 2013).
  38. Flower, D.J.M.; Sanjayan, J.G. Green house gas emissions due to concrete manufacture. Int. J. Life Cycle Assess 2007, 12, 282–288. [Google Scholar] [CrossRef]
  39. Frischknecht, R.; Jungbluth, N. Implementation of Life Cycle Impact Assessment Methods; Final Report Ecoinvent; Swiss Centre for LCI: Duebendorf, Switzerland, 2003. [Google Scholar]
  40. Frischknecht, R. Implementation of Life Cycle Impact Assessment Methods; Ecoinvent Report; Swiss Centre for LCI: Duebendorf, Switzerland, 2007. [Google Scholar]
  41. Bare, J. Tool for the Reduction and Assessment of Chemical and Other Environmental Impacts (TRACI); United States Environmental Protection Agency: Washington, DC, USA, 2002. Available online: http://www.epa.gov/nrmrl/std/traci/traci.html (accessed on 21 February 2013).
  42. Guggemos, A.A.; Horvath, A. Comparison of Environmental effects of steel- and concrete-framed buildings. J. Infrastruct. Syst. 2005, 11, 93–101. [Google Scholar] [CrossRef]
  43. Jonsson, A.; Bjorklund, T.; Tillman, A. LCA of concrete and steel building frames. Int. J. Life Cycle Assess. 1998, 3, 216–224. [Google Scholar] [CrossRef]
  44. Zapata, P.; Gambatese, J.A. Energy consumption of asphalt and reinforced concrete pavement materials and construction. J. Infrastruct. Syst. 2005, 11, 9–20. [Google Scholar] [CrossRef]
  45. Huntzinger, D.N.; Eatmon, T.D. A life-cycle assessment of Portland cement manufacturing: comparing the traditional process with alternative technologies. J. Clean. Prod. 2009, 17, 668–675. [Google Scholar] [CrossRef]
  46. O’Brien, K.; Ménaché, J.; O’Moore, L. Impact of fly ash content and fly ash transportation distance on embodied greenhouse gas emissions and water consumption in concrete. Int. J. Life Cycle Assess. 2009, 14, 621–629. [Google Scholar] [CrossRef] [Green Version]
  47. Reiner, M.; Rens, K. High-volume fly ash concrete: Analysis and application. Pract. Period. Struct. Des. Construct. 2006, 11, 58–64. [Google Scholar] [CrossRef]
  48. Keoleian, G.; Kendall, A.; Dettling, J.; Smith, V.; Chandler, R.; Lepech, M.; Li, V. Life Cycle modeling of concrete bridge design: Comparison of Engineered cementitious composite link slabs and conventional steel expansion joints. J. Infrastruct. Syst. 2005, 11, 51–60. [Google Scholar] [CrossRef]
  49. Johnson, J.; Reck, B.K.; Wang, T.; Graedel, T.E. The energy benefit of stainless steel recycling. Energy Policy 2008, 36, 181–192. [Google Scholar] [CrossRef]
  50. Al-Awadhi, J.M. Impact of gravel quarrying on the desert environment of Kuwait. Environ. Geol. 2001, 41, 365–371. [Google Scholar] [CrossRef]
  51. Edvardsson, K.; Magnusson, R. Monitoring of dust emission on gravel roads: Development of a mobile methodology and examination of horizontal diffusion. Atmos. Environ. 2009, 43, 889–896. [Google Scholar] [CrossRef]
  52. Jakucionyte, L.; Mikalajune, A. Investigation into heavy metal concentration by the gravel roadsides. J. Environ. Eng. Landsc. Manag. 2011, 19, 89–100. [Google Scholar] [CrossRef]
  53. Chakravarty, R. Are Solar PV Farms Polluting; Electronics For You: New Delhi, India, 2012. [Google Scholar]
  54. Tripanagnostopoulos, Y.; Souliotis, M.; Battisti, R.; Corrado, A. Energy, cost, and LCA results of PV and hybrid PV/T Solar systems. Prog. Photovolt. Res. Appl. 2005, 13, 235–250. [Google Scholar] [CrossRef]
  55. Alsema, E.; de Wild-Scholten, M. Environmental life cycle assessment of advanced silicon solar cell technologies. In Presented at the 19th European Photovoltaic Solar Energy Conference, Paris, France, 7–11 June 2004.
  56. Fthenakis, V. Overview of Potential Hazards. In Practical Handbook of Photovoltaics: Fundamentals and Applications; Markvart, T., Castaner, L., Eds.; Brookhaven National Laboratory: Upton, NY, USA, 2003; Chapter VII-2. [Google Scholar]
  57. Connelly, J. Embodied Carbon Footprint Understanding; Campion, N., Ed.; Cascadia Green Building Council: Pittsburgh, PA, USA, 2012. [Google Scholar]
  58. Rajagopalan, N.; Bilec, M.; Landis, A. Life cycle assessment evaluation of green product labeling systems for residential construction. Int. J. Life Cycle Assess. 2012, 17, 753–763. [Google Scholar] [CrossRef]

